Embed Size (px)
Citation preview
BRIEFING MEMO
GM Memo No. 04-112
Meeting Date: April 21, 2004
Finance Committee El
Operations Committee □
Paratransit Committee □
Financing Corporation □
SUBJECT: MONTHLY FINANCIAL STATUS REPORT
RECOMMENDED ACTION:
□ Information Only EE3 Briefing Item □ Recommended Motion
1. Receive 10-Year Financial Projections as of February 29, 2004.
2. Receive Potential Revisions to the FY 2003-04 and FY 2004-05 Budgets.
3. Receive Cash Flow Projections as of February 29, 2004.
4. Receive Internal Financial Statements as of February 29, 2004 for the District
Operating Program, Paratransit and the AC Transit Financing Corporation.
5. Receive Monthly Report on Investments as of February 29,2004.
Fiscal Impact:
No change to the Second Quarter Projection.
BOARD ACTION: Approved as Recommended [x]
Approved with Modification(s) [ ]
Other
MOTION: PEPEEPLES/KAPLAN to receive report for information (6-0-0-1).
Ayes: Directors Peeples, Kaplan, Jaquez, Bischofberger, Vice President Harper,
President Wallace - 6
Noes: None - 0
Abstain: None - 0
Absent: Director Piras -1
The above order was passed and adopted on
May 5, 2004.
Rose Martinez, District Secretary
By

GM Memo No. 04-112
Subject: Monthly Financial Status Report
Date: April 21, 2004
Page 2 of 4
Background/Discussion:
On June 18, 2003, the Board adopted the FY 2003-04 and FY 2004-05 Biennial
Budget. The US and the State of California were amidst an economic downturn that
began in 2001. To mitigate the impact of the recession on the District's financial
condition, several revenue-enhancing activities, budget and service reduction actions,
and the implementation of stringent cost controls were employed to result in a balanced
budget.
On December 10, 2003, the Board received year-end financial statements as of June
30, 2003; the Independent Auditor's report for the year ended June 30, 2003; and
adopted First Quarter revisions to the FY 2003-04 and FY 2004-05 Biennial Budget.
The District closed FY 2002-03 with a ($4.2 million) deficit in unrestricted net assets,
which resulted from the financial strain experienced during the year as a result of the
economic recession. After extensive analysis of the economic outlook, the outcome of
first quarter receipts and year-to-date expenditure activity, the FY 2003-04 and FY
2004-05 Biennial Budget was amended.
On February 18, 2004, the Finance Committee was presented with the Second Quarter
Financial Performance Report that indicated potential revenue losses of $4.3 million
and $13.1 million respectively for FY 2003-04 and FY 2004-05. The financial hardship
that the District experienced during FY 2001-02 and FY 2002-03 persists. Updated
estimates of revenue and expenditures yield a combined $10.8 million shortfall for the
two-year period. The General Manager convened three sessions with the Executive
Team to formulate a corrective action plan with the intent to ensure the financial viability
of the agency. A mid-year review of financial operations and heightened expenditure
controls were put in place to contain costs for the two-year period and to address
balancing the FY 2003-04 and FY 2004-05 budget: a line-by-line review of salary,
benefits and operating expense categories reducing them to minimum levels; deferring
FY 2003-04 and FY 2004-05 operating and capital costs to the extent possible to a
future period; reduction of the budgeted contribution to reserves in FY 2004-05;
reduction of the District funded capital program in FY 2003-04 deferring projects to FY
2004-05; coach and engine sales to other transit agencies; and other adjustments to
the FY 2003-04 and FY 2004-05 budget. As a precautionary measure, staff has begun
the process to declare a fiscal emergency and to develop a service reduction plan of
$5-$15 million annually and will hold a public hearing in May to address these issues.
Staff continues to evaluate the financial characteristics of revenue and expenditure and
have determined potential FY 2003-04 and FY 2004-05 budget revisions on the horizon
for third quarter [See Attachment B]. Projections of operating and grant revenues
predict a net decline by year-end. However, corrective actions identified to-date could
offset the potential $2.5 million shortage. Additional plans continue to be formulated to
support a balanced year-end.

GM Memo No. 04-112
Subject: Monthly Financial Status Report
Date: April 21, 2004
Page 3 of 4
offset the potential $2.5 million shortage. Additional plans continue to be formulated to support a balanced year-end.
Prior Relevant Board Actions/Policies:
GM Memo 04-060B, Consider FY 2003-04 Second Quarter Financial Performance Report, Adopting Resolution No. 2118A Amending the FY 2003-04 and FY 2004-05 General Fund Operating and Capital Budget for Second Quarter Revisions and Adoption of Resolution 2119 Authorizing the Filing and Execution of Applications and Funding Agreements with the Metropolitan Transportation Commission (MTC) April 7 2004.
GM Memo 04-016, Receive Monthly financial Status Report, 10-year Financial Projections—Moderate and Stronger Scenarios, Cash Flow Projections for FY 2003-04 and FY 2004-05, and Monthly Report on Investments as of December 2003.
GM Memo 03-342, FY 2003-04 First Quarter Financial Performance Report Adopting Resolution No. 2112 Amending the FY 2003-04 and FY 2004-05 General Fund Operating and Capital Budget for First Quarter Revisions. December 10, 2003.
GM Memo 03-312, Receiving Monthly Financial Status Report, Recommended Revisions to the FY 2003-04, FY 2004-05, FY 2005-06 and the remainder of the 10-Year Financial Projection Period, Cash Flow Projections For FY 2003-04 and FY 2004-05 as of October 28,2003, and Monthly Report on Investments as of September, 2003
GM Memo 03-297, Receiving Monthly Financial Status Report, Recommended Revisions to the FY 2003-04, FY 2004-05, FY 2005-06 and the remainder of the 10-Year Financial Projection Period, Cash Flow Projections For FY 2003-04 and FY 2004-05 as of October 3, 2003, and Monthly Report on Investments as of August 2003 November 19,2003. *
GM Memo 03-277A, Receiving Monthly Financial Status Report, Recommended Revisions to the FY 2003-04, FY 2004-05, FY 2005-06 and the remainder of the 10-Year Financial Projection Period, Cash Flow Projections For FY 2003-04 and FY 2004-05 as of September 25, 2003, and Monthly Report on Investments as of July, 2003.
GM Memo 03-225, August 6, 2003
GM Memo 03-140B, Adopting Resolution 2090A, Adopting the FY 2003-04 and FY 2004-05 General Fund Operating and Capital Biennial Budget, June 18, 2003.
GM Memo 02-017, Adopting Resolution 2043,
Amending Board Policy No. 336, District Investment Policy, February 7, 2002.
000002

GM Memo No. 04-112
Subject: Monthly Financial Status Report
Date: April 21, 2004
Page 4 of 4
Attachments:
Attachment A: 10-Year Financial Projection
Attachment B: Potential Budget Revisions FY 2003-04 and FY 2004-05
Attachment C: FY 2003-04 and FY 2004-05 Cash Flows
Attachment D: Financial Operations for the Eight Months Ended February 29,2004
Attachment D: Monthly Investment Report for February 2004
Attachment F: YTD Total Farebox Revenue (Farebox Cash, G/L Pass Sales Bookings)
Approved by: Rick Fernandez
Prepared by: Deborah McClain, Chief Financial officer
Hernan Vargas, Budget Manager
Dan Lillin, Treasury Manager
Frank Haywood, Jr., Controller
Joan Martin, Manager of Capital Planning and Grants
Date Prepared: April 15, 2004
000003

TABLE OF CONTENTS
GM Memo 04-112 Monthly Financial Status Report Pp. 1-4
10-Year Financial Projections pp. 5.6
Potential Revisions to the FY 2003-04 and FY 2004-05 Budgets Pp. 7-8
Cash Flow Projections Y 2003-04 and FY 2004-05 Pp. 9.10
Financial Operations for the Eight Months Ended 2/29/04 Pp. 11-12
Paratransit Financial Statements Pp. 13.19
District Financial Statements Pp. 20-28
AC Transit Financing Corporation Financial Statements Pp. 29-33
Monthly investment Report for February 2004 Pp. 3443
Year-to-Date Total Farebox Revenue Pp.
GM Memo No. 04-112

ATTACHMENT C
FY 2003-04 and FY 2004-05 Cash Flows
As reported in March 2003, the District required additional financial assistance to meet its expenditure requirements for the next six months. On March 6, 2003, the Board authorized the use of Revenue Anticipation Notes as a budgetary strategy in FY 2003-04 to enable the District to borrow funds to offset temporary cash deficits that will impact the ability to pay the operating and capital obligation of the Agency. On August 28, 2003, the District received $35,312,900 from the sales of these Revenue Anticipation Notes. Funds are required to be set-aside in April and May 2004 for repayment of the notes, and are planned appropriately in the FY 2003-04 cash flow projection. As in FY 2003-04, the District will require additional financial assistance to meet its expenditure requirements for the next six months. Cash flow projections anticipate $35 million of RANS and the corresponding repayment in the FY 2004-05 Cash Flow projection. Upon receipt of authorization from the Board as requested in GM Memo No. 04-074, December 18, 2004, staff will begin the process to investigate the use of revenue anticipation Notes as a budgetary strategy in FY 2004-05. That investigation and associated analysis will determine the structure and sizing of the amount of RANs that the District may qualify for. Revised cash flows will be developed in conjunction with revised FY 2003-04 and FY 2004-05 projections to recognize the impact of revised allocation estimates, updated expenditure projections, and revenue enhancement or expenditure reduction strategies included in the forthcoming corrective action plan.
Comments on the February cash flow follow:
• Farebox receipts are currently tracking per forecast and staff continues to closely monitor.
• Bus purchases are tracking per forecast. As noted in last month's notes, the Operating Fund will temporary advanced funds to cover bus payments until the receipt of BRT Project funds.
• The $20 million Measure B loan from ACTIA, scheduled to arrive in February, was received in early March and invested.
• The first of the RAN's repayments is scheduled for late April and is fully funded.
• Approximately $7 million of Alameda County property tax, scheduled for receipt in April, was received in late March. This pushes the forecasted March close to approximately $59 million.
• Disbursements for outstanding A/P checks for the months September 2003 through February 2004 have been reclassified to payroll/wages/benefits. A/P transactions were subtracted from payroll/wages/benefits during this period. While there is no material change bottom line to the cash flows, A/P expenditures were overstated and payroll/wages/benefits were understated in the cash flow reports, for the referenced months, prior to this adjustment.
GM Memo 04-112
000004

tu i ecu ruictiluicti n
2nd Quarter Projection
000005

10 Year Financial Projection 2nd Quarter Projection
Scenario: Moderate Economic Recovery -Current Status
000006 I56PM

ATTACHMENT A
AC TRANSIT
POTENTIAL BUDGET REVISIONS - PRELIMINARY
Q3 PROJECTION FY 2003-04
As per 03/30/04 and 04/06/04 meetings
$000
Favorable/
Description of change (Unfavorable)
ISurplus as of Q2 FY 2003-04 Projection as of 03/11/04 215 |
* TDA adjustment to reflect revision by MTC (33)
* Welfare to work funding revised 155
* ADA Revenue addtl exchange PM 3,757
* Preventive maintenance revision (4,848)
* TFCA revision (383)
* ADA Paratransit funding (31)
* Bridge Toll grant revision (78)
*Fed Assist Sect 5307 Capital (98)
* Maintenance tech mechs wages adjustment (690)
* Other changes/revisions (Fuel and Lubricants?) (450)
IDefictt as of preliminary Q3 FY 2003-04 Projection as of 04/06/04 (2,484) |
Upside Potentials:
- TDA final revision 1 5q0
- AB1007 final revision 1 |qoo
Surplus after Upside Potentials as of 04/06/04 17
Revisions list FY 2003-04 04-05 Q3 Proj AprO6 4/15/2004 4:49 PM
10
000007

ATTACHMENT A
AC TRANSIT
WORKING BUDGET REVISIONS - PRELIMINARY
Q3 PROJECTION FY 2004-05
As per 03/30/04 and 04/06/04 meetings
Description of change
ISurplus as of 02 FY 2004-05 Projection as of 03/11/04"
$000
Favorable/
(Unfavorable)
* Farebox - fare increase not to be realized
* TDA adjustment to reflect revision by MTC
* Preventive Maintenance BDI revision
* ADA Paratransit funding
* Bridge Toll grant revision
* ADA Paratransit Vehicles
* Maintenance tech mechs wages adjustment
* Fringe Benefits - reduction in utilization rate for medical premium
costs at Kaiser down from 25% to 10% a year
* ADA Consortium expense adjustment
ISurplus as of preliminary Q3 FY 2004-05 Projection as of 04/06/oT
(48)
(16)
32
1,093
48
(1,401)
1,942
(600)
1,050
Revisions list FY 2003-04 04-05 Q3 Proj AprO6
000008
4/15/2004 4:54 PM
11

r*«.i* ciaw PY ditOd With Bua Proc
200J • 2D04 PROJECTED GENERAL FUND CASHFLOWS (Actuals wtUl updated pn|tetfOft«| (2nd QUARTER PROJECTION}
4.0M|Not«tti tere nc/tvc reductions
Urachsdutod dutt to tbTtng cf bcSing
PbtJM.2/2604
13 870 7.7Z
5.7411 Net with fatc/svc reductions
(tcuaiy
O O o o o
04/142C04
11:39 AM

Cash Fla*: FY 04/08 with Bus Proc
ittte Transportation Aartitance (STA)
>B4Z<STA)
18,308 47.369 44.824 37.497 27,704 21,102 34,911 32,499 25.289 23.605 25,166 7,423
iapaal Reimbursement
PmtramftVtan Lease
tsewutoe
iwwasumaAOvanoe)
lwmtm pwwma i irre MWYga
ha Dufciiul Funding 2 (gTP-FY 04/05) 2,021 2,240
2.000 2.240
3000 3,000
2.240 2.240 2.240 2.240 Ju
dpe Toll* 04/05 1.465 2,240
1,450 1,450 1,450 1,450
.SSEL
40.000
21,070 24,094 20,700 41,111 25,192 15,324 20.320 43,885 24,561
i—y.wapen
Conlniwtton
!Uto Board of
12.591
t5ie 1,356
tsi?"
12,410
TasT 1.356 L356
60" 50" :ops
_12J210_ 12210 1,356
12.110 12,010
7.016
_L356_
7,916
J2J010.
T356" T916"
5.000
401 401 401
166 166 168 166
17
is Tsoo"
so
"430" SO 50 50
169 170 170"
vementa
NDMG BALANCE
Board
© 24,218
29,061
47.3*9
(2,545)
44.824
31.421
(7.327)
37.497
"2T189"
(9,793)
27.704
■2735T
(6.602)
21.102
13,609
34.911
(2.412)
32.499
"22134"
(7.210)
26.289
20,400 20.400
22,004
(1.684)
42.304
t.561
28 1AA
42,304
(17.743)
IK
2,240
Tflgf 1.450
23,370
12.011
7,924
50
21,9t3
1.457
16,308
lio
56
16,950
2,102
600
331,
147,
HSr m 96,000
600
1.930
20,600
^030
40,800
34i3iO
(9.428)
Inc fare tnc/svc reduction*
Per JM 2/26
PftfJM2«6
Per JM 2^6
P«r JM 2/26
Per JM 2^6
Per JM 2/26
Per JM 2/26
J
nc tvc reductions
04/14^004
11:40 AM

ATTACHMENT D
Financial Operations for the Eight Months Ended February 29,2004
February Operations
As of the eight months ended February 29, 2004 and February 28, 2003, operating results for the District, Paratransit Services, and AC Transit Financing Corporation are summarized as follows:
DISTRICT (See attached Financial Statements):
The change in District equity from 02/28/03 to 02/29/04 is due primarily to timing of when capital contributions are booked. Capital contributions for FY 2002-03 were accumulated during the year in the balance sheet equity accounts and reclassified to revenues at year-end. Capital contributions during FY 2003-04 are recorded to revenues when received.
PARATRANSIT (See attached Paratransit Services Financial Statements):
Contract bus services is sole source of Paratransit program revenues.
Decrease in Paratransit program equity results from impact of Holiday season and driver shortages. Revenues declined beginning in November. New drivers have been hired since January and revenues are now beginning to increase.
GM Memo 04-112 OOOOll 15

ATTACHMENT D
AC TRANSIT FINANCING CORPORATION (See attached AC Transit Financing Corporation Financial Statements):
Increase in investment income reflects improved yield rates.
GM Memo 04-112
16 000012

PARATRANSIT SERVICES
FINANCIAL STATEMENTS
FOR THE EIGHT MONTHS ENDED
FEBRUARY 29, 2004
DATE ISSUED:3/15/04
000013 17

ALAMEDA-CONTRA COSTA TRANSIT DISTRICT
(PARATRANSIT SERVICES)
FINANCIAL STATFMFNTfi
TABLE OF CONTENTS
PAGE NO.
Balance Sheet - Assets 1
Balance Sheet - Liabilities and Capital 2
Revenue & Expenses - District Total (Year-To-Date) 3
Comparison of Revenue & Expenses, Year-to-Date 2004 vs. 2003 4
Revenue & Expenses - District Total (Month) 5
18 000014
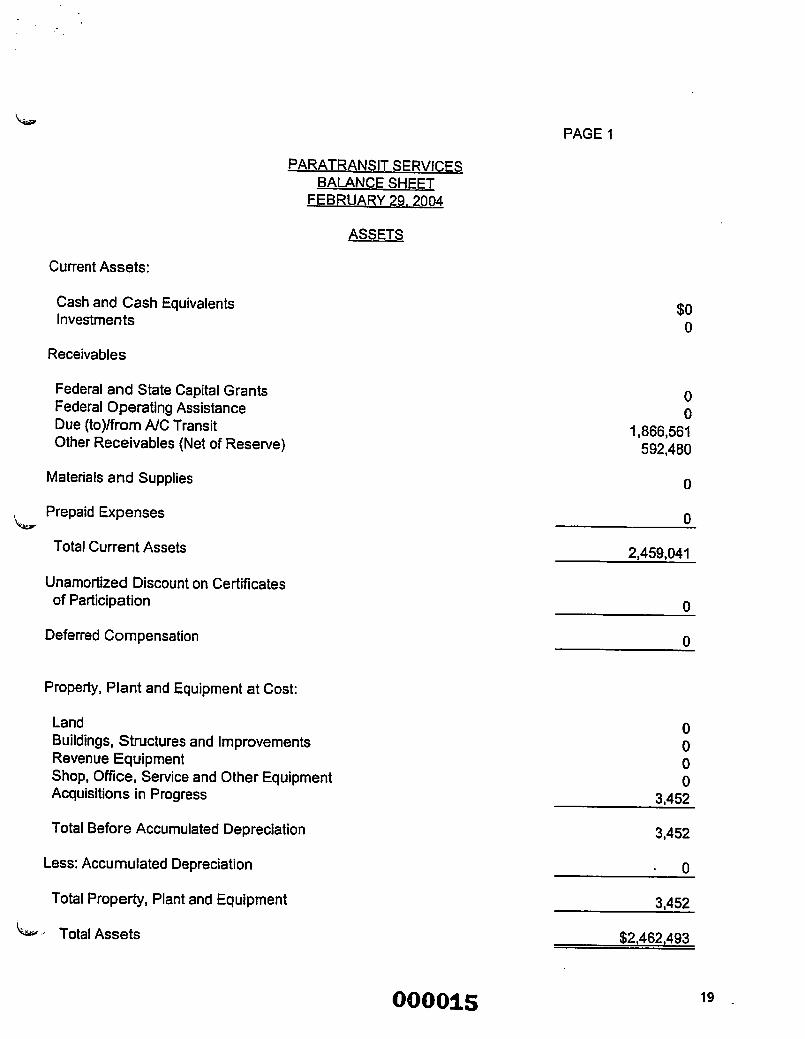
PAGE1
PARATRANSIT SERVICES
BALANCE SHEET
FEBRUARY 29. TfiOA
ASSETS
Current Assets:
Cash and Cash Equivalents
Investments
Receivables
Federal and State Capital Grants
Federal Operating Assistance
Due (to)/from A/C Transit
Other Receivables (Net of Reserve)
Materials and Supplies
Prepaid Expenses
Total Current Assets
Unamortized Discount on Certificates
of Participation
Deferred Compensation
$0
0
0
0
1,866,561
592,480
0
0
2,459,041
Property, Plant and Equipment at Cost:
Land
Buildings, Structures and Improvements
Revenue Equipment
Shop, Office, Service and Other Equipment
Acquisitions in Progress
Total Before Accumulated Depreciation
Less: Accumulated Depreciation
Total Property, Plant and Equipment
- Total Assets
0
0
0
0
3,452
3,452
• 0
3,452
$2,462.493
000015 19

PAGE 2
PARATRANSIT SERVICES
BALANCE SHEET
FEBRUARY 29. 2004
LIABILITIES
Current Liabilities:
Accounts Payable $1,169
Salaries, Wages , Vacations & Sick Leave 135^034 Book Overdraft ' q Other Liabilities 224
Due to/(from) AC Transit 0
Notes Payable - Rans 0
Notes Payable - Cops - S/T Portion 0
Capital Lease Obligation - S/T Portion 0
Deferred Revenue 0
Self-Insurance Reserves:
Public Liability and Property Damage 475,334
Workers'Compensation 558,114
Total Current Liabilities 1,169,875
Long Term Liabilities:
Deferred Compensation 0
Early Retirement 0
Accrued Unfunded Pension Costs 0
Notes Payable - L/T Portion 0
Capital Lease Obligation - L/T 0
Due to/(from) Financing Corp. 0
Total Long Term Liabilities 0
Total Liabilities 1,169,875
CAPITAL
District Equity:
Designated 0
Non-designated 1,292,618
Sub-Total 1,292^618 Contributed Capital:
Federal Grants 0
State Grants 0
Local Transportation Funds 0
Total Capital 1,292,618
Total Liabilities and Capital $2,462,493
20 000016

PARATRANSIT SERVICES
COMPARISON OF ACTtlAI REVENUE AND EXPENSE WITH BUDGFT FOR THE EIGHT MONTHS ENDED FEBRUARY 29 2004
DISTRICT TOTAL
PAGE 3
% OF YTD 66.85%
REVENUES:
Farebox
Contract Bus Service
Bart Transfers
Advertising
Interest Income
Other Income
OPERATING REVENUES
SUBSIDIES:
Property Taxes
Supplementary Service
AB1107
Transit Development Act
Federal Assistance
Measure "B"
Measure "C"
State Transit Assistance
ADA Paratransit Service
SUBSIDIES
REVENUE & SUBSIDIES
2.646.420
0
0
0
0
0
0
0
0
0
4.336.007 61.03%
N/A
2,646.420 4,336,007 61.03%
EXPENSES:
Operator Wages
Other Wages
Fringe Benefits
Pension Expense
Services
Fuel & Lubricants
Tires & Tubes
Office/Printing Supplies
Bus Parts/Maint. Supplies
Utilities
Insurance
Taxes
Leases & Rentals
Other Expenses
Purchased Transportation Service
Purchased Transportation - ADA
Interest Expense
Depreciation
EXPENSES
SURPLUS(DEFICIT)
Depredation-Contrib. Capital
Increase(Decrease) in District Equity
District Equity - Beginning of Year
1.044.753
382,095
903,550
63,934
2,333
97,595
5,762
5,154
30,710
0
193.333
275
63
(116)
0
0
0
0_
S2.729.441
1.699,692
684.288
1,295.643
59,000
35.640
119,169
12,358
12.562
80.340
0
318.780
1.986
0
0
0
0
0
0
$4.319.478
61.47%
55.84%
69.74%
108.36%
6.55%
81.88%
46.63%
41.03%
38.23%
N/A
60.65%
13.85%
N/A
N/A
N/A "
N/A
N/A
N/A
63.19%
($83,021)
(83.021)
1.375.639
District Equity - End of February 29,2004 $1,292,6.18
000017 21

PARATRANSIT SERVICES
COMPARISON OF ACTUAL REVENUE AND EXPENSE
FOR THE EIGHT MONTHS ENDED FEBRUARY 29. 2004 AND 2003
DISTRICT TOTAL
PAGE 4
22
000018

PARATRANSIT SERVICES
COMPARISON OF ACTUAL REVENUE AND EXPENSE WITH BUDGET
FOR THE ONE MONTH ENDED FEBRUARY 29. 2004
DISTRICT TOTAL
PAGE 5
REVENUES:
Farebox
Contract Bus Service
Bart Transfers
Advertising
Interest Income
Other Income
OPERATING REVENUES
SUBSIDIES:
Property Taxes
Supplementary Service
AB1107
Transit Development Act
Federal Assistance
Measure "B"
Measure "C"
State Transit Assistance
ADA Paratransit Service
SUBSIDIES
REVENUE & SUBSIDIES
317,909
0
0
0
0
0
0
0
0
0
4,336,007 7.33%
N/A
317,909 4,336.007 7.33%
SURPLUS(DEFICIT)
Depreciation-Contrib. Capital
Increase(Decrease) in District Equity
District Equity - End of January 31.2004
District Equity - End of February 29,2004
($26,076)
0
(26.076)
1.318.694
$1.292.618
000019 23

ALAMEDA-CONTRA COSTA TRANSIT DISTRICT
FINANCIAL STATEMENTS
FOR THE EIGHT MONTHS ENDED
FEBRUARY 29, 2004
UM
DATE ISSUED:3/15/04
24 000020

ALAMEDA.CONITRA COSTA TRANSIT DISTRICT
FINANCIAL STATEMENTS
TABLE OF CONTENTS
PAGE NO.
Summary of Cash and Investments 1
Balance Sheet - Assets 2
Balance Sheet - Liabilities and Capital 3
Revenue & Expenses - District Total (Year-To-Date) 4
Statement of Cash Flows 5
Revenue & Expenses - District Total (Month) 6
Comparison of Revenue & Expenses, Year-To-Date 2004 vs. 2003 7
000021 25

PAGE1
ALAMEDA-CQNTRA COSTA TRANSIT DISTRJP.T
SUMMARY OF CASH AND INVESTMENTS
FEBRUARY 29. 9004
A.C. TRANSIT
Cash - In Bank and on Hand
Bank of CA - Money Market
Bank of America - Money Market
Repurchase Agreements
Guaranteed Inv. Certificates (GIC)
U.S. Treasury Bills -
Less than 90 Days
Cash & Cash Equivalents
U.S. Treasury Bills-
Greater Than 90 Days
Total Cash & Investments
26 000022

PAGE 2
ALAMEDA-CONTRA COSTA TRANSIT DISTRICT
BALANCE SHEET
FEBRUARY 29. 2004
ASSETS
Current Assets:
Cash and Cash Equivalents
Investments
Receivables
Federal and State Capital Grants
Federal Operating Assistance
State and Local Operating Assistance
Other Receivables (Net of Reserve)
Due from/(to) Pension
Materials and Supplies
Prepaid Expenses
Total Current Assets
Unamortized Discount on Certificates
of Participation
Deferred Compensation
Property, Plant and Equipment at Cost:
Land
Buildings, Structures and Improvements
Revenue Equipment
Shop, Office, Service and Other Equipment
Acquisitions in Progress
Total Before Accumulated Depreciation
Less: Accumulated Depreciation
Total Property, Plant and Equipment
Total Assets
$45,371,071
396
7,178,502
109,866
19,007,463
3,319,670
117,835
6,779,585
376,380
82,260,768
1,645,647
11,402,646
121,772,747
248,416,211
103,564,154
45,878,313
531,034,071
268,603,740
262,430,331
$346.336.746
000023 27

PAGE 3 ALAMEDA-CONTRA COSTA TRANSIT njRTRir.T
BALANCE SHEFT
FEBRUARY 29. 2004
LIABILITIES
Current Liabilities:
Accounts Payable $8 321 -g1
Salaries, Wages, Vacations & Sick Leave 14 WQ9Q
Book Overdraft 2 786
interest Payable 4B2
Other Liabilities ftis' Notes Payable - Rans
Notes Payable - Cops - S/T Portion *1' 105 000 Capital Lease Obligation - S/T Portion ' ' 0
Deferred Revenue 0 7Oc 17Q
Self-Insurance Reserves: ' '
Public Liability and Property Damage 561 359
Workers' Compensation 5 848'677
Total Current Liabilities
Long Term Liabilities:
Deferred Compensation
Accrued Vacation and Sick Leave
Claims (Workers' Vacation and Sick Leave) Notes Payable - L/T Portion
Capital Lease Obligation - UT
Due to/(from) Financing Corp.
Total Long Term Liabilities
Total Liabilities
CAPITAL
District Equity:
Designated
208 177 457 Contributed Capital: ' *4t)' Federal Grants 0
State Grants ^
Local Transportation Funds 0
Total Capital 208,177.457
Total Liabilities and Capital $346 336 746
28 000024

ALAMEDA-CONTRA COSTA TRANSIT DISTRICT
COMPARISON OF ACTUAL REVENUE AND EXPENSE WITH BUDGET
FOR THE EIGHT MONTHS ENDED FEBRUARY 29. 2004
DISTRICT TOTAL
PAGE 4
% OF YTD 66.85%
YTD%
29

PAGE 5
ALAMEDA-CQNTRA COSTA TRANSIT DISTRICT STATEMENT OF CASH Fl OWS
FOR THE EIGHT MONTHS ENDED FEBRUARY 7Q
CASH FLOWS FROM OPERATING ACTIVITIES: Cash received from customers
Cash payments to suppliers for goods and services Cash payments to employees for services Other operating revenues
Net cash used for operating activities
CASH FLOWS FROM NONCAPITAL FINANCING ACTIVITIES: Operating grants received
Principal paid on certificates of participation
Interest paid on revenue anticipation notes
Proceeds from sale of revenue anticipation notes
Net cash provided by noncapital financing activities
CASH FLOWS FROM CAPITAL AND RELATED FINANCING ACTIVITIES: Capital contributed by grants
Acquisition and construction of capital assets
Principal paid on certificates of participation
Discount amortization on note payable
Principal paid on capital lease obligation
Interest paid on certificates of participation Interest paid on capital lease
Net cash provided by capital and related financing activities
CASH FLOWS FROM INVESTING ACTIVITIES:
Sales of investment securities
Purchases of investment securities
Interest and dividends on investments
Net cash used for investing activities
Net increase (decrease )in cash and cash equivalents
CASH AND CASH EQUIVALENTS AT BEGINNING OF YEAR
CASH AND CASH EQUIVALENTS AT FEBRUARY 29, 2004
$31,858,134
(39,612,207)
(126,630,728)
"£322,385
(129,062,416)
130,254,785
0
(350,000)
35,187,740
"165TO92,525"
32,542,404
(51,114,716)
(1,075,000)
(76,099)
0
(367,061)
0
(20,090,472)
9,994,236
(4,996,632)
_ 244,246
5,242,350
21,181,986
... ,24'.189^085
$45,371,071
30 000026

ALAMEDA-CONTRA COSTA TRANSIT DISTRICT
COMPARISON OF ACTUAL RFVENUE AND EXPENSE WITH
FOR THE ONF MONTH FEBRUARY 29. 2004
DISTRICT TOTAL
PAGE 6
REVENUES:
Farebox
Bart Transfers
Contract Services
Advertising
Interest income
Other Income
OPERATING REVENUES
SUBSIDIES:
Property Taxes
Supplementary Service/Welfare to Work AB1107
Transit Development Act
Fedl Assist- ADA Set Aside/Planning
Fed Assist-Bus Def.ffires & Tubes/Other
Fed Assist-Prev. Maint. (Van Hool) Measure "AA"
Measure "B"
Measure "C"
State Transit Assistance
ADA Paratransit Service/Consortium SUBSIDIES
REVENUE & SUBSIDIES
5,575,215
4,215,416
745,833
2,395,834
3,802,677
3,433
1,246,976
0
583.333
1.949.054
125,500
321,777
327.165
15.716,998
58,014,451
51,608,000
5,327,000
28,750,000
46,149,000
3,266.000
26,257,000
0
7,000,000
19.100.000
1,506,000
3,651,000
3,811,000
196,425,000
9.61%
8.17%
14.00%
8.33%
824%
0.11%
4.75%
N/A
8.33%
10.20%
8.33%
8.81%
8.58%
8.00%
21,292,213 254,439.451 8.37%
EXPENSES:
Operator Wages
Other Wages
Fringe Benefits
Pension Expense
Services
Fuel & Lubricants
Tires & Tubes
Office/Printing Supplies
Bus Parts/Maint. Supplies
Utilities
Insurance
Taxes
Leases & Rentals
Other Expenses
Purchased Transportation Service
Purchased Transportation - ADA
Interest Expense
EXPENSES
Surplus (Deficit) before Deprn. & Capital
Contributions
Depreciation
Depreciation-Contrib. Capital
Net Depreciation
Capital Contributions
Increase(Decrease) in District Equity
District Equity - End of January 31, 2004
District Equity - End of February 29,2004 208.177.457
4,513,201
3,750,573
6.268,518
1,415,919
1.051,709
571,878
106.254
53.805
583,944
279,689
353,736
71.976
61.960
120,897
23,956
1,329,848
120,266
$20,678,130
$614,083
(2,904,726)
(2.904,726)
0_
(2.290,643)
210,468,100
56,960,794
45.875.919
67.505.921
17,027,000
15,574,587
7,088,121
1,326.046
1.054,481
8.257.987
2.915.251
4,947.000
1,780,977
610,616
657,749
160,000
15,732,000
1.581.000
$251.055.451
7.65%
8.18%
9.29%
8.32%
6.75%
8.07%
8.01%
5.10%
7.07%
9.59%
7.15%
4.04%
10.15%
18.38%
14.97%
8.45%
7.61%
8.24%
000027 31

ALAMEDA-CONTRA COSTA TRANSIT DISTRICT
COMPARISON OF ACTUAL REVENUE AND EXPENSE
FOR THE EIGHT MONTHS ENDED FEBRUARY 29. 2004 AND 2003
DISTRICT TOTAL
PAGE 7
32
000028

Alameda Contra
Costa Transit District
Financing Corporation
Financial Statements
For the Eight Months Ending
February 29, 2004
Post-audit Issued February 12,2004
000029 33

ALAMEDA CONTRA COSTA TRANSIT DISTRICT
FINANCING CORPORATION (COPS)
STATEMENT OF NET ASSETS AVAILABLE TO CERTIFICATE HOLDERS At February 29,2004
As of
February 29,2004
Assets:
Cash, unrestricted
Investments, unrestricted
Note Receivable ACTD- Current Portion
Interest Receivable-ACTD
Intercompany-ACTD
Total Current Assets
Cash & Investments, restricted for debt service
Note Receivable, ACTD-Long term portion
Unamortized Intercompany deferral
Note Receivable, net
Unamortized Issuance Costs
Total Assets
Liabilities:
Accounts Payable
Interest Payable
Certificates of Participation-current portion
Total Current Liabilities
Funds Held for ACTD
Certificates of Participation-Long term portion
Unamortized deferred amount from refunding
Total Liabilities
Net assets available for certificate holders
37,028
1,105,000
74,732
PAGE1
34 000030

ALAMEDA CONTRA COSTA TRANSIT DISTRICT
FINANCING CORPORATION (COPS)
STATEMENT OF CHANGES IN NET ASSETS
For the Month Ended February 29,2004
One Month
Ending February 29
Additions to net assets attributed to:
Interest From ACTD to Fin Corp
Amortization on Deferral
Investment Income
Total Additions
Deductions from net assets attributed to:
Interest to Certificate Holders
Interest Expense: amortization of net gain from defeasence
Amortization of COPS issuance costs
Total Deductions
Net increase (decrease)
Net assets available for Certificate Holders:
Beginning of period
Net assets available for Certificate Holders:
End of period
PAGE 2
000031 35

ALAMEDA CONTRA COSTA TRANSIT DISTRICT
FINANCING CORPORATION (COPS)
STATEMENT OF CHANGES IN NET ASSETS
For the Eight Months Ended February 29,2004
Additions to net assets attributed to:
Interest From ACTD to Fin Corp
Amortization on Deferral
Investment Income
Total Additions
Deductions from net assets attributed to:
Interest to Certificate Holders
Interest Expense: amortization of net gain from defeasence
Amortization of COPS issuance costs
Total Deductions
Net increase (decrease)
Net assets available for Certificate Holders:
Beginning of period
Net assets available for Certificate Holders:
End of period
PAGE 3
36 000032

ALAMEDA CONTRA COSTA TRANSIT DISTRICT
FINANCING CORPORATION (COPS)
REPORT TO CERTIFICATE HOLDERS
For the Eight Months Ended February 29,2004
The following is a summary of the Financing Corporation activity:
AC Transit District Interest Contributions
Amortization on Deferral
Investment Income
Total Income
Interest Payments to Transfer Trustee
Interest Expense: amortization of net gain from defeasence
Amortization of COPS Issuance Costs
Administrative Expenses
Total Expenses
Net Increase
Net Assets at Beginning of Period
Net Assets at End of Period
Eight Months
Ending February 29
PAGE 4
000033 37

ATTACHMENT E
Monthly Investment Report for February 2004
The General Fund Investment Report for the month of February 2004 is provided
for information and review.
The following disclosure statements are being made in accordance with California
Government Code Section 53646 (b)(2) and (3):
The portfolio contained in the Monthly Report on Investments for February 2004
is in compliance with Investment Policy No. 336. As reported in March 2003, the
District requires additional financial assistance to meet its expenditure
requirements for the next six months. On March 6, 2003, the Board authorized
the use of Revenue Anticipation Notes as a budgetary strategy in FY 2003-04 to
enable the District to borrow funds to offset temporary cash deficits that will
impact the ability to pay the operating and capital obligations of the Agency. On
August 28, 2003, the District received $35,312,900 from the sales of these
Revenue Anticipation Notes. The District is pursuing Revenue Anticipation Notes for the Fiscal Year 2004-05.
Current investment earning trends are summarized below:
Feb 2003
Feb 2004
Earnings on the District's Repurchase Agreements (0.456%) fell below the current 3 month Treasury Bill benchmark (0.937%) as rates are dependent on
the Federal Funds rate. Earnings on the District's Agency Discount Notes (0.980%) continue to exceed the 3 month Treasury Bill benchmark (0.937%).
On November 6,2002, the Federal Funds rate was reduced by 50 basis points to 1.25% resulting in lower interest income rates for overnight repurchases. This
rate remains in effect per the outcome of all Federal Reserve meetings held since that date.
GM Memo 04-112
38 000034

o o o
ALAMEDA - CONTRA COSTA TRANSIT DISTRICT
MONTHLY REPORT ON INVESTMENTS
FOR THE GENERAL FUND
FEBRUARY 29, 2004

ALAMEDA - CONTRA COSTA TRANSIT DISTRICT
MONTHLY REPORT ON INVESTMENTS
Table of Contents
Page
O Investment Summary 1
O p Investment Overview 2 CO
Return on Investments 3
Detail of Portfolio 4
Repurchase Agreements 5
Government Securities (General Fund) 6
Government Securities (Bus Procurement Fund) 7
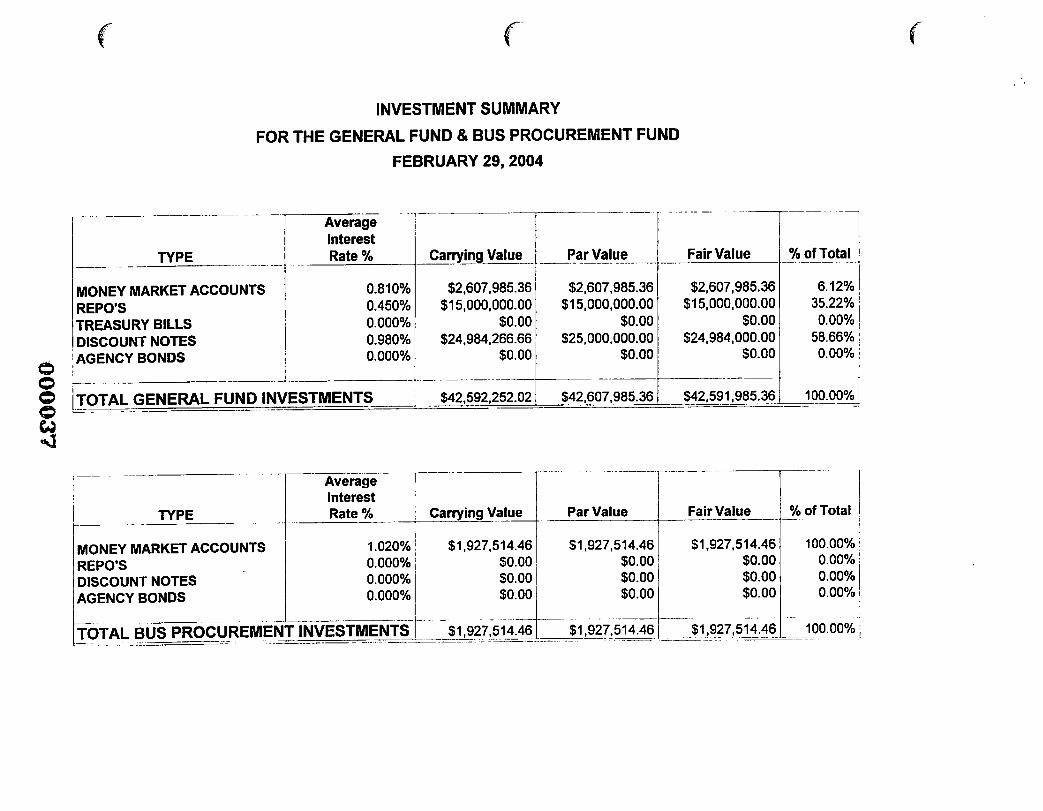
INVESTMENT SUMMARY
FOR THE GENERAL FUND & BUS PROCUREMENT FUND
FEBRUARY 29, 2004
© O o o

ALAMEDA • CONTRA COSTA TRANSIT DISTRICT
INVESTMENT OVERVIEW
FOR THE GENERAL FUND & BUS PROCUREMENT FUND
FEBRUARY 29, 2004
YTD
APR MAY JUN AVERAGE
0.4S7%
0867%
0840%
0.986%
Agency Bonds (purchased In current month)
o o o o c; GO
AVERAGE INTEREST RATE
Repurchase Agreement! (12-monin avQ)
Monty Market Accounts (t2nxxi1n ovg)
Go* Securtles held ai rnonlh ond
Treasury BUS (Portfolio)
Ofcecurt Notes (Porttodo)
Agency Boo* (Poftto&rt
BEWCMMAHKa
Current Mm9i Oaly Fed Funds Average
Current Worth Daly 3 Month T BH Ra» Averttoe
MontMy Atg ol oaty r-ca r-ura» 112 manm mv)
MoMMy Atg i MonO) T Bit Rota (12 month avg)
AVER/WE MATURfTY OF MVE3TMEMT3
Retwrdtose Arjifomtrls
Treasury BilS
Discount Notes
Afleney Bonds
MVfFSTWSWTa AT CAUB YINfi Vfll <fF
Repurdtase A«re«nents
UsrMy Market Account*
Treasury BUS
AQCtcy Bonds
MVESTMENTaATCQSI
0974%
0029%
0904%
0 941%
0601%
0953%
1.000%
09S2%
• 019%
0934%
0 533%
0919%
$12,000,000 S1S.O00.O00 tS.2S0.0O0 S8.0S0.000 S1S.0O0.O0O S15.000.000 S13.370.000 S15.C0O.000
t17.S16.057 S1S.634.138 SI0.S79.72S M.JM.C39 13.1W.442 13.564.28$ 447.843 4.535.900
S4.S99.3S7
S29.962.6S2 S34.07e.739 S34.977.422 9.997.917 24.930.171 29.931.378 24.984227
J29.516.0S7S6S.S9S.tS7 JSI.IIXMW SS<.392.121 $38,148,359 S53.S44.4S6 S43799.211 U4^19.T27
129.516.057 t6S.592.097 SS1.0S0.S04 SSI .399.65* S38.139.192 S53.5J3.913 S43.781.0S6 S44.504.033
DAYS
0.646%
0.972%
0210%
0988%
0478%
0899%
0676%
1.063%
DAYS
2
14
27
J12.337.S00
$10,507,841
S4.9S8.387
$27,122,824
SO tS4.9GJS.63l
M7.189.507
DAYS

ALAMEDA - CONTRA COSTA TRANSIT DISTRICT
RETURN ON INVESTMENTS
FOR THE GENERAL FUND & BUS PROCUREMENT FUND
FEBRUARY 29, 2004
RETURN ON INVESTMENTS
Repurchase Agreements
Money Market Accounls
Treasury Bills
Discount Notes
Bonds
Total return on investments
Interest received
Accrued interest
Total return on Investments
2003
JUL
$4,117
7,534
2,336
$3,467
10.386
467
3,071
SEP
$4,061
14.750
1.167
22.674
$3,802
10,076
O
26.928
NOV
$4,121
9,537
O
20.493
$34.151
$33,790
361
S34.1S1
DEC
$6,008
6,118
0
12,625
$24.751
2004
JAN FEB MAR
$5,199
9.011
0
22.872
S5.018
2.348
0
22.419
$37,082 $29.785 $0
APR MAY JUN
$0 $0 $0
S23.897
854
$15,230
21.792
$29,315
470
$24.751 $37,082 S29.785 SO $0 $0 so
© o o o
PORTFOLIO INVESTED
Average daity portfolio available for investment J15.B85.749
Average daily portfolio invested $13,013,871
% of average da9y portfolio invested 81.92%
CARRYING VALUE GENERAL FUND PORTFOLIO
CABBYJNJS-VALUE-B-US PROCUREMENT PORTFOLIO
$21,065,111
$20,720,387
98.38%
S44.837.597
$44,172,590
98.52%
$43,354,773 $36,135,621 $30,807,349
$42,765,708 $35,605,583 S30.474.276
98 64% 98.53% 98.92%
FY 02/03
Jul 2002
Aug
Sep
Oct
Nov
Doc
Jan 2003
Feb
Mar
Apr
May
Jun
$3,326,111
$3,331,373
$3,336,275
$6,333,657
$1,751,770
S4.293.460
S8.G98.B05
$12,543,001
S14.B37.136
S16.963.151
$16,976,610
S14.443.B83
$42,885,912
$41,565,506
86.92%
S43.345.823
$43,110,984
99.46%
FY 00/01

TYPE
MONEY MARKET ACCOUNTS
Bank of America
Union Bank of CA
REPO'S Bank of America
TREASURY BILLS:
02G9/04
ALAMEDA - CONTRA COSTA TRANSIT DISTRICT
DETAIL OF PORTFOLIO
FOR THE GENERAL FUND & BUS PROCUREMENT FUND
FEBRUARY 29, 2004
Purchased
From
TOTAL REPO
TOTAL TREASURY BILLS
AGENCY DISC NOTES:
5
17
26
33
40
TOTAL DISCOUNT NOTES
TOTAL BONDS
0.960%
1.000%
0.970%
0.980%
0970%
0.973%
1.014%
0.983%
0.994%
0.983%
4.999.466.67
4.997.777.78
4.996.631.94
4.995.644.44
4.994.745.83
24 0976% 0.990% 24.984.266.66
5.000,000.00
5.000.000.00
5.000.000.00
5.000.000.00
5.000.000.00
25.000.000.00
MONEY MARKET ACCOUNT:
Union Bank of CA TOTAL MONEY MARKET ACCOUNTS 1.020% 1.020% 1.927,514.46
TREASURY BILLS:
AGENCY DISC NOTES:
TOTAL TREASURY BILLS
TOTAL DISCOUNT NOTES
1.927.514.46
4.999.500.00
4.998.000.00
4,996.500.00
4.995.500.00
4.994.S00.00
24.984.000.00
42.592.252.02 42,607.985.36 42.591.985.36]
1.927.514.46
AGENCY BONDS:
IPORTFOOO -BUS 1,927.514.46 1.927.514.46 1.927.514.46
ITOTAL PORTFOLIO 44,519,766.48 44,635,499,82 44,519,499.82
COMPOSITION OF PORTFOLIO:
Money Market Accounts
Repurchase Agreamonts
Treasury Bills
Discount Notes
Bonds
GENERAL FUND
6 12%
3522%
0 00%
58 66%
0 00%
100 00%
BUS PROCUREMENT
100.00%
0.00%
000%
0.00%
0.00%
100.00%

ALAMEDA - CONTRA COSTA TRANSIT DISTRICT
REPURCHASE AGREEMENTS
FOR THE MONTH ENDED
FEBRUARY 29, 2004

ALAMEDA - CONTRA COSTA TRANSIT DISTRICT GENERAL FUND
GOVERNMENT SECURITIES SUMMARY
FOR THE MONTH ENDED
FEBRUARY 29, 2004

o o
ALAMEDA - CONTRA COSTA TRANSIT DISTRICT BUS PROCUREMENT FUND
GOVERNMENT SECURITIES SUMMARY
FOR THE MONTH ENDED
FEBRUARY 29, 2004
I TOTAL GOVERNMENT SECURITIES 0.001 0.001 0.00! 0.001 0.001 0.001 0.001
000
0.001
Too? Government Securities 90 days and less
Government Securities over 90 days
Total Government Securities - Aged
Variance
Tool Tool oobi oool
_O00J
JJJXJ] _0 00
0.00
0.00
000
JOOO
0.00
uoo
000
J)00
000
0001
0001
000;
000:
000
000
000
000
000
0 001
0001
OJOOJ
OMl
OOVT SECURITIES OVER M OATS I OS/29/04 I For he mill ended 07/29/04
000
0.00
OUJO
Pg 2
vostmonts et Cos)
0.00
o.oo
„ 0.00
P93 ■ Irtlcrest Reed

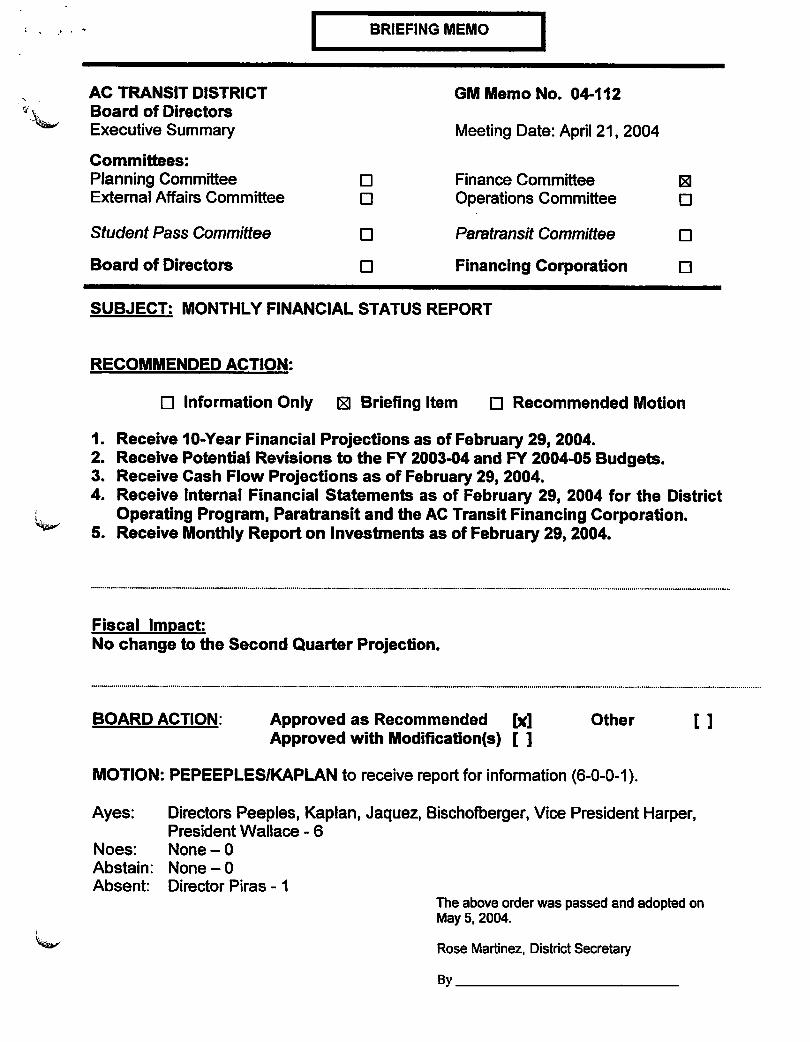
YTD Total Farebox Revenue GM MEMO 04-112
Attachment F
,300,000
2.200,000
2,100,000
2,000,000
1,900,000
1,800,000
1,700.000
1,600,000
Farebox Cash
►—FY 01/02
■-FY 02/03
— FY 03/04
G/L Pass Sales Bookings
Cash Totals:
FY 01/02:
FY 02/03:
FY 03/04
Projection:
$22,969,145
$22,222,411
$23,390,148
2,200.000
2,000,000
1,800,000
1.600.000
1,400.000
,200,000
,000,000
-FY 01/02
-FY 02/03
FY 03/04
G/L Totals:
FY 01/02:
FY 02/03:
FY 03/04
Projection:
$19,467,460
$15,476,617
$18,898,095
Total Farebox Revenue
4,400,000
4,200,000
4,000,000
3,800,000
3,600,000
3,400,000
3,200,000
3,000,000
2,800,000
Total Farebox
FY 01/02
FY 02/03
FY 03/04
$42,436,605
$37,699,028
FY 01/02:
FY 02/03:
FY 03/04
Projection:
48 000044

Forwbon Cash saam
Firebm cuh and OL booWrtoi griiptii.xh
Juli Annual Saatembar October November Pac«mb«r January Etbroarv March fiElil &9X ^»nq TOTAL fnc/Dae from previous vnar Avu/month Prolaetlon
FY0IK>2 2.046.616 2.050.695 1.997.039 2.093.392 1.BS4.I01 1.753.705 1.905.233 1.745.631 1.897.344 1.680.656 1.912.589 1.831.544 22.969.145 1914095 lavo'121
FY 02/03 1.909.629 1.917.521 2.055,656 2.074.434 1.782.000 1.637.744 1.867.90S 1.699.142 1.647.777 1,762,379 1.619.-173 1.797,871 22.222,411 (746.734) iWc&O FYOSflM 1.B29.173 1.842,645 2,176.185 2,168.916 1.842,341 1.847.452 1,917.539 13.644.253 34B.484 1949*170 23390148 %lncJD»c: -4.21% -3.90% 5.86% 5.52% 3.34% 9.46% 2.66%
o o
o o
in

Tatttwy Oft. T1cfccW»M Satan Fwebei nih end 01 boaktogi VW*t it>
o ut N>y fi£tSkU MfiyWltwr Qgcambar Janmrv F^fflfg Bwch flfi£fl MM JUIll TOTAt, FV 01/02 2.112.974 1.031.709 1.301.935 2.027.284 1,682.395 1.638.748 1.675.164 1.543.536 1.261.590 1.459.837 1.565.923 1.338.JB8 19487480
FY02W3 1.303.565 1.481.179 1.410.031 1.151.320 1.444.676 1.233.428 1.362.587 1.166,142 1,164.724 1,155.643 1.262.651 1.320.671 15478617
FYOJrtM 1,230.673 2.002.501 1.541.052 1.677.222 1.546.486 1.522.191 1.503.764 1i'o23'e89 -592% 20.03% 8.50% 31.36* 6.58% 1697% 9.39% ' '
(3990643)
1637103
1.622^88 (tvg'12)
1.269.716 15.476.617
1.574.841 18.698.095
o o o ©

July August 8<mt«mfaw peMm Noymrtwr Dacambw Jmhiot February UffiSb fiElll MM jHtt TOTAL |pcffl«c trem nrevtom v«»r AwtfManHi Protection FY01/02 4159 590 3,712481 3.298.974 4,120.676 3.736.496 3.392.453 3.560.397 3.289.167 3,159.534 3.340.493 3.478.512 3.167.832 42.43S.605 3.S3S.384 (av9*12|
FY02fO3 3213194 3.398700 3,465.687 3.225.754 3.227,558 2.921.172 3.230.492 2,665.284 3.012,501 2.918,022 3.102.124 3.118.542 37.699.028 (4.737.577) 3.141.586 15.476.617
FY 03/04 3.059.846 3.845.146 3.717.237 3.666.140 3.3B8.827 3.369.643 3.421.303 24.668.142 1.985.587 3.524.020 42.26B.243
%lnc/Oce: -5.01S 11.61% 877% 16 56% 4.76% 13.31% 558%
o o o o