Embed Size (px)
Citation preview
www.elsevier.com/locate/tecto
Tectonophysics 377 (2003) 357–381
Subcritical compaction and yielding of granular quartz sand
Stephen L. Karner*, Frederick M. Chester, Andreas K. Kronenberg, Judith S. Chester
Center for Tectonophysics, Department of Geology and Geophysics, Texas A&M University, College Station, TX 77845, USA
Received 18 February 2003; accepted 15 October 2003
Abstract
Cylindrical samples of water-saturated, initially loose, St. Peter quartz sand were consolidated using triaxial deformation
apparatus at room temperature, constant fluid pressure (12.5 MPa), and elevated confining pressures (up to 262.5 MPa). The
samples were deformed along four loading paths: (1) hydrostatic stressing tests in which confining pressure was monotonically
increased; (2) hydrostatic stress cycling similar to (1) except that effective pressure was periodically decreased to initial
conditions; (3) triaxial deformation at constant effective pressure in which differential stress was applied after raising effective
pressure to an elevated level; and (4) triaxial stress cycling similar to (3) except that the axial differential stress was periodically
decreased to zero. Hydrostatic stressing at a constant rate results in a complex nonlinear consolidation response. At low
pressures, large strains occur without significant acoustic emission (AE) activity. With increased pressure, the stress versus
strain curve becomes quasi-linear with a corresponding nonlinear increase in AE rates. At elevated pressures, macroscopic
yielding is marked by the onset of large strains, high AE rates, and significant grain failure. Stress cycling experiments show
that measurable inelastic strain occurs at all stages of hydrostatic loading. The reload portions of stress cycles are characterized
by a poro-elastic response and lower AE rates than during constant rate hydrostatic stressing. As the stress nears and exceeds the
level that was applied during previous loading cycles, strain and AE rates increase in a manner consistent with yielding. Triaxial
stressing cycles achieve greater consolidation and AE rates than hydrostatic loading at similar mean stress levels. By comparing
our results with previously published studies, we construct a three-component model to describe elastic and inelastic
compaction of granular sand. This model involves acoustically silent grain rearrangement that contributes significant inelastic
strain at low pressures, poro-elastic (Hertzian) deformation at all pressures, and inelastic strain related to granular cracking and
particle failure which increases in significance at greater pressures.
D 2003 Elsevier B.V. All rights reserved.
Keywords: Compaction; Deformation; Flow; Fracture; Sand; Sedimentary
1. Introduction
Understanding the processes associated with con-
solidation and densification of granular media is
fundamental for many research topics in the Earth
0040-1951/$ - see front matter D 2003 Elsevier B.V. All rights reserved.
doi:10.1016/j.tecto.2003.10.006
* Corresponding author. Fax: +1-979-845-6162.
E-mail address: [email protected] (S.L. Karner).
sciences: such as mass movement (e.g. landslides,
turbidity flows), pyroclastic flows, high-velocity plan-
etary impacts, migration of mantle melt, sediment
transport, burial diagenesis of sedimentary rocks,
and shear-enhanced evolution of fault zone materials
(gouge). Loose sediments compact to form consoli-
dated rock when subjected to the physico-chemical
conditions associated with burial (e.g. pressure, tem-

S.L. Karner et al. / Tectonophysics 377 (2003) 357–381358
perature, presence and type of fluids). The path by
which sediments become lithified plays a major role
in determining the various physical properties of
sedimentary rocks (e.g. mineralogy, degree of grain
packing, bulk strength, permeability, porosity). Simi-
larly, consolidation processes can significantly alter
the strength and flow properties of granular fault
gouge. Thus, in order to properly understand the
material properties and evolution of these granular
systems, it is necessary to first understand how the
granular medium responds to deformation.
In material science and soil mechanics, a deform-
ing granular aggregate is often considered to be an
elasto-plastic material. This concept has been perpet-
uated by the continued testing of clay-rich soils
sparked by the pioneering work of Terzaghi (1925).
That is, stressing of a porous media is considered to
induce an initial stage of elastic deformation followed
by an interval of non-recoverable strain similar to
plastic flow. As such, there are several descriptive
statements that are used to define the stress–strain
behaviour of the deforming granular medium (Britto
and Gunn, 1987): (1) a yield function for the material;
(2) an expression relating directions of principal
strains to principal stresses; (3) a flow rule; and (4)
post-yield deformation style.
The key aspects in this definition are that the
material is elasto-plastic and that it exhibits a distinct
yield point. By definition, yielding occurs when a
material is strained beyond its elastic limit whereby
subsequent strain cannot be recovered when the
applied stresses are relaxed. Below the elastic limit
where the yield condition has not yet been satisfied, a
material is considered to be either rigid or in a state of
elastic deformation. It is this strict definition of yield
that is used to describe the yield function which, in
turn, defines the stress–strain characteristics of a
deforming media. Compaction experiments on sand-
stones appear to follow this style of deformation (e.g.
Brace, 1978; Zhang et al., 1990a,b). Volumetric
strains are nonlinear at low stresses, with a transition
to quasi-linear loading as applied stress increases
(resembling the behaviour of an elastic material).
This quasi-linear loading trend continues to an inflec-
tion point (P*) above which volumetric strains ac-
celerate and show measurable permanent deformation
(Zhang et al., 1990a,b). This latter stage is associated
with large acoustic emission rates (indicative of
fracturing processes) and pervasive grain crushing,
in a manner consistent with sample yield. In practice,
however, materials may not display such idealized
yield behaviour.
Studies of deformation in sands (e.g. Zoback and
Byerlee, 1976; Brzesowsky, 1995) and sandstones
(e.g. Zhang et al., 1990a,b; David et al., 1994; Wong
et al., 1997; Baud et al., 2000) show that the critical
pressure, P*, marks the onset of pervasive grain
crushing. Clearly, grain-scale brittle deformation at
P* is associated with macroscopic sample yield and
involves permanent damage leading to non-recover-
able strains and porosity loss coupled with a reduction
in permeability (e.g. Zoback and Byerlee, 1976).
However, it is unclear exactly how deformation is
accommodated at pressures below the macroscopic
crushing strength, P*. Is strain within a deforming
granular aggregate accommodated via purely elastic
means, or are other inelastic mechanisms involved in
deformation?
To investigate deformation at sub-critical pres-
sures and to help isolate relative contributions from
elastic and inelastic strain mechanisms, we performed
compaction experiments on cohesionless samples of
granular quartz sand in standard triaxial deformation
apparatus. Our samples exhibit deformation behav-
iour consistent with results from sandstones (e.g.
Zhang et al., 1990a,b), compaction in soils (e.g.
Terzaghi, 1925; Britto and Gunn, 1987; Bridgwater,
1994), consolidation of oceanic sediments (e.g.
Olgaard et al., 1995), and poro-elastic models of
granular deformation (Hertz, 1881; Mindlin and Der-
esiewicz, 1953; Gangi, 1978; Brzesowsky, 1995).
Taken collectively, these studies indicate that granular
deformation involves both elastic and inelastic mech-
anisms that operate simultaneously. Thus, care must be
taken to correctly identify the modes of strain accom-
modation—particularly leading to the functional de-
scription of yield.
2. Experiment procedure
2.1. Experiment sample and preparation
St. Peter quartz sand was chosen for this study and
was collected from Battle Creek in Minnesota, USA.
The St. Peter formation is a very pure, fine-grained,

S.L. Karner et al. / Tectonophysics 377 (2003) 357–381 359
well-sorted, friable quartzose sandstone of middle
Ordovician age probably deposited in a near-shore,
transgressive marine environment (Borg et al., 1960;
Arbenz, 1989; Pitman et al., 1997). While the sand is
well sorted and grains are sub-rounded at the optical
scale, scanning electron microscopy reveals the sand
grains to have a rough ‘‘brain-like’’ surface morphol-
ogy (e.g., Elias and Hajash, 1992). Prior to experi-
ments, the sand was cleaned in a dilute acid bath (5%
HCl), washed with distilled water, and air-blown to
remove fines (following the procedure of He, 2001).
The sand was sieved to produce two different size
fractions (124–180 and 250–350 Am).
Samples of the loose, granular sand were encased
by silver foil soldered into cylindrical form and then
jacketed by a heat-shrinkable poly-olefin or Teflon
(PTE) tube. A thin wafer of Berea Sandstone (2.5
mm) was placed at the pore-fluid access port to
prevent loss of sand grains into the pore-fluid system.
During preparation of the sample assembly, the sand
was gently vibrated so as to pre-compact the material
and minimize the starting porosity. The mass of sand
used for each experiment was determined by weighing
on a digital balance, and these values were used to
calculate starting porosities for our experiments (see
Table 1). Prior to insertion of the sample assembly
into the testing apparatus, air was evacuated from
sample pore space and this was followed by injection
of distilled water to pre-saturate the sand-pack.
2.2. Laboratory equipment
Hydrostatic and triaxial compaction experiments
were performed in two screw-driven triaxial testing
Table 1
Summary of experiment conditions and sample details
Experiment Type of experiment Grain size
(Am)
LSR4492 Hydrostatic constant stress rate 124–180
MVSR029 Hydrostatic constant stress rate 250–350
MVSR031 Hydrostatic constant stress rate 250–350
MVSR030 Hydrostatic constant stress rate 250–350
LSR4475 Hydrostatic constant stress rate 250–350
MVSR016 Hydrostatic stress cycling 124–180
MVSR013 Hydrostatic stress cycling 250–350
MVSR027 Triaxial constant stress rate 250–350
MVSR026 Triaxial stress cycling 250–350
Karner et al. (2003) to be published in Tectonophysics.
machines in the John Handin Rock Mechanics labo-
ratory at Texas A&M University. Each apparatus
provides different capabilities suitable to address
particular goals of an experiment. One machine
(LSR) is a variable strain rate, triaxial compression
apparatus designed to deform specimens up to 5 cm
diameter and 20 cm length at strain rates from 10� 3 to
10� 8 s� 1, at confining and pore-fluid pressures to
300 MPa, and at room temperature (Handin et al.,
1972). The other is a modified variable strain rate
triaxial compression apparatus (MVSR) designed to
deform 2.5 by 6 cm samples at confining and pore
pressures to 150 MPa, temperatures to 300 jC and
strain rates from 10� 3 to 10� 8 s� 1 (Heard, 1963).
Each apparatus subjects jacketed cylindrical sam-
ples to an external pressure imposed by a liquid
confining media, and provides access to sample void
space for the injection of distilled water pore fluid (see
Fig. 1). For our experiments, sample lengths and
diameters were 50 and 25 mm, respectively, for the
LSR apparatus. The same dimensions for MVSR
samples were 43 and 19 mm, respectively. Owing to
the design of the sample columns, each apparatus
utilizes slightly different jacketing materials that have
slightly different stiffnesses. While these aspects have
a measurable influence on the deformation character
of the samples, the difference in the results obtained
from each testing vessel is minor.
Throughout each experiment we monitored confin-
ing pressure (PC), pore-fluid pressure (PP), the axial
loading force applied to the sample, axial shortening of
the sample column, and the volume of the pore-fluid
system. For experiments using the MVSR apparatus,
we also monitored temperature and the number of
Initial
porosity (%)
Max. PC
(MPa)
PP
(MPa)
Axial strain
rate (s� 1)
32.6 262.5 12.5 –
31.1 42.5 12.5 –
31.7 87.5 12.5 –
31.5 137.5 12.5 –
34.0 200 12.5 –
34.6 117.5 12.5 –
31.3 117.5 12.5 –
32.1 75 12.5 1.5� 10� 5
31.8 75 12.5 1.5� 10� 5
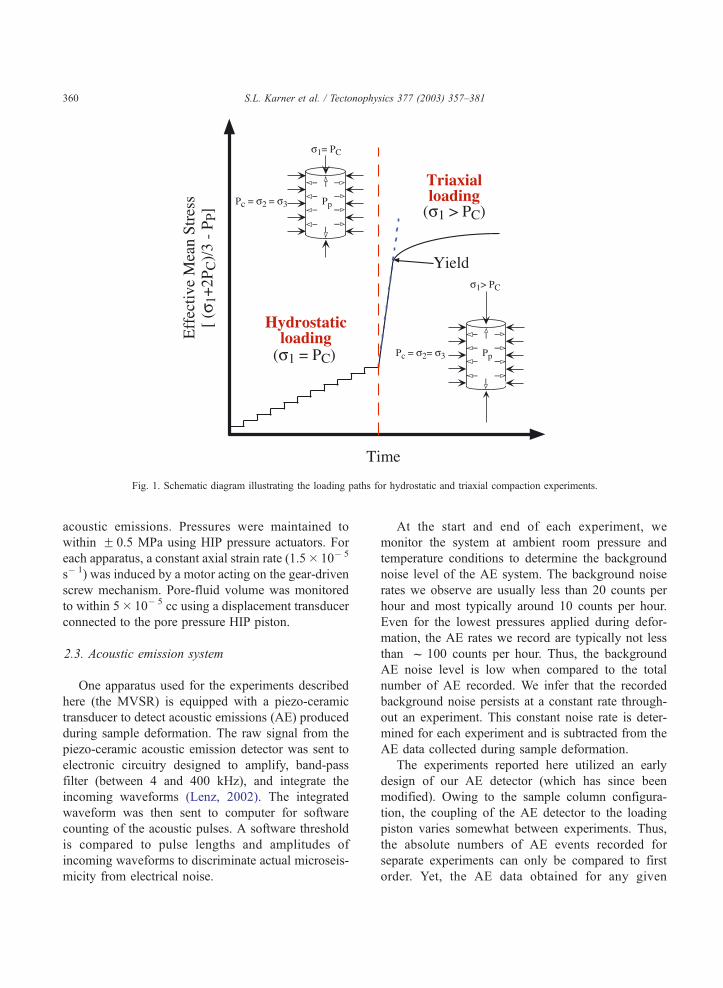
Fig. 1. Schematic diagram illustrating the loading paths for hydrostatic and triaxial compaction experiments.
S.L. Karner et al. / Tectonophysics 377 (2003) 357–381360
acoustic emissions. Pressures were maintained to
within F 0.5 MPa using HIP pressure actuators. For
each apparatus, a constant axial strain rate (1.5� 10� 5
s� 1) was induced by a motor acting on the gear-driven
screw mechanism. Pore-fluid volume was monitored
to within 5� 10� 5 cc using a displacement transducer
connected to the pore pressure HIP piston.
2.3. Acoustic emission system
One apparatus used for the experiments described
here (the MVSR) is equipped with a piezo-ceramic
transducer to detect acoustic emissions (AE) produced
during sample deformation. The raw signal from the
piezo-ceramic acoustic emission detector was sent to
electronic circuitry designed to amplify, band-pass
filter (between 4 and 400 kHz), and integrate the
incoming waveforms (Lenz, 2002). The integrated
waveform was then sent to computer for software
counting of the acoustic pulses. A software threshold
is compared to pulse lengths and amplitudes of
incoming waveforms to discriminate actual microseis-
micity from electrical noise.
At the start and end of each experiment, we
monitor the system at ambient room pressure and
temperature conditions to determine the background
noise level of the AE system. The background noise
rates we observe are usually less than 20 counts per
hour and most typically around 10 counts per hour.
Even for the lowest pressures applied during defor-
mation, the AE rates we record are typically not less
than f 100 counts per hour. Thus, the background
AE noise level is low when compared to the total
number of AE recorded. We infer that the recorded
background noise persists at a constant rate through-
out an experiment. This constant noise rate is deter-
mined for each experiment and is subtracted from the
AE data collected during sample deformation.
The experiments reported here utilized an early
design of our AE detector (which has since been
modified). Owing to the sample column configura-
tion, the coupling of the AE detector to the loading
piston varies somewhat between experiments. Thus,
the absolute numbers of AE events recorded for
separate experiments can only be compared to first
order. Yet, the AE data obtained for any given

S.L. Karner et al. / Tectonophysics 377 (2003) 357–381 361
experiment are internally consistent and meaningful
because the detector coupling does not vary during a
test.
2.4. Experiment procedure
For purposes of reproducibility, we employed an
identical start-up pressurization sequence for all
experiments. Confining pressure was initially raised
to 0.4 MPa while the pore-fluid system was drained
and maintained at atmospheric pressure. In this way,
pressure leaks across the sample jacketing could be
readily identified. Subsequent pressurization occurred
with the pore-fluid system closed and stepping both
the confining and pore-fluid pressures by 0.4 MPa
every 90 s. In this way, a constant effective pressure
(PE) was maintained until the initial experiment pres-
sures were achieved (PC = 15.0 MPa, PP= 12.5 MPa).
For better comparison between experiments, we
select these starting conditions to be our zero refer-
ence for measurements of pore-fluid volume change
that occur during sample deformation. Throughout
each experiment, pore-fluid pressure was kept at the
starting level of 12.5 MPa and we monitored the
change in fluid volume needed to maintain constant
pressure. We calculate volumetric strain by normal-
izing the measured change in fluid volume by the
calculated bulk volume of the sample at the start of
the experiment. We then consider this volumetric
strain to be a proxy for the change in sample
porosity.
Two modes of imposing stress were employed
for our experiments (as shown in Fig. 1). All
samples were subjected to an initial stage of hy-
drostatic stressing in the absence of an extra axial
load (i.e. r1 =PC). For some experiments, after a
target effective pressure was achieved samples were
subjected to triaxial (or non-hydrostatic) stressing
through the application of an extra axial load. We
have performed four different types of experiments
to investigate how strain can be accommodated
during deformation of granular quartz sand:
1. hydrostatic constant stress rate tests for which
effective pressure was monotonically increased to
a target maximum level (e.g. Figs. 1–4), achieved
by stepping confining pressure at a constant rate
and maintaining pore pressure constant;
2. hydrostatic stress cycling tests for which effective
pressure was increased as above, but was periodi-
cally decreased to the starting conditions (e.g. Fig.
5). For successive reloading cycles, effective
pressure reached increasingly greater levels than
that to which the sample had previously been
subjected;
3. a triaxial deformation test for which effective
pressure was first monotonically increased to a
target value of 62.5 MPa. Then the sample was
shortened by axial loading at a constant strain rate
(e.g. Figs. 1 and 6);
4. a triaxial stress cycling test for which effective
pressure was first monotonically increased to a
target value of 62.5 MPa. Then, repeated cycles of
axial straining were imposed to subject the sample
to greater levels of stress and, hence, deformation
(e.g. Fig. 7).
To determine experiment reproducibility and to
explore the generality of our observations, we per-
formed tests on two size fractions of St. Peter quartz
sand (124–180 and 250–350 Am). The salient details
about these experiments are listed in Table 1.
2.5. Terminology used
We adopt the nomenclature commonly used by the
Rock Mechanics community, rather than that reported
in the Engineering and Material Science literature. For
example, compressive stresses and compactive volu-
metric strains are taken to be positive (see Fig. 1). As
our sand samples were deformed in the presence of
pore fluid, we use the difference between the applied
confining and pore pressures to define an effective
pressure (PE =PC�PP; also referred to as ‘differen-
tial pressure’ in soil mechanics).
For samples subjected to an extra loading force
along the cylindrical axis (e.g. Fig. 1), we take the
difference between the applied axial stress and con-
fining pressure as differential stress (Dr=[r1�PC],
also known as the ‘deviator stress’ in engineering).
When the applied axial stress, confining pressure and
pore-fluid pressure are taken collectively they define
an effective mean stress (reff =[r1 + 2PC]/3�PP). It
can be seen from these combined relationships that
when differential stress is zero then effective mean
stress is equal to the hydrostatic effective pressure.
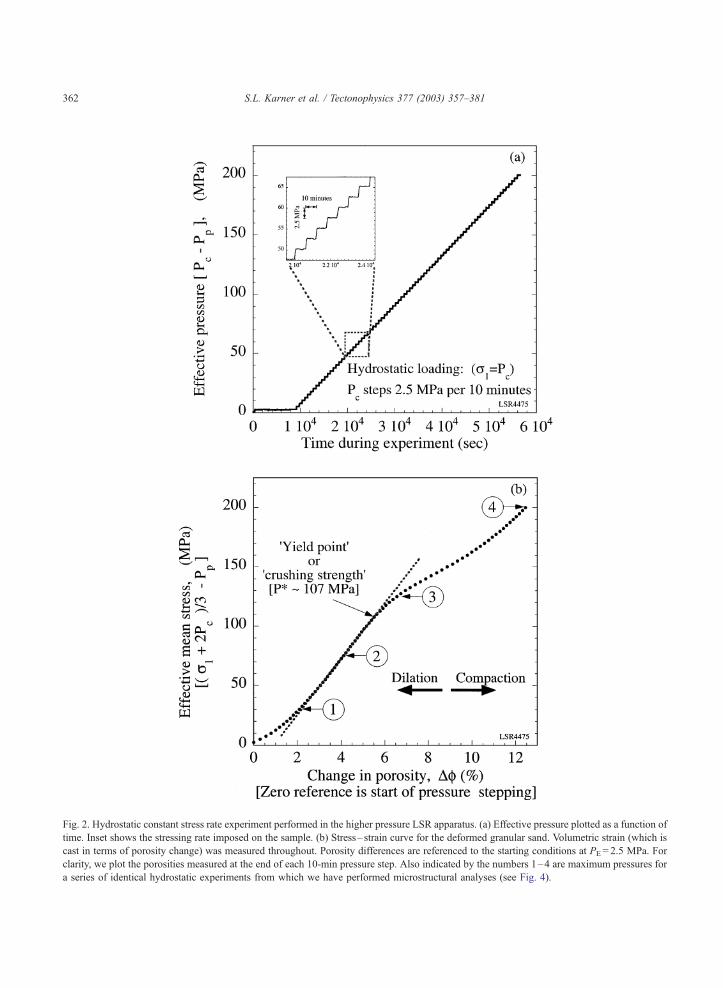
Fig. 2. Hydrostatic constant stress rate experiment performed in the higher pressure LSR apparatus. (a) Effective pressure plotted as a function of
time. Inset shows the stressing rate imposed on the sample. (b) Stress– strain curve for the deformed granular sand. Volumetric strain (which is
cast in terms of porosity change) was measured throughout. Porosity differences are referenced to the starting conditions at PE = 2.5 MPa. For
clarity, we plot the porosities measured at the end of each 10-min pressure step. Also indicated by the numbers 1–4 are maximum pressures for
a series of identical hydrostatic experiments from which we have performed microstructural analyses (see Fig. 4).
S.L. Karner et al. / Tectonophysics 377 (2003) 357–381362

S.L. Karner et al. / Tectonophysics 377 (2003) 357–381 363
Thus, by casting the applied load in terms of effective
mean stress (reff), results from experiments involving
either hydrostatic or triaxial loading modes can be
compared directly.
Fig. 3. Data from a hydrostatic constant stress rate experiment performed to
data reflect the sample response to individual increments of effective pr
granular sand. (b) Acoustic emission data for the same MVSR stress–strain
count recorded during sample deformation, while the inset figure shows t
3. Results
The results from our experiments are presented in
Figs. 2–7. For each case, samples exhibit behaviour
PE = 125 MPa in the lower-pressure MVSR apparatus. Steps in the
essure. (a) Stress– strain curve recorded during deformation of the
experiment shown in (a). The main plot displays the cumulative AE
he AE rate determined for this test.
S.L. Karner et al. / Tectonophysics 377 (2003) 357–381364
similar to elasto-plastic deformation with macroscopic
yielding above a critical mean stress. Yet as we will
demonstrate, the style of deformation for cohesion-
less, granular sand is not so straightforward. This is
because deformation occurs through a variety of
elastic and inelastic mechanisms that operate simulta-
neously for the conditions that we studied.
3.1. Constant stress rate tests
Results from hydrostatic experiments show that
loose, granular sands compact as effective pressure
is increased. However, compaction rates display con-
siderable variation as a function of the applied stress,
with a characteristic sigmoidal relationship between
stress and volumetric strain (recast as porosity in Fig.
2). At low effective pressures (less than 20 MPa for
the experiment data shown in Fig. 2b), significant
compaction occurs with a gradual transition to lower
compaction rates as effective pressure increases. For
intermediate effective pressures (between 40 and 100
MPa in Fig. 2b), the stress–porosity curve becomes
quasi-linear giving the appearance of an elastic re-
sponse to loading. At even greater loads, a second
stage of increased compaction rate occurs that closely
resembles compactive failure of granular media (e.g.
Zhang et al., 1990a,b) marking the onset of pervasive
inelastic grain failure at a critical effective pressure
(denoted by P*). For the grain size range that we
tested (250–350 Am), P* was observed to be f 107
MPa.
Inelastic strain prior to P* is revealed by acoustic
emissions that occur during sample deformation (Fig.
3). We monitored volumetric strain and acoustic
emissions for the hydrostatic deformation of sample
MVSR030 to an effective pressure of 125 MPa (Fig.
3a), slightly greater than the crushing strength deter-
mined from sample LSR4475 (P*f 107 MPa in Fig.
2b). The cumulative number of acoustic emissions is
significant, and AE rates increase in a nonlinear
manner as the applied pressure is increased (Fig.
3b). At low stresses where strains are large, the
cumulative number of AE is small and the AE rate
is low. The number of AE increases with effective
pressure and the AE rates accelerate significantly for
pressures above f 60 MPa, revealing that consider-
able inelastic deformation occurs well before the
conventional macroscopic yield stress is reached, as
denoted by P* (Figs. 2 and 3). This is consistent with
results from hydrostatic compaction experiments on
sandstones that show increased AE rates near P* and
maximum AE rates in the post-failure region of the
loading curve (Zhang et al., 1990b).
Post-experiment observations of our samples show
that significant grain size reduction occurs at pres-
sures above P*, consistent with previous work on
sandstone (e.g. Zhang et al., 1990a). However, we
observe considerably less fragmentation and grain
size reduction at pressures below P*. In Fig. 4, we
show transmitted light micrographs from samples that
were deformed to different levels of effective pressure
(as shown by the numbers 1–4 in Fig. 2b). For
comparison, we show an image of the pre-experiment
starting material (Fig. 4a). The sample deformed to
low pressure (PE = 30 MPa; Fig. 4b) shows that while
a small number of new intragranular fractures have
formed there are few indications of significant trans-
granular fractures or grain fragmentation. At slightly
higher pressure but less than P* (PE = 75 MPa; Fig.
4c), we observe a significant increase in fracture
density with the presence of some transgranular
fractures and grain fragmentation. At a pressure
slightly above P* (PE = 125 MPa; Fig. 4d), the
samples show clear evidence of widespread fractur-
ing, fragmentation and grain size reduction. At the
highest pressure we tested (PE = 200 MPa; Fig. 4e),
the sample displays extreme amounts of fragmenta-
tion with far fewer intact grains having survived the
experiment. Thus, the progression of images (Fig.
4a–e) qualitatively shows a nonlinear increase in
fracture density and fragmentation in a manner con-
sistent with the accelerating AE rates shown in Fig. 3.
This compares well to quantitative microstructural
analyses from creep compaction experiments on St.
Peter quartz sand performed at similar pressures to the
deformed samples shown in Fig. 4 (Chester et al., in
press).
3.2. Hydrostatic stress cycling tests
The departure from simple elastic behaviour at sub-
critical pressures is revealed further by hydrostatic
stress cycling experiments (Fig. 5). Samples of St.
Peter sand were loaded to a target effective pressure at
the same stressing rate as before (i.e. 2.5 MPa every
10 min), followed by intervals of unloading for which

Fig. 4. Transmitted light photomicrographs of St. Peter quartz sand immersed in mineral oil. The images show an increase in fracture density and
fragmentation as a function of effective pressure. Samples were obtained from constant stress rate hydrostatic experiments with the maximum
effective pressures as shown in Fig. 2b. Images were obtained using the same magnification; the scale bar shown in (a) is 0.5 mm and applies to
all photomicrographs. (a) Starting material; (b) maximum PE = 30 MPa; (c) maximum PE = 75 MPa; (d) maximum PE = 125 MPa; (e) maximum
PE = 200 MPa.
S.L. Karner et al. / Tectonophysics 377 (2003) 357–381 365
confining pressure was reduced to the starting level of
15 MPa (effective pressure of 2.5 MPa). Samples
were reloaded to a new pressure that exceeded the
level of the previous loading cycle (Fig. 5a), then
subsequently unloaded. These stress cycles were re-
peated multiple times to ever increasing levels of
applied pressure. To remain consistent with studies
from soil mechanics, we denote the peak stress level
of the prior loading cycle as ‘‘previous maximum
mean stress’’ (or PMMS).
At low-effective pressures, the initial volumetric
strain rates for each reload curve are large and the
rates subsequently decrease at higher pressures. Thus,
each loading curve exhibits concave upwards charac-

Fig. 5. Results from a hydrostatic stress cycling experiment. (a) Stress– strain measurements at the end of each 10-min interval are shown for the
stress cycling experiment. Separate loading cycles are marked by increasing levels of effective pressure and the successive offsets in volumetric
strain. For comparison, these are superimposed on the data from the constant stress rate test (from Fig. 2b). (b) The cumulative AE count is
shown for each loading cycle in (a). AE count has been zeroed at the start of each stress cycle. Inset figure shows the total cumulative AE
recorded for the experiment.
S.L. Karner et al. / Tectonophysics 377 (2003) 357–381366
ter at low pressures which gradually becomes quasi-
linear as effective pressure increases. In this way, the
general character of reloading curves mirrors the
behaviour observed from the constant stress rate
experiments. However, permanent strain increases
with each successive loading cycle and the reloading

S.L. Karner et al. / Tectonophysics 377 (2003) 357–381 367
curves fall below an upper bound defined by the
hydrostatic constant loading rate curve (replotted from
Fig. 2b).
The reloading curves can also be distinguished
from the constant loading rate curve by several
additional differences. First, the amount of volumetric
strain during the low-pressure portions of each reload-
ing cycle is less than that observed from the hydrostat
curve. Second, for stresses below the PMMS the
reloading curves display a quasi-linear section with
a steeper slope than the comparable portion of the
hydrostat curve. Third, when effective pressure nears
(or exceeds) the PMMS the reloading curve slopes
decrease slightly and more closely resembles the
hydrostat data (taking the form of a secondary yield).
These systematic observations reveal that significant
inelastic strain processes operate at sub-critical pres-
sures (i.e. below P*).
Cumulative acoustic emissions recorded during
each sequential loading (Fig. 5b) exhibit similar
character to AE from a constant loading rate exper-
iment (Fig. 3b). For easier comparison between
successive load cycles, we reset the AE count to zero
at the start of each reload cycle. AE activity is
minimal at low-effective pressures, and AE rates
increase with effective pressure in a nonlinear man-
ner. The total AE count that occurs during unloading
is small (typically only tens of events) and these are
clustered near the high-pressure region at the start of
each unload. Upon reloading, AE rates are initially
very low and only increase when the imposed effec-
tive pressure approaches the level achieved in the
previous stress cycle (PMMS). For each reload, AE
rates are significantly large when the applied pressure
exceeds the PMMS.
The systematic observations of volumetric strain
and AE activity indicate that non-recoverable strain
mechanisms operate at all stress conditions studied. If
the large AE rates at elevated pressure correspond
with the post-experiment observations of particle size
reduction, then the measured AE may represent mi-
croseismicity from grain cracking and breakage. Yet,
we recognize that AE may also be generated via
frictional slip at grain contacts. In either case, large
AE rates would correspond to increased volumetric
strains when loading stresses exceed the PMMS (or
even P*). However, the low numbers of AE at low
stresses suggests a different strain mechanism than
that which occurs at higher stress (i.e. grain breakage).
This indicates that several deformation modes operate
during hydrostatic stressing of granular media. Yet, it
raises the question of how strain will be accommo-
dated when samples are subjected to more complicat-
ed stress states—such as during non-hydrostatic (or
triaxial) deformation.
3.3. Non-hydrostatic (triaxial) deformation tests
We investigated non-hydrostatic compaction of St.
Peter quartz sand by performing a triaxial deformation
experiment at an effective pressure well within the
quasi-linear portion of the hydrostatic loading curve.
During the first stage of the experiment, the sample
was hydrostatically loaded at a rate of 2.5 MPa per 10
min to a target effective pressure of 62.5 MPa (Fig.
6a). In the second stage of deformation, the sample
was axially loaded at a strain rate of 1.5� 10� 5 s� 1.
The hydrostatic portion of the loading curve (Fig.
6) is consistent with our results shown in Figs. 2–5 in
terms of the deformation character and amount of
sample compaction. From an initial effective pressure
of 62.5 MPa, samples are further compacted under
triaxial loading. The stress–strain curve resembles the
characteristic behaviour of a material that yields in
compression (e.g. Brace, 1978; Zhang et al., 1990a;
Brzesowsky, 1995; see Fig. 1). That is, the initially
quasi-linear loading curve is followed by yielding for
which large strains are induced by small increments in
triaxial stress (plotted in terms of effective mean
stress in Fig. 6). The hydrostatic portion of the
experiment data shown in Fig. 6b records a similar
number of acoustic emissions to our hydrostatic
results that we described previously. Furthermore,
the nonlinear increase in AE activity with increasing
hydrostatic stress is also consistent with our previous
observations.
Despite the similar mean stresses imposed, how-
ever, there are striking differences between hydrostat-
ic and triaxial deformation that are accentuated by the
measured AE (Fig. 6). Triaxial deformation is associ-
ated with lower ultimate strengths and greater volu-
metric strains than observed from hydrostatic
deformation tests. Furthermore, the AE rates moni-
tored during triaxial deformation are significantly
greater than the rates obtained from hydrostatic stress-
ing tests. AE rates increase as triaxial loading pro-
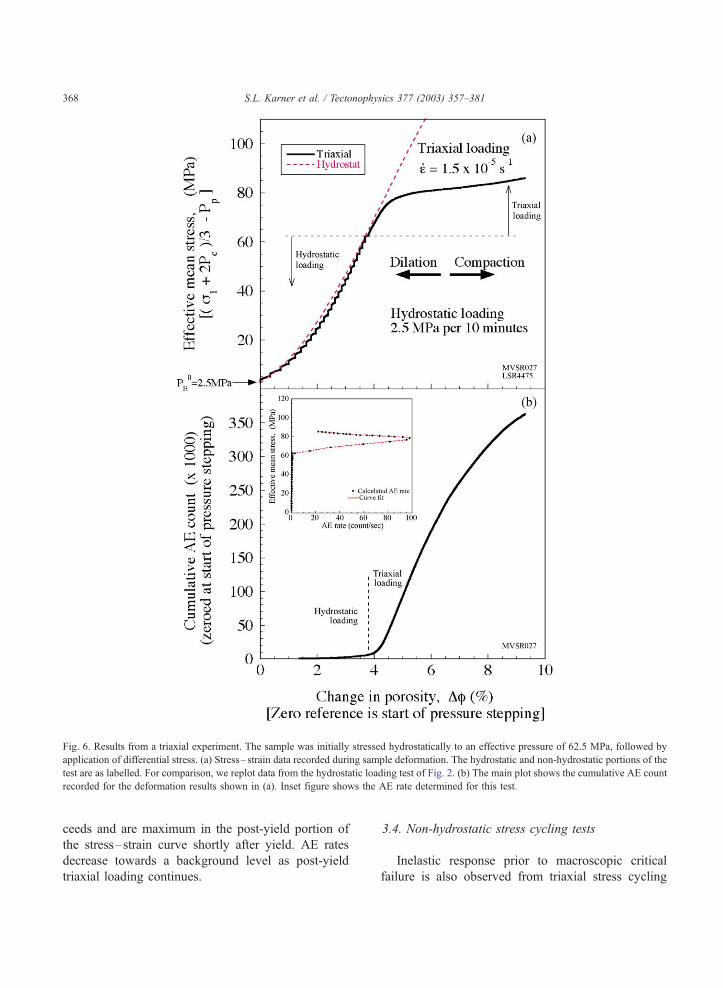
Fig. 6. Results from a triaxial experiment. The sample was initially stressed hydrostatically to an effective pressure of 62.5 MPa, followed by
application of differential stress. (a) Stress– strain data recorded during sample deformation. The hydrostatic and non-hydrostatic portions of the
test are as labelled. For comparison, we replot data from the hydrostatic loading test of Fig. 2. (b) The main plot shows the cumulative AE count
recorded for the deformation results shown in (a). Inset figure shows the AE rate determined for this test.
S.L. Karner et al. / Tectonophysics 377 (2003) 357–381368
ceeds and are maximum in the post-yield portion of
the stress–strain curve shortly after yield. AE rates
decrease towards a background level as post-yield
triaxial loading continues.
3.4. Non-hydrostatic stress cycling tests
Inelastic response prior to macroscopic critical
failure is also observed from triaxial stress cycling

S.L. Karner et al. / Tectonophysics 377 (2003) 357–381 369
experiments (Fig. 7). We deformed St. Peter sand
under the same triaxial conditions as the experi-
ment shown in Fig. 6, except that during the non-
Fig. 7. Results from a triaxial stress cycling experiment. The sample was st
loading the differential stress was periodically reduced to zero. (a) Stress– s
expanded view of the first nine loading cycles. (b) Cumulative AE count re
the hydrostatic and non-hydrostatic portions, as well as at the start of eac
experiment.
hydrostatic portion we periodically imposed triaxial
stress cycling. After axial stress was increased to a
prescribed level, the sample was unloaded to the
ressed in a manner similar to the test in Fig. 6, except that for triaxial
train data obtained during sample compaction. Inset figure shows an
corded for the test shown in (a). AE data were zeroed at the start of
h stress cycle. Inset figure shows the total cumulative AE for this

S.L. Karner et al. / Tectonophysics 377 (2003) 357–381370
maximum hydrostatic stress level (62.5 MPa) by
reversing the direction of the axial loading piston.
In a manner similar to our hydrostatic stress
cycling experiments, data from our triaxial stress
cycles indicate that the deformation response is not
purely elastic (Fig. 7). With successive stress cycles,
volumetric strains increase with significant offsets
from the previous loading cycles. These offsets are
measured for the first few loading cycles in the
sequence, indicating that permanent strains are appar-
ent even for the lowest axial stress imposed. More-
over, a comparison of loading curves reveals that
greater volumetric strains result from triaxial stress
increments than from hydrostatic stressing. For exam-
ple, the first three triaxial load cycles indicate a
permanent porosity loss of f 0.02% per MPa of
applied mean stress, compared to permanent volumet-
ric strains of f 0.007% per MPa during hydrostatic
stressing.
This is further accentuated by AE events which
become more numerous and correspond to larger
increments in volumetric strain with successive load-
ing cycles (Fig. 7b). These observations agree with
results from triaxial experiments that show a qualita-
tive correlation between macroscopic yield and max-
imum AE rates for sandstones (e.g. Zhang et al.,
1990a) and soils (Lord et al., 1977). Yet, there are
differences between the AE recorded from hydrostatic
experiments and those data from triaxial stress cycling
tests. First, the AE from triaxial stress cycles are
generally more numerous and occur at higher rates
than for hydrostatic loading (compare Figs. 5b and 7b,
each having f 6,000 AE events for hydrostatic
loading to 62.5 MPa). Second, the AE from triaxial
stress cycles show sharper transitions to faster rates
than observed from the hydrostatic test. Thus, inelas-
tic mechanisms are seemingly more sensitive to tri-
axial stresses than to hydrostatic loading conditions.
4. Discussion
The mechanical response we have measured for St.
Peter sand is qualitatively similar to previous work on
other granular media and analog materials (e.g. Borg
et al., 1960; Gallagher et al., 1974; Zoback and
Byerlee, 1976; Brzesowsky, 1995; Dewers and
Hajash, 1995; Olgaard et al., 2001; Chuhan et al.,
2002), on loose soils (e.g. Schofield and Wroth, 1968;
Britto and Gunn, 1987; Bridgwater, 1994), and on
cohesive, cemented granular rocks such as sandstone
(e.g. Zhang et al., 1990a,b; David et al., 1994; Wong
et al., 1997; Baud et al., 2000). Taken collectively,
these data highlight the complexities of deformation
within granular materials. While soil mechanics stud-
ies provide an extensive dataset for granular deforma-
tion, they are typically performed at lower pressures
than their counterparts from rock mechanics. This is
important because it is frequently assumed in soil
mechanics research that grains are unbreakable and
that deformation is accommodated by granular rolling,
grain-contact frictional slip, or elastic distortion of the
stressed grains (Gudehus, 2000; Walker, 2000). This
assumption forms the foundation for elasto-plastic and
hypoplastic constitutive models used to describe soil
deformation (e.g. Herle et al., 2000; Marcher et al.,
2000). As our samples were subjected to stresses near
or above the fracture strength of individual grains,
constitutive models for soils cannot account for all the
grain-scale processes that occur during our experi-
ments (as noted by Brzesowsky, 1995).
4.1. Comparison to results from soil mechanics
Deformation studies of soils have often noted a
nonlinear response to loading (e.g. Terzaghi, 1925;
Biot, 1941, 1973; Britto and Gunn, 1987; Bridgwater,
1994). Loading curves from these studies are fre-
quently presented in terms of the logarithm of stress
(e.g. Graham and Hovan, 1986; Ramsamooj and
Alwash, 1990; Smith et al., 1992). This serves to
minimise the nonlinear character of the loading curves
for the range of stresses considered in soil mechanics
(typically of the order of 10s of kPa up to f 10 MPa).
This loading behaviour corresponds favourably to the
nonlinear character observed from the deformation of
St. Peter sand at low stresses (see Figs. 2–7). While
elastic models predict stress-dependent curvature at
low stresses (e.g. Hertz, 1881; Mindlin and Deresie-
wicz, 1953), the nonlinearity observed during soil
deformation is often attributed to inelastic consolida-
tion processes.
Stress cycling tests that deform soils at low stresses
(< 1 MPa) exhibit non-recoverable (or permanent)
strains that are consistent with post-yield behaviour
(Smith et al., 1992). In those tests, increased loading

S.L. Karner et al. / Tectonophysics 377 (2003) 357–381 371
delineates a line of ‘normal’ consolidation which cor-
relates to the low-pressure hydrostatic loading of our
experiments (e.g. Figs. 2–5). The unloading during
stress cycles exhibit steeper stress–strain curves than
that of ‘normal’ consolidation, to the extent that strain
is not fully recovered upon complete removal of stress
(similar to Fig. 5). The reloading path exhibits this
steep character until the applied stress exceeds the
previously applied pressure, much as observed in our
experiments once PMMS is reached. At this point, the
loading path shallows and resumes the trend of the
‘‘normal’’ consolidation line. This takes the appearance
of yielding of the material. Similar results have been
reported for stress cycling tests performed on oceanic
sediments (Olgaard et al., 1995, 2001).
Yielding in soils is typically described as the
transition from elastic to plastic behaviour (Britto
and Gunn, 1987; Smith et al., 1992). For our experi-
ments, this might be considered to occur near the
point marking the onset of pervasive grain crushing
and cataclastic flow, P* (e.g. Zhang et al., 1990a). Yet,
our stress cycling experiments indicate that permanent
strains occur at much lower stresses than P*. Similar
studies from soil mechanics have identified a more
elaborate and complex scheme to describe yield
surfaces (Smith et al., 1992). This scheme involves
four stages of deformation that are loosely consistent
with concepts in rock mechanics. In the first stage,
soils exhibit linear elastic behaviour with completely
reversible strain up to a ‘yield’ stress level analogous
to an elastic limit. In the second stage, strains are still
recoverable but the loading path becomes nonlinear
providing an apparent decrease in material stiffness.
The third stage is marked by the onset of non-
recoverable strain, a feature considered to define
material yield. Permanent strains increase in magni-
tude during this stage as the applied stresses become
greater. This third stage is limited by the failure
envelope for the soil which, in turn, corresponds to
an abrupt and significant change in volumetric strain
rates. The fourth, and final, stage is marked by
deformation in what can be considered as a ‘post-
failure’ region. However, it must be recognized that
each of these stages is restricted by limits that each, in
their own way, conveys a different concept of yield-
ing. We shall adopt the classic definition of yield,
which is marked by the onset of permanent strain (i.e.
the point between stage 2 and 3 deformation).
For unconsolidated soils, the onset of permanent
strain during third-stage deformation typically occurs
at stresses lower than the initial conditions of our
experiments. This, coupled with observations from
our stress cycling experiments (e.g. Figs. 5 and 7),
implies that the behaviour exhibited by our samples is
not achieved solely by elastic deformation. Thus, from
a soil mechanics perspective our samples always
exhibit yield over the range of stresses that we report
here.
4.2. Comparison to deformation experiments on
sandstone
The loose, granular quartz sand of our experiment
samples did not have the cohesion brought about by
natural processes such as consolidation, inter-granular
cementation, and mineral diagenesis. Yet, the form of
our stress–strain curves is very similar to the charac-
ter observed for deformation of naturally lithified
quartz sandstones (e.g. Zhang et al., 1990a,b; David
et al., 1994; Wong et al., 1997; Baud et al., 2000).
Zhang et al. (1990a,b) characterized a variety of
sandstones in terms of mean grain size (d) and average
porosity (/) and showed that these microstructural
parameters can be related to the critical compaction
that occurs at P*. Superimposed on their loading data
for sandstones we show our results from hydrostatic
deformation of loose, quartz sand (Fig. 8). The mean
grain size and starting porosity for our experiments
are within the range studied by Zhang et al. (1990a).
The loading curves for both loose sand and lithified
sandstone exhibit relatively large strain rates when
pressure is initially applied, followed by a transition to
steeper, quasi-linear loading behaviour prior to the
second interval of large strain rates associated with
P*. From their results for sandstones, Zhang et al.
(1990a,b) note that this second transition corresponds
to significant micro-cracking at grain contacts, which
is supported by increased acoustic emission rates that
are maximum in the post-yield portion of the loading
curve (Zhang et al., 1990b; David et al., 1994). From
this, it is concluded that P* marks the onset of
pervasive grain fracturing leading to significant sam-
ple compaction (Wong et al., 1997). Our observations
for this transition in loose sands are similar to those
for sandstone (Fig. 2) and are supported by micro-
structural observations of our samples (Fig. 4). Yet, it

Fig. 8. Comparison of our hydrostatic experiments for St. Peter sand to results for sandstones. We compare our constant stress rate results (from
Figs. 2b and 3a) and the final loading path from our hydrostatic stress cycling experiment (from Fig. 5a) with sandstone data from Zhang et al.
(1990a). It is important to note that our samples were deformed at a constant stress rate, whereas the sandstones were deformed at variable
stressing rates.
S.L. Karner et al. / Tectonophysics 377 (2003) 357–381372
is clear from the comparison in Fig. 8 that there are
significant differences.
The crushing strength (P*) of St. Peter sand is
generally lower than P* observed for consolidated
sandstones of similar grain size and porosity, partic-
ularly when compared to Berea, Kayenta, and St.
Peter sandstones (Zhang et al., 1990a). The crushing
strength for St. Peter quartz sand (grain size 250–350
Am; P*f 107 MPa in Fig. 2) is of the same order as
that reported for deformation of loose Ottawa quartz
sand having slightly larger grain diameter and broader
size distribution (P*f 65 MPa from Zoback and
Byerlee, 1976). When compared to the sandstones,
however, we note that Boise sandstone exhibits a
lower crushing strength than for our sand samples.
Boise sandstone has porosity similar to our starting
material, yet it has a much larger mean grain size (560
and 920 Am for two samples measured by Wong et al.,
1997). This is consistent with previous work showing
that P* decreases for samples consisting of larger
grains and having greater porosity (Zhang et al.,
1990a; Wong et al., 1997) and a companion study in
which we have investigated grain size effects (Karner
et al., 2001, submitted for publication). In addition to
grain size and porosity, though, the character of grain
contacts in sandstones will differ from loose sands due
to processes such as cementation and grain suturing.
Furthermore, other parameters (e.g. grain angularity,
compositional heterogeneities) may alter the macro-
scopic strength behaviour of granular sands. As yet, it
remains to be seen exactly what influence these
factors would have on P*.
The sand and sandstone results presented in Fig.
8 also show variations in the slope of the stress–strain
curves. These slopes provide a measure of effective
material stiffness, or bulk compressibility (Zimmer-
man, 1991). At stresses below P*, the effective
stiffness of quartz sand (replotted from Figs. 2 and

S.L. Karner et al. / Tectonophysics 377 (2003) 357–381 373
3) is significantly lower than those of the sandstones.
Yet, this discrepancy is reduced if we compare the
effective stiffness for stress cycle #8 to the sandstone
data. The sand data from the stress cycle coincide well
with the sub-critical loading curve for Boise sand-
stone. If sandstones are considered to be a consoli-
dated version of our loose sands, then the steep curve
for stress cycle #8 may reflect a high consolidation
state brought about by grain rearrangement during
earlier loading cycles.
For sub-critical stresses below P*, it has been
assumed that strains in sandstones are accommodated
by elastic deformation of grains (not through inelastic
mechanisms) because sandstones are comprised of a
cohesive framework of individual grains (Zhang et al.,
1990a; Wong et al., 1997; see Fig. 8). This assumption
is primarily based on the character of the loading
curve which shows a transition to quasi-linearity with
increased applied load. This implies that for purely
elastic sub-critical deformation of sandstones, inter-
granular cohesion is not altered as the applied stress is
increased. Yet, acoustic emission data from experi-
ments on sandstones show significant AE rates for
sub-critical pressures well below P* (Zhang et al.,
1990b; David et al., 1994; Wong et al., 1997). If this
microseismicity is associated with deformation at
grain contacts (e.g. breaking of intergranular cement)
then the sandstones might undergo a measurable
amount of permanent strain. Thus, it remains to be
verified whether sub-critical deformation of sand-
stones occurs purely through elastic mechanisms.
4.3. Recoverable versus permanent strain
Our experiments on cohesionless quartz sand show
that the relative contributions from elastic and perma-
nent deformation mechanisms are difficult to resolve
when samples are subjected to monotonically increas-
ing stresses. Stress cycle tests on soils (e.g. Terzaghi,
1925) and our sand samples (Figs. 5 and 7) show that
permanent strain accumulates at all stresses imposed
on the sample. On the basis of soil and rock mechan-
ics studies, we should expect deformation of cohe-
sionless granular media to occur via particle rolling,
frictional sliding, grain rotation, and grain fracture.
Such granular rearrangement mechanisms produce an
improved degree of consolidation (e.g. Hedberg,
1926; Athy, 1930; Graton and Franser, 1935; Max-
well, 1964), which increases sample stiffness and
lowers compressibility (e.g. Zimmerman, 1991).
To investigate the stress dependence of consolida-
tion, we analyse our experiments in terms of a
compressibility that can be calculated directly from
our measurements (Fig. 9). Compressibility (C), the
reciprocal of stiffness, is a measure of the volumetric
strain resulting from an applied change in pressure.
For a porous media, there are four different compres-
sibilities that can be determined from two independent
volumes (pore space, VP; and total or bulk sample
volume, Vb), the applied pore pressure (PP) and
confining pressure (PC) (Zimmerman, 1991). For
our experiments, the measured change in fluid volume
that is needed to maintain pore pressure reflects the
evolution of pore volume (VP) brought about by
pressure-dependent sample compaction. This can be
used to determine pore compressibility, as described
by:
C ¼ �1
V iP
DVP
DPC
� �PP
ð1Þ
where VPi is the initial reference pore volume, the
subscript PP indicates that pore pressure is maintained
constant, and the negative sign accounts for sample
compaction (pore volume loss) with increasing con-
fining pressure.
In Fig. 9a, we show calculated pore compressibil-
ities for the stress cycling experiments (Fig. 5a). For
comparison, we plot the calculated values for each
loading curve together with the pore compressibility
determined from the hydrostatic constant stress rate
test (from Fig. 2). For each case, pore compressibil-
ities are greatest at very low-effective pressures. As
stress increases, pore compressibility decreases to a
minimum value at stresses just below the crushing
strength (P*). At P*, pore compressibility exhibits a
marked increase. While compressibilities for each
loading cycle display similar pressure-dependent char-
acter, distinct variations in the compressibility curves
are apparent.
First, stress cycle compressibilities are generally
lower than those calculated for the constant stress rate
test. To clarify this point, we have determined the
minimum compressibility for each load cycle as a
function of previous maximum pressure (PMMS) and
compare these to the calculated values for the constant

S.L. Karner et al. / Tectonophysics 377 (2003) 357–381374

S.L. Karner et al. / Tectonophysics 377 (2003) 357–381 375
stress rate test (Fig. 9b). This comparison indicates
that pressure-dependent compaction (or improved
consolidation) lowers the compressibility of granular
sand. Furthermore, experiments on two different grain
size fractions indicate that this observation is inde-
pendent of particle dimension. Second, at stresses
lower than the previous maximum effective pressure
(PMMS) the compressibility curves generally overlie
each other indicating good reproducibility for succes-
sive stress cycles (Fig. 9a). This implies that the
material has the stiffness (hence, consolidation state)
that was achieved during previous loadings. The third
feature is observed for effective pressures that exceed
the previous maximum pressure (PMMS). For these
portions of a given stress cycle, pore compressibility
increases slightly and approaches values of the hy-
drostatic constant stress rate test. This increase coin-
cides with the secondary yielding that occurs when
the reloading path meets the ‘normal’ consolidation
curve. In this stage of the loading path, the sample
exhibits a ‘new’ state of deformation in response to
the new maximum applied pressure.
The low compressibilities for the portion of stress
cycle reloads below the PMMS are associated with
low AE rates (Fig. 5). We interpret this to indicate that
the initial portion of stress cycle reloading reflects
predominantly elastic deformation. The secondary
yield and increased compressibility observed when
the applied stress nears the PMMS must then reflect
the onset of permanent strain. Thus, the ‘normal’
consolidation curve of our constant stress rate tests
displays the combined effects of deformation involv-
ing elastic and permanent strain mechanisms.
4.4. Mathematical description of elastic deformation
To better understand elastic deformation of granu-
lar sand at stresses below P*, we consider a Hertzian
description of deformation between two contacting
spherical bodies (Hertz, 1881; Timoshenko, 1934;
Love, 1944; Mindlin and Deresiewicz, 1953; Gangi,
Fig. 9. Calculated pore compressibilities for our experiments according to
constant stress rate and stress cycling tests (Figs. 2 and 5, respectively) ar
applied stress, data for the reload cycles show that samples are less compr
are interpreted to reflect greater consolidation of the granular aggregate. (
samples with different particle size fractions. For the stress cycling tests, w
function of the previous maximum mean stress (PMMS) that had been ap
during deformation of the granular media.
1978; Zhang et al., 1990a; Brzesowsky, 1995). This
description begins with the assumption that a deform-
ing granular aggregate is comprised of perfectly
elastic, uniformly sized spheres subjected to external
forces (Fig. 10). The spheres compress at their meet-
ing point and the area of contact grows as a function
of the applied force and material properties. From
contact mechanics theory, the amount of closure
between the sphere centres (a) and the radius of the
circular contact (a) will change according to the
following relations (after Gangi, 1978):
a ¼ 2R3pKF4R2
� �2=3ð2Þ
a ¼ 3pKFR4
� �1=3where K ¼ ð1� t2Þ
pEð3Þ
Here, R is the grain radius, F is the applied force, K is
the bulk modulus of the grain, t and E are the Poisson
ratio and Young’s modulus, respectively, of the grain.
By expanding on Hertzian contact theory, Gangi,
(1978) showed that pressure-dependent variations in
whole rock transport properties can be calculated
when granular compaction occurs through elastic
deformation at grain contacts. Of relevance to our
study are those relations used to determine porosity
evolution with applied hydrostatic pressure:
UðPÞ ¼ U0 1� C0ðP=PmÞ2=3h i3
1� U0 þ U0 1� C0ðP=PmÞ2=3h i3� ��
ð4Þ
Pm ¼ 4E=3pð1� m2Þ ð5Þ
where U is the porosity calculated for the applied
pressure (P) such that U0 =U(0), C0 is a ‘‘packing’’
Eq. (1), described in the text. (a) Compressibilities calculated for the
e plotted against the applied effective pressure. After decreasing the
essible than for the constant stress rate test. Lower compressibilities
b) Pore compressibilities calculated for hydrostatic experiments on
e show the minimum compressibility for a given loading curve as a
plied. These data show that the consolidation state is reproducible

closure, α
a) Spherical grain contact: cross-sectional view
Force (F) = 0Force (F) > 0
grain radius, R
b) Spherical grain contact: plan view
a point
a circle
a
Fig. 10. Schematic diagram showing elastic distortion of two spherical grains in contact.
S.L. Karner et al. / Tectonophysics 377 (2003) 357–381376
constant for the granular aggregate (of value c 2),
and Pm is the effective elastic modulus of the
grains.
Using Eqs. (4) and (5), we calculate the evolution
of porosity with applied hydrostatic pressure by
assuming a typical starting porosity for our samples
of f 32% and published material constants for a-
quartz (t = 0.099, E = 90.177 GPa; after Birch, 1966;
Sumino and Anderson, 1984). The predicted porosity
evolution for hydrostatic loading is considerably less
than our measurements of porosity reduction from
hydrostatic constant stress rate tests (Fig. 11). Fur-
thermore, the calculated porosity change is expected
to be reversible unlike the non-recoverable strains
observed from our stress cycling tests (Fig. 5).
However, the Hertzian contact model predictions
match closely the porosity data obtained from reload-
ing portions of the hydrostatic stress cycle tests.
When the numerical results are coupled with the
low acoustic emission rates observed at reload
stresses less than the PMMS, we may safely con-
clude that reload cycles represent the macroscopic
response of the granular aggregate to elastic distor-
tion at grain contacts.
4.5. Model for hydrostatic deformation
As we reasoned earlier, compaction within granular
quartz sand at sub-critical pressures is achieved via a
combination of Hertzian-style elastic deformation at
grain contacts and inelastic strain mechanisms. These
inelastic processes vary with effective mean stress and
may include particle rolling, frictional sliding, grain
rotation and rearrangement, and grain fracture. Based
on the stresses and microseismicity measured during
our deformation tests, we expect that grain fracture
depends on both the level of macroscopic stress and
the population density of particles in contact. On the
other hand, grain rearrangement would depend on the
directed macroscopic stresses that produce shear trac-
tions and torques at grain contacts. While both pro-
cesses operate for all stress states, grain rearrangement
may be favoured at low mean pressures while grain
fracture dominates at elevated stress conditions (either
hydrostatic or triaxial).
The theoretical constraints of Hertzian behaviour for
spherical grains are such that when pressure is below a
critical level particles deform elastically, while above
that stress particles yield by fracture or other modes of

Fig. 11. Comparison of hydrostatic deformation tests to numerical calculations of compaction due to elastic deformation at grain contacts based
on Hertzian contact theory. For the properties of our starting material, the elastic model predicts a stress– strain path that more closely matches
reloading during a stress cycle test. This, combined with the low compressibilities observed from stress cycle tests, suggests that deformation
during constant stress rate tests is accommodated through both elastic and inelastic strain mechanisms.
S.L. Karner et al. / Tectonophysics 377 (2003) 357–381 377
permanent deformation (Mindlin and Deresiewicz,
1953; Brzesowsky, 1995; Walker, 2000). Photoelastic
studies and discrete element computer simulations
indicate that the stresses applied to a granular aggregate
are transmitted via a complicated network of stress
bridges and force chains (e.g. Gallagher et al., 1974;
Drescher and de Josselin de Jong, 1972; Morgan and
Boettcher, 1999; Aharonov and Sparks, 1999). When
the applied stress is sufficiently high, the population of
grains at or near failure will be large. In turn, wholesale
collapse of the stress bridges will occur and lead to
macroscopically observed increases in volumetric
strain rate.
We propose a three-component model that has been
employed in studies of powder densification involving
particle rearrangement, elastic deformation of grains,
and grain failure (Reed, 1995; Walker, 2000; see Fig.
12). It is likely that these processes operate simulta-
neously during deformation of granular media, which
makes it difficult to separate their contributions during
the course of a laboratory experiment. However, these
processes can be considered separately in conceptual
models of granular deformation.
At low-effective pressures (e.g. < 20 MPa in Fig.
3a), samples exhibit considerable inelastic volumetric
strain but with comparatively little acoustic emission
activity. Furthermore, direct observation of materials
subjected to these pressures indicates only small
amounts of fracturing and granulation (Fig. 4b). This
indicates that the granular compaction that occurs
early in the loading path does not result from brittle
failure processes. Rather, it is likely that these large
strains are achieved by acoustically silent processes
such as granular rolling, particle rotation, and fric-
tional slip at grain contacts (see Fig. 12a). This
granular rearrangement acts to increase the popula-
tion of grains that are in contact with their neigh-
bours. As such, the granular aggregate achieves an
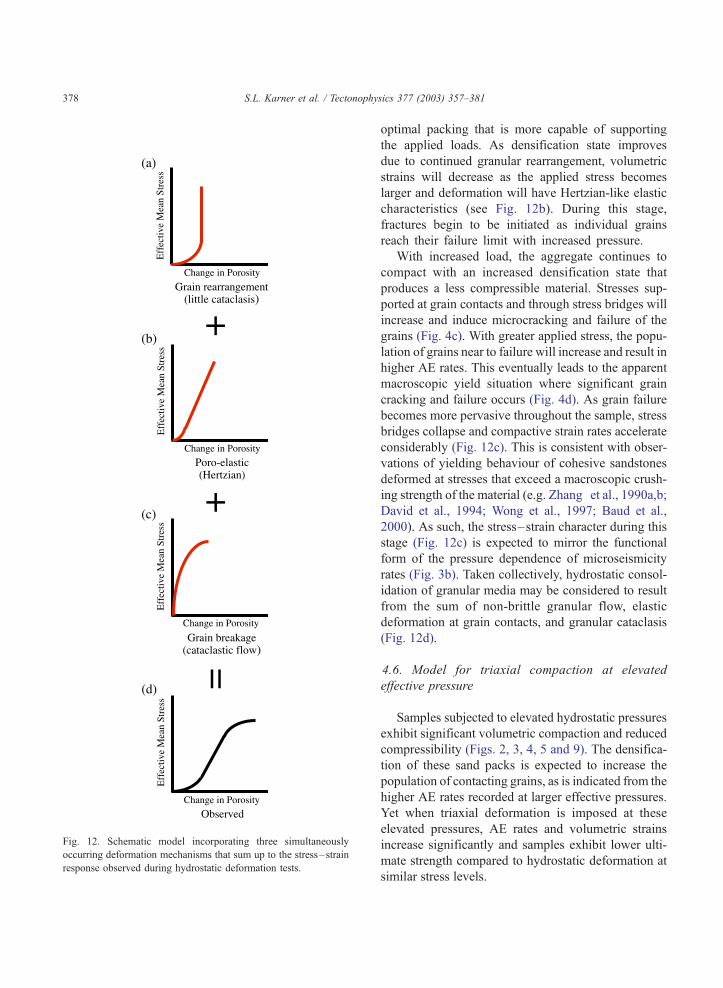
Fig. 12. Schematic model incorporating three simultaneously
occurring deformation mechanisms that sum up to the stress– strain
response observed during hydrostatic deformation tests.
S.L. Karner et al. / Tectonophysics 377 (2003) 357–381378
optimal packing that is more capable of supporting
the applied loads. As densification state improves
due to continued granular rearrangement, volumetric
strains will decrease as the applied stress becomes
larger and deformation will have Hertzian-like elastic
characteristics (see Fig. 12b). During this stage,
fractures begin to be initiated as individual grains
reach their failure limit with increased pressure.
With increased load, the aggregate continues to
compact with an increased densification state that
produces a less compressible material. Stresses sup-
ported at grain contacts and through stress bridges will
increase and induce microcracking and failure of the
grains (Fig. 4c). With greater applied stress, the popu-
lation of grains near to failure will increase and result in
higher AE rates. This eventually leads to the apparent
macroscopic yield situation where significant grain
cracking and failure occurs (Fig. 4d). As grain failure
becomes more pervasive throughout the sample, stress
bridges collapse and compactive strain rates accelerate
considerably (Fig. 12c). This is consistent with obser-
vations of yielding behaviour of cohesive sandstones
deformed at stresses that exceed a macroscopic crush-
ing strength of the material (e.g. Zhang et al., 1990a,b;
David et al., 1994; Wong et al., 1997; Baud et al.,
2000). As such, the stress–strain character during this
stage (Fig. 12c) is expected to mirror the functional
form of the pressure dependence of microseismicity
rates (Fig. 3b). Taken collectively, hydrostatic consol-
idation of granular media may be considered to result
from the sum of non-brittle granular flow, elastic
deformation at grain contacts, and granular cataclasis
(Fig. 12d).
4.6. Model for triaxial compaction at elevated
effective pressure
Samples subjected to elevated hydrostatic pressures
exhibit significant volumetric compaction and reduced
compressibility (Figs. 2, 3, 4, 5 and 9). The densifica-
tion of these sand packs is expected to increase the
population of contacting grains, as is indicated from the
higher AE rates recorded at larger effective pressures.
Yet when triaxial deformation is imposed at these
elevated pressures, AE rates and volumetric strains
increase significantly and samples exhibit lower ulti-
mate strength compared to hydrostatic deformation at
similar stress levels.

S.L. Karner et al. / Tectonophysics 377 (2003) 357–381 379
While both elastic and inelastic deformation pro-
cesses operate during triaxial deformation at elevated
effective pressure (e.g. Figs. 6 and 7), the increased AE
rates suggest that grain failure is a favoured mecha-
nism. Axial loading of samples would likely induce
distortional stresses at particle contacts and promote
grain failure. Furthermore, the population density of
grain contacts would increase and favour the genera-
tion of stress bridges that have an optimal alignment
relative to the imposed stress directions. For triaxial
deformation, the force chain network would be strong-
ly anisotropic. As individual particles reach their fail-
ure limit, the stress bridges would collapse and lead to
macroscopic yielding of the sample at lower levels than
for hydrostatic loading. With continued triaxial stress-
ing, the rate of generation and collapse of these stress
bridges would approach equilibrium. However, the
evolutionary rates of these stress bridges are expected
to be greater during triaxial deformation than for
hydrostatic stressing, which would lead to larger vol-
umetric strains.
5. Summary and implications
We have presented results from a suite of experi-
ments designed to investigate mechanical deforma-
tion of unconsolidated granular media at elevated
pressures. As the applied effective stress increases,
quartz sand densifies and becomes less compressible
with an associated increase in microcracking (as seen
from optical micrographs and measured by elevated
acoustic emission rates). Stress cycling experiments
indicate that quartz sand exhibits permanent strains
throughout the pressure range we studied. Large
strains are recorded for low stresses, with a gradual
transition to a quasi-linear stress-strain path at inter-
mediate stresses. For high pressures, samples show a
second transition to large strains associated with
significant AE activity. This corresponds to macro-
scopic yield-like behaviour consistent with previous
observations of a material crushing strength, P* (e.g.
Zhang et al., 1990a,b). Thus, inelastic strains are
measured at low pressures well before acoustic emis-
sion (AE) rates are significant, and at higher pres-
sures when large AE rates can be correlated with
significant grain failure leading to an apparent critical
failure point, P*.
Analysis of our results leads to a physical model
that describes the pressure-dependent compaction of
an unconsolidated granular medium. At low pressures,
quartz sand compacts predominantly via particulate
flow involving grain rolling, slip at grain contacts, and
grain translation. As the consolidation state increases
with pressure, stresses build up at grain contacts and
individual grains form stress bridges to support the
macroscopic load. The formation and subsequent
evolution of these stress bridges will be promoted
by the distortional stresses imposed during triaxial
deformation. At the grain scale, individual particles
deform elastically following the Hertzian contact
theory. Microcracks within the grains develop as
stress builds up at grain contacts and with continued
stressing these microcracks grow leading to grain
failure. As the number of failing grains reaches a
critical limit, the macroscopic stresses can no longer
be supported and pore collapse occurs throughout the
sample.
The observation that permanent strains accumulate
at all pressures is fundamental for the definition of
yielding of the granular aggregate. The classic defi-
nition of material yield relies on observations that
pinpoint the onset of permanent deformation. As our
sand exhibits permanent strain for all pressures, this
implies that the aggregates are yielding at all stages of
deformation. This observation is crucial for the con-
struction of failure envelopes that are often reported in
studies of critical state and CAP models of soil
mechanics, and more recently extended to the loading
conditions of rock mechanics (e.g. Wong et al., 1997;
Karner et al., 2000). Our results indicate that the
material crushing strength (e.g. P* for hydrostatic
deformation) must be carefully identified using a
rigorous, self-consistent, and systematic approach.
Our stress cycling experiments also indicate that
granular aggregates retain memory of the consolida-
tion state that was previously attained. This is signif-
icant for studies of granular material in environments
likely to experience fluctuations in stress due to
deposition and erosion at an actively subsiding river
delta; or within gouge zones of mature seismogenic
faults. It is important to note that for our experiments
we allowed fluid to escape during pore collapse. If the
natural environment were to permit interstitial fluids to
migrate away from the compacting aggregate, then the
sediment would consolidate ‘‘normally’’. If, however,
S.L. Karner et al. / Tectonophysics 377 (2003) 357–381380
the fluids were prevented from migrating, consolida-
tion of the granular aggregate would result in in-
creased pressures for interstitial fluids. Conversely,
underpressured fluids would result if the loading
stresses were relieved because the sediment would
retain a memory of the previous consolidation state.
Thus, the consolidation state and physical properties
of sediments will be sensitive to the history of loading
and generation of overpressure in sedimentary basins.
Similarly, the physical properties of granular fault
gouges will be sensitive to the influence of the
earthquake cycle on fluid-saturated seismogenic
faults.
Acknowledgements
This research was supported by the Office of Basic
Energy Sciences, Division of Chemical Sciences,
Geosciences, and Biosciences, Department of Energy,
under Grant No. DE-FG03-ER14887. We thank Teng-
fong Wong and an anonymous reviewer for their
thorough and constructive comments and suggestions
regarding this manuscript. The authors are extremely
grateful to Andrew Hajash, Wenwu He, and Steven
Lenz for their significant contributions to this work,
and for the many stimulating discussions we have had
with them. We express our utmost appreciation to
Tony Gangi and Dave Sparks for their insightful
comments and thoughts expressed about this research.
References
Aharonov, E., Sparks, D.W., 1999. Rigidity phase transitions in
granular packing. Phys. Rev., E, 6890–6896.
Arbenz, J.K., 1989. The Ouachita system. In: Bally, A.W., Palmer,
A.R. (Eds.), The Geology of North America, Volume A—An
Overview. Geological Society of America, Boulder, CO,
pp. 371–396.
Athy, L.F., 1930. Density, porosity, and compaction of sedimentary
rocks. AAPG Bull. 65, 2433–2436.
Baud, P. Zhu, W., Wong, T.-F., 2000. Failure mode and weaken-
ing effect of water on sandstone. J. Geophys. Res. 105,
16371–16389.
Biot, M.A., 1941. General theory of three-dimensional consolida-
tion. J. Appl. Phys. 12, 155–164.
Biot, M.A., 1973. Nonlinear and semilinear rheology of porous
solids. J. Geophys. Res. 78, 4924–4937.
Birch, F., 1966. Compressibility; elastic constants. In: Clark Jr., S.P.
(Ed.), Handbook of Physical Constants. Geol. Soc. Am. Mem.,
vol. 97, pp. 169–173.
Borg, I. Friedman, M. Handin, J., Higgs, D.V., 1960. Experimental
deformation of St. Peter Sand: a study of cataclastic flow. In:
Griggs, D., Handin, J. (Eds.), Rock Deformation. Geol. Soc.
Am. Mem., vol. 79, pp. 133–191.
Brace, W.F., 1978. Volume changes during fracture and frictional
sliding: a review. Pure Appl. Geophys. 116, 603–614.
Bridgwater, J., 1994. Mixing and segregation mechanisms in par-
ticle flow. In: Mehta, A. (Ed.), Granular Matter: An Interdisci-
plinary Approach. Springer, New York, pp. 161–193.
Britto, A.M., Gunn, M.J., 1987. Critical State Soil Mechanics via
Finite Elements. Ellis Horwood, Chichester.
Brzesowsky, R.H., 1995. Micromechanics of Sand Grain Failure
and Sand Compaction. PhD Thesis. Universiteit Utrecht,
Netherlands.
Chester, J.S. Lenz, S.C. Chester, F.M., Lang, R., 2003. Mechanisms
of compaction of quartz sand at diagenetic conditions. Earth
Planet. Sci. Lett. (in press).
Chuhan, F.A. Kjeldstad, A. Bjørlykke, K., Høeg, K., 2002. Porosity
loss in sand by grain crushing—experimental evidence and rele-
vance to reservoir quality. Mar. Pet. Geol. 19, 39–53.
David, C. Wong, T.-F. Zhu, W., Zhang, J., 1994. Laboratory
measurement of compaction-induced permeability change in
porous rocks: implications for the generation and maintenance
of pore pressure excess in the crust. Pure Appl. Geophys. 143,
425–456.
Dewers, T., Hajash, A., 1995. Rate laws for water-assisted compac-
tion and stress-induced water – rock interaction in sandstones.
J. Geophys. Res. 100, 13093–13112.
Drescher, A., de Josselin de Jong, G., 1972. Photoelastic verifica-
tion of a mechanical model for the flow of a granular material.
J. Mech. Phys. Solids 20, 337–351.
Elias, B.P., Hajash Jr., A., 1992. Changes in quartz solubility and
porosity due to effective stress: an experimental investigation of
pressure solution. Geology 20, 451–454.
Gallagher, J.J. Friedman, M. Handin, J., Sowers, G.M., 1974. Ex-
perimental studies relating to microfracture in sandstone. Tecto-
nophysics 21, 203–247.
Gangi, A.F., 1978. Variation of whole and fractured porous rock
permeability with confining pressure. Int. J. Rock Mech. Min.
Sci. Geomech. Abstr. 15, 249–257.
Graham, J., Hovan, J.-M., 1986. Stress characteristics for bearing
capacity in sand using a critical state model. Can. Geotech.
J. 23, 195–202.
Graton, L.C., Fraser, H.J., 1935. Systematic packing of spheres—
with particular relation to porosity and permeability. J. Geol. 43,
785–909.
Gudehus, G., 2000. On the physical background of soil strength. In:
Kolymbas, D. (Ed.), Constitutive Modelling of Granular Mate-
rials. Springer, Berlin, pp. 291–301.
Handin, J. Friedman, M. Logan, J.M. Pattison, L.J., Swolfs, H.S.,
1972. Experimental folding of rocks under confining pressure:
buckling of single-layer rock beams. In: Heard, H.C., Borg, I.Y.,
Carter, N.L., Raleigh, C.B. (Eds.), Flow and Fracture of Rocks.
AGU Geophys. Mono. Series, vol. 16, pp. 1–28.
He, W., 2001. Experimental and Theoretical Modeling of Creep

S.L. Karner et al. / Tectonophysics 377 (2003) 357–381 381
Compaction of Quartz Sand: rate Laws and Evolution of Poros-
ity and Fluid Chemistry. PhD Dissertation. Texas A&M Univer-
sity. 90 pp.
Heard, H.C., 1963. Effect of large changes in strain rate in the ex-
perimental deformation of Yule marble. J. Geol. 71, 162–195.
Hedberg, H.D., 1926. The effect of gravitational compaction on the
structure of sedimentary rocks. AAPG Bull. 10, 1035–1073.
Herle, I. Doanh, T., Wu, W., 2000. Comparison of hypoplastic and
elastoplastic modelling of undrained triaxial tests on loose sand.
In: Kolymbas, D. (Ed.), Constitutive Modelling of Granular
Materials. Springer, Berlin, pp. 333–351.
Hertz, H., 1881. Ueber die Beruhrung fester elastischer Korper.
J. Reine Angew. Math. 92, 156–171.
Karner, S.L. Chester, F.M. Kronenberg, A.K., Lenz, S.C., 2000.
The compactive strength of granular quartz sand. EOS Trans.
AGU 81 (48), F1187.
Karner, S.L., Chester, F.M., Kronenberg, A.K., Chester, J.S., Lenz,
S.C., Hajash, A., He, W., 2001. Compressibility and particle size
effects of compacted granular quartz. EOS Trans. AGU 82 (47),
F1131
Karner, S.L. Chester, J.S. Chester, F.M. Kronenberg, A.K., Hajash,
A., 2003. Laboratory deformation of granular quartz sand: im-
plications for the burial of clastic rocks. AAPG Bull (submitted
for publication).
Lenz, S.C., 2002. Acoustic Emission and Compaction Creep of
Quartz Sand at Subcritical Stress. MSc Thesis. Texas A&M
University, College Station, Texas.
Lord, A.E. Koerner, R.M., Curran, J.W., 1977. Fundamental studies
of acoustic emissions in soils. In: Hardy, H.R., Leighton, F.W.
(Eds.), Proceedings First Conference on Acoustic Emission/Mic-
roseismic Activity in Geologic Structures and Materials. Trans.
Tech. Publications, Clausthal, Germany, pp. 135–148.
Love, A.E.H., 1944. A Treatise on the Mathematical Theory of
Elasticity. Dover Publ., New York. 643 pp.
Marcher, Th. Vermeer, P.A., von Wolffersdorff, P.-A., 2000. Hypo-
plastic and elastoplastic modelling—a comparison with test da-
ta. In: Kolymbas, D. (Ed.), Constitutive Modelling of Granular
Materials. Springer, Berlin, pp. 353–374.
Maxwell, J.C., 1964. Influence of depth, temperature, and geologic
age on porosity of quartz sandstone. AAPG Bull. 48, 697–709.
Mindlin, R.D., Deresiewicz, H., 1953. Elastic spheres in contact
under varying oblique forces. J. Appl. Math. 75, 327–344.
Morgan, J.K., Boettcher, M.S., 1999. Numerical simulations of
granular shear zones using the distinct element method: 1. Shear
zone kinematics and the micromechanics of localization. J. Geo-
phys. Res. 104, 2703–2719.
Olgaard, D.L. Nueesch, R., Urai, J., 1995. Consolidation of water
saturated shales at great depth under drained conditions. In:
Fujii, T. (Ed.), Proceedings of the Congress of the International
Society for Rock Mechanics, vol. 8, pp. 273–277.
Olgaard, D.L. Dugan, B.E., Gooch, M.J., 2001. Near-sea floor
compaction and shallow overpressures: constraints from high
strain consolidation tests on ODP sediments. EOS Trans.
AGU 82 (47), F1128.
Pitman, J.K. Goldhaber, M.B., Spoetl, C., 1997. Regional diage-
netic patterns in the St. Peter sandstone: implications for brine
migration in the Illinois basin. U.S. Geol. Surv. Bull. 2094-A,
A1–A17.
Ramsamooj, D.V., Alwash, A.J., 1990. Model prediction of cyclic
response of soils. J. Geotech. Eng. 116, 1053–1072.
Reed, J.S., 1995. Principles of Ceramic Processing, 2nd ed. Wiley,
New York.
Schofield, A., Wroth, P., 1968. Critical State Soil Mechanics.
McGraw-Hill, New York. 310 pp.
Smith, P.R. Jardine, R.J., Hight, D.W., 1992. The yielding of Both-
kenar clay. Geotechnique 42, 257–274.
Sumino, Y., Anderson, O.L., 1984. Elastic constants of minerals.
In: Carmichael, R.S. (Ed.), CRC Handbook of Physical Prop-
erties of Rocks, vol. III. CRC Press, Boca Raton, pp. 92–93.
Terzaghi, C., 1925. Principles of soil mechanics: II. Compressive
strength of clay. Eng. News-Rec. 95, 796–800.
Timoshenko, S., 1934. Theory of Elasticity. McGraw-Hill, New
York.
Walker Jr., W.J., 2000. Persistence of granular structure during die
compaction of ceramic powders. Mater. Res. Soc. Symp. Proc.
627 (BB6.4).
Wong, T.-F. David, C., Zhu, W., 1997. The transition from brittle
faulting to cataclastic flow in porous sandstones: mechanical
deformation. J. Geophys. Res. 102, 3009–3025.
Zhang, J. Wong, T.-F., Davis, D.M., 1990a. Micromechanics of
pressure-induced grain crushing in porous rocks. J. Geophys.
Res. 95, 341–352.
Zhang, J. Wong, T.-F. Yanagidani, T., Davis, D.M., 1990b. Pres-
sure-induced microcracking and grain crushing in Berea and
Boise sandstones: acoustic emission and quantitative micro-
scopy measurements. Mech. Mater. 9, 1–15.
Zimmerman, R.W., 1991. Compressibility of Sandstones. Elsevier,
New York. 173 pp.
Zoback, M.D., Byerlee, J.D., 1976. Effect of high-pressure defor-
mation on permeability of Ottawa sand. AAPG Bull. 60,
1531–1542.