Embed Size (px)
Citation preview
Applikationsbericht
Sub-Femtomole Detection of Protein Digests Using the Q-Tof Premier and nanoACQUITY UPLC System
Iain Campuzano, Chris Hughes, Therese McKenna, Phil Young, Mark Ritchie, James I. Langridge
Waters Corporation

Abstract
In this application note we describe the use of a Q-Tof Premier in combination with a nanoACQUITY UPLC
System for the detection of low-level tryptic digests.
Introduction
The use of LC-MS/MS to qualitatively characterize enzymatic protein digests is now standard and
widespread throughout protein laboratories. This method has been shown to work well with mixtures of low
and medium complexity, while highly complex protein samples are often separated using an extra stage of
chromatography prior to analysis via LC-MS/MS.
The mass spectrometer is normally operated in the Data Directed Analysis (DDA) mode, where the
instrument automatically selects peptides for MS/MS, based upon their intensity and charge state, as they
elute from the HPLC column.
In this application note we describe the use of a Q-Tof Premier in combination with a nanoACQUITY UPLC
System for the detection of low-level tryptic digests.

The Waters nanoACQUITY UPLC System and the Waters Micromass Q-
Tof Premier Mass Spectrometer.
Experimental
Sample Preparation
Samples of the MassPREP Digest Standards, Enolase, and Bovine Serum Albumin (Waters Corp, Milford MA)
were analyzed on the Q-Tof Premier nanoACQUITY UPLC System. Stock solutions at a concentration of 1
pmol/μL were prepared by adding 1 mL of aqueous 0.1% formic acid to the lyophilised powder. Samples were
then diluted to the desired concentration for injection using 0.1% formic acid. The nanoACQUITY sampler
manager was programmed to inject 2 μL in full loop mode.
nanoACQUITY System
Samples were injected, and separated, on a nanoACQUITY System configured in trapping mode, (with a
trapping and analytical column). The trapping column (180 μm ID x 20 mm), was packed with Symmetry C18
5 μm, while the analytical column (75 μm ID x 100 mm) was packed with Atlantis dC18 3 μm. Solvent A was
aqueous 0.1% formic acid with solvent B acetonitrile + 0.1% formic acid.
Trapping was performed for 3 minutes using the Binary Solvent Manager operating at a flow rate of 5 μL/min

and at a composition of 3% B. The gradient then changed the composition of the solvent B from 3% B to
40% B over 30 minutes with a wash at 95% B for 2 minutes. The columns were then re-equilibrated for 30
minutes prior to the next injection. The nanoACQUITY provides direct flow to the nano-scale column, without
flow splitting. In these experiments a flow rate of 250 nL/min was used to elute the peptides from the
analytical column.
Mass Spectrometry
All analysis was carried out using the Waters Micromass Q-Tof Premier mass spectrometer operating in the
V-Optics mode. The Q-Tof Premier was operated in Data Directed Analysis mode with an MS survey
integration time of 1 second.
The mass spectrometer was programmed to switch into the MS/MS mode on a single precursor ion, when a
doubly or triply charged ion exceeded a threshold of 6 counts/sec. MS/MS was performed with an
integration time of 2 seconds per precursor, up to a maximum of 12 seconds for each selected ion.
The column eluent was coupled directly to a NanoLC sprayer, fitted to the NanoLockSpray source of the
mass spectrometer. In the reference channel of the NanoLockSpray source a 300 fmol/μL solution of Glu
Fibrinopeptide B was continually delivered by the Auxiliary Solvent Manager of the nanoACQUITY System to
provide a lock mass ion at m/z 785.8426. The ASM was operated at a flow rate of 0.5 μL/min.
The mass spectrometer was calibrated, prior to the analysis, using a mixture of CsI and NaI, over the m/z
range 50–1990.
Results and Discussion
The data presented below illustrates typical results that can be obtained from low-level tryptic digests using
the nanoACQUITY/Q-Tof Premier combination in DDA mode. Example data from two digest samples, Bovine
Serum Albumin (BSA) and Yeast Enolase are shown. In the case of BSA, data is presented from 250 and 500
attomoles, while in the case of Enolase, data is shown from 125, 250 and 500 attomoles. In each case positive
identification of the parent protein could be made and is shown using ProteinLynx Global SERVER v2.2.
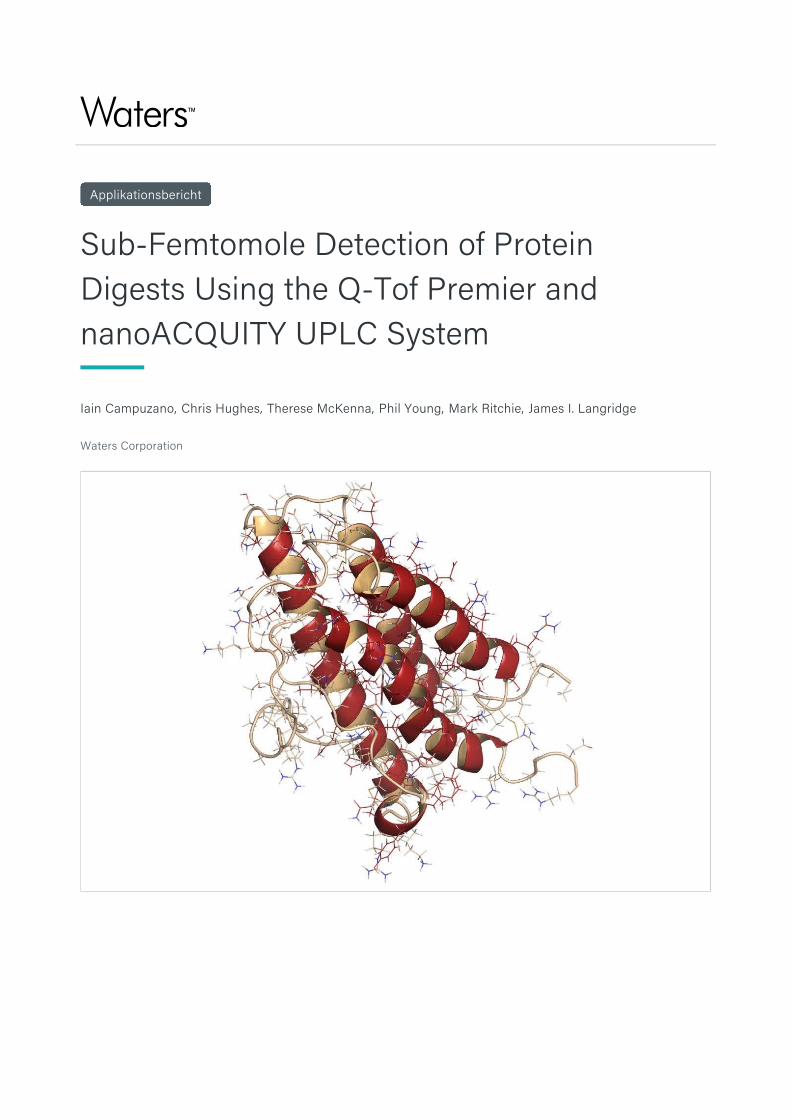
Figure 1. ProteinLynx Global SERVER 2.2 databank search result from
the LC-MS/MS analysis of 250 amol BSA.
Figure 2. Raw data showing 6 summed two-second MS/MS scans of the
ion at m/z 582.29. 250 amol BSA MPDS was injected onto the column in
this experiment.

Figure 3. MS/MS data from one two-second integration of the ion at
m/z 582.29 obtained from the injection of 250 attomoles of BSA.
Figure 4. MS/MS spectrum for m/z 582.29 (2+), from the injection of 250
attomoles of BSA; annotated with the “matching y” ions from the
identified BSA amino acid sequence.

Figure 5. ProteinLynx Global SERVER 2.2 databank search result from
the LC-MS/MS analysis of 500 amol BSA MPDS.
Figure 6. ProteinLynx Global SERVER 2.2 databank search result from
the LC-MS/MS analysis of 125attomoles of an Enolase tryptic digest.

Figure 7. Raw data of 6 summed two-second MS/MS scans from the ion
at m/z 643.95. In this case, 125 attomoles of an Enolase tryptic digest
was injected onto the column.
Figure 8. One two-second MS/MS scans from the ion at m/z 643.95(2+).
In this case, 125 attomoles of an Enolase tryptic digest was injected
onto the column.

Table 1. Summary of the proteins analyzed, the number of matching
peptides and amino acid sequence coverage obtained from databank
searching of the LC-MS/MS data.
Conclusion
The results presented here clearly show the inherent sensitivity of the nanoACQUITY Q-Tof Premier
combination for the analysis of low level protein digests
■
The limits of detection in favorable cases can be below 200 attomoles, injected on-column ■
This data has been acquired with Atlantis dC18 stationary phase. The use of a nanoscale nanoACQUITY
BES 1.7 μM column, in the near future may allow even lower limits of detection to be achieved
■
Featured Products
ACQUITY UPLC M-Class System <https://www.waters.com/134776759>
ProteinLynx Global SERVER (PLGS) <https://www.waters.com/513821>
720001252, May 2005

© 2021 Waters Corporation. All Rights Reserved.