Embed Size (px)
Citation preview

Department of Electronics and Communication Engineering
Sub Code/Name: BEC7L2-OPTICAL COMMUNICATION LAB
Name : ……………………………………
Reg No : ……………………………………
Branch : ……………………………………
Year & Semester : ……………………………………

LIST OF EXPERIMENTS
Sl No Experiments Page No
1
V-I and P-I characteristics of LED
2 V-I and P-I characteristics of Photodiode
3 Setting up an analog link using plastic fiber cable
4 Settingup a digital linkusing plastic fiber cable
5 Amplitude Modulation and Demodulation
6 Frequency modulation and Demodulation
7 Numerical Aperture for a Plastic Fiber
8 Pulse width modulation and Demodulation
9 Pulse position modulation and Demodulation
10 Time Division Multiplexing(TDM)
11
Finding V-number for a glass fiber(Multimode / single mode fiber)
12 Numerical Aperture for optical glass fiber(Multimode / single mode)
Coupling loss in optical glass fiber(multimode / single mode fiber)
Bit Error Rate Measurement
Study of Pulse Broadening

INDEX
Expt. Date Name of the Experiment Marks Staff SIGN

Ex No:1 Date:
V-I AND P-I CHARACTERISTICS OF LED
Aim : To plot the VI and PI characteristics of LED operating at 850 nm
wavelength and find the conversion efficiency.
Apparatus Required : 1. OFT powers supply
2. LED module
3. Optical power meter
4. Bare Fiber adapter-Plastic
5. 1.25m plastic fiber
6. 180 Ω resistor
7. Digital multimeter
Theory :
LEDs, used in optical communication have high modulation rate
capability, high radiance, high reliability and emission wavelengths restricted
to the near-IR spectral regions of low attenuation in fibers. The materials used
are GaAs, InGaAs. The internal quantum efficiency is only 1% and external
efficiency is much lower due to light emitted from semiconductor-air surface,
angle of incidence, the light reflected back and absorption at the point of
generation and emitting surface. Recombination of excess electrons and holes
takes place whenever current is passed through the PN junction of LED. The
energy released by photons results in light emission.

Precautions : 1. Before switching on the power supply ensure that the
potentiometer[R2] is in the minimum position[Left extreme]. Tabulation :
Vf volts If mA VLED volts Power Power in [dBm] μW [Po]
2. me
Procedure : 1. Make the set-up as in the diagram.
2. With potentiometer in the minimum position switch on the power
supply.
3. Measure the voltage across resistor R1 and note down as V1; 4. Measure the voltage across the LED and note it as VLED; Also note
down the corresponding output power in dBm from the optical
power meter.
5. Calculate If from the formula: If = V1/180

6. Calculate power in microwatts from the formula :
Power[μW] = 1mW * 10 [Power in dBm/10]
7. Vary the potentiometer slowly and for various values of V1 repeat
steps 3 to 6.
8. Tabulate the readings. 9. Plot the VI characteristics taking VLED in the x-axis and If in the y-
axis.
10. Plot the P-I characteristics taking If in the x-axis and the Power in
watts in the y-axis.
11. By taking the average values of power in watts, VLED and If and using
the following formula calculate the conversion efficiency:
η = [Po*100/ (VLED* If)] %
Result : Thus the VI and PI characteristics of LED was plotted and the
conversion efficiency is found as ___________________.

CIRCUIT DIAGRAM:
R1 R2
Opt
VPD ical
L
D Po Vbias
U wer
VLD
N
I Met T er
Model Graph :
P-I Characteristics V-I Characteristics
P 0
C U R R E N T [mA] V O L T AG E[ Volts]

Ex No:2 Date:
CHARACTERISTICS OF PHOTODIODE Aim: To plot distance Vs Photocurrent Characteristics of LDR and Photodiode APPARATUS REQUIRED: COMPONENTS REQUIRED:
S.No. Name Range Type Qty
1 R.P.S (0-30)V
1
2 Ammeter (0–30)mA
1 (0–10)µ A
(0–10)V
1 3 Voltmeter
S.No. Name Range Type Qty
1 Photodiode
1
2 LDR 1K Ω 1
1
3 Bread
1 Board
4 Wires
Theory: LDR A photoresistor or light dependent resistor or cadmium sulfide (CdS) cell is a resistor hose resistance decreases with increasing incident light intensity. It can also be referred to as a photoconductor. A photoresistor is made of a high resistance semiconductor. If light falling on the device is of high enough frequency, photons absorbed by the semiconductor give bound lectrons enough energy to jump into the conduction band. The resulting free electron (and its hole partner) conduct electricity, thereby lowering resistance Photodiode A silicon photodiode is a solid state light detector that consists of a shallow diffused P-N junction with connections provided to the out side world. When the top surface is illuminated, photons of light penetrate into the silicon to a depth determined by the photon energy and are absorbed by the silicon generating electron-hole pairs. The electron-hole pairs are free to diffuse (or wander) throughout the bulk of the
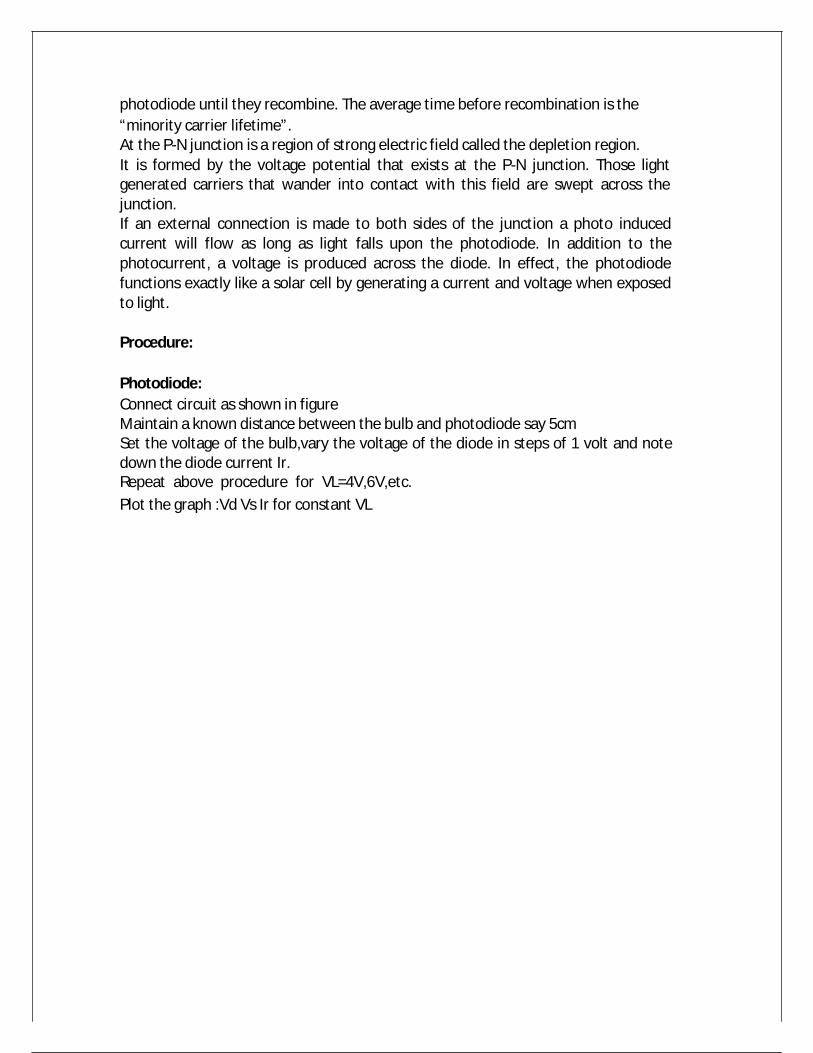
photodiode until they recombine. The average time before recombination is the “minority carrier lifetime”. At the P-N junction is a region of strong electric field called the depletion region. It is formed by the voltage potential that exists at the P-N junction. Those light generated carriers that wander into contact with this field are swept across the junction. If an external connection is made to both sides of the junction a photo induced current will flow as long as light falls upon the photodiode. In addition to the photocurrent, a voltage is produced across the diode. In effect, the photodiode functions exactly like a solar cell by generating a current and voltage when exposed to light. Procedure: Photodiode: Connect circuit as shown in figure Maintain a known distance between the bulb and photodiode say 5cm Set the voltage of the bulb,vary the voltage of the diode in steps of 1 volt and note down the diode current Ir. Repeat above procedure for VL=4V,6V,etc. Plot the graph :Vd Vs Ir for constant VL


Tabulation
Photodiode Distance-constant, VL-Constant
S. No VD(V) IR (mA) Result: The characteristics of Photodiode,to be tabulated and the graphs are plotted

Ex No:3 Date:
SETTING UP AN ANALOG LINK USING PLASTIC FIBER CABLE
Aim : To establish a fiber optic analog link and determine the
bandwidth, attenuation loss, bending loss and coupling losses.
Apparatus/Components Required : 1. OFT Kit 2. CRO 3. Function Generator 4. 1m and 3m OF cables 5. 10 mm and 12 mm Mandrels 6. Jig for connecting 2 fibers
Theory :
Though optical fibers offer many advantages including very low EM
interference, the signal strength decreases as light travels longer distances.
This is because of the various losses including rayleigh scattering loss and
increases with length.
Unless proper splicing techniques are used for connecting 2 fibers there
exists considerable coupling losses due to various misalignments including
axial misalignment.
Similarly there exist two kinds of bending losses viz. micro bending loss
and constant radius bending losses. The former is because of the light
absorbed by the water/air molecules or any irregularities which could have
occurred at the time of manufacturing of the fibers. Constant radius bending
losses occur because of fiber bending during cable laying.

Tabulation : 1. For Bandwidth : Vin = __________ Volts
Frequency Output Gain [Hz] Voltage [dB]
[Volts]
Tabulation : 2. For Atenuation Loss : Vin = __________ Volts Cable Output voltage [Volts]
1m V1= 3m V3=
Tabulation : 3. For Bending Loss :
Cable/Bend Output voltage Output voltage Voutbb[Volts] Voutab[Volts] 1m / 10 mm 1m / 12 mm
3m / 10 mm 3m / 12 mm
Voutbb = output voltage without any bending Voutab = output voltage with bend

Procedure 1.Make the connections as in the diagram. Connect the input signal from
FG to I/O-1. Short I/O-1,I/O-2 and P11 ________. Connect I/O-2 and the
output from P31 to the two channels of CRO. Set the switch SW8 to analog
position. Adjust the gain control knob to obtain proper shape of the output
signal.
2.[a] To measure the bandwidth of the fiber :
Note down the amplitude of input signal as Vin. Vary the frequency
of the input signal from a few Hz to MHz and note down the
corresponding output voltages. Tabulate the readings and calculate the
gain from the formula :
Gain[dB]= 20 * log[Vout/Vin].
Plot the gain Vs frequency graph. Note down the two points
which are 3 dB lower from the maximum gain on either side. Note down
the corresponding frequencies as f1 and f2; then the bandwidth of the
fiber is : [f2-f1]
[b] To measure the attenuation loss in the fiber :
Connect the 1m fiber between the Tx and Rx. Note down the
input voltage as Vin and the output voltage as V1.Replace the 1m fiber
with 3m fiber and for the same Vin note down the output as V3. Then
the attenuation loss in Np/m can be calculated from :
α[Np/m]= -[1/2]* ln[V3/V1] and α’[dB/m]= 4.343*α

Tabulation : 4. For coupling Loss :
Vin = __________ Volts Coupling Output voltage
[Volts] Without Gap With 1 cm Gap
[c] To measure the Bending loss in the fiber :
1.Connect the 1m fiber between the Tx and Rx. Note down the
output voltage as Voutbb.Take the 10mm radius mandrel and make 1 or
2 turns of the fiber on the mandrel and note down the output as Voutab.
Now replace the 10mm mandrel with 12mm mandrel and note down
the output voltage.
2.Repeat step 1 for 3m cable.
3. Calculate the bending loss from the formula:
Bending Loss[dB]= 20*log[Voutbb/Voutab]
[d] To measure the Coupling loss in the fiber :
Connect one end of the 1m fiber to the Tx and one end of the
3m fiber to the Rx. Connect the remaining 2 end together using the
Jig

making the ends to touch each other. Note down the input and
output voltages.
With the same input voltage, introduce 1cm gap between the
fiber ends connected in the jig and note down the output voltage.
Calculate the coupling losses without gap and with 1cm gap using the
formula:
η= 20*log [Vin / Vout] – α’[L1+L2] where α’= 4.343α and L1=
1m and L2= 3m
Result : The fiber optic link for analog transmission has been set up and the
following were determined:
Bandwidth of the analog link : Attenuation loss in Np/m: Attenuation loss in dB/m: Coupling loss without Gap in dB: Coupling loss with 1cm Gap in dB: ================================ 1m cable 3m cable Bending loss with 10mm radius bend[dB] Bending loss with 12mm radius bend[dB]

Ex No:4 Date:
SETTING UP FIBER OPTIC DIGITAL LINK OBJECTIVE:
The objective of this experiment is to study a 650 nm fiber optic
digital link. In this experiment, we will study a relationship between the input signal
and the received signal. PROCEDURE:
1 Connect the power supply to the board.
2 Ensure that all switch faults are OFF. 3 Make the following connections.
a. Connect the function generator 1 KHz square wave output to the
emitter 1’s input.
b. Connect the fiber optic cable between the emitter’s output and
detector’s input.
c. Connect detector 1’s output to the comparator 1’s input.
d. Connect comparator 1’s output to AC amplifier 1’s input.
4 On the board switch emitter 1’s driver to digital mode.
5 Switch ON the power.
6 Monitor both the inputs to comparator 1 (tp 13 and tp 14). Slowly adjust the
comparator bias. Reset until DC level on the input (tp 13) lies midway
between the high and low level of the signal on positive input (tp 14).
7 Observe the input to emitter (tp 5) with output from AC amplifier 1 (tp 28)
and note that the two signals are same. RESULT:
Thus the relationship between input and output waves was obtained.
Frequency (KHz) =

SETTING UP FIBER OPTIC DIGITAL LINK
Emitter circuit Detector circuit
Comparator
Function Generator
1 KHz
AC amplifier Gnd
Circuit
OBSERVATION
Input Voltage Output Voltage Time (V) (V) (ms)

:
Ex No:7 Date
NUMERICAL APERTURE FOR A PLASTIC FIBER AIM:
To measure the numerical aperture of the plastic fiber provided with kit
using 660 nm wavelength LED.
APPARATUS REQUIRED:
S.No. Name of the Equipments Quantity
1. Link – B Advance Fiber Optic
Communication Trainer Kit 1
2. Power Supply 1
3. Fiber Optic Cable (Plastic) 1 meter
4. Numerical Aperture measurement
Jig 1
5. Steel Ruler 1
6. Patch Chords Required
THEORY:
Numerical aperture refers to the maximum angle at the light incident on the
fiber end is totally internal reflected and is transmitted properly along the fiber.
The cone formed by the rotation of this angle along the axis of the fiber is the
cone of acceptance of fiber. The light ray should strike the fiber end within its
cone of acceptance; else it is refracted out of the fiber core.

Numerical aperture is the measure of the power launching efficiently of an optical
fiber. When N.A. is small, then the light available from various directions from the
source, only a portion of light is accepted by an optical fiber and the remaining is
rejected.
OBSERVATION:
d
(mm)
MR
(mm)
PN
(mm)
r
(mm) NA
r = (MR+PN)
4
NA = sin θ max =
PROCEDURE:
1. Make connections as shown in figure. Connect the power supply cables with
proper polarity to Link – B Kit. While connecting this, ensure that the power
supply is OFF.
2. Keep Intensity control pot P2 towards minimum position.
3. Keep Bias control pot P1 fully clockwise position.
4. Switch ON the power supply.

5. Slightly unscrew the cap of SFH 756V (660) nm. Do not remove the cap from
the connector. Once the cap is loosened, insert the 1 Meter Fiber into the cap.
Now tighten the cap by screwing it back.
6. Insert the other end of the Fiber into the numerical aperture measurement jig.
Adjust the fiber such that its cut face is perpendicular to the axis of the Fiber.
7. Keep the distance of about 5mm between the fiber tip and the screen. Gently
tighten the screw and thus fix the fiber in the place.
8. Increase the intensity pot P2 to get bright red light circular patch.
9. Now observe the illuminated circular patch of light on the screen.
10. Measure exactly the distance d and also the vertical and horizontal diameters
MR and PN as indicated in the Figure.
11. Mean radius is calculated using the following formula
r = (MR+PN)/4.
12. Find the numerical aperture of the fiber using the formula
NA = sin θ max =
Where θ max is the maximum angle at which the light incident is properly
transmitted through the fiber.
RESULT :
Thus Numerical aperture of the plastic fiber provided with kit using 660 nm
wavelength LED was measured as ________.

BLOCK DIAG Fiber
He-Ne LASER FIBER COUPLER
ROTATION
STAGE
POWER METER DETECTOR
O/P Power
Gaussian 2 curve
(Degrees)
Figure: Field Distribution

Ex No: 12 Date
NUMERICAL APERTURE FOR OPTICAL GLASS FIBER (MULTIMODE / SINGLE MODE)
Objective: To measurement of the Numerical Aperture (NA) of the fiber.
Apparatus Required:
3. ST2502 trainer with power supply cord
4. Optical Fiber cable.
5. Numerical Aperture measurement Jig/Paper & Scale.
Fig.8.1 Connection diagram on ST502

Theory: The numerical aperture refers to maximum angle at which the incident on fiber end is totally
internally reflected and is transmitted along the fiber. The cone formed by rotation of this angle
along the axis of the fiber is the cone of acceptance of fiber. if light ray should strike the fiber end within
this cone of acceptance it will be transmitted properly else it is refracted out of fiber.
NA=
Procedure: 7. Connect the Power supply cord to mains supply and to the trainer ST2502. 8. Connect the frequency generator's 1 KHz sine wave output to input of emitter 1 circuit. Adjust its
amplitude at 5Vpp.
9. Connect one end of fiber cable to the output socket of emitter 1 circuit and the other end to
the numerical aperture measurement jig. Hold the white screen facing the fiber such that its cut
face is perpendicular to the axis of the fiber.
10. Hold fiber vertically at a suitable distance to make the red spot . 11. Record the distance of screen from the fiber end L and note the diameter W of the spot. Compute the numerical aperture from the formula given below-
NA= (W/2) / √(W/2)^2+L^2
Result : The N.A. of optical glass fiber measured .
Ex No:13 Date:
COUPLING LOSS IN OPTICAL GLASS FIBER(MULTIMODE / SINGLE MODE
FIBER)
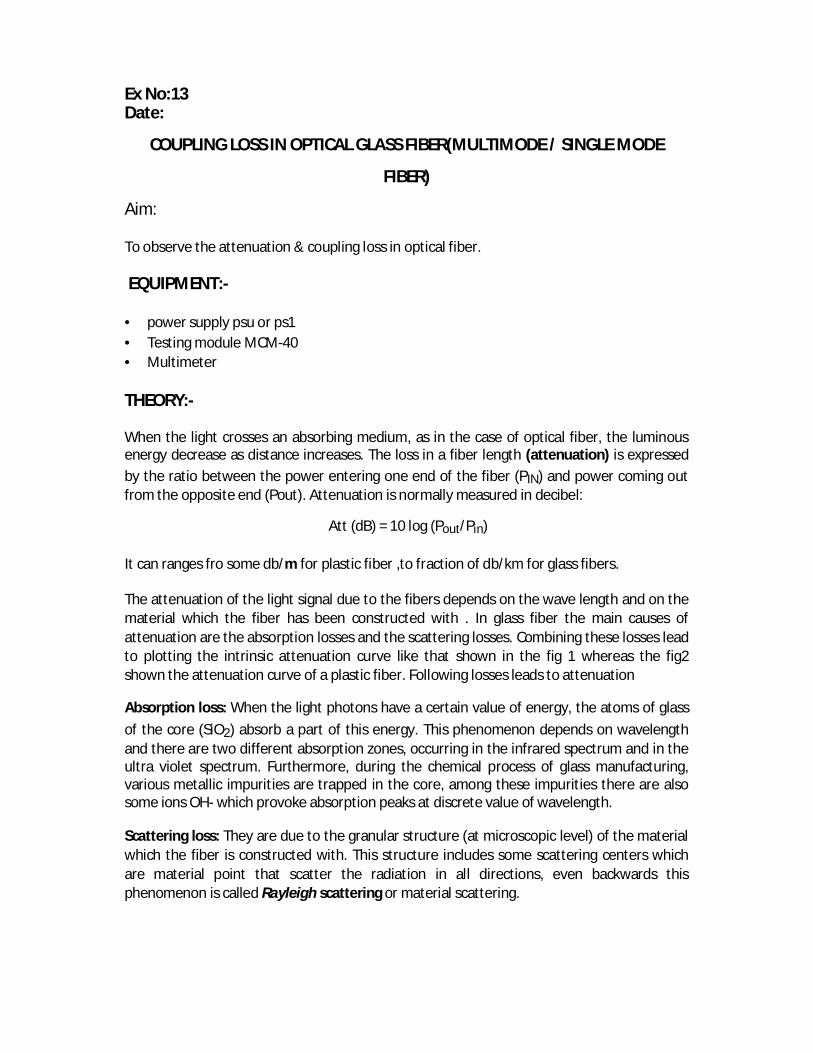
Aim: To observe the attenuation & coupling loss in optical fiber. EQUIPMENT:-
• power supply psu or ps1 • Testing module MCM-40 • Multimeter
THEORY:- When the light crosses an absorbing medium, as in the case of optical fiber, the luminous energy decrease as distance increases. The loss in a fiber length (attenuation) is expressed by the ratio between the power entering one end of the fiber (PIN) and power coming out from the opposite end (Pout). Attenuation is normally measured in decibel:
Att (dB) = 10 log (Pout/Pin) It can ranges fro some db/m for plastic fiber ,to fraction of db/km for glass fibers. The attenuation of the light signal due to the fibers depends on the wave length and on the material which the fiber has been constructed with . In glass fiber the main causes of attenuation are the absorption losses and the scattering losses. Combining these losses lead to plotting the intrinsic attenuation curve like that shown in the fig 1 whereas the fig2 shown the attenuation curve of a plastic fiber. Following losses leads to attenuation Absorption loss: When the light photons have a certain value of energy, the atoms of glass of the core (SiO2) absorb a part of this energy. This phenomenon depends on wavelength and there are two different absorption zones, occurring in the infrared spectrum and in the ultra violet spectrum. Furthermore, during the chemical process of glass manufacturing, various metallic impurities are trapped in the core, among these impurities there are also some ions OH- which provoke absorption peaks at discrete value of wavelength. Scattering loss: They are due to the granular structure (at microscopic level) of the material which the fiber is constructed with. This structure includes some scattering centers which are material point that scatter the radiation in all directions, even backwards this phenomenon is called Rayleigh scattering or material scattering.

Other losses : In an optical fiber link, other can be due to too narrow loops in the path of the optical cable (Bending losses), or to junction of more lengths of fiber. Of course they are not intrinsic losses of the fiber, but they depend on cable laying. PROCEDURE:- Attenuation of the fiber with increase in length • power the module • Disconnect the jumper j13 and connect j7c-j9b-j10b-j11-j12b, so that the circuit can be
arranged as it is shown in fig 1. This configuration includes the LED and the photodiode at 660 nm; moreover an alternating data signal (0/1) is applied to the input of the digital driver
• connect the LED to the photodiode through the cable # 1,ST-St adapter and cable 6 • set the bias trimmer (p4) to its intermediate position. connect j15b and observe the
waveform in TP24 (voltage detected by the assembly “photodiode +Tran impedance amplifier”) on the oscilloscope
• Record the amplitude vout1 of the square wave detected . • Replace the cable # 1(plastic fiber of 1.5m) with the cable # 2(plastic fiber of 5 m) and
measure the new amplitude vout2 of the received signal, in TP24. • Calculate vout2/ vout1=……………………….. Coupling and bending Losses • keep the same condition of the previous test (LED and photodiode at 660 nm connected
through the cable # 2) • observe the waveform in TP24, on the oscilloscope • looser the fiber connector inserted in the ST-ST adapter and gradually move it away
from the same adapter (and hence from the second ST connector inserted in the adapter )
• note that the amplitude of the receive signal decrease as the connection is loosen, it also depends on the angle at which the connector of the source and of the detector are connected.
• Bend the fiber and observe the wave form it will be observed that for sharp bends the wave form is more attenuated as the bending losses increases.
Attenuation of the fiber as a function of wavelength • remove the jumper j12b and connect the j13b, in order to use the LED and the
photodiode at 820nm • connect the LED 1 to the photodiode PD1 through the cable #1 (plastic fiber of 1.5m) • connect j15a and observe the waveform in TP23 • record the amplitude vout3 of the square wave detected • replace the cable #1 (plastic fiber of 1.5 m) with the cable #2 (plastic fiber of 5 m) and
measure the new amplitude vout4 of the signal received, in TP23 • Calculate vout4/ vout3 =………………. RESULT:- • It has been observed that the coupling loss increases as the cable length increases • The plastic fiber cable offer greater attenuation at 820nm then on 660nm

Ex No: 14 Date:
BIT ERROR RATE MEASUREMENT
AIM:
To Measure bit error rate.
APPARATUS REQUIRED:
S.No. Name of the Equipments Quantity
7. Link – B Advance Fiber Optic
Communication Trainer Kit 1
8. Power Supply 1
9. Fiber Optic Cable (Plastic) 1 meter
10. 20 MHz Dual channel Oscilloscope 1
11. Probes, Patch Chords Required
THEORY:
BIT ERROR RATE:
In telecommunication transmission, the bit error rate (BER) is a Ratio of
bits that have errors relative to the total number of bits received in a
transmission. The BER is an indication of how often a packet of other data unit
has to be retransmitted because of an error. Too high a BER may indicate that
a slower data rate would actually improve overall transmission time for a given
amount of transmitted data since the BER might be reduced, lowering the
number of packets that had to be resent.

OBSERVATION:
Tb = 320Kbits
S.No: Error Counter Eb BER
1.
2.
3.
4.
5.
BER = Eb/Tb
Where Eb – Errored bits
Tb – Total bits Transmitted in a period of time t seconds.
Measuring Bit Error Rate:
A BERT (bit error rate tester) is a procedure or device that measures the
BER for a given transmission. The BER, or quality of the digital link, is calculated
from the number of bits received in error divided by the number of bits
transmitted.
BER = (Bits in error) / (Total bits transmitted)
PROCEDURE:
1. Make connections as shown in figure. Connect the power supply cables
with proper polarity to Link – B Kit. While connecting this, ensure that the
power supply is OFF.
2. Keep PRBS switch SW7 as shown in figure to generate PRBS signal.
3. Keep switch SW8 towards TX position.
4. Keep switch SW9 towards TX1 position.

5. Keep the switch SW10 at fiber optic receiver output to TTL position.
6. Select PRBS generator clock at 32 KHz by keeping jumper JP4 at 32K
position.
7. Keep Jumper JP5 towards +5V position.
8. Keep Jumper JP6 shorted.
9. Keep Jumper JP8 towards Pulse position.
10. Switch ON the power supply.
11. Connect the post DATA OUT of PRBS Generator to the IN post of digital
buffer.
12. Connect OUT post of digital buffer to TX IN post.
13. Slightly unscrew the cap of SFH 756V (660) nm. Do not remove the cap from
the connector. Once the cap is loosened, insert the one Meter Fiber into
the cap. Now tighten the cap by screwing it back.
14. Slightly unscrew the cap of RX1 Photo Transistor with TTL logic output SFH
551V. Do not remove the cap from the connector. Once the cap is loosened,
insert the other end of fiber into the cap. Now tighten the cap by screwing
it back.
15. Connect detected signal TTL OUT to Bit Error Rate event counter DATA IN
post & post IN of Noise Source.
16. Connect post OUT of Noise Source to post RXDATA IN of Bit Error Rate
event counter.
17. Connect post CLK OUT of PRBS Generator to post CLK IN of Bit Error Rate
event counter.
18. Press Switch SW 11 to start counter.
19. Vary pot P3 for Noise Level to observe effect of noise level on the error
count.

20.Observe the Error Count LED’s for the error count in received signal in time
10 seconds as shown in figure.
RESULT:
Thus Bit error rate for given Sequence was measured.
REVIEW QUESTIONS:
1. Define bit error rate (BER)
2. What are the typical error rates for optical fiber telecommunication
systems?
3. Why transimpedance amplifier is commonly used in optical
communication receiver?
4. What devices are used as pre-amplifiers for Giga bits/sec. data rate?


![Optical transport of sub-micron lipid vesicles along an optical … · 2020-03-04 · arXiv:2003.01623v1 [physics.bio-ph] 2 Mar 2020 Optical transport of sub-micron lipid vesicles](https://img.dokumen.tips/doc/110x75/5f4a8bb8afa6f74d4704adcd/optical-transport-of-sub-micron-lipid-vesicles-along-an-optical-2020-03-04-arxiv200301623v1.jpg)