Embed Size (px)
Citation preview

STYLE-DEPENDENT ARTIFACT RECOGNITION FOR DIGITAL VARIABLE DATA PRINTING
by
Hector J. Santos-Villalobos
A thesis submitted in partial fulfillment of the requirements for the degree of
MASTER OF SCIENCE in
COMPUTER ENGINEERING
UNIVERSITY OF PUERTO RICO MAYAGÜEZ CAMPUS
2005 Approved by:
________________________________ Wilson Rivera-Gallego, PhD Member, Graduate Committee
________________ Date
________________________________ Nayda G. Santiago-Santiago, PhD Member, Graduate Committee
________________ Date
________________________________ Jose Fernando Vega-Riveros, PhD President, Graduate Committee
________________ Date
________________________________ Yolanda Ruiz-Vargas, PhD Representative of Graduate Studies
________________ Date
________________________________ Isidoro Couvertier, PhD Chairperson of the Department
________________ Date
________________________________ José Mari Mutt, PhD Director of Graduate Studies
________________ Date

ii
ABSTRACT This research explores a hybrid knowledge-based system for detecting defects in
digital documents, especially defects that depend on the style of the document
designer. The hybrid system is composed of a rule-based engine in charge of the
document segmentation and understanding, and a case-based reasoning engine in
charge of recognizing the defects. The system performs with an 81.2% of accuracy in
the recognition of defects. This thesis includes the architecture design for the hybrid
system, the characterization of defects, the methodology for document segmentation
and the extraction of the document implicit knowledge, and finally the experimental
results of defect detection.
iii
RESUMEN Esta investigación trata sobre el desarrollo de un sistema híbrido basado en
conocimiento para detectar defectos en documentos digitales, especialmente defectos
que dependen del estilo del diseñador del documento. El sistema híbrido se compone
de un sistema basado en reglas encargado de segmentar y entender artificialmente el
contenido de los documentos, y de un sistema inteligente basado en casos, el cual se
encarga de detectar los defectos. El sistema se desempeña con un 81.6% de exactitud
en la detección de artefactos. La investigación incluye el desarrollo de la arquitectura
del sistema híbrido, la caracterización de los defectos, la metodología para la
segmentación de documentos y para extraer el conocimiento implícito en el
documento y finalmente los resultados de nuestros experimentos con el sistema de
detección de defectos en documentos digitales.

iv
©Hector J. Santos-Villalobos 2005

v
Dedicated to:My God, family, and friends

vi
ACKNOWLEDGEMENTS First I have to give all the credit to my Lord, because from Him I receive the
strength and the wisdom to excel. Second I want to thank my family for their support
in all times. I really like to recognize the labor of my advisor, Dr. Jose Fernando Vega.
I have no words to express my gratitude; thanks for believing in me, for your patience,
for your extra time, for your backup, and for giving me your friendship.
This successful two-year journey on my master’s degree was possible thanks to the
help of the people mentioned above, although there are other professors, friends, co-
workers, and roommates that enriched my academic and personal life during this time.
I have to bring up the Digital Publishing Research team, Dr. Wilson Rivera, Dr. Nayda
Santiago, Dr. Manuel Rodriguez, Dr. Jan Allebach, Dr. Sam Midkiff, Dr. Allen
Braunsdorf, Tatiana Avellanet, Xiaojun Feng, Amado Pereira, Wilson Lozano,
Gustavo Chaparro, Qiao Mu, Ariawan Suwendi, and Guatam Upadhyaya. Thanks for
the challenges! We have made a great team!
This joint research between Purdue University and the University of Puerto Rico at
Mayaguez was made possible by HP Puerto Rico and HP Labs. I have to thanks Lou
Witkin, Gary Vondran, Henry Sang, and Hui Chao for their collaboration and support.
I want to highlight one of my mentors and friends, Xiaofan Lin, an HP Labs researcher
involved in this investigation. He has provided me valuable advice and guidance
throughout this research.

vii
Finally I want to mention the people that placed all their effort, dedication, and
skills to carefully review this thesis. They are Dr. J. Fernando Vega, Dr. Xiaofan Lin,
Dr. Wilson Rivera, Dr. Nayda Santiago, and Dr. Yolanda Ruiz.

viii
TABLE OF CONTENTS
ABSTRACT.............................................................................................................................ii
RESUMEN ............................................................................................................................ iii
ACKNOWLEDGEMENTS........................................................................................................vi
TABLE OF CONTENTS ........................................................................................................ viii
TABLE LIST...........................................................................................................................xi
FIGURE LIST ........................................................................................................................xii
1 INTRODUCTION ............................................................................................................ 1
1.1 The problem......................................................................................................... 2 1.2 The framework..................................................................................................... 4 1.3 Insight about knowledge-based systems........................................................... 6
1.3.1 Declarative programming............................................................................................. 6 1.3.2 Case-based reasoning................................................................................................... 7
1.4 Main Contributions.............................................................................................. 8 1.5 Next chapters ...................................................................................................... 9
2 LITERATURE SURVEY .................................................................................................. 10
2.1 Document content segmentation and analysis................................................ 11 2.2 Digital Document Artifact Characterization...................................................... 16 2.3 Knowledge representation and inference ........................................................ 18 2.4 Chapter Review ................................................................................................. 20
3 THE ARCHITECTURE OF A HYBRID KNOWLEDGE-BASED SYSTEM.............................. 23
3.1 The Automated Digital Publishing Preflight Model.......................................... 24 3.1.1 DP’s processes........................................................................................................... 26 3.1.2 The intent module ....................................................................................................... 27 3.1.3 The preflight process .................................................................................................. 28 3.1.4 The artifact recognition tool ....................................................................................... 28
3.2 Knowledge-Based Artifact Recognition Model ................................................ 32 3.2.1 K-BAR Tool Manager................................................................................................. 33 3.2.2 Input .......................................................................................................................... 34 3.2.3 XSL-FO Parser........................................................................................................... 35 3.2.4 Page Segmentation and Analysis................................................................................. 36 3.2.5 Anomaly Case Representation..................................................................................... 37 3.2.6 Case Matcher ............................................................................................................. 37 3.2.7 Output........................................................................................................................ 38 3.2.8 Update Cases ............................................................................................................. 38
3.3 Chapter review .................................................................................................. 39

ix
4 DESIGN PRINCIPLES.................................................................................................... 41
4.1 The roots of document design.......................................................................... 42 4.2 White space principle........................................................................................ 43 4.3 Unity principle ................................................................................................... 46
4.3.1 Similarity Principle .................................................................................................... 46 4.3.2 Contrast Principle ...................................................................................................... 47 4.3.3 Proximity Principle .................................................................................................... 48 4.3.4 Repetition Principle.................................................................................................... 48
4.4 Chapter review .................................................................................................. 50
5 DESIGN PRINCIPLES FOR PAGE SEGMENTATION AND DOCUMENT UNDERSTANDING........................................................................................... 52
5.1 The analysis cycle............................................................................................. 54 5.1.1 Gathering Geometric Properties in the XSL-FO Parser module................................... 55 5.1.2 Getting strong lines .................................................................................................... 59 5.1.3 Creating Logical Units ............................................................................................... 63 5.1.4 The assignment of logical types to components............................................................ 66
5.2 Chapter Review ................................................................................................. 69
6 ARTIFACT RECOGNITION WITH CASE-BASED REASONING........................................ 71
6.1 Artifact Characterization ................................................................................... 71 6.1.1 Artifact features.......................................................................................................... 76
6.2 Personalized Analysis Criteria Reviewed......................................................... 86 6.3 Applying Case-Based Reasoning..................................................................... 88
6.3.1 Artifact Case Features................................................................................................ 90 6.3.2 Case matching............................................................................................................ 92 6.3.3 Learning with case-based reasoning ........................................................................... 97
6.4 Chapter Review ............................................................................................... 100
7 TESTS, RESULTS, AND ANALYSIS.............................................................................. 102
7.1 System performance measurements.............................................................. 102 7.2 Document Segmentation and Understanding................................................ 103
7.2.1 Strong Lines ............................................................................................................. 103 7.2.2 Logical units and logical component types ................................................................ 104
7.3 Artifact Recognition ........................................................................................ 106 7.3.1 Typeface change artifacts ......................................................................................... 111 7.3.2 Missing-components ................................................................................................. 114 7.3.3 Overlapping artifacts................................................................................................ 115 7.3.4 Lack-of-white-space artifact ..................................................................................... 117 7.3.5 Overall Performance and false alarms...................................................................... 118
7.4 Chapter Review ............................................................................................... 121
8 CONCLUSIONS.......................................................................................................... 123
8.1 System limitations........................................................................................... 123 8.2 Contributions................................................................................................... 124
8.2.1 Document segmentation and understanding .............................................................. 125 8.2.2 Artifact recognition .................................................................................................. 125

x
8.3 Future work...................................................................................................... 126 8.3.1 Architecture.............................................................................................................. 127 8.3.2 Document segmentation and understanding .............................................................. 127 8.3.3 Artifact recognition .................................................................................................. 128
8.4 Achievements.................................................................................................. 129
9 REFERENCES ............................................................................................................. 130

xi
TABLE LIST Table 1: Supported XSL-Objects and their respective attributes ................................56 Table 2: Artifact Features..........................................................................................80 Table 3: Features Measurement.................................................................................83 Table 4: Artifact features categorization and case matching equations.......................91 Table 5: Example of the NNA: Features Values ........................................................95 Table 6: Weights Configuration ..............................................................................109

xii
FIGURE LIST Figure 1: The Automated Preflight Model.................................................................25 Figure 2: Sub-Module Architecture...........................................................................30 Figure 3: Independent Module Architecture ..............................................................30 Figure 4: Web Architecture.......................................................................................31 Figure 5: Knowledge-Based Artifact Recognition Model ..........................................32 Figure 6: Reversible figure/ground relationship.........................................................44 Figure 7: Ambiguous figure/ground relationship .......................................................45 Figure 8: Strong Lines examples ...............................................................................46 Figure 9: Repetition and Proximity Examples ...........................................................47 Figure 10: K-BAR System Architecture: Page Segmentation
Module Highlighted ..........................................................................................52 Figure 11: Flow Chart for the Document Segmentation and
Understanding Processes ...................................................................................54 Figure 12: Simple example of a XSL-FO tree............................................................57 Figure 13: Geometric properties extraction pseudo-code ...........................................57 Figure 14: Strong line - a business card used for the example....................................59 Figure 15: Strong line - left, center and right suitable coordinates detected................60 Figure 16: Strong line - place possible strong lines in suitable coordinates ................61 Figure 17: Strong line - leave valid strong lines.........................................................62 Figure 18: Logical units - units from strong lines ......................................................63 Figure 19: Logical units - break strong line unit in pairs units ...................................64 Figure 20: Logical units - keep closer components together.......................................65 Figure 21: Logical units - final units..........................................................................66 Figure 22: Logical type - example with section headings and paragraphs ..................67 Figure 23: Logical type - document after logical unit assignments.............................67 Figure 24: Logical type - headings and paragraphs identified ....................................68 Figure 25: Artifacts Taxonomy Part 1 .......................................................................72 Figure 26: Artifacts Taxonomy Part 2 .......................................................................72 Figure 27: Artifacts Taxonomy Part 3 .......................................................................73 Figure 28: Artifacts Taxonomy Part 4 .......................................................................73 Figure 29: Style-dependent artifact example..............................................................75 Figure 30: Visual example of components in evaluation and
their respective equivalent component ...............................................................77 Figure 31: Document Taxonomy and Type Difference measure example ..................84 Figure 32: Artifact Recognition Case-Based Reasoning Processes ............................89 Figure 33: Arrangement of Artifact-Cases within the feature axes .............................92 Figure 34: Example of the NNA: Simple graph with two features .............................94 Figure 35: Case matching process pseudo-code.........................................................96 Figure 36: CBR Learning - Graphic Interface Prototype............................................98 Figure 37: Strong lines layout test samples - part one ..............................................103 Figure 38: Representative examples of detected strong lines ...................................104 Figure 39: Example of a test sample for the logical units and types assignment .......104

xiii
Figure 40: Test samples distribution........................................................................106 Figure 41: Brochure test samples ............................................................................107 Figure 42: Artifacts in the test samples....................................................................107 Figure 43: Examples of missing-components, lack-of-white-space, and
overlapping artifacts ........................................................................................110 Figure 44: Typeface-family-change artifact.............................................................111 Figure 45: Typeface-style-change artifact................................................................111 Figure 46: Typeface-style-change artifact results.....................................................112 Figure 47: Typeface-size-change artifact results......................................................112 Figure 48: Typeface-family-change artifact results..................................................113 Figure 49: Missing-component artifact ....................................................................114 Figure 50: Missing-component artifact results.........................................................115 Figure 51: Overlapping artifact ...............................................................................115 Figure 52: Overlapping artifact results ....................................................................116 Figure 53: Lack-of-white-space artifact...................................................................117 Figure 54: Lack-of-empty-space artifact results.......................................................117 Figure 55: Overall system performance...................................................................118 Figure 56: False alarms ...........................................................................................119 Figure 57: False alarms per component ...................................................................120 Figure 58: False alarms per instance........................................................................120 Figure 59: Overall performance after removing LOES artifact-case ........................121

1
1 INTRODUCTION From the very early printed book, the “Diamond Sutra”, printed in China in 868
AC, to the invention of the printing press by Johannes Gutenberg in 14401, and finally
to modern digital presses; printing technologies have been undergoing continuous
improvement. The Gutenberg press with its wooden and later metal movable type
printing remained a standard until the 20th century. Today’s printing technology has
reached new heights in the digital era. First, document design turns from a desk with
rulers and pencils to a desktop computer with a keyboard and a mouse. Second, the
traditional press uses plates to create a desired image in the printing material instead of
movable types. Nowadays digital printers make use of the latest technology to place
drops of ink to the printing material and do no longer rely on plates. These substantial
changes in the document design tools and the press machinery have created a
revolutionary commercial field named Digital Publishing.
The purpose of Digital Publishing (DP) is to empower individuals to control all, or
at least most of the publishing processes [14]. Politis defined DP as printing-imaging
processes where the film and/or plate making stages are eliminated (plate-less
printing) and where printing or imaging takes place after the pre-press process [17]. It
is an end-to-end workflow where customers can obtain the desired service on demand.
In other words DP means publishing anything, at anytime, anywhere, and by anyone
[15].
1 This information was gathered from http://inventors.about.com/library/inventors/blJohannesGutenberg.htm

2
One of the significant advantages of DP is the feasibility of Variable Data
Printing (VDP). The essence of VDP is job personalization. It is desirable to reuse the
layout of an existing document page as a template and edit the content of an existing
page by replacing the images, figure illustrations, or modifying a body of text to create
a new page or a new version of the page without going back to the original document
[9]. A job of this type with multiple similar instances is known as a Variable Data Job
(VDJ). With the traditional offset presses it is impossible to print a VDJ and achieve
personalization. Because a plate needs to be created for every job instance, it is not
cost-effective. In contrast, in DP the VDJ remains digital until it is printed on paper.
This allows the modification of the job at any point in the workflow or multiple
variations of it with a minimum cost. For example, if Ford wants to promote sales of
accessories for its cars, the company can search its database for all previous car
buyers. At that point, Ford sends out a name-personalized brochure with the pictures
of the accessories suitable for that individual’s specific vehicle [20]. This type of
service has an outstanding psychological impact on the advertisement recipient.
1.1 The problem
Digital documents and VDJs are created by human designers and humans make
mistakes. Therefore many documents contain defects, such as missing context, wrong
use of metrics (for example the use RGB2 instead of CYMK3 as the document color
space), aesthetically unpleasant context arrangement, infringement of the page
constraints (like a text that exceeds the page margins), image resolution below
2 RGB color is determined by the combination of three colors; red, green, and blue. 3 CYMK color is determined by the combination of four colors; cyan, yellow, magenta, and black.

3
requirements, and so on. Consequently print shops have two processes before sending
any job to the printers: preflight and proofing. The preflight task checks if the digital
document has all the elements required to perform well in the production workflow.
These elements include page file format, image resolution, font types, safety margins,
and mismatched colors. The proofing task is for checking an output before printing.
Conventional proofing is film-based, while soft proofing involves calibrated monitors
and digital proofing printers. This last stage is done today exclusively by human
experts. This dependency on human expertise to ensure the quality of every job, before
it is sent to the digital press, raises a question when dealing with VDJs. If the proofing
expert wants to ensure that all the instances in a VDJ are ready for printing, he/she
should verify each instance of the job. That is a mission impossible, giving that a
single VDJ could contain millions of instances.
The most critical defects found in a VDJ are errors produced by the changes in the
variable data, because they appear after the new instance of the variable data job is
created. Although some of these defects, such as text overflow in a document field, are
obvious like, there are other more subtle defects, including inconsistencies in the style
with regard to the design of a particular VDJ. For example, we cannot determine if a
given document heading with typeface Times New Roman is a defect until we know
that the typeface used by the document designer for his/her headings is Arial. We refer
to this type of error as style-dependent artifacts4. Moreover, the data required to detect
such artifacts are implicit in the document context. While other types of defects can be
4 The term artifact stands for any type of defects in digital documents. It is used through the entire thesis as an interchangeable term with digital document defects and digital document errors.
4
detected by current preflight tools, style-dependent artifacts require a different
approach, which for the best of our knowledge had not been addressed until this
research.
The main goal of this research is to design a framework capable of identifying
defects inside VDJs, especially style-dependent artifacts. To develop such a system we
have followed three consecutive steps: studying and characterizing the defects in
digital variable data documents, finding the most suitable knowledge representation
language for the characterized defects, and establishing the techniques and models to
gather, manage, and process the knowledge used for defect recognition in variable
data jobs.
1.2 The framework
We have determined that the framework for an artifact recognition tool should
consist of document segmentation, extraction of the document’s implicit knowledge,
and finally the detection of artifacts. In the segmentation the system should divide the
document context into logical units. Logical units are groups of components that are
closely related, like an image and its caption, or a heading and its section. The
extraction of the implicit knowledge from the document layout means that the system
should take the logical units created in the segmentation stage and give logical types to
each component in the document. Examples of logical types are chapter heading,
section heading, caption, paragraph, list, and tables. Lastly, the artifact recognition
system uses the knowledge extracted from previous stages to analyze and determine
where the defects are.

5
We determined that a good approach to our problem is a knowledge-based system
that fulfills the segmentation, knowledge acquisition and artifact recognition tasks. So
we have developed a rule-based engine for document segmentation and understanding.
The engine is capable of a partial segmentation of documents and the assignment of
logical types to certain components in the documents. In addition, the artifact
recognition task is implemented as a case-based reasoning system since style-
dependent artifacts can only be detected based on the experience of the proofing
expert. We have implemented each task in an independent module so that in the future
more advanced modules can substitute any existing module in order to improve the
system performance and accuracy.
We are following certain standards and terminology in the framework. The
variable data jobs (VDJs) are created using the XSL-FO5 (eXtensible Stylesheet
Language Formatting Objects) language. XSL-FO is an XML based language that can
format a given set of data for its visual presentation. With this standard, designers can
format information for display on a computer screen, a web page, or a hardcopy.
The system assumes that one instance of the VDJ has already been approved by
the proofing expert. This instance is referred as the approved instance throughout this
thesis, and is used to analyze the remaining instances of the VDJ. The remaining
instances are referred as the instances in evaluation. Finally the components inside
the approved instance and instance in evaluation are called the approved
components and components in evaluation, respectively.
5 More information is found at http://www.w3.org/TR/xsl/

6
1.3 Insight about knowledge-based systems
A knowledge-based system is a program that simulates human reasoning about a
problem domain. It performs reasoning over representation of human knowledge, and
it solves problems by heuristics or approximate methods which, unlike algorithmic
solutions, are not guaranteed to succeed [12]. Therefore knowledge acquisition and
knowledge representation are the most important tasks when designing a knowledge-
based system. Knowledge acquisition is the transfer and transformation of potential
problem-solving expertise from some knowledge source to a program. Knowledge
representation is a substantial subfield that shares concepts from formal philosophy
and cognitive psychology. It does not deal with the physical details of how knowledge
is encoded, but rather with how the overall conceptual scheme might look like [12].
We acquire knowledge from professional graphic design books to determine if there
exist some rules that could guide the system in order to understand the layout and the
context of a given document. In addition, we represent knowledge using both
declarative programming and case-base reasoning.
1.3.1 Declarative programming
Declarative programming is the formal name for a rule-based knowledge
representation technique. Nowadays programmers are familiar with procedural and
object-oriented programming languages. In procedural and object-oriented
programming the programmer tells the computer exactly what to do. This type of
programming is suitable to problems where their inputs are well specified and where a
known set of steps can be carried out to solve a problem [6]. Rule-based programming

7
is very different from procedural or object-oriented programming. It has, as any other
rule-based engine, its foundation in declarative programming [6]. This type of
programming is more similar to the way people solve daily problems. The
programmer can describe what the computer should do, but omit many of the
instructions on how to do it. In addition, the rules execution sequence depends on the
current inputs and previously executed rules. Moreover, declarative programs tolerate
the absence of some inputs and still come up with possible solutions. In short,
declarative programming or rule-based expert systems can be used to solve problems
without clear algorithmic solutions. This type of programming is often the natural way
to tackle problems involving control, diagnosis, prediction, classification, pattern
recognition, or situational awareness [6]. In this research, declarative programming is
used to implement the rule engine for the document segmentation and understanding
process. Therefore, this section of our research can also be viewed from the pattern
recognition angle.
1.3.2 Case-based reasoning
The first ideas related to case-based reasoning (CBR), were brought by Schank and
Abelson in 1977 [30], when they provided the “script” model. They tried to explain
how memories about events are stored in our brain, and how we use this stored
knowledge when we encounter new events. They proposed that memories were
descriptions of past events or scripts (scripts are equivalent to cases). When new
events are encountered, the brain uses similar events stored in our brain to solve
problems or to determine what to do.

8
In our research, cases represent digital document defects found by proofing experts
and they are called artifact-cases. The experts feed into to the system the artifact
name, and the severity of its effects on the aesthetic quality of the document. The
system places the properties of the defective component in the slots of the new
artifact-case and stores the artifact-case in a case base for future use. The slots
represent each property of the case. For example, the artifact name and the severity of
the artifact are two slots of the artifact-case. The case base is the place where all the
artifact-cases are stored. In document evaluation, when a potential error may be
present, the system searches through the artifact-cases in the case base and determine
if the potential error is an artifact. It is worth noting that the system reaches a solution
based on past detected artifacts.
1.4 Main Contributions
This thesis was intended to assess and design a methodology which ensured that a
VDJ will print correctly. Focused on that goal we developed some techniques that can
be considered relevant collaborations to science, and especially to the DP industry.
Through this thesis we expose the use of design principles to segment and understand
the document context. Moreover we establish a sound architecture for the artifact
recognition system based on a hybrid expert system. In addition we study the defects
that can be found on digital documents and particularly in VDJs. We establish the
properties of defects that are relevant for their characterization and detection. Finally
this thesis gives details on how to measure, manage, and process the artifact properties
in order to achieve an accurate artifact recognition system.

9
1.5 Next chapters
The following chapters explain in detail how we have designed, and implemented
the style-dependent knowledge-based artifact recognition tool. The chapters are
organized as follows: Chapter 2 deals with the exposition of previous research related
and which had enriched this investigation. These previous work are from different
research areas, like knowledge engineering, genetic algorithms, expert systems, signal
imaging processing, document segmentation, document understanding, and hybrid
expert systems. Chapter 3 gives a general description of the research’s framework. It
exposes the architecture of our hybrid knowledge-based expert system. It gives a brief
description of the system modules, the work flow, and the data used for the analysis
and how it is passed on between modules. Chapter 4 explains the rules behind graphic
design, the terminology in the field, and their impact on our research. Chapter 5
describes the use of design principles to segment and understand the document
context. Chapter 6 deals with the characterization of style-dependent artifacts in digital
documents and explains why Case-Based Reasoning (CBR) is our choice for the
artifact recognition task. Chapter 7 exposes the tests used to prove the reliability and
performance of our framework and their results. Finally Chapter 8 gives our last
conclusions about our research and relevant future work to improve the performance
and extend the scope of our framework.

10
2 LITERATURE SURVEY Digital Publishing (DP) is an emerging research field. Therefore there is little
previous published literature for Variable Data Printing (VDP). We have gathered
knowledge and techniques from other research areas and have associated them with
the DP area. Currently many research groups are in a race to find the best solutions for
an automated Digital Publishing system. Nevertheless, there are very few technical
publications. On one hand, this is good because significant contributions can come out
of this research. On the other hand, there were not established grounds to begin with or
to get references about which techniques to consider.
At the time of this writing the system most similar to our proposed investigation is
the Xerox’s Automatic Document Layout6 [15]. This system uses genetic algorithms
to automatically produce aesthetically pleasing customized documents [22], allowing
the contents to change. This program arranges text, pictures, graphics, headlines, and
white space in a document. It can decide the objects’ places based upon sound design
principles, such as alignment, balance, legibility, compactness, text and image
balance, and so on. Their best solution is based on two different methods, the Death
Penalty Approach and the Multi-objective Optimization Approach [15]. This
application aims at VDP jobs and personalized Web documents. Nevertheless this
system is not focused on the detection of errors inside an actual document. It is an
automated document generator instead of an automated document correction
application. 6 Xerox Automatic Document Layout, Xerox Technology and Brand Licensing, http://www.xeroxtechnology.com, Technologies for Graphic Arts and Imaging

11
Many of the tasks involved in VDP are related to other fields. Document content
segmentation and analysis are very common topics in Optical Character Recognition
(OCR), pattern recognition, machine learning, semantic web, automated document
type classification, and so on. Knowledge extraction, representation, and inference are
seen in ontology design, semantic web, artificial intelligence (some examples, rule-
based and case-based expert systems, machine learning, data mining, and genetic
algorithms), and information theory. Several papers and publications were evaluated
in order to get information and techniques that may aid in our research. Even though
we did not find works directly associated to our investigation, they will help us to
extend our concepts, enrich our strategies and adopt standard terminology. The
following sections introduce the previous works reviewed, and describe their areas and
relevance to our research.
2.1 Document content segmentation and analysis
Document content segmentation is closely related to the layout analysis, an
important task for the knowledge extraction and representation in our system. The
techniques and terminology used for document segmentation are very useful to
knowledge acquisition. For these reasons this section summarizes the works on page
segmentation and their relationship with our research.
The study of automated document classification assumes a page layout signature,
which is a set of relevant and invariant layout characteristics allowing the recognition

12
of the document type7 [5]. Researchers usually do not develop general purpose
document classification systems. Instead, they have focused their systems on
particular types of documents [10], like office documents, research papers, table of
content pages, and so on. In many document recognition and classification systems a
parser or a knowledge base is used, but the most common characteristic is that a
human user always defines the production rules used in the analysis at design time [5].
Most of the analysis techniques come from the pattern recognition (especially OCR)
field, in combination with the compilers, and artificial intelligence fields [5]. At the
moment the most common approach consists of two phases: a geometric structure
analysis and a logical structure analysis. The geometric analysis tries to identify
components inside the document page and the logical structure analysis tries to
determine the type of document or the possible source or publisher, given the
geometric characteristics of the components inside the document [5][13]. In the
geometric analysis components are grouped by their shared characteristics. Some of
these components are primary structures because they are directly identifiable by
geometric characteristics of the corresponding text regions, and others are called
secondary structures because these components can be identified through grouping
components together [10].
Researchers have identified a tradeoff between the number of segments and the
outcome of the analysis. A large number of segments lead to better results at the cost
of more information to be handled, more processing time and slower learning
7 Examples of document types are research papers, posters, ads, letters, postal cards, etc.

13
processes. In general, researchers classify knowledge in three different types and used
three different page segmentation strategies [4][24]. The three different knowledge
types are generic knowledge, class-specific knowledge, and publication-specific
knowledge. Generic knowledge deals with the general characteristics of the documents
components. An example could be that the words in a text line should be on the same
base line. Class-specific knowledge assumes that every document type has its own
characteristics, such as no text line being lateral to a graphical object. Publication-
specific knowledge is the constraints proposed or demanded by the application domain
where the document belongs to [4][5][10].
The strategies for page segmentation include top-down, bottom-up, and hybrid
strategies [4][13]. In top-down strategies the page is repeatedly segmented into smaller
and smaller blocks [4]. This approach is document-specific and simultaneously
performs the geometric and logical analysis when using publication-specific
knowledge [13]. In bottom-up techniques basic layout components are created from
the bitmap and then are grouped together into larger blocks based on their
characteristics. They are less document-specific [4]. Hybrid strategies use the top-
down and bottom-up techniques together.
Chao and Fan work with the analysis of document layout to help the
rearrangement of the document content in the presence of variable data. The
electronically originated PDF description is selected over the information extracted
from scanning and OCR because the PDF language provides more information about
the text inside a document (some examples are position, font, color, character spacing,
14
orientation, etc.). The strategy is to segment PDF document pages in three regions;
text, images, and vector graphics. Words with similar alignment, style, and distance
between other similar words are grouped together as a text line. Then adjacency, style
and line gap between text lines are used to determine text segments. They have
reported segmentation errors being found in 18 of the 200 pages. There are some
problems within the segmentation process. One of the problems was encountered in
tables; for example text in different cells were grouped into the same segment.
Another problem was found with the text in maps, text lines that are too close but
indicated different locations where grouped in the same segment. Finally another
problem was with text style changing after a colon; the text lines were grouped in
different line segments when they were supposed to be in the same. This work teaches
us a technique to segment the document contents. In addition, we have taken into
consideration the flaws in their system when developing our algorithms [9].
F. Esposito, et al. [4], make use of knowledge base and other artificial intelligence
techniques for document analysis, in particular, in the layout analysis process. They
represent the knowledge as a tree. The leaves of the tree represent classes and belong
to five different types: text, horizontal line, vertical line, picture, and graphics. The
page will be segmented into areas or blocks which will be classified into one of the
classes. For each block in the page they compute the top-left coordinate, bottom-right
coordinate, height, length, area, and eccentricity. The analysis is executed in two steps.
It starts with a global analysis where paragraphs, sections, columns, figures, and tables
are identified inside the document. Then a local analysis where components identified

15
in the global analysis are analyzed to check if they can be grouped together in a larger
block of the same type. For the local analysis three properties are used: proximity
(adjacent components belonging to the same column/area, and equally spaced),
continuity (overlapping components when the block is expanded horizontally or
vertically), and similarity (components of the same type, with almost equal height).
The continuity property leads to undesired outcomes because of erroneous page
segmentation. Continuity is useful to analyze the document layout but this property
needs to be complemented with other properties [4]. Similar approach is reported in
[3], where D. Malerba, et al. [3] use machine learning techniques to develop a
document layout analysis system trained by human users. The system first analyses the
layout, using the techniques proposed in [4]. The human user then modifies this
analysis, and later the program utilizes the user modifications to improve its accuracy
in future decisions.
Another knowledge-based approach is implemented by K. H. Lee, et al. [13]. They
use the knowledge base to store and represent the different document types with rules.
Their results show an impressive 99.3% accuracy for document segmentation. The
system is composed of three main components: an image analysis system, a rule-based
system, and a rule base. The image analysis system analyzes the scanned image,
segments it, and identifies possible compound components. The rule-based system
collects the information provided by the image analysis module and uses the rules
stored in the rule base to make decisions about the document logical layout
composition [13].

16
An important piece of work is done by F. Esposito, et al. [5] who developed a fully
automated layout detection system. The recognition system is developed as a learning
machine trained by inductive generalization8. Parametric and conceptual learning
techniques are used. The parametric technique focuses on quantitative knowledge and
the conceptual technique deals with symbolic knowledge, like dependencies and
relations. In reality the parametric technique is very similar to the geometric analysis,
and the conceptual technique is equal to the layout analysis exposed before [13][5].
The strategy is to use the information obtained by the parametric system to feed and
contribute to the analysis in the conceptual module. The integrated system improves
the accuracy of the segmentation and decreases the processing time by a 50% when
compared to the processing time of the parametric system alone [5].
2.2 Digital Document Artifact Characterization
At the moment we have not found a complete characterization, taxonomy, or
ontology about types of artifacts in Digital Publishing. Many models have been
proposed for characterizing picture quality, but little work has been done on studying
and characterizing the individual artifacts [16]. Literature on artifacts of video or still
images can be found in [8][16]. These artifacts are generated by hardware defects,
wrong calibration of equipment, loss of information during image compression
processes, quantization errors or incorrect distribution of content on a document page
[8][11][27][28][33].
8 Inductive generalization connotes learning by example.

17
After a comprehensive literature search we have found a number of relevant
artifacts produced by hardware or software. Although the focus of this research is on
software generated artifacts, literature about hardware generated artifacts is also
included in this review because some of their characteristics are very similar to those
artifacts found in images. W. Jang, et al. [27][28], studied hardware generated
artifacts. They classified artifacts in three main groups: defects of uniformity, random
marks or repetitive artifacts, and color defects [27][28]. The artifacts classified in the
defects of uniformity group are characterized by a visible density variation in constant
tone areas that appear as fine pitch banding or streaks [27]. The random marks look
like randomly distributed marks or artifacts; and the repetitive artifacts show repetitive
marks with a fixed interval. The first two groups are commonly detected by their
spatial features; distance, size, quantity, and others [28]. The third group shows color
problems caused by one or more color planes, or by interaction between those planes;
generally it is a hardware problem [28]. Since we focus on digital document artifacts
only this group will be mentioned. Other types of artifacts were found, and most of
them came from the research on defects in compressed images. Alpha-rooting
artifacts are image artifacts generated after an image enhancement using Fourier
transform coefficient rooting and they are caused by well-defined high contrast edges
within the image [11]. Blocking artifacts are a consequence of lack of correlation
between the errors at the common edge of adjacent blocks [8][33]. They appear as grid
noise along the block boundaries in monotone areas [26]. Ringing artifacts are caused
by a truncation of the high-frequency coefficients, and are more evident along sharp
edges in low energy areas of the image [26]. Blurring artifacts in compressed images

18
are commonly caused by a tradeoff between bits to code resolution and motion and
appear as a reduction of sharpness of the edges and spatial detail [16]. Another type of
artifacts is the physical noise artifacts9. They are an uncontrolled or unpredicted
pattern of intensity fluctuations that adversely affect the quality of the video image
[16]. Mosquito noise and quantization noise are the most common examples of this
type of artifact. The mosquito artifact is perceived as a form of edge busyness
characterized by moving artifacts in a video image or blotchy noise patterns
superimposed over objects [16]. Quantization of the pixel values in the image leads to
quantization artifacts; they look like a random noise through the whole image and can
be gray or colored noise, but are not uniform [16]. However no style-dependent
artifact literature was found. These artifacts should be studied and characterized by the
evaluation of variable data document samples.
2.3 Knowledge representation and inference
Inference machines are necessary to extract, manipulate and process acquired
knowledge. This section will discuss relevant work on the implementation and
development of these types of systems.
S. Bandini, and S. Manzoni present the integration of two Artificial Intelligence
techniques, Fuzzy Logic (FL) and Case-Based Reasoning (CBR) to help race
engineers to determine the best chemical compounds for a racing tire tread. The hybrid
system is employed when an experienced race engineer finds an unusual problem. He
may recall similar past cases and find the solution based on how those cases turned
9 The original name for this type of artifacts found in [16] is physically noise artifacts
19
out. FL’s strength is its tolerance to imprecision, which can be exploited to achieve
tractability, robustness, low solution cost, and better rapport with reality. CBR’s main
purpose is to store and characterize past events. It uses a two step process to find the
solution. The first step performs a reduction of the set of cases to be compared to the
current case in the second step. The second step applies a function giving a measure of
similarity among cases. In this system, the similarity function has been defined as the
weighted sum of differences between attributes, where some of the attributes are the
result of a fuzzy interpretation of user’s inputs [21].
T. A. Mostek, et al. [24], propose a new method for organizing and using case
libraries in analogical reasoning. The idea is to store the facts of all cases in a general-
purpose knowledge base, and automatically extract relevant subsets of knowledge for
reasoning, based on task constraints [24]. The system consists of a two-step process.
The first step extracts the case facts from the knowledge base, given the target entity
and a query about that entity. In the second step the case facts are expanded, and more
information is added to help the matching function decide between competing sub-
matches. This approach has three advantages: simplified knowledge authoring,
because concrete and specific facts can be added without task-case dependency (static
case content); more efficient CBR, because the contents of a case are gathered at query
execution time eliminating irrelevant facts; and high efficiency dealing with a large
number of cases [24].
R. H. Chi and M. Y. Kiang introduce a new hybrid reasoning method that
integrates artificial intelligence rule-based (RBR) and case-based reasoning

20
techniques. The expert system is used to decide what percentage of raise should be
given to an employee, based on the raises given to employees with similar job
background. The past knowledge was represented in the CBR. The RBR is used for
case abstraction and generalization. If two different jobs share the same salary value,
then the RBR tells the CBR to interpret cases with these job types as the same job
type. The cases are composed of three types of slots: critical slots, common slots, and
decision slots. For a successful match the critical slots in the case in evaluation
(potential matches or other employees) should be equal to those slots in the target case
(the employee in consideration for a raise). The common slots are extra information
used to improve and add detail to case matching. The decision slot will contain the
solution to the problem, like the raise percentage [18].
2.4 Chapter Review
This survey on previous work over a diversity of areas not directly related to the
Digital Publishing field is a great source to nourish our research. Therefore we would
like to highlight some of the most relevant research projects and their direct impact on
our investigation.
About design principles we can underline Xerox’s work on an automated
document generator [15][22]. That research tells the importance of the design
principles for document understanding. The work done by Esposito, et al. [4] also
points out the principles on design. Another investigation that indirectly highlights the
importance of design patterns in a document layout is about the recognition of the

21
page layout type [3]. It proved that each document type has its exclusive
characteristics that can be used to identify one type from others
Document segmentation research helps to clarify the approaches we can use to
segment the document page. We would like to emphasize the following works and
techniques. First, hybrid approaches involving both geometric and logical analysis are
popular in document segmentation. The geometrical analysis is in responsible for
gathering the position, size and other physical properties of the page components, and
the logical analysis is responsible for gathering the components types and it infers
knowledge about the components in the page using the information from the
geometric analysis. This same methodology is adopted in our system and will be
explained in subsequent chapters. As mentioned earlier, another valuable reference is
the work done in [9]. Their strategy leads us to use XSL-FO as our document
formatting language, because this language keeps even more information about the
layout of the document than PDF.
On the knowledge-based system topic, we have paid attention to the following
works. The hybrid expert system done by Bandini and Manzoni influences the way we
design our case-based expert system [21]. Although we do not use fuzzy sets, we deal
with several symbolic attributes; therefore we have adopted the strategy of this work
to convert the symbolic knowledge to quantitative data. Another important work was
found in [18]. This work emphasizes the use of categorized case slots. Although we do
not directly copy the strategy, that research helps us to identify which slots are more
relevant for the case matching process and therefore assign the slots a larger weight.

22
This literature survey helps us to avoid methods that have a high probability to
failure. It also helps us to enhance and reinforce the theoretical background of this
investigation. As can be seen in subsequent chapters, our research is greatly influenced
by the works described in this chapter.

23
3 THE ARCHITECTURE OF A HYBRID KNOWLEDGE-BASED SYSTEM
Hybrid systems are potential powerful tools that have proven to address and solve
problems that are just too complex for conventional approaches. When we talk about
hybrid systems, we are referring to knowledge-based systems which make use of more
than one type of knowledge representation or inference technique. Our system
integrates rule-based and case-based artificial intelligence techniques. As explained
earlier rule-based reasoning (RBR) [30] systems are for problems where the theory of
the underlying problem domain can be well defined. On the other hand, case-based
reasoning (CBR) [30] finds solutions to problems from past experiences and there is
no need of a well defined problem domain.
Our problem domain is to design a tool capable of detecting defects on digital
documents. To solve this problem it is necessary to understand the rules of document
design. Particularly we are not experts in document design, but there exist some well-
accepted rules on how to avoid an aesthetic flaw. These rules are sufficient for our
purpose and are suitable for a rule-based expert system. Nevertheless, there are some
ambiguities in the design principles that can not be covered by a rule system. For
example, determining the line height of a paragraph cannot be done with a rule or
formula. Moreover, a suitable line height could be determined according to past
experiences with paragraphs by searching through our knowledge base for the line
height assignment that best matches the current typeface family, size, and job type.
For these reasons we have decided to leverage case-based reasoning. With this
24
technique we do not need to fully understand document design principles. Instead, we
just gather particular properties from previous jobs of document components that can
be used to detect defects and inconsistencies within the document original layout
design.
This chapter discusses the hybrid knowledge-based expert system capable of
recognizing defects in variable data documents. The document evaluation is
constrained by the approval of at least one instance of the variable data job, and then
the remaining instances will be evaluated based on that approved instance. We
adopted a knowledge-based system as a solution, because traditionally aesthetic flaws
inside a document are detected by print shop experts. The expert’s knowledge is very
difficult to represent in other programming languages such as Java or C++. Moreover,
the experts’ knowledge is based on past customer’s requirements and design
principles, as well as past subjective evaluations. Consequently, this problem is
suitable for a hybrid system composed of rules and past experiences in the form of
cases.
3.1 The Automated Digital Publishing Preflight Model
Digital Publishing has greatly expanded the market of Variable Data Printing
(VDP) for the printing industry. VDP brings many benefits while it increases the
complexity of the evaluation and verification of digital jobs before they are converted
to their hardcopy version10. The purpose of the preflight and proofing stages is to
make sure that the document is free from errors before it is sent to the press. It may be
10 Hardcopy version refers to the finished printed job on paper plastics, or other materials.

25
impossible for human operators to preflight and prooof every instance of the variable
data job. For this reason it is necessary to automate these processes inside DP’s
workflow.
We have identified three important processes for an automated preflight system.
Two of them already exist in the traditional print shop: the Intent and Preflight. The
third one is new and is called the Artifact Recognition Tool in this thesis. In the
traditional print shop, artifact recognition is is executed exclusively by human experts.
Figure 1 shows a model of the DP’s Automated Preflight Model (APM). These
preflight processes are responsible for capturing, sharing, managing, and analyzing
data about clients and their respective variable data jobs. Although the ripping and
printing processes (processes 6 and 7, respectively), are technically not part of the
APM, we are including them to illustrate the full DP workflow. The job passes
through the APM, then is sent to the rip process, and finally should be passed to the
printer free of defects.
Figure 1: The Automated Preflight Model

26
3.1.1 DP’s processes
The digital publishing workflow consists of several processes. Although each print
shop has a customized work environment, it is reasonable to assume some common
stages: job submission, job verification, and job printing. Digital printing workflows
require a number of sophisticated modules. For example, job submission allows
several options, like the remote transmission via web services and/or a physical
submission in high-capacity storage media (CDs, DVDs, and USB Flash Drives).
Other pieces include scheduling applications and automated workflow management.
Scheduling applications have the responsibility of monitoring and allocating
resources, tracking pending jobs. After making an overall analysis of current and
future processes, the system can prognosticate when it will start a new job, and how
much time it will take to finish the job. This is a very complex application and has a
huge impact on the degree of customer satisfaction and the workflow management
part. However, this module has little effect on the detection of errors inside the jobs.
The workflow management system is very important for efficient use of resources,
and reduction of bottlenecks and system failures. This module and the scheduling
module are quite intertwined, given that their decisions will affect each other. The
Knowledge-Based Artifact Recognition Tool (K-BAR) does not receive metadata
from this module for the artifacts detection analysis, although the results of the K-
BAR analysis are very important for the decisions inside the workflow management
system.

27
3.1.2 The intent module
The intent module is the print shop’s first contact with the clients and their print
jobs. The metadata extracted at this point is very relevant for APM. This stage is
responsible for gathering information about the expected quality of the printed job, the
color system used by the designers, the job type11, and so on. Moreover this module
may gather information about the client’s interests, audience, expertise, organization,
etc. This information can be used by the APM to execute a personalized analysis of
the job.
A personalized analysis criterion of the job is a fundamental part of the artifact
recognition system. The analysis criterion is the cap of tolerance the artifact
recognition tool allows for anomalies found in a given job. Information about the
client expertise (amateur or professional), and the type of job can lead to different
analysis criteria. At the same time the client’s organization and audience are also
considered in evaluating jobs with the same analysis criterion used in similar
organizations. It is pretty obvious that National Geographic magazines require a very
rigorous evaluation (high analysis criterion), while amateur jobs can be evaluated with
a more flexible criteria (low or moderate analysis criterion). This does not mean that
the print shop will give a lower quality of service to amateurs. This means that
amateur’s jobs are usually designed in a way that if a rigorous criterion is used, many
irrelevant errors or artifacts would be detected.
11 Some job types are: posters, greeting cards, business cards, books, magazines, advertisements, etc.

28
3.1.3 The preflight process
The preflight tool’s responsibility is to check if there are missing job components,
incorrect color systems, invalid file configurations or formats, and possible flaws
given the press type and configuration. The press is where the ripping process takes
place. It decodes PostScript, creates an intermediate list of objects and instructions,
and finally converts graphic elements into bitmaps for rendering on an output device
[29]. Many job failures are generated in the ripping process and the average job takes
long time and uses considerable resources to rip. For these reasons it is necessary that
the preflight application verifies the basic requirements.
Preflight applications provide an analysis report, which can be useful for artifact
detection. The preflight results can pinpoint the artifacts in vulnerable areas inside the
document. In this way the workflow manager can send part of the job to the artifact
recognition tool for further evaluation and not the entire job. This may reduce
processing time with a more efficient utilization of resources. This metadata in
combination with the Intent metadata lead the artifact recognition analysis.
3.1.4 The artifact recognition tool
DP has benefited from hardware and software advancements, but there is still a lot
of room for improvements. Preflight applications continue to improve in performance,
quality, and level of automation. This stage is practically free of human intervention.
However, the proofing stage is still executed by human experts, who check a printed
output before the production printing takes place [29]. In this research, we do not
intend to fully automate the proofing stage. We extend the preflight capabilities and

29
reduce human intervention in the DP workflow processes through our artifact
recognition tool
In the APM shown in Figure 1, the Knowledge-Based Artifact Recognition (K-
BAR) module and the Complementary Artifact Recognition (CAR) module are two
conceptual modules of the artifact recognition tool. The K-BAR is designed for
document segmentation, layout understanding, artifact detection, and document design
quality assessment. The CAR is a module reserved for other artifact recognition tools.
Our tool, while powerful, has a limited functionality, because it specializes in the
detection of artifacts which depend on the style of the designer. For this research we
are collaborating with the University of Purdue in developing an artifact recognition
system capable of detecting JPEG compression artifacts, such as blocking, ringing,
and quantization artifacts. Such Artifact Recognition tools are good examples of what
can be implemented as the CAR module.
The DP workflow is designed to have the capability of communicating with
external applications via Web Services [29]. It is expected that the artifact recognition
tools make use of this capability. Figure 2 through Figure 4 show possible
architectures.

30
Figure 2: Sub-Module Architecture
The first architecture in Figure 2 places the CAR as a sub-module called by the K-
BAR. This model is desirable for co-dependent and cooperative analysis of the job. In
the co-dependent analysis, one module generates some data from its own analysis,
passes it to the other module, and waits for a response to make further analysis. This
process iterates until the job analysis is completed. In this way the metadata generated
from one module can enrich the information available to the other module. The
disadvantage of this architecture is that the CAR is an exclusive sub-module.
Therefore neither the K-BAR nor the CAR can be used alone.
Figure 3: Independent Module Architecture

31
Another possible arrangement of the artifact recognition tools is the Independent
Module Architecture as shown in Figure 3. This architecture has the K-BAR and the
CAR modules as standalone applications. The modules can share their results via the
Digital Publishing Automated Workflow Manager (DPAWM), although they can
independently evaluate the jobs. The disadvantage of this architecture is that it can
lead to an information transmission overload in the DP Workflow Manager, if the
artifact detection modules use their analyses as complementary and co-dependent. In a
co-dependent analysis the system share the data from their respective analyses
constantly. Several inter-module data transmissions can consume the DPAWM
computing resources.
Figure 4: Web Architecture
The last one is the Web Architecture in Figure 4. This architecture is really
powerful because it gives a print shop the ability to buy or sell services from or to
other print shops. A suitable communication interface would use web services, but this
architecture can be implemented with any equivalent technology. The print shop can

32
have its own artifact recognition tool, and extend the analysis provided by its tools
with other applications around the world. Moreover, the K-BAR tool uses codified
knowledge for its analysis. Print shops could extend the scope of the K-BAR by
getting new rules and knowledge from other knowledge bases. This architecture
suffers from the same disadvantage of the Independent Knowledge Architecture.
Many transmissions to or from the outside can lead to processing overhead in the DP
Workflow Manager.
3.2 Knowledge-Based Artifact Recognition Model
Figure 5: Knowledge-Based Artifact Recognition Model
The main purpose of the Knowledge-Based Artifact Recognition Model, shown in
Figure 5, is the detection of defects or artifacts generated by inconsistencies in the
document design or style. We call this type of artifacts as style-dependent artifacts.

33
We have found three important steps to develop a successful artifact recognition
system: document segmentation, document understanding, and artifact matching.
Document segmentation is in charge of taking the job’s raw data and starting to group
logically related components given the layout of the document. Chapter 5 gives full
details on these steps. The document understanding process takes the information
provided by the segmentation step and establishes logical types12 for the components.
The artifact matching step deals with the characterization of the inconsistencies in the
document design and matching these inconsistencies with previously found
inconsistencies. This step is part of the case-based reasoning system. Please see
Chapter 6 for more details.
As shown in Figure 5, K-BAR is composed of eight principal parts: the K-BAR
Tool Manager, the Input, the Job XSL-FO Parser, the Page Segmentation and
Analysis, the Anomaly Case Representation, the Case Matcher, the Output, and the
Update Cases. An essential concept in this model is that it is composed of a hybrid
knowledge-based system since knowledge is managed, processed, and represented
with techniques from procedural programming, predicate programming, rule-based
reasoning, and case-based reasoning.
3.2.1 K-BAR Tool Manager
The K-BAR Tool Manager handles and supervises all the processes inside the K-
BAR. This module manages the tasks needed to accomplish artifact detection and the
interaction between tasks. It acts as an internal workflow engine.
12 Some examples of logical types are chapter header, sections header, captions, text, image, and table.

34
3.2.2 Input
The functionality of this module is its capability of communication with the
exterior in order to receive data. This module receives a variable data job and metadata
about the job needed for the analysis or to enrich the analysis. The file format for jobs
used in this research is XSL-FO. This format is very versatile, because it can be used
to format many types of digital documents, such as HTML web pages, PDF, and so
on. We use this format because it keeps the layout information, thus simplifying the
segmentation and document understanding processes.
The Variable Data Printing (VDP) job represented in XSL-FO is stored as
independent files. For each instance of the variable data job, there is an XSL-FO file.
For the proof-of-concept prototype the Input module receives the directory where the
files are placed, and then the system loads all the files and starts the analysis. It is
assumed that all the files start with the same base name, but end with different
numbers. As explained earlier, the Artifact Recognition Tool assumes that one of the
instances has been evaluated and approved by a human expert. The file finishing with
“0” is the approved instance.
The metadata play an important role in this analysis. This data can be received by
this module as an XML file. Some relevant information that can supplement the
analysis is the client type (expert or amateur), the job type and targeted market
(children ad, professional photo magazine, professional physics journal, amateur photo
album, etc.). This information can decide the tolerance of the system to
inconsistencies. Another type of metadata that can be incorporated into the system is
35
the preflight reports or reports from other artifact recognition tools as shown in section
3.1.4. Nowadays preflight tools are very advanced, and for the sake of computational
efficiency we do not want to analyze sections of the job that are already analyzed by
other tools. For example, if a preflight tool analyze an instance of a VDJ, and
establishes in its reports that there is no significant change in the variable data of the
instance, the K-BAR can skip this instance and analyze other instances with
significant layout changes. Finally the metadata can guide the system to areas that do
not appear to have errors or areas that need further analysis.
3.2.3 XSL-FO Parser
The XSL-FO Job Parser takes an XSL-FO file and extracts the geometric
information and properties of the components, and represents them in a data structure
suitable for the system. Since XSL-FO is an XML-based language we can search the
XSL-FO nodes with Apaches’ Xerces213 xml parser. We use Xerces2’s Document
Object Model14 (DOM) data structure to represent a variable data job as a document
tree. The methodology used to search the tree was the top-down strategy. The system
starts the analysis in the root node and finishes it in a terminal node or leaf. Because to
extract each node’s properties it is required to have at any given time the properties of
the node parents, siblings and children. Properties are relationships between
components or inherited from parent nodes.
We have not achieved full compliance with the latest XSL-FO standard. However,
the XML Parser is designed using polymorphism techniques in order to make it easy 13 More information on Xerces2 at http://xml.apache.org/xerces2-j 14 More information on DOM at http://xml.apache.org/xerces2-j/dom.html

36
for future developers to add new XSL-FO formatting objects. In this project we are
evaluating Variable Data Jobs of one page length and arbitrary page size. Jobs can be
composed by images and text. XSL-FO can be used to define the components’ size,
location, alignment, and other specific properties like text typeface. We impose a
constraint regarding the parameters of each object. All the numbers used in the XSL-
FO file are assumed to be integers.
3.2.4 Page Segmentation and Analysis
The Page Segmentation and Analysis module takes the information extracted by
the Job XSL-FO Parser to subdivide the document in groups of components related to
each other. It is composed of two important modules: the Geometric Analysis and the
Design Rules. These two modules are co-dependent. The Geometric Analysis module
extracts explicit knowledge from the components, such as position, dimension, text
size, text typeface, and so on. The Design Rules module is a rule-based expert system.
It uses the information provided by the Geometric Analysis to determine the
relationships between components in order to obtain implicit knowledge from the
document layout, like headers, captions, footnotes, image-caption relations, and so on.
From this analysis logical units or groups of components are determined. The
components in these units are strongly related and we expect that the same component
properties appear consistently trough the instances. When some inconsistency in the
document design is found the module flags the change as an anomaly. An anomaly is
a potential artifact.

37
3.2.5 Anomaly Case Representation
The Anomaly Case Representation takes the analysis provided in the Page
Segmentation and Analysis module. Its responsibility is to characterize the anomalies
found in the previous module. Each anomaly is represented as a case. A case base of
artifacts is developed for the artifact recognition framework. The components in the
damaged instance are associated with a corresponding component in the approved
instance. When anomalies are found the changes between the properties of the
damaged and the approved components are characterized. Some of the features used to
characterize the artifacts are: page white space change, component size change,
component dimension changes, distance changes, components relations changes, and
logical type changes.
3.2.6 Case Matcher
The Case Matcher module is in charge of searching through the artifacts case base
and tries to find a match for the anomaly characterized in the previous process. We use
the k-NN algorithm (Nearest Neighbor Algorithm) to match cases. Artifact-cases and
anomaly-cases have the same features. The system measures the similarity between
the anomaly-case and the artifact-cases in the case base. The closest artifact case is
considered a potential match. If the similarity is above a given threshold, the anomaly-
case is considered an artifact similar to the matched artifact-case. If the similarity
value is below the threshold the anomaly-case is considered free of defects.
The stored artifact-cases include additional features such as a severity rating and
the artifact name. These features are not used for the case matching. Other systems can

38
use this information to create preflight reports, with the name of the artifacts and its
severity rating. The artifact name and the severity rating are given by a human expert
at the time of adding a new artifact-case to the case base. In addition this information
can be used by the DP’s Workflow Manager to make decisions about whether to send
the job back to the client to fix errors or just send the job to the next process.
3.2.7 Output
The Output is another communication module. This module informs the DP
Workflow manager when the artifact recognition tool has finished its analysis. This
module gathers all the data generated from the detection analysis and transmits it via a
Web Service to the DP Workflow Manager, to other artifact recognition tool, or to a
storage device15.
3.2.8 Update Cases
The Update Cases module is used to add new cases in the artifact case base. This
module receives an approved instance and a damaged instance. The module extracts
the features of the damaged and approved components and calculates their differences.
Then the human expert determines the name and severity rating of the artifact. A list
of possible artifacts names is provided to avoid calling the same artifact with different
names, although the operator can add new artifacts names if the name is not on the list.
Future extensions to this module include providing the human expert with a severity
rating if he/she understands the given rating is not suitable for the artifact he/she can
change it.
15 Some examples of storage devices are: databases, xml files, file archives, etc.

39
3.3 Chapter review
This chapter describes a powerful tool that is designed as a hybrid knowledge-
based system composed of rule-based and case-based reasoning. Rule-based
techniques are used to code graphic design principles in order to segment and
understand the document contents, and to extract the data needed to create the
anomaly cases. Case-based techniques are used to represent and store past knowledge
about known artifacts. The combination of these two systems helps in the detection of
artifacts in digital documents. We call such system the Knowledge-Based Artifact
Recognition (K-BAR) tool.
The K-BAR tool is important inside the Digital Publishing workflow. This
architecture can be enhanced with the addition of new modules, the improvement of
existing ones, or the implementation of the Web Architecture as shown in Figure 4. In
this research we have kept the framework as a man-in-the-loop system, because any
system decision should be corroborated by human experts, given the subjectivity of
the problem.
Automated artifact recognition is new, just as the general digital publishing area.
This architecture is the first step in solving a problem that had been traditionally
executed by human experts. This section makes a number of key contributions. First,
we have established the personalized analysis criteria, which give the K-BAR a certain
amount of tolerance to inconsistencies (Section 3.1.2). Second, the models for external
communication via Web Services provide print shops with the ability of buying or
selling services (Section 3.1.4). Finally, the steps for artifact recognition are described
40
(Section 3.2.4 to 3.2.6). The K-BAR framework is versatile and flexible. It allows
future knowledge sharing, knowledge reuse, task sharing, task distribution, and web
integration.

41
4 DESIGN PRINCIPLES One profession which involves highly subjective decisions is the career of graphic
design. The Graphic Arts Industry is influenced by fashion, personality, style, culture,
and market sector. Fashion is a superficial condition adopted by those anxious to
appear elegant and sophisticated [30]. Personality involves the personal traits of the
designer. Style is derived from the real needs of the clients or society [30]. Culture
implicates the traits of an organization, community, or group. Finally the market sector
is the group or entity to which the design will be addressed. All these factors are
significant at the moment of choosing the best and suitable design. Graphic artists are
skillful people that work very hard to elevate their creativity to the utmost, in order to
fulfill their clients’ needs, extend the scope of their audience, and excel in a very
competitive market. Therefore it is important for every graphic designer to develop
his/her unique piece of art. Moreover each artist should make his/her own designs
distinctive from other designers.
Each designer’s style is subjective and exclusive, although there are some common
rules, principles, or guidelines that experts follow at design time. We found that
connoisseurs of this topic emphasize that graphic design is not a mysterious science
exercised by the privileged few. They understand that graphic design is a procedure
that combines learned skills, value judgments and logical reasoning [25]. We took the
task to evaluate these principles in order to use them as a foundation for the techniques
used in page segmentation, document understanding, and artifact recognition.

42
This chapter is dedicated to explain the basics of document design which were
gathered from professional graphic arts literature and books. These principles include
rules, hints, advice, and vocabulary from the field. Finally at the end of the chapter we
review the concepts behind design principles and their impact on document
segmentation and understanding.
4.1 The roots of document design
Our main task was to detect defects in digital documents. To fulfill this objective
we needed to find some technique that revealed patterns inside the document layout or
expose the logical meaning16 of each component within the layout. The work done by
Xerox with its Automatic Document Layout [16] application gives us a hint on where
to look. Based on design principles Xerox developed a set of genetic algorithms
capable of measuring the aesthetic quality of a document layout to select the most
suitable page layout given a particular context. In addition some work on document
segmentation reveals that documents are consistent with a pattern called the page
layout signature. This term means documents have a set of relevant characteristics
that can be used to determine their types17 [8]. These last two sources lead us to
establish that design principles give meaning to the document contents. Therefore
design principles were used to find the document implicit knowledge18.
16 Logical meaning connotes the role of a context inside the document, for example section, chapter, and list headers; image captions; and so on. 17 Some document type examples are: letter, sign, business cards, and brochures. 18 The implicit knowledge in a document refers to the logical meaning of components, and the relations between them.
43
The most basic design principle is known as readability, which is a term that refers
to the adequacy of an object to attract readers [30]. Good readability makes the page
comfortable to read, and bad readability makes the page busy. This term can not be
confused with the similar word legibility, which describes the adequacy of an object to
be deciphered [30]. When designers develop a document layout or template, their
objective is to convey a specific message and provoke a specific response from the
audience [25]. The principle of readability establishes that the purpose of a design is
not to the best or most original, but to make the document understandable.
Readability is not a fully subjective design principle. It is a composition of several
sub-principles. Although we had found many quantitative characteristics in the
principles; there is a slight amount of subjectivity at the time of putting the rules in
practice. Next sections explain two main principles needed to achieve a readable
document or design: white space and unity.
4.2 White space principle
White space has more significance than the usual value people give to it and is
considered by many as the most important factor in document design. It provides the
context or physical environment in which a message or form is perceived [30]. In
addition it balances the context; giving the eyes a visual break [25]. In the Graphic
Arts Industry white space has many names. Usually the name represents the use the
artist is giving the white space. It can be known as “negative space”, which is an
equivalent word; contents is seen as positive space or “trapped space”, refers to space
between other elements or “counter-form”, is commonly used by typography experts
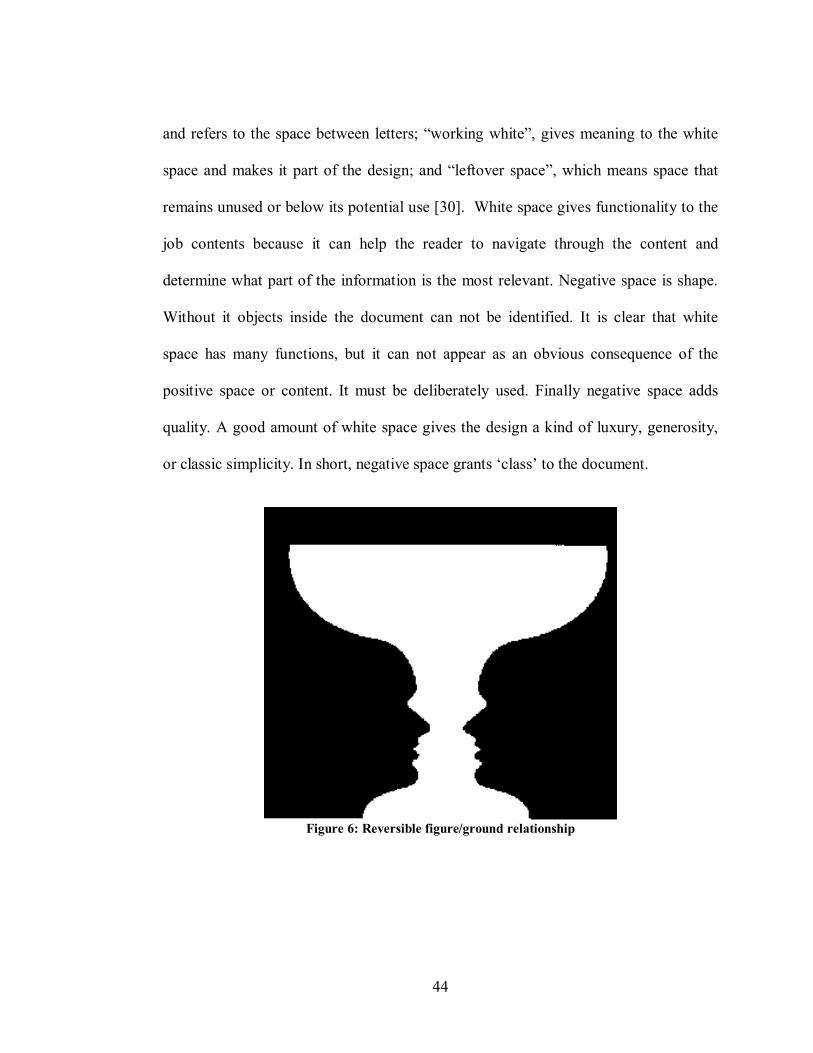
44
and refers to the space between letters; “working white”, gives meaning to the white
space and makes it part of the design; and “leftover space”, which means space that
remains unused or below its potential use [30]. White space gives functionality to the
job contents because it can help the reader to navigate through the content and
determine what part of the information is the most relevant. Negative space is shape.
Without it objects inside the document can not be identified. It is clear that white
space has many functions, but it can not appear as an obvious consequence of the
positive space or content. It must be deliberately used. Finally negative space adds
quality. A good amount of white space gives the design a kind of luxury, generosity,
or classic simplicity. In short, negative space grants ‘class’ to the document.
Figure 6: Reversible figure/ground relationship

45
Figure 7: Ambiguous figure/ground relationship
White Space gives meaning to the objects placed in the page. There exists three
types of figure/ground relationship; stable, reversible, and ambiguous. In the stable
figure/ground relation the spectators perceive the objects as placed in front of the
background; this is the most common relationship. In the reversible figure/ground
relationship the figures and their background can be seen equally (See Figure 6).
Finally in the ambiguous figure/ground relation spectators can not distinguish what is
the background and what is the foreground (See Figure 7) [30]. These concepts are
very important for document segmentation and understanding. A component added to
the document does not explicitly denote whether the component is in the foreground.
Sizes, location, and other document properties are decisive at the time of choosing
what is in the foreground and what is in the background.

46
4.3 Unity principle
Unity is achieved by joining elements and exploiting their potential relationships
and alignments [25][30]. Unity is composed of four sub-principles similarity,
contrast, proximity and repetition.
Figure 8: Strong Lines examples
4.3.1 Similarity Principle
Similarity is also called correspondence [30][32]. It refers to elements that share
similar properties like size, color shape, position, or texture. Alignment is a sub-
principle inside similarity. It is used to unify and organize the components in the page.
There is a term known as strong lines. A strong line is an invisible line that runs at the
edge or center of the aligned components [32]. Figure 8 shows three examples of
strong lines. Strong lines define a relationship between components. Therefore sharing
the same strong line does not happen accidentally. Designers want to keep a relation or
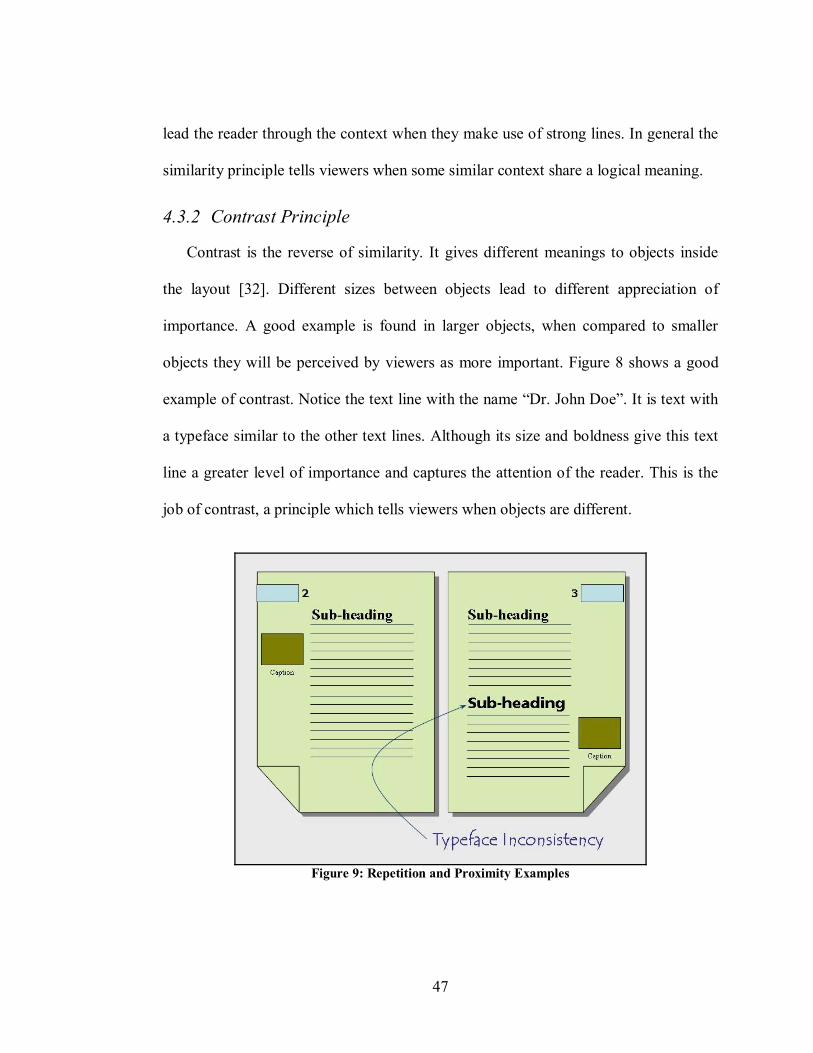
47
lead the reader through the context when they make use of strong lines. In general the
similarity principle tells viewers when some similar context share a logical meaning.
4.3.2 Contrast Principle
Contrast is the reverse of similarity. It gives different meanings to objects inside
the layout [32]. Different sizes between objects lead to different appreciation of
importance. A good example is found in larger objects, when compared to smaller
objects they will be perceived by viewers as more important. Figure 8 shows a good
example of contrast. Notice the text line with the name “Dr. John Doe”. It is text with
a typeface similar to the other text lines. Although its size and boldness give this text
line a greater level of importance and captures the attention of the reader. This is the
job of contrast, a principle which tells viewers when objects are different.
Figure 9: Repetition and Proximity Examples
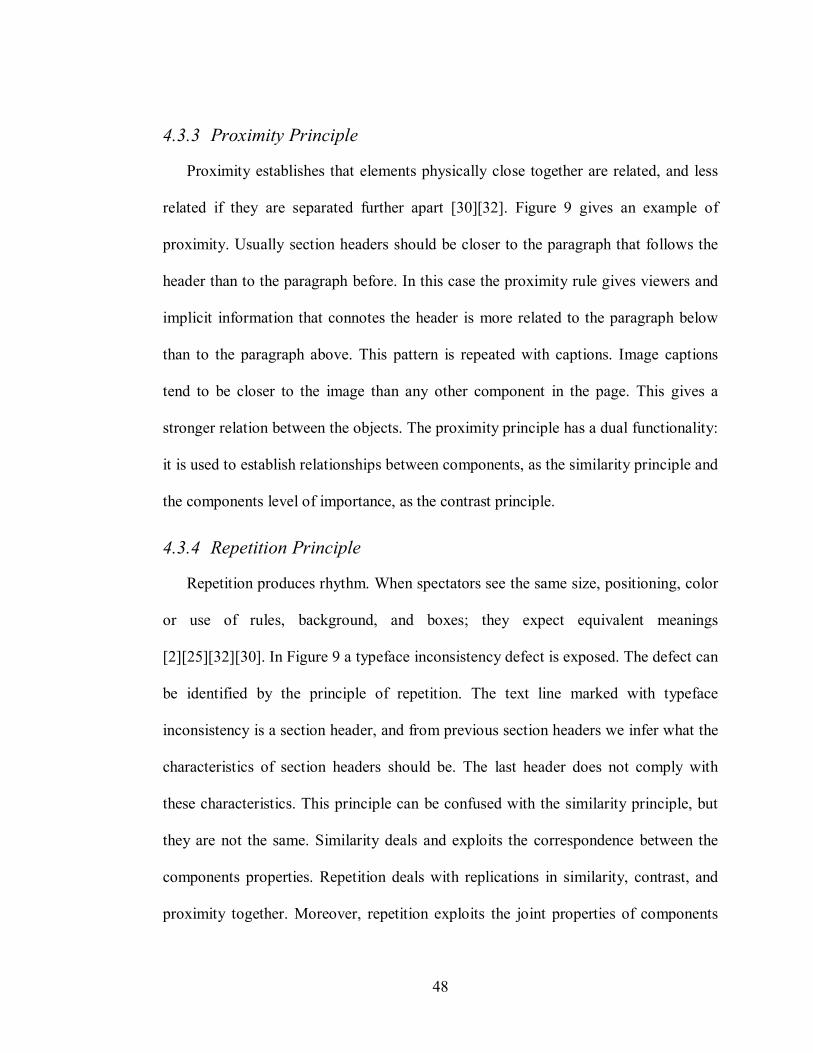
48
4.3.3 Proximity Principle
Proximity establishes that elements physically close together are related, and less
related if they are separated further apart [30][32]. Figure 9 gives an example of
proximity. Usually section headers should be closer to the paragraph that follows the
header than to the paragraph before. In this case the proximity rule gives viewers and
implicit information that connotes the header is more related to the paragraph below
than to the paragraph above. This pattern is repeated with captions. Image captions
tend to be closer to the image than any other component in the page. This gives a
stronger relation between the objects. The proximity principle has a dual functionality:
it is used to establish relationships between components, as the similarity principle and
the components level of importance, as the contrast principle.
4.3.4 Repetition Principle
Repetition produces rhythm. When spectators see the same size, positioning, color
or use of rules, background, and boxes; they expect equivalent meanings
[2][25][32][30]. In Figure 9 a typeface inconsistency defect is exposed. The defect can
be identified by the principle of repetition. The text line marked with typeface
inconsistency is a section header, and from previous section headers we infer what the
characteristics of section headers should be. The last header does not comply with
these characteristics. This principle can be confused with the similarity principle, but
they are not the same. Similarity deals and exploits the correspondence between the
components properties. Repetition deals with replications in similarity, contrast, and
proximity together. Moreover, repetition exploits the joint properties of components

49
and their logical meaning inside the layout. For example Figure 9 illustrates two
document pages. Each page has a page number at the top and outside the edge of the
page. Also between the edge and the page number there is a rectangle. The rectangle
and the text do not share any similarity, aside they are centered vertically. However
the repetition of location, size, typeface and color help viewers to familiarize with the
document structure and easily find the page number when needed; this behavior is
known as the repetition principle. Another good example of the powerful potential of
repetition is found in the newspapers. When you see several newspapers in their
stands, you can rapidly identify your favorite one because of its portrait design; an
impossible achievement if the newspaper administrators change the design every
week. Repetition gives an identity to the document. This principle can be interpreted
as consistency; consistency that will unify all parts of the design [32].
All these principles are always used together. Therefore it is impossible to achieve
a good design based on a single principle. In general we can conclude from the
previous design principles that designers:
• Give similar characteristics to related context;
• Give different characteristics to the document components to send
different messages;
• Arrange and align context consciously and with a purpose; and finally
• Keep a consistent layout pattern to help viewers understand and navigate
through the document.
• These principles combined give meaning and structure to the design.

50
4.4 Chapter review
Design Principles are the backbone of our document segmentation algorithm. The
principles were used in combination and were codified using predicate logic. We
developed as a proof of concept a rule-based expert system which is responsible for
the segmentation of the document and the assignment of logical types to components.
Rule-based expert systems have the peculiarity of non-sequential execution. This
characteristic of the system allows us to use the principles in combination. Most of the
time one principle confirms, validates, or complements the analysis of another
principle. For example determining that a text line is a header of a list by the proximity
principle; is confirmed if that text line has contrast with the list19. Chapter 5 explains
in depth how the principles were used for document segmentation and understanding.
An artist’s end product is a mixture of the design principles exposed through this
chapter. Designers try to achieve creativity in their arts using the principles. For these
reason, if we want to understand the document layout and try to find where the defects
are; we need to segment the document with the same principles used to create the
document. This concept is explained better with the following analogy. A very
common word inside the information security and internet fields is the term
“encrypted messages”. An “encrypted message” is a communication converted to an
illegible format via an encoder before being sent. The receptor of the message can
decode the communication to understand it; if he/she knows the encryption technique.
The process of encoding and decoding are very similar, commonly the last one is a
19 Contrast exists if the header is bold and the list is not.

51
reverse method of the first one. This same concept can be applied to document
understanding and segmentation. The designer encodes the message in the document
layout using the design principles. Therefore the message can be decoded with the
same design principles. In short, we are using the design principles to decipher the
intentions of the designer in order to achieve an accurate automated document layout
understanding.

52
5 DESIGN PRINCIPLES FOR PAGE SEGMENTATION AND
DOCUMENT UNDERSTANDING The document segmentation and understanding module is a very important piece
inside the knowledge-based artifact recognition tool (K-BAR). At the beginning of our
research we tried to design the K-BAR system exclusively from the extraction of
metadata generated by document context changes. Very soon we noticed that for an
accurate document defect analysis we need to extract additional metadata implicitly
stored in the document layout. Thus, we decided to develop a basic segmentation and
analysis tool for single page documents.
Figure 10: K-BAR System Architecture: Page Segmentation Module Highlighted
The segmentation process is the second step inside the K-BAR (See Figure 10).
After the XSL-FO parser extracts the job instance information the segmentation
module uses that information to subdivide the document context into logical units.
Logical units are a group of closely related components and the relation between the

53
components inside the logical unit is stronger than the relation between the
components from different units. The segmentation module is composed by two main
sub-modules, as shown in Figure 10: the geometric analysis and the design rules
modules. These modules collaborate to provide an accurate artificial document
understanding.
The geometric analysis module is implemented in the Java SDK Platform Version
1.420. Its job is to extract explicit knowledge from the data provided by the XSL-
Parser module. The properties gathered from each component in the document are:
component position inside the page, component dimension, text size, text leading, text
typeface, text color, page margins, percentage of page white space, and page
dimension. This module is also in charge of flagging document changes. For this
second task this module uses its data and the data generated by the design rule module.
The design rule module uses the information provided by the geometric analysis to
establish logical units inside the document page. It determines the relations between
components and obtains implicit knowledge from the document layout, like
establishing what is a header, caption, footnote, image-caption relation, and so on. The
design rule module is implemented as a rule-based expert system. The rules inside the
module are the design principles explained in Chapter 4. The programming language
used to codify the module was the Jess21 rule engine (version 6.1.7). Jess is written in
Java, allowing the rule engine to be easily integrated to other Java-based applications.
20 A free programming developer kit can be acquired at Sun official website www.java.sun.com 21 Jess stands for Java Expert System Shell, and it is a registered trademark of the Sandia Corporation. Jess is free for academic use and can be licensed for commercial use.

54
This is especially useful for integrating the rule-based system to our geometric
analysis module.
This chapter is dedicated to explaining in detail the use of design principles to
segment and understand the document context. We have found a strong relationship
between the document segmentation and understanding, and the recognition of defects
produced by the infringement of the constraints articulated in the document layout.
From all the design principles we focus on the repetition, proximity, alignment,
similarity, and contrast principles as the foundation for the strategy in our document
segmentation and understanding tool.
5.1 The analysis cycle
This section explains the processes inside the document segmentation and
understanding module.
Figure 11: Flow Chart for the Document Segmentation and Understanding Processes

55
Figure 11 shows a model of the sequence of tasks in the tool. Every instance of the
variable data job (VDJ) passes through these processes, including the approved
instance, but the approved instance analysis stops after the execution of the Assign
Logical Types to Components process. All the information gathered about the
approved instance at that point is stored in memory for later evaluation of the other
instances based on the approved instance data.
5.1.1 Gathering Geometric Properties in the XSL-FO Parser module
This section deals with the constraints established for the file format of the
variable data document, and the processes involved in the extraction of the geometric
properties of the document instances and their respective components. The data
extracted will be used for the document understanding process.
Supported XSL-FO Objects
Objects Attributes Value Type
Margin-top Integer margin-right Integer
margin-bottom Integer Margin-left Integer page-width Integer
fo:simple-page-master
page-height Integer
text-align “left”, “center”, or “right” width Integer height Integer Left Integer Top Integer color rgb(Number, Number, Number)
background-color rgb(Number, Number, Number) line-height Integer
fo:block
font-size Integer

56
Supported XSL-FO Objects
Objects Attributes Value Type
font-family String font-weight “bold”
font-style “italic”
width Integer height Integer Left Integer Top Integer
fo:block-container
background-color rgb(Number, Number, Number)
width Integer height Integer fo:external-graphic
Src Path of image file
Table 1: Supported XSL-Objects and their respective attributes
The first process to carry out is the extraction of the geometric properties of the
document components and layout. This task is performed by the XSL-FO Parser
module shown in Figure 10. The Variable Data Job (VDJ) document file format used
in this project is the XSL-FO formatting language. The components geometric
properties are extracted from the XSL-FO file, although there is not a fully compliance
with the formatting language. For example the Scalable Vector Graphic format,
SVG22, is supported by the XSL-FO standard, but it is not supported by our test bed.
Instead, graphic objects can be drawn in any application and exported as a JPEG23
image. The JPEG image can be used in our application with the “fo:external-graphic”
object. The objects supported by our research test bed are presented in Table 1. These
22 More information about SVG at http://www.w3.org/TR/SVG/ 23 More information about JPEG at http://www.jpeg.org/
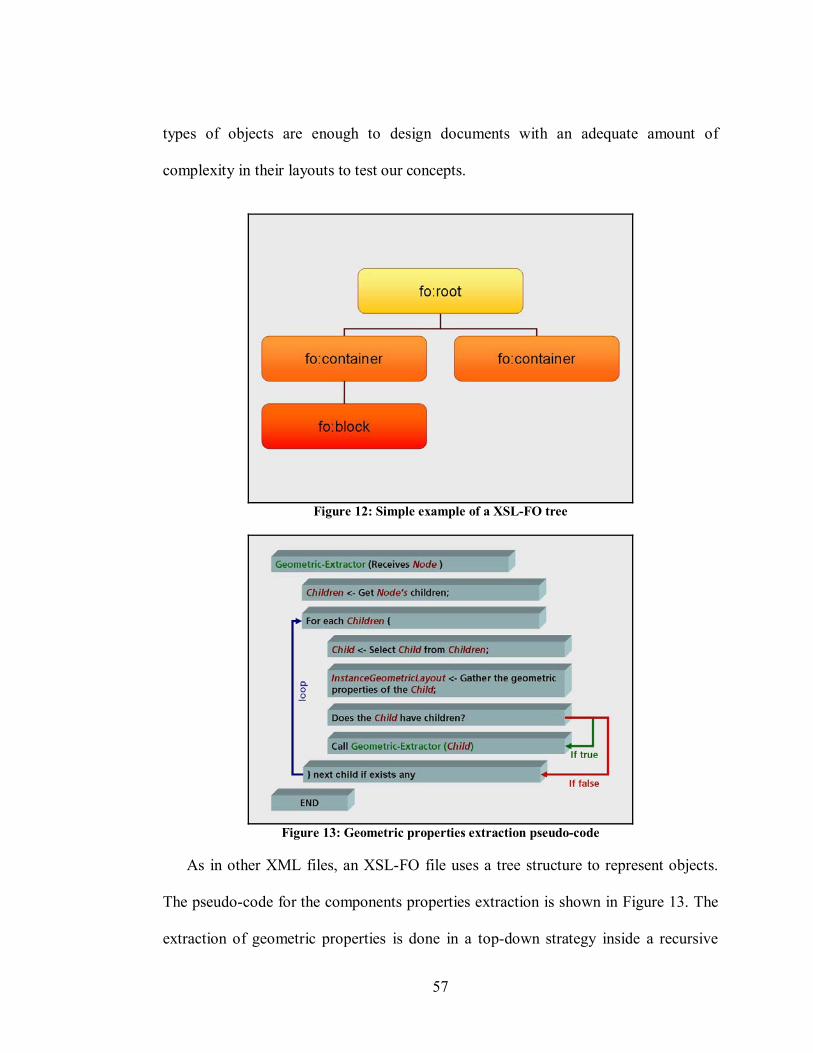
57
types of objects are enough to design documents with an adequate amount of
complexity in their layouts to test our concepts.
Figure 12: Simple example of a XSL-FO tree
Figure 13: Geometric properties extraction pseudo-code
As in other XML files, an XSL-FO file uses a tree structure to represent objects.
The pseudo-code for the components properties extraction is shown in Figure 13. The
extraction of geometric properties is done in a top-down strategy inside a recursive
58
function (called in the pseudo-code as Geometric-Extractor). The recursive function
receives the root node of the file, fo:root (See Figure 12). We call this stage “level-1”
to identify the recursive function calls. After the node is received the children of the
root node are stored temporarily in a list called Children. Each level has its own
Children list. The program selects the first child in the list, which is the fo:container at
the left. After that, the system extracts the geometric properties of the component.
Consequently the program verifies if the node has children. For our example the
component has a child, therefore the system call recursively the Geometric-Extractor
function, sending this time the current node; the fo:container at the left. Now the
process is on “level-2”. The system stores the only child in the Children list; the
fo:block component. The system extracts the component geometric properties and
checks if it has children. The fo:block does not have children, therefore the function
returns to “level-1”. The fo:container does not have more children, consequently the
programs select the next node or child in the “level-1” Children list. The only child
left is the fo:container at the right. The program extracts its geometric properties and
checks if it has children. The fo:container node does not have children, therefore the
system looks for additional children in the “level-1” Children list. The system does not
find any child, consequently the process ends. This process is executed for every
instance of the variable data job and our test samples are composed with a minimum
of twenty nodes.

59
5.1.2 Getting strong lines
We found that detecting strong lines inside the page layout is a good point of
reference to establish relationships between components. In this section we use a
visual example of the process to get the strong lines. This visual representation of the
algorithm24 can be used as a guideline for future extensions or for a different
implementation of the algorithm.
Figure 14: Strong line - a business card used for the example
Figure 14 shows a business card that will be used in this subsection to explain the
establishment of strong lines in the document layout. It is important to notice that
strong lines can exist vertically and horizontally. For a proof of concept we decided to
deal exclusively with vertical strong lines. Therefore the example will consider only
possible vertical strong lines. To find horizontal strong lines the top, middle, and
bottom coordinates of each component should be computed. Then, some current
functions and rules should be modified in order to support the new functionality.
24 Through this thesis the word algorithm is used to imply a step-by-step procedure for solving a problem or accomplishing some end especially by a computer (http://www.m-w.com)

60
However the horizontal strong line detection process follows exactly the same process
used to find vertical strong lines.
Figure 15: Strong line - left, center and right suitable coordinates detected
The first step in the detection of strong lines is to determine suitable coordinates
for possible strong lines. Suitable coordinates for possible strong lines are any
coordinate that is on the left edge, the center, or the right edge of a component. This is
different for components that are explicitly aligned in the XSL-FO file. If the layout
constraints the component to some alignment, the suitable coordinate will be the
coordinate of the specified alignment. In addition, the current system assumes the
language it is working with has a left-to-right reading and writing orientation, like
English and Spanish. For example if the alignment is left, center, or right; the suitable
coordinate for the component is the coordinate of the left edge, the center, or the right
edge of the component, respectively. Figure 15 shows an example of the suitable
coordinates. It can be noticed that the logo on the left of the card has three suitable
coordinates, because it was not explicitly aligned. However the text components on
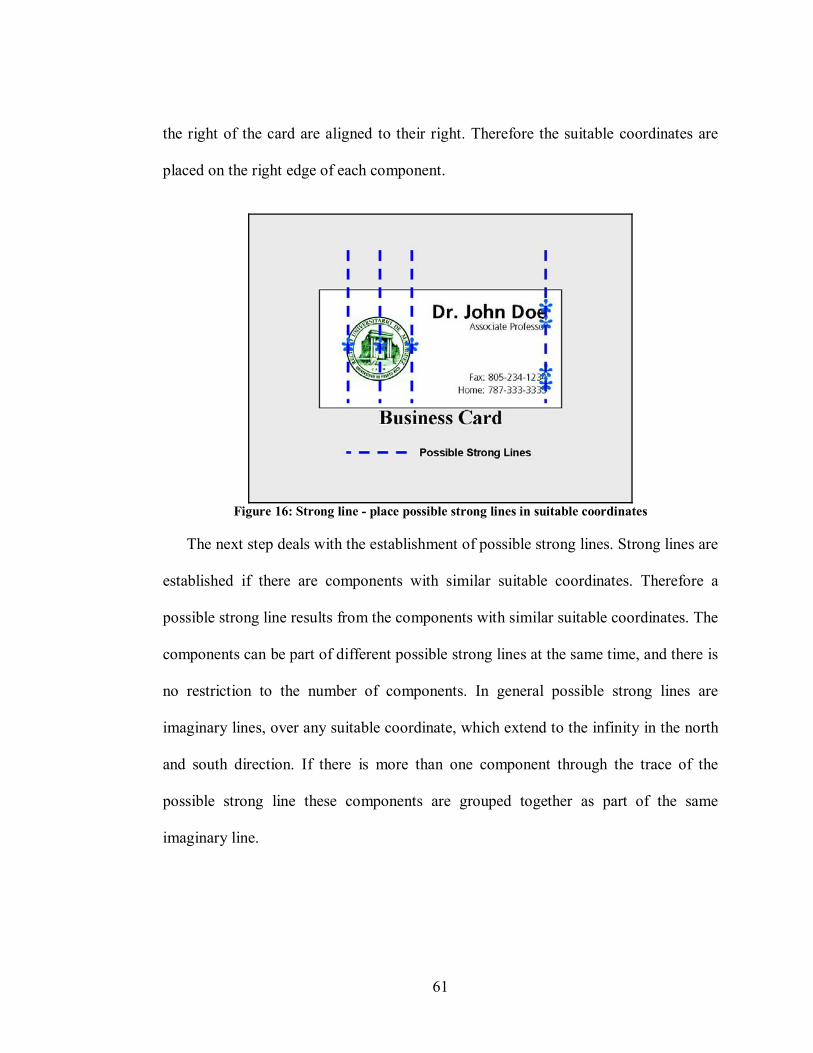
61
the right of the card are aligned to their right. Therefore the suitable coordinates are
placed on the right edge of each component.
Figure 16: Strong line - place possible strong lines in suitable coordinates
The next step deals with the establishment of possible strong lines. Strong lines are
established if there are components with similar suitable coordinates. Therefore a
possible strong line results from the components with similar suitable coordinates. The
components can be part of different possible strong lines at the same time, and there is
no restriction to the number of components. In general possible strong lines are
imaginary lines, over any suitable coordinate, which extend to the infinity in the north
and south direction. If there is more than one component through the trace of the
possible strong line these components are grouped together as part of the same
imaginary line.

62
Figure 17: Strong line - leave valid strong lines
The last step in the detection of strong lines is the removal of invalid strong lines.
An invalid strong line is any line that has less than two components related to it.
Another example of an invalid strong line occurs when two or more strong lines share
the same component. The component is eliminated from the smaller strong lines and
kept only on the large one. Each page can have more than one strong line. When two
strong lines are very close to each other the system measures the distance between
them and if the distance is below 2 points (1 point = 1/72 inch) the rule engine merges
the components into the strong line with more components. If the number of
components is the same the strong line remains is the one at the left. If there are three
strong lines that comply with the 2 pts alignment tolerance the strong line with more
components receives the components in the other strong lines that are inside the 2pts
tolerance. This tolerance to errors in the alignment can be manipulated with the
metadata in the personalized analysis criteria. The system can expect an exact
alignment in jobs from professionals or experts in graphic design, but the tolerance

63
should increase for jobs created by amateur or novice designers. The strong line
guides the viewer through the context. In addition these invisible lines establish and
implicit relation between the components. If we can detect strong lines we can be sure
that the objects that are part of the line are related to each other.
5.1.3 Creating Logical Units
Logical units are the first intervention within the knowledge encoded in the layout.
In this step the system tries to group together the components that have stronger
relationships. This process is based on the proximity and contrast principles. As
explained in Chapter 4, components are placed closer consciously by the designer, and
this short distance between components implicitly means a strong relation. This
section explains how we detect and establish logical units.
Figure 18: Logical units - units from strong lines
Logical units start after the detection of the strong lines inside the document page.
The criteria to determine the first units are: Any component that is isolated is

64
considered a potential unit. Components that belong to the same strong line are
considered a potential unit. These first groups of components are not necessarily the
final logical units. After creating these potential relations is when the proximity and
contrast rules are applied to split units in groups of components with higher cohesion
between them.
Figure 19: Logical units - break strong line unit in pairs units
After the first units have been created the system splits these units in pairs (See
Figure 19). In the final segmentation, a component can not belong to more than one
unit, but at this step they may. In the visual example shown above (Figure 19) it can be
noticed that the unit on the right hand side, initially composed of four components,
was split in three smaller units of two components. This task is done for every unit on
the page with three or more components.

65
Figure 20: Logical units - keep closer components together
The final touch to the units is when the distance between components is measured.
The system selects pairs of units that belong to the same strong line and share a
common component. Then it determines which unit is above and which one is below
(given that we are working with vertical strong-lines only). The distances between the
common component and its partner units are measured for both units. Then the unit
with the smaller distance keeps the component and the other unit it is dissolved. If the
calculated distances are equal, the units are merged together. Figure 20 is a visual
example of the task. It can be noticed that the text component “Associate Professor” is
a common component for the first two units (from top to bottom). The distance from
“Associate Professor” to “Dr. John Doe” is smaller than the distance from “Associate
Professor” to “Fax: 805-234-1234”. Consequently “Associate Professor” is removed
from the second unit and kept by the unit together with “Dr. John Doe”.

66
Figure 21: Logical units - final units
Figure 21 shows the final result of the logical unit processing. It shows that the
business card is composed of five components grouped in three different logical units.
Humans can identify these units with a quick look at the card. Moreover, it is easy for
a human to identify a relationship between the card owner’s name, job position, fax
number, and telephone number. Although the system does not understand the meaning
of the card context as human do; the principles of alignment and proximity make the
system establish these relationships. This is the power of design principles in
document understanding.
5.1.4 The assignment of logical types to components
The assignment of logical types to components is the next step after the system has
established the units inside the page. For our proof of concept we decided to constraint
the assignment of logical types to text, images, headings, and paragraphs. This section
is focus on the elucidation of the use of logical units, patterns, and contrast for the
assignment of logical types to components.
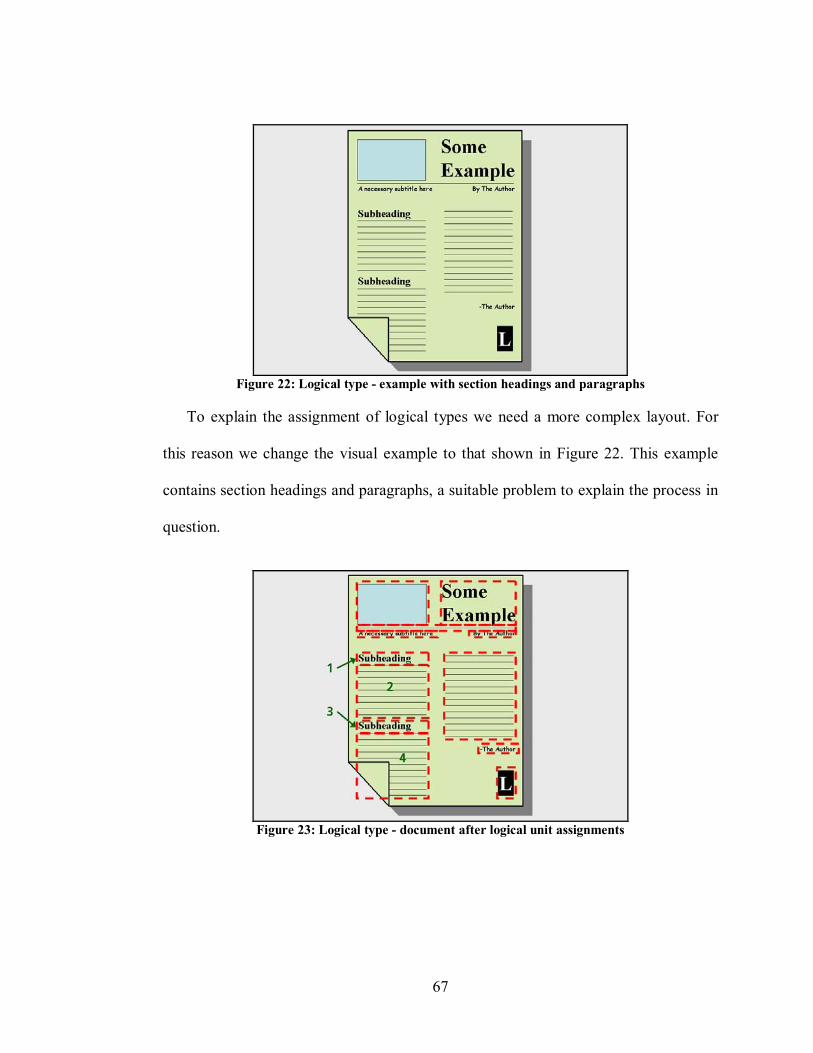
67
Figure 22: Logical type - example with section headings and paragraphs
To explain the assignment of logical types we need a more complex layout. For
this reason we change the visual example to that shown in Figure 22. This example
contains section headings and paragraphs, a suitable problem to explain the process in
question.
Figure 23: Logical type - document after logical unit assignments

68
Figure 24: Logical type - headings and paragraphs identified
After the logical units are allocated the logical type assignment process takes place
(See Figure 23 and Figure 24). The assignment algorithm exploits the patterns inside
the units. To explain this process we will take in consideration the analysis of units [1,
2, 3, 4] exposed in Figure 23. To simplify the example we ignore the remaining units.
The first step is to select three units with the same strong line. At this time if the units
were not merged from previous processes there should be some differences between
the units. The system starts with three units to compare first the distance between units
and keep the pair of closer units for further analysis. This corroborated by the
proximity principle which allows us to assume that closer units have a stronger
relation. In or example the system can select units [2, 3, 4] and [1, 2, 3], but never [1,
3, 4] or [1, 2, 4] because the units should be adjacent to each other. Let us use as
example the selection of units [2, 3, 4]. The distance from unit 3 to unit 2 is larger
when compared to the distance to unit 4. Therefore we continue the analysis with units
[3, 4]. The contrast principles teach us that designers make components different to
keep a relation and at the same time give different meanings and importance to

69
components. The system detects in unit 3 a single line of text, with bigger and
different typeface to the typeface in unit 4. Therefore by the design principles, the
characteristics of the unit lead us to establish that unit 3 is a heading of unit 4. The
system tags the component in unit 3 as a heading and merge unit 3 and 4 (See Figure
24). The system continues to analyze the components in unit 4. If the components are
single sentence components distributed vertically, the group of components is tagged
as a list. If the components are composed of several sentences each component is
tagged as a paragraph. This process is repeated for the remaining units. When there is
not any group left of three consecutive units the system analyzes group of two
consecutive units. Figure 24 shows the final results of the logical type assignments.
This assignment processes can lead to additional features in the system. A rule-
based expert system can be implemented as a complementary unit as shown in Figure
10. This additional system can exploit the pattern produced by equivalent logical
units25 inside the approved instance. If the same logical units do not appear on the
unapproved instances the system can report a layout inconsistency error.
5.2 Chapter Review
We noticed that for an accurate document defect analysis we need to extract
metadata implicitly stored in the document layout. Graphic design experts make use of
design principles to encode a given message in a VDJ. Then we make use of the
repetition, proximity, alignment, similarity, and contrast design principles to decode
25 Equivalent logical units are units with the same arrangement of logical components.

70
the message. From these principles we were able to determine logical units and the
assignment of logical types to components.
This section has presented a solid method for document segmentation and
understanding. This is essential for the artifact recognition system, given that the type
of the components involved in defects are identified by this module, and is very
different to consider all components alike, rather than identify in specific defects for
text, images, graphics, margins, or any other logical type.

71
6 ARTIFACT RECOGNITION WITH CASE-BASED
REASONING Knowledge-based systems are dependent on a good characterization or
representation of the problem in question, in order to manage, process, and analyze the
knowledge adequately. This chapter deals with the characterization of artifacts in
digital documents. Although we are focused on the detection of artifacts that are
closely related to the style of the designer we did not constraint the research to these
types of artifacts. Moreover the chapter exposes relevant characteristics from artifacts
that can be encountered in any type of defect.
The study of artifacts in digital documents was required in order to develop a
system that could recognize errors or aesthetic flaws in the document. With that
purpose, this research focused on the evaluation of a Case-Based Reasoning (CBR)
system for the artifact recognition task. The CBR system is part of the hybrid
knowledge-based artifact recognition tool (K-BAR). This chapter exposes the
processes inside the CBR system and some examples to help understand this approach.
In addition we will discuss the learning capabilities of the system. CBR is a powerful
technique that is based on solving problems using past events. It is claimed that this
approach is appropriate since most of the time experts in the print shops rely for their
decisions on past experiences.
6.1 Artifact Characterization
Artifact characterization is part of the knowledge acquisition stage needed to
represent digital document defects in a machine readable format. Some of the artifacts

72
characterized in this project come from JPEG compression artifacts literature26 and
others came from our own test samples. From the study of some document defects we
created an artifact ontology. The ontology was used to group artifacts by their
common characteristics, to exploit their hierarchical properties and to establish the
features or properties that can be employed to detect the defects.
Figure 25: Artifacts Taxonomy Part 1
Figure 26: Artifacts Taxonomy Part 2
26 See Chapter 2 Section 2.2 for the literature survey about artifacts.

73
Figure 27: Artifacts Taxonomy Part 3
Figure 28: Artifacts Taxonomy Part 4
Artifacts were classified in three main groups; constraint-dependent, component-
dependent, and style-dependent. Figure 25 to Figure 28 show the taxonomy of the
studied artifacts. Constraint-dependent artifacts are defects inside the document that
can be detected by the properties of the page layout. In simple words, if there are some
explicit page formatting constraints, and the component violates those constraints, this
will be considered a constraint-dependent artifact. An example of this type of artifacts
will be a text field with a capacity of no more than one hundred characters where a

74
text string of two hundred characters is going to be inserted; we call this defect a
container-overflow artifact.
Other general category is the component-dependent artifacts. This group of
artifacts is characterized by defects that have no effect on neighboring components.
The defect has a negative effect only in the component where it appears. For example,
component-dependent defects, like blocking-artifacts make an image or text look with
distortion. In the other hand a constraint-dependent artifact like the container-overflow
artifact can shift other components on the page, having a direct effect on other
components in the page.
Finally, style-dependent artifacts are anomalies inside the document layout. This
type of artifact can not be detected with explicit information provided by the
formatting language of the document or by conventional methods. To recognize this
type of artifacts implicit knowledge is needed and the system should become aware of
design patterns inside the document page.

75
Figure 29: Style-dependent artifact example
The detection of style-dependent artifacts is the main goal of this research.
Artifacts such as these can not be detected with simple arithmetic calculations. The
recognition system should take into consideration the style and intention of the
document designer. Figure 29 shows an example of a style-dependent artifact,
specifically a font-change artifact. This type of defect is impossible to detect
evaluating the component alone. There is no overlapping, or overflow. The component
meets all the constraints imposed by the layout, nevertheless there is an artifact. To
solve this problem the system should have some background knowledge about the
layout design to make decisions. Moreover the system should have a basic
understanding of the document context in order to determine what an artifact is and
what is not. To detect the artifact shown in Figure 29 the recognition tool should
establish a relationship between the components in the approved instance and the
instance to evaluate. For example the tool should become aware of which components
are section headings in the document, and compare the headings in the instance to

76
evaluate with the headings in the approved instance. Then, if an inconsistency is
found, the system can know that there is a defect.
The segmentation and understanding rule engine module extracts the required
knowledge for the CBR tool do its job. Although the rule engine extracts the implicit
knowledge it is very difficult to represent defects with rules. Codifying rules is a very
difficult task. In addition the system should have the capacity of learning. Learning
with rules is very difficult, because an expert in artificial intelligence or programming
languages is required to add new rules. Such expertise is not commonly available in
print shops. In the other hand CBR programming is straightforward and the learning
process is so simple that can be executed by people with poor computer skills.
Therefore we leave the recognition process to the CBR, because its techniques are
more suitable for the problem, given the patterns and particular properties inside
artifacts.
6.1.1 Artifact features
The Case-Based Reasoning (CBR) engine detects artifacts matching the anomaly-
case features with the artifact-cases features stored in the engine case base. In CBR a
feature is a particular characteristic or piece of information inside each case. Features
are also known as properties or case slots. A formula is used to measure the similarity
between the anomaly-case and the stored artifact-cases. Each case contains the artifact
name, the severity of the artifact and several features discussed in this sub-section.
After the anomaly is compared with the stored artifacts the artifact most similar to the
anomaly is selected as the solution and the system determines that the anomaly and the

77
selected artifact are the same type of artifact. This process is explained in more detail
in Section 6.3.
Figure 30: Visual example of components in evaluation and their respective equivalent
component
Trough this chapter two terms are used constantly; they are Component in
Evaluation, and Equivalent Component. As exposed in earlier chapters the K-BAR
analyzes the instances of a Variable Data Job (VDJ) basing its decisions on one
instance that should be approved by a proofing human expert. The rule engine
analyzes and creates logical units in all the instances, but one of the engine tasks is to
make a one to one relationship with the component in the approved instance and the
components in remaining instances. Figure 30 shows a visual example of the concept.
The component in evaluation is part of an instance been evaluated, and the equivalent
component is in the approved instance. Other equivalent terms for component in
evaluation are: potential defected component and anomaly component. The rule
engine analyzes the layout of both instances and assigns each component in the
instance been evaluated an equivalent component from the approved instance. In the
example above it can be noticed that the HP logo is the component in evaluation and

78
the UPRM27 logo is the equivalent component. In general the equivalent component
shares similar layout properties, such as size and position with the component in
evaluation.
Artifact Case Features Feature Name Short Description
Artifact Name The name of the artifact. (e.g. Overlapping, Container-Overflow, Ringing Artifact, Lack-of-Empty-Space)
Severity Rating A rating number from 0 to 5 describing the negative effect of the artifact over the aesthetic quality of the document page.
White Space The empty space inside the page.
Decrement White Space
True if the white space in the instance in evaluation is less than the white space in the approved instance.
Size The percentage of the anomaly component inside the equivalent component in the approved instance.
Width The increase or decrease of the width of the component with the anomaly and the equivalent component in the approved instance.
Decrement Width True if the width of the component in evaluation is smaller than the width of the equivalent component.
Height The increase or decrease of the height of the component with the anomaly and the equivalent component in the approved instance.
Decrement Height True if the height of the component in evaluation is smaller than the width of the equivalent component.
27 UPRM stands for University of Puerto Rico Mayagüez Campus

79
Artifact Case Features Feature Name Short Description
Above Distance
The vertical distance from the top edge of the anomaly component to the bottom edge of the near neighbor component above or to the top page margin if there is no component above.
Right Distance
The horizontal distance from the right edge of the anomaly component to the left edge of the near neighbor component at the right or to the right page margin if there is no component at the right.
Below Distance
The vertical distance from the bottom edge of the anomaly component to the edge of the near neighbor component below or to the bottom page margin if there is no component below.
Left Distance
The horizontal distance from the left edge of the anomaly component to the right edge of the near neighbor component at the left or to the left page margin if there is no component at the left.
Overlapping Tells which component, the component in the anomaly or the equivalent component in the approved instance, overlaps over other components.
Margin Friendly Tells which component, the component in the anomaly or the equivalent component in the approved instance, violates the page margin constraints.
Typeface Change Indicates the typeface changes (font family, size, and style), if any, between the anomaly text component and the equivalent text component in the approved instance.
Object Type The logical type of the component with the anomaly (e.g. heading, text, image).
Expected Object Type
The logical type of the equivalent component in the approved instance (e.g. heading, text, image).
Type Difference The quantitative difference between the object type and the expected object type.

80
Artifact Case Features Feature Name Short Description
Client Expertise The client looks for a professional finished job (e.g. Magazines) or they are looking for mass production services (e.g. supermarket’s shoppers).
Audience Age Group The age group of the people the variable data job is addressed to.
Audience Expertise The experience of the audience given the context of the document. (e.g. Novice, Amateur, Professional, or Expert)
Audience Visual Sensitivity
How well does the audience see? (e.g. very poor, poor, average, sensitive, very sensitive)
Table 2: Artifact Features
Table 2 shows a list of the features used to detect artifacts in digital documents.
The features not only depend on the component that caused the anomaly, but the
values of the features are determined from the difference between the potentially
defective component and the equivalent object in the approved instance. The feature
Artifact Name contains the name of the artifact. This information is used for reports
requested from end users of the system. This data provides a familiar name to end
users in order to identify the artifacts. The Severity Rating is an integer number which
ranges from 0 to 5. The numeric rating is the numeric equivalent to no artifact,
tolerable artifact, low effect artifact, high effect artifact, severe artifact, and critical
artifact respectively. These last two features, Artifact Name and Severity Rating are
given by an expert when adding a new artifact to the case base. The other features
measurements and values are described in Table 3.
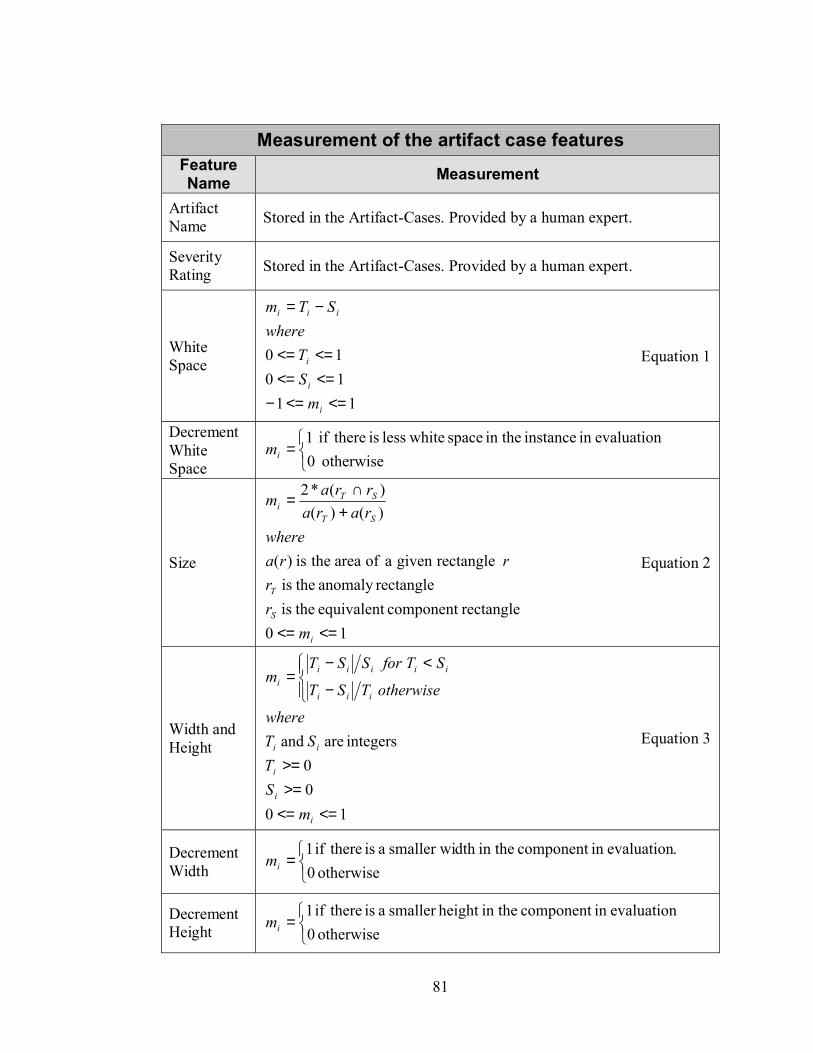
81
Measurement of the artifact case features Feature Name Measurement
Artifact Name Stored in the Artifact-Cases. Provided by a human expert.
Severity Rating Stored in the Artifact-Cases. Provided by a human expert.
White Space
111010
<=<=−<=<=<=<=
−=
i
i
i
iii
mST
whereSTm
Equation 1
Decrement White Space
=otherwise 0
evaluationin instance in the space whiteless is thereif 1im
Size
10rectanglecomponent equivalent theis
rectangleanomaly theis rectanglegivenaofareatheis)(
)()()(*2
<=<=
+∩
=
i
S
T
ST
STi
mrr
rrawhere
rararra
m
Equation 2
Width and Height
1000
integers are and
<=<=>=>=
−
<−=
i
i
i
ii
iii
iiiiii
mST
STwhere
otherwiseTST
STforSSTm
Equation 3
Decrement Width
=otherwise 0
.evaluationin component in thedth smaller wi a is thereif 1im
Decrement Height
=otherwise 0
evaluationin component in theheight smaller a is thereif 1im

82
Measurement of the artifact case features Feature Name Measurement
Above, Right, Below, and Left Distances
1100
integers are and
)()(
<=<=−>=>=
−<−
=
i
i
i
ii
iii
iiiiii
mST
STwhere
otherwiseTSTSTforSST
m
Equation 4
Overlapping
=
overlap.component equivalent theandanomaly theif 4not. doesanomaly theamd overlapscomponent equivalent theif 3not. doescomponent equivalent theand overlapsanomaly theif 2
overlap.not docomponent equivalent theandanomaly theif 1
im
Margin Friendly
=
margins. exceedcomponent equivalent theandanomaly theif 4not. doesanomaly theand margins exceedscomponent equivalent theif 3not. doescomponent equivalent theand margins exceedsanomaly theif 2
margins. exceednot docomponent equivalent theandanomaly theif 1
im
Typeface Change
=
=
=
++=
otherwise. 0change. sizefont a is thereif 1
x
otherwise. 0
bold).or italic (e.g. change stylefont a is thereif 1
otherwise. 0change.family font a is thereif 1
)(*4)(*2)(*1
3
2
1
321
x
x
wherexxxmi
Equation 5
Object Type The logical type of the anomaly.
Expected Object Type
The logical type of the equivalent component in the approved instance.

83
Measurement of the artifact case features Feature Name Measurement
Type Difference See description below Equation 6.
Client Expertise Gathered at the intent stage. Provided by a human expert.
Audience Age Group Gathered at the intent stage. Provided by a human expert.
Audience Expertise Gathered at the intent stage. Provided by a human expert.
Audience Visual Sensitivity
Gathered at the intent stage. Provided by a human expert.
Table 3: Features Measurement
In the equations above iT corresponds to the value for a given feature in the
anomaly component and iS is the value of the same feature in the equivalent
component. For example, if we want to setup the Width feature, iT is the width of the
anomaly component and iS is the width of the equivalent component. On the other
hand if we want to calculate the Above Distance feature, iT is the vertical distance
from the top edge of the anomaly component to the bottom edge of the nearest
neighbor component above or to the top page margin if there is no component above
and iS is the same measurement but for the equivalent component. In the Typeface
Change feature the changes are determined comparing the font properties in a text
component in evaluation and its equivalent component in the approved instance.

84
),(),(),(),(
1),(
1),(
1
0
1
0
AEDDifferenceTypeCAADCAEDAED
iKCAAD
iKCAED
LLK
A
E
L
i
L
i
ET
=+=
+=
+=
−=
∑
∑−
=
−
=
Equation 6
Figure 31: Document Taxonomy and Type Difference measure example
The Object Type, Expected Object Type, and Type Difference features require a
more detailed explanation. The Object Type and Expected Object Type properties are
handled virtually the same way, but their values come from different sources. The
former is the logical type of the component in evaluation and latter is the logical type
of the equivalent object in the approved instance. The challenge arises when
measuring the difference for the Type Difference feature. The values are symbols, i.e.,
names of logical types of the components in the document. To calculate this feature
we developed a taxonomy of document components and placed in the Type Difference
slot the distance from one node to other in the taxonomy tree (See Figure 31). The

85
notation in Equation 6 is as follows: E is the logical type of the component in
evaluation. A is the expected logical type or the logical type of the equivalent
component in the approved instance. CA is a common logical type ancestor for A and
E. LT is the number of components between the root node and E. The root node
Component is in level zero. LE and LA is the number of levels to ascend to reach CA
for E and A, respectively. Variable K is the subtraction of the number of components
in the branch where E is, minus LE. The functions D(E, CA) and D(A, CA) are the
distances from the E to CA and from A to CA, respectively. Consequently D(E, A) is
the sum of the last two distances. Figure 31 shows an example with E as Document
Title and A as Header. For this example: LE = 2, LT = 4, LA = 2, LCA = 4-2 = 2.
Therefore D(E, CA) = 1/2 + 1/3 ~ 0.83, D(A, CA) = 1/2 + 1/3 ~ 0.83. Finally the
distance between E and A is D(E, A) = 1.66. To normalize the values of the D(E, A)
function we divide the result by the maximum distance that can be encountered inside
the components ontology. In our example the maximum distance is 2.83. Therefore the
value for the Type Difference feature is 0.5866 approximately. This methodology has
the particularity that the distance at the branches are calculated at run time, therefore if
some change to the taxonomy is done, this change has no effect in the execution of the
code. This measurement provides us with a suitable numeric representation of the
difference between logical types. The technique penalizes ascensions, because logical
types in upper levels are more abstract or generic.
There are additional features that are not gathered at the document segmentation
and understanding module. They come from the metadata extracted in the Intent

86
module at the time of receiving the job (See Section 3.1) for more details about the
architecture). These features are Client Expertise, Audience Age Group, Audience
Expertise, and Audience Visual Sensitivity. These features are not critical for the
analysis, but they will help the system to get appropriate results given the client and
audience description and expectations, thus providing a customized analysis and
evaluation of the variable data job for the client. We have denoted this Personalized
Analysis Criteria and is described in the next section.
6.2 Personalized Analysis Criteria Reviewed
The personalized analysis criterion is an element of the system which increases the
accuracy of the decisions and makes the system emulate human behavior. The
criterion is used to customize the tolerance of the system to variations in the document
layout. For example the tolerance has an effect on the required precision to establish
an alignment tolerance bounds. In addition the criteria can determine how much
excess of text should occur to determine an overflow defect. Another example is
component page distribution. When components are distributed vertically, for example
a list, there could be a variation in the white space between the components in the list
(line height). The criteria can make the system overlook these variations and manage
this list of components as equally spaced. Moreover this feature is used to improve
artifact case matching, because cases can be filtered in order to show artifacts for a
particular client or job profile.
This additional criterion is very useful because human experts do not handle all
documents in the same way. The type of the company that submitted the job will have

87
a great influence in the way proofing professionals determine defects inside a job. As
explained earlier, this behavior does not mean that print shops give a lower quality
service to amateurs, novices, or non-professional jobs. Amateurs, novices, and non-
professional designers do not demand the same quality requirements for their jobs.
There are many factors that make the last argument true. Amateur designers
commonly do not have access to expensive high quality design tools. Therefore their
layouts will not have the precision and the exactitude in the alignment of components
or in the placement of component trough the page as professional tools do. Many
amateur’s design is addressed to audiences with a low level of visual sensitivity.
Consequently a picture with poor resolution can pass unnoticed by the audience of a
given job. Managing this kind of job just as a professional one may unnecessarily stop
the job in the DP workflow system waiting to for the client to fix defects that may pass
unnoticed by the client or the audience. This can decrease the client satisfaction,
congest the workflow, and delay delivery, if the automated system is asking the client
to fix irrelevant defects. For these reasons we can not evaluate amateurs’ jobs with the
same rigorous criteria of a professional high-quality job.
Right now the personalized analysis criterion is hard coded, but future
improvements or implementations could add an interface to gather this metadata
directly from the DP workflow system. The metadata to extract is the Client Expertise,
Audience Age Group, Audience Expertise, and Audience Visual Sensitivity. The
client expertise refers to the level of design skills or professionalism inside the
organization that submitted the job. We give this property a value range from 1 to 5;
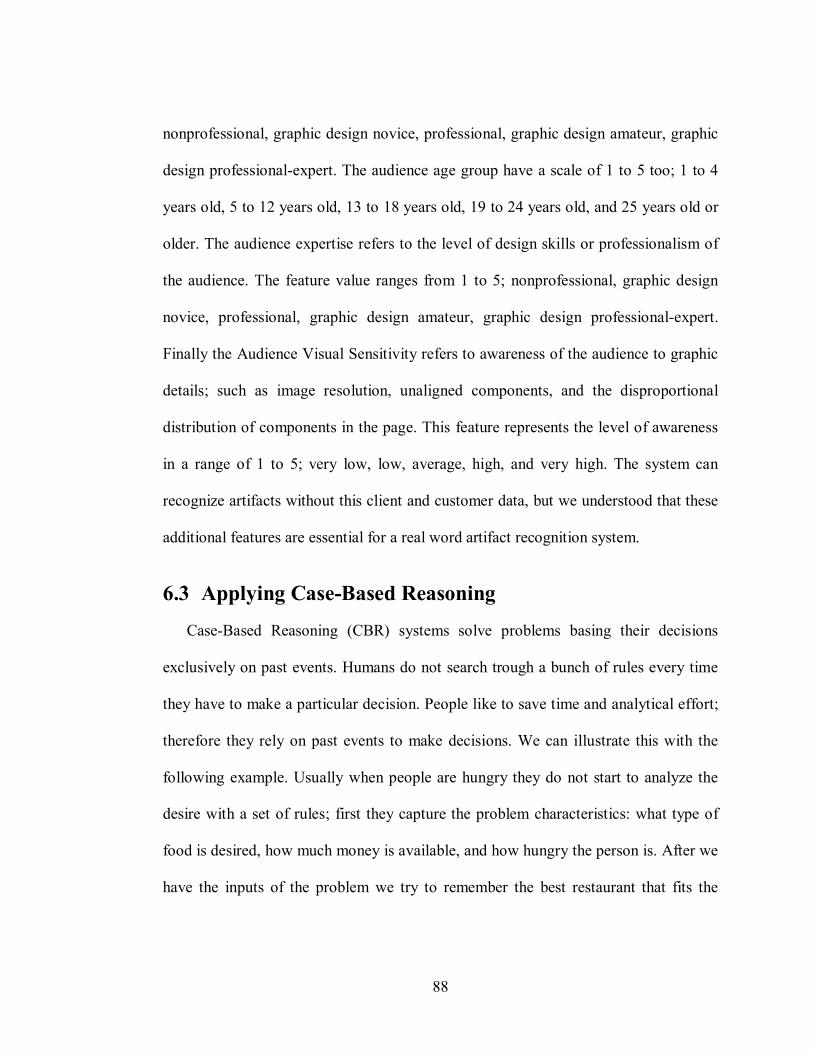
88
nonprofessional, graphic design novice, professional, graphic design amateur, graphic
design professional-expert. The audience age group have a scale of 1 to 5 too; 1 to 4
years old, 5 to 12 years old, 13 to 18 years old, 19 to 24 years old, and 25 years old or
older. The audience expertise refers to the level of design skills or professionalism of
the audience. The feature value ranges from 1 to 5; nonprofessional, graphic design
novice, professional, graphic design amateur, graphic design professional-expert.
Finally the Audience Visual Sensitivity refers to awareness of the audience to graphic
details; such as image resolution, unaligned components, and the disproportional
distribution of components in the page. This feature represents the level of awareness
in a range of 1 to 5; very low, low, average, high, and very high. The system can
recognize artifacts without this client and customer data, but we understood that these
additional features are essential for a real word artifact recognition system.
6.3 Applying Case-Based Reasoning
Case-Based Reasoning (CBR) systems solve problems basing their decisions
exclusively on past events. Humans do not search trough a bunch of rules every time
they have to make a particular decision. People like to save time and analytical effort;
therefore they rely on past events to make decisions. We can illustrate this with the
following example. Usually when people are hungry they do not start to analyze the
desire with a set of rules; first they capture the problem characteristics: what type of
food is desired, how much money is available, and how hungry the person is. After we
have the inputs of the problem we try to remember the best restaurant that fits the

89
inputs and where we felt pleased the last time we visit it. The same principle applies to
the case-based artificial reasoning technique.
In this research the problem was to detect defects inside variable data documents;
especially style-dependent artifacts. As explained before this type of artifacts are very
complex to be described with only rules; moreover human experts identified these
defects by their past experience with aesthetic flaws in documents. Therefore we opted
for using a case-based reasoning engine to recognize artifacts.
Figure 32: Artifact Recognition Case-Based Reasoning Processes
CBR is a very simple and logical technique. We develop the engine in the Java
programming language and the cases were stored in a XML file. The CBR system was
composed of two main modules; the Case Matcher and the Report Artifact modules
(See Figure 32). The Case Matcher receives one anomaly-case and compares it with a
set of artifact-cases; from this set the module determines the case most similar to the
anomaly. Some anomalies are not artifacts; therefore not always the system will come

90
out with a match. When a match is found, the Report Artifact module receives the
request and notifies the defect. For the research prototype, the Report Artifact module
writes the defects report in a XML file. Future implementations can use this module to
interface with other applications or storage devices. It can be noticed that while the
system is practically the most important piece in the K-BAR, its architecture is very
simple and straightforward.
6.3.1 Artifact Case Features
Section 6.1.1 exposed the features that characterize digital document artifacts; this
section deals with the logical representation of those features for the case matching
process. R. H. Chi and M. Y. Kiang [18] classify the case features or slots in three
different categories Critical Slots, Common Slots and Decision Slots. Critical slots
should be equal to those slots in the target case; the common slots are extra
information used to give more detail to the case, and the decision slots contain the
solution to the problem. We followed the same idea, but with the difference that
critical slots do not have to share the same content as the critical slots in the target
case. In our research we emphasize critical slots with weights heavier than the weights
of the common slots. The weights are numbers used to increase or decrease the
importance of the features. The next section explains the topic in more detail. For this
first prototype the weights where assigned by observations. Some test were run, and
based on the test results the weights were readjusted.

91
Feature Name Feature Category
Feature Similarity Function
Artifact Name Decision Slot None
Severity Rating Decision Slot None
White Space Common Slot Equation 9
Decrement White Space Common Slot Equation 10
Size Critical Slot Equation 8
Width Common Slot Equation 8
Decrement Width Critical Slot Equation 10
Height Common Slot Equation 8
Decrement Height Critical Slot Equation 10
Above Distance Common Slot Equation 9
Right Distance Common Slot Equation 9
Below Distance Common Slot Equation 9
Left Distance Common Slot Equation 9
Overlapping Common Slot Equation 10
Margin Friendly Common Slot Equation 10
Typeface Change Critical Slot Equation 10
Object Type Critical Slot Equation 6
Expected Object Type Critical Slot Equation 6
Type Difference Critical Slot Equation 8
Client Expertise Common Slot Equation 10
Audience Age Group Common Slot Equation 10
Audience Expertise Common Slot Equation 10 Audience Visual Sensitivity Common Slot Equation 10
Table 4: Artifact features categorization and case matching equations
Table 4 categorizes the artifact-case features as critical, common, and decision
slots. Critical slots are features that receive a heavier weight. They receive heavier
weights because the experiments showed that these slots are the most important slots

92
to measure similarity between an anomaly-case and an artifact-case in the case
matching process. For example changes in logical types commonly lead to defects,
and classifying the logical type as a critical slot ensured that artifacts-cases with same
logical types will outstand over cases that represent defects from other types of
components. Common slots add detail to the cases for evaluations where there is more
than one possible match; in these events the common slots have relevant information
that can decide which possible match is the best.
6.3.2 Case matching
Case matching is the most important process inside a case-based reasoning system.
For this reason it is important to select a suitable matching algorithm. The Nearest
Neighbor Algorithm (NNA) was found an appropriate technique for artifact case
matching. This algorithm has shown outstanding results, not only in CBR, but in
Pattern Recognition, Image Processing [30], and so on. The best characteristic of this
technique is its comprehensible and clear implementation.
Figure 33: Arrangement of Artifact-Cases within the feature axes

93
iwSTi
NiNST
ST
w
w),Sf(T(T,S)Similarity N
ii
i
N
iii
attribute of weight importance theis and casesin attributefor function similarity a is f
to1 from attribute individualan is caseeach in attributes ofnumber the
case-artifact theis case-anomalyor case- target theis
1),(Similarity0where
1
1
≤≤
×=
∑
∑
=
=
Equation 7
iiii STSTf −−=1),( Equation 8
=
=
+=
otherwise 0negativeor positiveboth are and if 1
),(
2)(),(
2
21
21
ii
ii
ii
TSd
STfdwhere
ddSTf
Equation 9
=otherwise 0
toequal is if 1),( ii
ii
STSTf Equation 10
In the NNA, cases are represented in an n-dimensional space (See Figure 33). Each
artifact-case feature will constitute an axis in the space; therefore our cases are
represented in a 21-dimensional space, one axis for each one of the 21 features. The
artifact-cases are arranged based on their features values. The anomaly-case is
represented in the 21-dimensional space in the same manner artifact-cases are. The
purpose is to measure the similarity between the anomaly-case and the artifacts in the
case base by measuring the distance between the cases’ features. Equation 7 presents

94
the case-matching similarity function and Equation 8, Equation 9, and Equation 10
present the features similarity functions in mathematical terms. Notice that the graph
has the characteristic of a Euclidian plane, although the similarity function is not based
on Euclidian distance, because features are evaluated independently from each other.
The formulas sum up the measure of similarity between each feature, instead of
establishing two points in the plane and calculate the distance between them. The
approach selected is simple, faster, and as effective as the Euclidian distance between
the cases. The closer the similarity function is to 1 the most similar is the artifact-case
to the anomaly-case, and vice versa. Similarly, for the feature similarity functions, the
closer the values are to 1 the more similar the features are, and vice versa. In Equation
9 the feature similarity function makes use of another feature similarity function with
subscript 2. This feature similarity function is the one shown in Equation 8. Table 4
shows the respective feature similarity function for the case attributes.
Figure 34: Example of the NNA: Simple graph with two features

95
Cases
Features i C1 C2 AC
Width 1 0.8 0.2 0.4
Type Difference 2 0.117 0.53 0.94
Table 5: Example of the NNA: Features Values
A simple example will help understand the algorithm better. Figure 34 shows a
visual representation of a case base composed of two artifact-cases, on a 2-
dimensional plane formed by the Width and Type Difference feature as axes. This
figure also shows the anomaly case. In addition Table 5 shows the values of the cases
features for easy reading. Assume that the weights are 1.0 for Width and 2.0 for Type
Difference. We can use Equation 7, Equation 8, and Equation 10 to calculate the
similarity between the anomaly-case AC and the past events or artifact-cases C1 and
C2. The similarity function for the Width feature is Equation 8 and the similarity
function for the Typeface Change feature is Equation 10. Notice that AC1 is the
feature value of Width and AC2 is the feature value of Type Different; it is the same
for the artifact-cases. The similarity function values for this example are given below.

96
2800.20.1
0.2*00.1*8.027
0268025
2000.20.1
0.2*00.1*6.014
00:1?10:1?13608.04.0111112
0.20.10.210.1111
22
11
2222
1111
2211
.)(AC,CSimilarity)(
),Cf(AC)(.),Cf(AC)(
.)(AC,CSimilarity)(
ACCST),Cf(AC)(.CAC-ST),Cf(AC)(
)*,Cf(AC)*,Cf(AC)(AC,CSimilarity)(
ii
ii
≈++=
==
=++=
========−−=−=−−=
++
=
From Figure 34 we can visually perceive that the artifact-case C2 is closer to the
anomaly case, therefore it should be chosen as the most similar case. Consequently the
calculations above demonstrate that the visual appearance of similarity was true and
correct, although none of the artifact-cases is close enough to be considered as a
reliable match.
Figure 35: Case matching process pseudo-code

97
After analyzing all the equations involved in the case matching process we can
join together all the pieces and see the process pseudo-code. Figure 35 shows the
pseudo-code for the case matching process. First the module receives a set of
anomaly-cases to evaluate. Next, the system selects one of the anomalies and
measures the similarity (Equation 7) between the artifact-cases and the anomaly-case.
The CBR engine selects the artifact-case most similar to the anomaly-case; this case is
known as the potential match. Although the system finds the closest artifact-case to
the anomaly, which does not mean a match was found. The matching process is
constrained by a threshold that will indicate the minimum degree of similarity that
should be achieved to denote an artifact-case as the match. Finally after comparing the
anomaly with the known artifacts, if some match is found the system extracts the
artifact name and severity rating and reports the finding in an XML file. The process is
repeated for every anomaly found by the rule engine analysis.
6.3.3 Learning with case-based reasoning
One of the most fundamental features in today’s intelligent systems is their
learning and adaptive capacity. If intelligent systems can not learn are fated to fail or
to become obsolete in a short period of time. Second to its straightforward
implementation, another important characteristic of CBR systems are their capacity to
learn and adapt. Other systems need complex training routines to update their
knowledge base, or technical knowledge about the system programming language to
create new rules, or complex algorithms to set parameter values and so on. A CBR
system can be updated through its life span without much trouble. If the problem can
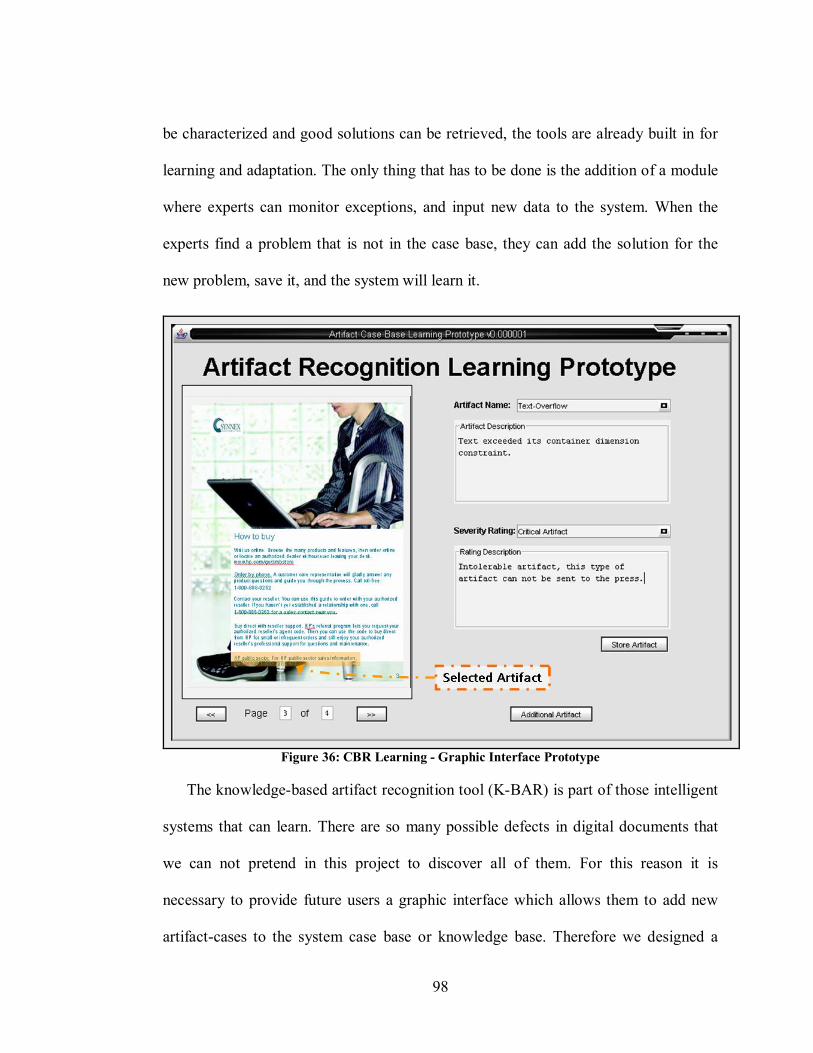
98
be characterized and good solutions can be retrieved, the tools are already built in for
learning and adaptation. The only thing that has to be done is the addition of a module
where experts can monitor exceptions, and input new data to the system. When the
experts find a problem that is not in the case base, they can add the solution for the
new problem, save it, and the system will learn it.
Figure 36: CBR Learning - Graphic Interface Prototype
The knowledge-based artifact recognition tool (K-BAR) is part of those intelligent
systems that can learn. There are so many possible defects in digital documents that
we can not pretend in this project to discover all of them. For this reason it is
necessary to provide future users a graphic interface which allows them to add new
artifact-cases to the system case base or knowledge base. Therefore we designed a

99
prototype for knowledge acquisition, specifically for the acquisition of new artifacts
(See Figure 36). The prototype shows a basic model to capture defects in digital
documents.
Figure 36 illustrates three important components; they are the job page display, the
artifact name combo box, and the severity rating combo box. The page display allows
the user to search through the job pages and find defects. Then he/she can select the
defective component and the component is highlighted. At the right of the GUI there
are two combo boxes, one to select the artifact name and the other to setup the severity
rating of the artifact. Instead of a text field to enter the name of the artifact we found it
more suitable to provide the user with possible names, in order to avoid that similar
artifacts will be named with different names. For example an overlapping artifact can
be named as superimposed artifact or component-over-component artifact. The
graphic interface should provide the user with the ability to add new artifact names if
the name does not appear in the combo box. The severity rating is setup by the human
expert too. The severity rating combo box does not have numbers; it has the symbolic
description of the severity rating: no artifact, tolerable, low effect, high effect, severe,
and critical. When the user presses the save button to add the new case, the system
automatically calculates the additional feature values of the defective components.
Finally the additional text areas provide the user the description of the selected artifact
or severity rating.
The learning process is not limited to graphic interface inputs. Moreover it can be
done trough the Internet or any other communication system where knowledge can be

100
shared. As explained in the chapter on architecture the print shops can sell or rent the
knowledge in their case bases or can buy the service too. Today high data transfer
networks allow this type of system to become part of an information network where
knowledge can be updated, polished, removed, or added continuously. Consequently
this will help improve the accuracy of the system and increase its life span.
6.4 Chapter Review
This chapter had shown how Case-Based Reasoning (CBR) was used to achieve an
artifact recognition system. It is important to highlight that the recognition of artifacts
via CBR is dependent of an accurate document segmentation and understanding. This
section of the research presents several collaborations. At the time of this writing and
to the best of our knowledge no one has made a deep study about digital document
defects or artifacts. This chapter exposed a characterization of artifacts and the
classification of artifacts given their inherited properties and negative effects over the
aesthetic quality of the document page. Therefore we classified defects in three main
groups; component-dependent artifacts, constraint dependent artifacts, and style-
dependent artifacts. In addition we discovered 21 artifact attributes that can be used by
a machine for their detection. Consequently we developed a CBR system capable of
using those artifact features to recognize defects in variable data documents. Given the
characteristics of CBR we classify artifact features by their relevancy, helping the
system to filter irrelevant cases. In addition the system does not perform a unique
analysis process; the analysis can be customized for every job, based on the client
type, the job type and the client audience. Finally, a model of artifact learning for the

101
CBR module was presented. This model allows users to increase the number of
artifact-cases in the case base; giving the possibility for improvements in the accuracy
of the system for artifact recognition and increasing its life span.

102
7 TESTS, RESULTS, AND ANALYSIS Testing of concepts is one of the most important tasks in any research. We
designed 43 different document samples to proof and substantiate our ideas. This
chapter deals with all the experiments executed in order to expose the strong and weak
spots of the knowledge-based artifact recognition tool. Any systems has its flaws and
virtues, the K-BAR is no exception. Nevertheless the results corroborate our
expectations about the system.
7.1 System performance measurements
detectedbeshouldthat artifactsofnumber theis detectionscorrect ofnumber theis
%100
TEwhere
TEa ×=
Equation 11
In our tests we calculated the accuracy of the system in recognizing defects, giving
a set of test samples. We measure accuracy with Equation 11. For example, if our test
samples have a total of 24 overlapping artifacts and the system detects 20, the
accuracy of the system in detecting overlapping artifacts is %3.83%1002420 ≈× .
componentsor instances ofnumber theis events ofnumber theis
%100
NEwhere
NEp ×=
Equation 12
We also estimated probabilities from relative frequencies as in Equation 12. We
estimated probability to determine the chances of the system of wrong recognition of a

103
defect. For example, if we have 12 false alarms and 123 components, the probability
of the system to wrongly detect an artifact per component is %76.9%10012312 ≈× .
7.2 Document Segmentation and Understanding
The document segmentation is an important piece inside the knowledge-based
artifact recognition tool. Its analysis provides substantial data about the document
layout to allow the case-base artifact recognition system to match anomalies with
known artifacts. The experiments done in this section were to verify a correct
operation of this system module instead of measuring or benchmarking the
performance of the system since, the goal of this research was to demonstrate the
capacity of a case-based reasoning system to detect digital document artifacts.
Therefore, our test samples were aimed at testing the precision of the recognition
system.
7.2.1 Strong Lines
Figure 37: Strong lines layout test samples - part one
Strong lines were the point of reference to start the segmentation analysis. We
tested different layout samples to verify the proper identification of the strong lines in
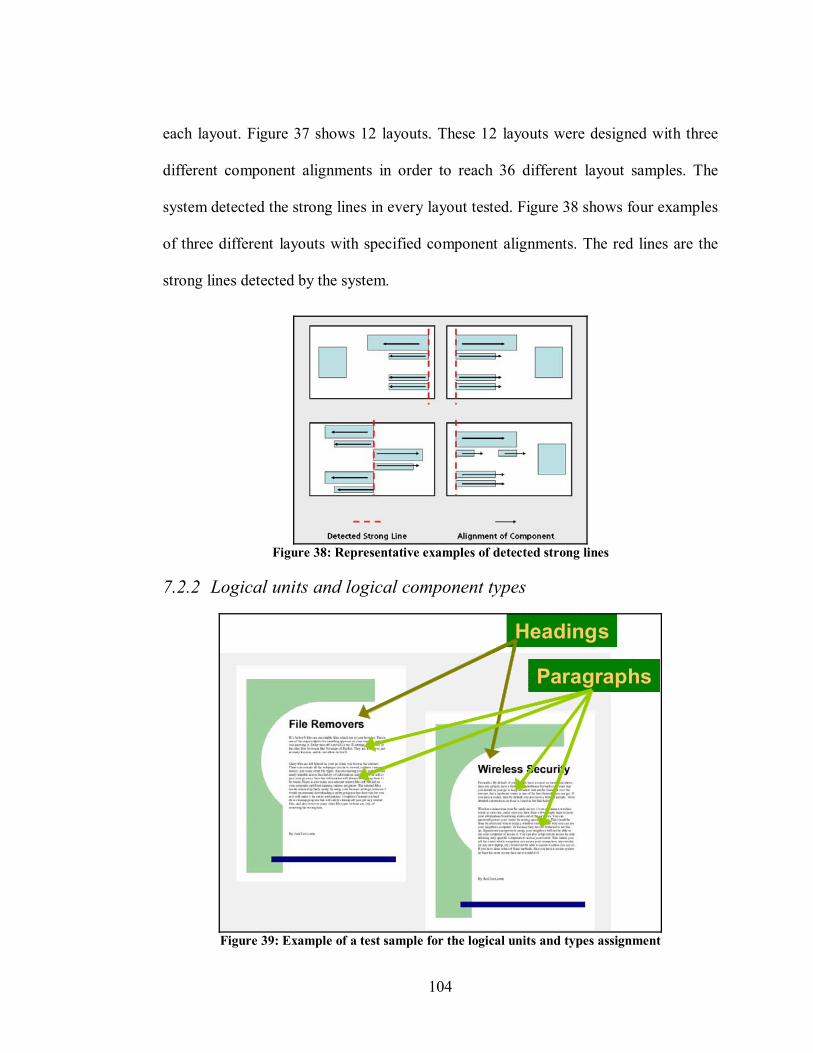
104
each layout. Figure 37 shows 12 layouts. These 12 layouts were designed with three
different component alignments in order to reach 36 different layout samples. The
system detected the strong lines in every layout tested. Figure 38 shows four examples
of three different layouts with specified component alignments. The red lines are the
strong lines detected by the system.
Figure 38: Representative examples of detected strong lines
7.2.2 Logical units and logical component types
Headings
Paragraphs
Headings
Paragraphs
Figure 39: Example of a test sample for the logical units and types assignment

105
For the logical unit assignment test we used the same test sample used for the
artifact recognition system, 43 test samples. We tested the rules with the intention of
verifying a proper assignment of logical types and units to page components. A correct
execution of this module will ensure a proper performance in the artifact recognition
tool. Figure 39 shows one of the test samples used to test the assignment of logical
units and component logical types. As with other variable data jobs (VDJ) the system
detected effectively the heading of the text and the paragraphs and the relation
between them. In addition the system assigned effectively equally spaced components
to the same unit. If the system could not encounter any relation to determine that a
component is a heading or paragraph, it assigned a more general type such as text or
image.
The document understanding and segmentation has two weaknesses. First, the
system treats all the components in the page as part of the foreground. This leads to an
inaccurate measurement of the white space in the document page. In addition when
two or more components overlap, the system can not determine which component is in
the front. Another system flaw is with the measurement of the text geometric
properties. We developed a routine in Java to measure the dimensions of the text. We
used the Java’s Font API. The measurement of the ascent and descent [25] of a given
typeface was not as accurate as we liked it to be. The system calculated a text height
of approximately 6% greater than the correct height, and the width of text lines were
2% less than the correct width. These flaws caused the misdetection of some artifacts
and an excessive generation of false alarms discussed later in this chapter. There still

106
additional functionalities to design, like the detection of horizontal strong lines.
Nevertheless the artifact recognition module could realize its task efficiently despite
these imperfections.
For the samples we used, the document segmentation and understanding tool
correctly segments the page context and assigns logical types to components. The
system gathered the needed implicit and explicit information for the artifact
recognition process from the geometric properties of the components inside the
document page. In addition it assigned correctly to the instance in evaluation the
corresponding equivalent components in the approved instance. Finally the system
detected successfully the anomalies inside the VDJ test samples, achieving an
outstanding accuracy of 100% for the detection of changes in the job layouts.
7.3 Artifact Recognition
Test Samples
Brochures14%
Essays9%
Bumper Stickers12%Bussines Cards
19%
Signs46%
Figure 40: Test samples distribution

107
Figure 41: Brochure test samples
Test Samples Artifacts
Typeface Family Change
15%
Missing Component
18%
Typeface Style Change
22%
Lack of Empty Space10%
Overlapping15%
Typeface Size Change
20%
Figure 42: Artifacts in the test samples
The experiments with the case-based artifact recognition module are intended to
expose the strengths and weaknesses of the system. We tested the system with 5
different variable data jobs (VDJs), for a total of 43 different test samples. The
samples were designed with the purpose of having diverse types of jobs (See Figure
40). Some VDJs have a simple design with few components, such as the bumper

108
stickers (Figure 45) with four components. Others samples are more complex, such as
the brochures (Figure 41), which contain 22 components.
The case base contains 13 representative samples of defects. Given the artifact-
cases used to train the CBR we expected the system to detect the following artifacts:
overlapping, missing components, lack of white space, typeface style change, typeface
family change, and typeface size change. Figure 42 shows the distribution of the
artifacts in the test samples. Some of the test samples do not contain any artifacts,
most of them contain one artifact, and a few samples contain two or three artifacts.
The system should detect a total of 40 artifacts. These artifacts were selected as
representative defects on digital document. They represent defects of geometric
changes (missing component, lack of empty space, and overlapping), and design
inconsistencies in particular properties of the components (typeface family change,
typeface size change, and typeface style change).
Weights Configuration Configuration
Features 1 2 3 4 5 6 7 8
Height 1.00 1.00 1.00 1.00 1.00 1.00 1.00 1.00
Decrement Height 2.00 2.00 2.00 1.00 1.00 1.50 1.00 2.00
Width 1.00 1.00 1.00 1.00 1.00 1.00 1.00 1.00
Decrement Width 2.00 2.00 2.00 1.00 1.00 1.50 1.00 2.00
Size 1.50 1.50 1.50 1.00 1.00 1.00 1.00 1.50
White Space 0.00 0.00 1.00 0.00 1.00 0.00 1.00 0.00
Decrement White Space 0.00 0.00 1.00 0.00 1.00 0.00 1.00 0.00

109
Weights Configuration Configuration
Features 1 2 3 4 5 6 7 8
Above Distance 0.50 1.00 0.50 1.00 0.50 1.00 1.00 1.50
Right Distance 0.50 1.00 0.50 1.00 0.50 1.00 1.00 1.50
Below Distance 0.50 1.00 0.50 1.00 0.50 1.00 1.00 1.50
Left Distance 0.50 1.00 0.50 1.00 0.50 1.00 1.00 1.50
Margin Friendly 1.00 1.00 1.00 1.00 1.00 1.00 1.00 1.00
Overlapping 1.00 1.00 1.00 2.00 1.50 1.50 1.00 1.00
Type 1.50 1.50 1.50 2.00 1.50 1.00 1.00 1.50
Expected Type 1.50 1.50 1.50 2.00 1.50 1.00 1.00 1.50
Type Difference 2.00 2.00 2.00 2.00 1.50 1.00 1.00 1.50
Typeface Change 2.00 2.00 2.00 2.00 1.50 1.50 1.00 2.00
Client Expertise 0 0 0 0 0 0 0 0
Audience Expertise 0 0 0 0 0 0 0 0
Audience Age Group 0 0 0 0 0 0 0 0 Audience Visual Sensitivity 0 0 0 0 0 0 0 0
Table 6: Weights Configuration
The weights configuration has a great impact on the system performance. To test
our system we used 8 different configurations (See Table 6). These configurations
were established by observation. We set up a configuration, test the system, observe
where it failed, readjust the weights that are related to the flaw, and re-test the system.
For example, with the configuration number 7 all the features have the same
significance. The system performs poorly on typeface change artifacts. Consequently
we increased the weight for the Typeface Change feature. This increase leads the

110
system to a better detection of such artifacts. The configurations in Table 6 are
arranged from the best performance (Configuration number 1) to the poorest
performance obtained (Configuration number 8). The personalized criteria features
have weights equal to zero, because the functionality for a personalized analysis was
not implemented completely yet.
Figure 43: Examples of missing-components, lack-of-white-space,
and overlapping artifacts
Figure 43 shows a sample set of four business cards. The card at the upper left
corner is the approved instance. It can be noticed that the card at the right of the
approved instance is missing its email address; the card below the approved instance
has the name too close to the job position; and finally the card at the bottom right of
the figure has the email address text over the phone numbers. All these artifacts were
identified successfully by the system. The results about these artifacts and others are
discussed next. The next results are about specific artifact tests where the system was
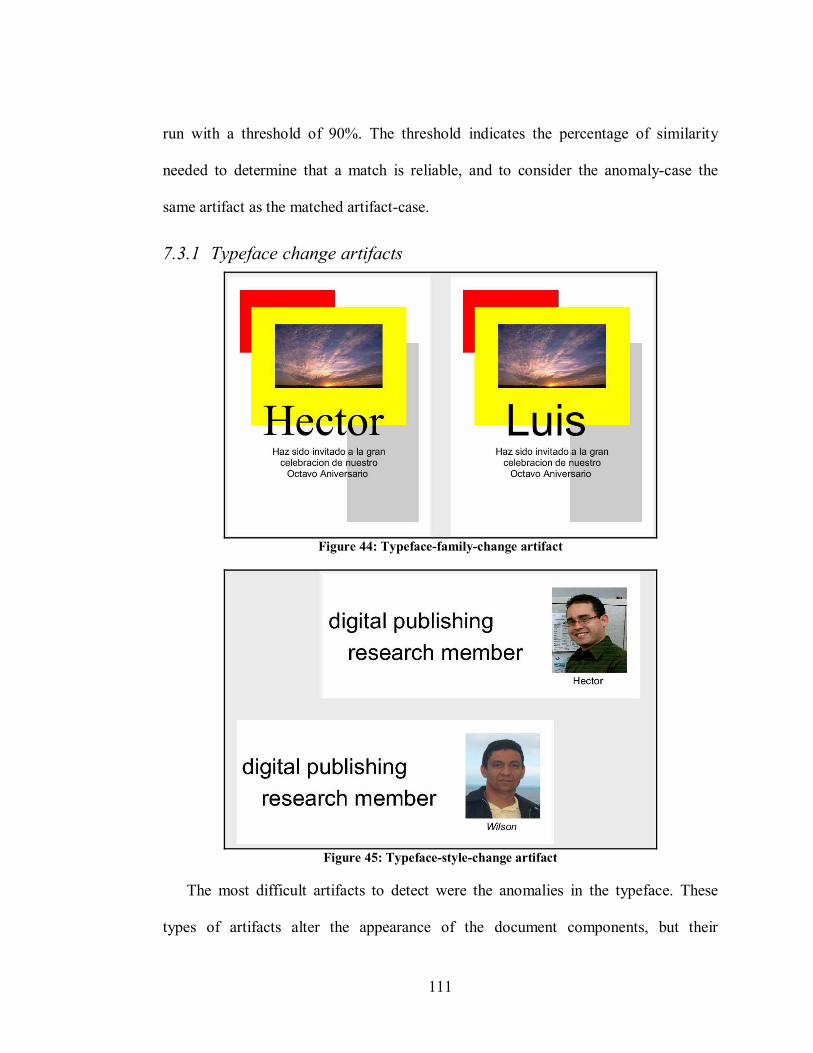
111
run with a threshold of 90%. The threshold indicates the percentage of similarity
needed to determine that a match is reliable, and to consider the anomaly-case the
same artifact as the matched artifact-case.
7.3.1 Typeface change artifacts
Figure 44: Typeface-family-change artifact
Figure 45: Typeface-style-change artifact
The most difficult artifacts to detect were the anomalies in the typeface. These
types of artifacts alter the appearance of the document components, but their

112
geometric properties remain almost the same. Figure 44 shows two signs test samples
with an example of a typeface-family-change artifact; the document at the left is the
approved document. In addition Figure 45 shows an example of the typeface-style-
change artifact; the document at the top is the approved instance.
77.8% 77.8%
66.7% 66.7% 66.7% 66.7% 55.6% 66.7%
0%
20%
40%
60%
80%
100%
Acc
urac
y
1 2 3 4 5 6 7 8Weights Configuration
Typeface Style Change Artifact Results
typeface-style-change
Figure 46: Typeface-style-change artifact results
87.5%100.0%
87.5%75.0%
62.5%75.0%
50.0%
75.0%
0%
20%
40%
60%
80%
100%
Acc
urac
y
1 2 3 4 5 6 7 8Weights Configuration
Typeface Size Change Artifact Results
typeface-size-change
Figure 47: Typeface-size-change artifact results
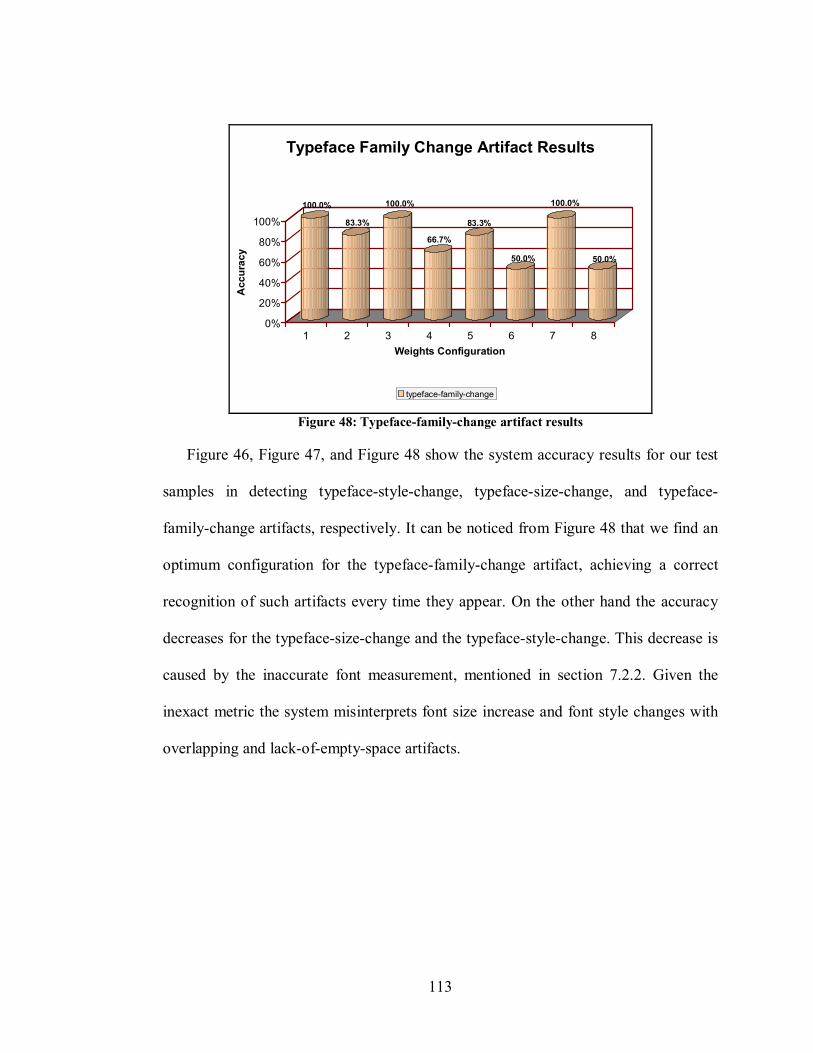
113
100.0%
83.3%
100.0%
66.7%
83.3%
50.0%
100.0%
50.0%
0%
20%
40%
60%
80%
100%
Acc
urac
y
1 2 3 4 5 6 7 8Weights Configuration
Typeface Family Change Artifact Results
typeface-family-change
Figure 48: Typeface-family-change artifact results
Figure 46, Figure 47, and Figure 48 show the system accuracy results for our test
samples in detecting typeface-style-change, typeface-size-change, and typeface-
family-change artifacts, respectively. It can be noticed from Figure 48 that we find an
optimum configuration for the typeface-family-change artifact, achieving a correct
recognition of such artifacts every time they appear. On the other hand the accuracy
decreases for the typeface-size-change and the typeface-style-change. This decrease is
caused by the inaccurate font measurement, mentioned in section 7.2.2. Given the
inexact metric the system misinterprets font size increase and font style changes with
overlapping and lack-of-empty-space artifacts.

114
7.3.2 Missing-components
Figure 49: Missing-component artifact
The missing-component artifact is a very obvious defect for people (Example in
Figure 49). The difference between the approved instance and the instance with the
defect is so clear that almost any person can notice the artifact. Although the artifact is
obvious for the human eye, there still some challenges in detecting it. Missing
components artifacts can vary in type and size. An instance can lose a very small or
large component. If the system is trained to detect the absence of small components it
will overlook the absences of larger components. Therefore the system should be
trained neither with a very small missing component, nor a very large missing
component. We used two artifact samples, one had a small component, occupying
about 5% of the document page; and the other was a large one, covering about 30% of
the document page.

115
100.0%
85.7%
100.0%
71.4%
85.7%
71.4%
100.0%
85.7%
0%
20%
40%
60%
80%
100%
Acc
urac
y
1 2 3 4 5 6 7 8Weights Configuration
Missing Component Artifact Results
missing-component
Figure 50: Missing-component artifact results
The results showed in Figure 50 demonstrate that the K-BAR correctly detected all
the missing component artifacts in our test samples for the weights configuration
number 1. To detect this artifact the weights should outstand the features which
indicate if the component decrease in height, width, and an increase in the page white
space.
7.3.3 Overlapping artifacts
Figure 51: Overlapping artifact

116
Overlapping artifacts has the peculiarity that defective components increase in size
(See Figure 51). If the page layout is designed to allow components to shift other
components in the page, overlapping can occur without an increment in the component
size. The relocation of the components inside the page is the event that produced the
overlapping; even though our test samples are designed for a fixed component layout.
Therefore in our test samples the components can overlap if and only if the component
increments in size.
66.7% 66.7% 66.7%
50.0% 50.0%
66.7%
33.3%
50.0%
0%
20%
40%
60%
80%
100%
Acc
urac
y
1 2 3 4 5 6 7 8Weights Configuration
Overlapping Artifact Results
overlapping
Figure 52: Overlapping artifact results
For our test samples the system’s best result in detecting overlapping artifacts was
a 66.7% of accuracy (See Figure 52). As explained earlier, for this prototype the
segmentation module is not aware of the background and the foreground. The system
treats all the components in the page as foreground. Therefore if a component has an
image on its background in the approved instance the system determines that there can
exist overlapping between the components. Consequently if the component with the
background overlaps over another component in an instance in evaluation the system

117
does not detect the overlapping artifact. These are the reasons for the poor
performance with this type of artifact. If this flaw in the segmentation module is fixed,
the accuracy of the K-BAR for recognizing overlapping artifacts should improve.
7.3.4 Lack-of-white-space artifact
Figure 53: Lack-of-white-space artifact
Finally we have the lack-of-white-space artifact. This artifact is very important
because even human viewers can overlook this type of artifact. For example Figure 53
shows a lack-of-white-space artifact. The artifact is not evident. The difference can be
noticed clearly when we take a look to the approved instance in Figure 43.
50.0% 50.0% 50.0%
75.0%
50.0%
75.0%
50.0% 50.0%
0%
20%
40%
60%
80%
100%
Acc
urac
y
1 2 3 4 5 6 7 8Weights Configuration
Lack of Empty Space Artifact Results
lack-of-empty-space
Figure 54: Lack-of-empty-space artifact results

118
Although the system reached a 75% accuracy in detecting this type of artifacts, for
our best weights configuration (Configuration number 1) the system performs for our
test samples with an accuracy of 50% (See Figure 55). Sometimes this artifact was
confused with the overlapping artifact. This poor performance is due to the flaw in the
segmentation module too, because of an inexact geometric measurement of the text
areas. Future versions of the prototype should correct this flaw in order to improve the
detection of such artifacts.
7.3.5 Overall Performance and false alarms
K-BAR Recognition Accuracy
81.6%
68.4% 68.4%65.8% 65.8%
83.7%
78.9%
68.4%
78.9%72.8%
78.1%80.7%78.7%
91.6%
84.1%
94.3%
50%
60%
70%
80%
90%
100%
1 2 3 4 5 6 7 8
Weights Configuration
Acc
urac
y
T = 90%T = 85%
Figure 55: Overall system performance
Figure 55 shows the overall performance of the system for our test samples. We
run the test with two thresholds, one at 85% and the other at 90%. The best
performance found with the 90% and 85% thresholds obtained accuracies of 81.8%
and 94.3%, respectively. It can be noticed in Figure 55 that both top performances
were achieved by the same weight configuration. This configuration (Configuration
number 1) has the White Space and Decrement White Space features disabled in order
to diminish the effects of the foreground/background flaw in the segmentation module.

119
As expected, the results from a threshold of 85% outperform the results of the 90%
threshold. Nevertheless the system results with a threshold of 85% generated
approximately the double of false alarms than the test run with a threshold of 90%
(See figures below).
0
10
20
30
40
50
60
70
Num
ber o
f Fal
se A
larm
s
1 2 3 4 5 6 7 8Weights Configuration
False Alarms
False Alarms for T = 90% False Alarms for T = 85% Figure 56: False alarms
The system generated several false alarms (See Figure 56). For the test run with a
threshold of 85% the system generated a maximum of 68 false alarms. In the other
hand with a threshold of 90% the false alarms decrease drastically to a maximum
quantity of 32 false alarms. These results show that the threshold plays an important
role in making a balance between the artifact recognition accuracy and the generation
of false alarms. Lower thresholds will lead the system to a better recognition of
artifacts, but more false alarms. On the other hand, higher thresholds slightly decrease
the accuracy of the system in detecting artifacts, but diminish drastically the
generation of false alarms.

120
11.1%
13.1%
8.6%
13.1%
4.5%
11.9%
7.0%
13.1%
0%
2%
4%
6%
8%
10%
12%
14%
Fals
e A
larm
s pe
r C
ompo
nent
1 2 3 4 5 6 7 8Weights Configuration
Probability of False Alarms per Component
False alarms per component ( T = 90%) Figure 57: False alarms per component
75.0%
88.9%
58.3%
88.9%
30.6%
80.6%
47.2%
88.9%
0%10%20%30%40%50%60%70%80%90%
Fals
e A
larm
s pe
r Ins
tanc
e
1 2 3 4 5 6 7 8Weights Configuration
Probability of False Alarms per Instance
False alarms per instance (T = 90%) Figure 58: False alarms per instance
Figure 57 and Figure 58 show the probability of the system erroneously
recognizing an artifact per component and per instance, respectively. These
probabilities are for a threshold of 90%. The results obtained were excellent.
Nevertheless we were not satisfied with them. We understood that the results were
contaminated with the flaws in the segmentation module. In most of the tests, the
flaws make the system to wrongly detect lack-of-empty-space artifacts. For example
with the Weight Configuration number 1 all the false alarms were lack-of-empty-space

121
artifacts. Therefore we decided to remove the lack-of-empty-space artifact from the
case base. The results obtained are shown below.
Overall Performance and False Alarms Without Lack-of-Empty-Space Artifact
03 4 3
7
4 4
16
84.6%
76.9%
92.3%
88.5%
92.3%
88.5%
92.3%92.3%
0
2
4
6
8
10
12
14
16
18
1 2 3 4 5 6 7 8
Weights Configuration
Num
ber o
f Fal
se A
larm
s
65%
70%
75%
80%
85%
90%
95%
Acc
urac
y
False Alarms without LOES Without LOES (90%) Figure 59: Overall performance after removing LOES artifact-case
After removing the lack-of-empty-space (LOES) artifact the system accuracy
increases from 81.6% to 92.3%. Weights Configurations 1 and 2 show the same
accuracy, but the Configuration number 1 eliminated all false alarms. These results
show the impact of the flaw in the segmentation module to the artifact recognition
module. We expect that after fixing the flaws, the system should perform similar to the
results shown in Figure 59.
7.4 Chapter Review
This chapter exposed the results from the tests made to the K-BAR. The tests were
aimed to detect defects in 43 different test samples. The system was trained with 6
different artifacts, for a total 13 artifact-cases in the case base. We run the system over
these test samples and obtained an accuracy of 81.6% for a threshold of 90%. The

122
system achieves better recognition results with a lower threshold of 85%, but
generated too many false alarms. The results lead us to determine that the
segmentation module has two flaws: the unawareness of foreground and background,
and the inexact measurement of the text areas. To diminish the effects of these flaws
we remove the lack-of-empty-space artifact-case from the case base. This decision
increases the accuracy of the system to 92.3%. Finally we can conclude that the
knowledge-based artifact recognition system has shown excellent outcomes detecting
document defects.

123
8 CONCLUSIONS This thesis has presented a hybrid knowledge-based system capable of detecting
defects in digital documents. This hybrid expert system has proven to be a powerful
tool for the partial automation of the preflight and proofing processes in the Digital
Publishing workflow. This chapter exposes some final thoughts on the topic, and some
ideas for future research.
8.1 System limitations
As proof of concept we develop a system capable of detecting defects or artifacts
in Variable Data Jobs (VDJs). The VDJs are designed with a subset of the XSL-FO
standard and are of one page length. For the evaluation, the system requires that one
instance in the VDJ is approved by a proofing expert, but no assumptions were made
to select such instance. Therefore the remaining instances are evaluated given the
layout properties of this approved instance. In addition the system supports True-Type
fonts only. Currently the system does not have any programmed module to
communicate with external applications. New modules should be programmed in
order to incorporate other systems to the K-BAR or to share the case base knowledge
with other K-BAR. Finally the prototype was designed in the Java programming
language and tested in the Windows XP operative system. In Java, programmers have
the ability of creating multi-platform applications although we can not guarantee that
the system will run in other operative systems since there could be some file path
dependencies with the Windows XP platform.

124
The document segmentation and understanding module has a limited functionality.
Currently the segmentation is based exclusively on the detection of strong lines. No
other criteria are used as starting point to determine the strength of the components
relations. If some components are not in the same strong line the system does not
apply other design principles in order to evaluate the components relation. In addition
the system only supports a segmentation analysis with vertical strong lines. Finally in
the document understanding analysis the systems only assigns logical types of text,
image, paragraph and headings.
There are additional system constraints in the artifact recognition module. At
present the system is trained to detect six different artifacts: missing-component,
overlapping, lack-of-empty-space, typeface-family-change, typeface-size-change, and
typeface-style-change artifacts. Finally there is no constraint to select the artifacts to
be used for training.
8.2 Contributions
There are many contributions from this research. One of the advantages of our
research was that, to the best of our knowledge, no other research had dealt or deals
with our problem. Therefore our methodology can be considered as a pioneer
approach or effort to achieve a partial automation of the evaluation of VDJs in Digital
Publishing (DP). We designed a model for a knowledge-based artifact recognition
system, which establishes the required modules and their respective tasks. The
knowledge-based system was implemented with a hybrid expert system composed of
rule-based reasoning and case-based reasoning. In addition this model contemplates

125
the interaction of the K-BAR system with the other modules in the DP’s workflow.
Finally additional collaborations are described in the following two subsections for the
system main modules: the document segmentation and understanding module, and the
artifact recognition module.
8.2.1 Document segmentation and understanding
We presented a novel technique for document segmentation and understanding.
The technique is based on design principles. This approach assumes that digital
document designers arrange components inside the document pages consciously. The
components are not just placed closer at random, or are not aligned to save space.
Designers make use of design principles to convey a message, a message that is
encoded in the document pages. Therefore with our document segmentation and
understanding module we established the guides to decode the designer message in
order to artificially understand the logical meaning of the document components and
consequently gather the required knowledge to achieve an artificial detection of
document defects in variable data jobs.
8.2.2 Artifact recognition
. This thesis gives details on how to measure, manage, and process the artifact
properties in order to achieve an accurate artifact recognition system. We recognize
that the print shops proofing experts rely on their past experiences to decide whether
or not a job contains defects. Based on that belief we implemented the artifact
recognition tool with case-based reasoning techniques. The CBR technique used in our
research used the Nearest Neighbor Algorithm. We found that if a component is

126
identified as defective, we can characterize its current geometric and qualitative
properties and store them in a case. Later we can retrieve these characterized defects to
evaluate digital documents. The defects were classified in three main groups;
component-dependent artifacts, constraint-dependent artifacts, and style-dependent
artifacts. The properties found to be relevant for the detection of artifacts are: the page
white space, the size of the defective component, the distance of the defective
component to neighboring components or margins, if components overlap, if
components violate page margins, typeface change in text components, the type of the
defective component, and the expected component type. In addition to these features
we determined four additional properties that can be used to conduct a personalized
analysis of the job in evaluation. They are: the customer expertise, the audience
expertise, the audience age group, and the audience visual sensitivity.
8.3 Future work
Research answers questions, but almost most of them generate additional
questions. Our research is not the exception. From our investigation we determined
that CBR is a suitable approach for artifact recognition, segment the document with
design principles, and develop additional strategies to strengthen the foundations of
our framework. Nevertheless there are other areas to explore and parts of the system
that need improvements. This section describes relevant future research and system
improvements.
127
8.3.1 Architecture
The architecture of the K-BAR can be substantially modified, in order to provide
additional functionality to the DP print shop and extend the capabilities of the system.
First, it is appropriate to extend the supported page length of the documents. Second, it
will be interesting to implement the Web-based model, in order to evaluate and
determine the strengths and weakness of knowledge sharing for our system. Finally a
module should be added to the K-BAR to gather information from previous process in
order to optimize the system analysis, for example, extracting the required
client/audience metadata from the intent stage in order to implement the Personalized
Criteria Analysis.
8.3.2 Document segmentation and understanding
There is a potential use of the document segmentation and understanding tool for
semantic web and knowledge management. This novel approach can help researches
to artificially understand the content of web pages and text documents. To achieve
such goal the document segmentation and understanding tool needs several
improvements.
The improvements for the segmentation are: First, the system should fully comply
with the XSL-FO standard and other formatting languages. This will make the system
support any type of job or context arrangement. Second, the measure of the height and
width of text areas should improve. Third, the system should differentiate components
that are in the background from components that are placed in the foreground. Fourth,

128
in order to make a more complete segmentation, the system should not only detect
vertical strong lines, but horizontal strong lines too.
The improvements for the document understanding task are: First, for more
complex documents it is required that the system assigns additional logical types, such
as caption of an image, header, footer, and so on. Second, the system should create
relationships between components that are beyond the alignment principle. For
example very close component, but unaligned, can be grouped by the proximity and
similarity principle.
8.3.3 Artifact recognition
The artifact recognition tool can be also modified. This tool has a potential use
beyond documents for publication. It can be used to evaluate web pages or any
document type whose contents is arranged given a particular template. There are still
some additional improvements to the tool. First, the graphical interface for learning
should be developed. Second, our system has a case base of 13 cases. Real systems
could have hundreds of cases. Consequently the matching algorithm should be
improved, because currently the system compares the anomaly-case with all the
artifact-cases in the case base and this could produce a processing overload in a larger
case base. Therefore some type of case indexing should be appropriate in order to
substantially reduce the number of artifact-cases to process. There should be an
extensive study on the case feature weights. Our results show that different weights
configurations change the output of the system. This study should determine the most
favorable configuration that optimizes the system performance. Finally, the system

129
evaluates the anomalies individually, and if an artifact is found, it returns a rating of
the negative effect of the artifact oin the aesthetics of the document. Future versions of
the K-BAR should return a rating of the negative effects of all the artifacts found in
the page. In this way we can measure the overall quality of the system, instead of the
severity of a single artifact.
8.4 Achievements
Ever since we initiated our research of previous work and our first ideas to solve
the problem, we setup several goals to guide the investigation forward and measure
the progress. From our goals we can establish that we have achieved: The
characterization of defects. To design the K-BAR we characterized defects identifying
several attributes that could be represented in a machine readable format. We
established the methodology to extract, manage, and process the characterized artifacts
with our architecture. We implemented a rule-based system which extracts the
required knowledge for the analysis and represents the document anomalies. The
system included a case-based system responsible for evaluating the represented
anomalies and determine if the anomaly is an artifact. Finally from our results we can
determine that we develop a hybrid knowledge-based system capable of identifying
artifacts inside VDJs. Consequently we can conclude that a hybrid knowledge-based
system is an appropriate tool to detect defects for Variable Data Printing.

130
9 REFERENCES [1] C. Sayers and R. Letsinger, “An Ontology for Publishing and Scheduling
Events and the Lessons Learned in Developing It”, Software Technology Laboratory, HP Laboratories, Technical Report HPL-2002-162, Palo Alto, CA USA, June 2002.
[2] D. Collier, “Collier’s Rules for Desktop Design and Typography”, Addison-Wesley, 1991.
[3] D. Malerba, F. Esposito, O. Altamura, M. Ceci, and M. Berardi, “Correcting the Document Layout: A Machine Learning Approach”, Seventh International Conference on Document Analysis and Recognition, August 2003, Vol. 1, pages 97 – 102.
[4] F. Esposito, D. Malerba, and G. Semeraro, “A Knowledge-Based Approach to the Layout Analysis”, Proceedings of the Third International Conference on Document Analysis and Recognition, Montreal, Canada, August 1995, Vol.1, pages 466 – 471.
[5] F. Esposito, D. Malerba, G. Semeraro, E. Annese, and G. Scafuro, “An Experimental Page Layout Recognition System for Office Document Automatic Classification: An Integrated Approach for Inductive Generalization”, Proceedings of the 10th International Conference on Pattern Recognition, Atlantic City, NJ USA, June 1990, Vol. 1, pages 557 – 562.
[6] E. Friedman-Hill, “Jess in Action: Rule-based Systems in Java”, Manning Publications, 2003, pages xxi, 15-16.
[7] G. K. Holman, “Definitive XSL-FO”, Prentice Hall, 2003. [8] G.A. Triantafyllidis, D. Tzovaras, and M.G. Strintzis, “Detection of blocking
artifacts of compressed still images”, Proceedings 11th International Conference on Image Analysis and Processing, Palermo Italy, September 2001, pages 607 – 611.
[9] H. Chao and J. Fan, “Layout and Content Extraction for PDF Documents”, IAPR Int. Workshop on Document Analysis Systems, Florence, Italy, September 2004.
[10] H. K. Lee, Y. C. Choy, and S. B. Cho, “Logical Structure Analysis and Generation for Structured Documents: A Syntactic Approach”, IEEE Transactions on Knowledge and Data Engineering, September 2003, Vol. 15 Issue 5, pages 1277 – 1294.
[11] J. McClellan, “Artifacts in Alpha-Rooting of Images”, IEEE International Conference on ICASSP '80, Acoustics, Speech, and Signal Processing, April 1980, Vol. 5, pages 449 – 452.
[12] P. Jackson, “Introduction to Expert Systems”, Addison-Wesley, 1999, 3rd Edition, pages 4-8.

131
[13] K. H. Lee, Y. C. COI , and S. B. Cho, “Geometric Structure Analysis of Document Images: a Knowledge-Based Approach”, IEEE Transactions on Pattern Analysis and Machine Intelligence, November 2000, Vol. 22, Issue 11, pages 1224 – 1240.
[14] M. L. Kleper, “The Handbook of Digital Publishing”, Graphic Dimensions, Prentice Hall, 2001, Vol. 1, pages XXVII – XXXVI.
[15] L. Purvis, S. Harrington, B. O'Sullivan, and E. C. Freuder, “Creating Personalized Documents: An Optimization Approach”, Proceedings of the 2003 ACM symposium on Document Engineering, Grenoble France, 2003, pages 68 – 77.
[16] M.C.Q. Farias, S.K. Mitra, and J.M. Foley, “Perceptual contributions of blocky, blurry and noisy artifacts to overall annoyance”, Proceedings International Conference on Multimedia and Expo, July 2003, Vol. 1, pages 529-32.
[17] A. Politis, “Digital Printing: finishing technologies making digitally printed documents professional”, XML Europe 2000 Conference, June 2000, Paris France.
[18] R. H. Chi and M. Y. Kiang, “An Integrated Approach of Rule-Based and Case-Based Reasoning for Decision Support”, ACM Annual Computer Science Conference, San Antonio, Texas USA, 1999, pages 255 – 267.
[19] R. P. Jones, J. F. Naveda, P. Roetling, S. J. Harrington, and N. Thakkar, “On the Structure of Style Space for Documents”, AAAI Fall Symposium Style and Meaning in Language, Art, Music, and Design, Arlington, Virginia USA, October 2004, page 64.
[20] J. Roth, “Demonstrating the Power of Personalized Comminication”, Digital Printing Council, February 2003.
[21] S. Bandini, and S. Manzoni, “Application of fuzzy indexing and retrieval in case based reasoning for design”, Proceedings of the 2001 ACM Symposium on Applied Computing, Las Vegas, Nevada USA, 2001, pages 462 – 466.
[22] S. J. Harrington, J. F. Naveda, R. P. Jones, P. Roetling, and N. Thakkar, “Aesthetic Measures for Automated Document Layout”, Proceedings of the 2004 ACM symposium on Document engineering, Milwaukee, Wisconsin USA, 2004, pages 109 – 111.
[23] S. Smith and A. Kandel, “Verification and Validation of Rule-Based Expert Systems”, CRC Press, 1993.
[24] T. A. Mostek, K. D. Forbus, and C. Meverden, “Dynamic Case Creation and Expansion for Analogical Reasoning”, Proceedings of the Seventeenth National Conference on Artificial Intelligence and Twelfth Conference on Innovative Applications of Artificial Intelligence, 2000, pages 323 – 329.

132
[25] S. M. Topping, “Graphic design and color in today’s office”, KODAK Publication, W-628, 1990.
[26] V. Hao-Song Kong and A. Huifang Sun, “Edge map guided adaptive post-filter for blocking and ringing artifacts removal”, Proceedings of the 2004 International Symposium on Circuits and Systems, May 2004, Vol. 3, pages 929-32.
[27] W. Jang and J. P. Allebach, “Simulation of Print Quality Defects”, International Conference on Digital Printing Technologies, San Diego, California USA, September 2002, pages 543-548.
[28] W. Jang, M.C. Chen, J. P. Allebach, and G. T.-C. Chiu, “Print Quality Test Page”, The Journal of Imaging Science and Technology, September 2004, Vol. 48, Issue 5, pages 432-446.
[29] W. Rivera, M. Rodriguez-Martinez, N. Santiago, F. Vega, T. Avellanet, G. Chaparro, W. Lozano, A. Pereira, and H. Santos-Villalobos, “Towards Development of Concepts and Algorithms to Enable Automated Digital Publishing Workflows”, Submitted to the 20th IEEE/ACM International Conference on Automated Software Engineering, Long Beach, California, USA, November 2005.
[30] I. Watson, “Applying Case-Based Reasoning: Techniques for Enterprise Systems”, Morgan Kaufmann, 1997, pages 11-3.
[31] A. White, “The Elements of Graphic Design”, Allworth Press, 2002. [32] R. Williams, “The Non-Designer’s Design Book”, Peachpit Press, 2nd
Edition, 2004. [33] Y.H. Fok, O.C. Au, and C. Chang, “Bit rate and blocking artifact reduction
by iterative pre-distortion”, Proceedings International Conference on Image Processing, Lausanne Switzerland, September 1996, Vol. 2, Pages: 13 – 16.