Embed Size (px)
Citation preview

1
SECURITIES AND EXCHANGE COMMISSION
WASHINGTON, D.C. 20549
FORM 10-K
FOR ANNUAL AND TRANSITION REPORTS
PURSUANT TO SECTION 13 OR 15(d) THE SECURITIES EXCHANGE ACT OF 1934
(Mark One)
ANNUAL REPORT PURSUANT TO SECTION 13 OR 15(d) OF THE SECURITIES EXCHANGE ACT OF 1934
For the fiscal year ended December 31, 2015
OR
TRANSITION REPORT PURSUANT TO SECTION 13 OR 15(d) OF THE SECURITIES EXCHANGE ACT OF 1934
For the transition period from ____________ to ___________
Commission File Number 0-4776
STURM, RUGER & COMPANY, INC. (Exact Name of Registrant as Specified in Its Charter)
Delaware (State or Other Jurisdiction of Incorporation or Organization)
06-0633559 (I.R.S. Employer
Identification No.)
Lacey Place, Southport, Connecticut (Address of Principal Executive Offices)
06890 (Zip Code)
(203) 259-7843 (Registrant’s telephone number, including area code)
Securities registered pursuant to Section 12(b) of the Act:
Title of Each Class Common Stock, $1 par value
Name of Each Exchange on Which Registered
New York Stock Exchange
Securities registered pursuant to Section 12(g) of the Act:
None
(Title of Class)
Indicate by check mark if the registrant is a well-known seasoned issuer, as defined in Rule 405 of the Securities Act. YES NO Indicate by check mark if the registrant is not required to file reports pursuant to Section 13 or Section 15(d) of the Act. YES NO Indicate by check mark whether the registrant (1) has filed all reports required to be filed by Section 13 or 15(d) of the Securities Exchange Act
of 1934 during the preceding 12 months (or for such shorter period that the registrant was required to file such reports), and (2) has been subject
to such filing requirements for the past 90 days. YES NO
Indicate by check mark if disclosure of delinquent filers pursuant to Item 405 of Regulation S-K is not contained herein, and will not be
contained, to the best of registrant's knowledge, in definitive proxy or information statements incorporated by reference in Part III of this Form
10-K or any amendment to this Form 10-K [ ].
Indicate by check mark whether the registrant is a large accelerated filer, an accelerated filer, or a non-accelerated filer. See definition of
“accelerated filer and large accelerated filer” in Rule 12b-2 of the Exchange Act. Large accelerated filer [ ] Accelerated filer [ ] Non-
accelerated filer [ ] Smaller reporting company [ ].
Indicate by check mark whether the registrant is a shell company (as defined in Rule 12b-2 of the Exchange Act).YES NO
Indicate by check mark whether the registrant has submitted electronically and posted on its corporate Web site, if any, every
Interactive Data File required to be submitted and posted pursuant to Rule 405 of Regulation S-T (§ 232.405 of this chapter)
during the preceding 12 months (or for such shorter period that the registrant was required to submit and post such files).
YES NO
The aggregate market value of the voting and non-voting common equity held by non-affiliates of the registrant computed by reference to the
price at which the common equity was last sold, or the average bid and asked price of such common equity, as of June 30, 2015:
Common Stock, $1 par value - $1,076,441,000
The number of shares outstanding of the registrant's common stock as of February 22, 2016:
Common Stock, $1 par value –18,946,000 shares
DOCUMENTS INCORPORATED BY REFERENCE.
Portions of the registrant’s Proxy Statement relating to the 2016 Annual Meeting of Stockholders to be held May 3, 2016 are incorporated by
reference into Part III (Items 10 through 14) of this Report.

2
TABLE OF CONTENTS PART I
Item 1. Business.…………………………………..………………………………………………………….. 4
Item 1A. Risk Factors…………………………………………………………………………………………… 10
Item 1B. Unresolved Staff Comments………………………………………………………………………….. 13
Item 2. Properties.…………………………………………………………………………………………….. 14
Item 3. Legal Proceedings....………………………………………………………………………………….. 15
Item 4. Mine Safety Disclosures………………………………………………................................................. 15
PART II
Item 5. Market for Registrant’s Common Equity, Related Stockholder Matters and Issuer
Purchases of Equity Securities.……………………………………………………………………...
16
Item 6. Selected Financial Data………………………………………………………………………………. 19
Item 7. Management’s Discussion and Analysis of Financial Condition and Results of Operations………… 20
Item 7A. Quantitative and Qualitative Disclosures About Market Risk………………………………………... 45
Item 8. Consolidated Financial Statements and Supplementary Data…………………………………… . 46
Item 9. Changes in and Disagreements With Accountants on Accounting and Financial Disclosure ………. 73
Item 9A. Controls and Procedures.……………………………………………………………………………... 73
Item 9B. Other Information.……………………………………………………………………………………. 74
PART III
Item 10. Directors, Executive Officers and Corporate Governance……………………………………………. 74
Item 11. Executive Compensation.……………………………………………………………………………... 74
Item 12. Security Ownership of Certain Beneficial Owners and Management and Related Stockholder
Matters.……………………………………………………………………………………………...
74
Item 13. Certain Relationships and Related Transactions, and Director Independence……………………….. 75
Item 14. Principal Accountant Fees and Services….…………………………………………………………... 75

3
PART IV
Item 15. Exhibits and Financial Statement Schedules..………………………………………………………... 76
Signatures…... ………………………………………………………………………………………………………… 81
Exhibit Index.. ………………………………………………………………………………………………………… 82
Financial Statement Schedule... ……………………………………………………………………………………….. 87
Exhibits……... ……………………………………………………………………………………………………….... 89
EXPLANATORY NOTE:
In this Annual Report on Form 10-K, Sturm, Ruger & Company, Inc. and Subsidiary (the “Company”) makes forward-
looking statements and projections concerning future expectations. Such statements are based on current expectations and
are subject to certain qualifying risks and uncertainties, such as market demand, sales levels of firearms, anticipated
castings sales and earnings, the need for external financing for operations or capital expenditures, the results of pending
litigation against the Company, the impact of future firearms control and environmental legislation, and accounting
estimates, any one or more of which could cause actual results to differ materially from those projected. Words such as
“expect,” “believe,” “anticipate,” “intend,” “estimate,” “will,” “should,” “could” and other words and terms of similar
meaning, typically identify such forward-looking statements. Readers are cautioned not to place undue reliance on these
forward-looking statements, which speak only as of the date made. The Company undertakes no obligation to publish
revised forward-looking statements to reflect events or circumstances after the date such forward-looking statements are
made or to reflect the occurrence of subsequent unanticipated events.

4
PART I ITEM 1—BUSINESS Company Overview
Sturm, Ruger & Company, Inc. and Subsidiary (the “Company”) is principally engaged in the
design, manufacture, and sale of firearms to domestic customers. Virtually all of the Company’s
sales for the year ended December 31, 2015 were from the firearms segment, with approximately
1% from the castings segment. Export sales represent approximately 4% of firearms sales. The
Company’s design and manufacturing operations are located in the United States and almost all
product content is domestic.
The Company has been in business since 1949 and was incorporated in its present form under the
laws of Delaware in 1969. The Company primarily offers products in three industry product
categories – rifles, pistols, and revolvers. The Company’s firearms are sold through independent
wholesale distributors, principally to the commercial sporting market.
The Company manufactures and sells investment castings made from steel alloys and metal
injection molding (“MIM”) parts for internal use in the firearms segment and has minimal sales
to outside customers. The castings and MIM parts sold to outside customers, either directly or
through manufacturers’ representatives, represented approximately 1% of the Company’s total
sales for the year ended December 31, 2015. For the years ended December 31, 2015, 2014, and 2013, net sales attributable to the Company's
firearms operations were approximately $544.9 million, $542.3 million and $678.6 million, or
virtually all of the total net sales in each year. The balance of the Company's net sales for the
aforementioned periods was attributable to its castings operations.
Firearms Products
The Company presently manufactures firearm products, under the “Ruger” name and trademark,
in the following industry categories: Rifles Revolvers
Single-shot Single-action Autoloading Double-action Bolt-action Modern sporting
Pistols
Rimfire autoloading Centerfire autoloading
Most firearms are available in several models based upon caliber, finish, barrel length, and other
features.

5
Rifles
A rifle is a long gun with spiral grooves cut into the interior of the barrel to give the bullet a
stabilizing spin after it leaves the barrel. Sales of rifles by the Company accounted for
approximately $208.5 million, $203.9 million, and $217.6 million of total net sales for the years
2015, 2014, and 2013, respectively.
Pistols
A pistol is a handgun in which the ammunition chamber is an integral part of the barrel and
which typically is fed ammunition from a magazine contained in the grip. Net sales of pistols by
the Company accounted for approximately $192.2 million, $198.2 million, and $293.5 million of
revenues for the years 2015, 2014, and 2013, respectively.
Revolvers
A revolver is a handgun that has a cylinder that holds the ammunition in a series of chambers
which are successively aligned with the barrel of the gun during each firing cycle. There are two
general types of revolvers, single-action and double-action. To fire a single-action revolver, the
hammer is pulled back to cock the gun and align the cylinder before the trigger is pulled. To fire
a double-action revolver, a single trigger pull advances the cylinder and cocks and releases the
hammer. Net sales of revolvers by the Company accounted for approximately $113.3 million,
$112.8 million, and $108.2 million of revenues for the years 2015, 2014, and 2013, respectively.
Accessories
The Company also manufactures and sells accessories and replacement parts for its firearms.
These sales accounted for approximately $30.3 million, $23.9 million, and $59.3 million of total
net sales for the years 2015, 2014, and 2013, respectively.
Castings Products
Net sales attributable to the Company’s casting operations (excluding intercompany transactions)
accounted for approximately $6.2 million, $2.2 million, and $9.7 million, for 2015, 2014, and
2013, respectively. These sales represented approximately 1% of total net sales in each of these
years.
Manufacturing
Firearms
The Company produces one model of pistol, all of its revolvers and most of its rifles at the
Newport, New Hampshire facility. Most of the Company’s pistols are produced at the Prescott,
Arizona facility. Some rifle models and one pistol model are produced at the Mayodan, North
Carolina facility, which began operations in the latter months of 2013.
Many of the basic metal component parts of the firearms manufactured by the Company are
produced by the Company's castings segment through processes known as precision investment
casting. The Company also uses many MIM parts in its firearms. See "Manufacturing-Castings"
below for a description of these processes. The Company believes that investment castings and
MIM parts provide greater design flexibility and result in component parts which are generally
close to their ultimate shape and, therefore, require less machining than processes requiring

6
machining a solid billet of metal to obtain a part. Through the use of investment castings and
MIM parts, the Company endeavors to produce durable and less costly component parts for its
firearms.
All assembly, inspection, and testing of firearms manufactured by the Company are performed at
the Company's manufacturing facilities. Every firearm, including every chamber of every
revolver manufactured by the Company, is test-fired prior to shipment.
Investment Castings and Metal Injected Moldings
To produce a product by the investment casting method, a wax model of the part is created and
coated (“invested”) with several layers of ceramic material. The shell is then heated to melt the
interior wax, which is poured off, leaving a hollow mold. To cast the desired part, molten metal
is poured into the mold and allowed to cool and solidify. The mold is then broken off to reveal a
near net shape cast metal part.
Metal injection molding is a metalworking process by which finely-powdered metal is mixed
with a measured amount of binder material to comprise a feedstock capable of being handled by
plastic processing equipment through a process known as injection mold forming. The molding
process allows complex parts to be shaped in a single operation and in high volume.
Marketing and Distribution
Firearms
The Company's firearms are primarily marketed through a network of federally licensed,
independent wholesale distributors who purchase the products directly from the Company. They
resell to federally licensed, independent retail firearms dealers who in turn resell to legally
authorized end users. All retail purchasers are subject to a point-of-sale background check by
law enforcement. These end users include sportsmen, hunters, people interested in self-defense,
law enforcement and other governmental organizations, and gun collectors. Each distributor
carries the entire line of firearms manufactured by the Company for the commercial market.
Currently, 20 distributors service the domestic commercial market, with an additional 24
distributors servicing the domestic law enforcement market and two distributors servicing the
Canadian market.
In 2015, the Company’s largest customers and the percent of total sales they represented were as
follows: Davidson’s-18%; Lipsey’s-17%; Sports South-13%, and Jerry’s/Ellett Brothers-11%.
In 2014, the Company’s largest customers and the percent of total sales they represented were as
follows: Davidson’s-19%; Lipsey’s-13%; Sports South-13%, and Jerry’s/Ellett Brothers-12%.
In 2013, the Company’s largest customers and the percent of total sales they represented were as
follows: Davidson’s-16%; Jerry’s/Ellett Brothers-14%; Lipsey’s-14%; and Sports South-11%.
The Company employs 15 employees who service these distributors and call on retailers and law
enforcement agencies. Because the ultimate demand for the Company's firearms comes from
end users rather than from the independent wholesale distributors, the Company believes that the

7
loss of any distributor would not have a material, long-term adverse effect on the Company, but
may have a material adverse effect on the Company’s financial results for a particular period.
The Company considers its relationships with its distributors to be satisfactory.
The Company also exports its firearms through a network of selected commercial distributors
and directly to certain foreign customers, consisting primarily of law enforcement agencies and
foreign governments. Foreign sales were less than 5% of the Company's consolidated net sales
for each of the past three fiscal years.
The Company does not consider its overall firearms business to be predictably seasonal;
however, orders of many models of firearms from the distributors tend to be stronger in the first
quarter of the year and weaker in the third quarter of the year. This is due in part to the timing of
the distributor show season, which occurs during the first quarter.
Castings
The castings segment provides castings and MIM parts for the Company’s firearms segment. In
addition, the castings segment produces some products for a number of customers in a variety of
industries.
Competition
Firearms
Competition in the firearms industry is intense and comes from both foreign and domestic
manufacturers. While some of these competitors concentrate on a single industry product
category such as rifles or pistols, several competitors manufacture products in all four industry
categories (rifles, shotguns, pistols, and revolvers). Some of these competitors are subsidiaries
of larger corporations than the Company with substantially greater financial resources than the
Company, which could affect the Company’s ability to compete. The principal methods of
competition in the industry are product innovation, quality, availability, and price. The
Company believes that it can compete effectively with all of its present competitors.
Castings
There are a large number of investment castings and MIM manufacturers, both domestic and
foreign, with which the Company competes. Competition varies based on the type of investment
castings products and the end use of the product (commercial, sporting goods, or military).
Companies offering alternative methods of manufacturing such as wire electric discharge
machining (EDM) and advancements in computer numeric controlled (CNC) machining also
compete with the Company’s castings segment. Many of these competitors are larger
corporations than the Company with substantially greater financial resources than the Company,
which could affect the Company’s ability to compete with these competitors. The principal
methods of competition in the industry are quality, price, and production lead time.

8
Employees
As of February 1, 2016, the Company employed approximately 1,920 full-time employees of
which approximately 27% had at least ten years of service with the Company. The Company
uses temporary employees to supplement its workforce. As of February 1, 2016, there were
approximately 260 temporary employees.
None of the Company's employees are subject to a collective bargaining agreement.
Research and Development
In 2015, 2014, and 2013, the Company spent approximately $8.5 million, $10.0 million, and $6.2
million, respectively, on research and development activities relating to new products and the
improvement of existing products. As of February 1, 2016, the Company had approximately 115
employees whose primary responsibilities were research and development activities.
Patents and Trademarks
The Company owns various United States and foreign patents and trademarks which have been
secured over a period of years and which expire at various times. It is the policy of the Company
to apply for patents and trademarks whenever new products or processes deemed commercially
valuable are developed or marketed by the Company. However, none of these patents and
trademarks are considered to be fundamental to any important product or manufacturing process
of the Company and, although the Company deems its patents and trademarks to be of value, it
does not consider its business materially dependent on patent or trademark protection.
Environmental Matters
The Company is committed to achieving high standards of environmental quality and product
safety, and strives to provide a safe and healthy workplace for its employees and others in the
communities in which it operates. The Company has programs in place that monitor compliance
with various environmental regulations. However, in the normal course of its manufacturing
operations the Company is subject to governmental proceedings and orders pertaining to waste
disposal, air emissions, and water discharges into the environment. These regulations are
integrated into the Company’s manufacturing, assembly, and testing processes. The Company
believes that it is generally in compliance with applicable environmental regulations and that the
outcome of any environmental proceedings and orders will not have a material adverse effect on
the financial position of the Company, but could have a material adverse effect on the financial
results for a particular period.

9
Executive Officers of the Company
Set forth below are the names, ages, and positions of the executive officers of the Company.
Officers serve at the discretion of the Board of Directors of the Company. Name Age Position With Company Michael O. Fifer
58
Chief Executive Officer
Christopher J. Killoy 57 President and Chief Operating Officer Thomas A. Dineen 47 Vice President, Treasurer and Chief Financial Officer Mark T. Lang 59 Group Vice President Thomas P. Sullivan 55 Vice President of Newport Operations Kevin B. Reid, Sr. 55 Vice President, General Counsel and Corporate
Secretary Steven M. Maynard 61 Vice President of Lean Business Development Shawn C. Leska 44 Vice President, Sales
Michael O. Fifer joined the Company as Chief Executive Officer on September 25, 2006, and
was named to the Board of Directors on October 19, 2006. Mr. Fifer also served as President
from April 23, 2008 to December 31, 2013.
Christopher J. Killoy became President and Chief Operating Officer on January 1, 2014.
Previously he served as Vice President of Sales and Marketing since November 27, 2006. Mr.
Killoy originally joined the Company in 2003 as Executive Director of Sales and Marketing, and
subsequently served as Vice President of Sales and Marketing from November 1, 2004 to
January 25, 2005.
Thomas A. Dineen became Vice President on May 24, 2006. Previously he served as Treasurer
and Chief Financial Officer since May 6, 2003 and had been Assistant Controller since 2001.
Prior to that, Mr. Dineen had served as Manager, Corporate Accounting since 1997.
Mark T. Lang joined the Company as Group Vice President on February 18, 2008. Mr. Lang is
responsible for management of the Prescott Firearms Division, the MIM subsidiary, and the
Company’s acquisition efforts. Prior to joining the Company, Mr. Lang was President of the
Custom Products Business at Mueller Industries, Inc. Prior to joining Mueller, Mr. Lang was the
Vice President of Operations for the Automotive Division of Thomas and Betts, Inc.
Thomas P. Sullivan joined the Company as Vice President of Newport Operations for the
Newport, New Hampshire Firearms and Pine Tree Castings divisions on August 14, 2006. Mr.
Sullivan is also responsible for the Mayodan, North Carolina Firearms Division.
10
Kevin B. Reid, Sr. became Vice President and General Counsel on April 23, 2008. Previously he
served as the Company’s Director of Marketing from June 4, 2007. Mr. Reid joined the
Company in July 2001 as an Assistant General Counsel.
Steven M. Maynard joined the Company as Vice President of Lean Business Development on
April 24, 2007. Prior to joining the Company, Mr. Maynard served as Vice President of
Engineering and CIO at the Wiremold Company.
Shawn C. Leska became Vice President, Sales on November 6, 2015. Mr. Leska joined the
Company in 1989, and has served in a variety of positions in the sales department. Most
recently, Mr. Leska served as Director of Sales since 2011.
Where You Can Find More Information
The Company is subject to the informational requirements of the Securities and Exchange Act of
1934, as amended (the "Exchange Act"), and accordingly, files its Annual Report on Form 10-K,
Quarterly Reports on Form 10-Q, Definitive Proxy Statements, Current Reports on Form 8-K,
and other information with the Securities and Exchange Commission (the "SEC"). The public
may read and copy any materials filed with the SEC at the SEC's Public Reference Room at 100
F Street NE, Washington, DC 20549. Please call the SEC at (800) SEC-0330 for further
information on the Public Reference Room. As an electronic filer, the Company's public filings
are maintained on the SEC's Internet site that contains reports, proxy and information statements,
and other information regarding issuers that file electronically with the SEC. The address of that
website is http://www.sec.gov.
The Company makes its Annual Report on Form 10-K, Quarterly Reports on Form 10-Q,
Definitive Proxy Statements, Current Reports on Form 8-K and amendments to those reports
filed or furnished pursuant to Section 13(a) or 15(d) of the Exchange Act accessible free of
charge through the Company's Internet site after the Company has electronically filed such
material with, or furnished it to, the SEC. The address of that website is http://www.ruger.com.
However, such reports may not be accessible through the Company's website as promptly as they
are accessible on the SEC’s website.
Additionally, the Company’s corporate governance materials, including its Corporate
Governance Guidelines, the charters of the Audit, Compensation, and Nominating and Corporate
Governance committees, and the Code of Business Conduct and Ethics may also be found under
the “Stockholder Relations” subsection of the “Corporate” section of the Company’s Internet site
at http://www.ruger.com/corporate. A copy of the foregoing corporate governance materials is
available upon written request to the Corporate Secretary at Sturm, Ruger & Company, Inc.,
Lacey Place, Southport, Connecticut 06890. ITEM 1A—RISK FACTORS
The Company’s operations could be affected by various risks, many of which are beyond its
control. Based on current information, the Company believes that the following identifies the

11
most significant risk factors that could adversely affect its business. Past financial performance
may not be a reliable indicator of future performance and historical trends should not be used to
anticipate results or trends in future periods.
In evaluating the Company’s business, the following risk factors, as well as other information in
this report, should be carefully considered.
Changes in government policies and firearms legislation could adversely affect the
Company’s financial results.
The sale, purchase, ownership, and use of firearms are subject to thousands of federal, state and
local governmental regulations. The basic federal laws are the National Firearms Act, the
Federal Firearms Act, and the Gun Control Act of 1968. These laws generally prohibit the
private ownership of fully automatic weapons and place certain restrictions on the interstate sale
of firearms unless certain licenses are obtained. The Company does not manufacture fully
automatic weapons and holds all necessary licenses under these federal laws. Several states
currently have laws in effect similar to the aforementioned legislation.
Until November 30, 1998, the “Brady Law” mandated a nationwide five-day waiting period and
background check prior to the purchase of a handgun. As of November 30, 1998, the National
Instant Criminal Background Check System, which applies to both handguns and long guns,
replaced the five-day waiting period. The Company believes that the “Brady Law” and the
National Instant Criminal Background Check System have not had a significant effect on the
Company’s sales of firearms, nor does the Company anticipate any significant impact on sales in
the future. On September 13, 1994, the “Violent Crime Control and Law Enforcement Act”
banned so-called “assault weapons.” All the Company’s then-manufactured commercially-sold
long guns were exempted by name as “legitimate sporting firearms.” This ban expired by
operation of law on September 13, 2004. The Company remains strongly opposed to laws which
would restrict the rights of law-abiding citizens to lawfully acquire firearms.
In 2005, Congress enacted the Protection of Lawful Commerce in Arms Act (“PLCAA”). The
PLCAA was enacted to address abuses by cities and agenda-driven individuals who wrongly
sought to make firearms manufacturers liable for legally manufactured and lawfully sold
products if those products were later used in criminal acts. The Company believes the PLCAA
merely codifies common sense and long standing tort principles. If the PLCAA is repealed or
efforts to circumvent it are successful and lawsuits similar to those filed by cities and agenda-
driven individuals in the late 1990s and early 2000s are allowed to proceed, it could have a
material adverse impact on the Company.
Currently, federal and several states’ legislatures are considering additional legislation relating to
the regulation of firearms. These proposed bills are extremely varied, but many seek either to
restrict or ban the sale and, in some cases, the ownership of various types of firearms. Other
legislation seeks to require new technologies, such as microstamping and so-called “smart gun”
technology, that are not proven, reliable or feasible. Such legislation became effective in
California in 2013, and has limited our ability to sell certain products in California. If similar
legislation is enacted in other states, it could effectively ban or severely limit the sale of affected
firearms. There also are legislative proposals to limit magazine capacity.

12
The Company believes that the lawful private ownership of firearms is guaranteed by the Second
Amendment to the United States Constitution and that the widespread private ownership of
firearms in the United States will continue. However, there can be no assurance that the
regulation of firearms will not become more restrictive in the future and that any such restriction
would not have a material adverse effect on the business of the Company.
The Company’s results of operations could be further adversely affected if legislation with
diverse requirements is enacted.
With literally thousands of laws being proposed at the federal, state and local levels, if even a
small percentage of these laws are enacted and they are incongruent, the Company could find it
difficult, expensive or even practically impossible to comply with them, impeding new product
development and distribution of existing products.
The Company’s results of operations could be adversely affected by litigation.
The Company faces risks arising from various asserted and unasserted litigation matters. These
matters include, but are not limited to, assertions of allegedly defective product design or
manufacture, alleged failure to warn, purported class actions against firearms manufacturers,
generally seeking relief such as medical expense reimbursement, property damages, and punitive
damages arising from accidents involving firearms or the criminal misuse of firearms, and those
lawsuits filed on behalf of municipalities alleging harm to the general public. Various factors or
developments can lead to changes in current estimates of liabilities such as final adverse
judgment, significant settlement or changes in applicable law. A future adverse outcome in any
one or more of these matters could have a material adverse effect on the Company’s financial
results. See Note 16 to the financial statements which are included in this Annual Report on
Form 10-K.
The Company’s results of operations could be adversely affected by a decrease in demand
for Company products.
If demand for the Company’s products decreases significantly, the Company would be unable to
efficiently utilize its capacity, and profitability would suffer. Decreased demand could result
from a macroeconomic downturn, or could be specific to the firearms industry. If the decrease in
demand occurs abruptly, the adverse impact would be even greater.
The Company must comply with various laws and regulations pertaining to workplace
safety and environment, environmental matters, and firearms manufacture.
In the normal course of its manufacturing operations, the Company is subject to numerous
federal, state and local laws and governmental regulations, and governmental proceedings and
orders. These laws and regulations pertain to matters like workplace safety and environment,
firearms serial number tracking and control, waste disposal, air emissions and water discharges
into the environment. Noncompliance with any one or more of these laws and regulations could
have a material adverse impact on the Company.

13
Business disruptions at one of the Company’s manufacturing facilities could adversely
affect the Company’s financial results.
The Newport, New Hampshire, Prescott, Arizona and Mayodan, North Carolina facilities are
critical to the Company’s success. These facilities house the Company’s principal production,
research, development, engineering, design, and shipping operations. Any event that causes a
disruption of the operation of any of these facilities for even a relatively short period of time
could have a material adverse effect on the Company’s ability to produce and ship products and
to provide service to its customers.
Price increases for raw materials could adversely affect the Company’s financial results.
Third parties supply the Company with various raw materials for its firearms and castings, such
as fabricated steel components, walnut, birch, beech, maple and laminated lumber for rifle
stocks, wax, ceramic material, metal alloys, various synthetic products and other component
parts. There is a limited supply of these materials in the marketplace at any given time, which
can cause the purchase prices to vary based upon numerous market factors. The Company
believes that it has adequate quantities of raw materials in inventory or on order to provide ample
time to locate and obtain additional items at then-current market cost without interruption of its
manufacturing operations. However, if market conditions result in a significant prolonged
inflation of certain prices or if adequate quantities of raw materials cannot be obtained, the
Company’s manufacturing processes could be interrupted and the Company’s financial condition
or results of operations could be materially adversely affected.
Retention of key management is critical to the success of the Company. We rely on the management and leadership skills of our senior management team. Our senior
executives are not bound by employment agreements. The loss of the services of one or more of
our senior executives or other key personnel could have a significant adverse impact on our
business.
The Affordable Care Act could have a material adverse impact on the Company. Certain provisions of the federal healthcare legislation, in particular the “unlimited lifetime
benefit” which eliminated the practice of capping the amount of medical benefits available to an
individual, could have a material adverse effect on the Company’s financial position. The
Company self-insures the cost of the medical benefits for its employees up to an annual and
lifetime maximum per individual. It supplements this self-insurance with “stop loss” insurance
for costs incurred above these maximum thresholds. In the past, the medical benefit costs for
several Company employees each year have exceeded this maximum, in some cases
significantly. It is the Company’s expectation that if it is forced to provide an “unlimited lifetime
benefit” its medical costs would likely increase significantly, which would have a material
adverse effect on its financial condition.
ITEM 1B—UNRESOLVED STAFF COMMENTS None.

14
ITEM 2—PROPERTIES The Company’s manufacturing operations are carried out at four facilities. The following table sets forth certain information regarding each of these facilities:
Approximate Aggregate
Usable Square Feet
Status
Segment
Newport, New Hampshire 350,000 Owned Firearms/Castings Prescott, Arizona 230,000 Leased Firearms Mayodan, North Carolina 220,000 Owned Firearms Earth City, Missouri 35,000 Leased Castings
Each firearms facility contains enclosed ranges for testing firearms. The lease of the Prescott facility provides for rental payments, which are approximately equivalent to estimated rates for real property taxes. The Company has three other facilities that were not used in its manufacturing operations in 2015:
Approximate Aggregate
Usable Square Feet
Status
Segment
Southport, Connecticut 25,000 Owned Corporate Newport, New Hampshire (Dorr Woolen Building)
45,000
Owned
Firearms
Enfield, Connecticut 10,000 Leased Firearms There are no mortgages or any other major encumbrance on any of the real estate owned by the Company. The Company’s principal executive offices are located in Southport, Connecticut.

15
ITEM 3—LEGAL PROCEEDINGS
The nature of the legal proceedings against the Company is discussed at Note 16 to the financial
statements, which are included in this Annual Report on Form 10-K.
The Company has reported all cases instituted against it through September 26, 2015, and the
results of those cases, where terminated, to the SEC on its previous Form 10-Q and 10-K reports,
to which reference is hereby made.
During the three months ending December 31, 2015, one case was formally instituted against the
Company, captioned Davies Innovation v. Sturm, Ruger & Company, Inc. pending in United
States District Court for the Southern District of Texas.
During the three months ending December 31, 2015, no cases previously reported were settled or
dismissed.
ITEM 4—MINE SAFETY DISCLOSURES – NOT APPLICABLE

16
PART II ITEM 5—MARKET FOR REGISTRANT'S COMMON EQUITY, RELATED
STOCKHOLDER MATTERS AND ISSUER PURCHASES OF EQUITY SECURITIES
The Company’s common stock is traded on the New York Stock Exchange under the symbol
“RGR.” At February 11, 2016, the Company had 1,703 stockholders of record.
The following table sets forth, for the periods indicated, the high and low sales prices for the
Company’s common stock as reported on the New York Stock Exchange and dividends paid on
the Company’s common stock.
High
Low Dividends Per Share
2014: First Quarter $85.93 $59.26 $0.54 Second Quarter 69.19 57.71 0.49 Third Quarter 60.59 45.76 0.45 Fourth Quarter 52.41 33.60 0.14 2015: First Quarter $56.13 $33.89 $0.17 Second Quarter 58.77 47.38 0.32 Third Quarter 66.11 54.84 0.36 Fourth Quarter 61.39 48.10 0.25
Issuer Repurchase of Equity Securities
In the fourth quarter of 2015, the Company did not repurchase any shares of its common stock.

17
Comparison of Five-Year Cumulative Total Return* Sturm, Ruger & Co., Inc., Standard & Poor’s 500, Recreation and Russell 2000 Index
(Performance Results Through 12/31/15)
31, 2015)
Assumes $100 invested at the close of trading 12/10 in Sturm, Ruger & Company, Inc. common
stock, Standard and Poor’s 500, Recreation and Russell 2000 Index.
Assumes $100 invested at the close of trading 12/10 in Sturm, Ruger & Company, Inc., common
stock, Standard and Poor’s 500, Recreation and Russell 2000 Index.
* Cumulative total return assumes reinvestment of dividends.
Source: Value Line Publishing LLC
Factual material is obtained from sources believed to be reliable, but the publisher is not responsible
for any errors or omissions contained herein.
2010 2011 2012 2013 2014 2015
Sturm, Ruger & Co., Inc. $100.00 $222.54 $310.46 $518.31 $252.72 $443.72
Standard & Poor’s 500 $100.00 $100.00 $113.40 $146.97 $163.71 $162.52
Recreation $100.00 $92.16 $123.70 $170.27 $194.06 $220.20
Russell 2000 Index $100.00 $94.55 $108.38 $148.49 $153.73 $144.95
$0
$100
$200
$300
$400
$500
$600
$700
$800
$900
2010 2011 2012 2013 2014 2015
Sturm, Ruger & Co., Inc.
Standard & Poors 500
Recreation
Russell 2000 Index

18
Securities Authorized for Issuance Under Equity Compensation Plans The following table provides information regarding compensation plans under which equity securities of the Company are authorized for issuance as of December 31, 2015:
Equity Compensation Plan Information
Plan category
Number of securities to
be issued upon exercise of
outstanding options,
warrants and rights
(a)
Weighted-average
exercise price of
outstanding options,
warrants and rights
(b) *
Number of securities
remaining available for
future issuance under
equity compensation
plans (excluding
securities reflected in
column (a))
(c)
Equity compensation
plans approved by
security holders
-
2007 Stock Incentive Plan 746,946 $8.95 per share 543,000
Equity compensation
plans not approved by
security holders
None.
Total 746,946 $8.95 per share 543,000
* Restricted stock units are settled in shares of common stock on a one-for-one basis.
Accordingly, such units have been excluded for purposes of computing the weighted-
average exercise price.

19
ITEM 6—SELECTED FINANCIAL DATA
(Dollars in thousands, except per share data)
December 31,
2015 2014 2013 2012 2011
Net firearms sales $544,850 $542,267 $678,552 $484,933 $324,200
Net castings sales 6,244 2,207 9,724 6,891 4,616
Total net sales 551,094 544,474 688,276 491,824 328,816
Cost of products sold 378,934 375,300 429,671 312,871 217,058
Gross profit 172,160 169,174 258,605 178,953 111,758
Income before income taxes 96,100 57,240 175,232 112,109 63,516
Income taxes 33,974 18,612 63,960 41,480 23,501
Net income 62,126 38,628 111,272 70,629 40,015
Basic earnings per share 3.32 1.99 5.76 3.69 2.12
Diluted earnings per share 3.21 1.95 5.58 3.60 2.09
Cash dividends per share $ 1.10 $ 1.62 $ 2.12 $ 5.80 $ 0.43
December 31,
2015 2014 2013 2012 2011
Working capital $107,279 $ 57,792 $ 69,460 $ 37,430 $ 96,646
Total assets 315,883 254,382 277,118 174,486 206,510
Total stockholders’ equity 227,738 185,462 179,086 95,032 137,391
Book value per share $ 12.17 $ 9.90 $ 9.26 $ 4.93 $ 7.20
Return on stockholders’ equity 30.1% 21.2% 81.2% 60.8% 32.0%
Current ratio 2.3 to 1 2.0 to 1 1.8 to 1 1.6 to 1 3.0 to 1
Common shares outstanding 18,713,400 18,737,000 19,348,000 19,263,000 19,083,100
Number of stockholders of
record
1,702
1,726
1,718
1,771
1,860
Number of employees 1,920 1,847 1,862 1,441 1,224
Number of temporary employees 205 220 530 570 300
20
ITEM 7—MANAGEMENT'S DISCUSSION AND ANALYSIS OF FINANCIAL CONDITION AND RESULTS OF OPERATIONS
Company Overview
Sturm, Ruger & Company, Inc. (the “Company”) is principally engaged in the design,
manufacture, and sale of firearms to domestic customers. Approximately 99% of sales are from
firearms. Export sales represent approximately 4% of total sales. The Company’s design and
manufacturing operations are located in the United States and almost all product content is
domestic. The Company’s firearms are sold through a select number of independent wholesale
distributors, principally to the commercial sporting market.
The Company also manufactures investment castings made from steel alloys and metal injection
molding (“MIM”) parts for internal use in its firearms and for sale to unaffiliated, third-party
customers. Approximately 1% of sales are from the castings segment.
Orders of many models of firearms from the independent distributors tend to be stronger in the
first quarter of the year and weaker in the third quarter of the year. This is due in part to the
timing of the distributor show season, which occurs during the first quarter.
Results of Operations - 2015
Product Demand
After a year of declining demand in 2014, demand rebounded in 2015 to slightly higher levels
and followed typical historical seasonal patterns.
The estimated sell-through of the Company’s products from the independent distributors to
retailers increased 7% in 2015 from 2014. For the same period, the National Instant Criminal
Background Check System (“NICS”) background checks (as adjusted by the National Shooting
Sports Foundation (“NSSF”)) increased 9%.
New products represented $115.4 million or 21% of firearms sales in 2015, compared to $89.4
million or 16% of firearms sales in 2014. New product sales include only major new products
that were introduced in the past two years.
Estimated sell-through from distributors to retailers and total adjusted NICS background checks:
2015 2014 2013
Estimated Units Sold from Distributors to
Retailers (1)
1,793,800
1,669,700
2,091,500
Total Adjusted NICS Background Checks (2) 14,244,200 13,090,400 14,796,900

21
(1) The estimates for each period were calculated by taking the beginning inventory
at the distributors, plus shipments from the Company to distributors during the
period, less the ending inventory at distributors. These estimates are only a proxy
for actual market demand as they:
Rely on data provided by independent distributors that are not verified
by the Company,
Do not consider potential timing issues within the distribution channel,
including goods-in-transit, and
Do not consider fluctuations in inventory at retail.
(2) NICS background checks are performed when the ownership of most firearms,
either new or used, is transferred by a Federal Firearms Licensee. NICS
background checks are also performed for permit applications, permit renewals,
and other administrative reasons.
The adjusted NICS data presented above was derived by the NSSF by subtracting
NICS checks that are not directly related to the sale of a firearm, including checks
used for concealed carry (“CCW”) permit application checks as well as checks on
active CCW permit databases.
Orders Received and Ending Backlog
The Company uses the estimated unit sell-through of our products from the independent
distributors to retailers, along with inventory levels at the independent distributors and at the
Company, as the key metrics for planning production levels.
Net Orders Received in 2015 increased 62% from 2014. Our ending order backlog of 430,300
units at December 31, 2015 decreased 221,100 units from backlog of 651,400 units at December
31, 2014.
The units ordered, value of orders received and ending backlog, net of Federal Excise Tax, for
the trailing three years are as follows (dollars in millions, except average sales price):
2015 2014 2013
Orders Received $463.2 $286.8 $636.0
Average Sales Price of Orders Received $303 $311 $283
Ending Backlog $137.8 $204.2 $440.6
Average Sales Price of Ending Backlog $320 $313 $290

22
Production
The Company reviews the estimated sell-through from the independent distributors to retailers,
as well as inventory levels at the independent distributors and at the Company, semi-monthly to
plan production levels and manage increases in inventory. These reviews resulted in decreased
total unit production of 8% in 2015 compared to 2014.
Annual Summary Unit Data
Firearms unit data for orders, production, shipments and backorders follows:
2015 2014 2013
Units Ordered 1,517,000 921,900 2,251,000
Units Produced 1,721,300 1,867,800 2,249,500
Units Shipped 1,738,100 1,791,300 2,237,400
Average Sales Price $313 $303 $303
Units on Backorder 430,300 651,400 1,520,800
Inventories
The Company’s finished goods inventory decreased by 16,800 units during 2015.
Distributor inventories of the Company’s products decreased by 55,700 units during 2015 and
approximate a reasonable level to support rapid fulfillment of retailer demand. However, there is
still insufficient inventory of certain models that are experiencing strong demand.
Inventory data follows:
December 31,
2015 2014 2013
Units – Company Inventory
87,400
104,200
27,700
Units – Distributor Inventory (3) 271,000 326,700 205,100
Total inventory (4) 358,400 430,900 232,800
(3) Distributor ending inventory as provided by the independent distributors of the
Company’s products. These numbers do not include goods-in-transit inventory
that has been shipped from the Company but not yet received by the distributors.

23
(4) This total does not include inventory at retailers. The Company does not have
access to data on retailer inventories.
Year ended December 31, 2015, as compared to year ended December 31, 2014:
Net Sales
Consolidated net sales were $551.1 million in 2015. This represents an increase of $6.6 million
or 1.2% from 2014 consolidated net sales of $544.5 million.
Firearms segment net sales were $544.9 million in 2015. This represents an increase of $2.6
million or 0.5% from 2014 firearms net sales of $542.3 million. Firearms unit shipments
decreased 3.0% in 2015.
Casting segment net sales were $6.2 million in 2015. This represents an increase of $4.0 million
or 183% from 2014 casting sales of $2.2 million.
Cost of Products Sold and Gross Profit
Consolidated cost of products sold was $378.9 million in 2015. This represents an increase of
$3.6 million or 1.0% from 2014 consolidated cost of products sold of $375.3 million.

24
The gross margin was 31.2% in 2015. This represents a slight increase from 31.1% in 2014 as
illustrated below:
(in thousands)
Year Ended December 31, 2015 2014
Net sales $551,094 100.0% $544,474 100.0%
Cost of products sold, before LIFO,
overhead and labor rate adjustments to
inventory, and product liability
375,267
68.1%
378,207
69.5%
LIFO expense
1,458
0.3%
2,062
0.4%
Overhead rate adjustments to inventory 1,150 0.2% (5,320) (1.0)%
Labor rate adjustments to inventory 139 - (424) (0.1)%
Product liability 920 0.2% 775 0.1%
Total cost of products sold 378,934 68.8% 375,300 68.9%
Gross profit $172,160 31.2% $169,174 31.1%
Cost of products sold, before LIFO, overhead and labor rate adjustments to inventory, and
product liability- In 2015, cost of products sold, before LIFO, overhead and labor rate
adjustments to inventory, and product liability decreased 1.4% as a percentage of sales compared
to 2014. This increased profitability is attributable to improved productivity, partially offset by a
less favorable shift in product mix.
LIFO- Gross inventories decreased by $7.7 million in 2015 and increased $24.8 million in 2014.
In 2015 and 2014, the Company recognized LIFO expense of $1.5 million and $2.1 million,
respectively, which increased cost of products sold.
Overhead Rate Change- The net impact on inventory in 2015 from the change in the overhead
rates used to absorb overhead expenses into inventory was a decrease of $1.2 million, reflecting
increased overhead efficiency. This decrease in inventory value resulted in a corresponding
increase to cost of products sold in 2015. In 2014, the change in inventory value resulting from
the change in the overhead rate used to absorb overhead expenses into inventory was an increase
of $5.3 million, reflecting decreased overhead efficiency. This increase in inventory value
resulted in a corresponding decrease to cost of products sold.

25
Labor Rate Adjustments- In 2015, the change in inventory value resulting from the change in the
labor rates used to absorb labor expenses into inventory was a decrease of $0.1 million,
reflecting increased labor efficiency. This decrease in inventory value resulted in a
corresponding increase to cost of products sold. The net impact in 2014 from the change in the
labor rates used to absorb labor expenses into inventory was an increase to inventory of $0.4
million, reflecting decreased labor efficiency. This increase in inventory value resulted in a
corresponding decrease to cost of products sold.
Product Liability- This expense includes the cost of outside legal fees, insurance, and other
expenses incurred in the management and defense of product liability matters. These costs
totaled $0.9 million and $0.8 million in 2015 and 2014, respectively. See Note 16 in the notes to
the financial statements “Contingent Liabilities” for further discussion of the Company’s product
liability.
Gross Profit- Gross profit was $172.2 million or 31.2% of sales in 2015. This is an increase of
$3.0 million from 2014 gross profit of $169.2 million or 31.1% of sales in 2014.
Selling, General and Administrative
Selling, general and administrative expenses were $77.7 million in 2015, an increase of $4.4
million from $73.4 million in 2014, and an increase from 13.5% of sales in 2014 to 14.1% of
sales in 2015. The increase in selling, general and administrative expenses is primarily
attributable to increased promotional selling expenses, including a new, summer round of
promotions, the “2 Million Gun Challenge to Benefit the NRA” which was not in effect in 2014,
and the cost of protecting distributor inventory related to the price reduction in the Ruger LCP.
Defined Benefit Pension Plans Settlement Charge
The Company fully funded and terminated its hourly and salaried defined-benefit pension plans
in accordance with Internal Revenue Service and Pension Benefit Guaranty Corporation
requirements in 2014. The settlement and termination of the frozen pension plans resulted in a
cash payment of $7.5 million and an income statement expense of $40.9 million in 2014.
Other Operating Income, net
Other operating income, net consists of the following (in thousands):
2015 2014
Gain on sale of operating assets $113 $ 1
Frozen defined-benefit pension plan income - 1,611
Total other operating income, net $113 $1,612

26
Operating Income
Operating income was $94.5 million or 17.2% of sales in 2015. This is an increase of $38.2
million from 2014 operating income of $56.3 million or 10.4% of sales.
Royalty Income
Royalty income increased to $1.1 million in 2015 from $0.5 million in 2014.
Interest Income
Interest income was negligible in 2015 and 2014.
Interest Expense
Interest expense was negligible in 2015 and 2014.
Other Income (Expense), Net
Other income (expense), net was income of $0.6 million in 2015, unchanged from income of
$0.6 million in 2014.
Income Taxes and Net Income
The effective income tax rate was 35.4% in 2015 and 32.5% in 2014. The increase in the
effective tax rate is primarily attributable to a decrease in the domestic production activities
deduction in 2015 compared to 2014.
As a result of the foregoing factors, consolidated net income was $62.1 million in 2015. This
represents an increase of $23.5 million from 2014 consolidated net income of $38.6 million.
Non-GAAP Financial Measure
In an effort to provide investors with additional information regarding its results, the Company
refers to various United States generally accepted accounting principles (“GAAP”) financial
measures and one non-GAAP financial measure, EBITDA, which management believes provides
useful information to investors. This non-GAAP measure may not be comparable to similarly
titled measures being disclosed by other companies. In addition, the Company believes that the
non-GAAP financial measure should be considered in addition to, and not in lieu of, GAAP
financial measures. The Company believes that EBITDA is useful to understanding its operating
results and the ongoing performance of its underlying business, as EBITDA provides
information on the Company’s ability to meet its capital expenditure and working capital
requirements, and is also an indicator of profitability. The Company believes that this reporting
provides better transparency and comparability to its operating results. The Company uses both
GAAP and non-GAAP financial measures to evaluate the Company’s financial performance.

27
Non-GAAP Reconciliation – EBITDA
EBITDA
(Unaudited, dollars in thousands)
Year ended December 31, 2015 2014
Net income $ 62,126 $ 38,628
Income tax expense 33,974 18,612
Depreciation and amortization expense 36,235 36,706
Interest expense 156 152
Interest income (5) (2)
Pension plan termination expense, net of cash payment - 32,218
EBITDA $132,486 $126,314
EBITDA is defined as earnings before interest, taxes, and depreciation and amortization. The
Company calculates this by adding the amount of interest expense, income tax expense and
depreciation and amortization expenses that have been deducted from net income back into net
income, and subtracting the amount of interest income that was included in net income from net
income to arrive at EBITDA. The Company’s EBITDA calculation also excludes any one-time
non-cash, non-operating expense, such as the pension plan termination expense in 2014.
Quarterly Data
To supplement the summary annual unit data and discussion above, the same data for the last
eight quarters follows:
2015
Q4 Q3 Q2 Q1
Units Ordered 696,400 207,500 262,400 350,700
Units Produced 425,400 439,900 487,000 369,000
Units Shipped 478,400 394,700 442,900 422,100
Estimated Units Sold from
Distributors to Retailers
552,700
374,900
379,400
486,800
Total Adjusted NICS Background
Checks
4,880,000
3,050,000
2,793,000
3,521,000
Average Unit Sales Price $336 $302 $314 $321
Units on Backorder 430,300 212,300 399,500 580,000
Units – Company Inventory 87,400 140,400 95,200 51,100
Units – Distributor Inventory (5) 271,000 345,300 325,500 262,000

28
2014
Q4 Q3 Q2 Q1
Units Ordered 225,800 155,900 145,200 395,000
Units Produced 360,900 356,400 552,200 598,300
Units Shipped 399,100 317,100 513,700 561,400
Estimated Units Sold from
Distributors to Retailers
422,500
292,900
388,900
565,400
Total Adjusted NICS Background
Checks
4,129,000
2,830,000
2,672,000
3,459,000
Average Unit Sales Price $306 $310 $298 $301
Units on Backorder 651,400 824,700 985,900 1,354,400
Units – Company Inventory 104,200 142,400 103,100 64,600
Units – Distributor Inventory (5) 326,700 350,100 325,900 201,100
(5) Distributor ending inventory as provided by the independent distributors of the
Company’s products.
(in millions except average sales price, net of Federal Excise Tax)
2015
Q4 Q3 Q2 Q1
Orders Received $203.4 $73.1 $71.9 $114.8
Average Sales Price of Orders Received $292 $352 $274 $327
Ending Backlog $137.8 $80.5 $123.8 $185.1
Average Sales Price of Ending Backlog $320 $379 $310 $319
2014
Q4 Q3 Q2 Q1
Orders Received $74.7 $50.1 $42.2 $119.8
Average Sales Price of Orders Received $331 $321 $291 $303
Ending Backlog $204.2 $242.9 $289.1 $396.5
Average Sales Price of Ending Backlog $313 $295 $293 $293

29
Fourth Quarter Gross Profit Analysis
The gross margin for the fourth quarter of 2015 and 2014 was 31.7% and 27.7%, respectively.
Details of the gross margin are illustrated below:
(in thousands)
Three Months Ended December 31, 2015 2014
Net sales $152,397 100.0% $122,605 100.0%
Cost of products sold, before LIFO,
overhead and labor rate adjustments to
inventory, and product liability 106,161 69.6% 90,180 73.5%
LIFO (income) expense (247) (0.2)% 900 0.7%
Overhead rate adjustments to inventory (1,802) (1.2)% (2,510) (2.0)%
Labor rate adjustments to inventory (207) (0.1)% (183) (0.1)%
Product liability 248 0.2% 258 0.2%
Total cost of products sold 104,153 68.3% 88,645 72.3%
Gross profit $ 48,244 31.7% $ 33,960 27.7%
Note: For a discussion of the captions in the above table, please see the “Cost of Products Sold
and Gross Profit” discussion above.

30
Results of Operations - 2014
Year ended December 31, 2014, as compared to year ended December 31, 2013:
Annual Summary Unit Data
Firearms unit data for orders, production, shipments and ending inventory, and castings setups (a
measure of foundry production) are as follows:
2014 2013 2012
Units Ordered 921,900 2,251,000 2,879,200
Units Produced 1,867,800 2,249,500 1,695,900
Units Shipped 1,791,300 2,237,400 1,696,400
Average Sales Price $303 $303 $286
Units on Backorder 651,400 1,520,800 1,507,200
Units – Company Inventory 104,200 27,700 15,600
Units – Distributor Inventory (1) 326,700 205,100 59,200
Castings Setups 201,592 273,597 257,312
Orders Received and Ending Backlog
(in millions except average sales price, net of Federal Excise Tax):
2014 2013 2012
Orders Received $286.8 $636.0 $796.7
Average Sales Price of Orders Received (2) $311 $283 $277
Ending Backlog (2) $204.2 $440.6 $427.1
Average Sales Price of Ending Backlog (2) $313 $290 $283
(1) Distributor ending inventory as provided by the independent distributors of the
Company’s products.

31
(2) Average sales price for orders received and ending backlog is net of Federal Excise
Tax of 10% for handguns and 11% for long guns.
Product Demand
The strong demand experienced in 2013 remained through the first quarter of 2014 and much of
the second quarter. This continued strong demand was due to:
new shooters joining the ranks of gun owners,
the Company’s introduction of many innovative new products in the past few years,
and
increased manufacturing capacity and greater product availability for certain
products in strong demand.
During the latter half of 2014, demand for the Company’s products declined significantly due to:
the reduction in overall consumer demand,
high inventory levels at retail, which encouraged retailers to buy fewer firearms
than they were selling, in an effort to reduce their inventories and generate cash,
aggressive price discounting by many of our competitors, and
the lack of significant new product introductions from the Company,
Demand for higher-margin firearms accessories, especially magazines, which was very strong in
2013, softened in the first half of 2014 and then decreased significantly in the latter half of 2014.
New product introductions in 2014 included the AR-556 modern sporting rifle and the LC9s
pistol. New products represented $89.4 million or 16% of firearms sales in 2014, compared to
$195.8 million or 29% of firearms sales in 2013. New product sales include only major new
products that were introduced in the past two years.
The estimated sell-through of the Company’s products from the independent distributors to
retailers decreased 20% in 2014. For the same period, the National Instant Criminal Background
Check System (“NICS”) background checks (as adjusted by the National Shooting Sports
Foundation) decreased 12%.
Estimated sell-through from distributors to retailers and total adjusted NICS background checks
follow:
2014 2013 2012
Estimated Units Sold from Distributors to
Retailers (1)
1,669,700
2,091,500
1,772,800
Total Adjusted NICS Background Checks (2) 13,090,400 14,796,900 13,780,000

32
(1) The estimates for each period were calculated by taking the beginning inventory
at the distributors, plus shipments from the Company to distributors during the
period, less the ending inventory at distributors. These estimates are only a proxy
for actual market demand as they:
Rely on data provided by independent distributors that are not verified
by the Company,
Do not consider potential timing issues within the distribution channel,
including goods-in-transit, and
Do not consider fluctuations in inventory at retail.
(2) While NICS background checks are not a precise measure of retail activity, they
are commonly used as a proxy for retail demand. NICS background checks are
performed when the ownership of most firearms, either new or used, is transferred
by a Federal Firearms Licensee. NICS background checks are also performed for
permit applications, permit renewals, and other administrative reasons.
The adjusted NICS data presented above was derived by the National Shooting
Sports Foundation (“NSSF”) by subtracting out NICS checks that are not directly
related to the sale of a firearm, including checks used for concealed carry
(“CCW”) permit application checks as well as checks on active CCW permit
databases. While not a direct correlation to firearms sales, the NSSF-adjusted
NICS data provides a more accurate picture of current market conditions than raw
NICS data.
Production
The Company reviews the estimated sell-through from the independent distributors to retailers,
as well as inventory levels at the independent distributors and at the Company, semi-monthly in
an effort to plan production levels and mitigate increases in inventory. These reviews resulted in
decreased total unit production of 17% in 2014 compared to 2013.
As estimated sell-through decreased, the Company managed its labor force by limiting the hiring
of new employees, reducing overtime hours, and allowing attrition to reduce its total employee
base. The Company’s compensation structure includes a significant performance-based
incentive compensation component which allows for a more rapid reduction in labor cost. For
reference, in 2014 performance-based incentive compensation comprised at least 15% of
individual employee compensation, down from 25% in 2013.
Capital expenditures have been curtailed by the cancellation or delay of purchase orders. In
addition, due to the decline in demand in certain mature product lines, some manufacturing
equipment from the production cells for those products was redeployed to production cells being
developed for new products or to replace older equipment in other production cells.
In 2013, the Company revised its estimate of the useful life of machinery and equipment from 10
years to 7 years. This change, which became effective December 31, 2013, resulted in increased
33
depreciation expense of $7 million in 2014. The Company estimates that this change will
increase depreciation expense for the machinery and equipment on hand at December 31, 2013
by approximately $3 million and $1 million in 2015 and 2016, respectively.
Inventories
The Company’s finished goods inventory increased by 76,500 units during 2014. This is the first
significant replenishment of finished goods inventory in several years.
Distributor inventories of the Company’s products increased by 121,600 units during 2014 and
approximate a reasonable level to support rapid fulfillment of retailer demand.
The Company reviews the estimated sell-through from the independent distributors to retailers,
as well as inventory levels at the distributors and at the Company semi-monthly in an effort to
plan production levels and mitigate undesired increases in inventory. These reviews resulted in
decreased total unit production of 17% in 2014.
34
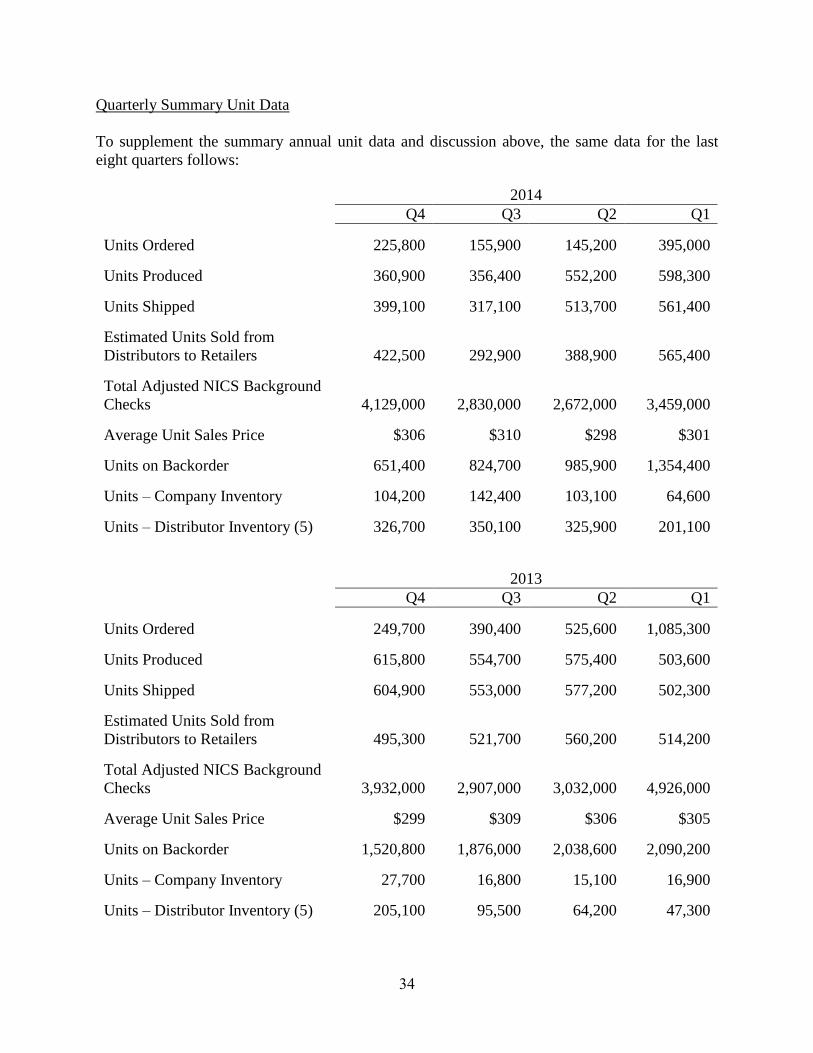
Quarterly Summary Unit Data
To supplement the summary annual unit data and discussion above, the same data for the last
eight quarters follows:
2014
Q4 Q3 Q2 Q1
Units Ordered 225,800 155,900 145,200 395,000
Units Produced 360,900 356,400 552,200 598,300
Units Shipped 399,100 317,100 513,700 561,400
Estimated Units Sold from
Distributors to Retailers
422,500
292,900
388,900
565,400
Total Adjusted NICS Background
Checks
4,129,000
2,830,000
2,672,000
3,459,000
Average Unit Sales Price $306 $310 $298 $301
Units on Backorder 651,400 824,700 985,900 1,354,400
Units – Company Inventory 104,200 142,400 103,100 64,600
Units – Distributor Inventory (5) 326,700 350,100 325,900 201,100
2013
Q4 Q3 Q2 Q1
Units Ordered 249,700 390,400 525,600 1,085,300
Units Produced 615,800 554,700 575,400 503,600
Units Shipped 604,900 553,000 577,200 502,300
Estimated Units Sold from
Distributors to Retailers
495,300
521,700
560,200
514,200
Total Adjusted NICS Background
Checks
3,932,000
2,907,000
3,032,000
4,926,000
Average Unit Sales Price $299 $309 $306 $305
Units on Backorder 1,520,800 1,876,000 2,038,600 2,090,200
Units – Company Inventory 27,700 16,800 15,100 16,900
Units – Distributor Inventory (5) 205,100 95,500 64,200 47,300

35
(5) Distributor ending inventory as provided by the independent distributors of the
Company’s products.
(in millions except average sales price, net of Federal Excise Tax)
2014
Q4 Q3 Q2 Q1
Orders Received $74.7 $50.1 $42.2 $119.8
Average Sales Price of Orders Received $331 $321 $291 $303
Ending Backlog $204.2 $242.9 $289.1 $396.5
Average Sales Price of Ending Backlog $313 $295 $293 $293
2013
Q4 Q3 Q2 Q1
Orders Received $79.5 $94.9 $150.9 $310.7
Average Sales Price of Orders Received $318 $243 $286 $291
Ending Backlog $440.6 $534.1 $590.3 $602.3
Average Sales Price of Ending Backlog $290 $285 $290 $288
Net Sales
Consolidated net sales were $544.5 million in 2014. This represents a decrease of $143.8 million
or 20.9% from 2013 consolidated net sales of $688.3 million.
Firearms segment net sales were $542.3 million in 2014. This represents a decrease of $136.3
million or 20.1% from 2013 firearms net sales of $678.6 million. Firearms unit shipments
decreased 19.9% in 2014.
Casting segment net sales were $2.2 million in 2014. This represents a decrease of $7.5 million
or 77.3% from 2013 casting sales of $9.7 million.
Cost of Products Sold and Gross Profit
Consolidated cost of products sold was $375.3 million in 2014. This represents a decrease of
$54.4 million or 12.7% from 2013 consolidated cost of products sold of $429.7 million.

36
The gross margin was 31.1% in 2014. This represents a decrease from the 2013 gross margin of
37.6% as illustrated below:
(in thousands)
Year Ended December 31, 2014 2013
Net sales $544,474 100.0% $688,276 100.0%
Cost of products sold, before LIFO,
overhead and labor rate adjustments to
inventory, and product liability
378,207
69.5% 427,737 62.1%
LIFO expense
2,062
0.4% 427 0.1%
Overhead rate adjustments to inventory (5,320) (1.0)% 183 0%
Labor rate adjustments to inventory (424) (0.1)% 71 0%
Product liability 775 0.1% 1,253 0.2%
Total cost of products sold 375,300 68.9% 429,671 62.4%
Gross profit $169,174 31.1% $258,605 37.6%
Cost of products sold, before LIFO, overhead and labor rate adjustments to inventory, and
product liability- In 2014, cost of products sold, before LIFO, overhead and labor rate
adjustments to inventory, and product liability increased as a percentage of sales by 7.4%
compared to 2013. The main contributors to this increase are:
reduced sales volume which deleveraged fixed costs, including depreciation,
indirect labor, and engineering and product development costs,
a product mix shift away from higher-margin firearms accessories,
increased depreciation expense due to the reduction in the estimated useful lives of
the Company’s capital assets, and
increased depreciation expense due to the $151 million of capital equipment
purchases as the Company increased firearms sales from $144 million in 2007 to
$679 million in 2013.
LIFO- Gross inventories increased by $24.8 million and $8.4 million in 2014 and 2013,
respectively. In 2014 and 2013, the Company recognized LIFO expense of $2.1 million and $0.4
million, respectively, which increased cost of products sold.
Overhead Rate Change- The net impact on inventory in 2014 from the change in the overhead
rates used to absorb overhead expenses into inventory was an increase of $5.3 million, reflecting

37
decreased overhead efficiency. This increase in inventory value resulted in a corresponding
decrease to cost of products sold in 2014. In 2013, the change in inventory value resulting from
the change in the overhead rate used to absorb overhead expenses into inventory was a decrease
of $0.2 million, reflecting increased overhead efficiency. This decrease in inventory value
resulted in a corresponding increase to cost of products sold.
Labor Rate Adjustments- In 2014, the change in inventory value resulting from the change in the
labor rates used to absorb labor expenses into inventory was an increase of $0.4 million,
reflecting decreased labor efficiency. This increase in inventory value resulted in a
corresponding decrease to cost of products sold. The net impact in 2013 from the change in the
labor rates used to absorb labor expenses into inventory was a decrease to inventory of $0.1
million, reflecting increased labor efficiency. This decrease in inventory value resulted in a
corresponding increase to cost of products sold.
Product Liability- This expense includes the cost of outside legal fees, insurance, and other
expenses incurred in the management and defense of product liability matters. These costs
totaled $0.8 million and $1.3 million in 2014 and 2013, respectively. See Note 16 in the notes to
the financial statements “Contingent Liabilities” for further discussion of the Company’s product
liability.
Gross Profit- Gross profit was $169.2 million or 31.1% of sales in 2014. This is a decrease of
$89.4 million from 2013 gross profit of $258.6 million or 37.6% of sales in 2013 due to:
reduced sales volume which deleveraged fixed costs, including depreciation,
indirect labor, and engineering and product development costs,
a product mix shift away from higher-margin firearms accessories,
increased depreciation expense due to the reduction in the estimated useful lives of
the Company’s capital assets, and
increased depreciation expense due to the $151 million of capital equipment
purchases as the Company increased firearms sales from $144 million in 2007 to
$679 million in 2013.
Selling, General and Administrative
Selling, general and administrative expenses were $73.4 million in 2014, a decrease of $10.7
million from $84.1 million in 2013, and an increase from 12.2% of sales in 2013 to 13.5% of
sales in 2014. The decrease in selling, general and administrative expenses is attributable to
decreased volume-driven promotional selling expenses and distribution costs, and a 60%
reduction in performance-based incentive compensation and profit-sharing expenses in 2014
compared to 2013.

38
Defined Benefit Pension Plans Settlement Charge
The Company fully funded and terminated its hourly and salaried defined-benefit pension plans
in accordance with Internal Revenue Service and Pension Benefit Guaranty Corporation
requirements in 2014. The settlement and termination of the frozen pension plans resulted in an
income statement expense of $41.0 million in 2014.
Other Operating Expenses (Income), net
Other operating expenses (income), net consist of the following (in thousands):
2014 2013
Gain on sale of operating assets $ (1) $ (65)
Frozen defined-benefit pension plan (income) expense (1,611) (336)
Total other operating (income) expenses, net $(1,612) $(401)
Operating Income
Operating income was $56.3 million or 10.4% of sales in 2014. This is a decrease of $118.6
million from 2013 operating income of $174.9 million or 25.4% of sales.
Royalty Income
Royalty income was $0.5 million in 2014. This represents a decrease of $0.2 million from 2013
royalty income of $0.7 million. The decrease is primarily attributable to decreased income from
licensing agreements.
Interest Income
Interest income was negligible in 2014 and 2013.
Interest Expense
Interest expense was negligible in 2014 and 2013.
Other Income (Expense), Net
Other income (expense), net was an income of $0.6 million in 2014, an increase of $0.8 million
from an expense of $0.2 million in 2013. This improvement is attributable primarily to the
write-down of an investment in 2013.

39
Income Taxes and Net Income
The effective income tax rate was 32.5% in 2014 and 36.5% in 2013. The decrease in the
effective tax rate is primarily attributable to an increase in the domestic production activities
deduction in 2014.
As a result of the foregoing factors, consolidated net income was $38.6 million in 2014. This
represents a decrease of $72.7 million from 2013 consolidated net income of $111.3 million.
Non-GAAP Financial Measure
In an effort to provide investors with additional information regarding its results, the Company
refers to various United States generally accepted accounting principles (“GAAP”) financial
measures and one non-GAAP financial measure, EBITDA, which management believes provides
useful information to investors. This non-GAAP measure may not be comparable to similarly
titled measures being disclosed by other companies. In addition, the Company believes that the
non-GAAP financial measure should be considered in addition to, and not in lieu of, GAAP
financial measures. The Company believes that EBITDA is useful to understanding its operating
results and the ongoing performance of its underlying business, as EBITDA provides
information on the Company’s ability to meet its capital expenditure and working capital
requirements, and is also an indicator of profitability. The Company believes that this reporting
provides better transparency and comparability to its operating results. The Company uses both
GAAP and non-GAAP financial measures to evaluate the Company’s financial performance.
Non-GAAP Reconciliation – EBITDA
EBITDA
(Unaudited, dollars in thousands)
Year ended December 31, 2014 2013
Net income $ 38,628 $111,272
Income tax expense 18,612 63,960
Depreciation and amortization expense 36,706 20,362
Interest expense 152 135
Interest income (2) (4)
Pension plan termination expense, net of cash payment 32,218 -
EBITDA $126,314 $195,725
EBITDA is defined as earnings before interest, taxes, and depreciation and amortization. The
Company calculates this by adding the amount of interest expense, income tax expense and
depreciation and amortization expenses that have been deducted from net income back into net
income, and subtracting the amount of interest income that was included in net income from net
income to arrive at EBITDA. The Company’s EBITDA calculation also excludes any one-time
non-cash, non-operating expense, such as the pension plan termination expense in 2014.

40
Financial Condition
Liquidity
At December 31, 2015, the Company had cash and cash equivalents of $69.2 million. Our pre-
LIFO working capital of $149.4 million, less the LIFO reserve of $42.1 million, resulted in
working capital of $107.3 million and a current ratio of 2.3 to 1.
Operations
Cash provided by operating activities was $112.6 million, $55.6 million, and $119.7 million in
2015, 2014, and 2013, respectively. The increase in cash provided in 2015 compared to 2014 is
attributable to increased profitability, decreases in inventory and other assets and increases in
accounts payable and accrued employee compensation during 2015, partially offset by an
increase in accounts receivable during the same period.
The decrease in cash provided by operating activities in 2014 compared to 2013 is attributable to
decreased profitability, increases in inventory and other assets and decreases in accounts payable
and accrued employee compensation during 2014, partially offset by a decrease in accounts
receivable and increased depreciation expense during the same period.
Third parties supply the Company with various raw materials for its firearms and castings, such
as fabricated steel components, walnut, birch, beech, maple and laminated lumber for rifle
stocks, wax, ceramic material, metal alloys, various synthetic products and other component
parts. There is a limited supply of these materials in the marketplace at any given time, which
can cause the purchase prices to vary based upon numerous market factors. The Company
believes that it has adequate quantities of raw materials in inventory or on order to provide
sufficient time to locate and obtain additional items at then-current market cost without
interruption of its manufacturing operations. However, if market conditions result in a
significant prolonged inflation of certain prices or if adequate quantities of raw materials cannot
be obtained, the Company’s manufacturing processes could be interrupted and the Company’s
financial condition or results of operations could be materially adversely affected.
Investing and Financing
Capital expenditures were $28.7 million, $45.6 million, and $54.6 million in 2015, 2014, and
2013, respectively. In 2016, the Company expects to spend $25 million on capital expenditures
to purchase tooling and fixtures for new product introductions and to upgrade and modernize
manufacturing equipment. Due to market conditions and business circumstances, actual capital
expenditures could vary significantly from the budgeted amount. The Company finances, and
intends to continue to finance, all of these activities with funds provided by operations and
current cash.
In 2015, the Company repurchased 82,100 shares of its common stock for $2.8 million in the
open market. The average price per share purchased was $34.57. These purchases were funded
with cash on hand. In 2014, the Company repurchased approximately 680,800 shares of its

41
common stock, representing 3.5% of the then outstanding shares, in the open market at an
average price of $35.22 per share. These purchases were made with cash held by the Company
and no debt was incurred. In 2013 no shares were repurchased.
At December 31, 2015, $73.2 million remained authorized for future share repurchases.
The Company paid dividends totaling $20.6 million, $31.4 million, and $41.1 million in 2015,
2014, and 2013, respectively. The dividend varies every quarter because the Company pays a
percentage of earnings rather than a fixed amount per share. Since 2012, the Company’s practice
has been to pay a dividend of approximately 40% of net income.
On February 22, 2016, the Company’s Board of Directors authorized a dividend of 35¢ per share
to shareholders of record on March 11, 2016. The payment of future dividends depends on many
factors, including internal estimates of future performance, then-current cash, and the Company’s
need for funds.
In 2007, the Company migrated its retirement benefits from defined-benefit pension plans to
defined-contribution retirement plans, utilizing its current 401(k) plan. Currently, the Company
provides supplemental discretionary contributions to substantially all employees’ individual
401(k) accounts.
The Company fully funded and terminated its hourly and salaried defined-benefit pension plans
in accordance with Internal Revenue Service and Pension Benefit Guaranty Corporation
requirements in the fourth quarter of 2014. Plan participants were not adversely affected by the
plan terminations, but rather had their benefits either converted into a lump sum cash payment or
an annuity contract placed with an insurance carrier.
The settlement and termination of the frozen pension plans resulted in a cash payment of $7.5
million and an income statement expense of $41.0 million in the fourth quarter of 2014.
The Company contributed $7.5 million, and $3.0 million to the frozen pension plans in 2014 and
2013. Since the plans have been fully funded, settled, and terminated, no further cash
contributions were made in 2015 or will be required in future years.
Based on its unencumbered assets, the Company believes it has the ability to raise cash through
issuance of short-term or long-term debt. The Company’s unsecured $40 million credit facility,
which expires on June 15, 2016, remained unused at December 31, 2015 and the Company has
no debt.
Contractual Obligations
The table below summarizes the Company’s significant contractual obligations at December 31,
2015, and the effect such obligations are expected to have on the Company’s liquidity and cash
flows in future periods. This table excludes amounts already recorded on the Company’s
balance sheet as current liabilities at December 31, 2015.

42
“Purchase Obligations” as used in the below table includes all agreements to purchase goods or
services that are enforceable and legally binding on the Company and that specify all significant
terms, including: fixed or minimum quantities to be purchased; fixed, minimum or variable price
provisions; and the approximate timing of the transaction. Certain of the Company’s purchase
orders or contracts for the purchase of raw materials and other goods and services that may not
necessarily be enforceable or legally binding on the Company are also included in “Purchase
Obligations” in the table, and, therefore, certain of the Company’s purchase orders or contracts
included in the table may represent authorizations to purchase rather than legally binding
agreements. The Company expects to fund all of these commitments with cash flows from
operations and current cash.
Payment due by period (in thousands)
Contractual Obligations
Total
Less than
1 year
1-3 years
3-5 years
More
than 5
years
Long-Term Debt Obligations - - - - -
Capital Lease Obligations - - - - -
Operating Lease Obligations $ 742 $ 283 $ 458 $ - -
Purchase Obligations $10,868 $10,868 - - -
Other Long-Term Liabilities
Reflected on the
Registrant’s Balance
Sheet under GAAP
-
-
-
-
-
Total $11,610 $11,151 $ 458 $ - -
The expected timing of payment of the obligations discussed above is estimated based on current
information. Timing of payments and actual amounts paid may be different depending on the
time of receipt of goods or services or changes to agreed-upon amounts for some obligations.
Firearms Legislation and Litigation
See Item 1A - Risk Factors and Note 16 to the financial statements which are included in the
Annual Report on Form 10-K for a discussion of firearms legislation and litigation. Other Operational Matters
In the normal course of its manufacturing operations, the Company is subject to occasional
governmental proceedings and orders pertaining to workplace safety, firearms serial number
tracking and control, waste disposal, air emissions and water discharges into the environment.
The Company believes that it is generally in compliance with applicable Bureau of Alcohol,
Tobacco, Firearms & Explosives, environmental, and safety regulations and the outcome of any
proceedings or orders will not have a material adverse effect on the financial position or results
of operations of the Company.

43
The Company self-insures a significant amount of its product liability, workers’ compensation,
medical, and other insurance. It also carries significant deductible amounts on various insurance
policies.
The Company expects to realize its deferred tax assets through tax deductions against future
taxable income. Critical Accounting Policies and Estimates
The preparation of financial statements in accordance with accounting principles generally
accepted in the United States requires management to make assumptions and estimates that
affect the reported amounts of assets and liabilities as of the balance sheet date and net sales and
expenses recognized and incurred during the reporting period then ended. The Company bases
estimates on prior experience, facts and circumstances, and other assumptions, including those
reviewed with actuarial consultants and independent counsel, when applicable, that are believed
to be reasonable. However, actual results may differ from these estimates.
The Company believes the determination of its product liability accrual is a critical accounting
policy. The Company’s management reviews every lawsuit and claim and is in contact with
independent and corporate counsel on an ongoing basis. The provision for product liability
claims is based upon many factors, which vary for each case. These factors include the type of
claim, nature and extent of injuries, historical settlement ranges, jurisdiction where filed, and
advice of counsel. An accrual is established for each lawsuit and claim, when appropriate, based
on the nature of each such lawsuit or claim.
Amounts are charged to product liability expense in the period in which the Company becomes
aware that a claim or, in some instances a threat of a claim, has been made when potential losses
or costs of defense are probable and can be reasonably estimated. Such amounts are determined
based on the Company’s experience in defending similar claims. Occasionally, charges are
made for claims made in prior periods because the cumulative actual costs incurred for that
claim, or reasonably expected to be incurred in the future, exceed amounts already provided with
respect to such claims. Likewise, credits may be taken if cumulative actual costs incurred for
that claim, or reasonably expected to be incurred in the future, are less than amounts previously
provided.
While it is not possible to forecast the outcome of litigation or the timing of related costs, in the
opinion of management, after consultation with independent and corporate counsel, there is a
remote likelihood that litigation, including punitive damage claims, will have a material adverse
effect on the financial position of the Company, but such litigation may have a material impact
on the Company’s financial results for a particular period.
The Company believes the valuation of its inventory and the related excess and obsolescence
reserve is also a critical accounting policy. Inventories are carried at the lower of cost,
principally determined by the last-in, first-out (LIFO) method, or market. An actual valuation of
inventory under the LIFO method is made at the end of each year based on the inventory levels
and prevailing inventory costs existing at that time.

44
The Company determines its excess and obsolescence reserve by projecting the year in which
inventory will be consumed into a finished product. Given ever-changing market conditions,
customer preferences and the anticipated introduction of new products, it does not seem prudent
nor supportable to carry inventory at full cost beyond that needed during the next 36 months.
Recent Accounting Pronouncements
In November 2015, the Financial Accounting Standards Board (“FASB”) issued Accounting
Standard Update (“ASU”) 2015-17, Income Taxes (Topic 740): Balance Sheet Classification of
Deferred Taxes. This ASU simplifies the presentation of deferred income taxes by eliminating
the requirement for entities to separate deferred tax liabilities and assets into current and
noncurrent amounts in classified balance sheets. Instead, it requires deferred tax assets and
liabilities be classified as noncurrent in the balance sheet. ASU 2015-17 is effective for financial
statements issued for annual periods beginning after December 15, 2016. The Company has not
yet selected a transition method and is currently evaluating the impact of the adoption of this
standard on its consolidated financial statements.
In May 2014, the FASB issued ASU 2014-09, Revenue from Contracts with Customers (Topic
606), requiring an entity to recognize the amount of revenue to which it expects to be entitled for
the transfer of promised goods or services to customers. The updated standard will replace most
existing revenue recognition guidance in U.S. GAAP when it becomes effective and permits the
use of either a full retrospective or retrospective with cumulative effect transition method. In
August 2015, the FASB issued ASU 2015-14 which defers the effective date of ASU 2014-09
one year making it effective for annual reporting periods beginning after December 15, 2017.
The Company has not yet selected a transition method and is currently evaluating the effect that
the standard will have on the consolidated financial statements.
Forward-Looking Statements and Projections
The Company may, from time to time, make forward-looking statements and projections
concerning future expectations. Such statements are based on current expectations and are
subject to certain qualifying risks and uncertainties, such as market demand, sales levels of
firearms, anticipated castings sales and earnings, the need for external financing for operations or
capital expenditures, the results of pending litigation against the Company, the impact of future
firearms control and environmental legislation and accounting estimates, any one or more of
which could cause actual results to differ materially from those projected. Words such as
“expect,” “believe,” “anticipate,” “intend,” “estimate,” “will,” “should,” “could” and other words
and terms of similar meaning, typically identify such forward-looking statements. Readers are
cautioned not to place undue reliance on these forward-looking statements, which speak only as
of the date made. The Company undertakes no obligation to publish revised forward-looking
statements to reflect events or circumstances after the date such forward-looking statements are
made or to reflect the occurrence of subsequent unanticipated events.
45
ITEM 7A—QUANTITATIVE AND QUALITATIVE DISCLOSURES ABOUT MARKET RISK
The Company is exposed to changing interest rates on its investments, which consist primarily of
United States Treasury instruments with short-term (less than one year) maturities and cash. The
interest rate market risk implicit in the Company's investments at any given time is low, as the
investments mature within short periods and the Company does not have significant exposure to
changing interest rates on invested cash.
The Company has not undertaken any actions to cover interest rate market risk and is not a party
to any interest rate market risk management activities.
A hypothetical 100 basis point change in market interest rates over the next year would not
materially impact the Company’s earnings or cash flows. A hypothetical 100 basis point change
in market interest rates would not have a material effect on the fair value of the Company’s
investments.

46
ITEM 8—FINANCIAL STATEMENTS AND SUPPLEMENTARY DATA
INDEX TO CONSOLIDATED FINANCIAL STATEMENTS
Reports of Independent Registered Public Accounting Firm
47 Consolidated Balance Sheets at December 31, 2015 and 2014 49 Consolidated Statements of Income and Comprehensive
Income for the years ended December 31, 2015, 2014 and 2013
51
Consolidated Statements of Stockholders’ Equity for the years
ended December 31, 2015, 2014 and 2013
52 Consolidated Statements of Cash Flows for the years ended
December 31, 2015, 2014 and 2013
53 Notes to Consolidated Financial Statements 54

47
Report of Independent Registered Public Accounting Firm
To the Board of Directors and Stockholders
Sturm, Ruger & Company, Inc. and Subsidiary
We have audited Sturm, Ruger & Company, Inc. and Subsidiary's (“the Company”) internal control over financial
reporting as of December 31, 2015, based on criteria established in Internal Control—Integrated Framework issued
by the Committee of Sponsoring Organizations of the Treadway Commission in 2013. The Company’s
management is responsible for maintaining effective internal control over financial reporting and for its assessment
of the effectiveness of internal control over financial reporting included in the accompanying Management’s Report
on Internal Control over Financial Reporting appearing under Item 9A. Our responsibility is to express an opinion
on the Company's internal control over financial reporting based on our audit.
We conducted our audit in accordance with the standards of the Public Company Accounting Oversight Board
(United States). Those standards require that we plan and perform the audit to obtain reasonable assurance about
whether effective internal control over financial reporting was maintained in all material respects. Our audit
included obtaining an understanding of internal control over financial reporting, assessing the risk that a material
weakness exists, and testing and evaluating the design and operating effectiveness of internal control based on the
assessed risk. Our audit also included performing such other procedures as we considered necessary in the
circumstances. We believe that our audit provides a reasonable basis for our opinion.
A company's internal control over financial reporting is a process designed to provide reasonable assurance
regarding the reliability of financial reporting and the preparation of financial statements for external purposes in
accordance with generally accepted accounting principles. A company's internal control over financial reporting
includes those policies and procedures that (a) pertain to the maintenance of records that, in reasonable detail,
accurately and fairly reflect the transactions and dispositions of the assets of the company; (b) provide reasonable
assurance that transactions are recorded as necessary to permit preparation of financial statements in accordance
with generally accepted accounting principles, and that receipts and expenditures of the company are being made
only in accordance with authorizations of management and directors of the company; and (c) provide reasonable
assurance regarding prevention or timely detection of unauthorized acquisition, use, or disposition of the company's
assets that could have a material effect on the financial statements.
Because of its inherent limitations, internal control over financial reporting may not prevent or detect misstatements.
Also, projections of any evaluation of effectiveness to future periods are subject to the risk that controls may become
inadequate because of changes in conditions, or that the degree of compliance with the policies or procedures may
deteriorate.
In our opinion, Sturm, Ruger & Company, Inc. and Subsidiary maintained, in all material respects, effective internal
control over financial reporting as of December 31, 2015, based on criteria established in Internal Control—
Integrated Framework issued by the Committee of Sponsoring Organizations of the Treadway Commission in 2013.
We have also audited, in accordance with the standards of the Public Company Accounting Oversight Board (United
States), the consolidated balance sheets of Sturm, Ruger & Company, Inc. and Subsidiary as of December 31, 2015
and 2014, and the related consolidated statements of income and comprehensive income, stockholders’ equity, and
cash flows for each of the three years in the period ended December 31, 2015, and our report dated February 24,
2016 expressed an unqualified opinion.
/s/RSM US LLP
Stamford, Connecticut
February 24, 2016

48
Report of Independent Registered Public Accounting Firm To the Board of Directors and Stockholders
Sturm, Ruger & Company, Inc. and Subsidiary
We have audited the accompanying consolidated balance sheets of Sturm, Ruger & Company, Inc. and
Subsidiary as of December 31, 2015 and 2014, and the related consolidated statements of income and
comprehensive income, stockholders’ equity, and cash flows for each of the three years in the period
ended December 31, 2015. Our audits also included the financial statement schedule of Sturm, Ruger &
Company, Inc. and Subsidiary (“the Company”) listed in Item 15(a). These consolidated financial
statements and financial statement schedule are the responsibility of the Company's management. Our
responsibility is to express an opinion on these consolidated financial statements and schedule based on
our audits.
We conducted our audits in accordance with the standards of the Public Company Accounting Oversight
Board (United States). Those standards require that we plan and perform the audit to obtain reasonable
assurance about whether the financial statements are free of material misstatement. An audit includes
examining, on a test basis, evidence supporting the amounts and disclosures in the financial statements.
An audit also includes assessing the accounting principles used and significant estimates made by
management, as well as evaluating the overall financial statement presentation. We believe that our
audits provide a reasonable basis for our opinion.
In our opinion, the consolidated financial statements referred to above present fairly, in all material
respects, the financial position of Sturm, Ruger & Company, Inc. and Subsidiary as of December 31,
2015 and 2014, and the results of its operations and its cash flows for each of the three years in the period
ended December 31, 2015, in conformity with U.S. generally accepted accounting principles. Also, in our
opinion, the related financial statement schedule, when considered in relation to the basic consolidated
financial statements taken as a whole, presents fairly in all material respects the information set forth
therein.
We also have audited, in accordance with the standards of the Public Company Accounting Oversight
Board (United States), Sturm, Ruger & Company, Inc. and Subsidiary’s internal control over financial
reporting as of December 31, 2015, based on criteria established in Internal Control—Integrated
Framework issued by the Committee of Sponsoring Organizations of the Treadway Commission in 2013,
and our report dated February 24, 2016 expressed an unqualified opinion on the effectiveness of Sturm,
Ruger & Company, Inc. and Subsidiary’s internal control over financial reporting.
/s/RSM US LLP
Stamford, Connecticut
February 24, 2016

49
Consolidated Balance Sheets
(Dollars in thousands, except per share data)
December 31, 2015 2014
Assets
Current Assets
Cash and cash equivalents $ 69,225 $ 8,901
Trade receivables, net 71,721 49,735
Gross inventories
Less LIFO reserve
Less excess and obsolescence reserve
81,278
(42,061)
(2,118)
89,017
(40,578)
(3,750)
Net inventories 37,099 44,689
Deferred income taxes 8,219 7,246
Prepaid expenses and other current assets 3,008 7,603
Total Current Assets 189,272 118,174
Property, Plant, and Equipment 308,597 288,236
Less allowances for depreciation (204,777) (177,575)
Net property, plant and equipment 103,820 110,661
Other assets 22,791 25,547
Total Assets $315,883 $254,382
See accompanying notes to consolidated financial statements.

50
December 31, 2015 2014
Liabilities and Stockholders’ Equity
Current Liabilities
Trade accounts payable and accrued expenses $ 42,991 $ 36,150
Product liability 642 641
Employee compensation and benefits 28,298 18,302
Workers’ compensation 5,100 5,133
Income taxes payable 4,962 156
Total Current Liabilities 81,993 60,382
Product liability 102 204
Deferred income taxes 6,050 8,334
Contingent liabilities (Note 16) - -
Stockholders’ Equity
Common stock, non-voting, par value $1:
Authorized shares – 50,000; none issued
Common stock, par value $1:
Authorized shares – 40,000,000
2015 – 23,775,766 issued,
18,713,419 outstanding
2014 – 23,717,321 issued,
18,737,074 outstanding
23,776
23,717
Additional paid-in capital 29,591 25,472
Retained earnings 239,098 198,159
Less: Treasury stock – at cost
2015 – 5,062,347 shares
2014 – 4,980,247 shares
(64,727)
(61,886)
Total Stockholders’ Equity 227,738 185,462
Total Liabilities and Stockholders’ Equity $315,883 $254,382
See accompanying notes to consolidated financial statements.

51
Consolidated Statements of Income and Comprehensive Income
(In thousands, except per share data)
Year ended December 31, 2015 2014 2013
Net firearms sales $544,850 $542,267 $678,552 Net castings sales 6,244 2,207 9,724 Total net sales 551,094 544,474 688,276 Cost of products sold 378,934 375,300 429,671 Gross profit 172,160 169,174 258,605
Operating Expenses:
Selling 49,864 44,550 48,706 General and administrative 27,864 28,899 35,394 Defined benefit pension plans settlement charge - 40,999 - Other operating income, net (113) (1,612) (401)
Total operating expenses 77,615 112,836 83,699 Operating income 94,545 56,338 174,906
Other income:
Royalty income 1,084 468 658 Interest income 5 2 4 Interest expense (156) (152) (135) Other income (expense), net 622 584 (201)
Total other income, net 1,555 902 326 Income before income taxes 96,100 57,240 175,232
Income taxes 33,974 18,612 63,960 Net income 62,126 38,628 111,272 Other comprehensive income (loss), net of tax:
Defined benefit pension plans - - 10,240
Comprehensive income $ 62,126 $ 38,628 $121,512
Basic Earnings Per Share $3.32 $1.99 $5.76
Fully Diluted Earnings Per Share $3.21 $1.95 $5.58
Cash Dividends Per Share $1.10 $1.62 $2.12
See accompanying notes to consolidated financial statements.

52
Consolidated Statements of Stockholders’ Equity
(Dollars in thousands)
Common
Stock
Additional
Paid-in
Capital
Retained
Earnings
Treasury
Stock
Accumulated
Other
Comprehensive
Loss
Total
Balance at December 31, 2012 $23,563 $15,531 $123,442 $(37,884) $(29,620) $ 95,032
Net income 111,272 111,272
Pension liability, net of
deferred taxes of $6,256
10,241
10,241
Dividends paid (41,079) (41,079)
Stock-based compensation 5,288 5,288
Exercise of stock options and
vesting of RSU’s
(2,423)
(2,423)
Tax benefit realized from exercise
of stock options and vesting of
RSU’s
2,302
2,302
Common stock issued –
compensation plans
84
(84)
-
Unpaid dividends accrued (1,547) (1,547)
Balance at December 31, 2013 23,647 20,614 192,088 (37,884) (19,379) 179,086
Net income 38,628 38,628
Settlement of pension liability, net
of deferred taxes of $11,157
19,379
19,379
Dividends paid (31,446) (31,446)
Stock-based compensation 5,647 5,647
Exercise of stock options and
vesting of RSU’s
(2,340)
(2,340)
Tax benefit realized from exercise
of stock options and vesting of
RSU’s
1,621
1,621
Common stock issued –
compensation plans
70
(70)
-
Unpaid dividends accrued (1,111) (1,111)
Repurchase of 680,813 shares of
common stock
(24,002)
(24,002)
Balance at December 31, 2014 23,717 25,472 198,159 (61,886) - 185,462
Net income 62,126 62,126
Dividends paid (20,569) (20,569)
Stock-based compensation 4,530 4,530
Exercise of stock options and
vesting of RSU’s
(788)
(788)
Tax benefit realized from exercise
of stock options and vesting of
RSU’s
436
436
Common stock issued –
compensation plans
59
(59)
-
Unpaid dividends accrued (618) (618)
Repurchase of 82,100 shares of
common stock
(2,841)
(2,841)
Balance at December 31, 2015 $23,776 $29,591 $239,098 $(64,727) $ - $227,738
See accompanying notes to consolidated financial statements.

53
Consolidated Statements of Cash Flows
(In thousands)
Year ended December 31, 2015 2014 2013
Operating Activities
Net income $ 62,126 $ 38,628 $111,272 Adjustments to reconcile net income to cash provided by operating activities:
Pension plan settlement charge - 32,218 - Depreciation and amortization 36,235 36,706 20,362 Stock-based compensation 4,530 5,647 5,288 Excess and obsolescence inventory reserve (1,468) 1,347 693 Loss (gain) on sale of assets (113) (1) 1 Deferred income taxes (3,257) (12,015) 5,736 Impairment of assets - 178 911 Changes in operating assets and liabilities:
Trade receivables (21,986) 17,649 (24,366) Inventories 9,058 (22,775) (7,945) Trade accounts payable and accrued expenses 6,808 (11,047) 9,231 Employee compensation and benefits 9,378 (17,435) 17,897 Product liability (101) (391) 179 Prepaid expenses, other assets and other liabilities 6,553 (13,075) (19,340) Income taxes payable 4,806 (83) (250)
Cash provided by operating activities 112,569 55,551 119,669 Investing Activities
Property, plant, and equipment additions (28,705) (45,571) (54,616) Net proceeds from sale of assets 222 24 233
Cash used for investing activities (28,483) (45,547) (54,383) Financing Activities
Dividends paid (20,569) (31,446) (41,079) Tax benefit from exercise of stock options 436 1,621 2,302 Repurchase of common stock (2,841) (24,002) - Payment of employee withholding tax related to share-
based compensation
(999)
(2,363)
(2,423) Proceeds from exercise of stock options 211 23 -
Cash used for financing activities (23,762) (56,167) (41,200)
Increase (decrease) in cash and cash equivalents 60,324 (46,163) 24,086 Cash and cash equivalents at beginning of year 8,901 55,064 30,978 Cash and cash equivalents at end of year $ 69,225 $ 8,901 $ 55,064
See accompanying notes to consolidated financial statements.

54
Notes to Consolidated Financial Statements
(Dollars in thousands, except per share)
1. Summary of Significant Accounting Policies
Organization
Sturm, Ruger & Company, Inc. (the “Company”) is principally engaged in the design,
manufacture, and sale of firearms to domestic customers. Approximately 99% of sales were
from firearms. Export sales represented approximately 4% of firearms sales. The Company’s
design and manufacturing operations are located in the United States and almost all product
content is domestic. The Company’s firearms are sold through a select number of independent
wholesale distributors principally to the commercial sporting market.
The Company manufactures investment castings made from steel alloys and metal injection
molding (“MIM”) parts for internal use in its firearms and utilizes available capacity to
manufacture and sell investment castings and MIM parts to unaffiliated, third-party customers.
Castings were approximately 1% of the Company’s total sales for the year ended December 31,
2015.
Preparation of Financial Statements
The Company follows United States generally accepted accounting principles (“GAAP”). The
preparation of financial statements in conformity with GAAP requires management to make
estimates and assumptions that affect the reported amounts of assets and liabilities and disclosure
of contingent liabilities at the date of the financial statements and the reported amounts of
revenues and expenses during the reporting period. Actual results could differ from these
estimates.
The significant accounting policies described below, together with the notes that follow, are an
integral part of the Financial Statements. Principles of Consolidation
The consolidated financial statements include the accounts of the Company and its wholly
owned subsidiary. All significant intercompany accounts and transactions have been eliminated. Revenue Recognition
Substantially all product sales are sold FOB (free on board) shipping point. Revenue is
recognized when product is shipped and the customer takes ownership and assumes the risk of
loss. Accruals are made for sales discounts and incentives based on the Company’s experience.
The Company accounts for cash sales discounts as a reduction in sales and sales incentives as a
charge to selling expense. Amounts billed to customers for shipping and handling fees are
included in net sales and costs incurred by the Company for the delivery of goods are classified
as selling expenses. Federal excise taxes are excluded from net sales.
55
Cash and Cash Equivalents
The Company considers interest-bearing deposits with financial institutions with remaining
maturities of three months or less at the time of acquisition to be cash equivalents.
Accounts Receivable
The Company establishes an allowance for doubtful accounts based on the creditworthiness of its
customers and historical experience. While the Company uses the best information available to
make its evaluation, future adjustments to the allowance for doubtful accounts may be necessary
if there are significant changes in economic and industry conditions or any other factors
considered in the Company’s evaluation. Bad debt expense has been immaterial during each of
the last three years.
Inventories
Substantially all of the Company’s inventories are valued at the lower of cost, principally
determined by the last-in, first-out (LIFO) method, or market. Elements of cost in inventories
include raw materials, direct labor and manufacturing overhead.
Property, Plant, and Equipment
Property, plant, and equipment are carried at cost. Depreciation is computed over useful lives
using the straight-line and declining balance methods predominately over 15 years for buildings,
7 years for machinery and equipment and 3 years for tools and dies. When assets are retired, sold
or otherwise disposed of, their gross carrying values and related accumulated depreciation are
removed from the accounts and a gain or loss on such disposals is recognized when appropriate.
Maintenance and repairs are charged to operations; replacements and improvements are
capitalized.
Long-lived Assets
The Company evaluates the carrying value of long-lived assets to be held and used when events
or changes in circumstances indicate the carrying value may not be recoverable. In performing
this review, the carrying value of the assets is compared to the projected undiscounted cash flows
to be generated from the assets. If the sum of the undiscounted expected future cash flows is less
than the carrying value of the assets, the assets are considered to be impaired. Impairment losses
are measured as the amount by which the carrying value of the assets exceeds their fair value.
The Company bases fair value of the assets on quoted market prices if available or, if not
available, quoted market prices of similar assets. Where quoted market prices are not available,
the Company estimates fair value using the estimated future cash flows generated by the assets
discounted at a rate commensurate with the risks associated with the recovery of the assets.

56
Income Taxes
Income taxes are accounted for using the asset and liability method. Under this method, deferred
income taxes are recognized for the tax consequences of “temporary differences” by applying
enacted statutory rates applicable to future years to temporary differences between the financial
statement carrying amounts and the tax basis of the Company’s assets and liabilities.
Product Liability
The Company provides for product liability claims including estimated legal costs to be incurred
defending such claims. The provision for product liability claims is charged to cost of products
sold.
Advertising Costs
The Company expenses advertising costs as incurred. Advertising expenses for 2015, 2014, and
2013, were $3.0 million, $3.6 million, and $3.2 million, respectively.
Shipping Costs
Costs incurred related to the shipment of products are included in selling expense. Such costs
totaled $6.4 million, $7.1 million, and $6.8 million in 2015, 2014, and 2013, respectively.
Research and Development
In 2015, 2014, and 2013, the Company spent approximately $8.5 million, $10.0 million, and $6.2
million, respectively, on research and development activities relating to new products and the
improvement of existing products. These costs are expensed as incurred.
Earnings per Share
Basic earnings per share is based upon the weighted-average number of shares of common stock
outstanding during the year. Diluted earnings per share reflect the impact of options, restricted
stock units, and deferred stock outstanding using the treasury stock method.
Recent Accounting Pronouncements
In November 2015, the Financial Accounting Standards Board (“FASB”) issued Accounting
Standard Update (“ASU”) 2015-17, Income Taxes (Topic 740): Balance Sheet Classification of
Deferred Taxes. This ASU simplifies the presentation of deferred income taxes by eliminating
the requirement for entities to separate deferred tax liabilities and assets into current and
noncurrent amounts in classified balance sheets. Instead, it requires deferred tax assets and
liabilities be classified as noncurrent in the balance sheet. ASU 2015-17 is effective for financial
statements issued for annual periods beginning after December 15, 2016. The Company has not
yet selected a transition method and is currently evaluating the impact of the adoption of this
standard on its consolidated financial statements.
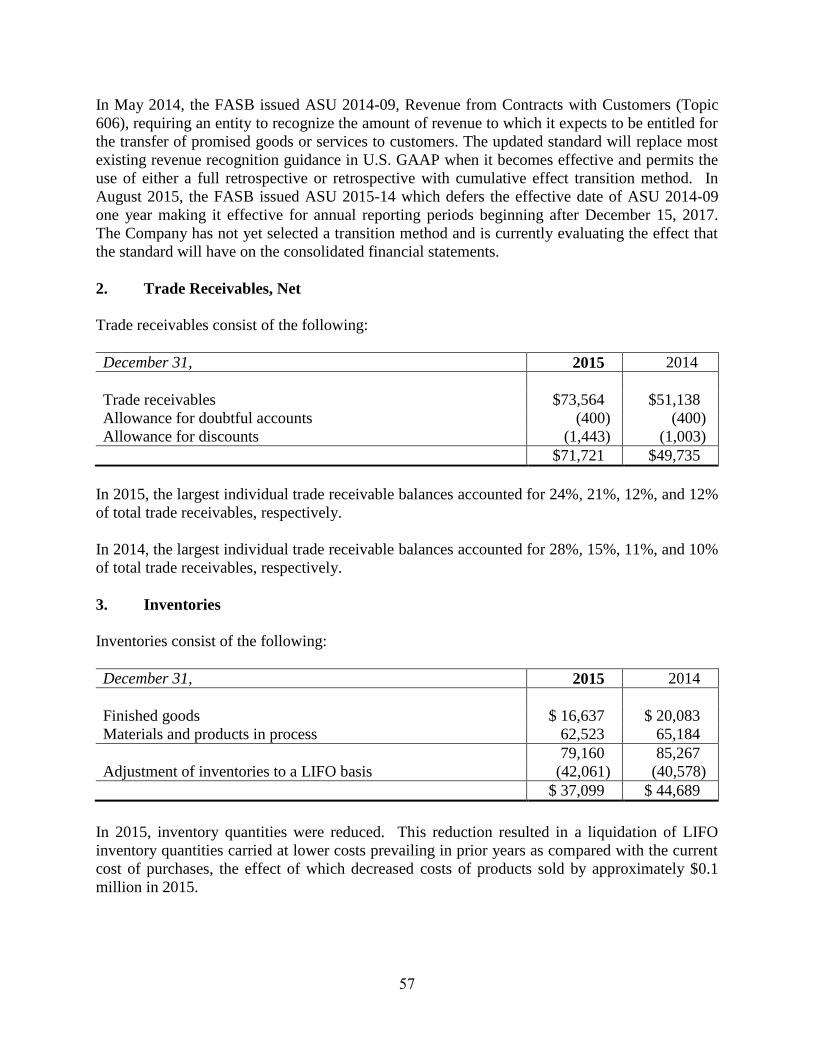
57
In May 2014, the FASB issued ASU 2014-09, Revenue from Contracts with Customers (Topic
606), requiring an entity to recognize the amount of revenue to which it expects to be entitled for
the transfer of promised goods or services to customers. The updated standard will replace most
existing revenue recognition guidance in U.S. GAAP when it becomes effective and permits the
use of either a full retrospective or retrospective with cumulative effect transition method. In
August 2015, the FASB issued ASU 2015-14 which defers the effective date of ASU 2014-09
one year making it effective for annual reporting periods beginning after December 15, 2017.
The Company has not yet selected a transition method and is currently evaluating the effect that
the standard will have on the consolidated financial statements.
2. Trade Receivables, Net
Trade receivables consist of the following:
December 31, 2015 2014
Trade receivables $73,564 $51,138
Allowance for doubtful accounts (400) (400)
Allowance for discounts (1,443) (1,003)
$71,721 $49,735
In 2015, the largest individual trade receivable balances accounted for 24%, 21%, 12%, and 12%
of total trade receivables, respectively.
In 2014, the largest individual trade receivable balances accounted for 28%, 15%, 11%, and 10%
of total trade receivables, respectively.
3. Inventories
Inventories consist of the following:
December 31, 2015 2014
Finished goods $ 16,637 $ 20,083
Materials and products in process 62,523 65,184
79,160 85,267
Adjustment of inventories to a LIFO basis (42,061) (40,578)
$ 37,099 $ 44,689
In 2015, inventory quantities were reduced. This reduction resulted in a liquidation of LIFO
inventory quantities carried at lower costs prevailing in prior years as compared with the current
cost of purchases, the effect of which decreased costs of products sold by approximately $0.1
million in 2015.

58
4. Property, Plant and Equipment
Property, plant and equipment consist of the following:
December 31, 2015 2014
Land and improvements $ 1,930 $ 1,926
Buildings and improvements 46,354 42,432
Machinery and equipment 216,055 201,562
Dies and tools 44,258 42,316
$308,597 $288,236
In 2013, the Company revised its estimate of the useful life of machinery and equipment from 10
to 7 years. This change, which became effective December 31, 2013, resulted in increased
depreciation expense of $2.5 million and $7.1 million for 2015 and 2014, respectively. The
Company estimates that this change will decrease depreciation expense for the machinery and
equipment that was on hand at December 31, 2013 by approximately $1.2 million in 2016.
5. Other Assets
Other assets consist of the following:
December 31, 2015 2014
Patents, at cost $ 6,322 $ 6,113
Accumulated amortization (3,629) (3,364)
Deposits on capital items 16,839 19,011
Software development costs, at cost 2,057 2,057
Accumulated amortization (1,792) (1,381)
Other 2,994 3,111
$22,791 $25,547
The capitalized cost of patents is amortized using the straight-line method over their useful lives.
The cost of patent amortization was $0.3 million, $0.3 million, and $0.2 million in 2015, 2014,
and 2013, respectively. The estimated annual patent amortization cost for each of the next five
years is $0.3 million. Costs incurred to maintain existing patents are charged to expense in the
year incurred.
Software development costs were incurred to develop and implement an integrated ERP system
prior to the time the system became operational. These costs are being amortized using the
straight line method over a period of sixty months. Costs incurred subsequent to the system
becoming operational are being expensed. The cost of software development cost amortization
was $0.4 million, $0.4 million, and $0.5 million in 2015, 2014, and 2013, respectively.

59
6. Trade Accounts Payable and Accrued Expenses
Trade accounts payable and accrued expenses consist of the following:
December 31, 2015 2014
Trade accounts payable $13,073 $11,796
Federal excise taxes payable 13,945 9,386
Accrued other 15,973 14,968
$42,991 $36,150
7. Line of Credit
The Company has an unsecured $40 million revolving line of credit with a bank. This facility,
which is renewable annually, has an expiration date of June 15, 2016.
The credit facility remained unused throughout 2014 and 2015. Borrowings under this facility
would bear interest at LIBOR (1.175% at December 31, 2015) plus 200 basis points and the
Company is charged three-eighths of a percent (0.375%) per year on the unused portion. At
December 31, 2015 and 2014, the Company was in compliance with the terms and covenants of
the credit facility.
8. Employee Benefit Plans
In the fourth quarter of 2014, the Company completed the migration of its retirement benefits
plans from defined-benefit pension plans to a defined-contribution retirement plan, utilizing its
existing 401(k) plan.
The Company previously sponsored two qualified defined-benefit pension plans that covered
substantially all employees. In 2007, the Company amended its hourly and salaried defined-
benefit pension plans so that employees no longer accrued benefits under them. This action
“froze” the benefits for all employees and prevented future hires from joining the plans. A third
defined-benefit pension plan was non-qualified and covered certain executive officers of the
Company.
The Company sponsors a defined-contribution 401(k) plan that covers substantially all
employees. The Company matches employee contributions to their 401(k) accounts using the
“safe harbor” guidelines provided in the Internal Revenue Code. In addition, the Company
provides discretionary supplemental contributions to substantially all employees’ individual
401(k) accounts.
Defined-Benefit Plans
In December 2014 the Company terminated its defined benefit pension plans and settled all
obligations to employees. As a result of the termination of the plans, the Company recognized an

60
expense of $41.0 million in the fourth quarter of 2014, primarily comprised of the recognition of
previously deferred actuarial losses.
Active employees, all of whom were 100 percent vested in their pension benefits, were given the
option of rolling the actuarially determined present value of their benefits into their 401(k)
accounts, receiving deferred annuity contracts issued by an insurance carrier, or receiving a lump
sum payment.
The Company contributed $7.5 million to the frozen pension plans in 2014 in order to fully fund
the settlement, representing the shortfall of the existing pension fund assets on the termination
date to the settlement value. The Company contributed $3 million to these frozen pension plans
in 2013, which satisfied the required minimum contribution for that year. Since the plans have
been fully funded and settled, no cash contributions were required in 2015, nor will any be
required in future years.
The measurement date of the assets and liabilities of all plans presented for 2014 was December
31, 2014. Since the plans were fully funded and terminated in 2014, no comparable data is
presented for 2015.
Summarized actuarial information on the Company’s defined-benefit pension plans is as follows:
Obligations and Funded Status at December 31, 2014
Change in Benefit Obligation
Benefit obligation at beginning of year $77,484
Service cost -
Interest cost 3,595
Actuarial (gain) loss 5,855
Benefits paid (3,301)
Settlement of obligations (83,633)
Benefit obligation at end of year -
Change in Plan Assets
Fair value of plan assets at beginning of year 77,993
Actual return on plan assets 311
Employer contributions 8,630
Benefits paid (3,301)
Settlement of obligations (83,633)
Fair value of plan assets at end of year -
Funded Status
Funded status -
Unrecognized net actuarial loss -
Unrecognized prior service cost -
Net amount recognized $ -

61
Weighted Average Assumptions for the years
ended December 31,
2014
Discount rate 4.75%
Expected long-term return on plan assets N/A
Rate of compensation increases N/A
Components of Net Periodic Pension Cost 2014
Service cost $ -
Interest cost 3,595
Expected return on assets (6,114)
Recognized gains 997
Net periodic pension cost $ (1,522)
Benefit plan termination costs (see above) 40,999
Net periodic pension cost and benefit plan termination costs $39,477
In conjunction with the termination and settlement of the defined-benefit pension plans, the
additional minimum pension liability was fully recognized in 2014. The Company recorded an
adjustment to the additional minimum pension liability, net of tax, which increased
comprehensive income by $19.4 million and $10.2 million in 2014 and 2013, respectively.
Plan Assets
As a result of the termination and settlement of the defined-benefit pension plans, there are no
plan assets as of December 31, 2015 and 2014.
Defined-Contribution Plans
The Company sponsors a qualified defined-contribution 401(k) plan that covers substantially all
of its hourly and salaried employees. Under the terms of the 401(k) plan, the Company matches
a certain portion of employee contributions. Expenses related to matching employee
contributions to the 401(k) plan were $3.3 million, $3.2 million, and $3.0 million in 2015, 2014,
and 2013, respectively.
Additionally, in 2015, 2014, and 2013 the Company provided discretionary supplemental
contributions to the individual 401(k) accounts of substantially all employees. Each employee
received a supplemental contribution to their account based on a uniform percentage of
qualifying compensation established annually. The cost of these supplemental contributions
totaled $5.0 million, $5.6 million, and $4.9 million in 2015, 2014, and 2013, respectively.

62
9. Other Operating Income, net
Other operating income, net consists of the following:
Year ended December 31, 2015 2014 2013
Gain on sale of operating assets $ 113 $ 1 $ 65
Frozen defined-benefit pension plan income - 1,611 336
Total other operating income, net $ 113 $1,612 $401
10. Income Taxes
The Company files income tax returns in the U.S. federal jurisdiction and various state
jurisdictions. With few exceptions, the Company is no longer subject to U.S. federal and state
income tax examinations by tax authorities for years before 2012.
The federal and state income tax provision consisted of the following:
Year ended December 31, 2015 2014 2013
Current Deferred Current Deferred Current Deferred
Federal $31,382 $(2,774) $25,797 $(10,429) $49,022 $4,879
State 5,849 (483) 5,019 (1,775) 9,202 857
$37,231 $(3,257) $30,816 $(12,204) $58,224 $5,736
The effective income tax rate varied from the statutory federal income tax rate as follows:
Year ended December 31, 2015 2014 2013
Statutory federal income tax rate 35.0% 35.0% 35.0%
State income taxes, net of federal tax benefit 3.6 3.7 3.7
Domestic production activities deduction (3.2) (4.6) (2.7)
Other items - (1.6) 0.5
Effective income tax rate 35.4% 32.5% 36.5%

63
Significant components of the Company’s deferred tax assets and liabilities are as follows:
December 31, 2015 2014
Deferred tax assets
Product Liability $ 263 $ 289
Employee compensation and benefits 3,822 3,621
Allowances for doubtful accounts and discounts 3,454 2,351
Inventories 886 1,411
Stock-based compensation 5,410 4,517
Other 1,623 1,487
Total deferred tax assets 15,458 13,676
Deferred tax liabilities:
Depreciation 12,946 14,377
Other 343 387
Total deferred tax liabilities 13,289 14,764
Net deferred tax (liabilities) assets $ 2,169 $(1,088)
The Company made income tax payments of approximately $27.5 million, $34.0 million, and
$59.9 million, during 2015, 2014, and 2013, respectively. The Company expects to realize its
deferred tax assets through tax deductions against future taxable income or carry back against
taxes previously paid.
The Company does not believe it has included any “uncertain tax positions” in its federal income
tax return or any of the state income tax returns it is currently filing. The Company has made an
evaluation of the potential impact of additional state taxes being assessed by jurisdictions in
which the Company does not currently consider itself liable. The Company does not anticipate
that such additional taxes, if any, would result in a material change to its financial position.
11. Earnings Per Share
Set forth below is a reconciliation of the numerator and denominator for basic and diluted
earnings per share calculations for the periods indicated:
Year ended December 31, 2015 2014 2013
Numerator:
Net income $62,126 $38,628 $111,272
Denominator:
Weighted average number of common shares
outstanding – Basic
18,696,659
19,367,928
19,327,394
Dilutive effect of options and restricted stock
units outstanding under the Company’s
employee compensation plans
668,420
469,480
613,324
Weighted average number of common shares
outstanding – Diluted
19,365,079
19,837,408
19,940,718
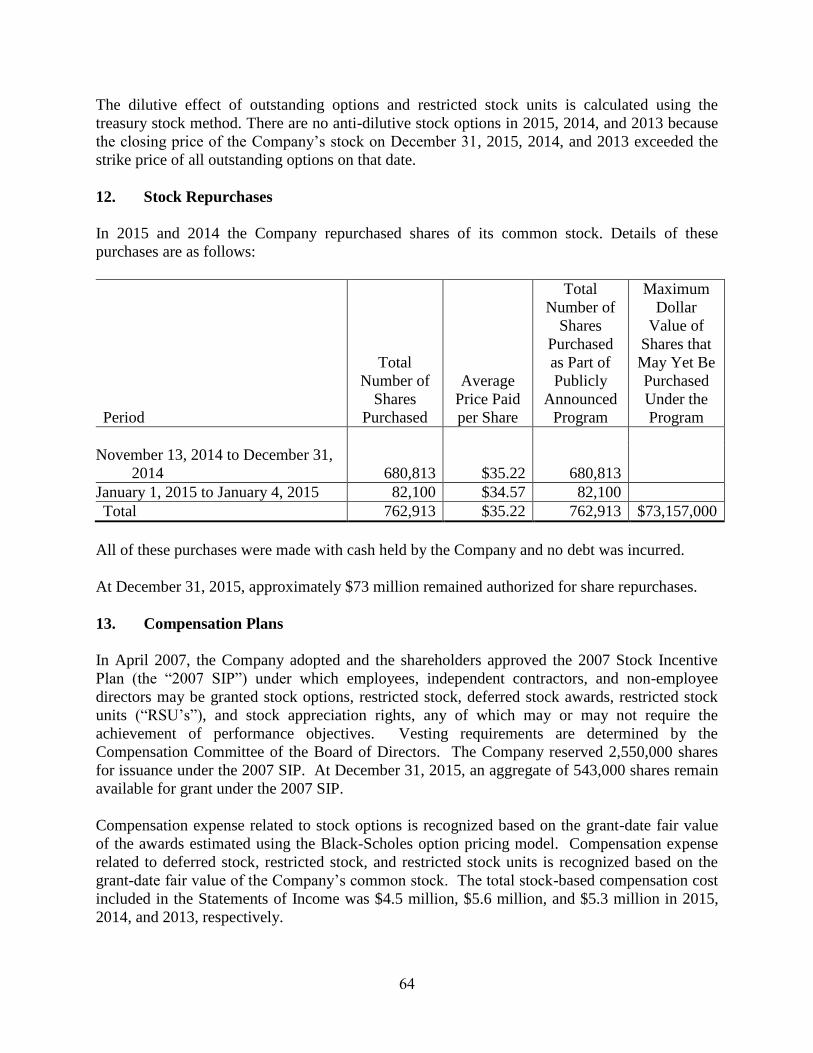
64
The dilutive effect of outstanding options and restricted stock units is calculated using the
treasury stock method. There are no anti-dilutive stock options in 2015, 2014, and 2013 because
the closing price of the Company’s stock on December 31, 2015, 2014, and 2013 exceeded the
strike price of all outstanding options on that date.
12. Stock Repurchases
In 2015 and 2014 the Company repurchased shares of its common stock. Details of these
purchases are as follows:
Period
Total
Number of
Shares
Purchased
Average
Price Paid
per Share
Total
Number of
Shares
Purchased
as Part of
Publicly
Announced
Program
Maximum
Dollar
Value of
Shares that
May Yet Be
Purchased
Under the
Program
November 13, 2014 to December 31,
2014
680,813
$35.22
680,813
January 1, 2015 to January 4, 2015 82,100 $34.57 82,100
Total 762,913 $35.22 762,913 $73,157,000
All of these purchases were made with cash held by the Company and no debt was incurred.
At December 31, 2015, approximately $73 million remained authorized for share repurchases.
13. Compensation Plans
In April 2007, the Company adopted and the shareholders approved the 2007 Stock Incentive
Plan (the “2007 SIP”) under which employees, independent contractors, and non-employee
directors may be granted stock options, restricted stock, deferred stock awards, restricted stock
units (“RSU’s”), and stock appreciation rights, any of which may or may not require the
achievement of performance objectives. Vesting requirements are determined by the
Compensation Committee of the Board of Directors. The Company reserved 2,550,000 shares
for issuance under the 2007 SIP. At December 31, 2015, an aggregate of 543,000 shares remain
available for grant under the 2007 SIP.
Compensation expense related to stock options is recognized based on the grant-date fair value
of the awards estimated using the Black-Scholes option pricing model. Compensation expense
related to deferred stock, restricted stock, and restricted stock units is recognized based on the
grant-date fair value of the Company’s common stock. The total stock-based compensation cost
included in the Statements of Income was $4.5 million, $5.6 million, and $5.3 million in 2015,
2014, and 2013, respectively.

65
Stock Options
There were no stock options granted in 2015, 2014 or 2013.
The following table summarizes the stock option activity of the 2007 SIP:
Shares
Weighted
Average
Exercise
Price
Weighted
Average
Grant
Date
Fair Value
Weighted
Average
Remaining
Contractual
Life (Years)
Outstanding at December 31, 2012 120,460 8.58 6.76 5.7
Granted - - - -
Exercised (63,239) 8.51 6.86 4.4
Canceled - - - -
Outstanding at December 31, 2013 57,221 8.66 6.65 5.0
Granted - - - -
Exercised (16,244) 8.25 7.54 3.9
Canceled - - - -
Outstanding at December 31, 2014 40,977 8.82 6.29 4.1
Granted - - - -
Exercised (29,139) 8.77 6.13 3.1
Canceled - - - -
Outstanding at December 31, 2015 11,838 8.95 6.69 3.3
Exercisable Options Outstanding
at December 31, 2015
11,838
8.95
6.69
3.3
Non-Vested Options Outstanding
at December 31, 2015
-
-
-
-
At December 31, 2015, the aggregate intrinsic value of all options, including exercisable options,
was $0.6 million.
Deferred Stock
Deferred stock awards vest based on the passage of time or the Company’s attainment of
performance objectives. Upon vesting, these awards convert one-for-one to common stock.
In 2015, 4,000 deferred stock awards were issued to non-employee directors that will vest in
April 2016 and 5,370 deferred stock awards were issued to non-employee directors that will vest
in April 2018.
In 2014, 3,711 deferred stock awards were issued to non-employee directors that vested in April
2015 and 7,002 deferred stock awards were issued to non-employee directors that will vest in
April 2017.

66
In 2013, 4,430 deferred stock awards were issued to non-employee directors that vested in April
2014 and 5,952 deferred stock awards were issued to non-employee directors that will vest in
April 2016.
Compensation expense related to these awards is amortized ratably over the vesting period.
Compensation expense related to these awards was $0.6 million, $0.6 million and $0.5 million in
2015, 2014, and 2013, respectively.
At December 31, 2015, there was $0.5 million of unrecognized compensation cost related to
deferred stock that is expected to be recognized over a period of three years.
Restricted Stock Units
The Company grants restricted stock units in lieu of incentive stock options to senior employees.
These RSU’s have a vesting “double trigger.” The vesting of these RSU’s is dependent on the
achievement of corporate objectives established by the Compensation Committee of the Board of
Directors and the passage of time.
During 2015, 76,000 restricted stock units were issued. Compensation costs related to these
restricted stock units was $1.9 million, of which $0.5 million was recognized in 2015. The
remaining costs will be recognized ratably over the remaining periods required before the units
vest, which range from 27 to 49 months.
During 2014, 59,000 restricted stock units were issued. Compensation costs related to these
restricted stock units was $3.8 million, of which $1.0 million was recognized in 2014. The
remaining costs are not being recognized since the required performance criteria is not expected
to be attained.
During 2013, 32,000 restricted stock units were issued. Compensation costs related to these
restricted stock units was $1.8 million, of which $0.6 million, $0.6 million, and $0.5 million was
recognized in 2015, 2014 and 2013, respectively. The remaining costs will be recognized ratably
over the remaining period required before the units vest, which is 3 months.
At December 31, 2015, there was $2.9 million of unrecognized compensation cost related to
restricted stock units that is expected to be recognized over a period of 4.0 years.
14. Operating Segment Information
The Company has two reportable operating segments: firearms and castings. The firearms
segment manufactures and sells rifles, pistols, and revolvers principally to a number of federally-
licensed, independent wholesale distributors primarily located in the United States. The castings
segment manufactures and sells steel investment castings and metal injection molding parts.
Corporate segment income relates to interest income, the sale of non-operating assets, and other
non-operating activities. Corporate segment assets consist of cash and other non-operating
assets.

67
The Company evaluates performance and allocates resources, in part, based on profit and loss
before taxes. The accounting policies of the reportable segments are the same as those described
in the summary of significant accounting policies (see Note 1). Intersegment sales are recorded
at the Company’s cost plus a fixed profit percentage.
Year ended December 31, 2015 2014 2013 Net Sales
Firearms $544,850 $542,267 $678,552
Castings
Unaffiliated 6,244 2,207 9,724
Intersegment 31,585 34,095 32,794
37,829 36,302 42,518
Eliminations (31,585) (34,095) (32,794)
$551,094 $544,474 $688,276
Income (Loss) Before Income Taxes
Firearms $98,565 $57,525 $177,736
Castings (3,407) (1,294) (3,866)
Corporate 942 1,009 1,362
$96,100 $57,240 $175,232
Identifiable Assets
Firearms $221,670 $211,338 $201,660
Castings 15,289 16,772 11,402
Corporate 78,924 26,272 64,056
$315,883 $254,382 $277,118
Depreciation
Firearms $32,409 $33,594 $18,679
Castings 3,029 2,321 897
$35,438 $35,915 $19,576
Capital Expenditures
Firearms $26,246 $39,511 $51,536
Castings 2,459 6,060 3,080
$28,705 $45,571 $54,616
In 2015, the Company’s largest customers and the percent of total sales they represented were as
follows: Davidson’s-18%; Lipsey’s-17%; Sports South-13%; and Jerry’s/Ellett Brothers-11%.
In 2014, the Company’s largest customers and the percent of total sales they represented were as
follows: Davidson’s-19%; Lipsey’s-13%; Sports South-13%; and Jerry’s/Ellett Brothers-12%.
In 2013, the Company’s largest customers and the percent of total sales they represented were as
follows: Davidson’s-16%; Jerry’s/Ellett Brothers-14%; Lipsey’s-14%; and Sports South-11%.
The Company’s assets are located entirely in the United States and domestic sales represented at
least 96% of total sales in 2015, 2014, and 2013.

68
15. Quarterly Results of Operations (Unaudited)
The following is a tabulation of the unaudited quarterly results of operations for the two years
ended December 31, 2015:
Three Months Ended
3/28/15 6/27/15 9/26/15 12/31/15 Net Sales $136,954 $140,872 $120,871 $152,397
Gross profit 41,397 48,508 34,011 48,244
Net income 15,503 17,560 11,963 17,100
Basic earnings per share 0.83 0.94 0.64 0.91
Diluted earnings per share $0.81 $0.91 $0.62 $0.88
Three Months Ended
3/29/14 6/28/14 9/27/14 12/31/14 Net Sales $169,884 $153,657 $98,327 $122,606
Gross profit 61,123 50,353 23,738 33,960
Net income (loss) 24,319 22,286 6,781 (14,758)
Basic earnings (loss) per share 1.26 1.15 0.35 (0.77)
Diluted earnings (loss) per share $1.22 $1.12 $0.34 $(0.77)
16. Contingent Liabilities
As of December 31, 2015, the Company was a defendant in three (3) lawsuits and is aware of
certain other claims. The lawsuits fall into three categories: traditional product liability patent
litigation and municipal litigation, discussed in turn below.
Traditional Product Liability Litigation
One of the three lawsuits mentioned above involves a claim for damages related to an allegedly
defective product due to its design and/or manufacture. This lawsuit stems from a specific
incident of personal injury and is based on traditional product liability theories such as strict
liability, negligence and/or breach of warranty.
The Company management believes that the allegations in this case are unfounded, that the
incident was unrelated to the design or manufacture of the firearm, and that there should be no
recovery against the Company.
Patent Litigation
During the three months ending December 31, 2015, one case was formally instituted against the
Company, captioned Davies Innovations Inc. v. Sturm, Ruger & Company, Inc., pending in the
United States District Court for the Southern District of Texas, Galveston Division. The suit is
based upon alleged patent infringement as the plaintiff claims that certain features of the Ruger

69
SR-556 and SR-762 modern sporting rifles infringe its patent. The complaint seeks a judgment
of infringement and unspecified monetary damages including costs, fees and treble damages.
The Company management believes that the allegations in this case are unfounded, that there is
no infringement of plaintiff’s patent, that plaintiff’s patent is invalid, and that there should be no
recovery against the Company.
Municipal Litigation
Municipal litigation generally includes those cases brought by cities or other governmental
entities against firearms manufacturers, distributors and retailers seeking to recover damages
allegedly arising out of the misuse of firearms by third-parties.
There is only one remaining lawsuit of this type, filed by the City of Gary in Indiana State Court,
over fifteen years ago. The complaint in that case seeks damages, among other things, for the
costs of medical care, police and emergency services, public health services, and other services
as well as punitive damages. In addition, nuisance abatement and/or injunctive relief is sought to
change the design, manufacture, marketing and distribution practices of the various defendants.
The suit alleges, among other claims, negligence in the design of products, public nuisance,
negligent distribution and marketing, negligence per se and deceptive advertising. The case does
not allege a specific injury to a specific individual as a result of the misuse or use of any of the
Company’s products.
After a long procedural history, the case was scheduled for trial on June 15, 2009. The case was
not tried on that date and was largely dormant until a status conference was held on July 27,
2015. At that time, the court entered a scheduling order setting deadlines for plaintiff to file a
Second Amended Complaint, for defendants to answer, and for defendants to file dispositive
motions. The plaintiff did not file a Second Amended Complaint by the deadline.
Last year, Indiana passed a new law that such that Indiana Code § 34-12-3-1 applies to the City's
case. The defendants have filed a joint motion for judgment on the pleadings, asserting immunity
under §34-12-3-1 and asking the court to re-visit the Court of Appeals' decision holding the
Protection of Lawful Commerce in Arms Act inapplicable to the City's claims. The motion is
being briefed by the parties and currently is set for hearing on April 26, 2016.
Summary of Claimed Damages and Explanation of Product Liability Accruals
Punitive damages, as well as compensatory damages, are demanded in certain of the lawsuits and
claims. For product liability claims made after July 10, 2000, coverage is provided on an annual
basis for losses exceeding $5 million per claim, or an aggregate maximum loss of $10 million
annually, except for certain new claims which might be brought by governments or
municipalities after July 10, 2000, which are excluded from coverage.
The Company management monitors the status of known claims and the product liability accrual,
which includes amounts for asserted and unasserted claims. While it is not possible to forecast
the outcome of litigation or the timing of costs, in the opinion of management, after consultation
70
with special and corporate counsel, it is not probable and is unlikely that litigation, including
punitive damage claims, will have a material adverse effect on the financial position of the
Company, but may have a material impact on the Company’s financial results for a particular
period.
Product liability claim payments are made when appropriate if, as, and when claimants and the
Company reach agreement upon an amount to finally resolve all claims. Legal costs are paid as
the lawsuits and claims develop, the timing of which may vary greatly from case to case. A time
schedule cannot be determined in advance with any reliability concerning when payments will be
made in any given case.
Provision is made for product liability claims based upon many factors related to the severity of
the alleged injury and potential liability exposure, based upon prior claim experience. Because
the Company’s experience in defending these lawsuits and claims is that unfavorable outcomes
are typically not probable or estimable, only in rare cases is an accrual established for such costs.
In most cases, an accrual is established only for estimated legal defense costs. Product liability
accruals are periodically reviewed to reflect then-current estimates of possible liabilities and
expenses incurred to date and reasonably anticipated in the future. Threatened product liability
claims are reflected in the Company’s product liability accrual on the same basis as actual
claims; i.e., an accrual is made for reasonably anticipated possible liability and claims-handling
expenses on an ongoing basis.
A range of reasonably possible loss relating to unfavorable outcomes cannot be made. However,
in product liability cases in which a dollar amount of damages is claimed, the amount of
damages claimed, which totaled $0.1 million and $0.0 million at December 31, 2015 and 2014,
respectively, are set forth as an indication of possible maximum liability that the Company might
be required to incur in these cases (regardless of the likelihood or reasonable probability of any
or all of this amount being awarded to claimants) as a result of adverse judgments that are
sustained on appeal.
As of December 31, 2015 and 2014 the Company was a defendant in 3 and 2 lawsuits,
respectively, involving its products and is aware of other such claims. During 2015 and 2014,
respectively, 2 and 0 claims were filed against the Company, 1 and 2 claims were settled, and no
claims were dismissed in either year.
The Company’s product liability expense was $0.9 million in 2015, $0.8 million in 2014, and
$1.3 million in 2013. This expense includes the cost of outside legal fees, insurance, and other
expenses incurred in the management and defense of product liability matters.

71
A roll-forward of the product liability reserve and detail of product liability expense for the three
years ended December 31, 2015 follows: Balance Sheet Roll-forward for Product Liability Reserve Cash Payments
Balance Beginning of Year (a)
Accrued Legal
Expense (Income)
(b)
Legal Fees (c)
Settlements (d)
Balance End of
Year (a) 2013 $1,057 230 (44) (7) $1,236 2014 $1,236 (295) (18) (78) $ 845 2015 $ 845 (77) (18) (6) $ 744
Income Statement Detail for Product Liability Expense
Accrued
Legal Expense
(b)
Insurance Premium Expense
(e)
Total Product Liability Expense
2013 $ 230 1,023 $ 1,253 2014 $ (295) 1,069 $ 774 2015 $ (77) 997 $ 920
Notes
(a) The beginning and ending liability balances represent accrued legal fees only.
Settlements and administrative costs are expensed as incurred. Only in rare instances is
an accrual established for settlements.
(b) The expense accrued in the liability is for legal fees only. In 2014 and 2015, the costs
incurred related to cases that were settled or dismissed were less than the amounts
accrued for these cases in prior years.
(c) Legal fees represent payments to outside counsel related to product liability matters.
(d) Settlements represent payments made to plaintiffs or allegedly injured parties in
exchange for a full and complete release of liability.
(e) Insurance expense represents the cost of insurance premiums.
There were no insurance recoveries during any of the above years.

72
17. Financial Instruments
The Company does not hold or issue financial instruments for trading or hedging purposes, nor
does it hold interest rate, leveraged, or other types of derivative financial instruments. Fair
values of accounts receivable, accounts payable, accrued expenses and income taxes payable
reflected in the December 31, 2015 and 2014 balance sheets approximate carrying values at
those dates.
18. Subsequent Events
On February 22, 2016, the Company’s Board of Directors authorized a dividend of 35¢ per share
to shareholders of record on March 11, 2016.
The Company’s management has evaluated transactions occurring subsequent to December 31,
2015 and determined that there were no events or transactions during that period that would have
a material impact on the Company’s results of operations or financial position.

73
ITEM 9—CHANGES IN AND DISAGREEMENTS WITH ACCOUNTANTS ON
ACCOUNTING AND FINANCIAL DISCLOSURE
None. ITEM 9A—CONTROLS AND PROCEDURES
Evaluation of Disclosure Controls and Procedures
The Company conducted an evaluation, with the participation of its Chief Executive Officer and
Chief Financial Officer, of the effectiveness of the design and operation of the Company’s
disclosure controls and procedures, as defined in Rules 13a-15(e) and 15d-15(e) under the
Securities Exchange Act of 1934, as amended, as of December 31, 2015. Based upon that
evaluation, the Chief Executive Officer and Chief Financial Officer have concluded that as of
December 31, 2015, the Company’s disclosure controls and procedures over financial reporting
were effective.
Management’s Report on Internal Control over Financial Reporting
The Company’s management is responsible for establishing and maintaining adequate internal
control over financial reporting as defined in Rules 13a-15(f) and 15d-15(f) under the Securities
Exchange Act of 1934. Because of its inherent limitations, internal control over financial
reporting may not prevent or detect misstatements. Also, projections of any evaluation of
effectiveness to future periods are subject to the risk that controls may become inadequate
because of changes in conditions, or that the degree of compliance with the policies or
procedures may deteriorate.
The Company conducted an evaluation, with the participation of its Chief Executive Officer and
Chief Financial Officer, of the effectiveness of its internal control over financial reporting as of
December 31, 2015. This evaluation was performed based on the criteria established in “Internal
Control — Integrated Framework” issued by the Committee of Sponsoring Organizations of the
Treadway Commission (“COSO”) in 2013.
Management has concluded that the Company maintained effective internal control over
financial reporting as of December 31, 2015, based on criteria established in “Internal Control —
Integrated Framework” issued by the COSO in 2013.
The effectiveness of the Company’s internal control over financial reporting as of December 31,
2015 has been audited by RSM US LLP, an independent registered public accounting firm, as
stated in their report which is included in this Form 10-K.
Changes in Internal Control over Financial Reporting
There were no changes in our internal control over financial reporting that occurred during our
most recently completed fiscal quarter that has materially affected, or is reasonably likely to
materially affect, our internal control over financial reporting.
74
New York Stock Exchange Certification
Pursuant to Section 303A.12(a) of the New York Stock Exchange Listed Company Manual, the
Company submitted an unqualified certification of our Chief Executive Officer to the New York
Stock Exchange in 2015. The Company has also filed, as exhibits to this Annual Report on
Form 10-K, the Chief Executive Officer and Chief Financial Officer Certifications required
under the Sarbanes-Oxley Act of 2002. ITEM 9B—OTHER INFORMATION
None.
PART III ITEM 10—DIRECTORS, EXECUTIVE OFFICERS AND CORPORATE GOVERNANCE Information concerning the Company’s directors, including the Company’s separately designated standing audit committee, and on the Company’s code of business conduct and ethics required by this Item is incorporated by reference from the Company’s Proxy Statement relating to the 2016 Annual Meeting of Stockholders scheduled to be held May 3, 2016, which will be filed with the SEC in March 2016. Information concerning the Company’s executive officers required by this Item is set forth in Item 1 of this Annual Report on Form 10-K under the caption “Executive Officers of the Company.” Information concerning beneficial ownership reporting compliance required by this Item is incorporated by reference from the Company’s Proxy Statement relating to the 2016 Annual Meeting of Stockholders scheduled to be held May 3, 2016, which will be filed with the SEC in March 2016. ITEM 11—EXECUTIVE COMPENSATION Information concerning director and executive compensation required by this Item is incorporated by reference from the Company’s Proxy Statement relating to the 2016 Annual Meeting of Stockholders scheduled to be held May 3, 2016, which will be filed with the SEC in March 2016.
ITEM 12—SECURITY OWNERSHIP OF CERTAIN BENEFICIAL OWNERS AND
MANAGEMENT AND RELATED STOCKHOLDER MATTERS Information concerning the security ownership of certain beneficial owners and management and related stockholder matters required by this Item is incorporated by reference from the Company’s Proxy Statement relating to the 2016 Annual Meeting of Stockholders scheduled to be held May 3, 2016, which will be filed with the SEC in March 2016.

75
ITEM 13—CERTAIN RELATIONSHIPS AND RELATED TRANSACTIONS AND DIRECTOR INDEPENDENCE
Information concerning certain relationships and related transactions required by this Item is incorporated by reference from the Company’s Proxy Statement relating to the 2016 Annual Meeting of Stockholders scheduled to be held May 3, 2016. ITEM 14—PRINCIPAL ACCOUNTANT FEES AND SERVICES Information concerning the Company’s principal accountant fees and services and the pre-approval policies and procedures of the audit committee of the board of directors required by this Item is incorporated by reference from the Company’s Proxy Statement relating to the 2016 Annual Meeting of Stockholders scheduled to be held May 3, 2016, which will be filed with the SEC in March 2016.

76
PART IV ITEM 15—EXHIBITS AND FINANCIAL STATEMENT SCHEDULES (a) Exhibits and Financial Statement Schedules
(1) Financial Statements can be found under Item 8 of Part II of this Form 10-K
(2) Schedules can be found on Page 87 of this Form 10-K
(3) Listing of Exhibits:
Exhibit 3.1 Certificate of Incorporation of the Company, as amended (Incorporated by reference to Exhibits 4.1 and 4.2 to the Form S-3 Registration Statement previously filed by the Company File No. 33-62702).
Exhibit 3.2 Bylaws of the Company, as amended.
Exhibit 3.3 Amended and restated Article 3, Section 2 of Bylaws
(Incorporated by reference to Exhibit 3.1 to the Company’s Current Report on Form 8-K filed with the SEC on April 24, 2007).
Exhibit 3.4 Amended and restated Article 3, Section 4 and Article 4,
Section 5 of Bylaws (Incorporated by reference to Exhibit 3.1 to the Company’s Current Report on Form 8-K filed with the SEC on April 24, 2007).
Exhibit 3.5 Amended and restated Bylaws (Incorporated by reference to
Exhibit 3.1 to the Company’s Current Report on Form 8-K filed with the SEC on July 26, 2007).
Exhibit 3.6 Amended and restated Bylaws (Incorporated by reference to
Exhibit 3.1 to the Company’s Current Report on Form 8-K filed with the SEC on April 25, 2008).
Exhibit 3.7 Amendment to Article 5, Section 1 of Bylaws (Incorporated by
reference to Exhibit 3.1 to the Company’s Current Report on Form 8-K filed with the SEC on February 6, 2009).
Exhibit 10.1 Sturm, Ruger & Company, Inc. 1986 Stock Bonus Plan
(Incorporated by reference to Exhibit 10.1 to the Company’s Annual Report on Form 10-K for the year ended December 31, 1988, as amended by Form 8 filed March 27, 1990, SEC File No. 1-10435).

77
Exhibit 10.2 Amendment to Sturm, Ruger & Company, Inc. 1986 Stock Bonus Plan (Incorporated by reference to Exhibit 10.3 to the Company’s Annual Report on Form 10-K for the year ended December 31, 1991, SEC File No. 1-10435).
Exhibit 10.3 Sturm, Ruger & Company, Inc. Supplemental Executive Profit
Sharing Retirement Plan (Incorporated by reference to Exhibit 10.4 to the Company’s Annual Report on Form 10-K for the year ended December 31, 1991, SEC File No. 1-10435).
Exhibit 10.4 Agreement and Assignment of Lease dated September 30, 1987
by and between Emerson Electric Co. and Sturm, Ruger & Company, Inc. (Incorporated by reference to Exhibit 10.2 to the Company’s Annual Report on Form 10-K for the year ended December 31, 1991, SEC File No. 1-10435).
Exhibit 10.5 Sturm, Ruger & Company, Inc. Supplemental Executive
Retirement Plan (Incorporated by reference to Exhibit 10.5 to the Company’s Annual Report on Form 10-K for the year ended December 31, 1995, SEC File No. 1-10435).
Exhibit 10.6 [Intentionally omitted.]
Exhibit 10.7 Sturm, Ruger & Company, Inc. 1998 Stock Incentive Plan.
(Incorporated by reference to Exhibit 10.7 to the Company’s Annual Report on Form 10-K for the year ended December 31, 1998, SEC File No. 1-10435).
Exhibit 10.8 Sturm, Ruger & Company, Inc. 2001 Stock Option Plan for
Non-Employee Directors (Incorporated by reference to Exhibit 4 to the Form S-8 Registration Statement filed by the Company File No. 33-53234).
Exhibit 10.9 Agreement and Release, dated as of February 28, 2006, by and
between Sturm, Ruger & Company, Inc. and William B. Ruger (Incorporated by reference to Exhibit 10.1 to the Company’s Current Report on Form 8-K filed with the SEC on April 4, 2006, SEC File No. 1-10435).
Exhibit 10.10 Sale and Purchase Agreement, dated as of September 26, 2006,
by and between Sturm, Ruger & Company, Inc. and Ruger Business Holdings, L.P. (Incorporated by reference to Exhibit 10.1 to the Company’s Current Report on Form 8-K filed with the SEC on September 26, 2006, SEC File No. 1-10435).
Exhibit 10.11 Severance Agreement, dated as of September 21, 2006, by and
between Sturm, Ruger & Company, Inc. and Stephen L. Sanetti (Incorporated by reference to Exhibit 10.1 to the Company’s Current Report on Form 8-K filed with the SEC on September 27, 2006, SEC File No. 1-10435).

78
Exhibit 10.12 Severance Agreement, dated as of September 21, 2006, by and between Sturm, Ruger & Company, Inc. and Thomas A. Dineen (Incorporated by reference to Exhibit 10.2 to the Company’s Current Report on Form 8-K filed with the SEC on September 27, 2006, SEC File No. 1-10435).
Exhibit 10.13 Severance Agreement, dated as of September 21, 2006, by and
between Sturm, Ruger & Company, Inc. and Robert R. Stutler (Incorporated by reference to Exhibit 10.4 to the Company’s Current Report on Form 8-K filed with the SEC on September 27, 2006, SEC File No. 1-10435).
Exhibit 10.14 Offer Letter, dated as of September 5, 2006, by and between
Sturm, Ruger & Company, Inc. and Michael O. Fifer (Incorporated by reference to Exhibit 10.1 to the Company’s Current Report on Form 8-K filed with the SEC on September 28, 2006, SEC File No. 1-10435).
Exhibit 10.15 Severance Agreement, dated as of December 15, 2006, by and
between Sturm, Ruger & Company, Inc. and Michael O. Fifer (Incorporated by reference to Exhibit 10.1 to the Company’s Current Report on Form 8-K filed with the SEC on December 19, 2006, SEC File No. 1-10435).
Exhibit 10.16 Severance Agreement, dated as of December 15, 2006, by and
between Sturm, Ruger & Company, Inc. and Christopher John Killoy (Incorporated by reference to Exhibit 10.2 to the Company’s Current Report on Form 8-K filed with the SEC on December 19, 2006, SEC File No. 1-10435).
Exhibit 10.17 Amended Severance Agreement, dated as of December 15,
2006, by and between Sturm, Ruger & Company, Inc. and Thomas P. Sullivan (Incorporated by reference to Exhibit 10.3 to the Company’s Current Report on Form 8-K filed with the SEC on December 19, 2006, SEC File No. 1-10435).
Exhibit 10.18 Retention and Consultation Agreement, dated December 4,
2007, by and between Sturm, Ruger & Company, Inc. and Robert R. Stutler.
Exhibit 10.19 Credit Agreement, dated as of December 14, 2007, by and
between the Company and Bank of America (Incorporated by reference to Exhibit 10.18 to the Company's Current Report on Form 8-K filed with the SEC on December 20, 2007).
Exhibit 10.20 Severance Agreement, dated as of April 10, 2008, by and
between the Company and Michael O. Fifer (Incorporated by reference to Exhibit 10.1 to the Company's Current Report on Form 8-K filed with the SEC on April 11, 2008).

79
Exhibit 10.21 Severance Agreement, dated as of April 10, 2008, by and between the Company and Thomas A. Dineen (Incorporated by reference to Exhibit 10.2 to the Company's Current Report on Form 8-K filed with the SEC on April 11, 2008).
Exhibit 10.22 Severance Agreement, dated as of April 10, 2008, by and
between the Company and Mark T. Lang (Incorporated by reference to Exhibit 10.3 to the Company's Current Report on Form 8-K filed with the SEC on April 11, 2008).
Exhibit 10.23 Severance Agreement, dated as of April 10, 2008, by and
between the Company and Christopher J. Killoy (Incorporated by reference to Exhibit 10.4 to the Company's Current Report on Form 8-K filed with the SEC on April 11, 2008).
Exhibit 10.24 Severance Agreement, dated as of April 10, 2008, by and
between the Company and Steven M. Maynard (Incorporated by reference to Exhibit 10.5 to the Company's Current Report on Form 8-K filed with the SEC on April 11, 2008).
Exhibit 10.25 Severance Agreement, dated as of April 10, 2008, by and
between the Company and Thomas P. Sullivan (Incorporated by reference to Exhibit 10.6 to the Company's Current Report on Form 8-K filed with the SEC on April 11, 2008).
Exhibit 10.26 Severance Agreement, dated as of April 10, 2008, by and
between the Company and Leslie M. Gasper (Incorporated by reference to Exhibit 10.7 to the Company's Current Report on Form 8-K filed with the SEC on April 11, 2008).
Exhibit 10.27 Agreement, dated as of April 10, 2008, by and between the
Company and Stephen L. Sanetti (Incorporated by reference to Exhibit 10.8 to the Company's Current Report on Form 8-K/A filed with the SEC on April 30, 2008).
Exhibit 10.28 Severance Agreement, dated as of May 2, 2008 by and between
the Company and Kevin B. Reid, Sr. (Incorporated by reference to Exhibit 10.1 to the Company's Current Report on Form 8-K filed with the SEC on May 5, 2008).
Exhibit 10.29 First Amendment to Credit Agreement, dated as of December
15, 2008, by and between the Company and Bank of America (Incorporated by reference to Exhibit 99.1 to the Company's Current Report on Form 8-K filed with the SEC on December 22, 2008).
Exhibit 10.30 Second Amendment to Credit Agreement, dated December 11, 2009, by and between the Company and Bank of America (Incorporated by reference to Exhibit 99.1 to the Company's Current Report on Form 8-K filed with the SEC on December 21, 2009).

80
Exhibit 10.31 Fifth Amendment to Credit Agreement, dated February 14, 2013 by and between the Company and Bank of America (Incorporated by reference to Exhibit 99.1 to the Company's Current Report on Form 8-K filed with the SEC on February 21, 2013).
Exhibit 10.32 Sixth Amendment to Credit Agreement, dated June 9, 2014, by and between the Company and Bank of America (Incorporated by reference to Exhibit 99.1 to the Company's Current Report on Form 8-K filed with the SEC on June 16, 2014).
Exhibit 10.33 Seventh Amendment to Credit Agreement, dated June 5, 2015, by and between the Company and Bank of America (Incorporated by reference to Exhibit 99.1 to the Company's Current Report on Form 8-K filed with the SEC on June 12, 2015).
Exhibit 23.1 Consent of RSM US LLP
Exhibit 31.1 Certification of Chief Executive Officer Pursuant to Rule 13a-
14(a) of the Exchange Act.
Exhibit 31.2 Certification of Treasurer and Chief Financial Officer Pursuant
to Rule 13a-14(a) of the Exchange Act.
Exhibit 32.1 Certification of the Chief Executive Officer Pursuant to Rule
13a-14(b) of the Exchange Act and 18 U.S.C. Section 1350, as Adopted Pursuant to Section 906 of the Sarbanes-Oxley Act of 2002.
Exhibit 32.2 Certification of the Treasurer and Chief Financial Officer
Pursuant to Rule 13a-14(b) of the Exchange Act and 18 U.S.C. Section 1350, as Adopted Pursuant to Section 906 of the Sarbanes-Oxley Act of 2002.
Exhibit 99.1 Item 1 LEGAL PROCEEDINGS from the Quarterly Report on
Form 10-Q of the Company for the quarter ended September 30, 1999, SEC File No. 1-10435, incorporated by reference in Item 3 LEGAL PROCEEDINGS.
Exhibit 99.2 Item 1 LEGAL PROCEEDINGS from the Quarterly Report on
Form 10-Q of the Company for the quarter ended March 28, 2015, SEC File No. 1-10435, incorporated by reference in Item 3 LEGAL PROCEEDINGS.
Exhibit 99.3 Item 1 LEGAL PROCEEDINGS from the Quarterly Report on
Form 10-Q of the Company for the quarter ended September 26, 2015, SEC File No. 1-10435, incorporated by reference in Item 3 LEGAL PROCEEDINGS.

81
SIGNATURES Pursuant to the requirements of Section 13 or 15(d) of the Securities Exchange Act of 1934, the registrant has duly caused this report to be signed on its behalf by the undersigned, thereunto duly authorized. STURM, RUGER & COMPANY, INC. (Registrant) S/THOMAS A. DINEEN Thomas A. Dineen Principal Financial Officer Principal Accounting Officer, Vice President Treasurer and Chief Financial Officer February 24, 2016 Date Pursuant to the requirements of the Securities Exchange Act of 1934, this report has been signed below by the following persons on behalf of the registrant and in the capacities and on the dates indicated. S/MICHAEL O. FIFER 2/24/16 Michael O. Fifer Chief Executive Officer, Director (Principal Executive Officer)
S/JOHN A. COSENTINO, JR. 2/24/16 John A. Cosentino, Jr. Director
S/C. MICHAEL JACOBI 2/24/16 C. Michael Jacobi Director
S/RONALD C. WHITAKER 2/24/16 Ronald C. Whitaker Director
S/AMIR P. ROSENTHAL 2/24/16 Amir P. Rosenthal Director
S/PHILLIP C. WIDMAN 2/24/16 Phillip C. Widman Director
S/TERRENCE G. O’CONNOR 2/24/16 Terrence G. O’Connor Director
S/SANDRA S. FROMAN 2/24/16 Sandra S. Froman Director
S/THOMAS A. DINEEN 2/24/16 Thomas A Dineen Principal Financial Officer Principal Accounting Officer, Vice President Treasurer and Chief Financial Officer

82
EXHIBIT INDEX
Page No.
Exhibit 3.1 Certificate of Incorporation of the Company, as amended (Incorporated by reference to Exhibits 4.1 and 4.2 to the Form S-3 Registration Statement previously filed by the Company File No. 33-62702).
Exhibit 3.2 Bylaws of the Company, as amended.
Exhibit 3.3 Amended and restated Article 3, Section 2 of Bylaws
(Incorporated by reference to Exhibit 3.1 to the Company’s Current Report on Form 8-K filed with the SEC on April 24, 2007).
Exhibit 3.4 Amended and restated Article 3, Section 4 and Article 4,
Section 5 of Bylaws (Incorporated by reference to Exhibit 3.1 to the Company’s Current Report on Form 8-K filed with the SEC on April 24, 2007).
Exhibit 3.5 Amended and restated Bylaws (Incorporated by reference to
Exhibit 3.1 to the Company’s Current Report on Form 8-K filed with the SEC on July 26, 2007).
Exhibit 3.6 Amended and restated Bylaws (Incorporated by reference to
Exhibit 3.1 to the Company’s Current Report on Form 8-K filed with the SEC on April 25, 2008).
Exhibit 3.7 Amendment to Article 5, Section 1 of Bylaws (Incorporated by
reference to Exhibit 3.1 to the Company’s Current Report on Form 8-K filed with the SEC on February 6, 2009).
Exhibit 10.1 Sturm, Ruger & Company, Inc. 1986 Stock Bonus Plan
(Incorporated by reference to Exhibit 10.1 to the Company’s Annual Report on Form 10-K for the year ended December 31, 1988, as amended by Form 8 filed March 27, 1990, SEC File No. 1-10435).
Exhibit 10.2 Amendment to Sturm, Ruger & Company, Inc. 1986 Stock
Bonus Plan (Incorporated by reference to Exhibit 10.3 to the Company’s Annual Report on Form 10-K for the year ended December 31, 1991, SEC File No. 1-10435).
Exhibit 10.3 Sturm, Ruger & Company, Inc. Supplemental Executive Profit
Sharing Retirement Plan (Incorporated by reference to Exhibit 10.4 to the Company’s Annual Report on Form 10-K for the year ended December 31, 1991, SEC File No. 1-10435).
Exhibit 10.4 Agreement and Assignment of Lease dated September 30, 1987
by and between Emerson Electric Co. and Sturm, Ruger & Company, Inc. (Incorporated by reference to Exhibit 10.2 to the Company’s Annual Report on Form 10-K for the year ended December 31, 1991, SEC File No. 1-10435).

83
EXHIBIT INDEX (continued)
Exhibit 10.5 Sturm, Ruger & Company, Inc. Supplemental Executive Retirement Plan (Incorporated by reference to Exhibit 10.5 to the Company’s Annual Report on Form 10-K for the year ended December 31, 1995, SEC File No. 1-10435).
Exhibit 10.6 [Intentionally omitted.]
Exhibit 10.7 Sturm, Ruger & Company, Inc. 1998 Stock Incentive Plan.
(Incorporated by reference to Exhibit 10.7 to the Company’s Annual Report on Form 10-K for the year ended December 31, 1998, SEC File No. 1-10435).
Exhibit 10.8 Sturm, Ruger & Company, Inc. 2001 Stock Option Plan for Non-
Employee Directors (Incorporated by reference to Exhibit 4 to the Form S-8 Registration Statement filed by the Company File No. 33-53234).
Exhibit 10.9 Agreement and Release, dated as of February 28, 2006, by and
between Sturm, Ruger & Company, Inc. and William B. Ruger (Incorporated by reference to Exhibit 10.1 to the Company’s Current Report on Form 8-K filed with the SEC on April 4, 2006, SEC File No. 1-10435).
Exhibit 10.10 Sale and Purchase Agreement, dated as of September 26, 2006, by and
between Sturm, Ruger & Company, Inc. and Ruger Business Holdings, L.P. (Incorporated by reference to Exhibit 10.1 to the Company’s Current Report on Form 8-K filed with the SEC on September 26, 2006, SEC File No. 1-10435).
Exhibit 10.11 Severance Agreement, dated as of September 21, 2006, by and between
Sturm, Ruger & Company, Inc. and Stephen L. Sanetti (Incorporated by reference to Exhibit 10.1 to the Company’s Current Report on Form 8-K filed with the SEC on September 27, 2006, SEC File No. 1-10435).
Exhibit 10.12 Severance Agreement, dated as of September 21, 2006, by and between
Sturm, Ruger & Company, Inc. and Thomas A. Dineen (Incorporated by reference to Exhibit 10.2 to the Company’s Current Report on Form 8-K filed with the SEC on September 27, 2006, SEC File No. 1-10435).
Exhibit 10.13 Severance Agreement, dated as of September 21, 2006, by and between
Sturm, Ruger & Company, Inc. and Robert R. Stutler (Incorporated by reference to Exhibit 10.4 to the Company’s Current Report on Form 8-K filed with the SEC on September 27, 2006, SEC File No. 1-10435).
Exhibit 10.14 Offer Letter, dated as of September 5, 2006, by and between Sturm,
Ruger & Company, Inc. and Michael O. Fifer (Incorporated by reference to Exhibit 10.1 to the Company’s Current Report on Form 8-K filed with the SEC on September 28, 2006, SEC File No. 1-10435).

84
EXHIBIT INDEX (continued)
Exhibit 10.15 Severance Agreement, dated as of December 15, 2006, by and
between Sturm, Ruger & Company, Inc. and Michael O. Fifer (Incorporated by reference to Exhibit 10.1 to the Company’s Current Report on Form 8-K filed with the SEC on December 19, 2006, SEC File No. 1-10435).
Exhibit 10.16 Severance Agreement, dated as of December 15, 2006, by and
between Sturm, Ruger & Company, Inc. and Christopher John Killoy (Incorporated by reference to Exhibit 10.2 to the Company’s Current Report on Form 8-K filed with the SEC on December 19, 2006, SEC File No. 1-10435).
Exhibit 10.17 Amended Severance Agreement, dated as of December 15,
2006, by and between Sturm, Ruger & Company, Inc. and Thomas P. Sullivan (Incorporated by reference to Exhibit 10.3 to the Company’s Current Report on Form 8-K filed with the SEC on December 19, 2006, SEC File No. 1-10435).
Exhibit 10.18 Retention and Consultation Agreement, dated December 4,
2007, by and between Sturm, Ruger & Company, Inc. and Robert R. Stutler.
Exhibit 10.19 Credit Agreement, dated as of December 14, 2007, by and
between the Company and Bank of America (Incorporated by reference to Exhibit 10.18 to the Company's Current Report on Form 8-K filed with the SEC on December 20, 2007).
Exhibit 10.20 Severance Agreement, dated as of April 10, 2008, by and
between the Company and Michael O. Fifer (Incorporated by reference to Exhibit 10.1 to the Company's Current Report on Form 8-K filed with the SEC on April 11, 2008).
Exhibit 10.21 Severance Agreement, dated as of April 10, 2008, by and
between the Company and Thomas A. Dineen (Incorporated by reference to Exhibit 10.2 to the Company's Current Report on Form 8-K filed with the SEC on April 11, 2008).
Exhibit 10.22 Severance Agreement, dated as of April 10, 2008, by and
between the Company and Mark T. Lang (Incorporated by reference to Exhibit 10.3 to the Company's Current Report on Form 8-K filed with the SEC on April 11, 2008).
Exhibit 10.23 Severance Agreement, dated as of April 10, 2008, by and
between the Company and Christopher J. Killoy (Incorporated by reference to Exhibit 10.4 to the Company's Current Report on Form 8-K filed with the SEC on April 11, 2008).
Exhibit 10.24 Severance Agreement, dated as of April 10, 2008, by and
between the Company and Steven M. Maynard (Incorporated by reference to Exhibit 10.5 to the Company's Current Report on Form 8-K filed with the SEC on April 11, 2008).

85
EXHIBIT INDEX (continued)
Exhibit 10.25 Severance Agreement, dated as of April 10, 2008, by and
between the Company and Thomas P. Sullivan (Incorporated by reference to Exhibit 10.6 to the Company's Current Report on Form 8-K filed with the SEC on April 11, 2008).
Exhibit 10.26 Severance Agreement, dated as of April 10, 2008, by and
between the Company and Leslie M. Gasper (Incorporated by reference to Exhibit 10.7 to the Company's Current Report on Form 8-K filed with the SEC on April 11, 2008).
Exhibit 10.27 Agreement, dated as of April 10, 2008, by and between the
Company and Stephen L. Sanetti (Incorporated by reference to Exhibit 10.8 to the Company's Current Report on Form 8-K/A filed with the SEC on April 30, 2008).
Exhibit 10.28 Severance Agreement, dated as of May 2, 2008 by and between
the Company and Kevin B. Reid, Sr. (Incorporated by reference to Exhibit 10.1 to the Company's Current Report on Form 8-K filed with the SEC on May 5, 2008).
Exhibit 10.29 First Amendment to Credit Agreement, dated as of December
15, 2008, by and between the Company and Bank of America (Incorporated by reference to Exhibit 99.1 to the Company's Current Report on Form 8-K filed with the SEC on December 22, 2008).
Exhibit 10.30 Second Amendment to Credit Agreement, dated December 11, 2009, by and between the Company and Bank of America (Incorporated by reference to Exhibit 99.1 to the Company's Current Report on Form 8-K filed with the SEC on December 21, 2009).
Exhibit 10.31 Fifth Amendment to Credit Agreement, dated February 14, 2013 by and between the Company and Bank of America (Incorporated by reference to Exhibit 99.1 to the Company's Current Report on Form 8-K filed with the SEC on February 21, 2013).
Exhibit 10.32 Sixth Amendment to Credit Agreement, dated June 9, 2014, by and between the Company and Bank of America (Incorporated by reference to Exhibit 99.1 to the Company's Current Report on Form 8-K filed with the SEC on June 16, 2014).
Exhibit 10.33 Seventh Amendment to Credit Agreement, dated June 5, 2015, by and between the Company and Bank of America (Incorporated by reference to Exhibit 99.1 to the Company's Current Report on Form 8-K filed with the SEC on June 12, 2015).
Exhibit 23.1 Consent of RSM US LLP 89

86
EXHIBIT INDEX (continued)
Exhibit 31.1 Certification of Chief Executive Officer Pursuant to Rule 13a-
14(a) of the Exchange Act.
90
Exhibit 31.2 Certification of Treasurer and Chief Financial Officer Pursuant to Rule 13a-14(a) of the Exchange Act.
92
Exhibit 32.1 Certification of the Chief Executive Officer Pursuant to Rule
13a-14(b) of the Exchange Act and 18 U.S.C. Section 1350, as Adopted Pursuant to Section 906 of the Sarbanes-Oxley Act of 2002.
94
Exhibit 32.2 Certification of the Treasurer and Chief Financial Officer Pursuant to Rule 13a-14(b) of the Exchange Act and 18 U.S.C. Section 1350, as Adopted Pursuant to Section 906 of the Sarbanes-Oxley Act of 2002.
95
Exhibit 99.1 Item 1 LEGAL PROCEEDINGS from the Quarterly Report on Form 10-Q of the Company for the quarter ended September 30, 1999, SEC File No. 1-10435, incorporated by reference in Item 3 LEGAL PROCEEDINGS.
Exhibit 99.2 Item 1 LEGAL PROCEEDINGS from the Quarterly Report on
Form 10-Q of the Company for the quarter ended March 28, 2015, SEC File No. 1-10435, incorporated by reference in Item 3 LEGAL PROCEEDINGS.
Exhibit 99.3 Item 1 LEGAL PROCEEDINGS from the Quarterly Report on Form 10-Q of the Company for the quarter ended September 26, 2015, SEC File No. 1-10435, incorporated by reference in Item 3 LEGAL PROCEEDINGS.

87
YEAR ENDED DECEMBER 31, 2015
STURM, RUGER & COMPANY, INC.
ITEMS 15(a) FINANCIAL STATEMENT SCHEDULE

88
Sturm, Ruger & Company, Inc.
Item 15(a)--Financial Statement Schedule
Schedule II—Valuation and Qualifying Accounts
(In Thousands) COL. A COL. B COL. C COL. D COL. E ADDITIONS Description
Balance at Beginning of Period
(1)
Charged (Credited) to
Costs and Expenses
(2)
Charged to Other
Accounts –Describe
Deductions
Balance at End
of Period
Deductions from asset accounts:
Allowance for doubtful accounts: Year ended December 31, 2015 $ 400 $ 120 $ 120 (a) $ 400 Year ended December 31, 2014 $ 300 $ 100 $ 400 Year ended December 31, 2013 $ 300 $ 300
Allowance for discounts:
Year ended December 31, 2015 $1,003 $11,797 $11,357 (b) $1,443 Year ended December 31, 2014 $1,344 $11,485 $11,826 (b) $1,003 Year ended December 31, 2013 $ 825 $14,515 $13,996 (b) $1,344
Excess and obsolete inventory
reserve:
Year ended December 31, 2015 $3,750 $(1,468) $ 164 (c) $2,118 Year ended December 31, 2014 $2,422 $ 1,328 $3,750 Year ended December 31, 2013 $1,729 $ 693 $2,422
(a) Accounts written off (b) Discounts taken (c) Inventory written off

89
Exhibit 23.1
Consent of Independent Registered Public Accounting Firm
We consent to incorporation by reference in the Registration Statements (Nos. 333-84677 and
333-53234) on Form S-8 of Sturm, Ruger & Company, Inc. of our reports dated February 24,
2016 relating to our audits of the consolidated financial statements, the financial statement
schedule, and internal control over financial reporting, which appear in this Annual Report on
Form 10-K of Sturm, Ruger & Company, Inc. for the year ended December 31, 2015.
/s/ RSM US LLP
Stamford, Connecticut February 24, 2016

90
EXHIBIT 31.1
CERTIFICATION
I, Michael O. Fifer, certify that:
1. I have reviewed this Annual Report on Form 10-K (the “Report”) of Sturm, Ruger &
Company, Inc. (the “Registrant”);
2. Based on my knowledge, this Report does not contain any untrue statement of a
material fact or omit to state a material fact necessary to make the statements made, in
light of the circumstances under which such statements were made, not misleading
with respect to the period covered by this Report;
3. Based on my knowledge, the financial statements, and other financial information
included in this Report, fairly present in all material respects, the financial condition,
results of operations and cash flows of the Registrant as of, and for, the periods
presented in this Report;
4. The Registrant’s other certifying officer and I are responsible for establishing and
maintaining disclosure controls and procedures (as defined in Exchange Act Rules
13a-15(e) and 15d-15(e)) and internal control over financial reporting (as defined in
Exchange Act Rules 13a-15(f) and 15d-15(f)) for the Registrant and have:
a) Designed such disclosure controls and procedures, or caused such disclosure
controls and procedures to be designed under our supervision, to ensure that
material information relating to the Registrant, including its consolidated
subsidiaries, is made known to us by others within those entities, particularly
during the period in which this Report is being prepared;
b) Designed such internal control over financial reporting, or caused such internal
control over financial reporting to be designed under our supervision, to provide
reasonable assurance regarding the reliability of financial reporting and the
preparation of financial statements for external purposes in accordance with
generally accepted accounting principles;
c) Evaluated the effectiveness of the Registrant’s disclosure controls and procedures
and presented in this Report our conclusions about the effectiveness of the
disclosure controls and procedures, as of the end of the period covered by this
Report based on such evaluation; and
d) Disclosed in this Report any change in the Registrant’s internal control over
financial reporting that occurred during the Registrant’s most recent fiscal quarter
(the Registrant’s fourth fiscal quarter in the case of an annual report) that has
materially affected, or is reasonably likely to materially affect, the Registrant’s
internal control over financial reporting.

91
5. The Registrant’s other certifying officer and I have disclosed, based on our most
recent evaluation of internal control over financial reporting, to the Registrant’s
auditors and the audit committee of Registrant’s board of directors (or persons
performing the equivalent functions):
a) All significant deficiencies and material weaknesses in the design or operation of
internal control over financial reporting which are reasonably likely to adversely
affect the Registrant’s ability to record, process, summarize and report financial
information; and
b) Any fraud, whether or not material, that involves management or other employees
who have a significant role in the Registrant’s internal control over financial
reporting.
Date: February 24, 2016
S/MICHAEL O. FIFER
Michael O. Fifer
Chief Executive Officer

92
EXHIBIT 31.2
CERTIFICATION
I, Thomas A. Dineen, certify that:
1. I have reviewed this Annual Report on Form 10-K (the “Report”) of Sturm, Ruger &
Company, Inc. (the “Registrant”);
2. Based on my knowledge, this Report does not contain any untrue statement of a
material fact or omit to state a material fact necessary to make the statements made, in
light of the circumstances under which such statements were made, not misleading
with respect to the period covered by this Report;
3. Based on my knowledge, the financial statements, and other financial information
included in this Report, fairly present in all material respects, the financial condition,
results of operations and cash flows of the Registrant as of, and for, the periods
presented in this Report;
4. The Registrant’s other certifying officer and I are responsible for establishing and
maintaining disclosure controls and procedures (as defined in Exchange Act Rules
13a-15(e) and 15d-15(e)) and internal control over financial reporting (as defined in
Exchange Act Rules 13a-15(f) and 15d-15(f)) for the Registrant and have:
a) Designed such disclosure controls and procedures, or caused such disclosure
controls and procedures to be designed under our supervision, to ensure that
material information relating to the Registrant, including its consolidated
subsidiaries, is made known to us by others within those entities, particularly
during the period in which this Report is being prepared;
b) Designed such internal control over financial reporting, or caused such internal
control over financial reporting to be designed under our supervision, to provide
reasonable assurance regarding the reliability of financial reporting and the
preparation of financial statements for external purposes in accordance with
generally accepted accounting principles;
c) Evaluated the effectiveness of the Registrant’s disclosure controls and procedures
and presented in this Report our conclusions about the effectiveness of the
disclosure controls and procedures, as of the end of the period covered by this
Report based on such evaluation; and
d) Disclosed in this Report any change in the Registrant’s internal control over
financial reporting that occurred during the Registrant’s most recent fiscal quarter
(the Registrant’s fourth fiscal quarter in the case of an annual report) that has
materially affected, or is reasonably likely to materially affect, the Registrant’s
internal control over financial reporting.
93
5. The Registrant’s other certifying officer and I have disclosed, based on our most
recent evaluation of internal control over financial reporting, to the Registrant’s
auditors and the audit committee of Registrant’s board of directors (or persons
performing the equivalent functions):
a) All significant deficiencies and material weaknesses in the design or operation of
internal control over financial reporting which are reasonably likely to adversely
affect the Registrant’s ability to record, process, summarize and report financial
information; and
b) Any fraud, whether or not material, that involves management or other employees
who have a significant role in the Registrant’s internal control over financial
reporting.
Date: February 24, 2016
S/THOMAS A. DINEEN
Thomas A. Dineen
Vice President, Treasurer and
Chief Financial Officer

94
EXHIBIT 32.1
Certification Pursuant to 18 U.S.C. Section 1350, As Adopted Pursuant to
Section 906 of the Sarbanes-Oxley Act of 2002
In connection with the Annual Report on Form 10-K of Sturm, Ruger & Company, Inc. (the
“Company”) for the period ended December 31, 2015, as filed with the Securities and Exchange
Commission on the date hereof (the “Report”), I, Michael O. Fifer, hereby certify, pursuant to 18
U.S.C. Section 1350, as adopted pursuant to Section 906 of the Sarbanes-Oxley Act of 2002,
that, to the best of my knowledge:
(1) The Report fully complies with the requirements of Section 13(a) or 15(d) of the Securities Exchange Act of 1934; and
(2) The information contained in the Report fairly presents, in all material respect, the
financial condition and results of operations of the Company. Date: February 24, 2016 S/MICHAEL O. FIFER Michael O. Fifer Chief Executive Officer A signed original of this statement has been provided to the Company and will be retained by the
Company and furnished to the Securities and Exchange Commission or its staff upon request.
95
EXHIBIT 32.2
Certification Pursuant to 18 U.S.C. Section 1350, As Adopted Pursuant to
Section 906 of the Sarbanes-Oxley Act of 2002
In connection with the Annual Report on Form 10-K of Sturm, Ruger & Company, Inc. (the
“Company”) for the period ended December 31, 2015, as filed with the Securities and Exchange
Commission on the date hereof (the “Report”), I, Thomas A. Dineen, hereby certify, pursuant to
18 U.S.C. Section 1350, as adopted pursuant to Section 906 of the Sarbanes-Oxley Act of 2002,
that, to the best of my knowledge:
(1) The Report fully complies with the requirements of Section 13(a) or 15(d) of the Securities Exchange Act of 1934; and
(2) The information contained in the Report fairly presents, in all material respect, the
financial condition and results of operations of the Company. Date: February 24, 2016 S/THOMAS A. DINEEN Thomas A. Dineen Vice President, Treasurer and Chief Financial Officer
A signed original of this statement has been provided to the Company and will be retained by the
Company and furnished to the Securities and Exchange Commission or its staff upon request.