Embed Size (px)
Citation preview

Stunting, underweight and wasting among IntegratedChild Development Services (ICDS) schemechildren aged 3–5 years of Chapra, Nadia District,West Bengal, India
Kaushik Bose, Sadaruddin Biswas, Samiran Bisai, Sanjib Ganguli, Argina Khatun,Ashish Mukhopadhyay and Mithu BhadraDepartment of Anthropology, Vidyasagar University, West Bengal, India
Abstract
This study investigated age and sex variations in height and weight, levels of stunting,underweightand wasting among 533 (254 boys; 279 girls) 3- to 5-year-old rural children of Bengalee ethnicityat 11 Integrated Child Development Services centres of Nadia District, West Bengal, India.Height-for-age, weight-for-age and weight-for-height < -2 z-scores were used to evaluate stunt-ing, underweight and wasting, respectively, following the National Center for Health Statistics(NCHS) Guidelines.Results revealed that boys were significantly heavier than girls at age 3 years.Significant age differences existed in mean height and weight in both sexes. Mean z-scores ofheight-for-age, weight-for-age and weight-for-height were lower than those of NCHS for bothsexes at all ages. The overall (age and sex combined) rates of stunting, underweight and wastingwere 23.9%,31.0% and 9.4%,respectively.The rate of underweight and wasting was higher amonggirls (underweight = 35.1%, wasting = 12.2%) compared with boys (underweight = 26.5%, wast-ing = 6.3%). In general, the frequency of stunting increased with increasing age in both sexes.Based on the World Health Organization classification of severity of malnutrition, the overallprevalence of underweight was very high (�30%).The prevalence rates of stunting (20–29%) andwasting (5–9%) were medium.In conclusion,the nutritional status of the subjects is unsatisfactory.There is scope for improvement in the form of enhanced supplementary nutrition.
Keywords: India, Bengalee, preschool children, stunting, underweight, wasting.
Introduction
Child growth is widely used to assess adequate nutri-tion, health and development of individual children,
and to estimate overall nutritional status and health ofpopulations. Compared with other health assessmenttools, measuring child growth is a relatively inexpen-sive,easy-to-perform and non-invasive process (WHO1995; Lee & Nieman 2003; Blössner et al. 2006).During the preschool age period,children have specialnutritional needs because of their extensive growthand development (WHO 1995; Lee & Nieman 2003;Bishnoi et al. 2004). The legacy of malnutrition,
Correspondence: Dr Kaushik Bose, Reader and Head of
Department, Department of Anthropology, Vidyasagar Univer-
sity, Midnapore – 721 102, West Bengal, India. E-mail: banda@
vsnl.net
Original Article
216 © 2007 The Authors. Journal compilation © 2007 Blackwell Publishing Ltd. Maternal and Child Nutrition (2007), 3, pp. 216–221
especially among preschool children, is a huge obstacleto overall national development (Bishnoi et al. 2004).Undernutrition among preschool children is an impor-tant health problem in rural India (Saxena et al. 1997;Yadav & Singh 1999; Mahapatra et al. 2000;Brahmbhatt et al. 2001; Rajaram et al. 2003; Kumar &Bhawani 2005; Ray 2005) including West Bengal(Mustaphi & Dobe 2005).However, there exists scantyinformation of the prevalence of undernutritionamong preschool children in India (George et al. 2000;Bishnoi et al. 2004; Kumari 2005) and West Bengal(Shaikh et al. 2003; Mustaphi & Dobe 2005).
Three internationally recommended indicatorsmost commonly used are child stunting (low height-for-age), underweight (low weight-for-age) andwasting (low weight-for-height) (WHO 1995; Lee &Nieman 2003). While stunting reflects a failure toreach linear growth potential due to suboptimalhealth and/or nutritional conditions, underweightreveals low body mass relative to chronological age,which is influenced by both, a child’s height andweight. Underweight thus cannot distinguish betweena child who is small in weight relative to his/her heightand a child who is low in height relative to his/her age,but who may be normal in weight-for-height. On theother hand, wasting is an indicator of acute undernu-trition, the result of more recent food deprivation orillness (WHO 1995).
The Integrated Child Development Services(ICDS) scheme is the largest national programme forthe promotion of mother and child health and theirdevelopment in the world (Kapil & Pradhan 1999).The beneficiaries include children below 6 years, preg-nant and lactating mothers, and other women in theage group of 15–44 years (Kapil & Pradhan 1999).Thepackage of services provided by the ICDS schemeincludes supplementary nutrition, immunization,health check-up, referral services, nutrition and healtheducation, and preschool education (Kapil & Pradhan1999). The scheme services are rendered essentiallythrough the ‘Anganwadi’ worker at a village centrecalled ‘Anganwadi’. There is therefore an urgent needto evaluate the nutritional status of children at ICDScentres to determine whether they have low rates ofstunting, underweight and wasting. Low rates of stunt-ing, underweight and wasting would imply that the
supplementary nutrition being administered to thechildren is effective in reducing the rates of undernu-trition. However, very few investigations have donethis (Bhasin et al. 2001; Mustaphi & Dobe 2005).
In view of this, the present investigation was under-taken to determine age and sex variations in heightand weight, as well as to evaluate the levels of stunt-ing, underweight and wasting, among 3- to 5-year-oldICDS children of Bengalee ethnicity from ChapraBlock, Nadia District, West Bengal, India.
Materials and methods
Study area and subjects
The present study was undertaken at 11 ICDS centresin Chapra Block, Nadia District, West Bengal. Thestudy area is situated at the India–Bangladesh inter-national border, 140 km from Kolkata, the provincialcapital of West Bengal. The area is remote and mostlyinhabited by Muslims. All preschool children(3–5 years old) living in Chapra Block are enrolled atthese centres. The ICDS authorities are allocated 80paise (approximately 2 US cents) per head (child) perday by the Government of India to provide supple-mentary nutrition to the children. This financial assis-tance ensures that each child is given a porridgeconsisting of 41 g of rice and 17 g of lentils per day.
Formal ethical approval was obtained fromVidyasagar University and ICDS authorities prior tothe commencement of the study. Subjects were ran-domly selected from 11 ICDS centres of HatkholaGram Panchyat of Chapra Block, Nadia District,West Bengal. A total of 545 children (male = 259;female = 286) aged 3–5 years were measured, outof whom 12 individuals (5 boys and 7 girls) wereexcluded because of missing data. The final samplesize was 533 (254 boys and 279 girls). Age and ethnic-ity of the subjects were verified from official records.
Anthropometric measurements and evaluationof nutritional status
Height and weight measurements were taken on eachsubject following the standard techniques (Lohmanet al. 1988). Technical errors of measurements (TEM)
Undernutrition among rural Bengalee preschool children 217
© 2007 The Authors. Journal compilation © 2007 Blackwell Publishing Ltd. Maternal and Child Nutrition (2007), 3, pp. 216–221
were found to be within reference values (Ulijaszek &Kerr 1999). Thus, TEM was not incorporated instatistical analyses.
Three commonly used undernutrition indicators –stunting, underweight and wasting – were used toevaluate the nutritional status of the subjects. TheUnited States National Center for Health Statistics(NCHS) (Hamill et al. 1979; WHO 1983) age- andsex-specific -2 z-scores were followed to define stunt-ing, underweight and wasting. The following schemewas utilized:
Stunting: <-2 HAZ (z-score for height-for-age);Underweight: <-2 WAZ (z-score for weight-for-
age);Wasting: <-2 WHZ (z-score for weight-for-
height).
where HAZ, WAZ and WHZ refer to height-for-age,weight-for-age and weight-for-height age- and sex-specific z-scores, respectively, of NCHS.
We followed the World Health Organization(WHO 1995) classification for assessing severity ofmalnutrition by percentage prevalence ranges ofthese three indicators among children. The classifica-tion is shown in Table 1.
Statistical analyses
The distributions of height and weight were not sig-nificantly skewed, therefore not necessitating theirnormalization. Between sexes, differences in means ofheight and weight were tested by Student’s t-test.One-way (Scheffe’s Procedure) analyses were under-taken to test for age differences in mean height andweight in each sex.
Results
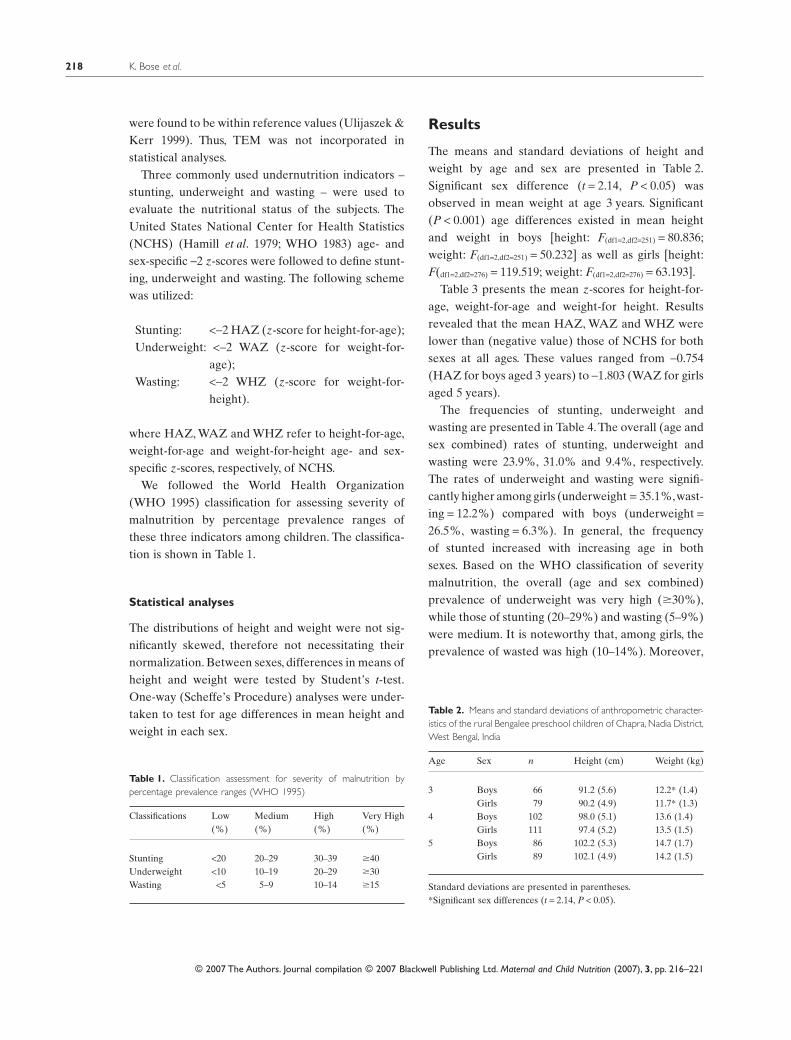
The means and standard deviations of height andweight by age and sex are presented in Table 2.Significant sex difference (t = 2.14, P < 0.05) wasobserved in mean weight at age 3 years. Significant(P < 0.001) age differences existed in mean heightand weight in boys [height: F(df1=2,df2=251) = 80.836;weight: F(df1=2,df2=251) = 50.232] as well as girls [height:F(df1=2,df2=276) = 119.519; weight: F(df1=2,df2=276) = 63.193].
Table 3 presents the mean z-scores for height-for-age, weight-for-age and weight-for height. Resultsrevealed that the mean HAZ, WAZ and WHZ werelower than (negative value) those of NCHS for bothsexes at all ages. These values ranged from -0.754(HAZ for boys aged 3 years) to -1.803 (WAZ for girlsaged 5 years).
The frequencies of stunting, underweight andwasting are presented in Table 4.The overall (age andsex combined) rates of stunting, underweight andwasting were 23.9%, 31.0% and 9.4%, respectively.The rates of underweight and wasting were signifi-cantly higher among girls (underweight = 35.1%,wast-ing = 12.2%) compared with boys (underweight =26.5%, wasting = 6.3%). In general, the frequencyof stunted increased with increasing age in bothsexes. Based on the WHO classification of severitymalnutrition, the overall (age and sex combined)prevalence of underweight was very high (�30%),while those of stunting (20–29%) and wasting (5–9%)were medium. It is noteworthy that, among girls, theprevalence of wasted was high (10–14%). Moreover,
Table 1. Classification assessment for severity of malnutrition bypercentage prevalence ranges (WHO 1995)
Classifications Low(%)
Medium(%)
High(%)
Very High(%)
Stunting <20 20–29 30–39 �40Underweight <10 10–19 20–29 �30Wasting <5 5–9 10–14 �15
Table 2. Means and standard deviations of anthropometric character-istics of the rural Bengalee preschool children of Chapra, Nadia District,West Bengal, India
Age Sex n Height (cm) Weight (kg)
3 Boys 66 91.2 (5.6) 12.2* (1.4)Girls 79 90.2 (4.9) 11.7* (1.3)
4 Boys 102 98.0 (5.1) 13.6 (1.4)Girls 111 97.4 (5.2) 13.5 (1.5)
5 Boys 86 102.2 (5.3) 14.7 (1.7)Girls 89 102.1 (4.9) 14.2 (1.5)
Standard deviations are presented in parentheses.*Significant sex differences (t = 2.14, P < 0.05).
K. Bose et al.218
© 2007 The Authors. Journal compilation © 2007 Blackwell Publishing Ltd. Maternal and Child Nutrition (2007), 3, pp. 216–221
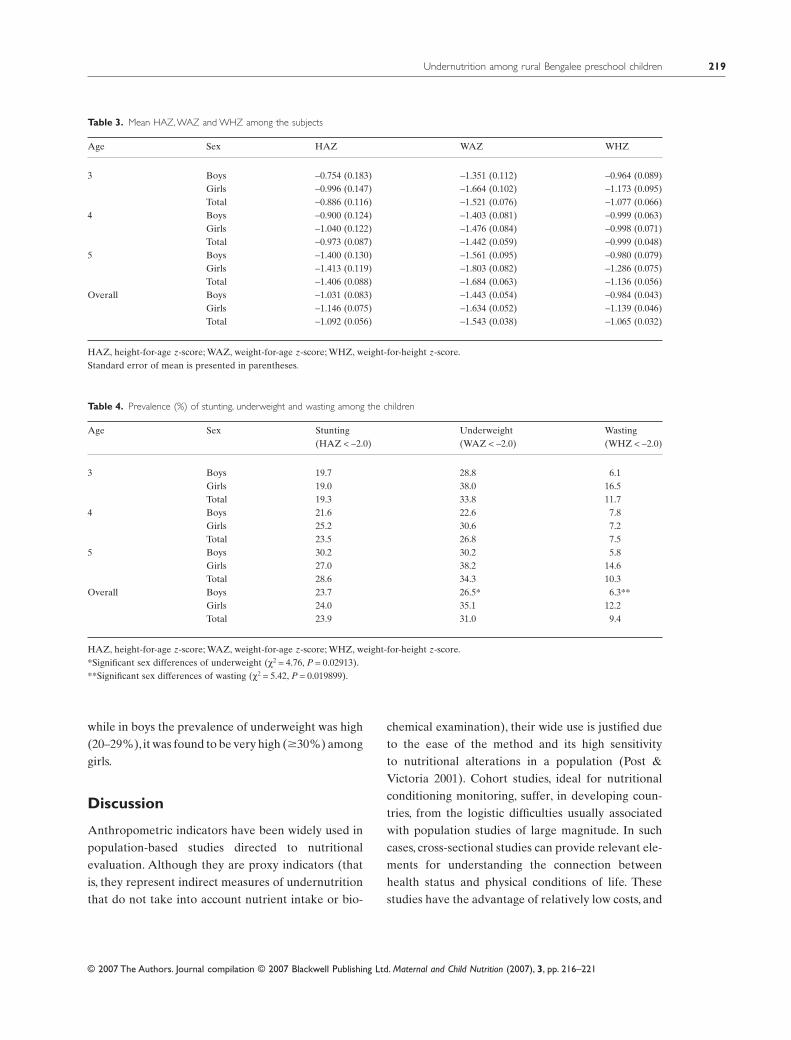
while in boys the prevalence of underweight was high(20–29%), it was found to be very high (�30%) amonggirls.
Discussion
Anthropometric indicators have been widely used inpopulation-based studies directed to nutritionalevaluation. Although they are proxy indicators (thatis, they represent indirect measures of undernutritionthat do not take into account nutrient intake or bio-
chemical examination), their wide use is justified dueto the ease of the method and its high sensitivityto nutritional alterations in a population (Post &Victoria 2001). Cohort studies, ideal for nutritionalconditioning monitoring, suffer, in developing coun-tries, from the logistic difficulties usually associatedwith population studies of large magnitude. In suchcases, cross-sectional studies can provide relevant ele-ments for understanding the connection betweenhealth status and physical conditions of life. Thesestudies have the advantage of relatively low costs, and
Table 3. Mean HAZ, WAZ and WHZ among the subjects
Age Sex HAZ WAZ WHZ
3 Boys -0.754 (0.183) -1.351 (0.112) -0.964 (0.089)Girls -0.996 (0.147) -1.664 (0.102) -1.173 (0.095)Total -0.886 (0.116) -1.521 (0.076) -1.077 (0.066)
4 Boys -0.900 (0.124) -1.403 (0.081) -0.999 (0.063)Girls -1.040 (0.122) -1.476 (0.084) -0.998 (0.071)Total -0.973 (0.087) -1.442 (0.059) -0.999 (0.048)
5 Boys -1.400 (0.130) -1.561 (0.095) -0.980 (0.079)Girls -1.413 (0.119) -1.803 (0.082) -1.286 (0.075)Total -1.406 (0.088) -1.684 (0.063) -1.136 (0.056)
Overall Boys -1.031 (0.083) -1.443 (0.054) -0.984 (0.043)Girls -1.146 (0.075) -1.634 (0.052) -1.139 (0.046)Total -1.092 (0.056) -1.543 (0.038) -1.065 (0.032)
HAZ, height-for-age z-score; WAZ, weight-for-age z-score; WHZ, weight-for-height z-score.Standard error of mean is presented in parentheses.
Table 4. Prevalence (%) of stunting, underweight and wasting among the children
Age Sex Stunting(HAZ < -2.0)
Underweight(WAZ < -2.0)
Wasting(WHZ < -2.0)
3 Boys 19.7 28.8 6.1Girls 19.0 38.0 16.5Total 19.3 33.8 11.7
4 Boys 21.6 22.6 7.8Girls 25.2 30.6 7.2Total 23.5 26.8 7.5
5 Boys 30.2 30.2 5.8Girls 27.0 38.2 14.6Total 28.6 34.3 10.3
Overall Boys 23.7 26.5* 6.3**Girls 24.0 35.1 12.2Total 23.9 31.0 9.4
HAZ, height-for-age z-score; WAZ, weight-for-age z-score; WHZ, weight-for-height z-score.*Significant sex differences of underweight (c2 = 4.76, P = 0.02913).**Significant sex differences of wasting (c2 = 5.42, P = 0.019899).
Undernutrition among rural Bengalee preschool children 219
© 2007 The Authors. Journal compilation © 2007 Blackwell Publishing Ltd. Maternal and Child Nutrition (2007), 3, pp. 216–221

they can also provide fundamental information forthe implementation of health surveillance systemsand the definition of long-term health interventionstrategies (Waterlow et al. 1977; Satyanarayan et al.1989; Martorel et al. 1996).
Undernutrition continues to be a cause of ill-healthand premature mortality among children in develop-ing countries like India (Nandy et al. 2005). The mostcommonly used indicators of undernutrition amongchildren are stunting (low height-for-age), wasting(low weight-for-height) and underweight (lowweight-for-age). Stunting is an indicator of chronicundernutrition, the result of prolonged food depriva-tion and/or disease or illness; wasting is an indicatorof acute undernutrition, the result of more recentfood deprivation or illness; underweight is used as acomposite indicator to reflect both acute and chronicundernutrition, although it cannot distinguishbetween them (WHO 1995).
These indices are compared against an interna-tional reference population developed from anthro-pometric data collected in the United States by theNCHS (Hamill et al. 1979; WHO 1983). Childrenwhose measurements fall below -2 z-scores of thereference population median are considered under-nourished (i.e. to have stunting, wasting or to beunderweight). These indices reflect distinct biologicalprocesses, and their use is necessary for determiningappropriate interventions (WHO 1995).
The results of the present study clearly indicatedthat, based on the WHO classification of severity mal-nutrition, the overall (age and sex combined) preva-lence of underweight was very high (�30%) whilethose of stunting (20–29%) and wasting (5–9%) weremedium. It is noteworthy that, among girls, the preva-lence of wasted was high (10–14%). Moreover, whilein boys the prevalence of underweight was high (20–29%), it was found to be very high (�30%) amonggirls. The rates of underweight were lower than thatreported from India (47%) by UNICEF (2006).Results on stunting indicated that, among thesechildren, there existed a medium level of chronicundernutrition due to prolonged food deprivation.Regarding wasted, it was also observed that thereexisted a medium rate of acute undernutrition thatwas indicative of more recent food deprivation.
Studies on underweight, which is used as a compositeindicator to reflect both acute and chronic undernu-trition, demonstrated that the level was very high.These findings suggested widespread adverse nutri-tional experience of the subjects. However, it must benoted here that the rates of underweight, wasting andstunting of the children of the present study weremuch lower than those reported among other chil-dren from various parts of India (Dolla et al. 2005).
It has been suggested that, as undernutrition is afunction of both food deprivation and disease, whichare in turn the consequences of poverty, anthropo-metric indices can serve only as proxies for evaluatingthe prevalence of undernutrition among children(Nandy et al. 2005). Efforts to reduce undernutrition,morbidity and mortality depend on reducing povertyand raising people’s living standards by improving thequality of homes and by increasing access to cleandrinking water and adequate sanitation. Such inter-ventions have positive impacts on health, and imple-menting these also goes some way towards fulfillingpeople’s basic human rights (Nandy et al. 2005).However, in the context of the present study, it shouldbe noted that ICDS offers only supplementary nutri-tion to young children and controlling of other relatedfactors of undernutrition is not within its ambit. Asthe nutritional status of the subjects of the presentstudy is not satisfactory, it seems that there is scopefor much improvement in the form of enhancedsupplementary nutrition than what is currently beingoffered by the ICDS scheme in Chapra Block, NadiaDistrict of West Bengal. Therefore, it is imperativethat the ICDS authorities urgently consider theenhancement of the supplementary nutrition beingcurrently given. It seems that the current food supple-mentation, consisting of 41 g of rice and 17 g of lentils,per child is insufficient and these amounts shouldbe increased. This requires additional governmentfunding.
Acknowledgements
All subjects who participated in the study are grate-fully acknowledged. Special thanks are due to theICDS authorities of Hatkhola Gram Panchyat of
K. Bose et al.220
© 2007 The Authors. Journal compilation © 2007 Blackwell Publishing Ltd. Maternal and Child Nutrition (2007), 3, pp. 216–221

Chapra Block of Nadia District. The help and assis-tance of Z. Mondal is gratefully acknowledged.
References
Bhasin S.K., Bhatia V., Kumar P. & Aggarwal O.P. (2001)Long-term nutritional effects of ICDS. Indian Journal ofPediatrics 68, 211–216.
Bishnoi P., Sehgal K. & Kwatra A. (2004) Anthropometricmeasurements of preschool children as effected bysocioeconomic factors. Asia Pacific Journal of ClinicalNutrition 13(Suppl.), S132.
Blössner M., de Onis M. & Uauy R. (2006) Estimatingstunting from underweight survey data. In: Culture,Ecology, Nutrition, Health and Disease (K. Bose ed.),pp. 145–152. Kamla Raj Enterprise: Delhi.
Brahmbhatt S.R., Brahmbhatt R.M. & Boyages S.C.(2001) Impact of protein energy malnutrition on thyroidsize in an iodine deficient population of Gujarat (India):is it an aetiological factor for goiter? European Journalof Endocrinology 145, 11–17.
Dolla C.K., Meshram P., Srivastava P., Karforma C., DasS. & Uike M. (2005) Nutritional status of Kodaku pre-school children in central India. Journal of HumanEcology 17, 229–231.
George K.A., Kumar N.S., Lal J.J. & Sreedevi R. (2000)Anemia and nutritional status of pre-school children inKerala. Indian Journal of Pediatrics 67, 575–578.
Hamill P.V., Drizd T.A., Johnson C.L., Reed R.B., RocheA.F. & Moore W.M. (1979) Physical growth: NationalCenter for Health Statistics percentiles. AmericanJournal of Clinical Nutrition 32, 607–629.
Kapil U. & Pradhan R. (1999) Integrated Child Develop-ment Services scheme (ICDS) and its impact on nutri-tional status of children in India and recent initiatives.Indian Journal of Public Health 43, 21–25.
Kumar S. & Bhawani L. (2005) Managing child nutritionin a drought affected district of Rajasthan – a casestudy. Indian Journal of Public Health 49, 198–206.
Kumari S. (2005) Nutritional status of scheduled castepre-school children. Indian Journal of Public Health49, 258–259.
Lee R.D. & Nieman D.C. (2003) Nutritional Assessment.McGraw-Hill: New York.
Lohman T.G., Roche A.F. & Martorell R. (1988) Anthro-pometric Standardization Reference Manual. HumanKinetics Books: Chicago, IL.
Mahapatra A., Geddam J.J., Marai N., Murmu B., MallickG., Bulliyya G. et al. (2000) Nutritional status of pre-school children in the drought affected Kalahandi districtof Orissa. Indian Journal of Medical Research 111, 90–94.
Martorel R., Rivera J. & Kaplowitz H. (1996) Conse-quences of stunting in early childhood for adult bodysize in Guatemala. Annals of Nestle 48, 85–92.
Mustaphi P. & Dobe M. (2005) Positive deviance – theWest Bengal experience. Indian Journal of Public Health49, 207–213.
Nandy S., Irving M., Gordon D., Subramanian S.V. &Davey Smith G. (2005) Poverty, child undernutrition andmorbidity: new evidence from India. Bulletin of theWorld Health Organization 83, 210–216.
Post C.L. & Victoria C.G. (2001) The low prevalence ofweight-for-height deficits in Brazilian children is relatedto body proportions. Journal of Nutrition 131, 1133–1134.
Rajaram S., Sunil T.S. & Zottarelli L.K. (2003) Analysis ofchildhood malnutrition in Kerala and Goa. Journal ofBiosocial Science 35, 335–351.
Ray S.K. (2005) Action for tackling malnutrition: growthmonitoring or surveillance. Indian Journal of PublicHealth 49, 214–217.
Satyanarayana K., Radhaiah G., Mohan K.R., Thim-mayamma B.V., Rao N.P., Rao B.S. et al. (1989) Theadolescent growth spurt of height among rural Indianboys in relation to childhood nutrition background: a 18years longitudinal study. Annals of Human Biology16, 289–300.
Saxena N., Nayar D. & Kapil U. (1997) Prevalence ofunderweight, stunting and wasting. Indian Pediatrics34, 627–631.
Shaikh S., Mahalanabis D., Chaterjee S., Kurpad A.V. &Khaled M.A. (2003) Lean body mass in preschool agedchildren in India: gender differences. European Journalof Clinical Nutrition 57, 389–393.
Ulijaszek S.J. & Kerr D.A. (1999) Anthropometric mea-surement error and the assessment of nutritional status.British Journal of Nutrition 82, 165–177.
UNICEF (2006) Report Progress for Children – A ReportCard on Nutrition. [WWW document]. URL http://www.unicef.org/progressforchildren/2006n4/index.html(last accessed 2 April 2007).
Waterlow J.C., Buzina R., Keller W., Lane J.M., NichmanM.Z. & Tanner J.M. (1977) The prevention and use ofheight and weight data for comparing the nutritionalstatus of group of children under the age of 10 year.Bulletin of the World Health Organization 55, 489–498.
World Health Organization (1983) Measuring Change inNutritional Status. WHO: Geneva.
World Health Organization (1995) Physical Status: The Useand Interpretation of Anthropometry. Technical ReportSeries no. 854. WHO: Geneva.
Yadav R.J. & Singh P. (1999) Nutritional status anddietary intake in tribal children of Bihar. IndianPediatrics 36, 37–42.
Undernutrition among rural Bengalee preschool children 221
© 2007 The Authors. Journal compilation © 2007 Blackwell Publishing Ltd. Maternal and Child Nutrition (2007), 3, pp. 216–221