Embed Size (px)
Citation preview
Studying the Segré- Silberberg effect by velocimetry in microfluidic channels
C. Sommer1, S. Quint1, P. Spang1, T. Walther2 & M. Baßler1 1Microfluidic Analysis Systems Department, Fraunhofer ICT-IMM, Germany 2Institute for Applied Physics, Technische Universität Darmstadt, Germany
Abstract
The specific equilibrium distance from the channel axis for particles in a laminar flow (Poiseuille Flow) according to the Segré-Silberberg effect has been extensively studied in microfluidic systems and it has been shown that particles of different sizes accumulate at different specific equilibrium distances. Little is known about the corresponding velocities and dynamics of the particle migration. Here, we measure the velocity distributions of particles migrating to their equilibrium positions in micro channels with rectangular cross section (12μ ∗ 477μ ) at a fixed migration distance (47.5 ) for varying particle diameter (1‐7μ ) and a wide range of Reynolds numbers (0.6–16). The measurements show the transition between two clearly distinct regimes. At low Reynolds numbers, the particle velocities suggest particle trajectories nearly uniformly distributed over the channel height. At high Reynolds numbers, the particles switch to a velocity about one third slower than the maximal velocity of the parabolic flow profile. In this regime, the particles propagate on Segré-Silberberg equilibrium positions between the channel axis and a channel wall. The transition to the Segré-Silberberg regime requires higher Reynolds numbers for smaller particles. We will further discuss the relationship between the various hydrodynamic forces (inertial force and wall force) and the velocity for both regimes in the framework of recent theories. Keywords: inertial migration, Segré-Silberberg effect, tubular pinch effect, micro-particles, velocity distribution, micro-particle velocity.
www.witpress.com, ISSN 1743-3533 (on-line) WIT Transactions on Engineering Sciences, Vol 82, © 2014 WIT Press
doi:10.2495/AFM140231
Advances in Fluid Mechanics X 265

1 Introduction
Since the measurements of Segré and Silberberg [10] in 1961, first describing a lateral migration of particles in a tube to an equilibrium position at 0.6 times the tube radius, this topic has been covered by many authors. In 1973, Tachibana [11] photographed particle trajectories in a (macro-) channel with square cross section (30x30 mm) and in a tube (r = 0.605 mm). In his experiments the particles need a travelling distance up to 1 depending on the channel Reynolds number in order to reach the Segré-Silberberg equilibrium position. The travelling distance in micro channels is much smaller which makes lateral migration useable, for example, for particle sorting (see Di Carlo et al. [4]; Kagalwala et al. [7]). A remarkable review is published by Di Carlo [3] describing the lateral migration and the possible fields of application. In 2011 Hur et al. [6] measured the Segré-Silberberg equilibrium position in dependency on the particle size of solid and elastic spheres. Many theoretical works have been performed in the past in order to describe the lateral migration. In 1964, Saffman [9] was one of the first authors to use perturbation theory to solve Oseen-like equations for basic shear flow and found that particles with deviating velocities to the ambient flow migrate laterally to the streamlines. On this basis and by using the method of matched asymptotic equations, Cox and Brenner [1] calculated in 1968 the lateral force and the resulting lateral velocity of a particle in a flow profile. Based on this, Ho and Leal [5] in 1974, Vasseur and Cox [12] in 1976, and Cox and Hsu [2] in 1977, derived expressions for the lateral force on particles in parabolic flow profiles. In 2010 Yahiaoui and Feuillebois [13] developed expressions for the lateral force on particles as well as for the velocity and compared their results with the other theoretical works discussed in more detail in section 2. The streamwise velocity of particles underlying lateral migration in micro channels has not been studied experimentally in detail up to now. This gap will be filled by the work presented in this paper in section 4, after a short introduction in the experimental setup in section 3.
2 Theory
The sketch in Figure 1 shows the parabolic flow profile (Poiseuille Flow, dashed line) between two infinite, parallel walls at a distance of . The distance from the lower wall is measured by the dimensionless parameter ⁄ . At the centre 0.5 , a plane is defined which is called centre plane in the following. At the centre plane, the flow has its maximum velocity . As is customary, a coordinate system (streamwise: , lateral: ) is attached to a particle suspended in the flow with radius and particle velocity ,. The behaviour of such particles in the lower half 0 0.5 is symmetric to that in the upper half 0.5 1.0 , thus only the lower half is considered in the flowing. The Segré-Silberberg effect occurs when the flow conditions cause particles to migrate laterally along the z-axis towards an equilibrium position.
www.witpress.com, ISSN 1743-3533 (on-line) WIT Transactions on Engineering Sciences, Vol 82, © 2014 WIT Press
266 Advances in Fluid Mechanics X

Hur et al. [6] showed experimentally that the equilibrium position of a particle is dependent on the particle radius . In their measurements, small particles with a ⁄ -value of 0.05 have an equilibrium distance of 0.22. This is in close agreement with the value of 0.20 measured by Segré and Silberberg. For an increasing , increases, too, which means that the equilibrium position shifts closer to the channel centreline at 0.5.
Figure 1: Sketch of the ideal parabolic flow profile (dashed curve) without perturbations caused by the particle. The profile is given for a fluidic channel with a rectangular cross section and a height of d and has a maximum velocity at the centreline 0.5 (dashed, horizontal line). The location of a particle with radius in the channel is measured by . For the purpose of generalization the distance is normalized to ⁄ .
The equilibrium distance for small particles of 0.22 is theoretically derived by Ho and Leal and Vasseur and Cox, while Cox and Hsu and Yahiaoui and Feuillebois derive a position of 0.15. Consequently, in this paper the theory of Ho and Leal is used, since it is in agreement with experimental results. Ho and Leal arrive at their result for channel Reynolds numbers of ≪ 1 and for 1. Nevertheless, the theory is in good agreement with the experimental results of Tachibana, where channel Reynolds numbers up to 60 are used ( 0.012). Hence, it is justified to apply the theory of Ho and Leal to our measurements which are conducted at 16 and 0.072. Ho and Leal derive a formula (1) for the dimensionless streamwise travelling distance Δ ′ (“asymptotic travelling length”) which particles need to migrate from an initial position to the equilibrium position.
Δ ∆x 36π1
(1)
www.witpress.com, ISSN 1743-3533 (on-line) WIT Transactions on Engineering Sciences, Vol 82, © 2014 WIT Press
Advances in Fluid Mechanics X 267

The function is evaluated numerically by Ho and Leal and is tabulated in their publication. The velocity is found to be . For the derivation of equation (1), Ho and Leal neglected the -term, which means that the disturbance of the flow profile caused by larger particles is neglected and therefore equation (1) is only valid for small particles 1 .
Figure 2: The normalized particle trajectories described by equation (1) for two initial starting positions 0.49 (Tim) and 0.01 (Twm) (Ho and Leal).
∆ ′ in equation (1) describes the general course of particle trajectories which are plotted in Figure 2 (Ho and Leal). For an initial particle position 0.01 close to the channel wall, the asymptotic travelling length calculates to ∆ 0.49 and the particle follows trajectory Twm. All other particles with initial position between channel wall and equilibrium position (0.01 0.22) also follow Twm starting at their respective on Twm. Lateral migration along Twm is dominated by a force due to the presence of the wall and is, therefore, termed wall migration. For an initial starting position of 0.49 close to the channel centre plane, the asymptotic length calculates to ∆ 1.7 and the particle follows Tim. This curve also determines the trajectories of initial positions in the range of 0.22 0.49 and is caused by a force due to the fluid inertia. Migration in this regime is termed inertial migration. Effectively, the wall migration is more than three times faster than the inertial migration. This theory also predicts that for all channel Reynolds numbers 0, inertial migration takes place and that there will be a finite ∆ at which all particles have reached their equilibrium position. However, the experimental results we present do not show inertial migration at low .
3 Experimental
The experiment uses the technique of spatially modulated emission which is described in detail by Kiesel et al. [8]. This technique is particularly suited for our experiments as it enables the measurement of intensity and velocity for fluorescent particles in micro channels. The fluorescent signal of each individual
www.witpress.com, ISSN 1743-3533 (on-line) WIT Transactions on Engineering Sciences, Vol 82, © 2014 WIT Press
268 Advances in Fluid Mechanics X

particle is modulated in time as it flows along a spatial mask with opaque and transparent features. By means of correlation techniques particle intensity and velocity are recovered from the signal. In Figure 3a) the experimental setup is shown. The laser beam of the laser a) is formed by the optical components b to e (b: iris diaphragm, c: filter, d: 2⁄ -plate, e: cylindrical lens) to illuminate the detection area. The spherical lens
g and the camera f are used for alignment issues. The chip h is fed with the sheath flow and the sample by a syringe pump o. The fluorescent light of the excited fluorescently dyed particles is collected by a microscope lens i, passed through a filter j and then focussed on the spatially modulated mask l. The light which passed through the transparent portions of the spatial mask is collected by a spherical lens m and focussed on an avalanche photo diode n.
Figure 3: In a) the sketch of the experimental setup is shown and the various components are marked by alphabetic letters (see text). The dashed line marks the optical axes of the setup. In b) mask l is sketched with its dimensions and in c) plastic chip h is sketched. The ports are numbered consecutively from 1 to 4. The dashed line is the course of the excitation laser beam within the plastic chip.
The mask shown in Figure 3b) was photo lithographically defined according to a binary sequence of [1,1,1,1,1,1,1,-1,-1,1,1,1,1,1,-1,-1,-1,-1,1,1,-1,-1,1,1,-1, 1,1,1,-1,1,-1,1,-1,1,-1,-1,-1,-1,1,1,-1,1,-1,1,1,-1,1,-1,-1,1,-1] where -1 represents opaque areas and vice versa. The particle suspension enters the chip through port 1, shown in Figure 3, c). The sheath liquids (deionised water, 18.2 Ω ), used for the hydrodynamic focusing of the particle suspension at the junction of the channels, enter through port 2 and 3. The ratio of the sheath flow- and the suspension flow rates is fixed to 0.0416 for all measurements. As a result the particle flow in the measurement channel, which starts at the junction, is focussed to a width of 20 . The travelling distance Δ of the particles in the measurement channel to the centre of the detection zone is 47.5 . The high aspect ratio of the channel cross section (width: 477 µm, height: 20 µm) is chosen to establish the fluidic
www.witpress.com, ISSN 1743-3533 (on-line) WIT Transactions on Engineering Sciences, Vol 82, © 2014 WIT Press
Advances in Fluid Mechanics X 269

conditions of two infinite, parallel walls. In combination with the sheath flow that localizes particle transport to a 20 µm wide stream at the centre, the particles are thus exposed to a 2-dimensional parabolic flow profile across the channel height. The simplified 2-dimensional flow profile in Figure 1 is therefore justified for the discussion of the experimental results. Since the flow rate of the suspension in the inlet channel is two orders of magnitude smaller and the diameter of the supply tube to port 1 is one order of magnitude larger, migration of particles prior to the measurement channel is neglected. The fluorescent polystyrene particles have a mean diameter of 0.84 , 2.11 , 3.30 , 4.24 , 6.42 (all Spherotech, Inc., flourophore: Nile Red) and 5.51 (Fluoresbrite® Polychromatic Red particles from Polysciences, Inc.), respectively. Four particle suspensions were prepared according to Table 1, each containing the smallest particle (0.84 µm), the brightest particle (5.51 µm) and one of the other particles. For each particle the concentration was set to 1.66 ∙ 10 #⁄ leading to a total particle concentration of 5 ∙ 10 #⁄ in each suspension. In addition, Table 1 shows the fluorescent intensity measured in our setup for each particle individually.
Table 1: Composition of particle suspensions and the mean fluorescent intensity for each particle population.
Suspension identifier Intensity Particle diameter (µm) 2.11 3.30 4.24 6.42 mV
0.84 × × × × 1.8 2.11 × - - - 13.8 3.30 - × - - 37.8 4.24 - - × - 11.0 5.51 × × × × 484.0 6.42 - - - × 40.2
Each particle suspension was passed through the fluidic channel at room temperature and the channel Reynolds number was successively increased from 0.6 to 16.0 by increasing the total channel flow rate from 7.9 ⁄ to 208.3 ⁄ (compare Table 2).
Table 2: The flow conditions of the measurement series of each suspension measurement.
Max. velocity Overall flow rate Channel Reynolds number / /
659.0 208.3 16.0493.3 155.9 12.0410.2 129.7 9.9328.9 104.0 8.0246.8 78.0 6.0164.5 52.0 4.043.8 13.9 1.125.0 7.9 0.6
www.witpress.com, ISSN 1743-3533 (on-line) WIT Transactions on Engineering Sciences, Vol 82, © 2014 WIT Press
270 Advances in Fluid Mechanics X

Velocity and intensity of each detected particle were measured according to [8] at a travelling distance of ∆ 47.5 . The scatter plot in Figure 4, shows exemplarily the result for the 4.24 suspension at a channel Reynolds number of 16.0. The measurement consists of a total of 5843 data points grouped in three clearly separated populations hallmarked by the rectangular frames according to the mean particle intensities (see Table 1). 3921 data points are assigned to the 0.84 population, 351 to the 4.24 population and 281 to the 5.51 population. At the given flow rate and the measurement duration of 3 , 3984 0.84 -sized particles were expected, i.e. we find a loss of 1/5%. The remaining 1290 data points in Figure 4 are caused by groups of two and more particles or debris of larger particles and cannot be assigned to one of the three populations. The lower particle count for both populations containing the larger particles is due to particle sedimentation in the horizontal stretch of the supply tube, having a length of 10 , a diameter of 100 and a flow rate of 8 / . Sedimentation prevents the measurement of 4.24 particles below a channel Reynolds number of 1.3, for 5.51 particles below 4 and for 6.42 particles below 5.
Figure 4: The measured velocity and fluorescent intensity of each particle at a channel Reynolds number of 16. By means of fluorescent intensity, three clearly distinct particle populations are visible. The inset shows the velocity distribution for the 0.84 population.
www.witpress.com, ISSN 1743-3533 (on-line) WIT Transactions on Engineering Sciences, Vol 82, © 2014 WIT Press
Advances in Fluid Mechanics X 271
The 0.84 particles experience the weakest migration force and can therefore be used to probe the flow profile. The inset in Figure 4 shows the velocity distribution of the particles inside of the 0.84 population. To the peak in this distribution at the highest occurring velocities a Gaussian fit is applied whose mean velocity is taken as the maximum velocity of the flow. The measured maximum velocity is listed in Table 2 and is used to calculate the channel Reynolds number as well as the flow rate. In that way we exclude errors introduced by the syringe pump which is not calibrated. Figure 4 also indicates that the velocity distribution for the 5.51 particles is narrow
471.0 1.1 / . To check the stability of the flow rate during a single measurement, the velocity of the 5.51 µm particle was plotted over time (not shown) and no drift of the velocity could be observed within the 1.1 ⁄ range. The comparability of the velocity distributions for
the following discussion is provided by normalizing each velocity distribution to the of the respective 0.84 population.
4 Results and discussion
The normalized velocity distribution is shown for the 0.84 particles in Figure 5a): 0.6, b) 16. The velocity distribution is compared to a hypothetic reference distribution (dashed line) calculated for the case of laterally homogeneously distributed, point-like particles which do not experience lateral migration. The model for calculating the reference distribution is depicted in the inset of Figure 5a). As for the measurement, the calculation is done for
Figure 5: a) The velocity distribution of 0.84 particles. The dashed lines are theoretical curves calculated for laterally homogeneously distributed, point-like particles. The 0.84 particles cannot arrive at velocities smaller than the vertical dashed and dotted lines at 0.135 since the particle would touch the wall at that velocity. The insert in a) shows the relationship of equidistant velocity bins ∆ to non-equidistant channel height bins ∆ which explains the hypothetic reference distribution (dashed line, see text).
www.witpress.com, ISSN 1743-3533 (on-line) WIT Transactions on Engineering Sciences, Vol 82, © 2014 WIT Press
272 Advances in Fluid Mechanics X
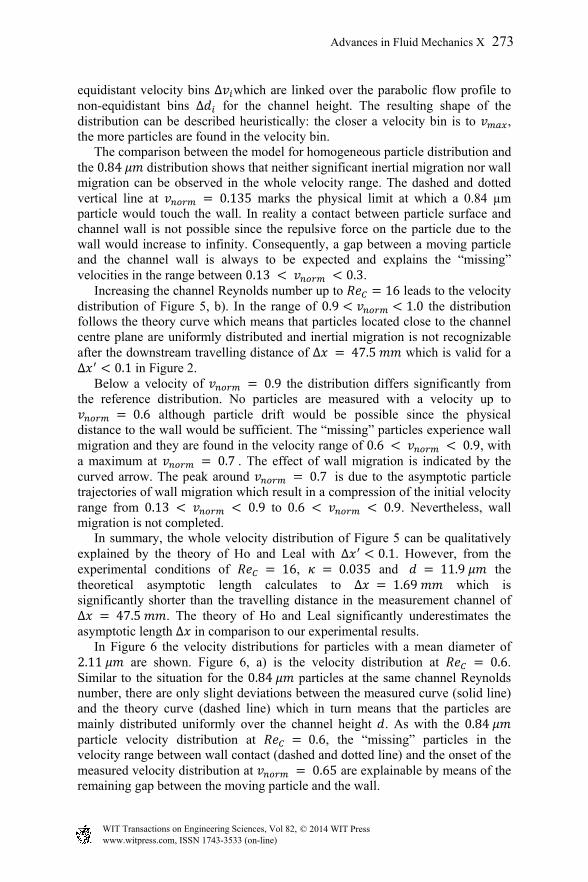
equidistant velocity bins ∆ which are linked over the parabolic flow profile to non-equidistant bins ∆ for the channel height. The resulting shape of the distribution can be described heuristically: the closer a velocity bin is to , the more particles are found in the velocity bin. The comparison between the model for homogeneous particle distribution and the 0.84 distribution shows that neither significant inertial migration nor wall migration can be observed in the whole velocity range. The dashed and dotted vertical line at 0.135 marks the physical limit at which a 0.84 µm particle would touch the wall. In reality a contact between particle surface and channel wall is not possible since the repulsive force on the particle due to the wall would increase to infinity. Consequently, a gap between a moving particle and the channel wall is always to be expected and explains the “missing” velocities in the range between 0.13 0.3. Increasing the channel Reynolds number up to 16 leads to the velocity distribution of Figure 5, b). In the range of 0.9 1.0 the distribution follows the theory curve which means that particles located close to the channel centre plane are uniformly distributed and inertial migration is not recognizable after the downstream travelling distance of ∆ 47.5 which is valid for a ∆ 0.1 in Figure 2. Below a velocity of 0.9 the distribution differs significantly from the reference distribution. No particles are measured with a velocity up to
0.6 although particle drift would be possible since the physical distance to the wall would be sufficient. The “missing” particles experience wall migration and they are found in the velocity range of 0.6 0.9, with a maximum at 0.7. The effect of wall migration is indicated by the curved arrow. The peak around 0.7 is due to the asymptotic particle trajectories of wall migration which result in a compression of the initial velocity range from 0.13 0.9 to 0.6 0.9. Nevertheless, wall migration is not completed. In summary, the whole velocity distribution of Figure 5 can be qualitatively explained by the theory of Ho and Leal with ∆ 0.1. However, from the experimental conditions of 16, 0.035 and 11.9 the theoretical asymptotic length calculates to ∆ 1.69 which is significantly shorter than the travelling distance in the measurement channel of ∆ 47.5 . The theory of Ho and Leal significantly underestimates the asymptotic length ∆ in comparison to our experimental results. In Figure 6 the velocity distributions for particles with a mean diameter of 2.11 are shown. Figure 6, a) is the velocity distribution at 0.6. Similar to the situation for the 0.84 particles at the same channel Reynolds number, there are only slight deviations between the measured curve (solid line) and the theory curve (dashed line) which in turn means that the particles are mainly distributed uniformly over the channel height . As with the 0.84 particle velocity distribution at 0.6, the “missing” particles in the velocity range between wall contact (dashed and dotted line) and the onset of the measured velocity distribution at 0.65 are explainable by means of the remaining gap between the moving particle and the wall.
www.witpress.com, ISSN 1743-3533 (on-line) WIT Transactions on Engineering Sciences, Vol 82, © 2014 WIT Press
Advances in Fluid Mechanics X 273

Figure 6: The velocity distributions of particles with a mean diameter of 2.11 at channel Reynolds numbers of a) 0.6, b) 4.0, c) 6.0 and d) 8.0. Again, the dashed curves are the theory for particles with 0 and the dashed and dotted vertical lines are the theoretical wall contact.
The slight elevation and the widening of the measured velocity distribution at 1.0 as compared to the reference distribution indicates that at this
channel Reynolds number after the travelling distance of again ∆ 47.5 the particle distribution over the channel height is slightly increased around the centre plane in comparison to the rest of the channel. This indicates that no inertial migration is active and all particles migrate towards the centre plane. In Figure 6b), the wall migration towards the velocity range of 0.7 0.9 can be clearly seen, which is indicated by the curved arrow to the left. Again a “migration” peak builds up in the same manner as it can be seen in Figure 5a). By comparing Figure 6c) and d) one can see that the onset of the velocity distributions remains constant at 0.7 ∙ . This indicates that the wall migration is completed. In the framework of Figure 2 this situation translates to a regime where the asymptotic travelling length must be ∆ 0.5. The reduced frequency density of the measured velocity distribution compared to the theory in the range of 0.9 0.97 supports the claim of ∆ 0.5 since the particles located initially halfway between the centre plane and the equilibrium position migrate faster than particles located close to the centre plane. Consequently, the velocity bins here “lose” particles at a higher rate
www.witpress.com, ISSN 1743-3533 (on-line) WIT Transactions on Engineering Sciences, Vol 82, © 2014 WIT Press
274 Advances in Fluid Mechanics X

than new particles arrive in the bin. In this regime a significant fraction of particles initially located between the centre plane and the equilibrium position experience inertial migration towards the equilibrium position (see curved array on the right). ∆ 0.5 translates to a calculated asymptotic travelling length of ∆ 2.14 , which is again far too short in comparison to our experimental findings. For 6.0 (Figure 6c)) the situation is attributed to an asymptotic travelling length range of 0.5 ∆ 1.0 since a distinct reduction of the frequency density at 1.0 can be observed and the particle density around the channel centre plane is thinned out. The range of 0.5 ∆ 1.0 translates to an absolute asymptotic travelling length in the range of 1.42 ∆ 2.85 , which is again too short. For 8.0 (Figure 6d)) the situation is attributed to an asymptotic travelling length range of 1.0 ∆ 1.5 because most of the particles are located around the equilibrium position. However, the asymmetric form of the migration peak with a flattened shoulder on the right side shows that the inertial migration away from the centre plane is not yet completed. The range of 1.0 ∆ 1.5 translates to an asymptotic travelling length of 2.14 ∆ 3.21 , which is too short. Consistently, the theory of Ho and Leal predicts too small values for the asymptotic travelling length ∆ for the 2.11 particles as well as for the 0.84 µm particles as discussed before. Figure 7a) shows the development of the 0.84 particle velocity distribution from the situation of Figure 5a) at a channel Reynolds number of
0.6 to the situation of Figure 5b) at a channel Reynolds number of 16. The asymptotic course of ∆ ~ can again be seen by having a
look on the slowest measured particle velocities of each distribution. Figure 7b) shows again the complete migration process for the 2.11 particles in dependency of the channel Reynolds number. The range of the Reynolds number is extended up to 16, at which the migration peak is very sharp compared to the migration peaks at lower channel Reynolds numbers. Figure 7c)-f) shows the velocity distributions of the measurement of the 3.30 particles (c)), 4.24 particles (d)), 5.51 particles (e)) and 6.42 particles (f)). Even for the lowest measureable channel Reynolds number for all of these distributions clear migration peaks have developed. At the channel Reynolds number of 16 the inertial migration is completed since the migration peaks do not significantly differ in width from the migration peaks at 12. A quantitative investigation of the standard deviation and the centre of the migration peaks in Figure 7b)-f) is in progress but cannot be discussed here due to the page limit.
5 Conclusion
Our study revealed that the measurement of velocity distributions of particles in laminar flows at different channel Reynolds numbers offers the possibility to study the interaction of the fluid inertia force on particles and the wall force. It
www.witpress.com, ISSN 1743-3533 (on-line) WIT Transactions on Engineering Sciences, Vol 82, © 2014 WIT Press
Advances in Fluid Mechanics X 275

Figure 7: Normalized velocity distributions for particles with a mean size of a) 0.84 , b) 2.11μ , c) 3.30 , d) 4.24 , e) 5.51 and f) 6.42 at various channel Reynolds numbers. For better perceptibility not all measurements of the series are displayed.
was demonstrated that the dynamics of the Segré-Silberberg effect can be studied in detail. The comparison with the theory of Ho and Leal shows a qualitative agreement. However, the theory delivers significantly smaller values for the asymptotic travelling length ∆ . Moreover, in contrast to the theory, our experiments suggest the presence of fluidic regimes at low where inertial forces are weaker than the wall forces over the whole channel height. If we overcome the limitations introduced by particle sedimentation and the limited pressure stability of our channels, a wider range of channel Reynolds numbers would be experimentally accessible to study the dynamics of the Segré-Silberberg effect in even more detail.
www.witpress.com, ISSN 1743-3533 (on-line) WIT Transactions on Engineering Sciences, Vol 82, © 2014 WIT Press
276 Advances in Fluid Mechanics X

Acknowledgements
The authors thank Tobias Broger for realizing an extremely reliable and fail-safe data sampling system and Stefan Schmitt whose knowledge in silicon-based thin-film technology was key to fabricating precise microfluidic channels. The European Research Council (ERC) is acknowledged for funding the project under grant #258604.
References
[1] Cox, R. & Brenner, H., The lateral migration of solid particles in Poiseuille flow — I theory. Chemical Engineering Science, 23, pp. 147–173, 1968.
[2] Cox, R. & Hsu, S., The lateral migration of solid particles in a laminar flow near a plane. International Journal of Multiphase Flow, 3, pp. 201–222, 1977.
[3] Di Carlo, D., Inertial microfluidics. Lab Chip, 9, p. 3038, 2009. [4] Di Carlo, D., Irimia, D., Tompkins, R. G. & Toner, M., Continuous
inertial focusing, ordering, and separation of particles in microchannels. Proceedings of the National Academy of Sciences, 104, pp. 18892–18897, 2007.
[5] Ho, B. P. & Leal, L. G., Inertial migration of rigid spheres in two-dimensional unidirectional flows. J. Fluid Mech., 65, p. 365, 1974.
[6] Hur, S. C., Henderson-MacLennan, N. K., McCabe, E. R. B. & Di Carlo, D., Deformability-based cell classification and enrichment using inertial microfluidics. Lab Chip, 11, p. 912, 2011.
[7] Kagalwala, T. E., Zhou, J., Papautsky, I., Continuous size-based separation of Microparticles in straight channels. Proc. of the 14th Int. Con. on Miniaturized Systems for Chemistry and Life Sciences, eds. S. Verpoorte, H. S. Svahn, J. Emneus, Chemical & Biological Microsystems Society : San Diego, CA, pp. 531-533, 2010.
[8] Kiesel, P., Baßler, M., Beck, M. & Johnson, N. M., Spatially modulated fluorescence emission from moving particles. Appl. Phys. Lett., 94, p. 41107, 2009.
[9] Saffman, P. G., The lift on a small sphere in a slow shear flow. J. Fluid Mech., 22, p. 385, 1965.
[10] Segré, G. & Silberberg, A., Radial Particle Displacements in Poiseuille Flow of Suspensions. Nature, 189, pp. 209–210, 1961.
[11] Tachibana, M., On the behaviour of a sphere in the laminar tube flows. Rheol Acta, 12, pp. 58–69, 1973.
[12] Vasseur, P. & Cox, R., The lateral migration of a spherical particle in two-dimensional shear flows. J. Fluid Mech., 78, p. 385, 1976.
[13] Yahiaoui, S. & Feuillebois, F., Lift on a sphere moving near a wall in a parabolic flow. J. Fluid Mech., 662, pp. 447–474, 2010.
www.witpress.com, ISSN 1743-3533 (on-line) WIT Transactions on Engineering Sciences, Vol 82, © 2014 WIT Press
Advances in Fluid Mechanics X 277