Embed Size (px)
Citation preview
Studying Hardware and Software Trade-Offs for aReal-Life Web 2.0 Workload
Stijn Polfliet Frederick Ryckbosch Lieven EeckhoutELIS Department, Ghent University
Sint-Pietersnieuwstraat 41, B-9000 Gent, Belgium{stijn.polfliet, frederick.ryckbosch, lieven.eeckhout}@elis.UGent.be
ABSTRACTDesigning data centers for Web 2.0 social networking applicationsis a major challenge because of the large number of users, the largescale of the data centers, the distributed application base, and thecost sensitivity of a data center facility. Optimizing the data centerfor performance per dollar is far from trivial.
In this paper, we present a case study characterizing and evaluat-ing hardware/software design choices for a real-life Web 2.0 work-load. We sample the Web 2.0 workload both in space and in timeto obtain a reduced workload that can be replayed, driven by in-put data captured from a real data center. The reduced workloadcaptures the important services (and their interactions) and allowsfor evaluating how hardware choices affect end-user experience (asmeasured by response times).
We consider the Netlog workload, a popular and commerciallydeployed social networking site with a large user base, and we ex-plore hardware trade-offs in terms of core count, clock frequency,traditional hard disks versus solid-state disks, etc., for the differ-ent servers, and we obtain several interesting insights. Further, wepresent two use cases illustrating how our characterization methodcan be used for guiding hardware purchasing decisions as well assoftware optimizations.
Categories and Subject DescriptorsC.0 [Computer Systems Organization]: Modeling of computerarchitecture; C.4 [Computer Systems Organization]: Performanceof Systems—Modeling Techniques
General TermsDesign, Performance, Measurement, Experimentation
KeywordsData center, Web 2.0, performance analysis
Permission to make digital or hard copies of all or part of this work forpersonal or classroom use is granted without fee provided that copies arenot made or distributed for profit or commercial advantage and that copiesbear this notice and the full citation on the first page. To copy otherwise, torepublish, to post on servers or to redistribute to lists, requires prior specificpermission and/or a fee.ICPE’12, April 22-25, 2012, Boston, Massachusetts, USACopyright 2012 ACM 978-1-4503-1202-8/12/04 ...$10.00.
1. INTRODUCTIONInternet usage has grown by 480% over the past ten years world-
wide according to a recent study by Internet World Stats1. Thisfast increase is due to various novel Internet services that are beingoffered, along with ubiquitous Internet access possibilities throughvarious devices including mobile devices such as smartphones, tabletsand netbooks. Online social networking in particular has beenbooming over the past few years, and has been attracting an in-creasing number of customers. Facebook, for example, has morethan 800 million active users as of January 20122, and 50% of theseusers log on to Facebook at least once a day. Twitter generates 140million tweet messages per day as of February 20113. LinkedIn hasmore than 135 million professionals around the world as of Novem-ber 20114. Netlog, a social networking site where users can keepin touch with and extend their social network, is currently availablein 40 languages and has more than 94 million users throughout Eu-rope as of January 20125. Clearly, social networking communitieshave become an important part of digital life.
Designing the servers and data centers to support social network-ing is challenging, for a number of reasons. As mentioned above,social networks have millions of users, which requires distributedapplications running in large data centers [2]. The ensemble ofservers is often referred to as a warehouse-scale computer [3] andscaling out to this large a scale clearly is a major design challenge.Because of their scale, data centers are very much cost driven —optimizing the cost per server even by only a couple tens of dol-lars results in substantial cost savings and proportional increases inprofit. There are various factors affecting the cost of a data center,such as the hardware infrastructure (servers, racks and switches),power and cooling infrastructure, operating expenditure, and realestate. Hence, data centers are very cost-sensitive and need to beoptimized for the ensemble. As a result, operators drive their datacenter design decisions towards a sweet spot that optimizes perfor-mance per dollar.
A key question when installing a new data center obviously iswhich new hardware infrastructure, i.e., which servers, to buy. Thisis a non-trivial question given the many constraints. On the onehand, the hardware should be a good fit for the workloads thatare going to run in the data center. The workloads themselves1http://internetworldstats.com/stats.htm2http://www.facebook.com/press/info.php?statistics3http://blog.kissmetrics.com/twitter-statistics/4http://press.linkedin.com/about5http://en.netlog.com/go/about
could be very diverse — some workloads are interactive, othersare batch-style workloads and thus throughput-sensitive and notlatency-critical; some workloads are memory-intensive while oth-ers are primarily compute-intensive or I/O-intensive. Hence, somecompromise middle-of-the-road architecture may need to be cho-sen to satisfy the opposing demands; alternatively, one may opt fora heterogeneous system where different workloads run on differ-ent types of hardware. Further, one needs to anticipate what newworkloads might emerge in the coming years, and how existingworkloads are likely to evolve over time. On the other hand, givenhow cost-sensitive a data center is, it is of utmost importance thatthe correct hardware is purchased for the correct task. High-endhardware is expensive and consumes significant amounts of power,which leads to a substantial total cost of ownership. This may bethe correct choice if the workloads need this high level of perfor-mance. If not, less expensive and less power-hungry hardware maybe a much better choice.
It is exactly this purchasing question that motivated this work:Can we come up with a way of guiding service operators and own-ers of data centers to what hardware to purchase for a given work-load? Although this might be a simple question to answer whenconsidering a single workload that runs on a single server, answer-ing this question is quite complicated when it comes to a Web2.0 social networking workload. A social networking workloadconsists of multiple services that run on multiple servers in a dis-tributed way in a data center, e.g., Web servers, database servers,memcached servers, etc. The fundamental difficulty that a Web 2.0workload imposes is that the performance of the ensemble can onlybe measured by modeling and evaluating the ensemble, because ofthe complex interplay between the various servers and services. Inother words, performance as perceived by the end-user, i.e., theresponse times observed by the end user, is a result of the perfor-mance of the individual servers as well as the overall interactionamong the servers. Put differently, optimizing the performance ofan individual server may not necessarily be beneficial for the en-semble and may not necessarily have impact on end-user experi-ence, nor may it have impact on the total cost of ownership.
In this paper, we present a case study in which we characterize areal-life Web 2.0 workload and evaluate hardware and software de-sign choices. We sample the Web 2.0 workload both in space and intime to obtain a reduced workload that can be replayed, driven byreal input data. The reduced workload captures the important ser-vices (and their interactions) and allows for evaluating how hard-ware choices affect end-user experience.
We consider Netlog’s commercially used Web 2.0 social net-working workload, and we evaluate how hardware design choicessuch as number of cores, CPU clock frequency, hard-disk drive(HDD) versus solid-state drive (SSD), etc. affect overall end-userperceived performance. We conclude that the number of cores pernode is not important for the Web servers in our workload, hencethe hardware choice should be driven by cost per core; further,we find that the end-user response time is inversely proportionalto Web server CPU frequency. SSDs reduce the longest responsetimes by around 30% over HDDs in the database servers, whichmay or may not be justifiable given the significantly higher cost forSSD compared to HDD. Finally, the memcached servers show lowlevels of CPU utilization while being memory-bound, hence the
the Internet load balancer
Webserver
Webserver
Webserver
Webserver
Webserver
memcached server
globaldatabase
server
memcached server
database server
database server
database server
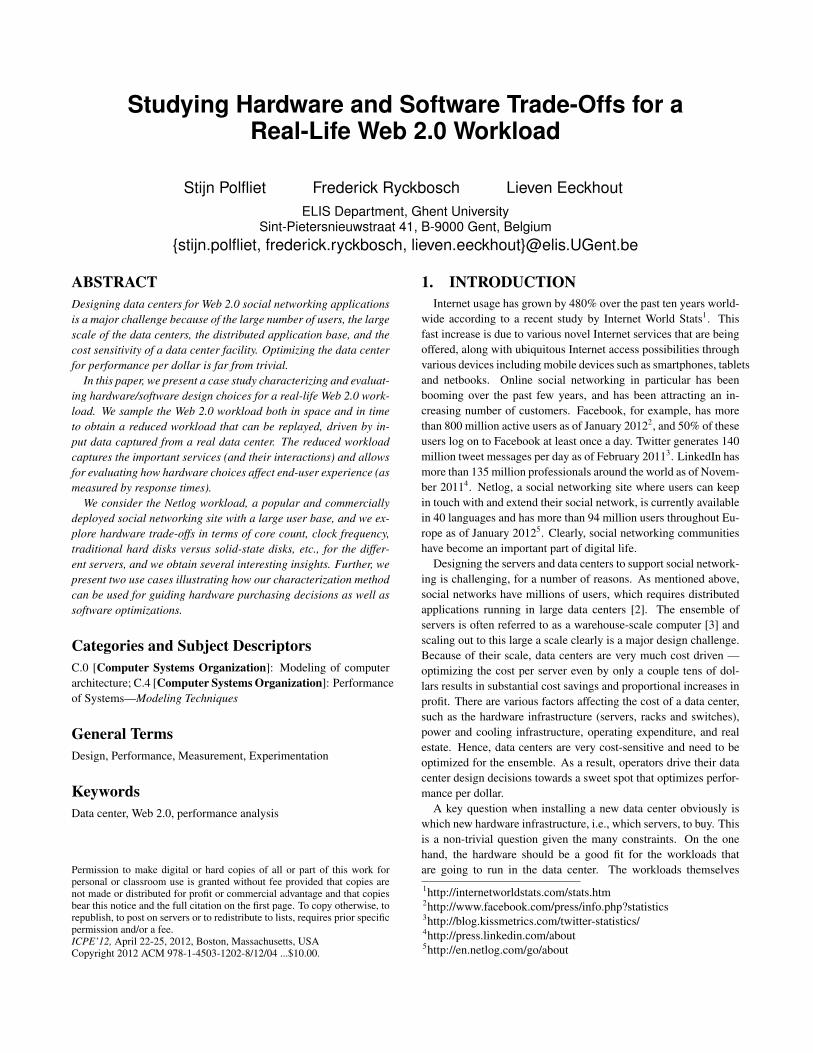
Figure 1: Netlog’s architecture.
hardware choice should be driven by the cost of integrating moremain memory in the server.
We believe that this approach is not only useful to service providersand data center owners, but also to architects, system builders, andintegrators to understand Web 2.0 workloads and how hardwarechoices affect user-perceived performance, server throughput, andutilization. Further, software developers and data center systemadministrators may find the approach useful to identify and solveperformance bottlenecks in the software and experiment with al-ternative software implementations. To demonstrate the potentialusage of the characterization, we present two uses cases illustratinghow it can be leveraged for guiding hardware purchasing decisionsand software optimizations.
This paper is organized as follows. We first describe the Web 2.0workload used in this study (Section 2). We then set the goals forthis paper (Section 3) and describe our methodology in more detail(Section 4). We detail our experimental setup (Section 5) and thenpresent our results (Section 6). We focus on two important usecases for this work (Section 7). Finally, we discuss related work(Section 8) and conclude (Section 9).
2. NETLOG WEB 2.0 WORKLOADAs mentioned in the introduction, we use Netlog’s software in-
frastructure as a representative Web 2.0 workload. Netlog hosts asocial networking site that is targeted at bringing people together.As of January 2012, Netlog is currently available in 40 languagesand has more than 94 million members throughout Europe. Ac-cording to ComScore6, Netlog is the pageview market leader inBelgium, Italy, Austria, Switserland, Romania and Turkey; and itis the second market leader in the Netherlands, Germany, Franceand Portugal. Netlog has around 100 million viewers per month,leading to over two billion pageviews per month. Netlog users canchat with other friends, share pictures, write blog entries, watchmovies and listen to music.
Netlog’s architecture is illustrated in Figure 1. A load balancer
6http://www.comscore.com/
distributes the incoming requests among the Web servers. The Webservers process the requests and assemble a response by fetching re-cently accessed data from the memcached servers. If the requesteddata is not present in one of the memcached servers, the Web servercommunicates with one of the database servers. There is one globaldatabase that holds general information with user data (like nick-name and passwords). All other user data is spread among multipledatabase servers using a technique called ‘sharding’7. Each of theservers run on a physical machine. The relative fraction of serversis as follows: 54% of Netlog’s servers are Web servers, 16% arememcached servers and 30% are database servers. The Netlog datacenter hosts more than 1,500 servers.
Netlog’s data center is partitioned among the languages that itsupports, i.e., servers are devoted to one particular language. Thelargest language is Dutch, followed by German, Italian, Arabic,English, and others. Interestingly, usage patterns are similar acrosslanguages, hence, the same relative occurrence of Web, cachingand database servers is maintained across all the languages.
In terms of software, the Web servers run the Apache HTTPserver8; the caching servers run Memcached9; and the databaseservers run MySQL10. For more information, please refer to Sec-tion 5.
3. CASE STUDY GOALSBefore describing our case study in great detail, we first need to
set out its goals. First, we want to be able to characterize and eval-uate end-user perceived performance of a Web 2.0 system. Thisimplies that a representative part of the workload needs to be du-plicated in the experimental environment which enables evaluatingoverall end-to-end performance. This in turn implies that a set ofmachines needs to be engaged with each machine running part ofthe workload — some run Web servers, some run database servers,others run memcached servers. Collectively, this set of machinesruns the entire workload. This experimental environment, whensupplied with real user requests, will act like a real data center run-ning the real workload. This enables measuring user-perceived re-sponse times as well as server-side throughput and utilization.
Second, the experimental environment by itself will not provideuseful measurement data. It also needs a method to feed real-lifeuser requests into the experimental environment. In other words,real user requests need to be captured and recorded in a real datacenter and then need to be replayed in our experimental environ-ment. This will enable us to measure how design choices in thehardware and the software affect user-perceived performance aswell as server throughput and utilization.
Third, in addition to being able to faithfully replay real-life userrequests, it is useful to be able to stress the setup through experi-ments in which user requests are submitted at a fixed rate. This al-lows for gaining insight into the system’s limits and how the system
7Sharding is a horizontal partitioning database design principlewhereby rows of a database table are held separately, rather thansplitting by columns. Each partition forms part of a shard, whichmay in turn be located on a separate database server or physicallocation.8http://httpd.apache.org/9http://memcached.org/
10http://www.mysql.com/
will react in case of high loads. For example, it allows for learningabout how user-perceived response time is affected by server load.Or, it allows for understanding the maximum allowable server loadbefore seeing degradations in user response times.
Finally, we need the ability to run reproducible experiments, orin other words, we want to draw similar performance figures whenrunning the same experiment multiple times. This allow us to mea-sure how changes in system configuration parameters affect perfor-mance. In the end, we want to use the experimental environmentand change both hardware and software settings to understand howhardware and software design choices affect user-perceived per-formance as well as server-level throughput and utilization. Thisnot only enables service providers and data center owners to pur-chase, provision and configure their hardware and software, it alsoenables architects, system builders and integrators, software devel-opers, etc. where to focus when optimizing overall system perfor-mance.
4. METHODOLOGYOur methodology has a number of important features in order to
make the experimental environment both efficient and effective forcarrying out our case study.
• Sampling in space. It is obviously prohibitively costly to du-plicate an entire Web 2.0 workload with possibly hundreds,if not thousands, of servers in the experimental environment.We therefore sample the workload in space and we selecta reduced but representative portion of the workload as thebasis for the experimental framework. For the Netlog work-load, we select one language out of the many languages thatNetlog’s workload supports; this language is representativefor the other languages and for the Netlog workload at large.Sampling in space allows us to evaluate a commercial Web2.0 workload with hundreds of servers in real operation withonly 10 servers in our experimental environment.
• Sampling in time. Replaying a Web 2.0 workload usingreal-life user input, as we will describe next, can be verytime-consuming, especially if one wants to replay multipledays of real-life operation in the data center. Moreover, inorder to understand performance trends across hardware andsoftware design changes, one may need to explore many con-figurations and hence run the workload multiple times. Thismay make the experimental setup impractical to use. Hence,we analyze the time-varying behavior of the workload andwe identify representative phases in the execution, which wesample from, and which we can accurately extrapolate per-formance numbers to the entire workload. Sampling in timeallows to analyze only a few hours of real time while beingrepresentative for a workload that runs for days.
• Workload warm-up. Sampling in time implies that we eval-uate only a small fraction of the total run time. A potentialpitfall with this approach is that system state might be verydifferent when replaying under sampling than if one were toreplay a workload for days of execution. This is referredto as the cold-start problem. In other words, the systemneeds to be warmed up when employing sampling in time
so that the performance characteristics during the evaluationare representative for as if we were to run the entire work-load. Our methodology uses a statistics-based approach togauge whether the system is warmed up sufficiently.
• Replaying empirical user request streams. As mentionedbefore, we capture and replay real-life user requests. Theuser request file that we store on disk and that we use asinput to the experimental environment contains sufficient in-formation for faithfully replaying real-life users requests. Inother words, the input served to the load balancer of the Net-log workload is identical under replay as when we capturedit during real-life operation.
We now discuss the various steps of our methodology in moredetail.
4.1 Sampling in spaceAs part of this study we duplicated Netlog’s workload. Because
it is infeasible to duplicate Netlog’s entire workload, we chose toduplicate a small part only, namely the part associated with theSlovene language. This is feasible to do, and leads to a represen-tative workload. Netlog organizes its servers such that there are anumber of physical servers per language domain. Hence, by se-lecting a language domain and by only duplicating that languagedomain, we sample in space while being representative for the en-tire workload. The Slovene part is representative for Netlog’s entireworkload because it exhibits the same partitioning of servers as therest of Netlog’s workload. Also, we observe similar degree of ac-tivity and access behavior (access to profiles, photos, videos, etc.)for the Slovene language as for the other languages.
Duplicating the Slovene language part of Netlog’s workload canbe done with a reasonable number of servers. Our setup includes6 Web servers, 1 memcached server and 2 database servers; thisdistribution across server types is identical to what is observed forthe entire Netlog workload, across all the languages. Further, oursetup includes the entire Slovene database and all of its records.The data present in our duplicate copy is anonymized. This is donethrough hashing while maintaining the length of the records.
4.2 Validating the setupDuplicating a Web 2.0 workload is a significant effort and in-
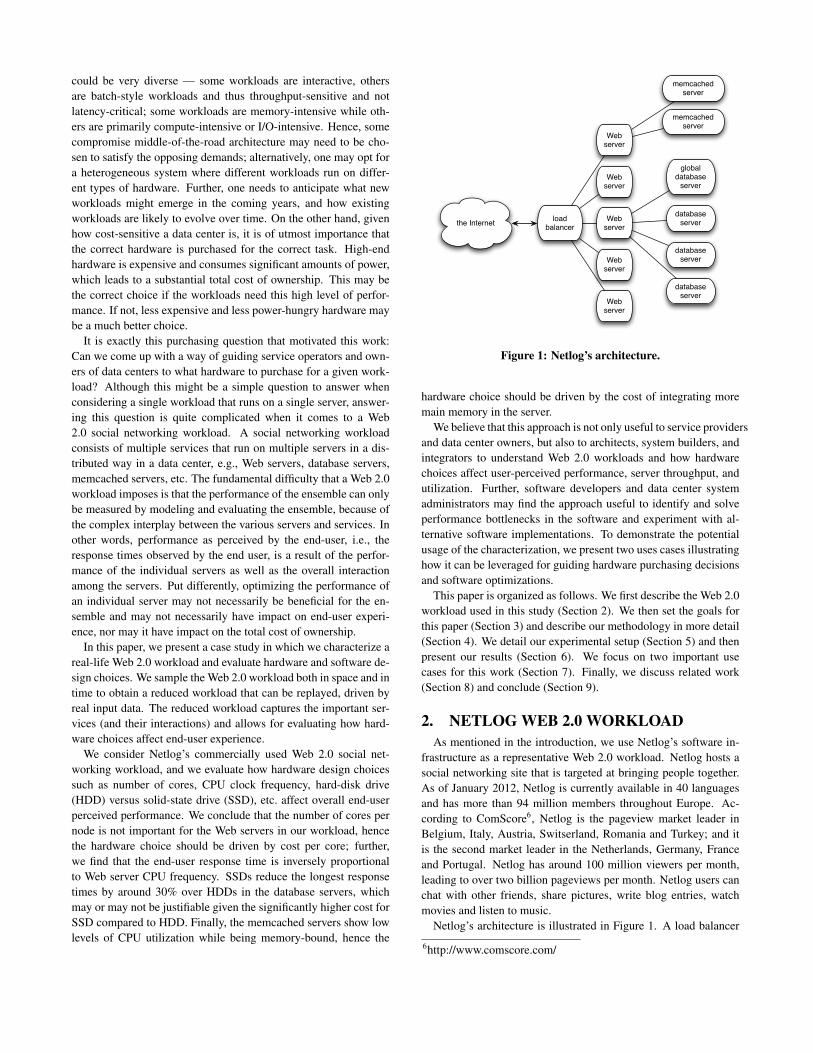
volves fine-tuning various software settings and configurations thatnecessitates proper validation. We validated our experimental frame-work both functionally and with respect to behavior and timing. Inparticular, we automatically verified whether the file sizes returnedby the duplicated workload match the file sizes observed in the realworkload. The reason for doing so is that some of the Web pagesreturned by the Web 2.0 workload are composed semi-randomly,and hence its content may not be perfectly identical when request-ing the same page multiple times. In our experimental environment,we found that 99.3% of the responses fall within a 5% error boundwith respect to file size compared to the real workload environment,as shown in Figure 2.
4.3 Replaying user requestsAn important aspect of the experimental environment is the re-
play of user requests. In order to do so, we collect user requests
0 10k 20k 30k 40k 50k 60k 70k0%
20%
40%
60%
80%
100%
Original Response SizeReplayed Response Size
Response Size (bytes)
Pro
ba
bili
ty (
%)
Figure 2: Distribution of response sizes when comparing realversus replayed requests.
as observed at the load balancer. The information collected by theuser input recorder consists of the following items — recall that thedata is anonymized:
• Header information. All HTTP header information is recordedso the same request can be reconstructed. This includes therequested URL, browser information, supported encoding for-mats, etc.
• Timing information. The date and time the request was sub-mitted is recorded (at microsecond resolution). This allowsfor maintaining precise timing information when replayingthe user request file. This is important to model bursty be-havior in user requests.
• User data. The input recorder captures all POST data thatis sent to the Web servers. Note that GET data is alreadycaptured as part of the URL in the header. All HTTP cookiesare saved as well, and are used to do automated login.
The file that contains these user requests is fairly large and con-tains 24 GB of data per day on average. Our user input recorderuses tcpdump11 to log the network traffic to a file in pcap12
format. pcap defines an API for capturing network traffic. OnLinux/Unix systems, this is implemented in the libpcap librarywhich most network tools like tcpdump, Wireshark, etc. imple-ment. A limitation of tcpdump/pcap is that it may drop pack-ets; however, packet loss rate was less than 0.002% for a 1 Gbpsnetwork in our setup.
The replayer reads the user request file and replays the requestsone by one. This means that the replayer picks the first request,sends the request to the Web 2.0 workload at the time specified inthe request file. It then picks the next request and sends it at itstime, etc. The replayer does not wait for the response to come backto determine the next request; all the requests are available in theuser request file.
Implementing the user request replayer is a challenge in itself.The reason is that the user request file is huge in size, and the re-quests need to be submitted to the workload at a fine time granu-larity. Reading the request file from disk, and submitting requestsin real-time is too slow. On the other hand, it is impractical to store
11http://www.tcpdump.org/12http://www.winpcap.org/ntar/draft/PCAP-DumpFileFormat.html

12 P
M
12 A
M
12 P
M
12
AM
12
PM
12 A
M
12 P
M
12 A
M
0102030405060708090
100T
raffi
c (R
eq
ue
sts/
s)
Figure 3: Netlog traffic profile for four days to the Slovene lan-guage domain.
the entire request file in main memory. We therefore developed atwo-thread replayer. The first thread reads the pcap file and fills inthe requests in the request pool in memory. The second thread thenreads from the request pool and submits the requests to the work-load using libcurl13, which is a client-side URL transfer librarythat supports sending requests using the HTTP protocol to a remoteWeb server.
4.4 Sampling in timeWe recorded four days (March 13–16, 2011) of user activity to
the Slovene language domain of the Netlog workload. This wasdone by capturing all the user requests (and their timing) at theload balancer. Replaying these four days of activity in real timewould require four days of experimentation time. Although thisis doable if one were to evaluate a single design point, exploringtrade-offs by varying hardware and/or software parameters, quicklyleads to impractically long experimentation times. We thereforeemploy sampling in time to evaluate only parts of the workloadactivity while being representative for the entire workload.
Figure 3 shows traffic over a four day period in number of re-quests per second. Clearly, we observe cyclic behavior in whichthere is much more activity in the evening than during the day.Traffic increases steeply in the morning between 6am and 9am, andremains somewhat stable or increases more slowly between 9 amand 5pm. Once past 5pm, traffic increases steeply until 8pm. Weobserve a sharp decrease in the number of requests past 9pm. Thistraffic pattern suggests that sampling in time is a sensible idea, i.e.,by picking samples that represent different traffic patterns, one cansignificantly reduce the load that needs to be replayed, which willlead to significant improvements in experimentation speed, whilereproducing a representative workload.
We set ourselves a number of goals for how to sample in time.We want the samples to be representative in a number of ways:we want the samples to represent diverse traffic intensity as wellas the sort of activity that the samples cover, i.e., as mentionedbefore, Netlog offers various sorts of services ranging from chat-ting to watching videos, etc., hence the samples should cover thesedifferent types of activity well. Further, we prefer having a fewlong representative samples over having many small samples. Thereason is that small samples require more precise warmup of thesystem than longer samples in order to be accurate.
We therefore employ the following two-step sampling proce-13http://curl.haxx.se/
Sunday Monday Tuesday Wednesday0
10
20
30
40
50
60
70
80
90
100
Tra
ffic
(Re
qu
est
s/s)
Warm-up Low Mid High
Figure 4: Identifying representative samples based on trafficintensity.
dure. We first aim at finding a number of time periods with dif-ferent traffic intensity. We employ k-means clustering as our clas-sification method [5]. The input to the clustering algorithm is atime series representing the number of requests per minute. Theclustering algorithm then aims at classifying this time series in anumber of clusters N . It initially picks N cluster centroids in arandom fashion, and assigns all data elements in the time series toits closest cluster. In the next iteration, the algorithm recomputesthe cluster centroid, and subsequently reassigns all data elements toclusters. This iterative process is repeated until convergence, or un-til a maximum number of iterations is done. An important questionis how many clusters N should one pick. We use the Bayesian In-formation Criterion (BIC) [9], which is a measure for how well theclustering matches the data. Using a maximum value of Nmax = 6
— recall we aim for a limited number of samples — we obtain theresult that N = 3 yields the optimum BIC score. Hence, we ob-tain three samples. These are shown in Figure 4. Intuitively, thesethree samples correspond to low-intensity, medium-intensity andhigh-intensity traffic, respectively.
The next question is how long the samples should be in these low,medium and high-intensity traffic regions. We therefore rely on oursecond requirement: we want the samples to cover diverse behaviorin terms of the type of traffic. We identify 30 major types of trafficincluding messages, photos, videos, friends, music, etc. This yieldsa 30-dimensional time series: each data element in the time seriesconsists of 30 values, namely the number of requests per minutefor each type of traffic. We then apply k-means clustering on this30-dimensional time series which yields the optimum number offour clusters using the BIC score. These four clusters represent thepredominant traffic rates observed at a given point in time. Figure 5illustrates how the time series of ten hours of the second day isdistributed across these four clusters. Interestingly, some trafficrates are more predominant during some periods of time, and trafficrate predominance varies fairly quickly. However, if we take a longenough snapshot, e.g., two hours, the sample contains all trafficrates. The end result for sampling in time, thus is that we pickthree samples of two hours of activity from the low, medium andhigh-intensity regions.
4.5 WarmupWith sampling in time, an important issue is how to start from a
warmed-up system state so that the performance numbers that weobtain from our experiments are representative for the real work-

0 2 4 6 8 100
1
2
3
Time (h)
We
bp
ag
e c
ate
go
ry
Figure 5: Traffic classified by its type.
0 500 1000 1500 2000 25000%
2%
4%
6%
8%
10%
Number of replayed requests
CP
U L
oa
d (
%)
Figure 6: Quantifying PHP cache warmup behavior. Replayspeed is set to a fixed rate of 10 requests/s.
load. Clearly, starting from a cold state is not going to be accu-rate because the performance of the workload will be very differ-ent from what one would observe in a real (and warmed-up) en-vironment. Warmup of a Web 2.0 workload involves a numberof issues. First, as mentioned before, the Web servers run PHPcode, and hence they rely on an opcode cache that caches the byte-codes; the PHP engine does not need to interpret cached bytecodesagain, and hence it achieves better performance. This implies thatthe performance of the PHP engine is relatively low initially, butthen improves gradually as more and more code gets cached andoptimized; this is obviously reflected in the Web server responsetimes observed by the end user. In other words, in the context ofthis work, it is important that we measure the performance of thePHP engine in steady-state modus, in which it executes highly op-timized code as opposed to interpreting the PHP code. As shownin Figure 6, the CPU load is higher when the PHP engine is firstinitialized. In this stage, the PHP engine still has to compile allPHP code. After 1,000 requests most PHP pages are compiled andloaded into the cache, hence, we conclude that the PHP cache iswarmed up in the order of a couple seconds.
Second, and more importantly, we also need to warm up thememcached and database servers. Initially, in a cold system, allthe requests will go to the database server because the memcachedserver does not cache any data yet; further, the database server willneed to read from disk to access the database. Hence, we will ob-serve a significant fraction of time spent waiting for I/O both overthe network and for accessing disks. Indeed, gigabytes of data needto be read in the database and transferred from the database serversto a memcached server. This requires a large number of user re-
0 2 4 6 8 10 12 14 16 18 20 22 2405
10152025303540
Time (h)
IO W
ait
time
(%
)
Figure 7: Quantifying how long one needs to warmup thedatabase and memcached servers: I/O wait time on thedatabase server is shown as a function of time when replayingthe first day.
quests being sent to the system to warmup the database and mem-cached servers. Figure 7 illustrates the fraction I/O wait time onthe database server starting from a cold state as a function of time.We observe that the fraction I/O wait time, which is proportionalto how often one needs to access the database on disk and trans-fer data to the memcached server, decreases as a function of time.Although there is a steep decrease in I/O wait time in the first fewhours, it takes close to an entire day before I/O wait time dropsbelow a few percent which represents a fully warmed up system.
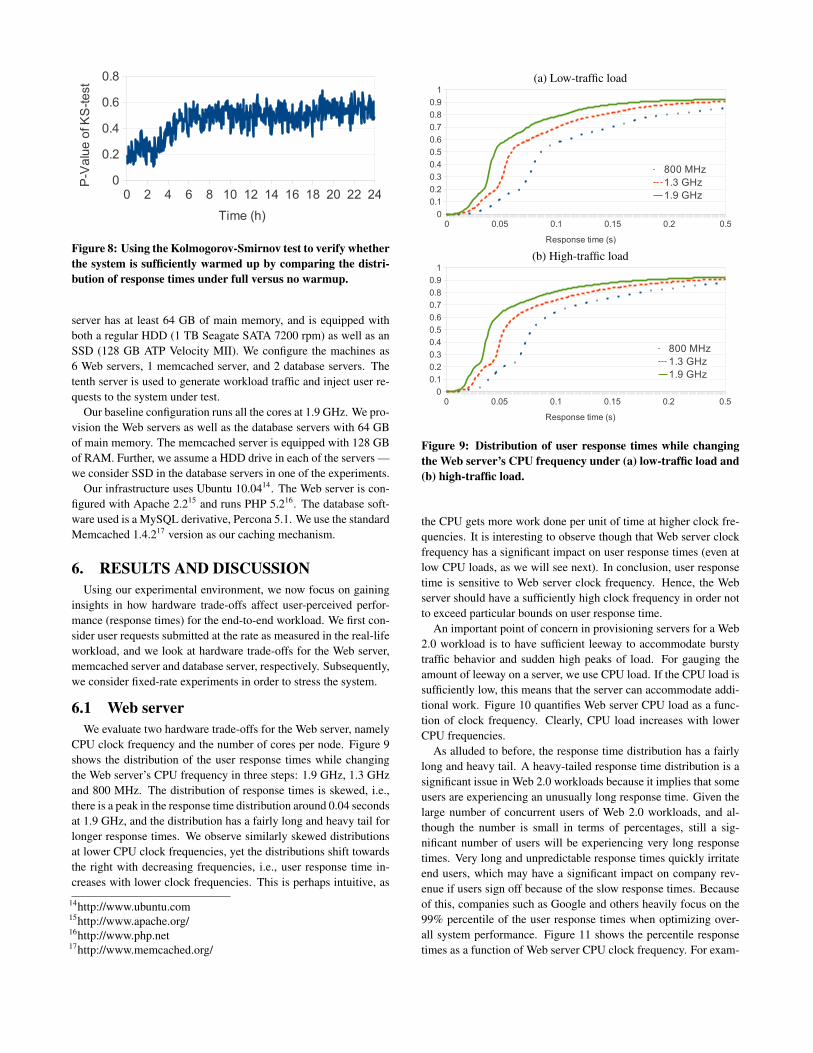
In order to get more confidence in this finding we employ theKolmogorov-Smirnov statistical test to verify whether the systemis sufficiently warmed up. The Kolmogorov-Smirnov test is a non-parametric test for the equality of continuous, one-dimensional prob-ability distributions. It basically measures whether two distribu-tions are equal or not; the exact form of the distribution is not im-portant, hence it is labeled a non-parametric test. In this work, wecompare the distribution of user response times starting from a coldversus a warmed-up system. This is done in steps of 5,000 userrequests, see Figure 8. The P -value reported by the Kolmogorov-Smirnov test gives an estimate for how good the correspondence isbetween starting from no-warmup versus a fully warmed up sys-tem; the P -value is a higher-is-better metric. We observe that theP -value saturates after approximately six hours of warmup, andreaches its highest score after 18 to 20 hours of warmup. Based onthese observations we decided to warm up our experimental systemwith one full day of load.
Note that, in our experimental environment, it does not take afull day to actually warmup the entire system. During warmup, wequickly submit an entire day’s user requests to the Netlog workload,as fast as possible. This takes approximately two hours in our setup.Once the system is warmed up, we then submit user requests for thesample of interest at the time stamps as stored in the user requestfile, as explained before.
5. EXPERIMENTAL SETUPAs mentioned before, we duplicated the Slovene language do-
main of the Netlog workload to our experimental environment. Ourinfrastructure consists of 10 dual AMD Opteron 6168 servers, witheach server having 24 cores in total or 12 cores per CPU. Each
0 2 4 6 8 10 12 14 16 18 20 22 240
0.2
0.4
0.6
0.8
Time (h)
P-V
alu
e o
f KS
-te
st
Figure 8: Using the Kolmogorov-Smirnov test to verify whetherthe system is sufficiently warmed up by comparing the distri-bution of response times under full versus no warmup.
server has at least 64 GB of main memory, and is equipped withboth a regular HDD (1 TB Seagate SATA 7200 rpm) as well as anSSD (128 GB ATP Velocity MII). We configure the machines as6 Web servers, 1 memcached server, and 2 database servers. Thetenth server is used to generate workload traffic and inject user re-quests to the system under test.
Our baseline configuration runs all the cores at 1.9 GHz. We pro-vision the Web servers as well as the database servers with 64 GBof main memory. The memcached server is equipped with 128 GBof RAM. Further, we assume a HDD drive in each of the servers —we consider SSD in the database servers in one of the experiments.
Our infrastructure uses Ubuntu 10.0414. The Web server is con-figured with Apache 2.215 and runs PHP 5.216. The database soft-ware used is a MySQL derivative, Percona 5.1. We use the standardMemcached 1.4.217 version as our caching mechanism.
6. RESULTS AND DISCUSSIONUsing our experimental environment, we now focus on gaining
insights in how hardware trade-offs affect user-perceived perfor-mance (response times) for the end-to-end workload. We first con-sider user requests submitted at the rate as measured in the real-lifeworkload, and we look at hardware trade-offs for the Web server,memcached server and database server, respectively. Subsequently,we consider fixed-rate experiments in order to stress the system.
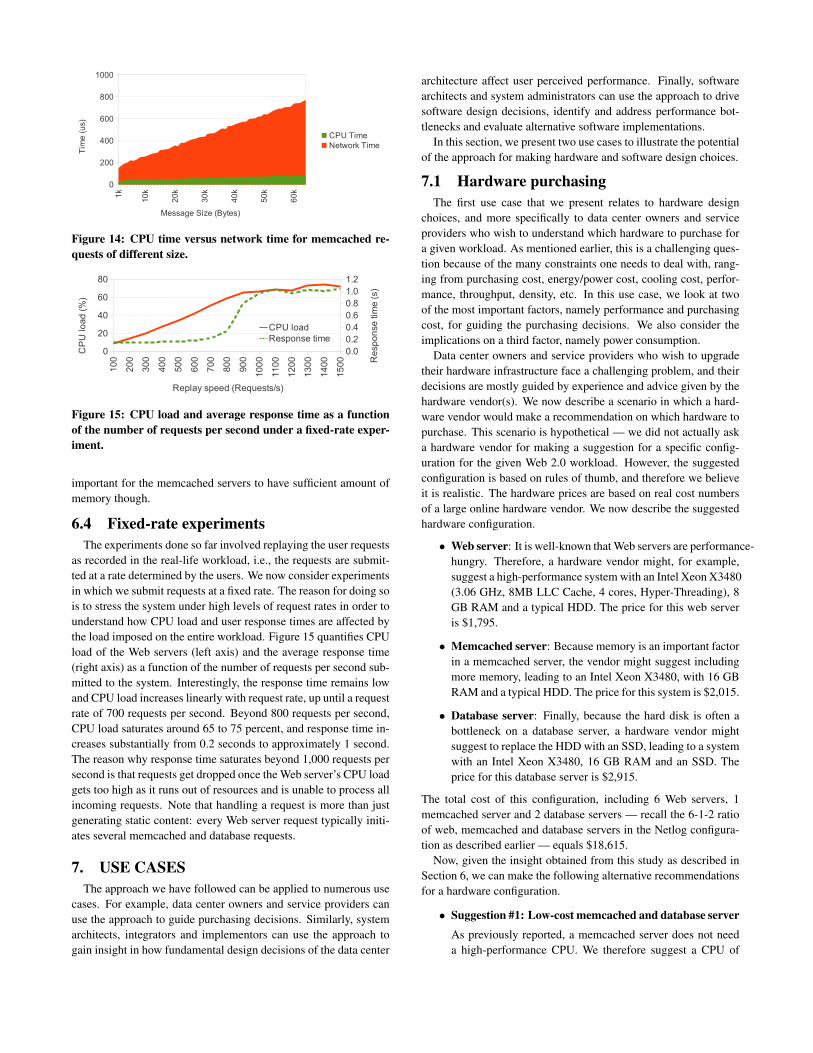
6.1 Web serverWe evaluate two hardware trade-offs for the Web server, namely
CPU clock frequency and the number of cores per node. Figure 9shows the distribution of the user response times while changingthe Web server’s CPU frequency in three steps: 1.9 GHz, 1.3 GHzand 800 MHz. The distribution of response times is skewed, i.e.,there is a peak in the response time distribution around 0.04 secondsat 1.9 GHz, and the distribution has a fairly long and heavy tail forlonger response times. We observe similarly skewed distributionsat lower CPU clock frequencies, yet the distributions shift towardsthe right with decreasing frequencies, i.e., user response time in-creases with lower clock frequencies. This is perhaps intuitive, as
14http://www.ubuntu.com15http://www.apache.org/16http://www.php.net17http://www.memcached.org/
(a) Low-traffic load
0 0.05 0.1 0.15 0.2 0.50
0.1
0.2
0.3
0.4
0.5
0.6
0.7
0.8
0.9
1
800 MHz1.3 GHz1.9 GHz
Response time (s)
(b) High-traffic load
0 0.05 0.1 0.15 0.2 0.50
0.1
0.2
0.3
0.4
0.5
0.6
0.7
0.8
0.9
1
800 MHz1.3 GHz1.9 GHz
Response time (s)
Figure 9: Distribution of user response times while changingthe Web server’s CPU frequency under (a) low-traffic load and(b) high-traffic load.
the CPU gets more work done per unit of time at higher clock fre-quencies. It is interesting to observe though that Web server clockfrequency has a significant impact on user response times (even atlow CPU loads, as we will see next). In conclusion, user responsetime is sensitive to Web server clock frequency. Hence, the Webserver should have a sufficiently high clock frequency in order notto exceed particular bounds on user response time.
An important point of concern in provisioning servers for a Web2.0 workload is to have sufficient leeway to accommodate burstytraffic behavior and sudden high peaks of load. For gauging theamount of leeway on a server, we use CPU load. If the CPU load issufficiently low, this means that the server can accommodate addi-tional work. Figure 10 quantifies Web server CPU load as a func-tion of clock frequency. Clearly, CPU load increases with lowerCPU frequencies.
As alluded to before, the response time distribution has a fairlylong and heavy tail. A heavy-tailed response time distribution is asignificant issue in Web 2.0 workloads because it implies that someusers are experiencing an unusually long response time. Given thelarge number of concurrent users of Web 2.0 workloads, and al-though the number is small in terms of percentages, still a sig-nificant number of users will be experiencing very long responsetimes. Very long and unpredictable response times quickly irritateend users, which may have a significant impact on company rev-enue if users sign off because of the slow response times. Becauseof this, companies such as Google and others heavily focus on the99% percentile of the user response times when optimizing over-all system performance. Figure 11 shows the percentile responsetimes as a function of Web server CPU clock frequency. For exam-

800 MHz 1.3 GHz 1.9 GHz0
2
4
6
8
10
12
14C
PU
loa
d (
%)
Figure 10: Web server CPU load as a function of CPU clockfrequency for the high-traffic load scenario.
1900 1300 8000
0.5
1
1.5
2
2.5
3
50.0%75.0%87.5%93.8%96.9%98.4%99.2%99.6%
Clock frequency (MHz)
Re
spo
nse
tim
e (
s) 54%
Figure 11: Percentile response times as a function of Webserver CPU clock frequency.
ple, this graph shows that, see the top left, 99.6% of the responsetimes are below 1.8 seconds at 1.9GHz. The 99.6% percentile goesup to 2.8 seconds at 800MHz, see the top right. The interesting ob-servation is that long-latency response times increase sub-linearlywith decreasing Web server clock frequency. The 99.6% percentileresponse time increases by 54% only, while decreasing clock fre-quency from 1.9GHz to 800MHz, or increasing cycle time by 138%from 0.53ns to 1.25ns.
The second hardware trade-off that we study relates to the num-ber of cores per node one should have for the Web server. The rea-son why this is an interesting trade-off is that systems with moresockets per node are more expensive, i.e., a four-socket systemis typically more than twice as expensive as a two-socket system.Similarly, the number of cores per CPU also directly relates to cost.Figure 12 quantifies Web server CPU load as a function of the num-ber of nodes and the number of cores per node. (Recall that CPUload is a good proxy for user response time as observed.) We varyfrom one Web server node with 24 cores enabled, to 2 nodes and12 cores each, to 4 nodes and 6 cores each, to 6 nodes and 4 coreseach. Clearly, CPU load (and response time) is not affected muchby node and core count (as long as the total number of cores is con-stant). This suggests that the Web server is a workload that scaleswell with core count, even across nodes. In conclusion, when pur-chasing Web server hardware, although total core count is impor-tant, core count per node is not. This is an important insight to takeinto account when determining how many servers to buy with howmany cores each. Determining the best buy (number of servers andnumber of cores per server) depends on many factors such as per-formance, power cost, real estate cost, reliability, availability, etc.,
1x24 cores 2x12 cores 4x6 cores 6x4 cores0.00
10.00
20.00
30.00
40.00
50.00
CP
U lo
ad
(%
)
Figure 12: Web server CPU load as a function of the number ofnodes and cores per node: m × n means m nodes and n coresper node.
800 – hdd 1900 – hdd 800 – ssd 1900 – ssd0
0.5
1
1.5
2
50.0%75.0%87.5%93.8%96.9%98.4%99.2%99.6%R
esp
on
se T
ime
(s) 30%
Figure 13: Trading off HDD versus SSD and CPU clock fre-quency for the database servers.
however, this case study shows that the number of cores per serveris a parameter one can tweak to optimize Web server performanceper dollar.
6.2 Database serverAs mentioned before, the database servers generate substantial
disk I/O activity. We therefore focus on a hardware trade-off thatinvolves HDDs versus SSDs in the database servers. We also varyCPU clock frequency. Figure 13 quantifies the percentile responsetimes for the four hardware design points that result from changingclock frequency and hard drives. We observe that, while short re-sponse times are not greatly affected by replacing the HDD with anSSD, the 99.6% percentile response time decreases by 30% whentrading an HDD for an SSD. Although this is a significant reduc-tion in the longest response times observed, it may not justify thesignificantly higher cost of SSD versus HDD.
6.3 Memcached serverThe memcached server has a very low typical CPU load, and is
primarily memory and network-bound. The average CPU load forthe memcached server is typically below 5% when stressed with6 Web servers. Figure 14 shows CPU time versus network timefor a memcached experiment in which we generate memcachedGET requests of varying size, more specifically, the responses ofthe GET requests are of varying size. This clearly shows that mem-cached performance is mainly determined by the network. Hence,CPU performance for the memcached servers is not critical, andone could for example deploy relatively inexpensive servers. It is
1k
10
k
20
k
30k
40
k
50k
60
k
0
200
400
600
800
1000
CPU TimeNetwork Time
Message Size (Bytes)
Tim
e (
us)
Figure 14: CPU time versus network time for memcached re-quests of different size.
10
0
200
30
0
40
0
500
60
0
70
0
800
900
10
00
110
0
120
0
13
00
14
00
150
00
20
40
60
80
0.00.20.40.60.81.01.2
CPU loadResponse time
Replay speed (Requests/s)
CP
U lo
ad
(%
)
Re
spo
nse
tim
e (
s)
Figure 15: CPU load and average response time as a functionof the number of requests per second under a fixed-rate exper-iment.
important for the memcached servers to have sufficient amount ofmemory though.
6.4 Fixed-rate experimentsThe experiments done so far involved replaying the user requests
as recorded in the real-life workload, i.e., the requests are submit-ted at a rate determined by the users. We now consider experimentsin which we submit requests at a fixed rate. The reason for doing sois to stress the system under high levels of request rates in order tounderstand how CPU load and user response times are affected bythe load imposed on the entire workload. Figure 15 quantifies CPUload of the Web servers (left axis) and the average response time(right axis) as a function of the number of requests per second sub-mitted to the system. Interestingly, the response time remains lowand CPU load increases linearly with request rate, up until a requestrate of 700 requests per second. Beyond 800 requests per second,CPU load saturates around 65 to 75 percent, and response time in-creases substantially from 0.2 seconds to approximately 1 second.The reason why response time saturates beyond 1,000 requests persecond is that requests get dropped once the Web server’s CPU loadgets too high as it runs out of resources and is unable to process allincoming requests. Note that handling a request is more than justgenerating static content: every Web server request typically initi-ates several memcached and database requests.
7. USE CASESThe approach we have followed can be applied to numerous use
cases. For example, data center owners and service providers canuse the approach to guide purchasing decisions. Similarly, systemarchitects, integrators and implementors can use the approach togain insight in how fundamental design decisions of the data center
architecture affect user perceived performance. Finally, softwarearchitects and system administrators can use the approach to drivesoftware design decisions, identify and address performance bot-tlenecks and evaluate alternative software implementations.
In this section, we present two use cases to illustrate the potentialof the approach for making hardware and software design choices.
7.1 Hardware purchasingThe first use case that we present relates to hardware design
choices, and more specifically to data center owners and serviceproviders who wish to understand which hardware to purchase fora given workload. As mentioned earlier, this is a challenging ques-tion because of the many constraints one needs to deal with, rang-ing from purchasing cost, energy/power cost, cooling cost, perfor-mance, throughput, density, etc. In this use case, we look at twoof the most important factors, namely performance and purchasingcost, for guiding the purchasing decisions. We also consider theimplications on a third factor, namely power consumption.
Data center owners and service providers who wish to upgradetheir hardware infrastructure face a challenging problem, and theirdecisions are mostly guided by experience and advice given by thehardware vendor(s). We now describe a scenario in which a hard-ware vendor would make a recommendation on which hardware topurchase. This scenario is hypothetical — we did not actually aska hardware vendor for making a suggestion for a specific config-uration for the given Web 2.0 workload. However, the suggestedconfiguration is based on rules of thumb, and therefore we believeit is realistic. The hardware prices are based on real cost numbersof a large online hardware vendor. We now describe the suggestedhardware configuration.
• Web server: It is well-known that Web servers are performance-hungry. Therefore, a hardware vendor might, for example,suggest a high-performance system with an Intel Xeon X3480(3.06 GHz, 8MB LLC Cache, 4 cores, Hyper-Threading), 8GB RAM and a typical HDD. The price for this web serveris $1,795.
• Memcached server: Because memory is an important factorin a memcached server, the vendor might suggest includingmore memory, leading to an Intel Xeon X3480, with 16 GBRAM and a typical HDD. The price for this system is $2,015.
• Database server: Finally, because the hard disk is often abottleneck on a database server, a hardware vendor mightsuggest to replace the HDD with an SSD, leading to a systemwith an Intel Xeon X3480, 16 GB RAM and an SSD. Theprice for this database server is $2,915.
The total cost of this configuration, including 6 Web servers, 1memcached server and 2 database servers — recall the 6-1-2 ratioof web, memcached and database servers in the Netlog configura-tion as described earlier — equals $18,615.
Now, given the insight obtained from this study as described inSection 6, we can make the following alternative recommendationsfor a hardware configuration.
• Suggestion #1: Low-cost memcached and database server
As previously reported, a memcached server does not needa high-performance CPU. We therefore suggest a CPU of
Suggestion #1 Suggestion #20.0
0.2
0.4
0.6
0.8
1.0
1.2
1.4
PerformancePerformance / Server costPerformance / WattPerformance / TCOPerformance / TCO²
Figure 16: Several performance trade-offs for different hard-ware suggestions compared to the hardware vendor suggestion.
the same class as proposed by the hardware vendor, but at alower clock frequency (e.g., Intel Xeon X3440 at 2.53 GHz).The same is true for the database server. On top of that wesuggest not to consider an SSD, because of its high cost andrelatively low performance gain over HDD for this particularworkload.
The lower price for the CPU makes the memcached and databaseserver cost $1,445 each. The total price of our suggested con-figuration now equals $15,105. This means a purchasing costreduction of 18.9%.
Using the results presented in Figure 13, we conclude that,using this configuration, 50% of all requests will not expe-rience any extra latency. For the other 50% of the requests,response times would increase from 11% for the 75% per-centile to 39% for the 99.6% percentile. In summary, per-formance as perceived by the end user would be reduced by9.1% on average. It is then up to the service provider to bal-ance the purchase cost against the loss in performance for asmall fraction of the user requests.
• Suggestion #2: Low-frequency Web server
We can go one step further and use a CPU at lower clockfrequency for the Web servers as well (Intel Xeon X3440 at2.53 GHz). The price of the Web server is now $1,225. Thiscould mean a total purchasing cost reduction of 37.2% overthe hardware vendor suggested configuration.
User requests would now observe a latency increase by 29%for the 50% percentile, and up to 56% for the 99.6% per-centile. On average, end-user performance would be reducedby 36.9%. Again, it is up to the service provider to deter-mine whether this loss in performance is worth the reductionin cost.
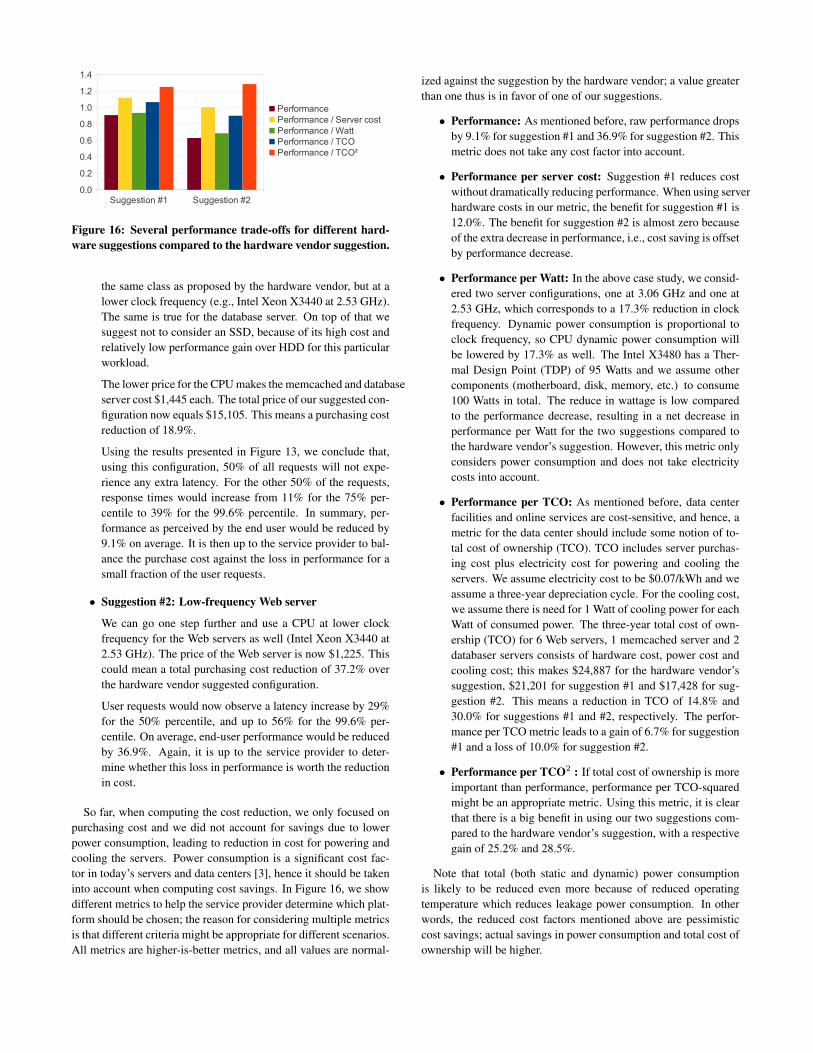
So far, when computing the cost reduction, we only focused onpurchasing cost and we did not account for savings due to lowerpower consumption, leading to reduction in cost for powering andcooling the servers. Power consumption is a significant cost fac-tor in today’s servers and data centers [3], hence it should be takeninto account when computing cost savings. In Figure 16, we showdifferent metrics to help the service provider determine which plat-form should be chosen; the reason for considering multiple metricsis that different criteria might be appropriate for different scenarios.All metrics are higher-is-better metrics, and all values are normal-
ized against the suggestion by the hardware vendor; a value greaterthan one thus is in favor of one of our suggestions.
• Performance: As mentioned before, raw performance dropsby 9.1% for suggestion #1 and 36.9% for suggestion #2. Thismetric does not take any cost factor into account.
• Performance per server cost: Suggestion #1 reduces costwithout dramatically reducing performance. When using serverhardware costs in our metric, the benefit for suggestion #1 is12.0%. The benefit for suggestion #2 is almost zero becauseof the extra decrease in performance, i.e., cost saving is offsetby performance decrease.
• Performance per Watt: In the above case study, we consid-ered two server configurations, one at 3.06 GHz and one at2.53 GHz, which corresponds to a 17.3% reduction in clockfrequency. Dynamic power consumption is proportional toclock frequency, so CPU dynamic power consumption willbe lowered by 17.3% as well. The Intel X3480 has a Ther-mal Design Point (TDP) of 95 Watts and we assume othercomponents (motherboard, disk, memory, etc.) to consume100 Watts in total. The reduce in wattage is low comparedto the performance decrease, resulting in a net decrease inperformance per Watt for the two suggestions compared tothe hardware vendor’s suggestion. However, this metric onlyconsiders power consumption and does not take electricitycosts into account.
• Performance per TCO: As mentioned before, data centerfacilities and online services are cost-sensitive, and hence, ametric for the data center should include some notion of to-tal cost of ownership (TCO). TCO includes server purchas-ing cost plus electricity cost for powering and cooling theservers. We assume electricity cost to be $0.07/kWh and weassume a three-year depreciation cycle. For the cooling cost,we assume there is need for 1 Watt of cooling power for eachWatt of consumed power. The three-year total cost of own-ership (TCO) for 6 Web servers, 1 memcached server and 2databaser servers consists of hardware cost, power cost andcooling cost; this makes $24,887 for the hardware vendor’ssuggestion, $21,201 for suggestion #1 and $17,428 for sug-gestion #2. This means a reduction in TCO of 14.8% and30.0% for suggestions #1 and #2, respectively. The perfor-mance per TCO metric leads to a gain of 6.7% for suggestion#1 and a loss of 10.0% for suggestion #2.
• Performance per TCO2 : If total cost of ownership is moreimportant than performance, performance per TCO-squaredmight be an appropriate metric. Using this metric, it is clearthat there is a big benefit in using our two suggestions com-pared to the hardware vendor’s suggestion, with a respectivegain of 25.2% and 28.5%.
Note that total (both static and dynamic) power consumptionis likely to be reduced even more because of reduced operatingtemperature which reduces leakage power consumption. In otherwords, the reduced cost factors mentioned above are pessimisticcost savings; actual savings in power consumption and total cost ofownership will be higher.
In summary, this case study illustrated evaluating hardware de-sign choices in the data center, enabling service providers, data cen-ter owners, as well as system architects to make trade-offs takinginto account end-user performance of a Web 2.0 workload.
7.2 Software optimizationsWhereas the first use case considered a hardware design trade-
off, our second use case illustrates the potential for driving soft-ware trade-offs and analyses. The reason why this is valuable isthat setting up such experiments in a live data center is consideredto be too risky because it might interrupt normal operation. Ourapproach on the other hand allows for setting up such experimentsin a controlled environment while being able to apply real-life userrequests.
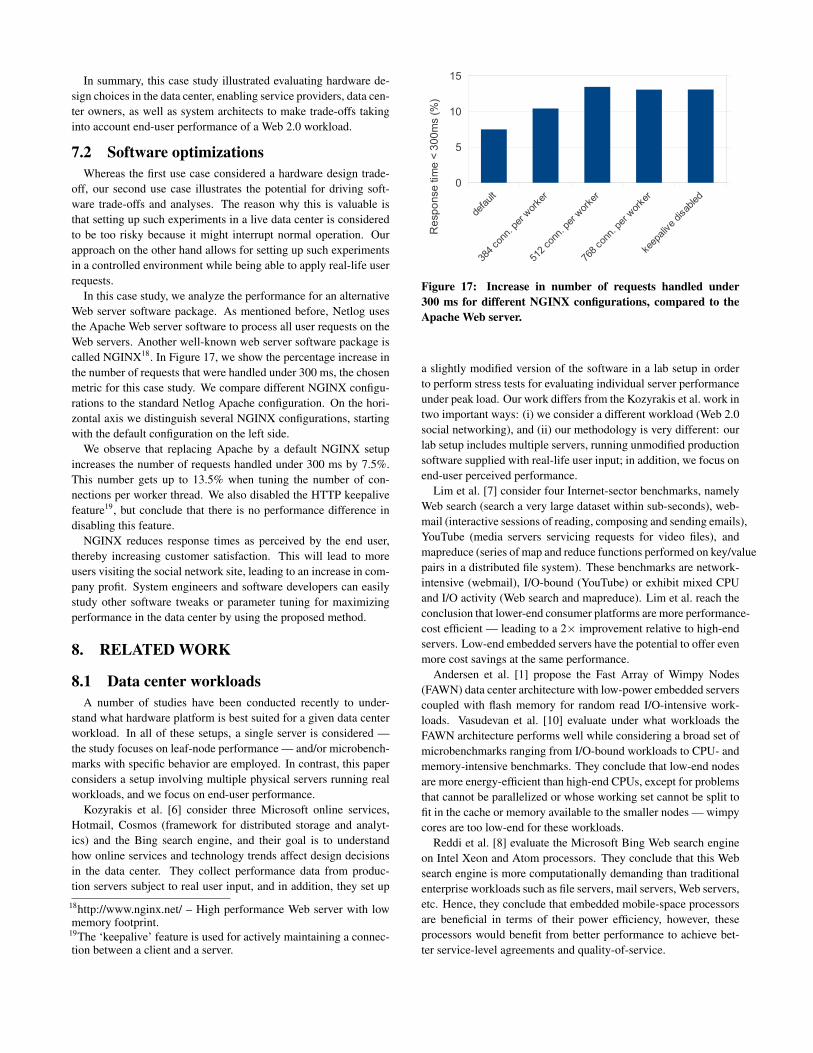
In this case study, we analyze the performance for an alternativeWeb server software package. As mentioned before, Netlog usesthe Apache Web server software to process all user requests on theWeb servers. Another well-known web server software package iscalled NGINX18. In Figure 17, we show the percentage increase inthe number of requests that were handled under 300 ms, the chosenmetric for this case study. We compare different NGINX configu-rations to the standard Netlog Apache configuration. On the hori-zontal axis we distinguish several NGINX configurations, startingwith the default configuration on the left side.
We observe that replacing Apache by a default NGINX setupincreases the number of requests handled under 300 ms by 7.5%.This number gets up to 13.5% when tuning the number of con-nections per worker thread. We also disabled the HTTP keepalivefeature19, but conclude that there is no performance difference indisabling this feature.
NGINX reduces response times as perceived by the end user,thereby increasing customer satisfaction. This will lead to moreusers visiting the social network site, leading to an increase in com-pany profit. System engineers and software developers can easilystudy other software tweaks or parameter tuning for maximizingperformance in the data center by using the proposed method.
8. RELATED WORK
8.1 Data center workloadsA number of studies have been conducted recently to under-
stand what hardware platform is best suited for a given data centerworkload. In all of these setups, a single server is considered —the study focuses on leaf-node performance — and/or microbench-marks with specific behavior are employed. In contrast, this paperconsiders a setup involving multiple physical servers running realworkloads, and we focus on end-user performance.
Kozyrakis et al. [6] consider three Microsoft online services,Hotmail, Cosmos (framework for distributed storage and analyt-ics) and the Bing search engine, and their goal is to understandhow online services and technology trends affect design decisionsin the data center. They collect performance data from produc-tion servers subject to real user input, and in addition, they set up
18http://www.nginx.net/ – High performance Web server with lowmemory footprint.
19The ‘keepalive’ feature is used for actively maintaining a connec-tion between a client and a server.
keep
alive
disa
bled
768
conn
. per
wor
ker
512
conn
. per
wor
ker
384
conn
. per
wor
ker
defa
ult0
5
10
15
Re
spo
nse
tim
e <
30
0m
s (%
)
Figure 17: Increase in number of requests handled under300 ms for different NGINX configurations, compared to theApache Web server.
a slightly modified version of the software in a lab setup in orderto perform stress tests for evaluating individual server performanceunder peak load. Our work differs from the Kozyrakis et al. work intwo important ways: (i) we consider a different workload (Web 2.0social networking), and (ii) our methodology is very different: ourlab setup includes multiple servers, running unmodified productionsoftware supplied with real-life user input; in addition, we focus onend-user perceived performance.
Lim et al. [7] consider four Internet-sector benchmarks, namelyWeb search (search a very large dataset within sub-seconds), web-mail (interactive sessions of reading, composing and sending emails),YouTube (media servers servicing requests for video files), andmapreduce (series of map and reduce functions performed on key/valuepairs in a distributed file system). These benchmarks are network-intensive (webmail), I/O-bound (YouTube) or exhibit mixed CPUand I/O activity (Web search and mapreduce). Lim et al. reach theconclusion that lower-end consumer platforms are more performance-cost efficient — leading to a 2× improvement relative to high-endservers. Low-end embedded servers have the potential to offer evenmore cost savings at the same performance.
Andersen et al. [1] propose the Fast Array of Wimpy Nodes(FAWN) data center architecture with low-power embedded serverscoupled with flash memory for random read I/O-intensive work-loads. Vasudevan et al. [10] evaluate under what workloads theFAWN architecture performs well while considering a broad set ofmicrobenchmarks ranging from I/O-bound workloads to CPU- andmemory-intensive benchmarks. They conclude that low-end nodesare more energy-efficient than high-end CPUs, except for problemsthat cannot be parallelized or whose working set cannot be split tofit in the cache or memory available to the smaller nodes — wimpycores are too low-end for these workloads.
Reddi et al. [8] evaluate the Microsoft Bing Web search engineon Intel Xeon and Atom processors. They conclude that this Websearch engine is more computationally demanding than traditionalenterprise workloads such as file servers, mail servers, Web servers,etc. Hence, they conclude that embedded mobile-space processorsare beneficial in terms of their power efficiency, however, theseprocessors would benefit from better performance to achieve bet-ter service-level agreements and quality-of-service.
8.2 SamplingSampling is not a novel method in performance analysis. Some
of the prior work mentioned above focuses on leaf-node perfor-mance, an example of sampling in space. Sampling in time is heav-ily used in architectural simulation. Current benchmarks executehundreds of billions, if not trillions, of instructions, and detailedcycle-accurate simulation is too slow to efficiently simulate theseworkloads in a reasonable amount of time. This problem is furtherexacerbated given the surge of multi-core processor architectures,i.e., multiple cores and their interactions need to simulated, whichis challenging given that most cycle-accurate simulators are single-threaded.
Sampled simulation takes a number of samples from the dynamicinstruction stream and only simulates these samples in great detail.Conte et al. [4] were the first to use sampling for processor simu-lation. They select samples randomly and use statistics theory tobuild confidence bounds. Further, they quantify what fraction ofthe sampling error comes from the sampling itself (sampling bias)versus the fraction of the error due to imperfect state at the be-ginning of each sample (non-sampling bias or cold-start problem).Wunderlich et al. [11] employ periodic sampling and very smallsamples while keeping the cache and predictor structures ‘warm’,i.e., cache and predictor state is simulated, while fast-forwardingbetween samples.
Whereas both the Conte et al. as well as the Wunderlich et al. ap-proaches select a large number of samples and rely on statistics toevaluate the representativeness of the samples, Sherwood et al. [9]employ knowledge about program structure and its execution todetermine representative samples. They collect program statistics,e.g., basic block vectors (BBVs), during a profiling run, and theythen rely on clustering to determine a set of representative samples.The approach taken in this paper is similar to Sherwood et al. al-though we take different workload statistics as input to the sampleselection algorithm, while considering server workloads rather thanCPU workloads.
9. CONCLUSIONIn this paper, we presented a case study in which we charac-
terized a real-life Web 2.0 workload and evaluated hardware andsoftware design choices in the data center. Our methodology sam-ples the Web 2.0 workload both in space and in time to obtain areduced workload that can be replayed, driven by input data cap-tured from a real data center. The reduced workload captures theimportant services (and their interactions) and allows for evaluat-ing how hardware and software choices affect end-user experience(response times).
The real-life Web 2.0 workload used in this work is Netlog, apopular and commercially deployed social networking site witha large user base in Europe. We explored hardware trade-offs interms of core count, clock frequency, HDD versus SSD, etc., forthe Web, memcached and database servers, and we obtain severalinteresting insights, such as the Web servers scale well with corecount, and end-user response times are inversely proportional toWeb server CPU frequency; an SSD reduces the longest responsetimes by around 30% over an HDD in the database servers, which
may or may not be justifiable given the significantly higher cost forSSD versus; memcached servers show low levels of CPU utiliza-tion, and are both memory and network-bound, hence, hardwarechoice should be driven by the cost of integrating more main mem-ory in the server. Further, we presented two case studies illustratinghow the method can be used for guiding hardware purchasing de-cisions as well as software optimizations.
AcknowledgementsWe thank the anonymous reviewers for their constructive and in-sightful feedback. Stijn Polfliet is supported through a doctoralfellowship by the Agency for Innovation by Science and Tech-nology (IWT). Frederick Ryckbosch is supported through a doc-toral fellowship by the Research Foundation–Flanders (FWO). Ad-ditional support is provided by the FWO projects G.0255.08, andG.0179.10, the UGent-BOF projects 01J14407 and 01Z04109, andthe European Research Council under the European Community’sSeventh Framework Programme (FP7/2007-2013) / ERC Grant agree-ment no. 259295.
10. REFERENCES[1] D. G. Andersen, J. Franklin, M. Kaminsky, A. Phanishayee, L. Tan,
and V. Vasudevan. FAWN: A fast array of wimpy nodes. InProceedings of the International ACM Symposium on OperatingSystems Principles (SOSP), pages 1–14, Oct. 2009.
[2] L. A. Barroso, J. Dean, and U. Hölzle. Web search for a planet: Thegoogle cluster architecture. IEEE Micro, 23(2):22–28, Mar. 2003.
[3] L. A. Barroso and U. Hölzle. The Datacenter as a Computer: AnIntroduction to the Design of Warehouse-Scale Machines. SynthesisLectures on Computer Architecture. Morgan and ClaypoolPublishers, 2009.
[4] T. M. Conte, M. A. Hirsch, and K. N. Menezes. Reducing state lossfor effective trace sampling of superscalar processors. InProceedings of the International Conference on Computer Design(ICCD), pages 468–477, Oct. 1996.
[5] R. A. Johnson and D. W. Wichern. Applied Multivariate StatisticalAnalysis. Prentice Hall, fifth edition, 2002.
[6] C. Kozyrakis, A. Kansal, S. Sankar, and K. Vaid. Server engineeringinsights for large-scale online services. IEEE Micro, 30:8–19,July/August 2010.
[7] K. Lim, P. Ranganathan, J. Chang, C. Patel, T. Mudge, andS. Reinhardt. Understanding and designing new server architecturesfor emerging warehouse-computing environments. In Proceedings ofthe International Symposium on Computer Architecture (ISCA),pages 315–326, June 2008.
[8] V. J. Reddi, B. C. Lee, T. Chilimbi, and K. Vaid. Web search usingmobile cores: Quantifying and mitigating the price of efficiency. InProceedings of the International Symposium on ComputerArchitecture (ISCA), pages 26–36, June 2010.
[9] T. Sherwood, E. Perelman, G. Hamerly, and B. Calder.Automatically characterizing large scale program behavior. InProceedings of the International Conference on ArchitecturalSupport for Programming Languages and Operating Systems(ASPLOS), pages 45–57, Oct. 2002.
[10] V. Vasudevan, D. Andersen, M. Kaminsky, L. Tan, J. Franklin, andI. Moraru. Energy-efficient cluster computing with FAWN:Workloads and implications. In Proceedings of the 1st InternationalConference on Energy-Efficient Computing and Networking(e-Energy), pages 195–204, Apr. 2010.
[11] R. E. Wunderlich, T. F. Wenisch, B. Falsafi, and J. C. Hoe.SMARTS: Accelerating microarchitecture simulation via rigorousstatistical sampling. In Proceedings of the Annual InternationalSymposium on Computer Architecture (ISCA), pages 84–95, June2003.