Embed Size (px)
Citation preview

© 2011 OLIVER WYMAN
FINANCIAL SERVICES
The Volcker Rule restrictions on proprietary trading Implications for the US corporate bond market
December 2011

1 © 2011 OLIVER WYMAN
The Volcker Rule restrictions on proprietary trading Implications for the US corporate bond market
Contents
• Impact of the Volcker Rule on liquidity in the US markets
• Impact on investors’ asset valuations
• Impact on issuers’ borrowing costs
• Impact on transaction costs
Appendix: Liquidity impact calculation methodology

2 © 2011 OLIVER WYMAN
Executive summary
• Oliver Wyman has estimated the impact of an overly restrictive implementation of the Volcker rule statute on
the US corporate credit market – specifically US corporate bonds
• The corporate credit market is a critical source of funding for American businesses (with nearly $1 TN raised
each year) and an essential element of a diversified investment strategy for US household investors, who
hold approximately $3 TN in corporate debt across direct holdings, pensions, and mutual funds1
• An overly restrictive implementation of the Volcker rule (as proposed) would artificially limit banking entities’
ability to facilitate trading, hold inventory at levels sufficient to meet investor demand, and actively participate
in the market to price assets efficiently – reducing liquidity across a wide spectrum of asset classes
• In the US corporate bond market, any meaningful reduction in liquidity could have significant effects:
– Cost investors ~ $90 to 315 BN in mark-to-market loss of value on their existing holdings, as these assets
become less liquid and therefore less valuable
– Cost corporate issuers ~ $12 to 43 BN per annum in borrowing costs over time, as investors demand
higher interest payments on the less liquid securities they hold
– Cost investors an additional ~ $1 to 4 BN in annual transaction costs, as the level and depth of liquidity in
the asset class is reduced
• Our analysis focuses on the US corporate bond market as an example – the Volcker rule obviously covers
other asset classes where liquidity provision by banks also has significant value to the economy as a whole
1. Based on SIFMA and Federal Reserve Flow of Funds data
The Volcker Rule – Implications for the US corporate bond market

3 © 2011 OLIVER WYMAN
Summary results of analysis
One-time costs Recurring costs
Asset valuations
Illiquidity discount
Transaction costs N/A Section 4
Section 2 Section 3
Borne by issuers: Issuers will have to
pay higher yields on new debt raised
to compensate investors for holding
less liquid assets
Borne by investors: Asset holders
will be directly affected by the market
value depreciation
Borne by investors: Investors will
have to pay more to trade bonds that
are now systematically less liquid
Potential annual costs to investors
of $1 to 4 BN
Potential annual costs to issuers of $2 to
6 BN in year one, and $12 to 43 BN at
steady state 1
Potential mark-to-market valuation loss
for investors of $90 to 315 BN
1. Steady state implies that all outstanding debt has been refinanced at the higher borrowing cost
Source: Oliver Wyman analysis
The Volcker Rule – Implications for the US corporate bond market

4 © 2011 OLIVER WYMAN
Purpose and scope of analysis
• Quantifying potential economic effects of major policy innovations is inherently difficult, especially when the
changes concern the full complexity and range of today’s capital markets
• Our aim in this analysis is to provide a robust view of the magnitude of potential effects of an overly
restrictive implementation of the proposed Volcker rule on a single asset class – US corporate bonds
• Our analysis is limited to clear first-order impacts, including
– Mark-to-market decrease in value on existing bonds due to loss of liquidity
– Higher interest rates paid by corporate bond issuers, due to investors demanding greater liquidity premia
– Increases in transactions costs paid by investors, directly due to trading lower liquidity instruments
• Many of these first-order effects would be realized as transfers from one economic group to another (e.g.
higher interest rates paid by issuers would be received by investors), but for brevity we refer to each by the
most negatively affected group
• We do not directly analyze a wide range of potential knock-on effects, including
– Effects due to the Volcker rule that are not directly attributable to loss of liquidity in the US corporate bond
market (e.g. changes in transaction costs caused by shifting economics for Volcker-affected dealers)
– The potential replacement of some proportion of intermediation currently provided by Volcker-affected
dealers by dealers not so affected
The Volcker Rule – Implications for the US corporate bond market

5 © 2011 OLIVER WYMAN January 3, 2012
Section 1
Liquidity in the US markets

6 © 2011 OLIVER WYMAN
A rigid implementation of the Volcker rule (as proposed) will almost certainly reduce market liquidity across several asset classes in the United States
Analytical approach Provisions of the Volcker rule that risk
constraining market liquidity
• The vast majority of asset classes are not agency
markets – dealers consistently provide liquidity to
these markets as principals
• Even highly liquid asset classes like US Treasuries
require significant dealer intermediation and inter-
dealer activity
• The main providers of liquidity to these markets are
institutions covered by the Volcker that will face at least
some restrictions on trading activity
• The Volcker rule therefore risks constraining market
liquidity across a number of dimensions (as
summarized to the right)
• We frame our analyses of the potential effects of a
rigid interpretation of Volcker using three scenarios of
overall loss of corporate bond market liquidity
• Artificial limits on size of inventory and retained risk
• Artificial limits on duration of inventory and retained risk
• Restrictions on inter-dealer trading
• Restrictions on active trading to price assets
• Requirement to show consistent revenue and risk dynamics
• Fragmented regulatory oversight and enforcement
1
2
3
4
5
6
The Volcker Rule – Implications for the US corporate bond market

7 © 2011 OLIVER WYMAN
Liquidity varies considerably across markets
0x
5x
10x
15x
20x
25x
30x
Treasury Agency MBS Agency Debt Municipal Corporate Equities
$0 TN
$5 TN
$10 TN
$15 TN
$20 TN
$25 TN20072008
200920102010 value outstanding
1. Annual trading volume defined = average daily volume * 252
2. Based on publicly traded securities only
Sources: SIFMA, Treasury, Federal Reserve Bank of New York, TRACE, MSRB, NYSE, NASDAQ, Oliver Wyman analysis
2010
Number of CUSIPs 2 ~300 >50,000 ~12,000 ~15,000 ~25,000 ~5,000
Total outstanding $9.4 TN $6.9 TN $2.7 TN $3.8 TN $7.5 TN $23.3 TN
Average daily volume $528 BN $321 BN $72 BN $13 BN $16 BN $114 BN
Annual turnover ratio 14.2x 11.8x 6.6x 0.9x 0.5x 1.2x
Annual turnover and value outstanding
Turnover, 2006-2010; Value outstanding (in $TN), 2010
Annual tr
adin
g v
olu
me ÷
avera
ge v
alu
e o
uts
tandin
g (
annual)
The Volcker rule – Implications for the US corporate bond market

8 © 2011 OLIVER WYMAN
Few asset classes are agency markets; even highly liquid products require significant dealer intermediation (as principals) and inter-dealer activity to support liquidity
22%17%
10%19%
39%
75%77%
83%73%
57%
3% 6% 7% 8% 3%
Corporate
Debt
CMO ABS Agency MBS Agency Debt
Principal vs. agency par value traded Percent share of Average Daily Volume in US markets, Q3 2011
Securitized Products
Inter-dealer
Customer- dealer
1. “An Analysis of CDS Transactions: Implications for Public Reporting” (Staff Report 517, Federal Reserve Bank of New York, September 2011)
2. The Federal Reserve Bank of New York reports Primary Dealer transaction volume for US Treasury securities with (1) Inter-Dealer Brokers and (2) All Other counterparties; trades with Inter-
Dealer Brokers (which represent a subset of Inter-Dealer activity) have contributed 40% of volume in 2011 year to date
Sources: TRACE, Federal Reserve Bank of New York, Oliver Wyman analysis
Principal
Agency
• Debt markets rely heavily on intermediation by
dealers on a ‘principal basis’
– Majority of trading volume is directly driven by
customer demand
– However, inter-dealer trading is critical to
facilitating these transactions
• Agency trading is naturally limited in scope in
these markets
– Relatively low levels of overall market liquidity
– Enormous variety of individual bond issues
• Market observers (including the FRB) have noted
the “importance of market makers, who are willing
to take on a position in a rarely traded asset and
hold the risk for some time” when these market
features are present1
• This concept extends even to liquid markets like
Agency Debt and US Treasuries, which were
explicitly exempted from the Volcker rule2
“Permitted activities”
The Volcker Rule – Implications for the US corporate bond market
9 © 2011 OLIVER WYMAN
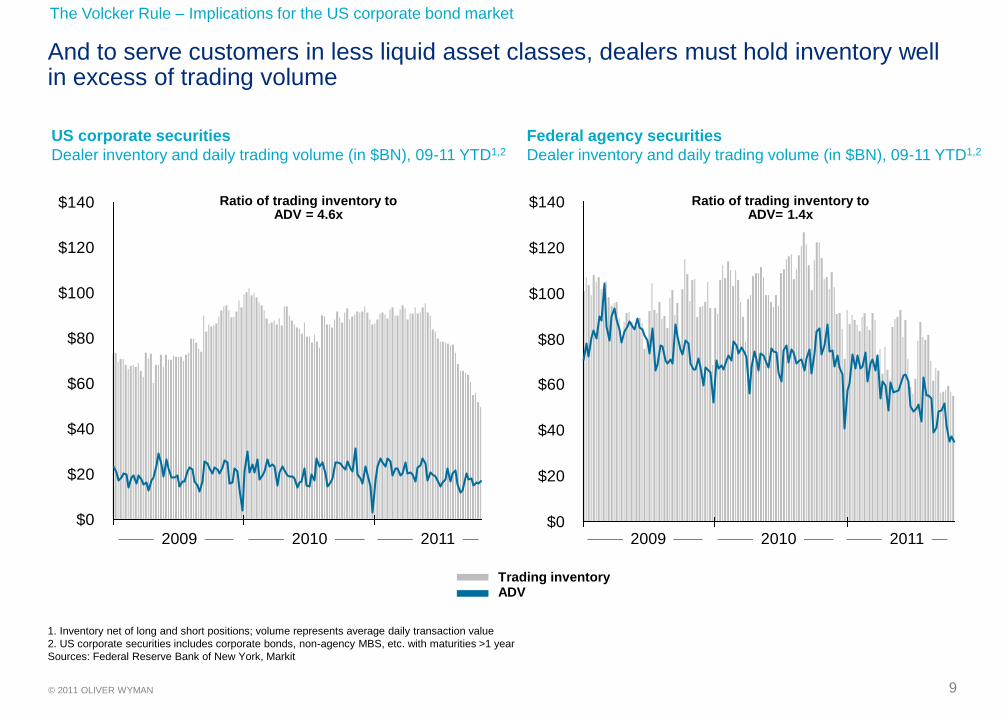
And to serve customers in less liquid asset classes, dealers must hold inventory well in excess of trading volume
$0
$20
$40
$60
$80
$100
$120
$140
US corporate securities
Dealer inventory and daily trading volume (in $BN), 09-11 YTD1,2
2009
1. Inventory net of long and short positions; volume represents average daily transaction value
2. US corporate securities includes corporate bonds, non-agency MBS, etc. with maturities >1 year
Sources: Federal Reserve Bank of New York, Markit
$0
$20
$40
$60
$80
$100
$120
$140
Federal agency securities
Dealer inventory and daily trading volume (in $BN), 09-11 YTD1,2
Ratio of trading inventory to ADV = 4.6x
Ratio of trading inventory to ADV= 1.4x
Trading inventory ADV
2010 2011 2009 2010 2011
The Volcker Rule – Implications for the US corporate bond market

10 © 2011 OLIVER WYMAN
The proposed Volcker rule risks reducing market-making activity by affected institutions, and thereby lowering overall market liquidity
1 Artificial limits on
size of inventory and
retained risk
• Implicit or explicit limits on the size of dealer inventories could lead market makers to ration their support of customer
needs not on the basis of economic and risk considerations
• Less liquid instruments or markets would likely be disproportionately affected
2 Artificial limits on
duration of inventory
and retained risk
• General restrictions on how long market makers can remain in a position are likely to be an overly blunt tool, given how
widely liquidity varies by asset class, instrument, and market conditions
• Dealers may be less willing to facilitate large transactions (“block trades”) if they have a limited window of time in which
to work down the position without unduly affecting the market price
3 Restrictions on inter-
dealer trading
• Virtually all markets rely on some degree of inter-dealer trading, which serves to more efficiently match natural investor
order flows, spread concentrated risk positions, and hedge individual and portfolio risks that market makers incur
• Explicit or implicit limits on inter-dealer trading could have negative knock-on consequences on the willingness of
market-makers to facilitate customer trades (e.g. due to inability to efficiently hedge risk)
4 Restrictions on active
trading to price
assets
• In many asset classes, market makers are able and willing to economically offer hedging and trade facilitation services
to customers because they are active participants in the markets for related instruments
• Active participation allows market makers to understand and maintain current views on market risk and pricing
dynamics, which in turn support customer facilitation
• Restrictions on the degree and manner in which covered dealers can participate in trading could reduce their capacity
to assume risk on behalf of customers
5 Requirement to show
consistent revenue
and risk dynamics
• Many elements of the compliance regime in the proposed rule seem to be based on an assumption that market making
functions should show consistent revenue, risk taking, and trading patterns, both over short time periods (day to day)
and across different periods of market conditions
• In both more and less liquid markets, customer flows are often “lumpy” (e.g. via facilitating block trades), and volatile
risk-taking and revenue are natural consequences for market makers
• In addition, market conditions – and the way market makers both serve customer needs and manage their own risks –
can shift substantially over time
6 Fragmented
regulatory oversight
and enforcement
• The proposed rule leaves supervision and enforcement at one institution as an activity potentially shared by several
regulatory agencies
• This will needlessly complicate the regulatory oversight process, and could lead to inconsistent or unpredictable
application of restrictions among different legal entities within one institution
The Volcker Rule – Implications for the US corporate bond market

11 © 2011 OLIVER WYMAN
Primary dealer Covered by Volcker
Bank of Nova Scotia
Barclays Capital
BMO Capital Markets
BNP Paribas Securities
Cantor Fitzgerald & Co.
Citigroup Global Capital Markets
Credit Suisse Securities (USA)
Daiwa Capital Markets Americas
Deutsche Bank Securities
Goldman, Sachs & Co.
HSBC Securities (USA)
J.P. Morgan Securities
Jefferies & Company
Merrill Lynch, Pierce, Fenner & Smith
Mizuho Securities USA
Morgan Stanley & Co.
Nomura Securities International
RBC Capital Markets
RBS Securities
SG Americas Securities
UBS Securities
The main providers of liquidity across asset classes are the institutions that will be most affected by the Volcker rule
Source: Federal Reserve Bank of New York
The Volcker Rule – Implications for the US corporate bond market

12 © 2011 OLIVER WYMAN
50th percentile (median)
We frame our analyses of the potential effects of a rigid interpretation of the Volcker rule on US corporate bonds using three scenarios of the decline in market liquidity
• We use robust, empirically tested measures of liquidity to understand the distribution of liquidity among
the universe of US corporate bonds
• Liquidity measures are based on
– Movements of a bond’s market price in response to trades of different sizes (price impact)
– Transaction costs (effectively) paid to market makers for trades in that bond
– The volatility of price impact and transaction costs over time
• Each liquidity scenario is defined in terms of a market-wide shift equivalent to the differences between
the median liquidity bond and a less liquid bond
Distribution of observed liquidity across US corporate bonds
Illustrative - observed liquidity is not normally distributed
Least liquid bonds Most liquid bonds
Small scenario: 5% change
Medium scenario: 10% change
Large scenario: 15% change
The Volcker Rule – Implications for the US corporate bond market

13 © 2011 OLIVER WYMAN January 3, 2012
Section 2
Impact on investors’ asset valuations
14 © 2011 OLIVER WYMAN
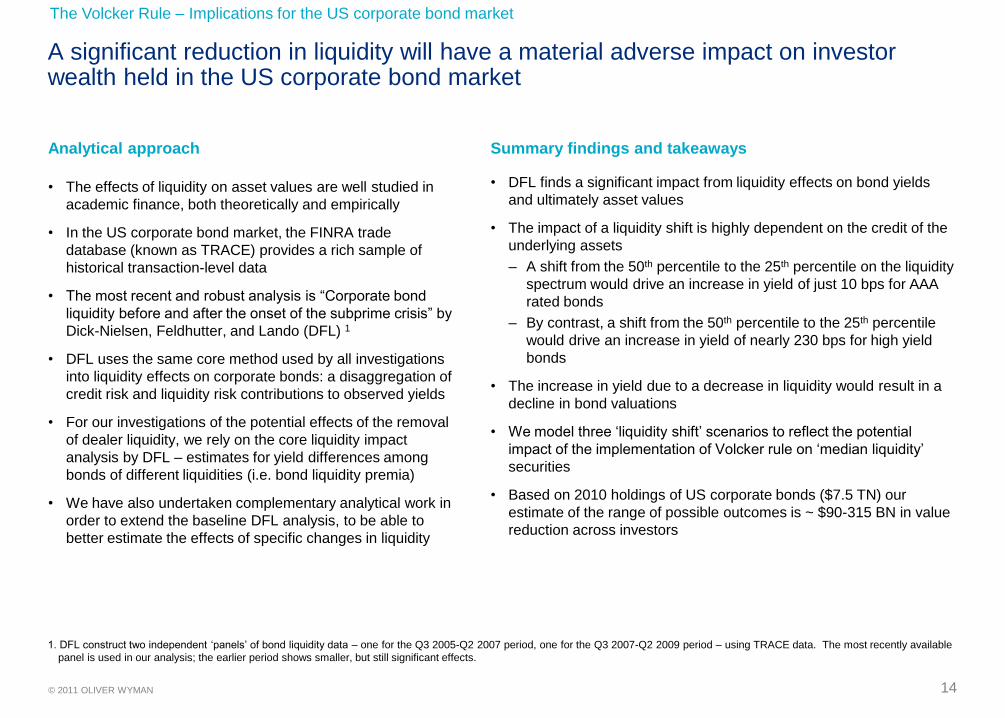
A significant reduction in liquidity will have a material adverse impact on investor wealth held in the US corporate bond market
• The effects of liquidity on asset values are well studied in
academic finance, both theoretically and empirically
• In the US corporate bond market, the FINRA trade
database (known as TRACE) provides a rich sample of
historical transaction-level data
• The most recent and robust analysis is “Corporate bond
liquidity before and after the onset of the subprime crisis” by
Dick-Nielsen, Feldhutter, and Lando (DFL) 1
• DFL uses the same core method used by all investigations
into liquidity effects on corporate bonds: a disaggregation of
credit risk and liquidity risk contributions to observed yields
• For our investigations of the potential effects of the removal
of dealer liquidity, we rely on the core liquidity impact
analysis by DFL – estimates for yield differences among
bonds of different liquidities (i.e. bond liquidity premia)
• We have also undertaken complementary analytical work in
order to extend the baseline DFL analysis, to be able to
better estimate the effects of specific changes in liquidity
• DFL finds a significant impact from liquidity effects on bond yields
and ultimately asset values
• The impact of a liquidity shift is highly dependent on the credit of the
underlying assets
– A shift from the 50th percentile to the 25th percentile on the liquidity
spectrum would drive an increase in yield of just 10 bps for AAA
rated bonds
– By contrast, a shift from the 50th percentile to the 25th percentile
would drive an increase in yield of nearly 230 bps for high yield
bonds
• The increase in yield due to a decrease in liquidity would result in a
decline in bond valuations
• We model three ‘liquidity shift’ scenarios to reflect the potential
impact of the implementation of Volcker rule on ‘median liquidity’
securities
• Based on 2010 holdings of US corporate bonds ($7.5 TN) our
estimate of the range of possible outcomes is ~ $90-315 BN in value
reduction across investors
Analytical approach Summary findings and takeaways
1. DFL construct two independent ‘panels’ of bond liquidity data – one for the Q3 2005-Q2 2007 period, one for the Q3 2007-Q2 2009 period – using TRACE data. The most recently available
panel is used in our analysis; the earlier period shows smaller, but still significant effects.
The Volcker Rule – Implications for the US corporate bond market

15 © 2011 OLIVER WYMAN
The US corporate bond market is a critical asset class for investors
Banking sector
Insurance sector
Foreign residents
US households
(direct holdings)
Exposure to US corporate credit
Holdings of US corporate bonds by investor, in $TN
Mutual funds
Pension funds
Public Sector
1.5 1.4 1.5 1.7 1.7
1.2 1.21.3
1.6 1.6
1.3 1.41.4
1.5 1.5
1.1 1.11.3
1.2 1.20.50.6
0.7
0.9 1.0
0.40.4
0.5
0.5 0.6
5.96.2
6.9
7.5 7.7
0
1
2
3
4
5
6
7
8
2007 2008 2009 2010 2011 ytd
Source: SIFMA, Federal Reserve Flow of Funds (Q2 2011), Oliver Wyman analysis
Highlighted cells represent direct and indirect holdings of corporate bonds by household investors in the
US - $2.8 TN in total
The Volcker Rule – Implications for the US corporate bond market

16 © 2011 OLIVER WYMAN
Liquidity is a significant driver of yield on US corporate bonds – particularly at the lower end of the credit spectrum
Percentile
liquidity
Rating bucket
AAA AA A BBB HY
99 -6 bps -57 bps -57 bps -77 bps -155 bps
95 -6 bps -55 bps -55 bps -74 bps -149 bps
75 -4 bps -39 bps -40 bps -53 bps -107 bps
60 -2 bps -19 bps -20 bps -26 bps -53 bps
50 0 bps 0 bps 0 bps 0 bps 0 bps
40 3 bps 26 bps 27 bps 35 bps 72 bps
25 10 bps 85 bps 85 bps 114 bps 230 bps
5 25 bps 219 bps 220 bps 293 bps 593 bps
1 29 bps 258 bps 258 bps 344 bps 696 bps
Liquidity premium relative to a bond with median liquidity 1
in bps
1. DFL construct two independent ‘panels’ of bond liquidity data – one for the Q3 2005-Q2 2007 period, one for the Q3 2007-Q2 2009 period – using TRACE data. The most recently available
panel is used in our analysis; the earlier period shows smaller, but still significant effects.
Sources: TRACE, "Corporate bond liquidity before and after the onset of the subprime crisis" (Dick-Nielsen, Feldhutter, Lando 2011), Oliver Wyman analysis
More
liq
uid
For example: The liquidity premium of a HY bond with 40th percentile liquidity is 72 bps higher than that of a bond with median liquidity
The Volcker Rule – Implications for the US corporate bond market
17 © 2011 OLIVER WYMAN
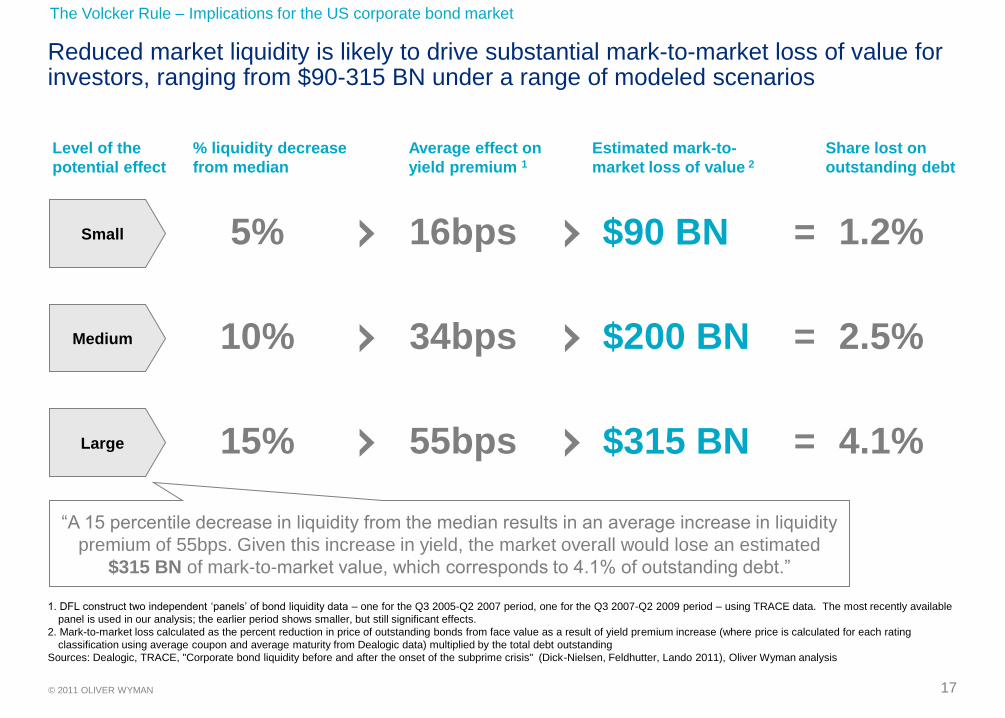
Reduced market liquidity is likely to drive substantial mark-to-market loss of value for investors, ranging from $90-315 BN under a range of modeled scenarios
Level of the
potential effect
% liquidity decrease
from median
Average effect on
yield premium 1
Estimated mark-to-
market loss of value 2
Share lost on
outstanding debt
5% 16bps $90 BN 1.2% Small =
10% 34bps $200 BN 2.5% = Medium
15% 55bps $315 BN 4.1% = Large
“A 15 percentile decrease in liquidity from the median results in an average increase in liquidity
premium of 55bps. Given this increase in yield, the market overall would lose an estimated
$315 BN of mark-to-market value, which corresponds to 4.1% of outstanding debt.”
1. DFL construct two independent ‘panels’ of bond liquidity data – one for the Q3 2005-Q2 2007 period, one for the Q3 2007-Q2 2009 period – using TRACE data. The most recently available
panel is used in our analysis; the earlier period shows smaller, but still significant effects.
2. Mark-to-market loss calculated as the percent reduction in price of outstanding bonds from face value as a result of yield premium increase (where price is calculated for each rating
classification using average coupon and average maturity from Dealogic data) multiplied by the total debt outstanding
Sources: Dealogic, TRACE, "Corporate bond liquidity before and after the onset of the subprime crisis" (Dick-Nielsen, Feldhutter, Lando 2011), Oliver Wyman analysis
The Volcker Rule – Implications for the US corporate bond market

18 © 2011 OLIVER WYMAN
The impact of reduced liquidity will have a disproportionate impact on the value of bonds backed by (generally smaller) firms at the lower end of the credit spectrum
Rating
bucket
Liquidity change
small
(50th to 45th)
medium
(50th to 40th)
large
(50th to 35th)
AAA 1 bps 3 bps 5 bps
AA 12 bps 26 bps 43 bps
A 12 bps 27 bps 43 bps
BBB 16 bps 35 bps 58 bps
HY 33 bps 72 bps 116 bps
Total 16 bps 34 bps 55 bps
Estimated increase in liquidity premium as a result of
liquidity change 1
in bps
1. DFL construct two independent ‘panels’ of bond liquidity data – one for the Q3 2005-Q2 2007 period, one for the Q3 2007-Q2 2009 period – using TRACE data. The most recently available
panel is used in our analysis; the earlier period shows smaller, but still significant effects.
2. Mark-to-market loss calculated as the percent reduction in price of outstanding bonds from face value as a result of yield premium increase (where price is calculated for each rating
classification using average coupon and average maturity from Dealogic data) multiplied by the total debt outstanding
Sources: Dealogic, TRACE, "Corporate bond liquidity before and after the onset of the subprime crisis" (Dick-Nielsen, Feldhutter, Lando 2011), Oliver Wyman analysis
Rating
bucket
Liquidity change
small
(50th to 45th)
medium
(50th to 40th)
large
(50th to 35th)
AAA $1 BN $1 BN $2 BN
AA $14 BN $31 BN $50 BN
A $24 BN $51 BN $82 BN
BBB $27 BN $58 BN $93 BN
HY $25 BN $54 BN $86 BN
Total $91 BN $195 BN $313 BN
Estimated mark-to-market loss of value from
reduction in bond prices 2
in $BN
Change in premium Mark-to-market loss of value
The Volcker Rule – Implications for the US corporate bond market

19 © 2011 OLIVER WYMAN January 3, 2012
Section 3
Impact on issuers’ borrowing costs

20 © 2011 OLIVER WYMAN
Increased liquidity premia on corporate bonds will also get passed on to issuers over time in the form of higher coupon rates
• We apply the same methodology for estimating overall
changes in liquidity premia for corporate bonds as a
baseline for assessing additional costs to issuers
– Use DFL analysis of liquidity premia differences
across bonds
– Refine DFL results to assess effects of specific
liquidity differences
• We assume that new issuance would pay coupons
incorporating any increased liquidity premia, gradually
increasing the annual net new cost to corporate debt
issuers over time
• Again, DFL finds a significant impact from liquidity
effects on bond yields and asset values
• Investors will demand higher interest payments to
compensate for the increased liquidity risk associated
with holding corporate bonds
• Taking the DFL estimate of changes in liquidity premia,
we can estimate total incremental borrowing costs for
corporate bond issuers
• Based on total issuance in 2010 (approximately $1 TN
across investment grade and high yield bonds)
– The outer bound for the first year impact on newly
issued bonds is approximately $6 BN, assuming full
effect
– Over time, the steady state level will rise closer to
$43 BN as a greater proportion of outstanding bonds
absorb the liquidity premium
Analytical approach Summary findings and takeaways
The Volcker Rule – Implications for the US corporate bond market

21 © 2011 OLIVER WYMAN
US corporate bond issuance averages approximately $1 TN across the investment grade and high yield markets
High Yield
Investment Grade 1
US corporate issuance
Investment grade and high yield issuance, in $BN
992
664754 799 809
136
43
148
264 236
1,128
707
902
1,063 1,045
0
200
400
600
800
1,000
1,200
2007 2008 2009 2010 2011 E
1. Investment grade includes all non-convertible corporate debt, medium-term notes, and Yankee bonds, but excludes all issues with maturities of one year or less and CDs
2. 2011 estimated based on 10 months of data
Sources: SIFMA, Oliver Wyman analysis
2
The Volcker Rule – Implications for the US corporate bond market

22 © 2011 OLIVER WYMAN
Investors will demand higher interest payments on newly issued bonds to compensate for the increased liquidity risk
Rating
bucket
Liquidity change
small
(50th to 45th)
medium
(50th to 40th)
large
(50th to 35th)
AAA 1 bps 3 bps 5 bps
AA 12 bps 26 bps 43 bps
A 12 bps 27 bps 43 bps
BBB 16 bps 35 bps 58 bps
HY 33 bps 72 bps 116 bps
Total 16 bps 34 bps 55 bps
1. DFL construct two independent ‘panels’ of bond liquidity data – one for the Q3 2005-Q2 2007 period, one for the Q3 2007-Q2 2009 period – using TRACE data. The most recently available
panel is used in our analysis; the earlier period shows smaller, but still significant effects.
Sources: Dealogic, TRACE, "Corporate bond liquidity before and after the onset of the subprime crisis" (Dick-Nielsen, Feldhutter, Lando 2011), Oliver Wyman analysis
Rating
bucket
Liquidity change
small
(50th to 45th)
medium
(50th to 40th)
large
(50th to 35th)
AAA $15 MM $30 MM $50 MM
AA $235 MM $510 MM $830 MM
A $350 MM $760 MM $1,240 MM
BBB $400 MM $870 MM $1,410 MM
HY $570 MM $1,235 MM $2,010 MM
Total $1,570 MM $3,405 MM $5,540 MM
Estimated annual incremental issuance cost due to
reduction in bond prices
In $MM
Change in premium Change in issuer cost
Estimated increase in liquidity premium as a result of
liquidity change 1
in bps
The Volcker Rule – Implications for the US corporate bond market

23 © 2011 OLIVER WYMAN
The impact on issuers will grow as outstanding debt is retired and new issues are priced at higher yields
439 439 439 439 439 439 439 439 439 439
2 3 5 6 8 9 11 12 122 4 6 7 9 11 13 14 14
24
69
1113
15 16 16
439445
451456
462467
473478
482 482
350
370
390
410
430
450
470
490
0 1 2 3 4 5 6 7 8 …
Years post rule implementation
Simulated cumulative increase in corporate issuance cost 1
In $BN
Cost of ‘Year Zero’ interest
Small liquidity shift $12 BN total
New steady state cost of borrowing
1. DFL construct two independent ‘panels’ of bond liquidity data – one for the Q3 2005-Q2 2007 period, one for the Q3 2007-Q2 2009 period – using TRACE data. The most recently available
panel is used in our analysis; the earlier period shows smaller, but still significant effects.
Sources: Dealogic, TRACE, "Corporate bond liquidity before and after the onset of the subprime crisis" (Dick-Nielsen, Feldhutter, Lando 2011), Oliver Wyman analysis
0
Medium liquidity shift $26 BN total
Large liquidity shift $43 BN total
The Volcker Rule – Implications for the US corporate bond market

24 © 2011 OLIVER WYMAN
The impact of higher issuer costs is most visible in the potential earnings drag for individual firms
Steady state earnings drag by issuer across liquidity scenarios 1
Dollar increase in issuer cost ÷ net income, in %
1. Steady state implies that all outstanding debt has been refinanced at the higher (post liquidity premium) borrowing cost
2. Average annual issuance based on 2005 - H1 2011
3. Similarly rated corporates are those with ratings in the same rating bucket: A+/A/A-, BBB+/BBB/BBB-, High Yield
Sources: Dealogic, TRACE, Oliver Wyman analysis
-0.9%
-4.0%
-5.6%
-1.9%
-8.7%
-12.1%
-3.0%
-14.1%
-19.6%
Caterpillar Harley-Davidson Delta Air Lines
Small liquidity shift
Medium liquidity shift
Large liquidity shift
Rating bucket A BBB High Yield
Average annual issuance 2 $6.4 BN $0.4 BN $1.4 BN
Debt outstanding $19.4 BN $4.5 BN $14.4 BN
2010 earnings $2,782 MM $147 MM $593 MM
Similarly rated corporates 3
(large liquidity shift % drag)
Walt Disney (-1.4%)
Coca-Cola (-0.5%)
Kraft Foods (-3.8%)
Clorox (-2.4%)
Sears (-20.0%)
Del Monte Foods (-6.2%)
The impact of a liquidity shock will fall disproportionately on lower rated,
generally smaller corporates with higher relative debt burdens
The Volcker Rule – Implications for the US corporate bond market

25 © 2011 OLIVER WYMAN January 3, 2012
Section 4
Impact on transaction costs

26 © 2011 OLIVER WYMAN
Liquidity is a significant driver of transaction costs in the corporate bond market, and a reduction in liquidity would lead to a material increase in costs paid by investors
• There is a clear relationship between liquidity and transaction
costs in the corporate bond market
• Using historical data on corporate bond trading from TRACE,
we observe
– Significant dispersion (40 bps) in average imputed
transaction costs1 driven by liquidity
– Average imputed transaction costs for the most liquid
securities ($500 MM+ in daily volume) of 7 bps
– Average imputed transaction costs for the least liquid
securities (less than $1 MM in daily volume) of 48 bps
• The average imputed transaction costs for all securities is
approximately 20.5 bps, which translates into approximately
$6.7 BN in imputed annual transaction costs paid by investors
• A 10% change in liquidity (equivalent to the change in
transaction costs between the median bond and the 40th
percentile bond) would mean an average increase of 8bps,
adding $2.4 BN in costs for investors
1 Transaction costs proxied using 50% of average purchase and sale price range
Summary findings and takeaways Analytical approach
• Our analysis of realized purchase and sales prices was
designed to understand the impact of changes in
liquidity on transaction costs for investors
• Transaction costs could also be significantly affected in
other ways by the Volcker rule that our analysis does
not address directly
• Bid-offer spreads are not directly observable in the
corporate bond market, and no central repository of
bid-offer data exists in the US market today – so
transaction costs must be estimated
• We use the FINRA database of corporate bond
transactions (known as TRACE) to impute transaction
costs from realized purchase and sale prices reported
• Investors’ realized transaction costs are imputed by
matching buy and sell transactions for the same
security on the same day and averaging dealers’
realized purchase and sale price
• For 2009, this yields a rich database of > 250 k
observations covering ~ $2.5 TN in transaction value
The Volcker Rule – Implications for the US corporate bond market

27 © 2011 OLIVER WYMAN
There is a clear relationship between decreasing liquidity and increasing transaction costs
47.7
32.5
26.2
22.319.7
16.6
12.5
7.4
20.5
< $1MM $1-5 MM $5-10MM $10-25 MM $25-50 MM $50-100 MM $100-500 MM $500MM + Overall
Trading volume for individual bonds and days
Imputed transaction costs by liquidity bucket 1
Transaction costs in bps, liquidity buckets in $ MM of trading volume for each security and day
1 Transaction costs proxied using 50% of average purchase and sale price range
Sources: TRACE, Oliver Wyman analysis
The Volcker Rule – Implications for the US corporate bond market

28 © 2011 OLIVER WYMAN
Reduced liquidity in the corporate bond market could increase transaction costs to investors from $7 BN to $11 BN
Imputed transaction costs for investors 1
Current and simulated, in $BN
Estimated impact
Percentile increase in
transaction costs 5% 10% 15%
Additional
Transaction costs 4 bps 8 bps 12 bps
6.7 6.7 6.7
1.32.4
3.98.0
9.1
10.6
Small liquidity shift Medium liquidity shift Large liquidity shift
Current cost
Additional cost
$3.3 TN in annual volume for customer-to-dealer trades
X
20.5 bps on average transaction across corporate bonds
1 Transaction costs proxied using 50% of average purchase and sale price range
Sources: TRACE, Oliver Wyman analysis
6.7
Scenario 1Estimated transaction costs (current)
The Volcker Rule – Implications for the US corporate bond market

29 © 2011 OLIVER WYMAN January 3, 2012
Appendix
Liquidity impact calculation methodology

30 © 2011 OLIVER WYMAN
Dick-Nielsen, Feldhutter and Lando conducted the most recent and robust analysis of the effect of reduced liquidity on bond prices, which we use as our starting point
• Dick-Nielsen, Feldhutter and Lando (DFL) clean available data, test different liquidity factors,
and analyze liquidity effects across two periods: pre-subprime (Q1 2005 – Q1 2007) and post-
subprime (Q2 2007 – Q2 2009)
Clean data Test factors Analyze effects
• Dataset of 5,376 bonds with
8.2 MM trades obtained after
cross-referencing data from
TRACE, Bloomberg, Datastream,
and IBES and removing retail-
sized and erroneous trades
• Treasury yields and LIBOR rates
obtained from the British Bankers’
Association
• Using yield spread to swap rate as
the dependent variable, eight
liquidity measures are regressed
to determine which correlated
more highly with yield spread
• Credit risk contribution to the yield
spread is controlled with 12
additional factors
• DFL create a composite liquidity
measure using a normalized
average of 4 liquidity measures:
Amihud, Imputed Roundtrip Cost,
and their standard deviations
• Running the regression using the
liquidity measure reveals that the
liquidity component of bond yields
strongly increased from higher
credit rating to lower
• Liquidity component increases at
the onset of subprime crisis for all
but AAA-rated bonds, which is
explained by the flight-to-quality
phenomenon
DFL develop a composite measure of liquidity and find its yield spread regression coefficient
for each rating bucket Sources: "Corporate bond liquidity before and after the onset of the subprime crisis" (Dick-Nielsen, Feldhutter, Lando 2011)
• Bond age
• Amount issued
• Coupon size
• Time-to-Maturity
• Equity volatility
• Ratio of operating
income to sales
• Leverage ratio
• Ratio of long term
debt to assets
• Interest rate coverage
• 10y swap rate
• 10y - 1y swap rate
• Earnings forecast
dispersion
The Volcker Rule – Implications for the US corporate bond market

31 © 2011 OLIVER WYMAN
The DFL composite liquidity measure and its regression coefficients are used to assess the impact of liquidity on our dataset
• After running regressions with eight measures of liquidity, Dick-Nielsen, Feldhutter, and Lando develop a
composite liquidity measure, λ, calculated as an equally weighted sum of Amihud’s measure of price impact,
a measure of roundtrip cost of trading, and the standard deviations of both, all normalized
• DFL provides certain percentile values of λ and coefficients of λ in regressions on the yield spread for each
rating
• We perform an exponential regression on the percentile values of λ to interpolate values at other percentiles
• We use the coefficients from the most recently available period (Q3 2007-Q2 2009) for our analysis of the
present
Sources: "Corporate bond liquidity before and after the onset of the subprime crisis" (Dick-Nielsen, Feldhutter, Lando 2011)
The Volcker Rule – Implications for the US corporate bond market

32 © 2011 OLIVER WYMAN
We use Dealogic data to supplement the results of the DFL paper and calculate estimates of the effect of a decrease in liquidity on asset values in various scenarios
Sources: Dealogic, "Corporate bond liquidity before and after the onset of the subprime crisis" (Dick-Nielsen, Feldhutter, Lando 2011)
Find liquidity component
Estimate outstanding debt
Determine current yield
• Use Dealogic data to
calculate current yield of
outstanding debt using
average maturity and
average coupon for each
rating bucket
• Find the difference in
liquidity premia between a
median liquidity bond and a
bond with lower liquidity as
per each scenario by
multiplying the difference in
the liquidity measure by the
corresponding regression
coefficient for each rating
bucket
• Estimate corporate debt
outstanding for each rating
bucket by assuming same
proportions as across 2005
through H1 2011 issuance,
for which we have data
• Calculate the percent mark-
to-market loss of value as a
result of increasing the
bond yield by the liquidity
component change
• Estimate the mark-to-
market loss of value in
absolute terms by
multiplying by outstanding
corporate debt in each
rating bucket
• Find the share of total
outstanding debt lost by
dividing absolute mark-to-
market loss of value by the
total outstanding debt
1 2 3 Estimate percentile shift costs 4
The Volcker Rule – Implications for the US corporate bond market

33 © 2011 OLIVER WYMAN
A similar process is used to obtain estimates of costs of credit for future issuance
Sources: Dealogic, "Corporate bond liquidity before and after the onset of the subprime crisis" (Dick-Nielsen, Feldhutter, Lando 2011)
Estimate percentile
shift costs
Find liquidity
component Approximate annual issuance
• Approximate annual issuance for
each rating bucket as that across
2005 through H1 2011
• Calculate the estimated additional
annual cost in absolute terms by
multiplying annual issuance by the
increase in liquidity premium
• Project annual issuance cost by
assuming that each year bonds
mature and are replaced with more
costly bonds as dictated by the
maturity rate, so that annual cost
increases at the rate of the additional
annual cost each year for the amount
of time of average maturity, at which
point it plateaus to steady state
• Find the difference in liquidity premia
between a median liquidity bond and
a bond with lower liquidity as per
each scenario by multiplying the
difference in the liquidity measure by
the corresponding regression
coefficient for each rating bucket
1 2 3
The Volcker Rule – Implications for the US corporate bond market

34 © 2011 OLIVER WYMAN
We use TRACE data to impute transaction costs from realized buy and sell prices reported and calculate the effect of different shift scenarios
Estimate percentile
shift costs
Impute transaction
costs Clean TRACE data
• Clean data to remove
– Corrected, cancelled, or
removed trades
– Equity linked and agency trades
– Trades with trading volume
<$100,000
• Calculate the increase in transaction
costs under different scenarios of
shift in transaction cost percentiles
• Translate into dollar costs by
applying premium to outstanding
debt for each rating bucket for each
scenario
• Aggregate data by security and day
• Calculate average buy and sell
prices weighted by trading volume
for each security and day
• Compute transaction costs in
absolute terms as half of the
difference between the average sell
and buy prices, multiplied by the
total trading volume for each
security and day
• Translate into transaction costs per
traded dollar for each security and
day by dividing absolute transaction
cost by the total price
1 2 3
Sources: TRACE
The Volcker Rule – Implications for the US corporate bond market

35 © 2011 OLIVER WYMAN January 3, 2012
Disclaimers

36 © 2011 OLIVER WYMAN
This report sets forth the information required by the terms of Oliver Wyman’s engagement by SIFMA and is prepared in the form expressly required
thereby. This report is intended to be read and used as a whole and not in parts. Separation or alteration of any section or page from the main body of this
report is expressly forbidden and invalidates this report.
This report is not intended for general circulation or publication, nor is it to be used, reproduced, quoted or distributed for any purpose other than those that
may be set forth herein without the prior written permission of Oliver Wyman. Neither all nor any part of the contents of this report, any opinions expressed
herein, or the firm with which this report is connected, shall be disseminated to the public through advertising media, public relations, news media, sales
media, mail, direct transmittal, or any other public means of communications, without the prior written consent of Oliver Wyman.
Information furnished by others, upon which all or portions of this report are based, is believed to be reliable but has not been verified. No warranty is given
as to the accuracy of such information. Public information and industry and statistical data are from sources we deem to be reliable; however, we make no
representation as to the accuracy or completeness of such information and have accepted the information without further verification.
The findings contained in this report may contain predictions based on current data and historical trends. Any such predictions are subject to inherent risks
and uncertainties. In particular, actual results could be impacted by future events which cannot be predicted or controlled, including, without limitation,
changes in business strategies, the development of future products and services, changes in market and industry conditions, the outcome of contingencies,
changes in management, changes in law or regulations. Oliver Wyman accepts no responsibility for actual results or future events.
The opinions expressed in this report are valid only for the purpose stated herein and as of the date of this report. No obligation is assumed to revise this
report to reflect changes, events or conditions, which occur subsequent to the date hereof.
All decisions in connection with the implementation or use of advice or recommendations contained in this report are the sole responsibility of SIFMA. This
report does not represent investment advice nor does it provide an opinion regarding the fairness of any transaction to any and all parties.
This report is for the exclusive use of SIFMA. There are no third party beneficiaries with respect to this report, and Oliver Wyman does not accept any
liability to any third party. In particular, Oliver Wyman shall not have any liability to any third party in respect of the contents of this report or any actions
taken or decisions made as a consequence of the results, advice or recommendations set forth herein.
Report qualifications/assumptions and limiting conditions