Embed Size (px)
Citation preview

STUDY SI2.408210 TYRE/ROAD NOISE VOLUME 2: APPENDICES
MOBILITÄ

FEHRL Report Final Report SI2.408210 Tyre/Road Noise – Volume 2 i
FEHRL
Contents
Appendix A. Literature survey .........................................................................................1 Appendix B. Results from TraNECam model .............................................................123 Appendix C. Estimating the influence of vehicle body design on the test result – A theoretical approach ....................................................................................................129 Appendix D. Predicted changes in the average roadside noise level resulting from a reduction in tyre/road noise of light vehicles ............................................................133 Appendix E. Test procedures for tyre safety and rolling resistance .......................139 Appendix F. Valuation information .............................................................................147

FEHRL Report ii Final Report SI2.408210 Tyre/Road Noise – Volume 2
FEHRL
FEHRL Report Final Report SI2.408210 Tyre/Road Noise – Volume 2 1
FEHRL
Appendix A. Literature survey

FEHRL Report. 2 Final Report SI2.408210 Tyre/Road Noise – Volume 2
FEHRL
FEHRL Report Final Report SI2.408210 Tyre/Road Noise – Volume 2 3
FEHRL
Contents Executive Summary ........................................................................................................ 7
1 Background ............................................................................................................ 11
1.1 INTRODUCTION 11 1.2 OBJECTIVES 11 1.3 TIME TRENDS IN VEHICLE AND TRAFFIC NOISE 12 1.4 SOME RECENT POLICY STATEMENTS 14
2 Tyre noise in relation to vehicle noise limits according to Directive 92/97/EC.. 15
2.1 WHY THIS TOPIC IS OF INTEREST HERE 15 2.2 REQUIREMENTS BASED ON THE EXISTING DIRECTIVES 15 2.3 REQUIREMENTS BASED ON THE NEW MEASURING METHOD FOR VEHICLE
NOISE 17 2.4 CONCLUSIONS 18
3 The limits in Directive 2001/43/EC......................................................................... 19
4 Essential data measured up to 1995..................................................................... 21
5 Noise levels of modern, new tyres........................................................................ 25
5.1 MEASUREMENTS ON ABOUT 100 CAR TYRES IN SWEDEN AND POLAND 25 5.2 MEASUREMENTS IN GERMANY 26 5.3 MEASUREMENTS IN THE NETHERLANDS 30 5.4 MEASUREMENTS ELSEWHERE 31 5.5 COMPILATION OF RESULTS 33 5.6 CONCLUSIONS 33
6 Noise levels of retreaded tyres.............................................................................. 35
6.1 STUDIES IN SWEDEN, POLAND AND GERMANY IN THE 1990'S 35 6.2 STUDY BY BAST IN GERMANY ON RETREADED TRUCK TYRES 37
7 The relation between tyre noise and tyre section width...................................... 39
7.1 EARLY STUDIES 39 7.2 STUDIES BEFORE 1995 40 7.3 STUDIES BY INDEPENDENT ORGANIZATIONS AFTER 1995 41 7.4 UNPUBLISHED DATA FROM ETRTO 43 7.5 CONCLUSIONS 45
8 Trade-off with other parameters?.......................................................................... 47
8.1 INTRODUCTION 47 8.2 ANALYSIS OF TARGET CONFLICTS BY ETRTO 48 8.3 BASIC DIFFICULTIES IN COMBINING LOW NOISE WITH GOOD HANDLING AND
BRAKING 48 8.4 MEASUREMENTS BY TRL IN THE U.K. 51

FEHRL Report. 4 Final Report SI2.408210 Tyre/Road Noise – Volume 2
FEHRL
8.4.1 Measurements in 1992 51 8.4.2 TRL study published in 2005 53
8.5 MEASUREMENTS BY TUG AND VTI ON ABOUT 100 CAR TYRES 55 8.6 MEASUREMENTS MADE BY TÜV AND SPONSORED BY UBA IN GERMANY 58 8.7 MEASUREMENTS BY CONTINENTAL TYRES IN GERMANY 63 8.8 IEA WORKSHOP NOVEMBER 2005 64 8.9 OTHER MEASURED DATA OR EXPRESSED VIEWS 66 8.10 CONCLUSIONS 66
9 Trade-off with fashion and styling?.......................................................................69
10 Tyre main types – distinction in the Directive.......................................................73
10.1 THE TYRE CATEGORIES IN THE DIRECTIVE 73 10.2 ALTERNATIVE CATEGORIZATION BY TYRE LOAD INDEX (LI) 73 10.3 TECHNICAL POSSIBILITIES TO SKIP THE TYRE WIDTH CATEGORIES 74
11 Tyre types not covered by the Directive................................................................75
12 Some views expressed recently by vehicle and tyre manufacturers..................77
12.1 VEHICLE MANUFACTURERS 77 12.2 TYRE MANUFACTURERS 77
13 Variability between tyres and the potential for noise reduction utilizing existing technology...............................................................................................................79
14 Future potential low-noise concepts for tyres......................................................81
14.1 FURTHER DEVELOPMENT USING CONVENTIONAL TECHNOLOGY 81 14.2 ATTEMPTS TO ESTIMATE THE NOISE REDUCTION POTENTIAL 83 14.3 UNCONVENTIONAL TECHNOLOGY AND INNOVATIONS 85
15 Suggestions for lowering of the noise limits ........................................................91
15.1 POLICY EXPRESSIONS 91 15.2 PROPOSAL BY THE UBA OF GERMANY 92 15.3 PROPOSAL BY TRL LIMITED 94 15.4 OTHER CONSIDERATIONS 95
16 The relevance of the ISO 10844 surface................................................................97
16.1 REPRESENTATIVITY OF THE ISO 10844 SURFACE 97 16.2 CORRELATIONS BETWEEN MEASURED LEVELS ON AN ISO SURFACE WITH
LEVELS ON COMMON ROAD SURFACES 98 16.3 THE NEED FOR AN ADDITIONAL ISO SURFACE 103 16.4 SOME ONGOING WORK 103
17 Need for new or supplementary data ..................................................................105
18 Conclusions ..........................................................................................................107

FEHRL Report Final Report SI2.408210 Tyre/Road Noise – Volume 2 5
FEHRL
19 Recommendations ............................................................................................... 111
20 Acknowledgements.............................................................................................. 113
21 References............................................................................................................ 115

FEHRL Report. 6 Final Report SI2.408210 Tyre/Road Noise – Volume 2
FEHRL

FEHRL Report Final Report SI2.408210 Tyre/Road Noise – Volume 2 7
FEHRL
Executive Summary
In 2001, Directive 2001/43/EC was published, introduced limiting values for noise emission from tyres for road vehicles. The limiting values distinguish between different types and widths of tyres and relate to type approval of all new tyres. The Directive includes a measuring method which includes also a specification of a standard test surface. Special conditions of the Directive requires more stringent noise limits to be set a few years after the introduction of the first limits; provided for example that such stricter limits could be set without compromising safety. In order to study the possibility to lower the noise limits and the possible trade-offs this might have on safety and rolling resistance, the Commission issued a call for tenders for "Study about technical possibility to apply the tyre/road noise emission levels of Directive 2001/43/EC without compromising vehicle safety". A proposal from the Forum of European National Highway Research Laboratories (FEHRL) won the contract and this report is part of Work Package 1 of the FEHRL proposal which aims at studying the “Potential for Reducing Tyre Noise Limits”. The aim of this report is to collect and compile information related to the technical possibilities to require tyres to meet lower noise limits than the limits currently in force; considering also the effect that lower limits may have on other important tyre performance characteristics such as safety (most notably wet skid resistance) and rolling resistance. All publicly available reports, papers, articles and other documents that deal to a significant extent with the subject and identified by the project consortium have been reviewed. Furthermore, some previously unpublished data are presented; most of which has been submitted to the project group by the European Tyre and Rim Technical Organisation (ETRTO). A rather large number of documents in some way dealing with various aspects of the Directive were identified and studied. The key findings are presented here; in many cases accompanied with figures and diagrams from the original documents. The following is a compilation of conclusions from the literature review. It is concluded that noise emissions from road traffic sources have been reduced only to a small extent and only for power unit noise, whereas no improvements are seen for tyre/road noise over the latest decades. The almost desperate needs for substantial noise reductions in society sometimes expressed by governments have no chance to come true unless more efficient tyre/road noise reductions take place. From the present situation one can conclude that already today there are much stricter car tyre noise limits indirectly imposed by Directive 92/97/EEC than that of Directive 2001/43/EC; especially for OE tyres wider than 150-170 mm. In fact, it seems that Directive 2001/43/EC more or less can be neglected in comparison to 92/97/EC, the latter of which has been in force already for almost a decade. Thus, it seems that there is immediately a technical potential for reducing the tyre noise limit values to a performance corresponding to that which OE tyres on new vehicles during type approval have to meet. This technical potential is substantial, amounting to 2 -7 dB(A) depending on tyre width (near the lower end of the range at narrow widths and near the

FEHRL Report. 8 Final Report SI2.408210 Tyre/Road Noise – Volume 2
FEHRL
higher end at larger widths) and what the actual tyre/road noise targets are for OE tyres related to 92/97/EC testing. The different studies reviewed in this report are quite consistent in their results, wherever the results are comparable, with regard to noise levels of existing tyres and the possible conflicts with safety and rolling resistance. Identified lacks of data include data for tyres for vans and small trucks (C2 tyres) and also for very wide tyres. The range between the noisiest and the quietest car tyres; including all tested widths, is about 10 dB(A) on an ISO surface, provided that one includes a few hundred tyres in the analysis. If one looks only at a single dimension or exchangeable dimensions (section width), the range is approximately 6-8 dB. For truck tyres, the range is about 10 dB(A) between the noisiest and the quietest tyres. This suggests that even with current tyre technology there is a great potential for noise reduction simply by selection of appropriate tyres. The average car tyre within each width class has a margin to the limit of 4-6 dB(A); and relatively very few tyres are closer to the limit than 2 dB(A). The quietest tyres are 8-9 dB(A) below the limit. For truck tyres the margin from the average tyre to the limit is approximately 6 dB; very few tyres are closer to the limit than 2 dB(A). The quietest truck tyres are 9-10 dB(A) below the limit. The noise emission of retreaded tyres is similar to that of new tyres, except for the heavy vehicle tyres, for which the tested retreaded tyres were 2-4 dB(A) noisier than new tyres. However, this is not considered to be a general disadvantage of the retreading tech-nology; it is rather due to a poor selection of (probably) unmodern tread moulds for these tyres. There is a big difference in the width influence on noise measured on tyres from the 1980's (which probably were designed in the 1970's), through tyres of the late 1980's and early 1990's until the tyres measured around year 2000. The width influence was originally very prominent but has diminished to become insignificant in recent years; with a few exceptions: for very narrow tyres, for very wide tyres and when testing on other surfaces than the ISO surface. Within the width range of the majority of cars, tyre width does not appear to be a significant parameter for noise any more. It is only when tyres become exceptionally wide that noise appears to increase substantially. For truck tyres, it still seems justified to distinguish between the normal and snow classes. With regard to possible conflicts in the requirements for noise, safety and rolling resistance, the following conclusions are drawn: • Although several design properties of tyres seem to be in conflict when designing for
noise reduction by conventional pattern and rubber changes, no significant conflicts have been detected on market tyres in practice.
• None of the reviewed studies could detect a significant conflict between requirements for low noise and wet road braking or aquaplaning performance. One of them, based on a very small sample seemed to indicate such a conflict but when studying the data from another perspective it turned out that the assumed conflict could be explained by a tyre width influence.
• None of the reviewed studies could detect a significant conflict between requirements for low noise and low rolling resistance.

FEHRL Report Final Report SI2.408210 Tyre/Road Noise – Volume 2 9
FEHRL
• It follows that the limits with regard to skid resistance and rolling resistance which are planned for introduction within the near future cannot be justified from the point of view of noise; i.e., there is no reason to expect that the noise limits will mean that tyres with inferior performance concerning skid and rolling resistance will come into the market. Nevertheless, there may of course be other reasons for such limits, but this is not the subject of this report.
• Several low noise tyres that also meet high standards in other respects than noise, such as safety and rolling resistance, are available.
• The key point according to the industry is advanced technology: advanced technology will provide better performance for multiple parameters simultaneously.
Unfortunately, it seems that fashion and styling concepts largely influence the tyre market as well as tyre design nowadays. Since it seems that fashion (in visual appearance of tyres) is in some conflict with low noise design principles, there should logically be a potential for better acoustical characteristics of tyres if visual appearance would not have an influence on tread pattern design. The styling concept called plus-sizing is also in conflict with low noise characteristics, as it is with safety and economy. One way to counteract the plus-sizing trend is to make noise limits independent of tyre width (possibly with exception of extremely wide tyres). The tyre industry seems to accept that 1-2 dB(A) lower noise levels can be achieved with today's technology, but the industry considers that a technological break-through is required if tyre producers have to manage a noise reduction of more than 3 dB(A) for all the tyre categories. Independent research organizations estimate the potential for tyre noise reduction by measures on the tyres using existing technology as 4-6 dB(A). In the long term perspective (perhaps a decade), there are a number of promising concepts for low noise tyres or tyre/wheel units using new technology. Some of them may provide a breakthrough which will give substantially lower tyre/road noise in the future. A selection of such concepts is presented in the report. Except for very few tyres, all tyres tested in studies reviewed here already meet the limits of 2001/43/EC even after the last steps foreseen in the Directive. Therefore, it is recommended to lower the limiting values as soon as is possible. A formal proposal for lower tyre noise limits has been put forward from the German Federal Environmental Agency (UBA). The proposal is summarized as follows: • Proposed reductions versus the limit values of the Directive amount to 1 to 5 dB(A)
for passenger car tyres and 5 to 6 dB(A) for tyres for commercial vehicles. • Furthermore, the UBA is proposing that ambitious limit values for rolling resistance
should be introduced as soon as possible. • For the sake of better consumer information, all tyres should be labelled with the type-
approval values for tyre-rolling noise and rolling resistance. • Retreaded tyres should be included in the scope of the Directive, at least for
commercial vehicle tyres because of their remarkable share of about 50% on the market.

FEHRL Report. 10 Final Report SI2.408210 Tyre/Road Noise – Volume 2
FEHRL
A proposal from TRL Limited put forward in a recent report outlines new limits in a couple of steps that finally arrives at approximately the same levels as the UBA proposal for car tyres. Nothing in this report, except perhaps the views of tyre manufacturers, indicates that the UBA or the TRL proposals are unrealistic or unbalanced. On the contrary, both the UBA and the rather similar TRL proposals seem to well represent a balanced approach for new limit values, bearing in mind the various results of this report. Consequently, it is recommended to use the UBA and TRL proposals in all their details as a basis for the decision on future limits. It is also recommended that not only OE tyres but also replacement and retreaded tyres shall meet such noise limits. Due to developments in road surface construction and use, the ISO 10844 surface can nowadays be considered as reasonably appropriate for testing of tyre/road noise according to the Directive 2001/43/EC, representing surfaces used on low- or medium-speed streets in urban areas, especially if they are optimized for low noise. The ISO surface generally gives a somewhat lower noise level than most surfaces subject to normal traffic. However, it has been consistently demonstrated that the ISO surface does not represent the ranking of tyres on more rough-textured surfaces such as exist on some urban streets and most high-speed highways. The present smooth ISO surface is suitable for optimizing tread patterns but less suitable for determining appropriate measures related to vibration excitations from road textures. In general, low-speed roads tend to have lower textures where tread patterns are important while high-speed roads tend to have rougher textures. Consequently, it is very important that a second ISO surface is specified which has a significantly rougher texture than the present one. Otherwise, tyres will be sub-optimized only for low- or medium-speed streets in urban areas.

FEHRL Report Final Report SI2.408210 Tyre/Road Noise – Volume 2 11
FEHRL
1 Background
1.1 Introduction
Directive 2001/43/EC, introducing limiting values for noise emission from tyres for road vehicles, was published in 2001. The limiting values distinguished between different types and widths of tyres and had to be observed for type approval of all new tyres three years later. The Directive includes a measuring method which had been worked out by a group "ERGA-Noise" under the Commission in the early 1990's and the suitable limiting values had been studied and discussed at the end of that work. When the directive was proposed, the Parliament was not satisfied with the limiting values in the proposal and in the following conciliation procedure a kind of "compromise" was reached. This "compromise" required more stringent limits to be set a few years after the introduction of the first limits; provided some conditions were fulfilled; most notably that such stricter limits could be set without compromising safety. Many researchers and organizations have expressed as their view that the selected limiting values are too liberal and have a negligible effect on overall traffic noise in society. Simultaneously, more and more reports have highlighted the traffic noise problem and indicated that traffic noise reduction overall is too slow or non-existing. The environmental noise Directive 2002/49/EC, generally called END, also calls for more effective regulations directed at sources of noise. The Commission "considers that legislative proposals to reduce noise emissions from all major sources should be made on the basis of robust evidence supporting such proposals" and has decided to "evaluate the need to come forward with new legislative proposals" [Commission, 2002]. The above makes it obvious that studies are needed to clarify and evaluate the technical possibilities to lower the limits for noise emission of the tyres. Thus, the Commission issued a call for tenders for "Study about technical possibility to apply the tyre/road noise emission levels of Directive 2001/43/EC without compromising vehicle safety". The proposal of FEHRL won the contract and this report is part of Work Package 1 which aims at studying the “Potential for Reducing Tyre Noise Limits”.
1.2 Objectives
The aim of this report is to collect and compile information related to the technical possibilities to require tyres to meet lower noise limits than the limits currently in force; considering also the effect that lower limits may have on other important tyre performance characteristics such as safety (most notably wet skid resistance) and rolling resistance.

FEHRL Report. 12 Final Report SI2.408210 Tyre/Road Noise – Volume 2
FEHRL
1.3 Time trends in vehicle and traffic noise
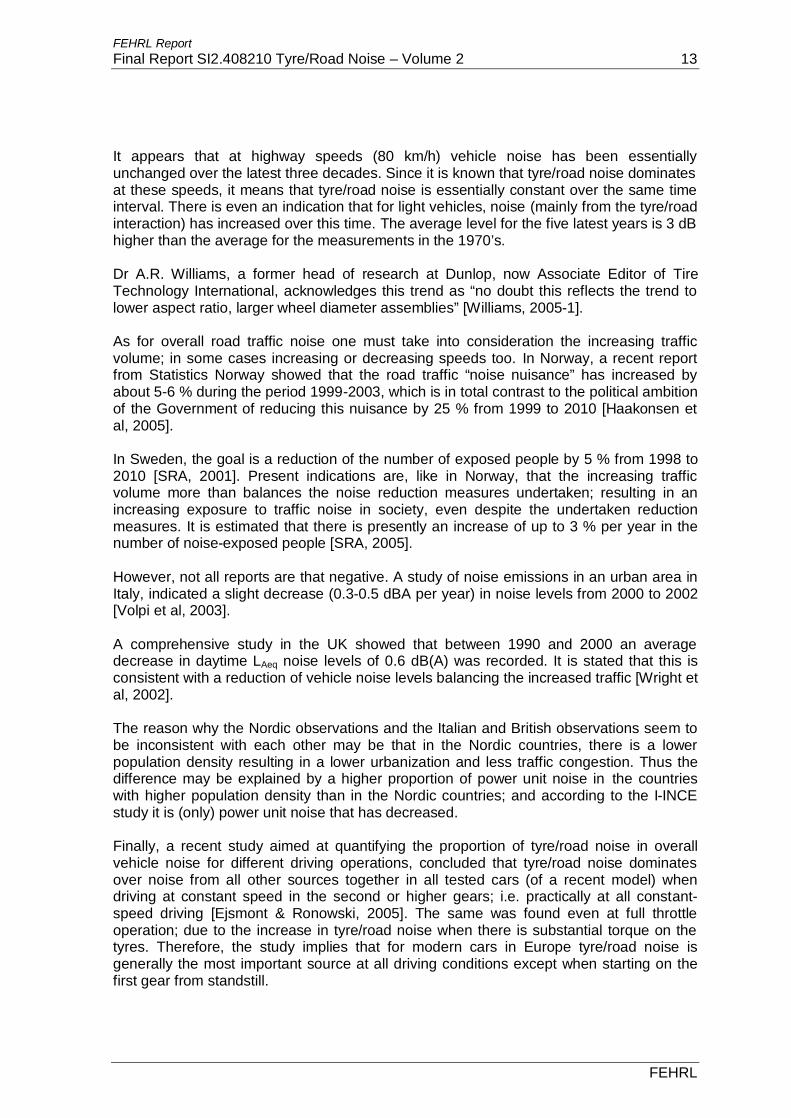
To look at time trends in noise emission from individual vehicles and from traffic, as well as analyzing the reasons for them, may give some hints related to future needs and possibilities. Simultaneously with the development of the tyre noise directive, the International Institute of Noise Control Engineers (I-INCE) conducted a study on the "The Effect of Regulations on Road Vehicle Noise" [Sandberg, 2001]. The report emphasized that although the vehicle noise reductions in actual traffic have been less than anticipated, there have been many and major positive effects from them. Due to the selected measuring method, mainly power unit noise had been affected. Tyres had been essentially unaffected by the regulations, at least until the latest tightening of limits which occurred in 1996. The report concluded that at high speeds, and for light vehicles also at medium speeds, noise had remained almost unaffected by the limits. However, substantial reductions had been achieved for heavy vehicles at low speeds. One of the reasons for the inefficiency of the noise limits was that the selection of limits during the first time period was too conservative and they were tightened too slowly. The major reason for the inefficiency at high speeds (and medium speeds for light vehicles) was that there were no efficient regulations for tyre noise. One illustration of the above mentioned inefficiency at high traffic speeds is shown in Fig. 1. This diagram shows vehicle noise levels (100+ vehicles in each point) measured with the SPB method beginning in the early 1970’s and continuing through 2005. The measurements have been made with similar methods and on similar road surfaces (however, the short-term variation partly indicates surface variations from year to year).
.. 1910 ..931&32
.. 19
10 ..
93
1&32
75
80
85
90
1970 1975 1980 1985 1990 1995 2000 2005 2010Measured year
L AE,
80
[dB
]
Heavy vehicleLight vehicle
Fig. 1. Vehicle population mean noise levels for light and heavy vehicles, as measured in different years at 80 km/h. Data collected in Denmark and in Sweden. The noise levels have been re-calculated to single-event equivalent levels normalized to 1 s (the number over each point identifies the measurement series). Diagram updated by this author in cooperation with J. Kragh, Danish Road Institute, based on [Sandberg, 2001].
FEHRL Report Final Report SI2.408210 Tyre/Road Noise – Volume 2 13
FEHRL
It appears that at highway speeds (80 km/h) vehicle noise has been essentially unchanged over the latest three decades. Since it is known that tyre/road noise dominates at these speeds, it means that tyre/road noise is essentially constant over the same time interval. There is even an indication that for light vehicles, noise (mainly from the tyre/road interaction) has increased over this time. The average level for the five latest years is 3 dB higher than the average for the measurements in the 1970’s. Dr A.R. Williams, a former head of research at Dunlop, now Associate Editor of Tire Technology International, acknowledges this trend as “no doubt this reflects the trend to lower aspect ratio, larger wheel diameter assemblies” [Williams, 2005-1]. As for overall road traffic noise one must take into consideration the increasing traffic volume; in some cases increasing or decreasing speeds too. In Norway, a recent report from Statistics Norway showed that the road traffic “noise nuisance” has increased by about 5-6 % during the period 1999-2003, which is in total contrast to the political ambition of the Government of reducing this nuisance by 25 % from 1999 to 2010 [Haakonsen et al, 2005]. In Sweden, the goal is a reduction of the number of exposed people by 5 % from 1998 to 2010 [SRA, 2001]. Present indications are, like in Norway, that the increasing traffic volume more than balances the noise reduction measures undertaken; resulting in an increasing exposure to traffic noise in society, even despite the undertaken reduction measures. It is estimated that there is presently an increase of up to 3 % per year in the number of noise-exposed people [SRA, 2005]. However, not all reports are that negative. A study of noise emissions in an urban area in Italy, indicated a slight decrease (0.3-0.5 dBA per year) in noise levels from 2000 to 2002 [Volpi et al, 2003]. A comprehensive study in the UK showed that between 1990 and 2000 an average decrease in daytime LAeq noise levels of 0.6 dB(A) was recorded. It is stated that this is consistent with a reduction of vehicle noise levels balancing the increased traffic [Wright et al, 2002]. The reason why the Nordic observations and the Italian and British observations seem to be inconsistent with each other may be that in the Nordic countries, there is a lower population density resulting in a lower urbanization and less traffic congestion. Thus the difference may be explained by a higher proportion of power unit noise in the countries with higher population density than in the Nordic countries; and according to the I-INCE study it is (only) power unit noise that has decreased. Finally, a recent study aimed at quantifying the proportion of tyre/road noise in overall vehicle noise for different driving operations, concluded that tyre/road noise dominates over noise from all other sources together in all tested cars (of a recent model) when driving at constant speed in the second or higher gears; i.e. practically at all constant-speed driving [Ejsmont & Ronowski, 2005]. The same was found even at full throttle operation; due to the increase in tyre/road noise when there is substantial torque on the tyres. Therefore, the study implies that for modern cars in Europe tyre/road noise is generally the most important source at all driving conditions except when starting on the first gear from standstill.

FEHRL Report. 14 Final Report SI2.408210 Tyre/Road Noise – Volume 2
FEHRL
The conclusion is that noise emissions from road traffic sources have been reduced only to a small extent and only for power unit noise, whereas no improvements are seen for tyre/road noise over the latest decades. The almost desperate needs for substantial noise reductions in society sometimes expressed by governments have no chance to come true unless more efficient tyre/road noise reductions take place. It appears important to study the potentials for such improvements. 1.4 Some recent policy statements
The European Road Federation (ERF) issued in 2006 a report named "The Socio-Economic Benefits of Roads in Europe" [ERF, 2006]. In this report the following policy statements related to noise issues can be found: "….there is a clear need for Europe to take a driving role in promoting targeted legislation, sharing solutions and achieving a common understanding of the potential for progress in order to reduce the road traffic-related noise level." "Future progress can be expected through new tyre design (such as randomized read1 pattern, narrow lateral grooves, etc.) and quieter engines (through acoustic shielding of the engine and multiple muffler systems). In recent years, however, the automotive sector's R&D efforts have been matched by progress from the road sector itself. Different road surfaces offer varying acoustic performance levels and constitute an affordable solution to tyre-road interaction noise." It may be particularly noteworthy from this that the ERF suggests that "there is a clear need for Europe to take a driving role in promoting targeted legislation". During the course of this project, the European Commission issued a final report for its initiative "CARS 21" [Commission, 2006]. The CARS 21 had a membership of its "High Level Group" including people from the Commission, Member States, the EU Parliament, Industry, Trade Unions, NGOs and Users. The 71-page final report deals with noise only as a very marginal item, stating only the following: "Further to its 1996 Green Paper (COM(96)540), the European Commission developed a new framework for noise policy, based on shared responsibility between the EU, national and local level. This document led to a comprehensive set of measures, including the Directive on Environmental Noise aimed at requiring competent authorities in Member States to produce strategic noise maps on the basis of harmonised indicators, to inform the public about noise exposure and its effects, and to draw up action plans to address noise issues. Recommendation n° 11: As in other policy areas, it is recommended that actions on noise policy should be proportionate and take appropriate account of the funct ioning of the internal market. A holistic approach should be pursued to tackle noise issues, involving all relevant stakeholders and systems (e.g. traffic management, driver behaviour, vehicle and tyre technology, road surfaces)." Obviously, there is no concrete statement regarding noise policy related to road vehicles. 1 Author's comment: "read" should read "tread"

FEHRL Report Final Report SI2.408210 Tyre/Road Noise – Volume 2 15
FEHRL
2 Tyre noise in relation to vehicle noise limits according to Directive 92/97/EC
2.1 Why this topic is of interest here
It may not be immediately obvious why the relation between tyre and vehicle noise limits is of interest to the main topic of this report. However, the reason is that the present limits for vehicle noise, as given in Directive 92/97/EC, in many cases put a stricter requirement on noise emission of tyres than the specialized tyre noise Directive 2001/43/EC. Therefore, it is interesting to compare these requirements.
2.2 Requirements based on the existing Directives
The following text and diagrams are adapted from the Tyre/Road Noise Reference Book [Sandberg & Ejsmont, 2002]. Tyre manufacturers must not only make sure that their tyres meet the limits of Directive 2001/43/EC, they also have to meet the requirements of the vehicle industry. Of course, vehicle manufacturers are very sensitive to the tyre/road noise inside their vehicles, since this is a major part of the acoustic signature of the vehicle in the ears of the customer. But the vehicle manufacturers also need tyres that are sufficiently quiet with regard to exterior noise during vehicle noise testing according to the ISO 362 method and its corresponding EU Directive or ECE Regulation. This feature is addressed in Fig. 2. Since 1996, new cars have to meet a nominal noise emission limit of 74 dB(A), tested at full-throttle acceleration on 2nd and 3rd gears past two microphones from a start speed of 50 km/h up to around 65 km/h. This is illustrated as the red broken line at 74 dB(A) in Fig. 2. A vehicle manufacturer would then probably require that tyre/road noise is at most 71 dB(A), since this gives the vehicle manufacturer the possibility to accept 71 dB(A) from the power unit of his vehicle. If he would accept 72 dB(A) of tyre/road noise, his power unit noise would have to be lower than 70 dB(A), and this would be much harder to achieve. Therefore, we can assume that in most cases the tyre/road noise target would be a maximum of 71 dB(A), at full-throttle acceleration. The target value indicated above is a very conservative assumption since, for example, [Harrison, 2003] suggests a target of 68 dB(A) for tyre/road noise during this test, when the overall vehicle noise target value is 74.2 dB(A). Further, the actual type approval values for cars are on the average 72 dB [Steven, 2002], which means that they would measure 73.0-73.9 dB(A) when considering also the subtraction of 1 dB and truncation. This would also call for a lower target value for tyre/road noise than 71 dB(A). Nevertheless, the following calculation assumes a target value o 71 dB(A). The noise increase due to torque at accelerations, typical of the present ISO 362, ranges from 0 to 6 dB, depending on tyre, gear selected and the engine power. On the second gear this increase is generally 2-4 dB (3.3 dB was predicted according to [Ejsmont & Ronowski, 2005]). On the third gear, this is generally around 1-2 dB. If 2 dB is chosen to

FEHRL Report. 16 Final Report SI2.408210 Tyre/Road Noise – Volume 2
FEHRL
represent the torque effect as an average for the two gears used in ISO 362, this is a rather conservative value. Tyres meeting the 71 dB(A) target for full-throttle would then emit a maximum of 69 dB(A) at free-rolling; probably even lower. The speed would be around 57 km/h, since this is approximately an average speed of accelerating vehicles (average for the 2nd and 3rd gears) when the maximum noise level is read. Assuming a speed coefficient B of 35 (see [Sandberg & Ejsmont, 2002]), 69 dB at 57 km/h corresponds to 74 dB at 80 km/h, the latter of which is the reference speed for the tyre noise limits of 2001/43/EC.
68
70
72
74
76
78
Speed [km/h]
SPL
[dB
(A)]
50 60 70 80 90
Vehicle noise limit (full-throttle accel.)
35*log V/57Tyre noise target
at full-throttle
Tyre noiseat free rolling
Tyre noise at 80 km/h
Fig. 2. Attempt to illustrate how the current vehicle noise limit (74 dB for cars) results in target requirements on tyre/road noise for tyres subject to considerable torque. This tyre noise target with torque can be translated to a target at free-rolling, and further translated to a corresponding noise level for free-rolling at 80 km/h. This means that tyre manufacturers supplying original equipment (OE) tyres to car manufacturers are likely to be forced indirectly by the manufacturers to supply tyres that emit a maximum of 74 dB(A) during a test according to the 2001/43/EC. This is lower than the 2001/43/EC tyre noise limits for all tyres except the very smallest ones2. As said before, the above assumes a very conservative target for tyre/road noise. If the target of [Harrison, 2003] would be used instead, the tyre manufacturers would have to supply tyres that emit a maximum of 71 dB(A) during the test of 2001/43/EC. As will be shown later, even this target is clearly achievable with today’s tyres. Therefore, it is likely that the target values for OE tyres lie in the range of 71 to 74 dB(A). According to Michelin, the OE and replacement tyres in Europe are very similar [Penant, 2005]; thus approximately the same should hold true for all car tyres. See also Section 14 on this. It follows that the requirements of 2001/43/EC are likely to be much less stringent for medium and large cars than the indirect limits following from the current vehicle noise limits. It also follows that the Directive 2001/43/EC can be neglected in comparison to the Directive 92/97/EC which has been in force since 1996. 2 Considering that on shall truncate the measured level and subtract 1 dB before comparing to the limits
FEHRL Report Final Report SI2.408210 Tyre/Road Noise – Volume 2 17
FEHRL
For heavy vehicles, it is extremely difficult to make a similar comparison since the actual test speed, the gear and the slip of the tyre varies to a very large extent from vehicle to vehicle. However, one may find a few cases where the same as above would happen; although it is much rarer than for cars.
2.3 Requirements based on the new measuring method for vehicle noise
A working group under ISO, designated ISO/TC 43/SC 1/WG 42, is currently working out a new measuring method for vehicle noise, intended to replace the existing method in ISO 362 which is the basis for Directive 92/97/EEC. The new method, which aims at providing driving conditions which are more common in actual traffic than the present full-throttle operation, is now in its final stage within the ISO approval procedure; recently having reached the Draft International Standard (DIS) level and being prepared for Final Draft International Standard (FDIS). Simultaneously, the GRB (the noise group under UN/ECE/WP 29) is preparing a similar method for use in the ECE regulations on vehicle noise. Since the Commission has expressed the intention to adopt such a future ECE standard as its own, one may assume that the essentials (if not all) of the ISO/DIS 362-13 will be carried over as an amended Directive. The new method will include the following features of relevance to tyre/road noise: For cars:
• One part of the test will be a constant speed pass-by, normally at 50 km/h (in the present ISO 362 only full-throttle operation takes place)
• There will still be a full-throttle test (maximum acceleration) but it will be at a slightly lower speed (50 instead of around 60 km/h) and will for most vehicles be made in higher gears than is presently the case. The accelerations will also be significantly lower.
• Instead of just calculating the arithmetic average of the tests on the two gears, as is made today, the new method will combine the two values in a complicated manner depending on the vehicle power and mass.
Most independent noise researchers consider the constant speed component of the test as being almost 100 % a tyre noise test (which is new). The full-throttle component of the test can be compared to today’s test as follows: Significantly lower accelerations will mean lower tyre noise increase due to torque (perhaps by 1 dB) and the somewhat lower driving speed will also mean lower tyre noise (perhaps by 2 dB). However, the lower engine speeds (higher gears) will also create lower power unit noise and it is rather likely that the changes in power unit and tyre noise will largely balance each other. The combination of the full-throttle and the constant speed test into a final value will be critical for the outcome, with regard to the relations between tyre noise and power unit noise. For most vehicles, the constant speed value will have lower weight than the full-throttle values.
3 Which is the formal designation of the present ISO draft

FEHRL Report. 18 Final Report SI2.408210 Tyre/Road Noise – Volume 2
FEHRL
If the limiting values will be adjusted to imply approximately the same stringency with respect to the vehicle market as is currently the case (which has been discussed), it should mean that the new limiting values will be reduced by 2-4 dB [CLEPA, 2005]. Assume 2 dB and the new limit for cars will be 72 dB. Putting this into Fig 2 instead of 74 dB (at 50 km/h), assuming the torque effect to be 1.5 dB rather than 2 dB in the old method, plus assuming that vehicle manufacturers will accept tyre noise to be 2 dB below the limit, it will mean that the tyre noise requirement will be about 1 dB less strict than that of the old method. The author’s conclusion is that the new method will mean a higher proportion of tyre noise in the overall vehicle noise. If the new ECE regulations will be based on this method, and if the limiting values will be adjusted to imply approximately the same stringency with respect to the vehicle market as is currently the case, it will mean that the new ISO 362 and the amended vehicle noise Directive following this will be a more severe requirement for OE tyres as the present tyre noise Directive; at least for the larger half of the car market. However, it will also mean that any future reductions in vehicle noise limit will have to be borne almost entirely by the tyres. If the proposal outlined as Stage 2 (suggested from the year 2015) in [Chair R51, 2005] will be realized, it will very likely mean substantially stricter tyre noise limits than the present ones of Directive 2001/43/EC; for the widest tyres probably around 5 dB lower than present limits.
2.4 Conclusions
From the present situation one can conclude that already today there are much stricter car tyre noise limits indirectly imposed by Directive 92/97/EEC than that of Directive 2001/43/EC; especially for OE tyres wider than 150-170 mm. In fact, it seems that Directive 2001/43/EC more or less can be neglected in comparison to 92/97/EC, the latter of which has been in force already for almost a decade. With the new measuring method currently being worked out, this indirect car tyre noise requirement will probably not immediately become more severe. However, with the lowering of future vehicle noise limits, this indirect tyre noise requirement will become more severe than it is presently according to the existing measuring method. Thus, it seems that there is immediately a technical potential for reducing the tyre noise limit values to a performance corresponding to that which OE tyres on new vehicles during type approval have to meet. This technical potential is substantial, amounting to 2-7 dB(A) depending on tyre width (near the lower end of the range at narrow widths and near the higher end at larger widths) and what the actual tyre/road noise targets are for OE tyres related to 92/97/EC testing. In the future, if vehicle noise is to be reduced in comparison to the present situation, and assuming that the new method is in force, almost all the noise reduction must be provided by the tyres. Very little noise reduction contribution will have to be provided by the power units of the cars; compared to the power unit noise of today’s new cars.

FEHRL Report Final Report SI2.408210 Tyre/Road Noise – Volume 2 19
FEHRL
3 The limits in Directive 2001/43/EC
The following is a summary4 of the limiting values specified in Directive 2001/43/EC. The Directive requires new tyres to meet the limits indicated in Table 1 and illustrated in Fig. 3. The measuring method is the coast-by method, with a reference surface according to ISO 10844. For cars (C1) and vans (C2), all measured and limit values are normalised to 80 km/h and for trucks (C3) to 70 km/h. Note that this means that the values for truck tyres are not directly comparable to those for the other categories due to the speed difference. Replacement tyres are not yet subject to these noise limits which concern only OE tyres. For car tyres (class C1), the limits depend on tyre section width; see the upper half of Fig. 3. Reinforced tyres are allowed one extra dB and "special" tyres (e.g. for off-road use) are allowed two extra dB. For van or light truck tyres (class C2), as well as for heavy truck tyres (class C3), the limits do not depend on tyre width, rather on the use of the tyres: "Normal", "Winter" and "Special". "Special" tyres are e.g. tyres for use on trucks partly driven off-road, for example trucks carrying building construction material, like gravel.
Table 1. Noise emission limits for new tyres according to Directive 2001/43/EC. Note that the values in the 3rd and 4th columns are only indicative. Final values will be decided after further studies have been made by the Commission (i.e., this study and possibly others).
Type of tyre, section width [mm]
Limit value [dB(A)]
Limits after first tightening
Limits after second tightening
Tyres for cars (C1)****: <145 72* 71* 70
>145 <165 73* 72* 71 >165 <185 74* 73* 72 >185 <215 75** 74** 74
> 215 76*** 75*** 75 Tyres for vans and light trucks (C2):
Normal 75 Snow 77
Special 78 Tyres for heavy trucks (C3):
Normal 76 Snow 78
Special 79
* Limit values in column 2 shall apply until 30 June 2007; limit values in column 3 shall apply as from 1 July 2007 ** Limit values in column 2 shall apply until 30 June 2008; limit values in column 3 shall apply as from 1 July 2008 *** Limit values in column 2 shall apply until 30 June 2009; limit values in column 3 shall apply as from 1 July 2009 **** Reinforced car tyres are allowed 1 dB higher limits **** "Special" car tyres are allowed 2 dB higher limits
4 The main part of this section is copied from the Tyre/Road Noise Reference Book [Sandberg & Ejsmont, 2002]
FEHRL Report. 20 Final Report SI2.408210 Tyre/Road Noise – Volume 2
FEHRL
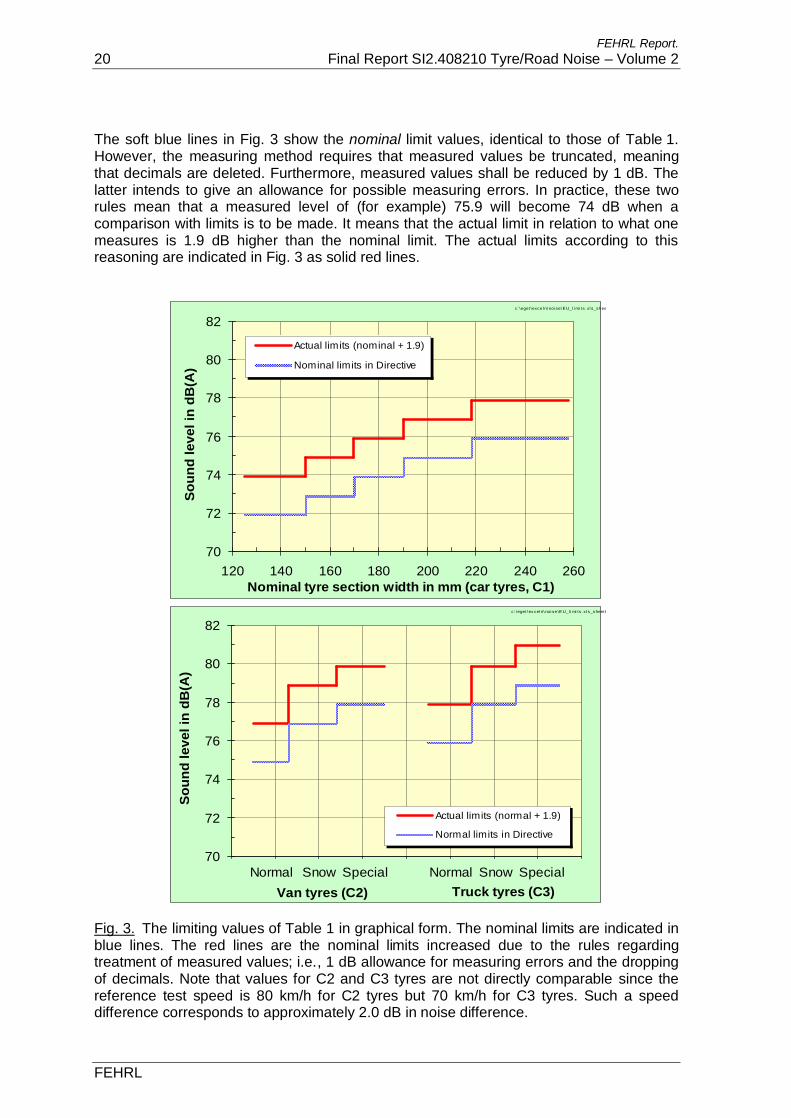
The soft blue lines in Fig. 3 show the nominal limit values, identical to those of Table 1. However, the measuring method requires that measured values be truncated, meaning that decimals are deleted. Furthermore, measured values shall be reduced by 1 dB. The latter intends to give an allowance for possible measuring errors. In practice, these two rules mean that a measured level of (for example) 75.9 will become 74 dB when a comparison with limits is to be made. It means that the actual limit in relation to what one measures is 1.9 dB higher than the nominal limit. The actual limits according to this reasoning are indicated in Fig. 3 as solid red lines.
70
72
74
76
78
80
82
120 140 160 180 200 220 240 260Nominal tyre section width in mm (car tyres, C1)
Sou
nd le
vel i
n dB
(A)
Actual limits (nominal + 1.9)
Nominal limits in Directive
c: \eget \exce l n\ noi se\ E U_l i mi ts. xl s_sheet6
70
72
74
76
78
80
82
Sou
nd le
vel i
n dB
(A)
Actual limits (normal + 1.9)
Normal limits in Directive
Normal Snow Special Normal Snow SpecialVan tyres (C2) Truck tyres (C3)
c: \eget \ex cel n\ noi se\E U_l i mi ts. xl s_s heet6
Fig. 3. The limiting values of Table 1 in graphical form. The nominal limits are indicated in blue lines. The red lines are the nominal limits increased due to the rules regarding treatment of measured values; i.e., 1 dB allowance for measuring errors and the dropping of decimals. Note that values for C2 and C3 tyres are not directly comparable since the reference test speed is 80 km/h for C2 tyres but 70 km/h for C3 tyres. Such a speed difference corresponds to approximately 2.0 dB in noise difference.

FEHRL Report Final Report SI2.408210 Tyre/Road Noise – Volume 2 21
FEHRL
4 Essential data measured up to 1995
In this report there is a distinction between data measured in the latest decade and data measured earlier. There are three reasons for this:
• From 1996, vehicles had to meet the present noise limits according to which tyre noise has become an important concern (see Section 2.2), and this might have affected the tyre population at least the OEM tyres
• At about the same time it became obvious that tyre noise limits would be introduced within a few years, actual to-be limits had been discussed, and it is likely that tyre producers started to take this fact into consideration
• The earlier data are of less relevance than the more recent data; for example since the ISO 10844 surface became mandatory to use from 1996 in vehicle noise measurements.
Many organizations have carried out measurements comparing the noise emission of various tyres. However, in most cases only a small number of tyres (10 or less) have been compared and the selected tyres have been new, being of similar dimensions and designs. In such cases, it was common that very small differences were found, generally only 1-3 dB(A). This was often taken as evidence of a difficulty to affect noise emission by tyre changes or by the introduction of limit values. On the other hand, it was also popular to test the tyres on quite different road surfaces, especially including newly laid porous asphalt surfaces, in which case one will find a rather large difference due to the surfaces (generally say 5-7 dB). The effect of selecting rather similar tyres but very different road surfaces in studies like this resulted in the conclusion that one should concentrate on road surface design and might forget about the tyre design. However, when including a larger tyre sample in the studies (say 20 or more tyres), the picture was different. An example is the results of testing 20 truck tyres, presented in Fig. 4. Although the dimension was not varied and the tyres were not substantially worn, there is a range of 10 dB between the quietest and the noisiest tyres, with 4 dB between 7 rib tyres (for steering and trailer axles) and 8 dB between 13 block-pattern tyres (for drive axles). The test track surface was of a design similar to an ISO 10844 surface but with maximum 12 mm chippings instead of 8 mm. According to experience, it is likely that tests on an ISO surface would have indicated greater differences between tyres. While the coming tyre noise directive was discussed, i.e. in the first half of the 1990’s, a few tests of larger number of tyres were conducted, using the supposed conditions of the measuring method specified in the draft directive. By that time, the first ISO surfaces were also available. To obtain a basis for the limiting noise levels, the Commission ordered tests according to the proposed method to be conducted in 1992-1993. Three organisations conducted such tests: UTAC in France, TRL in the UK and FIGE GmbH in Germany. These data were reported directly to the Commission and to ERGA-NOISE but were never officially published (as far as the author knows). In the ERGA-NOISE document series, these were:

FEHRL Report. 22 Final Report SI2.408210 Tyre/Road Noise – Volume 2
FEHRL
• Document 39 of ERGA/NOISE: TRL [Nelson et al, 1993] • Document 44 of ERGA/NOISE: UTAC [Marduel, 1995] • Personal communication with Mr. H. Steven, FIGE GmbH (currently TÜV),
Herzogenrath, Germany, in the form of tables “Anhang A” [Steven, 1993]. Essentially the same data was available in [Köllman, 1993].
0
1
2
3
88 89 90 91 92 93 94 95 96 97 98 99 100
Sound pressure level [dB(A)]
Num
ber o
f tyr
es
Rib patternBlock pattern
Fig. 4. Tyre/road noise from 20 truck tyres (dimension 12R22.5), measured in 1987 by VTI with an "old" CPX method on a dense asphalt concrete surface (MAB12T, see text) [Sandberg & Ejsmont, 2002].
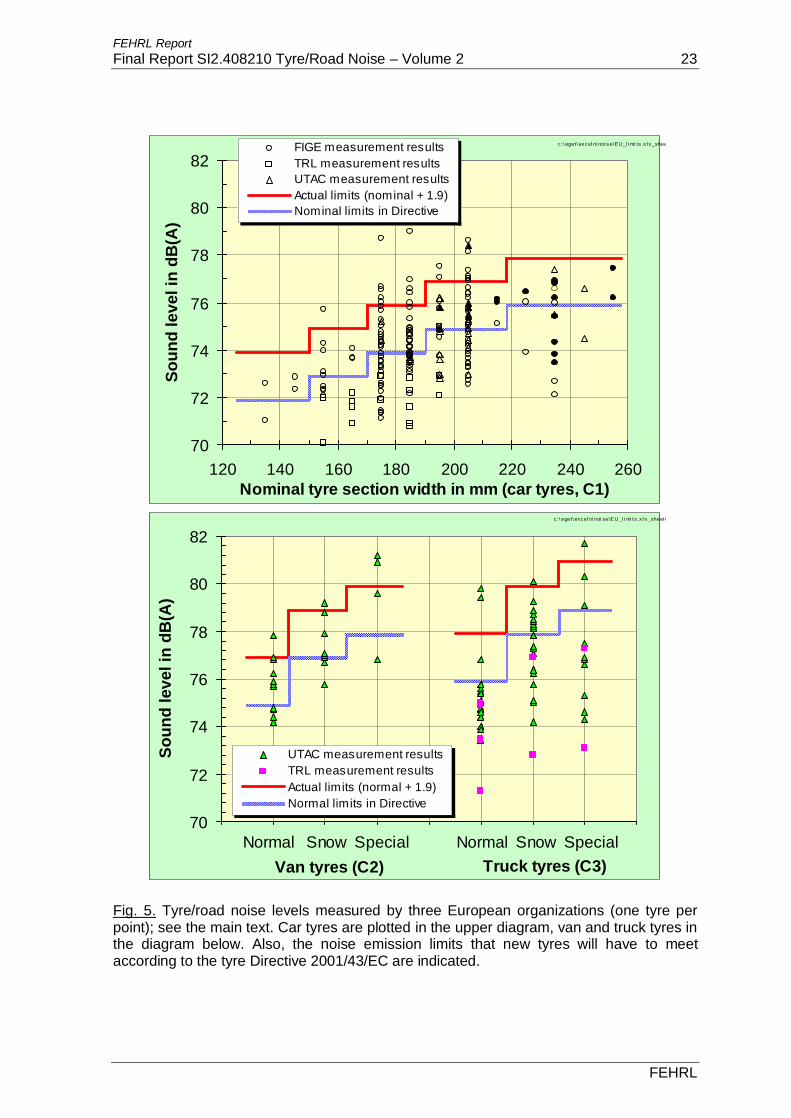
Most of these data, which were measured in 1992-93, are plotted in Fig. 5. It should be noted that the FIGE tests [Steven, 1993], which included the majority of the measured car tyres, were made with a slightly different method (trailer coast-by). The basic data measured at 80 km/h on an ISO surface and corrected for temperature (according to the draft EU Directive) were used. In order to be able to use the FIGE data here, despite the different measurement method, this author has made the following data processing: All original levels have been increased by 3.4 dB(A), a value obtained by FIGE in a
separate test in which they checked the relation between the method they used and the EU draft method (ERGA document No. 41, from ACEA, Dec. 1993).
Fig. 5 shows the measured values for the three studies: one point per tyre. In the figure, also the nominal limits have been indicated, as well as these nominal limits increased by the 1.9 dB following due to the treatment of measured values discussed above. The figure shows that a relatively small number of the tested tyres exceed the limits. Note that several of the car tyres that exceed the limits in the figure in fact are reinforced or special tyres that are allowed an extra 1 or 2 dB. Thus it can concluded that only a small percentage of the tested tyres on the market at the beginning of the 1990's exceeded the limits to be established a decade later; namely about 9 % of the car tyres, 17 % of the van tyres and 7 % of the truck tyres.
FEHRL Report Final Report SI2.408210 Tyre/Road Noise – Volume 2 23
FEHRL
70
72
74
76
78
80
82
120 140 160 180 200 220 240 260Nominal tyre section width in mm (car tyres, C1)
Soun
d le
vel i
n dB
(A)
FIGE measurement resultsTRL measurement resultsUTAC measurement resultsActual limits (nominal + 1.9)Nominal limits in Directive
c :\ eget\ excel n\ noi se\E U_l i mi ts .x l s_sheet 6
70
72
74
76
78
80
82
Soun
d le
vel i
n dB
(A)
UTAC measurement resultsTRL measurement resultsActual limits (normal + 1.9)Normal limits in Directive
Normal Snow Special Normal Snow SpecialVan tyres (C2) Truck tyres (C3)
c :\ eget\ excel n\ noi se\E U_l i mi ts .x l s_sheet 6
Fig. 5. Tyre/road noise levels measured by three European organizations (one tyre per point); see the main text. Car tyres are plotted in the upper diagram, van and truck tyres in the diagram below. Also, the noise emission limits that new tyres will have to meet according to the tyre Directive 2001/43/EC are indicated.

FEHRL Report. 24 Final Report SI2.408210 Tyre/Road Noise – Volume 2
FEHRL
However, at that time, the European Tyre and Rim Technical Organisation (ETRTO) considered the limits as being 2 dB too strict; see the introductory "Motivation" in [Commission, 1997]. As a contrast, the Nordic countries acted together and in a letter to the Commission suggested limits, the values of which were similar to the finally decided ones, but which in practice were about 2 dB more stringent as they expressly did not allow for any truncation and subtraction of the measured values [Nielsen et al, 1995]. The data in Fig. 5 also shows that there were for the most common tyre dimensions tyres which were substantially quieter than the limits would allow; namely 5-6 dB below the maximum allowed levels for car tyres and 7-8 dB for the heavy truck tyres. The same data were used in a Dutch study to predict the influence on road traffic noise of two tyre noise regulation scenarios [van Blokland et al, 1996]. The authors specified one scenario having one single limit for all tyres within the C1, C2 and C3 categories, and another one having multiple limits within each category. This was approximately what was later decided on in Directive 2001/43/EC with a distinction between car tyre widths and heavy tyre types. The result was that multiple limits gave much better effect; the single limit scenario would need an unrealistically low limit in order to have an effect on overall traffic LAeq levels of 1 dB or higher. In order to have such an effect with the multiple limit scenario, about 35-45 % of the (then) present tyres would need to be replaced with quieter ones. Since the number of tyres of the (then) existing tyres to be eliminated by the coming limits would be only 7-9 %, provided the measurements had shown results that were fairly representative of the entire European market, it was obvious already from the beginning that the first limits would have a negligible effect on overall traffic noise.

FEHRL Report Final Report SI2.408210 Tyre/Road Noise – Volume 2 25
FEHRL
5 Noise levels of modern, new tyres
5.1 Measurements on about 100 car tyres in Sweden and Poland
As part of a study to explore the relations between noise, friction and rolling resistance of tyres, approximately 100 car tyres were selected for testing. Most of these tyres were tyres from the replacement market. It was attempted to include a great variety of tyres (although dimensions were normally 185/65R15 or 195/65R15), including tyres that were expected to be "quiet" as well as "noisy", and to include popular market tyres. The results are presented in Fig. 6. The figure is based on measurements at 80 km/h on a typical public road in Sweden in 1997-99 with the CPX5 method. The chosen road surface was the most common one in Sweden on high-traffic roads in the late 20th century. Measurements were also made on two other public road surfaces. The range of these measured noise levels is 10 dB, but when one excludes the "worst" tyres, which were studded, the range narrows down to 9 dB. Two thirds of the tyres are within 2.5 dB. Most studies of tyre noise are made on the ISO 10844 surface. In this project such measurements were made on a replica of an ISO surface covering one of the drums of TUG. Fig. 7 shows the results on this surface. The range of these measured noise levels is 8 dB, excluding the smooth and pattern-less PIARC reference tyre. Studded tyres are not included here since such tyres make damage to drum surfaces. Two thirds of the tyres are, again, within 2.5 dB.
0
5
10
15
20
94 96 98 100 102 104 106
Noise level [dB(A)]
Num
ber o
f tes
ted
tyre
s
Speed rating S,TSpeed rating HSpeed rating V,Z,WWinter tyres
Smooth asphalt (DAC16), 80 km/h
Fig 6. Tyre/road noise from approximately 100 car tyres, measured with the CPX method in 1997-99 by TUG and VTI in cooperation. The road surface was a dense asphalt concrete surface DAC 0/16 in "average" condition. From [Sandberg & Ejsmont, 2002].
5 CPX = Close-Proximity; a method in which two microphones are located close to a test tyre and the test tyre is run in free-rolling conditions for a certain distance under which the mean noise level is measured. Generally, such values are approx 20 dB higher than coast-by values at 7.5 m, due to the closer distance.

FEHRL Report. 26 Final Report SI2.408210 Tyre/Road Noise – Volume 2
FEHRL
0
5
10
15
20
92 93 94 95 96 97 98 99 100 101 102
Noise level [dB(A)]
Num
ber o
f tes
ted
tyre
sSpeed rating S,TSpeed rating HSpeed rating V,Z,WWinter tyre
DRUM, ISO surface, 80 km/h
Winter tyre MS 01
Winter tyre MS 02
Summer tyre HN50
PIARC tyre smooth
Fig. 7. Tyre/road noise from 94 car tyres, measured 1997-99 by TUG with the CPX method on a replica of an ISO 10844 surface. From [Sandberg & Ejsmont, 2002].
Smooth, pattern-less tyres are often considered as the ultimate tyres in terms of low noise. The measurement here indicated that if this would be the case, the technical potential for reduction by playing with the tread pattern is about 6 dB from the middle of the range and 2-3 dB from the quietest tyres found. The results also showed that speed ratings do not correlate well with noise levels. They further showed that the quietest tyres are some winter tyres, whereas there are also noisy winter tyres. A further analysis showed that winter tyres prepared for studs as a group had the same average noise level as summer tyres, but winter tyres not intended to have studs were about 1 dB(A) quieter than summer tyres and than winter tyres intended for studs. Evidently, the principles used in winter tyres not intended to use studs are useful to create quieter tyres. 5.2 Measurements in Germany
In Germany, very extensive measurements have been made by TÜV, sponsored by the Federal Environmental Agency (Umweltbundesamt – UBA), over the period 1998-2002. First, as part of activities for the award of the "Blue Angel" ecolabel to low-noise and fuel-saving tyres, a representative selection of 48 different tyre types sold on the market was used to determine the state of the art [Stenschke & Jäcker-Cüppers, 1999]. The study showed that the noise emissions from all 48 tyres, using two of the most commonly used tyre widths, were well below the limit values required in the (then) proposed directive. See Fig. 8.

FEHRL Report Final Report SI2.408210 Tyre/Road Noise – Volume 2 27
FEHRL
68 69 70 71 72 73 74 75 760
20
40
60
80
100 tyre size 175/70 R13 tyre size 195/65 R15
Fig. 8. Noise emissions from 48 car tyre types measured according to the proposal for Directive 2001/43/EC. Measurements made on the ISO 10844 test track at TÜV Allach, reference temperature: 20°C. From [Stenschke & Jäcker-Cüppers, 1999]. Note that the difference between measured values and limits are even higher than indicated in the figure since measured values should also be truncated and 1 dB shall be subtracted before comparing to limits. A later project, reported in 2002, concentrated on van and truck tyres [Reithmaier et al, 2002]. The aim of this study was to investigate rolling noise, rolling resistance and wet road braking characteristics of various tyres of four different size categories mounted either on the steering axle or the drive axle of the truck. Each tyre population comprised 4 or 5 tyre brands selected according to market relevance. The resulting database included the following measurements:
• Measurements of noise emission according to 2001/43/EC (ISO surface) • Measurements of rolling resistance according to ISO 8767 (smooth steel drum
surface) • Measurements of wet grip (<1.5 mm water depth) as braking distance, when
braking from a high speed to standstill. In the case of the 225/70 R15C tyres the braking test were made with the tyres mounted on a vehicle in the other cases with the tyres mounted on a test trailer. The average deceleration is calculated on the basis of the measured distance recorded when decelerating the vehicle equipped with an ABS system, between the speeds given in the table:
Tyre category Tyre dimension Speed
C2 (van) 225/70 R15C 90 – 10 km/h C3 (truck) 215/75 R17,5 60 – 30 km/h C3 (truck) 275/70 R22,5 70 – 30 km/h C3 (truck) 315/80 R22,5 70 – 30 km/h

FEHRL Report. 28 Final Report SI2.408210 Tyre/Road Noise – Volume 2
FEHRL
Approximately at the same time, similar measurements were made on new sets of car tyres [Reithmaier & Salzinger, 2002]. The aim of this study was to investigate rolling noise, rolling resistance, aquaplaning and wet road braking characteristics of various car tyres in six different dimensions. Each tyre population comprised between three and eleven tyre brands selected according to market relevance, covering a broad range from outstanding to poor performance in the single criteria. The resulting database included the following:
• Measurements of noise emission according to 2001/43/EC (ISO surface) • Measurements of rolling resistance according to ISO 8767 (smooth steel drum
surface) • Measurements of aquaplaning characteristics (8 mm water depth in a basin). An
aquaplaning speed is defined as the speed at which a slip of 15 % is reached when accelerating on the 3rd or 4th gears.
• Measurements of wet grip (<1.5 mm water depth) as braking distance, when braking from a high speed to standstill, using an ABS system. The average deceleration is calculated on the basis of the measured distance recorded when decelerating the vehicle between 80 km/h and 10 km/h
For the two studies together, a total of 82 car tyres and 32 truck tyres were selected. They covered car tyre widths 155-225 mm (rim diameters 14-17 inches) and truck tyre widths 215-315 mm (rim diameters 17.5-22.5 inches). Of the 82 car tyres, 37 were winter or all-weather tyres. The results can be described in many ways and have been reported in many documents; the main one being [Reithmaier et al, 2002] and [Reithmaier & Salzinger, 2002]. Other references using these results, sometimes in a little different ways, include for example [Stenschke & Jäcker-Cüppers, 1999], [Stenschke & Vietzke, 2000], [Stenschke & Vietzke, 2001], [Stenschke & Rauterberg-Wulff, 2004], and [Stenschke & Vietzke, 2005]. The results, in terms of noise levels, of the study on car tyres are presented in Fig. 9, while the results of the study on van and truck tyres are presented in Fig. 10. Note that the measured noise levels on which the bars are based have been treated as is specified in the Directive (i.e., truncation and subtraction are already performed). It is quite obvious from the graphs that a majority of tested tyres are well below the limits, for all kinds of tyres. If one would consider the "immediate" technical potential as what the average tyre represents, this potential is 3-7 dB. If one would consider the long-term technical potential as what the quietest tyre represents, the potential is 5-9 dB.

FEHRL Report Final Report SI2.408210 Tyre/Road Noise – Volume 2 29
FEHRL
66
67
68
69
70
71
72
73
74
75
76
77
C1b C1c C1d C1e
Tyre class according to Directive 2001/43/EC
Tyre
noi
se [d
B(A
)]
minimum value mean value maximum value
Tyre noise limits according to Directive
24 tested tyres 14 tested tyres 37 tested tyres 7 tested tyres
Fig. 9. Comparison of tyre noise levels with the current limits (car tyres). Figure prepared by BASt6, based on data in [Reithmeier & Salzinger, 2002]. Tyre class C1b means widths 145-165 mm, C1c 170-185 mm, C1d 190-215 mm and C1e > 215 mm.
66
67
68
69
70
71
72
73
74
75
76
77
78
79
C2 normal C3 normal C3 M&S
Tyre class according to Directive 2001/43/EC
Tyre
noi
se [d
B(A
)]
minimum value mean value maximum value
Tyre noise limits according to Directive
4 tested tyres
14 tested tyres
14 tested tyres
Fig. 10. Comparison of tyre noise levels with the current limits for van (C2) and truck (C3) tyres. Figure prepared by BASt, based on data in [Reithmeier & Salzinger, 2002]. 6 BASt = Bundesanstalt für Straßenwesen = Federal Highway Research Institute (in Germany)

FEHRL Report. 30 Final Report SI2.408210 Tyre/Road Noise – Volume 2
FEHRL
5.3 Measurements in the Netherlands
A study on truck tyres within the large Dutch IPG7 program was conducted by M+P8 in 2003 [Reinink et al, 2005]. Since there is not too much information available for truck tyres, this is an important supplement to other studies reported here. The tests were made on various road surface types but the results reported here are for an ISO 10844 surface. Only the noise measurements which were done in accordance with the Directive were used for the diagrams. The report contains the actual values but for the comparison with the actual limits, see Fig. 11, these values were truncated and reduced by 1dB as required in the Directive.
636465666768697071727374757677787980
Contin
ental
HSR
Goody
ear M
aratho
n LHS
Micheli
n XZA2 E
nergy
(new
)
Micheli
n XZA2 E
nergy
(worn
)
Micheli
n XZA2 E
nergy
(slick
)
Contin
ental
HTR
Contin
ental
HTL E
co-P
lus
Goody
ear M
aratho
n LHT
Micheli
n XTA2 E
nergy
(new
)
Micheli
n XTA2 E
nergy
(worn
)
Contin
ental
HDR
Goody
ear M
aratho
n LHD
Micheli
n XDA2 E
nergy
(new
)
Micheli
n XDA2 E
nergy
(worn
)
Micheli
n XDN G
rip
Tyre
noi
se [d
B(A
)]
Tyre noise limits according to Directive
Tyre class C3 normal (dimensions 315/80 R22.5)
Tyre class C3 M+S (dimensions 385/65 R22.5)
Fig. 11. Comparison of truck tyre noise levels with the current limits. Figure produced by BASt based on data measured by M+P [Reinink et al, 2005]. It appears that one of the 15 tested tyres exceeds the limit value and that another one is just 1 dB below the limit. Else, the results are in line with the German results. The one exceeding the limit, 7-9 dB noisier than any of the others, is a tyre containing pockets in the tread. Such a tyre is known to give exceptionally high air pumping noise and is no longer produced. Note that two of the tyres in the diagram are worn. One is a slick tyre (no tread pattern). Both worn tyres happen to give lower noise than their counterparts in new condition. Surprisingly the slick tyre is not the quietest.
7 IPG = Innovatieprogramma Geluid, is a very large research programme aiming at reducing traffic noise, see http://www.innovatieprogrammageluid.nl/ 8 M+P = a consulting company in the Netherlands, see http://www.mp.nl/

FEHRL Report Final Report SI2.408210 Tyre/Road Noise – Volume 2 31
FEHRL
A test program for car tyres has also been conducted by M+P [Roovers, 2003]. In Fig. 12 the noise emission of 23 tyres is presented as they were measured according to the EU directive. These values were calculated using only the measurements which are appropriate for this matter. The prescribed temperature correction is included, values are rounded to the lower whole number, and 1 dB(A) is subtracted.
Fig.12. EU Noise levels of 23 car tyres as a function of the nominal section width; the size of a dot represents the number of tyres with a certain noise level ranging from 1 (smaller dot) to 3 (larger dot). From [Roovers, 2003]. The discontinuous line represents the EU limit values in 2001/43/EC. The results seem to show that there is no apparent effect of tyre width on the measured noise, and that the margin to the limiting levels is large (2-7 dB(A)). 5.4 Measurements elsewhere
Fig. 13 presents results of an Austrian study comprising seven car tyres and three truck tyres, measured on a number of ISO surfaces as well as common road surfaces [Haider et al, 2004]. The measured values in the figure have been truncated and 1 dB subtracted before comparing with the limits. The results show that except for one car tyre which is 1-2 dB below the limit, all tyres are several dB below the limits. All truck tyres are at least 4 dB below the limit and the quietest car tyre is 7-8 dB below the limit, depending on size. It also appears that the ISO surfaces are among the quietest surfaces tested, except for the porous ones (OPA). SINTEF in Norway recently has measured 20 car tyres on an ISO surface and else according to the requirements of 2001/43/EC. The results are shown in Fig. 14. The corresponding limit values, plus 1 dB for the subtraction and 0.9 dB for the truncation are at the levels 75.9 dB for the 175 mm width and 76.9 for the two greater widths.

FEHRL Report. 32 Final Report SI2.408210 Tyre/Road Noise – Volume 2
FEHRL
Fig.13. EU noise levels of seven car tyres and three truck tyres (one tyre per vertical column of symbols); measured in Austria [Haider et al, 2004]. The darker green area represents the EU limit (and higher values) in 2001/43/EC. Each set of points connected with a line denotes one road or test track surface, according to the list at the right.
Fig.14. EU noise levels of 20 car tyres (one tyre sample per symbol); measured by SINTEF in Norway [Berge et al, 2005]. It then appears that the measured values are 2-5 dB lower than the limit for the 175 mm tyres and 3-6 dB lower than the limit for the wider tyres. No width influence can be seen.

FEHRL Report Final Report SI2.408210 Tyre/Road Noise – Volume 2 33
FEHRL
The range between the quietest and noisiest tyres is 4.5 dB if all three dimensions are included and 3-4 dB within each dimension. 5.5 Compilation of results
This author recently compiled the results of all the above mentioned studies into one diagram which is reproduced in Figs. 15-16 [Sandberg, 2005]. In Fig. 15, recent data from TRL Limited have also been introduced [Watts et al, 2005]. Note that in order to avoid too many data points coinciding; some of the measurement points have been displaced marginally to the left or right of the nominal tyre width. Measured data have not been truncated or 1 dB subtracted; instead the nominal limits are shown together with the limits increased to the maximum measured noise level that would pass the limits (the solid red line). The figures now include data for 174 car tyres and 45 truck tyres, which is currently the most comprehensive data collection of this type known to the author. It may be that a few of these tyres (but only very few) are duplicate measurements; i.e., one organization might have measured a tyre type which was already measured by another organization. Some notes are justified for the M+P data for truck tyres. The point for C3 normal tyres exceeding the limit is a tyre containing pockets in the tread. Such a tyre is known to give exceptionally high air pumping noise and is no longer produced. Note also that two of the M+P tyres in the diagram are worn and one is a slick tyre (no tread pattern), see more details in Fig. 11. 5.6 Conclusions
The following conclusions can be made from the tyre/road noise tests in recent years reviewed above: The different studies reviewed here are quite consistent in their results, wherever the results are comparable. The range between the noisiest and the quietest car tyres; including all tested widths, is about 6-8 dB(A) on an ISO surface. If one looks only at a single dimension (section width), the range is approximately the same. For truck tyres, the range is about 10 dB(A) between the noisiest and the quietest tyres9. The average car tyre within each width class has a margin to the limit of 4-6 dB(A); very few tyres are closer to the limit than 2 dB(A). The quietest tyres are 8-9 dB(A) below the limit. For truck tyres the margin from the average tyre to the limit is approximately 6 dB; very few tyres are closer to the limit than 2 dB(A). The quietest truck tyres are 9-10 dB(A) below the limit. The pronounced width influence on noise which existed earlier cannot be detected in the recent measurements. Width does not appear to be a significant parameter for noise any more. For truck tyres, it still seems justified to distinguish between the normal and snow classes.
9 If one excludes the extreme truck tyre with air pockets in the tread.

FEHRL Report. 34 Final Report SI2.408210 Tyre/Road Noise – Volume 2
FEHRL
68
70
72
74
76
78
80
120 140 160 180 200 220 240 260 280Nominal tyre section width in mm (car tyres, C1)
Soun
d le
vel i
n dB
(A)
Actual limits (nominal + 1.9)Nominal limits in DirectiveM+P measurement resultsUBA/TÜV meas. resultsArsenal dataTUV/UBA meas. resultsTRL data
Fig. 15. Measured sound levels of 174 car tyres at 80 km/h on ISO surfaces in the Netherlands, Austria, Norway, United Kingdom and Germany, compared to the EU limits. Data from [Roovers, 2003], [Stenschke & Vietzke, 2001], [Reithmaier & Salzinger, 2002], [Berge et al, 2004], [Watts et al, 2005] och [Haider et al, 2004].
65
70
75
80
85
Soun
d le
vel i
n dB
(A)
Actual limits (normal + 1.9)Normal limits in DirectiveUBA/TÜV data:Arsenal dataM+P data
Normal Snow Special Normal Snow SpecialVan tyres (C2) Truck tyres (C3)
c: \eget\ex cel n\noi s e\E U_l i mi ts .xl s _s heet6
Fig. 16. Measured sound levels of 45 truck tyres at 80 km/h (C2 tyres) och 70 km/h (C3 tyres), on ISO surfaces in the Netherlands, Austria and Germany, compared to the EU limits. Data from [Stenschke & Vietzke, 2001], [Haider et al, 2004] and [Reinink et al, 2005].

FEHRL Report Final Report SI2.408210 Tyre/Road Noise – Volume 2 35
FEHRL
6 Noise levels of retreaded tyres
6.1 Studies in Sweden, Poland and Germany in the 1990's
Retreaded tyres have a high market share in Europe. For truck and bus tyres, approximately half of the tyres in traffic are retreaded. For car tyres, it is not a big share, except in the Nordic countries where 25 % are retreaded; most of them winter tyres. Retreaded tyres are not yet subject to noise limits, but within the ECE such limits for retreaded tyres are currently being discussed. It follows that it is interesting to see if retreaded tyre differ significantly from new tyres in terms of noise generation. One frequently can hear speculations suggesting that the new tyres "must" be quieter than the retreaded ones. The first study reviewed here involved tests performed by VTI in 1987 on 20 truck tyres. These tests indicated that 6 retreaded tyres were equally quiet or noisy as "ordinary" new tyres [Sandberg, 1991-2]. During the experiment, radial tyres of the size 12R22.5 were tested with the trailer method (CPX) on four surfaces. Averaged results of the tests are shown in Fig. 17. The differences between new and retreaded tyres were within ±1dB. Such small differences may probably be related to the tread pattern characteristics since the treads of the retreaded tyres were visually more "aggressive" than those of the other tyres. This may explain why the retreaded tyres were less noisy than new tyres on the rough surface but noisier on the smooth surfaces.
75
80
85
90
95
100
GR
B-S
GR
B-R
Sm
oo
th
SM
A1
2
GR
B-S
GR
B-R
Sm
oo
th
SM
A1
2
GR
B-S
GR
B-R
Sm
oo
th
SM
A1
2
Surface
SP
L [
dB
]
Factory new
Retreaded
JE_RETREAD
30 km/h 50 km/h 70 km/h
Fig. 17. Averaged results for 13 "ordinary" and 6 retreaded truck tyres tested on four road surfaces. Test by VTI reported in [Sandberg, 1991-2]. The next study was made in 1992-93 in Germany by FIGE GmbH [Köllman, 1993]. They used a special trailer (see Fig. 16.29) that was towed past a roadside microphone with different car tyres mounted on the trailer axle. Normal coast-by measurements were made except that the vehicle was this special trailer and not a four-wheel car. They considered the effect of the tow vehicle as negligible. Anyway, the comparison of the various tyres

FEHRL Report. 36 Final Report SI2.408210 Tyre/Road Noise – Volume 2
FEHRL
should not be affected by this method. By kind permission of FIGE-TÜV, the authors of the Tyre/Road Noise Reference Book [Sandberg & Ejsmont, 2002] could process the German data to compare sound pressure levels of the retreaded and the new tyres. The results are shown in Fig. 18. Fig. 18 shows that the tested 11 retread tyres were marginally noisier than the new tyres on the smooth ISO surface while they were marginally less noisy than the new tyres on the rougher surface dressing. It also seemed that the retreaded winter tyres compared to the new tyres less favourably than the summer retreads.
68
69
70
71
72
73
74
Summer Winter All tires
A-w
eig
hte
d S
PL
[d
B]
.
Retreaded
Factory new
JE _RE T RE A D2
ISO ISO
Splitt
ISO
SplittSplitt
Fig. 18. Comparison between exterior noise measured on 11 retreaded car tyres compared to 46 ordinary new tyres of the same dimensions. Data from [Köllman, 1993] normalised to 20 oC, processed in the Tyre/Road Noise Reference Book. Surfaces were: - ISO = dense asphalt surface with 0-8 mm chippings, meeting the specs of ISO 10844 - Splitt = single surface dressing with 2-5 mm chippings placed on top of SMA 0/11 In 1999 the Technical University of Gdansk (TUG) and the Swedish Road and Transport Research Institute (VTI) conducted tests in order to survey the influence of passenger car tyre retreading on tyre/road noise emission. Tyre/road noise was measured in a laboratory with the drum method on four drum surfaces. Two drums were used, one of diameter 1.7 m having both a very smooth Safety Walk and a very rough-textured surface named GRB-R. The other drum had a diameter of 1.5 m being equipped with the smooth-textured (replica) surfaces ISO and GRB-S, the latter being a replica of an actual DAC 0/16 road surface. Microphone locations were as in the CPX method. Ambient temperatures were 18-22 oC, so no temperature corrections were applied. In this study, 10 retreaded car tyres were selected from the production of Fighter AB in Sweden as well as three from MacRipper and one from a company called AGI. As references, 58 new tyres were used. All tyres were tested in unworn condition. The measured A-weighted sound pressure levels are presented in Fig. 19. These levels are the averages for the two microphones and for the three speeds 70, 90 and 110 km/h. There is one figure for each group of tyres:
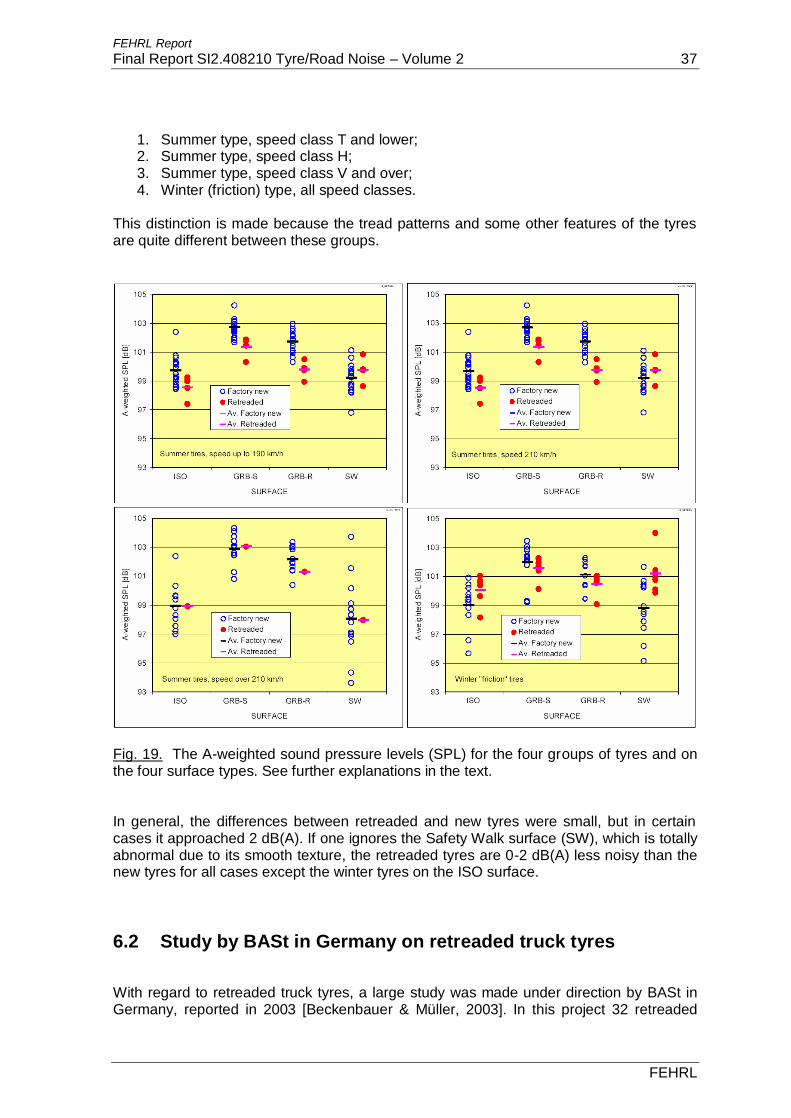
FEHRL Report Final Report SI2.408210 Tyre/Road Noise – Volume 2 37
FEHRL
1. Summer type, speed class T and lower; 2. Summer type, speed class H; 3. Summer type, speed class V and over; 4. Winter (friction) type, all speed classes.
This distinction is made because the tread patterns and some other features of the tyres are quite different between these groups.
Fig. 19. The A-weighted sound pressure levels (SPL) for the four groups of tyres and on the four surface types. See further explanations in the text. In general, the differences between retreaded and new tyres were small, but in certain cases it approached 2 dB(A). If one ignores the Safety Walk surface (SW), which is totally abnormal due to its smooth texture, the retreaded tyres are 0-2 dB(A) less noisy than the new tyres for all cases except the winter tyres on the ISO surface. 6.2 Study by BASt in Germany on retreaded truck tyres
With regard to retreaded truck tyres, a large study was made under direction by BASt in Germany, reported in 2003 [Beckenbauer & Müller, 2003]. In this project 32 retreaded

FEHRL Report. 38 Final Report SI2.408210 Tyre/Road Noise – Volume 2
FEHRL
truck tyres were tested. The tyres had different carcasses, dimensions and different tread patterns (steering axle tyre or drive axle tyre). The study was motivated by the consideration whether the widely used retreaded tyres should be included in the Directive and if they already fulfil the limit values. The noise measurements were done in accordance with the Directive 92/23/EWG. This report contains the actual values. Only for the comparison with the actual limits these values were rounded and reduced by 1 dB as is specified in the Directive.
66
67
68
69
70
71
72
73
74
75
76
77
78
79
295/80 R22.5 315/60 R22.5 275/70 R22.5 295/80 R22.5 315/60 R22.5 315/80 R22.5Tyre dimensions
Tyre
noi
se [d
B(A
)]
minimum value mean value maximum value
Tyre noise limits according to Directive 2001/43/EC
2 tested tyres
Tyre class C3 normal
Tyre class C3 M+S
6 tested tyres6 tested tyres 3 tested tyres 3 tested tyres 12 tested tyres
Fig. 20. Noise levels of retreaded truck tyres, as tested by Müller-BBM under direction by BASt. The number of tyres within each tyre size is indicated within the triple bars. Data from [Beckenbauer & Müller, 2003] processed by BASt. The results can best be compared to Figs. 10 and 16. It appears that the retreaded tyres are about 2 dB(A) noisier than the tested new tyres with regard to the normal tyre class. For the "Snow" or "M+S" class, the retreaded tyres are 3-4 dB(A) noisier than the tested new tyres. The quietest retread tyres are about as noisy as the noisiest new tyres10. However, no retreaded tyre exceeded the noise limit.
10 According to communication with BASt, the reported noise increase over new tyres shall not be taken as representative of all retreaded tyres in these categories. The tyres selected for the test here were probably produced using some less modern tread moulds, not corresponding to present state-of-the art.

FEHRL Report Final Report SI2.408210 Tyre/Road Noise – Volume 2 39
FEHRL
7 The relation between tyre noise and tyre section width
7.1 Early studies
Probably the most comprehensive attempt to look at the relation between tyre noise and tyre width is a paper pooling German, Swedish and Norwegian results of the 1980's together [Storeheier & Sandberg, 1990]. In this study, it was possible to plot the noise level of 148 radial car summer tyres measured in the period 1981-87 versus the tyre section width. The relation is shown in Fig. 21. There is a clear relation between noise and tyre width, suggesting an increase of about 6 dB(A) from 135 to 205 mm of tyre width. In this diagram, of course also systematic tyre design features typical of the various sizes are included. If such features, other than width, are systematically different for narrow compared to wide tyres, they will influence the results. A number of other studies are reported in Section 10.2 of Tyre/Road Noise Reference Book [Sandberg & Ejsmont, 2002].
Fig. 21. Relation between tyre noise level and tyre width as reported in [Storeheier & Sandberg, 1990]. Data based on measurements 1981-87 on radial car tyres in Germany, Sweden and Norway.

FEHRL Report. 40 Final Report SI2.408210 Tyre/Road Noise – Volume 2
FEHRL
7.2 Studies before 1995
The upper part of Fig. 5 is a fine example of a study on tyres from a later generation. The data of this figure was supplemented with data from other studies in a diagram published in the Tyre/Road Noise Reference Book, which is reproduced below as Fig. 22. Data are based on the sources mentioned in [Sandberg & Ejsmont, 2002]. First, a regression analysis using only car tyre data was made and then another one was made for all tyres (the latter shown in the figure as a black curved line). It seemed that a polynomial line rather than a straight line was motivated, since for car tyres wider than 200 mm, noise levels are not increasing so much; a trend that is strengthened when truck sizes are included. Actually, the truck and bicycle data fitted an extrapolation of the car data very well. It thus looks as if the noise-width relationship is rather general and is not limited to just one class of tyres. The green line drawn from 72 to 77 dB denotes the relation reported in [Storeheier & Sandberg, 1990], reported above. Since tyres wider than 200 mm were rare then, the relation was limited to the extent of the green line.
y = -0.0001x2 + 0.0904x + 62.276R2 = 0.3847
65
67
69
71
73
75
77
79
81
83
0 50 100 150 200 250 300 350 400
Nominal tyre width [mm]
A-w
eigh
ted
SPL
[dB
(A)]
BicycleFIGE carsTRL carsUTAC carsUTAC vanUTAC truckTRL truckEjsmontS&STRL 2001
EU_limits /1
N = 276
Fig. 22. Relation between noise and nominal tyre section width, for a full range of tyre sizes. Data have been compiled from several sources and normalised to represent uni-form conditions [Sandberg & Ejsmont, 2002].

FEHRL Report Final Report SI2.408210 Tyre/Road Noise – Volume 2 41
FEHRL
There is a clear relation between noise and tyre width also in this figure, suggesting an increase of 5 dB(A) from 135 to 255 mm of tyre width. Over the more limited width range of 135-205 mm, this corresponds to only about 60 % of the width influence which was obtained for the earlier data in Fig. 21. In this diagram, of course also systematic tyre design features typical of the various sizes are included. The noise-width relation in Fig. 22 was confirmed by TRL Limited over part of the range by measurements on actual traffic for a large number of road and tyre combinations [Phillips & Abbott, 2001]. The majority of vehicles and tyres measured in the TRL study must have been from before 1996. 7.3 Studies by independent organizations after 1995
As one of the best example of tyre noise-width relations studied for the most recent tyres, results reported from Germany may serve. See Fig. 23. Part (a) of the figure shows results from [Stenschke, 2005]. Here, each point represents one or more measured tyres (in total 82 tyres). Points larger than the smallest ones denote more than one point at the same value; the more points the larger the point is plotted. These results show no influence of width at all. The relation is not statistically significant. A partly conflicting set of data is shown in part (b) of the figure. This data set, which is from [Steven, 2004], indicates the following:
• For tyres having widths 155 mm and above, the correlation between noise level, measured on an ISO surface, and width is insignificant.
• For the very narrow tyres, 135 mm and 145 mm, it seems that noise levels are lower than for the wider tyres. However, the number of tyres in this group is only four, so the observation is uncertain.
• When testing on an SMA surface, the noise-width relation is flat from about 185 mm and upwards, but there is a clear relation under 185 mm.
A possible interpretation of this is that the other studies, such as those summarized in Fig.15 and Fig. 23a, have not included the narrowest tyres, in which case the noise-width relation at these narrow widths have been "hidden". Further, a possible interpretation is that the tyres have been optimized on an ISO surface, and when testing on another and quite different surface, such as the SMA surface in Fig. 23b, the "levelling-out" of the noise-width relation indirectly caused by the Directive 92/97/EC, has had little effect. The data compiled in Fig. 15 is presented again in Fig. 24, but with the limits removed and a linear regression line fitted. Since this compilation contains a larger number of measurements it may be more relevant than the other data sets. It appears that the width in this data compilation explains only about 18 % of the total variation between tyres; the rest of the variation is due to other differences in tyre construction. If the outlier at 275 mm were neglected, the width influence would be close to zero for this data set. For the older data, see Fig. 22, about 38 % was explained by the width. According to this compilation, a change from 150 to 260 mm means a noise increase of 3 dB. However, one may note that over the width range 175-225 mm, which is a range containing more than 75 % of all tyres on the European market, there is no width influence.

FEHRL Report. 42 Final Report SI2.408210 Tyre/Road Noise – Volume 2
FEHRL
Note that the = sign in the figure should read •.
Fig. 23a. German data on relation between noise and nominal tyre section width, for a wide range of car tyre sizes. Data and figure from [Stenschke, 2005], comprising 82 car tyres, originally from the study of [Reithmaier & Salzinger, 2002].
Fig. 23b. German data on relation between noise and nominal tyre section width, for a wide range of car tyre sizes. Data and figure from [Steven, 2004] showing the relation between tyre/road noise and nominal tyre section width for an ISO and an SMA surface.

FEHRL Report Final Report SI2.408210 Tyre/Road Noise – Volume 2 43
FEHRL
y = 0,027x + 66,863R2 = 0,1871
68
70
72
74
76
78
80
120 140 160 180 200 220 240 260 280Nominal tyre section width in mm (car tyres, C1)
Soun
d le
vel i
n dB
(A)
M+P measurement resultsUBA/TÜV meas. resultsArsenal dataTUV/UBA meas. resultsTRL data
Fig. 24. Relation between tyre noise and nominal tyre section width using the data compiled in Fig. 15. Finally, it shall be mentioned that a study at TRL, comprising 23 car tyres from 155 to 225 mm section widths, suggested a negative correlation between noise level and width, showing a 1 dB decrease over the width range [Phillips et al, 2001]. These measurements were made on an ISO surface with the CPX method, so they were not in total agreement with the method in the Directive. 7.4 Unpublished data from ETRTO
ETRTO has submitted unpublished data to the project group and has agreed to its presentation in the reports. There are several data sets, but the most comprehensive one is the one presented in Fig. 25 which is reduced from 502 original data points made up of 339 tyres at standard load and 163 tyres at extra load; of which 287 are summer tyres and 215 are winter (with M+S marking) tyres. The vast majority of the tyres are OE tyres. The diagram is non-conventional since it does not show the individual and original data points (rather it shows a point where data is available without specifying the number of values); neither does it have a continuous parameter on the abscissa (the variable on the abscissa is not tyre width, but a number given to a certain width class, each one based on a varying width range). Only 56 of the originally 502 data points are shown. A conventional regression analysis based on such a diagram; and also a visual estimation, is arguable since it is unknown how the original 502 data points have been reduced into 56 data points and due to the unlinear transformation from tyre width to tyre width class number.

FEHRL Report. 44 Final Report SI2.408210 Tyre/Road Noise – Volume 2
FEHRL
For example, to illustrate the problem, it is in principle possible that the data point at the lower right is based on approximately 200 actual data points around that noise level and width, and that the data point at the upper left is based on 200 actual data points around that noise level and tyre width. A regression analysis based on the individual data points would in such a case show a noise-width relation which would be totally contrary to the one shown in the diagram (i.e. a negative rather than a positive slope). Of course the data are not manipulated in this way, so one can probably feel confident that the shown regression data of selected data points versus the number of the tyre width class is reasonably similar to a conventional regression of noise level on tyre width making use of all individual data points. It then appears that the data are in fact very similar to that of Fig. 24, with approx 17 % of the variation explained by the width, and a noise increase from 150 to 260 mm of about 2,5 dB. Another feature is also common to Fig. 24; namely that if one looks at the width range 175-225 mm representing more than 75 % of the tyres on the European market one cannot see any significant width influence.
Fig. 25. Relation between tyre noise level in dB(A) and nominal tyre section width class, according to aggregate ETRTO data (56 data points based on originally 502 data points). Note that the diagram is not a conventional regression diagram (see the text). Note also that the undefined vertical scale shows 1 dB per line spacing. It may be noted that the trend of increasing noise with the number (1-8) of tyre width class is dominated by the extremely wide tyres with a width exceeding 250 mm. Such tyres would constitute about 1.5 % of the tyres on the European market, but in the diagram here

FEHRL Report Final Report SI2.408210 Tyre/Road Noise – Volume 2 45
FEHRL
they constitute almost half of the data (23 of 56 points). Therefore, the diagram is heavily biased by an abnormal proportion of super-wide tyres. In actual traffic one would not see such noise-width effects, but when the purpose is to study in particular the inherent noise-width relation the bias can be justified. ETRTO also responded to a question from the project group regarding the need for extra allowance for reinforced tyres. The response shows a relation between noise level and load index (LI) which is highly significant and which suggests that noise increase by about 4 dB over the LI range of 70-110. If reinforced tyres would have 4 units higher LI than normal tyres, which is the common case, this relation would then correspond to about 0.4 dB. However, this author thinks that the presented relation between noise level and LI more reflects the strong covariation between LI and tyre width (wider tyres mostly carry a higher load), thus there is no clear evidence that reinforced tyres need an extra allowance. 7.5 Conclusions
Evidently, there is a big difference in the width influence of noise measured on tyres from the 1980's (which probably were designed in the 1970's), through tyres of the late 1980's and early 1990's until the tyres measured around year 2000 and later. The width influence was originally very prominent but has diminished in recent years; possibly with three exceptions: for very narrow tyres, for very wide tyres and when testing on other surfaces than the ISO surface. Within the tyre width range 175-225 mm containing most of the tyres on the market, the width influence on noise can be neglected. How can one explain this? First, the observations made by different organizations are quite consistent and thus most probably correct. The dramatic reduction in the width influence may be explained by the gradually increasing importance of vehicle noise limits. As explained above, the only important noise limit for tyres presently is the 74 dB(A) for vehicle overall noise according to Directive 92/97/EC. This is a reality that no doubt has influenced tyre properties, but without distinction of width; possibly with exception of the narrowest tyres. The latter probably might be so quiet due to their narrow widths that they may not be limited so much by 92/97/EC. When a vehicle manufacturer needs a "moderately wide" tyre (say up to 250 mm width), this tyre must meet approximately the same noise requirements as a medium-narrow tyre for a smaller car. However, a super-wide tyre would probably be mounted on a sports car which would have an extra allowance of vehicle noise11. This should create a levelling-out of the width influence on noise; at least for OE tyres. Why the low width influence seems to include essentially also replacement tyres may be because tyre manufacturers often use the technology of the OE tyres also for replacement tyres. The above is just a speculation, but an equally or more plausible explanation cannot be offered. One may speculate that there might be an unused potential for noise reductions of narrow tyres if the same advanced technology is used as for wide tyres, but benefiting from the "natural" noise reduction that logically should be offered by narrow widths. Thus, to take maximum advantage of the technology it is justified to use a flat noise-width relation up to the widest tyres but to allow some extra dB to the latter. Allowing the very widest tyres extra noise will not affect the Leq or LDEN levels in road traffic significantly as long as these tyres are very few of the total number of tyres. 11 A 1 dB extra allowance; further an extra high gear setting is used; often called the "Lex Ferrari" rule

FEHRL Report. 46 Final Report SI2.408210 Tyre/Road Noise – Volume 2
FEHRL

FEHRL Report Final Report SI2.408210 Tyre/Road Noise – Volume 2 47
FEHRL
8 Trade-off with other parameters?
8.1 Introduction
There is often fear expressed by government officials and people in the industry that lower noise emission can only be obtained by sacrificing some other properties, most notably safety. This is based on the knowledge that a tyre design is always a compromise between various parameters. It is common to express this compromise for a particular tyre as a polar diagram illu-strating the property profile of the tyre, see Fig. 26. It is often understood that if one pulls out one or two of the corners, some other corners are likely to be pulled-in, i.e. these properties are sacrificed. However, not everybody in the tyre industry shares this view. An interesting editorial appeared in Tire Technology International recently. It was written by the former Director of Research at Dunlop Tyres in the UK, Dr A.R. Williams. He wrote [Williams, 2005-2]: "The tire industry has been very successful in spreading a conservative attitude not only to its customers but also to the government authorities and legislators. The idea has been sown that the world of the tire is a compromise: if you enhance one property, you detract from another. This is the biggest self-defense mechanism the industry has invented. There is the grave danger that the industry itself has now come to believe this message. If this approach fails then it is easy to hide behind legislation and standards. In my view technology should lead legislation, not be hindered by it."
Fig. 26. Polar diagram illustrating the property profile of a particular tyre (kindly obtained from Dr Saemann, Continental Tyres).

FEHRL Report. 48 Final Report SI2.408210 Tyre/Road Noise – Volume 2
FEHRL
Anyway, it is this authors view that if everything is always a compromise and no corner can be pulled out without pulling-in some others, it would mean that tyre development over the past decades would have been at standstill in an overall sense. This is obviously not at all the case; on the contrary, it is obvious that many if not most of the corners have been expanded without really sacrificing anything important. Therefore, the view of Dr Williams seems to be relevant. The next sub-chapters explore the possible compromise between low noise and other major tyre properties. 8.2 Analysis of target conflicts by ETRTO
ETRTO has offered to the project group a comprehensive listing and evaluation of the conflicts between different targets that a tyre constructor has to struggle with, which is shown in Table 2. As long as the colours in the same column are similar for various parameters, there are no conflicts, but when colour changes from green to red or vice versa, there is a conflict. The table shows that conflicts exist between many parameters; not the least for noise, and that the relations are extremely complicated. One interpretation of the table is that there are many other factors than noise that have conflicting relations to (for example) safety parameters and that low noise is not unique in being difficult to combine with other desirable characteristics. It is one among many parameters to consider. 8.3 Basic difficulties in combining low noise with good handling
and braking
Some of the principles utilized when designing tyres for low noise are admittedly in conflict with principles used in design for optimum handling and braking performance. This is nothing unique to noise; such conflicts exist in many aspects of tyre design. The major low-noise design principles presently being explored are summarized in Chapter 13.1. The following is a list of potential conflicting principles. Pattern-less tyres: Tyres without a pattern, "slicks" or "smooth tyres", are generally considered to be the ultimate low-noise tyres. Obviously, such tyres would be a disaster to safety, so they are only used for testing purposes. Anyway, it is a misconception that slick tyres are the quietest; it is only on smooth surfaces such as the ISO surfaces that they are the quietest tyres. Even in such cases, there are exceptions. On rough surfaces slick tyres are sometimes the noisiest tyres.
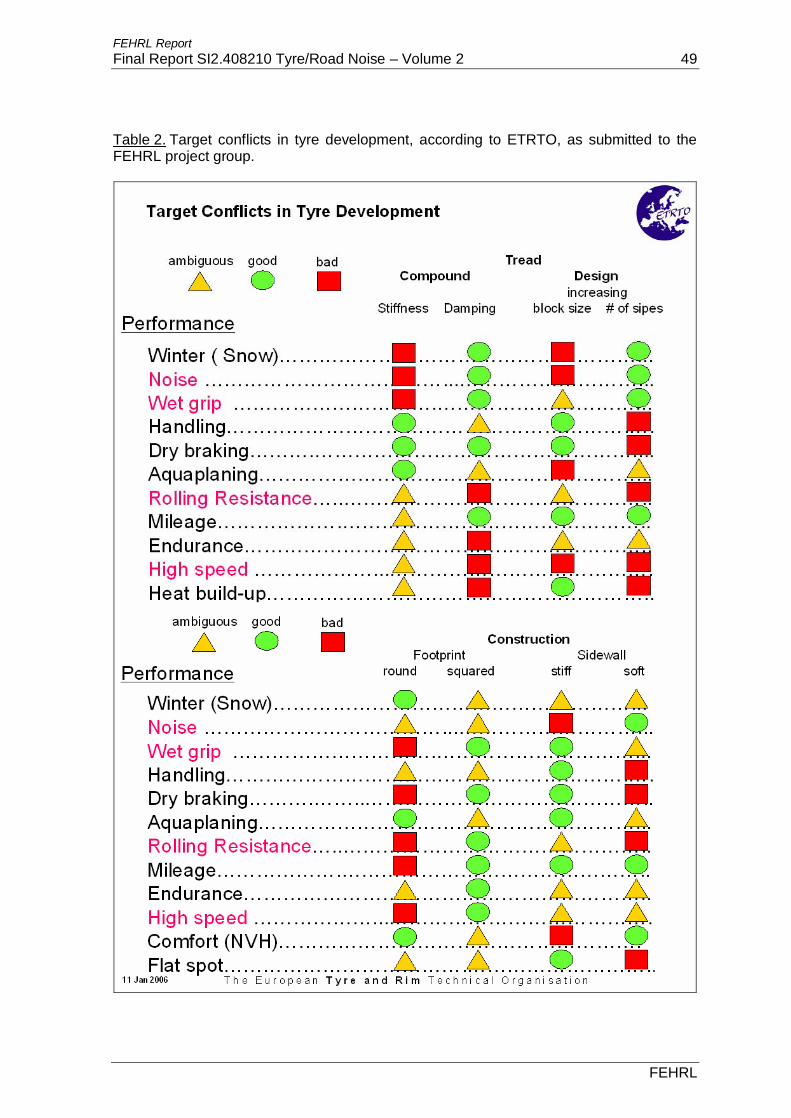
FEHRL Report Final Report SI2.408210 Tyre/Road Noise – Volume 2 49
FEHRL
Table 2. Target conflicts in tyre development, according to ETRTO, as submitted to the FEHRL project group.

FEHRL Report. 50 Final Report SI2.408210 Tyre/Road Noise – Volume 2
FEHRL
Reducing the air/rubber ratio in the tread pattern: For optimum noise performance one may consider reducing the air/rubber ratio in the tread pattern down to about 20 %, from today’s common ratio of 30 %. In cornering and braking on wet roads, the ability of the voids to evacuate water is critical. In principle, low-noise optimization could then be in conflict with cornering and braking on wet roads. It is even more likely to be in conflict with acceptable hydroplaning characteristics, since the tread will be filled-up with water more quickly if the grooves are more narrow; in particular for tyres of high-performance cars. Reducing the longitudinal size of tread elements: For noise reduction, it is desirable to increase the number of tread elements around the tyre circumference to a high number, preferably up to 100 (today around 65 is common). This cannot be made immediately since one must find out ways to achieve this without compromising braking performance and cornering due to the more flexible tread if tread block elements are smaller. Siping: Modern winter tyres are heavily siped; i.e. the tread elements are cut with small narrow cuts, not always down to the full tread depth. These sipes are generally favourable for noise reduction. They are also very good for friction on icy and snow-covered surfaces. However, on wet or dry surfaces, sipes might make tyres less stable during some braking or cornering manoeuvres. Sipes may also increase tyre wear. Making use of softer rubber compounds: Softer tyre rubber compounds are favourable for noise reduction; the softer the better (within tested ranges). It is also very good for friction on icy surfaces. However, on wet or dry surfaces, too soft rubber makes tyres less stable during braking or cornering. These are the most important properties for which one must make sophisticated optimizations in order not to sacrifice safety. With regard to noise versus rolling resistance properties, there are no major conflicts identified. The potentially conflicting properties above do not make it impossible to combine properties in a favourable way. The low-noise truck tyre mentioned in Section 13.1 is an example. This tyre combined extremely low noise with equally good performance in other respects as normal tyres have. But, of course, it is nothing that happens without a lot of development work. The conclusion of the above is that in the design process there are some design principles which have conflicting effects on noise and safety, but not generally on noise and rolling resistance. This is probably the reason why there is some scepticism among some people regarding low noise tyres. However, this is not to say that such conflicting design principles need to have an effect on tyres on the market, since this depends on how tyre manufacturers solve the problems and their policy regarding the balance between various properties. The coming sections explore this situation based on experimental work.

FEHRL Report Final Report SI2.408210 Tyre/Road Noise – Volume 2 51
FEHRL
8.4 Measurements by TRL in the U.K.
8.4.1 Measurements in 1992
Tests in 1992 by TRL for 16 car and 9 truck tyres indicated some significant correlations between noise and safety, suggesting a conflict between the parameters [Nelson et al, 1993]. The most serious one was for noise level versus a composite safety rating. The latter was created by weighing together all types of friction measurements that were made; see the relation in Fig. 27. With respect to possible trade-offs between noise and safety, the authors concluded as follows (the five most relevant points cited here): (iii) From the results of the statistical analyses of correlation between tyre noise and various tyre safety performance indicators it has been established that, for current generation car and truck tyres operating over a broad range of conditions, there is, in general, a significant relationship between tyre noise and safety performance, i.e. a decrease in tyre noise is associated with a reduction in tyre safety performance and vice versa. (iv) The correlations obtained between tyre noise and safety measures taken were, in several of the cases examined, highly significant indicating that the results could not have been obtained by chance. In many cases causal links between tyre noise and skidding performance characteristics were indicated. (ix) Even though the results of this study have established the existence of a correlation between tyre noise and safety performance for current generation tyres there still remains substantial scatter or variance in the data. This leaves considerable scope for the exploitation of tyre designs which do not fall into the general pattern of behaviour established by the regression analysis. Consequently there would appear to be opportunities for realistically promoting tyre designs with the parallel objectives of achieving both low noise and a high degree of tyre safety. (x) With regard to the setting of limit values for car and truck tyre noise, it would appear that, on the basis of this data set, a noise limit of 74 dB(A) for cars at 80 km/h and 78 dB(A) for truck tyres at 70 km/h as measured on the ISO surface would not significantly influence the current distribution of car and truck tyre safety performance. (xii) Since the safety performance of different current generation tyres has been found to vary over a considerable range, there is also a need to establish minimum safety requirements for tyres irrespective of the introduction of noise limits. The conclusions above were quite firm and seem to have influenced the final Directive significantly.

FEHRL Report. 52 Final Report SI2.408210 Tyre/Road Noise – Volume 2
FEHRL
Fig. 27. Correlation between composite safety rating and noise level of car tyres run at 80 km/h on an HRA surface [Nelson et al, 1993]. However, bearing in mind the results of later experiments, this author has studied the TRL data closer. First, one shall remember that the 16 car tyres and 9 truck tyres in the TRL study is a very small sample, compared to the samples of 80-100 car tyres and 32 truck tyres used in each of the Swedish-Polish and the German studies made later. Secondly, the high correlations were obtained when the noise was measured on an HRA surface, which is not the case in the Directive. Thirdly, there are also some other variables that could have influenced the results. This author has checked what happens if one would look at the correlations between safety and tyre width instead of noise level. The results of this analysis for car tyres are shown in Figs. 28-29. For truck tyres the corresponding correlations are not statistically significant and are therefore not shown. Note that the correlations are statistically significant in both cases, but that the correlation with safety is better for tyre section width than for noise level. It may be that the tyres with greater section width were constructed based on a higher level of technology and better rubber compounds, for example. Fig. 32 suggests that there is higher friction for higher speed categories, which are usually connected with greater widths. Therefore, it is this author's view that the TRL study does not show that there is a conflict between high safety and low noise. This is then consistent with the results of the studies described below.

FEHRL Report Final Report SI2.408210 Tyre/Road Noise – Volume 2 53
FEHRL
Fig. 28. Relation between the composite safety rating and tyre section width. The diagram is based on data in [Nelson et al, 1993]. Fig. 29. Relation between the composite safety rating and tyre noise level meas-ured according to Directive 2001/43/EC. The diagram is based on data in [Nelson et al, 1993].
8.4.2 TRL study published in 2005
TRL Ltd. has recently made new noise and wet grip measurements, using 11 car tyre sets, for which noise was measured on an ISO surface at 80 km/h and on an SMA 0/10 surface at 65 km/h [Watts et al, 2005]. Wet grip was measured as peak friction on the SMA surface at 65 km/h. The resulting correlations are shown in Fig. 30. At first sight it would appear that there is evidence of a significant correlation between the noise levels and peak friction measures taken. However, it is important to note that one of the tyres in the sample (the upper right one) could not be tested using the correct load conditions because the load requirements exceeded the load cell limits on the test equipment. Therefore, the authors of the report also calculated the correlations with this tyre removed from the dataset. When these data are removed, the regression shown by the broken line in each Figure is obtained. It can be seen that, in both cases, the degree of correlation is insignificant.
y = 0,0081x + 4,2849R2 = 0,3248
5,3
5,4
5,5
5,6
5,7
5,8
5,9
6
6,1
150 160 170 180 190 200
Tyre section width [mm]
Com
posi
te s
afet
y ra
ting
y = 0,0934x - 1,0054R2 = 0,2925
5,3
5,4
5,5
5,6
5,7
5,8
5,9
6
6,1
70 71 72 73 74 75 76
Tyre noise level [dB(A)]
Com
posi
te s
afet
y ra
ting

FEHRL Report. 54 Final Report SI2.408210 Tyre/Road Noise – Volume 2
FEHRL
y = 0.07x + 62.6R2 = 0.48
y = 0.02x + 69.5R2 = 0.17
72
73
74
75
76
77
130 135 140 145 150 155 160 165 170Wet grip index, %
Max
imum
noi
se le
vel o
n IS
O s
urfa
ce, d
B(A
)
y = 0.06x + 68.0R2 = 0.38
y = 0.02x + 72.8R2 = 0.10
74
75
76
77
78
79
130 135 140 145 150 155 160 165 170
Wet grip index, %
Max
imum
noi
se le
vel o
n SM
A s
urfa
ce, d
B(A
)
Fig. 30. Relation between noise level and wet grip for the 11 tested car tyres. In the top of the diagram the maximum A-weighted noise level is measured at 80 km/h on an ISO surface and wet grip at 65 km/h on an SMA 0/10 surface. In the bottom of the diagram the noise level is measured on the same SMA surface as wet grip and at the same speed.
TRL Limited also made measurements of rolling resistance [Watts et al, 2005]. When noise level was plotted against rolling resistance coefficient. With the special tyre mentioned above removed from the data set, the resulting correlation was close to zero.

FEHRL Report Final Report SI2.408210 Tyre/Road Noise – Volume 2 55
FEHRL
8.5 Measurements by TUG and VTI on about 100 car tyres
In 1997-1999 the Swedish National Road and Transport Research Institute (VTI) and the Technical University of Gdansk (TUG) conducted tests of noise, friction and rolling resistance of nearly 100 car tyres. The data from these tests have been used for statistical evaluations of relations between tyre road/noise and tyre/road friction. To measure such a number of tyres is a significant undertaking. Friction measurements were therefore limited to a wet asphalt concrete road with a smooth-to-moderate texture at a speed of 70 km/h. Measurements at such conditions were judged to be representative for typical "difficult" driving conditions. They are, however, not representative of winter driving on snow and ice, or of cross-country driving. Noise measurements were made on the same type of road surface. The following briefly summarises the experimental program and method and presents the most important results of the study. A much more comprehensive report is presented in [Sandberg & Ejsmont, 2000]. Tyres were grouped according to their intended use. The following groups were established:
S - summer tyres for speeds up to 190 km/h H - summer tyres for speeds up to 210 km/h V - summer tyres for speeds over 210 km/h M+S - winter tyres M+S studded - winter tyres with studs
Tyre/road noise was tested with the CPX method on three typical public road surfaces and with the drum method on four surfaces. Friction was measured at 70 km/h on a wet dense asphalt concrete road (DAC 0/16 mm) with a special friction test vehicle "BV 12B" constructed at VTI. The "DAC 0/16 mm" road surface was similar to one of the three road surfaces on which noise measurements with the CPX method were made, as well as one of the drum surfaces (GRB-S). Both the peak friction coefficient (corresponding to that utilized during ABS braking), and the friction coefficient for locked wheel were measured. Rolling resistance measurements were made on the TUG drum facility, in accordance with the ISO 8767 standard. Two drum surfaces were used: one was a sand-paper-like surface often called Safety Walk (this is in accordance with the ISO standard) and another surface with extremely rough texture. These two surfaces were considered to represent the entire range of rolling resistance due to road surface texture variations. Analyses of the data indicated that there was no correlation between tyre/road noise (dry) and maximum friction on the wet surface. This is apparent in Figs. 31-32. When considering friction measured with a locked wheel, there is in fact a weak but statistically significant relation, implying that increased friction means lower noise. However, one should not consider such a weak relation as very important, as it is barely statistically significant.

FEHRL Report. 56 Final Report SI2.408210 Tyre/Road Noise – Volume 2
FEHRL
Fig. 31. Tyre/road noise measured with the CPX method on three road surfaces (SMA 0/8 mm, DAC 0/16 mm and CS 12 mm)12 at 90 and 70 km/h (averaged), plotted against friction (peak friction coefficient, corresponding to that utilized during ABS braking) measured on a wet DAC 0/16 mm surface at 70 km/h. Each individual symbol re-presents one specific unworn tyre (3x81 tyres in total). The three types of symbols and colours re-present a particular road surface. Fig. 32. Tyre/road noise measured with the CPX method on three road surfaces (SMA 0/8 mm, DAC 0/16 mm and CS 12 mm) at 90 km/h, plotted against friction (friction coefficient with locked wheel) which was measured on the DAC 0/16 mm surface at 70 km/h. Each individual symbol represents one specific unworn tyre (3x81 tyres in total). The three types of symbols and colours represent a particular road surface.
It is interesting to note that average friction coefficients are different for each tyre type. These friction coefficient averages are summarised in Fig. 33 together with noise level averages. The average noise levels for tyres in the groups "S", "H", and "V" are very similar but at the same time average friction coefficients (especially maximum values) are higher for tyres with higher speed ratings. This indicates that tyres for high speed provide better friction and braking forces without a significant penalty in noise. Winter tyres, however, are less noisy than summer tyres but at the same time their friction coefficients are also lower. It can probably be explained by the use of rubber compounds and tread design optimised for winter road conditions.
12 This is a surface dressing, also called chip seal surface, with dominating chippings 8-12 mm.
R2 = 0.0052
R2 = 0.0164R2 = 0.0273
92
94
96
98
100
102
104
106
0.6 0.7 0.8 0.9 1 1.1
Friction coefficient (maximum)
A-w
eigh
ted
SPL
[dB
]
SMA 8mmDAC 16mmCS 12mm
JE_Fr v TRN/1
R2 = 0.0487R2 = 0.0498R2 = 0.0494
92
94
96
98
100
102
104
106
0.35 0.4 0.45 0.5 0.55Friction coefficient (blocked wheel)
A-w
eigh
ted
SPL
[dB
]
SMA 8mmDAC 16mmCS 12mm
JE_Fr v TRN/2

FEHRL Report Final Report SI2.408210 Tyre/Road Noise – Volume 2 57
FEHRL
Fig. 33. Average friction coefficients and A-weighted SPL's for different groups of tyres. Red lines and the red scale at right shows the noise levels of each class, whereas the blue bars and the left scale shows the friction coefficient. Light blue is for locked wheel and dark blue is for optimum slip such as when using ABS.
Based on the presented results it was concluded that no conflict could be detected between low noise on dry surfaces and high friction on a wet road surface. With regard to noise versus rolling resistance, Fig. 34 presents the correlation between noise measured with the CPX method on the DAC 0/16 mm and CS 12 mm road surfaces and rolling resistance measured on the drum surfaces that are most similar to the noise-tested surfaces.
Fig. 34. Relation between tyre/road noise measured with the CPX method on "DAC 0/16 mm" and "CS 12 mm" road surfaces and rolling resistance measured on the drum facility having a Safety Walk sandpaper surface and APS-4 surface, respectively. Speed 80 km/h (noise measured at 70 and 90 but averaged).
0
0.1
0.2
0.3
0.4
0.5
0.6
0.7
0.8
0.9
1
S H V M+S M+Sstudded
Fric
tion
coef
ficie
nt
99
100
101
102
103
104
105
Maximum friction
Blocked wheel frictionA-weighted SPL
A-w
eigh
ted
SPL
[dB
(A)]
JE_Fri_SPL
y = 294.89x + 97.018R2 = 0.051
94
96
98
100
102
104
106
0.005 0.010 0.015 0.020
Rolling resistance on Safety Walk
A-w
eigh
ted
SPL
on D
AC
16m
m [d
B]
Speed rating S,TSpeed rating HSpeed rating V,Z,WWinter tyreN = 79
80 km/h
y = 331.62x + 93.12R2 = 0.0765
92
94
96
98
100
102
104
0.005 0.010 0.015 0.020
Rolling resistance on APS surface
A-w
eigh
ted
SPL
on C
S 12
mm
[dB
]
Speed rating S,TSpeed rating HSpeed rating V,Z,WWinter tyre
N = 79
80 km/h

FEHRL Report. 58 Final Report SI2.408210 Tyre/Road Noise – Volume 2
FEHRL
The figures show that there is a certain statistically significant (p < 5 %) correlation between noise and rolling resistance. The regression lines indicate that tyres with lower rolling resistance generate somewhat lower noise levels. Further and independent studies on this relation which are presented in Section 18.3.2 of the Tyre/Road Noise Reference Book give results supporting the relations indicated above. The general conclusion from the results is that there seems to be no conflict between low tyre/road noise and low rolling resistance of car tyres. In most cases, even a "positive" weak trend may be seen, which means that tyres with low rolling resistance also generate low tyre/road noise. 8.6 Measurements made by TÜV and sponsored by UBA in
Germany
The very comprehensive measurements of noise levels of modern car, van and truck tyres reported in Chapter 5.2 included also wet friction (deceleration or braking distance), aquaplaning and rolling resistance, but these results were not reported in 5.2. Instead, they are reported in this section. For a description of these measurements; however, refer to 5.2 and to the references mentioned there. The first diagram (Fig. 35) shows the results with respect to wet road ABS-type braking deceleration for the 82 car tyres that were tested. The measured values are plotted as braking deceleration versus tyre noise level. The data points distinguish between different dimensions and different types of tyres (summer, winter or all year). The following conclusions can be made:
• There are some significant differences in braking deceleration between certain groups of data; e.g. 205/55R16 summer tyres are the best ones in this selection.
• No significant relation between ABS-type braking deceleration and noise level can be seen for any particular tyre type or dimension (for some types or dimensions of course there are too few data points to be able to see any relation for such a large spread in data)
• No significant relation between ABS-type braking deceleration and noise level can be seen for all data points considered together
The second diagram (Fig. 36) shows the results with respect to aquaplaning speed for the 82 car tyres that were tested. The measured values are plotted as aquaplaning speed versus tyre noise level. Again, the data points distinguish between different dimensions and different types of tyres.

FEHRL Report Final Report SI2.408210 Tyre/Road Noise – Volume 2 59
FEHRL
6
7
8
9
10
11
68 69 70 71 72 73 74 75 76
Tyre noise [dB(A)]
Wet
bra
king
dec
eler
atio
n [m
/sec
2]
165/70 R14 (winter)
165/70 R14 (all year)
185/60 R14 (winter)
195/65 R15 (winter)
195/65 R15 (all year)
205/55 R16 (winter)
155/60 R14 (summer)
165/70 R14 (summer)
185/60 R14 (summer)
195/65 R15 (summer)
205/55 R16 (summer)
225/45 R17 (summer)
Fig. 35. Braking deceleration (as utilized during ABS braking) versus tyre noise level for different dimensions and different types of tyres. Figure prepared by BASt, based on data reported in [Reithmaier & Salzinger, 2002].
75
80
85
90
95
100
105
110
115
68 69 70 71 72 73 74 75 76
Tyre noise [dB(A)]
Aqu
apla
ning
spe
ed [k
m/h
]
165/70 R14 (winter)
165/70 R14 (all year)
185/60 R14 (winter)
195/65 R15 (winter)
195/65 R15 (all year)
205/55 R16 (winter)
155/60 R14 (summer)
165/70 R14 (summer)
185/60 R14 (summer)
195/65 R15 (summer)
205/55 R16 (summer)
225/45 R17 (summer)
Fig. 36. Aquaplaning speed versus tyre noise level for different dimensions and different types of tyres. Figure prepared by BASt, based on data reported in [Reithmaier & Salzinger, 2002].
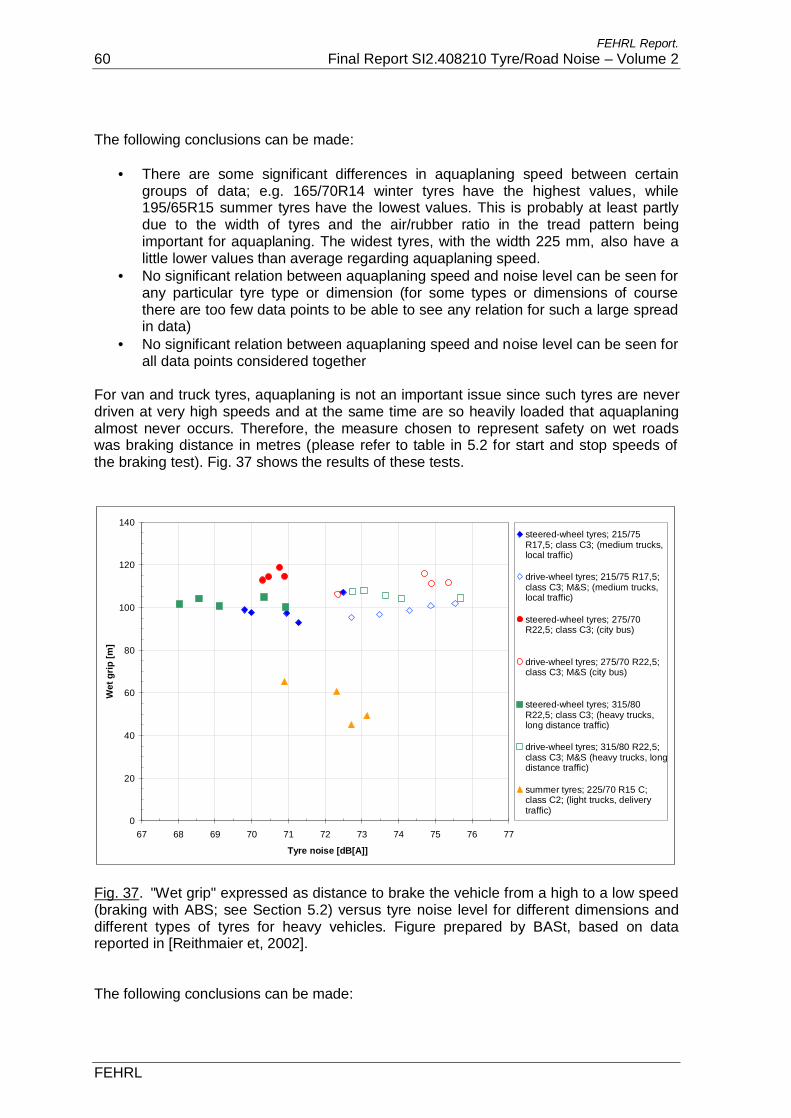
FEHRL Report. 60 Final Report SI2.408210 Tyre/Road Noise – Volume 2
FEHRL
The following conclusions can be made:
• There are some significant differences in aquaplaning speed between certain groups of data; e.g. 165/70R14 winter tyres have the highest values, while 195/65R15 summer tyres have the lowest values. This is probably at least partly due to the width of tyres and the air/rubber ratio in the tread pattern being important for aquaplaning. The widest tyres, with the width 225 mm, also have a little lower values than average regarding aquaplaning speed.
• No significant relation between aquaplaning speed and noise level can be seen for any particular tyre type or dimension (for some types or dimensions of course there are too few data points to be able to see any relation for such a large spread in data)
• No significant relation between aquaplaning speed and noise level can be seen for all data points considered together
For van and truck tyres, aquaplaning is not an important issue since such tyres are never driven at very high speeds and at the same time are so heavily loaded that aquaplaning almost never occurs. Therefore, the measure chosen to represent safety on wet roads was braking distance in metres (please refer to table in 5.2 for start and stop speeds of the braking test). Fig. 37 shows the results of these tests.
0
20
40
60
80
100
120
140
67 68 69 70 71 72 73 74 75 76 77
Tyre noise [dB[A]]
Wet
grip
[m]
steered-wheel tyres; 215/75R17,5; class C3; (medium trucks,local traffic)
drive-wheel tyres; 215/75 R17,5;class C3; M&S; (medium trucks,local traffic)
steered-wheel tyres; 275/70R22,5; class C3; (city bus)
drive-wheel tyres; 275/70 R22,5;class C3; M&S (city bus)
steered-wheel tyres; 315/80R22,5; class C3; (heavy trucks,long distance traffic)
drive-wheel tyres; 315/80 R22,5;class C3; M&S (heavy trucks, longdistance traffic)
summer tyres; 225/70 R15 C;class C2; (light trucks, deliverytraffic)
Fig. 37. "Wet grip" expressed as distance to brake the vehicle from a high to a low speed (braking with ABS; see Section 5.2) versus tyre noise level for different dimensions and different types of tyres for heavy vehicles. Figure prepared by BASt, based on data reported in [Reithmaier et, 2002]. The following conclusions can be made:

FEHRL Report Final Report SI2.408210 Tyre/Road Noise – Volume 2 61
FEHRL
• The tyres for vans and light trucks (C2) have significantly better wet grip than the larger tyres. However, note that the loads and the start and stop speeds for the measurements are different for C2 tyres compared to C3 tyres, so the comparison is not entirely fair.
• The data points for the C2 tyres seem to indicate a conflict between safety and noise, but the number of points is too low (4) to make a safe conclusion.
• No significant relation between braking distance (with ABS type of braking) and noise level can be seen for any particular tyre type or dimension (for some types or dimensions of course there are too few data points to be able to see any relation for such a large spread in data)
• No significant relation between braking deceleration (with ABS type of braking) and noise level can be seen for all data points considered together
The next two diagrams show the relations between noise and rolling resistance. For the information about the measurements, please refer to Chapter 5.2. First, Fig. 38 shows the rolling resistance coefficient for the 82 car tyres as a function of the noise level.
0,8
0,9
1
1,1
1,2
1,3
1,4
1,5
68 69 70 71 72 73 74 75 76
Tyre noise [dB(A)]
Rol
ling
resi
stan
ce c
oeffi
cien
t [%
]
165/70 R14 (winter)
165/70 R14 (all year)
185/60 R14 (winter)
195/65 R15 (winter)
195/65 R15 (all year)
205/55 R16 (winter)
155/60 R14(summer)165/70 R14(summer)185/60 R14(summer)195/65 R15(summer)205/55 R16(summer)225/45 R17(summer)
Fig. 38. Rolling resistance coefficient versus tyre noise level for different dimensions and different types of car tyres. Figure prepared by BASt, based on data reported in [Reithmaier & Salzinger, 2002]. The following conclusions can be made:
• There are some significant differences in rolling resistance between certain groups of data; e.g. 185/60R14 summer tyres and 225/45R17 summer tyres are the two groups with the highest values.
• No significant relation between rolling resistance and noise level can be seen for any particular tyre type or dimension, except for the two groups mentioned in the

FEHRL Report. 62 Final Report SI2.408210 Tyre/Road Noise – Volume 2
FEHRL
previous bullet, which show totally different relations between rolling resistance and noise (probably there are too few data points to be able to see any relation for such a large spread in data)
• No significant relation between rolling resistance and noise level can be seen for all data points considered together
Fig. 39 shows the corresponding measurements for the van and truck tyres.
0
0,2
0,4
0,6
0,8
1
1,2
1,4
1,6
1,8
2
67 68 69 70 71 72 73 74 75 76 77
Tyre noise [dB(A)]
Rol
ling
resi
stan
ce c
oeffi
cien
t [%
]
steered-wheel tyres; 215/75R17,5; class C3; (mediumtrucks, local traffic)
drive-wheel tyres; 215/75 R17,5;class C3; M&S; (medium trucks,local traffic)
steered-wheel tyres; 275/70R22,5; class C3; (city bus)
drive-wheel tyres; 275/70 R22,5;class C3; M&S (city bus)
steered-wheel tyres; 315/80R22,5; class C3; (heavy trucks,long distance traffic)
drive-wheel tyres; 315/80 R22,5;class C3; M&S (heavy trucks,long distance traffic)
summer tyres; 225/70 R15 C;class C2; (light trucks, deliverytraffic)
Fig. 39. Rolling resistance coefficient versus tyre noise level for different dimensions and different types of van and truck tyres. Figure prepared by BASt, based on data reported in [Reithmaier et al, 2002]. The following conclusions can be made:
• There are some significant differences in rolling resistance between certain groups of data; e.g. the van and light truck tyres (C2) have the highest values and steering axle 315/80R22.5 have the lowest values. This probably has to do with the very different loads carried by these tyres and the corresponding difference in air inflation.
• No significant relation between rolling resistance and noise level can be seen for any particular tyre type or dimension, except for the two groups mentioned in the previous bullet, which show totally different relations between rolling resistance and noise (probably there are too few data points to be able to see any relation for such a large spread in data)
• No highly significant relation between rolling resistance and noise level can be seen for all data points considered together. If any, the trend is that noise and rolling resistance vary together, but the significance is weak.

FEHRL Report Final Report SI2.408210 Tyre/Road Noise – Volume 2 63
FEHRL
More specific analyses of the relations between various parameters in the German tests have been made by [Alteköster, 2005]. These have not revealed any new and surprising relations but the details may be of interest for special purposes. Of special interest in this report are the relations shown in Fig. 40 where the aquaplaning speed is plotted against the different tyre dimensions. Not very surprisingly, the narrower widths in general have higher aquaplaning speeds than the wider widths, although there is a large scatter. In case the earlier noted width influence on noise would still exist, it would then mean that tyres with narrower widths would also have higher aquaplaning speeds.
Aquaplaning vA [km/h] vs. tyre dimensions
96,52 96,08
100,21101,34
91,63
89,54
85,45
89,75
86,83
94,51
91,3989,95
75
80
85
90
95
100
105
110
115
155/60 R14Summer
tyres
165/70 R14Summer
tyres
165/70 R14Wintertyres
165/70 R14All-year
tyres
185/60 R14Summer
tyres
185/60 R14Wintertyres
195/65 R15Summer
tyres
195/65 R15Wintertyres
195/65 R15All-year
tyres
205/55 R16Summer
tyres
205/55 R16Wintertyres
225/45 R17Summer
tyres
Aqu
apla
ning
vA
[km
/h]
Fig. 40. Aquaplaning speed for the different tyre dimensions. The values highlighted in green are the means within the group of tyres. Diagram from [Alteköster, 2005]. 8.7 Measurements by Continental Tyres in Germany
Unpublished data from Continental Tyres in Hanover, Germany, showed no correlation between noise level and wet road braking distance on a concrete surface [Saemann, 2005-2]. This study included a large number of tyres, but most of them were experimental and have not been released on the market. Wet road braking on a low-friction test track surface showed a slight (conflicting) relation between noise level and braking distance, whereas results on a high-friction test track surface showed the contrary relation. In both cases the correlations were weak and since they were inconsistent, the conclusion when considering all results together is that there seems to be no correlation between wet road braking and noise [Saemann, 2005-2]. One shall then bear in mind that the tested tyres were a mix of market tyres and tyres not available on the market.

FEHRL Report. 64 Final Report SI2.408210 Tyre/Road Noise – Volume 2
FEHRL
8.8 IEA Workshop November 2005
In November 2005, the International Energy Agency (IEA) organized a workshop on more energy efficient tyres. At this workshop relations between tyre rolling resistance and other parameter were reported in some presentations. First, a presentation by Duleep had a slide regarding trade-offs between various parameters which read [Duleep, 2005]:
• Auto-manufacturers emphasize that tire properties trade-off is a function of tire technology, and trade-off for a new tire should be evaluated at given technology level.
• Over time, it is possible to improve all properties simultaneously with technology improvements. Hence comparisons of tires at different technology levels will show no consistent trade-off pattern.
• New silica tires have lower RRC tradeoff with other desired properties than older designs.
These bullets, especially the two first ones, are very important for this section of the report. A paper by Michelin presented suggestions from Michelin regarding development and encouraging greater use of low energy tyres (LET), as shown in Fig. 41. This is of interest here since it is largely consistent with the wishes of many actors regarding another environmental parameter, namely noise. For example, Michelin wants to have maximum limits for rolling resistance (RR) that eliminates the tyres with the highest RR. Another presentation by Michelin looked at the conflicts between rolling resistance, safety and tread wear. The ETRTO had commissioned a multi-parameter study comprising 12 European tyre segments (dimensions and winter/summer) and 20 brands of car tyres (in total 183 tyres) to TÜV in Germany and CERM in France. Fig. 42 shows the relations measured between fuel efficiency (proportional to rolling resistance) and wet braking performance. The scales are normalized to 100 % for each parameter, representing the "average tyre". Each symbol in the diagram represents a certain dimension and tyre type. Fig. 43 shows the same thing but with wet road braking replaced with tread wear. The conclusion was that there are some very weak but not negligible correlations between rolling resistance on one hand and safety and wear on the other hand13. However, it was also concluded that the scatter is so large that it is always possible to find tyres which meet very high standards for all three of the parameters. The tyres with high performance in all parameters generally are tyres for which a more advanced technology has been used. Thus, the major conclusion is that with more or better technology one can meet multiple requirements and does not have to accept trade-offs. This is totally in line with what was said by Mr Duleep, see above.
13 It was not stated whether the correlations were statistically significant or not. To this author it looks quite uncertain that there were statistically significant correlations.

FEHRL Report Final Report SI2.408210 Tyre/Road Noise – Volume 2 65
FEHRL
Fig. 41. Suggestions from Michelin to support development of low energy tyres (LET) and introduction of instruments to accelerate this. From [Penant, 2005].
Fig. 42. Fuel efficiency versus wet road braking performance for car tyres according to experimental study made by TÛV and CERM and presented by Michelin [Aimon, 2005].

FEHRL Report. 66 Final Report SI2.408210 Tyre/Road Noise – Volume 2
FEHRL
Fig. 43. Fuel efficiency versus tread wear performance for car tyres according to experimental study made by TÛV and CERM and presented by Michelin [Aimon, 2005]. 8.9 Other measured data or expressed views
The multi-parameter study by ETRTO mentioned in the previous sub-chapter includes also data on noise levels of the tested tyres. Together with the friction, wear and rolling resistance data, one would be able to make interesting comparisons. However, these results have not yet been made available to the project. A paper by Bayer AG concludes "By using modern synthetic rubbers, it is possible to meet the constantly increasing requirements placed upon tyres with regard to safety, environmental protection and, last but not least, economy" [Engehausen et al, 2001]. 8.10 Conclusions
The picture from this Chapter comes out quite clear and consistent: • Although some design properties of tyres seem to be in conflict when designing for
noise reduction by conventional pattern and rubber changes, no significant conflicts have been detected on market tyres in practice.
• None of the reviewed studies could detect a significant conflict between requirements for low noise and wet braking or aquaplaning performance. One of them, based on a

FEHRL Report Final Report SI2.408210 Tyre/Road Noise – Volume 2 67
FEHRL
very small sample seemed to indicate such a conflict but when studying the data from another perspective it turned out that the assumed conflict could be explained by a tyre width influence.
• None of the reviewed studies could detect a significant conflict between requirements for low noise and low rolling resistance.
• Several low noise tyres that also meet high standards in other respects than noise, such as safety and rolling resistance, are available.
• The key point according to the industry is advanced technology: advanced technology will provide better performance for multiple parameters simultaneously. It will widen the area of the polar diagram of Fig. 26, not just pull out one of the items.
It follows that the limits with regard to skid resistance and rolling resistance which are planned for introduction within the near future cannot be justified from the point of view of noise; i.e., there is no reason based on currently available data to expect that the noise limits will mean that tyres with inferior performance concerning safety and rolling resistance will come into the market. Nevertheless, there might of course be other reasons for introducing such limits, but this is not a subject of this report. This author recalls a comment made by the Michelin representative at one of the ERGA-Noise meetings in the early 1990's when it was discussed whether noise limits would need to be accompanied by wet grip limits in order to avoid sacrifices of safety for low noise tyres. Mr André Schneider of Michelin said approximately "We would never supply to the market a tyre which would have poor wet grip performance since this parameter is so crucial to us". The implication was that tyres meeting a noise limit will not result in a sacrifice of wet grip and that wet grip limits are not really necessary. At least with respect to the possible sacrifice of wet grip, history has now shown that Mr Schneider's prediction was correct.

FEHRL Report. 68 Final Report SI2.408210 Tyre/Road Noise – Volume 2
FEHRL

FEHRL Report Final Report SI2.408210 Tyre/Road Noise – Volume 2 69
FEHRL
9 Trade-off with fashion and styling?
When studying tyre brochures and websites it is obvious that the visual appearance of tyres, especially the tread patterns, is an important design issue; i.e. fashion plays a significant role in tyre design. Just a couple of examples are given here to illustrate the problem. Fig. 44 shows a picture from Tire Technology International, according to which a tyre tread which looks like almost the worst one can imagine from an acoustical point of view has been designed based on resemblance with sport shoes. Another example, Fig. 45, is from the same page in Tire Technology International, showing a text describing how visual appearance has influence the tread design of a Japanese tyre. Similar things can be found among almost all tyre manufacturers.
Fig. 44. Picture from Tire Technology International June/July 2005 with the caption "For Hummer's H3T concept, BF Goodrich developed tires with sportswear firm, Nike". Many if not most tyres for high-performance cars nowadays typically have a tread with diagonal long grooves, often in V-shape. This is said by tyre developers to be to a significant extent based on visual appearance and not on what one would do if the design was based on safety and noise. An example of such a V-shaped groove design is shown in Fig. 46. Perhaps a solution to this is to combine the V-shaped grooves with sipes and very narrow lateral grooves as well as wider longitudinal grooves, such as is the case for one of the quietest tyres produced so far; namely, the Yokohama AVS dB S2 tyre [Yokohama, 2005]? See Fig. 47. The company claims that by using an unbroken and stable centre rib they create "stealth-like handling and stability" to solve the handling and braking problem.

FEHRL Report. 70 Final Report SI2.408210 Tyre/Road Noise – Volume 2
FEHRL
Fig. 45 (left). Picture from Tire Technology Inter-national June/July 2005, illustrating how important the visual appearance of tyres is to vehicle and tyre manufacturers.
Fig. 46 (above right). Example of a modern V-shaped-groove tread design. Photo by the author. Note that this particular tyre may not necessarily be poor from an acoustical point of view.
For low-noise purposes, a favourable design would typically feature the design details showed in Fig. 48. By such optimization one may reach a noise level as low as only 1-2 dB(A) above that of a pattern-less tyre and further significant improvements by tread design are not very likely [Saemann, 2005-1]. However, the visual appearance of such a tyre is not currently popular among tyre designers. Fig. 47 (left). The Yokohama AVS dB S2 tyre; one of the quietest tyres on the market, which seems to combine the principles outlined in Fig. 46 and Fig. 48.
At the Tire Technology Expo in 2005, there was an interesting presentation showing how important visual appearance is, by [Miyabe, 2005]; namely, almost as important as ride and handling, and more important than traction. See Fig. 49.

FEHRL Report Final Report SI2.408210 Tyre/Road Noise – Volume 2 71
FEHRL
Fig. 48. Example of a tread design with low noise characteristics; i.e. what a noise control tyre engineer would aim at. From [Saemann, 2005-1], used with permission.
Quality & Durability
43%
Ride & handling
19%
Appearence17%
Traction15%
Fuel economy6%
Fig. 49. Criteria for the choice of tyres by consumers, according to a German study, [Power and Associates, 2003] presented by [Miyabe, 2005].

FEHRL Report. 72 Final Report SI2.408210 Tyre/Road Noise – Volume 2
FEHRL
Another fashionable trend is so-called Plus-sizing. Plus-sizing refers to the tendency for tyres that are wider and have a shorter sidewall than "regular" tyres; i.e. to select a tyre with lower aspect ratio but generally the same outer diameter. The result is considered by many as "a sportier look". This styling trend was heavily criticized recently by one of the foremost tyre experts in the world, Dr Joe Walter, who in a column in Tire Technology International wrote among other things [Walter, 2006]: "This mainly dealer-driven process is known as plus-sizing; the latest edition of The Plus-Sizing Guide issued annually by Tire Guides Inc lists 432 pages of such sizing possibilities for domestic and foreign passenger cars available in the North-American market ….." "And while this trend started in the after-market, it is unfortunately becoming popular with some OEMs"14. "Plus-sizing seems to be reversing these long-term development trends in tire-wheel technology". Dr Walter continues to list the advantages and disadvantages of the plus-sizing trend and finds that the disadvantages in safety and economy dominate. Plus-sizing seems quite clearly to be inconsistent with principles for lower noise. Thus it is important not only from safety and economy points of view but also from the acoustic point of view to attempt to counteract the trend. Lower noise limits balanced in the right way, which may mean not allowing higher noise limits for wider tyres with lower aspect ratios, may help to do so since it should make it more difficult to offer plus-sizing options that will also meet the noise limits. In other words, it seems important that tyres that would be favoured in plus-sizing will have to meet as stringent noise limits as the tyres that they are supposed to replace. If not, after-market styling attempts and consequent pressure on vehicle manufacturers to supply such concepts as original equipment will lead to an increase in noise emission in the future. One conclusion from this would be that there should logically be a potential for better acoustical characteristics of tyres if visual appearance would not have an influence on tread pattern design. Furthermore, styling trends such as plus-sizing need to be counter-acted. It would be better if technological performance rather than styling and fashion would lead the development.
14 Author's comment: For example, look at the future concept cars presented at automotive fairs; these invariably have extremely low aspect ratio tyres with high diameters

FEHRL Report Final Report SI2.408210 Tyre/Road Noise – Volume 2 73
FEHRL
10 Tyre main types – distinction in the Directive
10.1 The tyre categories in the Directive
As shown in Chapter 3, tyres are categorized into three major groups depending on whether they are intended for car, for van or for heavy vehicle use. These groups are defined by their Load Index (LI), which is a value showing the maximum load that a tyre can carry when properly inflated. Further, there is a distinction within each major group regarding the use of the tyre or the tyre section width. Table 3 summarizes the tyre categorization.
Table 3. Categorization of tyres according to Directive 2001/43/EC.
Designation of tyre group
Tyre section width [mm] Use of the tyre Extra subcategories
Main category C1: Tyres for cars (LI = any): C1a <145 - Reinforced / Special* C1b >145 <165 - Reinforced / Special* C1c >165 <185 - Reinforced / Special* C1d >185 <215 - Reinforced / Special* C1e > 215 - Reinforced / Special*
Main category C2: Tyres for vans and light trucks (LI • 121): C2a - Normal C2b - Snow** C2c - Special***
Main category C3: Tyres for heavy trucks (LI > 121): C3a - Normal C3b - Snow** C3c - Special***
* Special here means tyres for mainly off-road use ** Snow means tyres used for maximum traction purposes, such as tyres on drive axles on trucks and busses, and tyres for use in mud and snow and on icy roads *** Special here means tyres for heavy duty use, e.g. tyres for use on trucks partly driven off-road, such as trucks carrying building construction material from gravel pits, etc.
10.2 Alternative categorization by tyre load index (LI)
When the Directive and the corresponding ECE regulation were discussed, Germany put forward a proposal to replace the width categorization with one based on the load index. The load index is selected according to what maximum load the car will carry, and thus based on technical needs. Also the tyre width is selected according to load requirements but also with respect to appearance and fashion. It could be tempting to select a wider

FEHRL Report. 74 Final Report SI2.408210 Tyre/Road Noise – Volume 2
FEHRL
tyre than desired for other reasons, since it would give a higher allowance in terms of noise level. In such a case the noise limitation system might be partly counter-productive. The German proposal is presented in Table 4. However, the width categorization was preferred in both the Directive 2001/43/EC and in the ECE Regulation.
Table 4. Categorization of tyres according to a German proposal [BMV, 1997], compared to that in Directive 2001/43/EC.
Designation of tyre group
Directive 2001/43/EC Tyre section width
[mm]
Directive 2001/43/EC Extra subcategories
German proposal Load Index (LI)
Main category C1: Tyres for cars: C1a <145 Reinforced / Special* LI < 80 C1b >145 <165 Reinforced / Special* 80 • LI • 86 C1c >165 <185 Reinforced / Special* 87 • LI • 93 C1d >185 <215 Reinforced / Special* C1e > 215 Reinforced / Special*
LI • 94
10.3 Technical possibilities to skip the tyre width categories
Based on the knowledge available at the production of the Directive 2001/43/EC, it seemed justified to use different limiting values for different tyre widths (or load index); see for example Fig. 5. If one would have determined only one single limit for all car tyres, the result would have been a rather high limit, allowing some wide tyres to be used, and this would have resulted in no narrow and very few medium tyres being eliminated. Since the latter dominated the market, this would have meant an inefficient noise control system. As shown in Chapter 2, the legislation which governs tyre/road noise today, at least for tyre category C1, is the vehicle noise Directive 92/97/EC rather than the tyre noise Directive 2001/43/EC. In the former, there is no distinction between tyre widths or load index. Furthermore, the relation observed in recent measurements between noise levels and tyre widths of car tyres, suggests that width is no longer a major factor within the tyre width range which contains the majority of tyres. The reason for this might well be the indirect requirements on tyre/road noise in Directive 92/97/EC. Consequently, there is clearly a technical possibility to skip the distinction between widths and use the same limiting value for all C1 tyres. It is hard to see any need to keep this particular feature of the Directive, other than for the extremely wide C1 tyres. Rather, it is counter-productive, since the more liberal noise limits for wider tyres encourage the selection of wider tyres than are necessary for vehicle handling, etc. The narrowest tyres (155 mm and lower) would have little problem to meet lower limits, in contrast to the medium-wide tyres, but since these narrow tyres are a relatively small percentage in today's traffic (total market share of 10-15 %) and probably will be so even more in future years, it is not necessary to require lower limits for them.
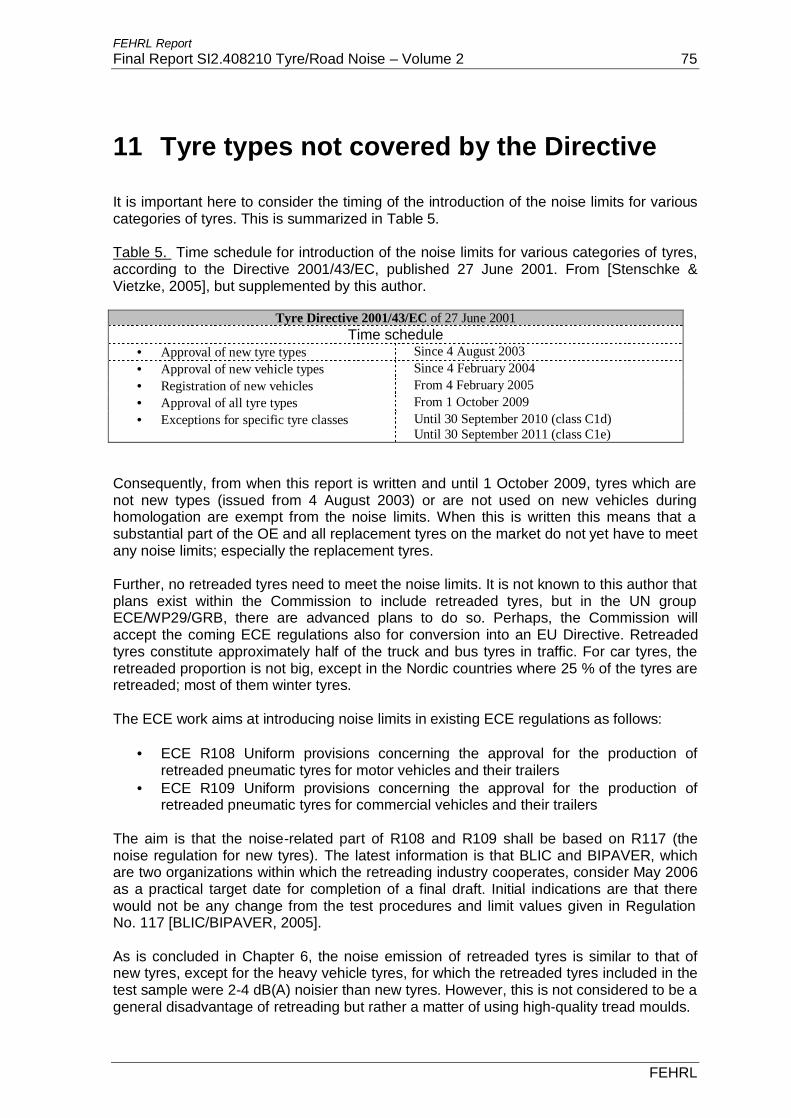
FEHRL Report Final Report SI2.408210 Tyre/Road Noise – Volume 2 75
FEHRL
11 Tyre types not covered by the Directive
It is important here to consider the timing of the introduction of the noise limits for various categories of tyres. This is summarized in Table 5. Table 5. Time schedule for introduction of the noise limits for various categories of tyres, according to the Directive 2001/43/EC, published 27 June 2001. From [Stenschke & Vietzke, 2005], but supplemented by this author.
Tyre Directive 2001/43/EC of 27 June 2001 Time schedule
• Approval of new tyre types Since 4 August 2003 • Approval of new vehicle types Since 4 February 2004 • Registration of new vehicles From 4 February 2005 • Approval of all tyre types From 1 October 2009 • Exceptions for specific tyre classes Until 30 September 2010 (class C1d)
Until 30 September 2011 (class C1e) Consequently, from when this report is written and until 1 October 2009, tyres which are not new types (issued from 4 August 2003) or are not used on new vehicles during homologation are exempt from the noise limits. When this is written this means that a substantial part of the OE and all replacement tyres on the market do not yet have to meet any noise limits; especially the replacement tyres. Further, no retreaded tyres need to meet the noise limits. It is not known to this author that plans exist within the Commission to include retreaded tyres, but in the UN group ECE/WP29/GRB, there are advanced plans to do so. Perhaps, the Commission will accept the coming ECE regulations also for conversion into an EU Directive. Retreaded tyres constitute approximately half of the truck and bus tyres in traffic. For car tyres, the retreaded proportion is not big, except in the Nordic countries where 25 % of the tyres are retreaded; most of them winter tyres. The ECE work aims at introducing noise limits in existing ECE regulations as follows:
• ECE R108 Uniform provisions concerning the approval for the production of retreaded pneumatic tyres for motor vehicles and their trailers
• ECE R109 Uniform provisions concerning the approval for the production of retreaded pneumatic tyres for commercial vehicles and their trailers
The aim is that the noise-related part of R108 and R109 shall be based on R117 (the noise regulation for new tyres). The latest information is that BLIC and BIPAVER, which are two organizations within which the retreading industry cooperates, consider May 2006 as a practical target date for completion of a final draft. Initial indications are that there would not be any change from the test procedures and limit values given in Regulation No. 117 [BLIC/BIPAVER, 2005]. As is concluded in Chapter 6, the noise emission of retreaded tyres is similar to that of new tyres, except for the heavy vehicle tyres, for which the retreaded tyres included in the test sample were 2-4 dB(A) noisier than new tyres. However, this is not considered to be a general disadvantage of retreading but rather a matter of using high-quality tread moulds.

FEHRL Report. 76 Final Report SI2.408210 Tyre/Road Noise – Volume 2
FEHRL

FEHRL Report Final Report SI2.408210 Tyre/Road Noise – Volume 2 77
FEHRL
12 Some views expressed recently by vehicle and tyre manufacturers
12.1 Vehicle manufacturers
In its response to a FEHRL questionnaire issued within this project, the following answers from the European Automobile Manufacturers Association (ACEA) are of interest (summarized here): • ACEA points out that OE tyres with 1-4 dB(A) lower noise levels than present limits
already are largely available on the market • The section width specification should be revised to use only one width class (all
widths) or three classes (small, medium, large) • As replacement tyres most likely have higher noise levels (and are not currently
subject to limits) a marginal effect on traffic noise can be expected of new and stricter noise limits
• The ISO 10844 surface seems to be appropriate after some improvements 12.2 Tyre manufacturers
In a recent presentation, Dr Saemann from Continental Tyres presented "Perspectives for PC Tyres" as follows [Saemann, 2005-2]: Short term • Full compliance to current Dir 2001/143 (including replacement tyres) • -1 dB(A) by 2007/2008 for section widths < 185 Medium term • Reduction by 2009/2010 • Another -1 dB(A) for all tyre widths seems feasible keeping the other performances
well balanced but with the following constraints: - The growth of the SUV market world-wide will require special consideration for off-
road tyres - The trend for higher section widths tyre will certainly need to reconsider the
splitting of class C1e which is unlimited for the moment Long term • A technological break-through is required if we have to generate a shift of more than
-3 dB(A) for all the tyre categories At a meeting between the project group and ETRTO in September 2005, it was expressed by ETRTO that low-profile high-performance tyres with exceptional section width (such as 250-270 mm) may need extra noise allowance, which is in-line with the presentation by Dr Saemann.

FEHRL Report. 78 Final Report SI2.408210 Tyre/Road Noise – Volume 2
FEHRL
The author's comment is that there is already a special provision for off-road tyres (currently 2 dB higher allowance). In the discussions between ETRTO and FEHRL, ETRTO has expressed the following (most important) views: • There is a clear relation between noise level and tyre width (see further section 7.4) • Therefore one shall maintain the present system with different noise limits in different
tyre width classes • Wider tyres need higher noise limits (see further section 7.4) • For the latter purpose one should create two new tyre width classes on top of the
existing ones • Reinforced tyres need an extra allowance (see further section 7.4) • Retreaded tyres need not in general to be noisier than new tyres • Limits can be reduced by 1 dB(A) for the majority of tyres in 2007-2009 • Limits can be reduced by a further 1 dB(A) for the majority of tyres in 2009 (except
M+S tyres) • Reducing noise limits by 2 dB(A) will require redesigning of 10 % of tyres of current
tyre families and will leave a further 14.9 % of tyre families exactly on the limit • Tyres used off-road for special tasks such as power line inspection and repairs, fire-
fighting, medical emergencies, etc, are called Professional off road tyres and should be exempted from noise limits. Definitions may include tread depth at least 10 mm, speed symbol maximum Q (160 km/h) and M+S marking
• ETRTO does not accepting testing on two different ISO surfaces; it would mean too much extra labour and costs
ETRTO holds the view that M+S tyres need 1 dB higher noise limits than non-M+S tyres. To support this, ETRTO submitted a diagram based on the same data as Fig. 25, according to which the regression line for noise versus tyre width is 1 dB higher for winter (M+S) tyres than that of summer tyres. This literature review has not discovered any significant difference in noise generation between winter and summer tyres (except that presented by ETRTO). However, it has been noticed that the variation between various tyre brands is larger for winter than for summer tyres. Therefore, in case one would measure predominantly tyres which would tend to be closer to the limits, rather than such which are well below the limits15, one would probably find that winter tyres would more frequently appear in this higher noise level range than summer tyres. This does not, however, mean that the "average" winter tyres are noisier than summer tyres. It has, for example, often been noticed that the quietest tyres are (studless) winter tyres [Sandberg & Ejsmont, 2002].
15 It would be natural to do this if one would like to be sure that a family of tyres does not exceed the noise limit, since one needs then to measure only the "worst" tyres and the "best" tyres may be left aside
FEHRL Report Final Report SI2.408210 Tyre/Road Noise – Volume 2 79
FEHRL
13 Variability between tyres and the potential for noise reduction utilizing existing technology
The data reviewed allows some conclusions to be drawn with regard to the variation in noise levels between tyres. The following is a compilation of such information, neglecting slick tyres and studies containing less than 50 tyres: Source Variation for similar subclass Variation within class C1 Fig. 6 (normal DAC surface) 10 dB >10 dB Fig. 7 (ISO surface) 8 dB >8 dB Fig. 9 4-5 dB 5 dB Fig. 15 6 dB 7 dB ETRTO figure on Noise vs LI 6-7 dB ? 13 dB ETRTO figure re. M+S tyres 6-8 dB ? 10 dB The ETRTO figures are not published here but were given to the FEHRL project group and are mentioned in Sections 7.4 and 12.2. Fig. 9 contained the lowest number of tyres (82), which may explain why the variation is the smallest, while the ETRTO figures contained up to 500 tyres, which may explain why it seems to show the largest variation. Taking such differences into account, the data seems to be rather consistent, suggesting that if one includes several hundreds of tyres in the tests, variation will be 6-8 dB within a certain sub-category and about 10 dB within the total C1 category. The above figures are for C1 tyres only. For C2 tyres, the amount of available data is too small. For C3 tyres, the only substantial source would be Fig. 16, which suggests that the range is about 10 dB (excluding the worst tyre tested by M+P). Assuming that all European tyres are safe, this of course suggests that there is quite a potential to reduce noise emission without obtaining unsafe tyres simply by trying to apply the best currently available technology. The entire range of variation cannot be utilized for this since within each subcategory there are tyres optimized for various purposes, but a major part of it should be available. Finally, it can be mentioned that a list of measured noise levels of C1, C2 and C3 tyres, made by TÜV and Müller-BBM in Germany and M+P in the Netherlands, is published on a Dutch website [IPG, 2005]. Most if not all of these measurements are already included in Figs. 15 and 16.

FEHRL Report. 80 Final Report SI2.408210 Tyre/Road Noise – Volume 2
FEHRL

FEHRL Report Final Report SI2.408210 Tyre/Road Noise – Volume 2 81
FEHRL
14 Future potential low-noise concepts for tyres
14.1 Further development using conventional technology
The technical potential for reduction of tyre/road noise the next few years and in a longer time perspective is also of interest. The following is a non-exhaustive list of possibilities currently under exploration: Adapting winter tyres for all-year use: The principles used in construction of winter tyres may be partly adapted to summer tyres; in order that summer tyres may obtain some of the favourable noise characteristics of winter tyres; yet having handling and wet friction properties acceptable for summer use. This may include using smaller tread elements, more frequent siping and softer rubber compounds. Can some winter tyres even be used the entire year? To answer this question, it is interesting to note what one tyre expert wrote to this author a couple of years ago (citation modified only to provide anonymity)16: “Tyre XX is made for Middle-European winter. I am myself using them as summer tyres (225/45R17) because of good, comfortable, acceptable handling, low noise and low rolling resistance.” This person is a major researcher at a European tyre research centre. This is not to say that all or most winter tyres would be suitable also for summer use, but it suggests that at least some of them are so; probably with some sacrifices, for example wear. Probably, one may regard the tyre shown in Fig. 47 as one example of application of this principle. Reducing the air/rubber ratio in the tread pattern: In the SILENCE project one of the possibilities being explored is the reduction of the air/rubber ratio in the tread pattern; for example by reducing the width of channels in the tread pattern. It has been found that a combination of softer rubber and lower air/rubber ratio may influence tyre/road noise emission on an ISO surface by about 6 dB(A). If, today’s common ratio of 30 % is replaced with 20 % this would give a potential noise reduction of 3 dB(A). Work will continue; for example to see how a reduction from 30 to 20 % may be combined with acceptable hydroplaning characteristics (this may be difficult for high-performance cars). Reducing the longitudinal size of tread elements: Today, the number of tread elements around a car tyre circumference is around 65; which is a result of a compromise between demands for braking and noise. This gives a tread impact frequency which is near the typical peak in the frequency spectrum at 800-1000 Hz. It is desirable to displace this tread impact frequency to some higher frequency where the tyre is less sensitive. Within the SILENCE project, it is therefore considered to increase the number of tread elements to a higher number, at least 70 and preferably up to 100. This cannot be made immediately since one must find out ways to achieve this without compromising braking performance due to the more flexible tread.
16 Unfortunately, a reference cannot be given here, due to confidentiality promises

FEHRL Report. 82 Final Report SI2.408210 Tyre/Road Noise – Volume 2
FEHRL
Making use of softer rubber compounds: Typically, winter tyres may have a Shore hardness of 55-60. Fig. 50 shows an example of how rubber hardness of summer tyres in new condition and then hardened by time affects noise generation for three tyres. If tyres did not have to be produced for such high speed categories as today, softer compounds may be used. Softer tyre rubber compounds are already used in Japan and in USA, but cannot yet be used in Europe due to the high maximum speeds on certain motorways. Sidewall stiffness adjustments: Changing the sidewall stiffness by using other materials or adding extra materials on the entire or part of the sidewalls will affect noise generation; especially at rather low frequencies. For example, one may have a different stiffness on one of the sidewalls compared to the other one in order to reduce the propagation of noise away from the vehicle. Run-flat technology: A little related to the topic above, an interesting challenge is also to combine run-flat technology with noise reduction. In principle, one can imagine that some of the run-flat concepts used or considered today may be adapted also to provide some exterior noise reduction; though not necessarily a simultaneous interior noise reduction. Views on whether the run-flat technology may be positive or negative to noise vary. Anyway, it needs some exploration.
ISO surface
95
96
97
98
99
100
65 70 75 80Shore hardness
SPL
[dB
(A)]
CPX Tyre BCPX Tyre A
CPX Tyre C
Rough-textured surface
97
98
99
100
101
102
65 70 75 80Shore hardness
SPL
[dB
(A)] CPX Tyre B
CPX Tyre A
CPX Tyre C
Fig. 50. Effect on tyre/road noise of rubber hardness (in Shore A), measured with the CPX method on an ISO surface and a rough-textured surface. Diagram by the author, measurements in 2005 on the laboratory drum at the Technical University of Gdansk, Poland. An example of a successful noise reduction design was presented in [Saemann et al, 2001]. Dr Saemann and his colleagues had produced a truck tyre that was equally quiet as a slick tyre, see Fig. 51. However, although the tyre had fully acceptable properties in other respects than noise, it was found that this tyre was not desired or needed by the vehicle industry, partly due to its visual appearance, partly due to that there was no need for any quieter tyre by the vehicle industry. By means of the noise prediction model TRIAS for tyres, TNO in the Netherlands has tried to predict how one may optimize the major parameters to obtain a low noise design [de Roo, 2005]. Parameter values for nine variables are given for minimum vibration noise.

FEHRL Report Final Report SI2.408210 Tyre/Road Noise – Volume 2 83
FEHRL
Fig. 51. Noise levels of some conventional truck tyres, a slick tyre and a low-noise truck tyre, according to [Saemann et al, 2001] (the black heading and arrow added by this author). 14.2 Attempts to estimate the noise reduction potential
The TNO modelling mentioned above claims to make possible a noise reduction of vibration-related noise by 6-7 dB(A) by optimization of a set of nine parameters; for example resulting from a 25 % reduction in section width and 5 % reduction of rolling radius and lower air/rubber ratio. The overall reduction depends on how large proportion of the total noise that comes from vibrations [de Roo, 2005]. It is admitted that handling and wear requires further attention and aquaplaning is predicted to both suffer and benefit from the changes. The TNO study finally estimates the noise reduction potential to be 5-6 dB(A) if air pumping noise can also be reduced; for example by adding porosity in the tyre tread. The technical potential for reduction of tyre/road noise the next few years by conventional methods has been extensively explored and discussed in a German PhD thesis [Schubert, 2003]. In his summary Dr Schubert includes a figure that illustrates his impression of the potential influences of various parameters that tyre engineers may play with, see Fig. 52.

FEHRL Report. 84 Final Report SI2.408210 Tyre/Road Noise – Volume 2
FEHRL
Fig. 52. Noise-influencing parameters and their relative reduction potentials, according to [Schubert, 2003], translated from German to English by Mr Schubert and the author. Dr Schubert lists the following possibilities (translated from German): • Making use of the acoustical advantages of tyres with run-flat technology • Implementation of a fast tyre inflation control system (to optimize air inflation
pressure) • Spatial differentiation of functional properties in the tyre/road contact area (outside
parts of tread acoustical optimized => longitudinal profile, inner part of tread optimized for example for wet braking and handling => lateral profile), in combination with a dynamically adjustable camber
• Making use of softer tread compounds (considering wear resistance and rolling resistance)
• Minimization of the horn effect towards the sides (more "corner-like" tyre cross-section, screening of the horns)
With such measures, the noise reducing potential is estimated at the same level as the noise emission of slick tyres; i.e., 4-5 dB(A) lower than today's tyres of the same construction but with conventional tread patterns [Schubert, 2003].

FEHRL Report Final Report SI2.408210 Tyre/Road Noise – Volume 2 85
FEHRL
14.3 Unconventional technology and innovations
The pneumatic tyre has been developed over the decades into one of the most sophisticated mechanical components that one can imagine17. It provides a rolling performance in most important respects that is amazing. Only a minor defect may demonstrate that this performance is not a matter of course but a result of a sensitive design. But this does not go without saying that the pneumatic tyre is the only useful device that could provide a safe, quiet and economic rolling for a vehicle. If a mere fraction of all the resources spent on tyre development so far would be spent on development of the composite wheel [Sandberg 2003-1], what can one achieve then? An interesting editorial appeared in Tire Technology International recently. It was written by the former Director of Research at Dunlop Tyres in the UK, Dr A.R. Williams. He wrote [Williams, 2005-1]: "So why is the industry almost afraid to move forward and challenge principles and practises that have been around far too long and not questioned? Who is stopping the questions even being asked? Are the answers such that the associated change is just too scary?" Non-pneumatic tyres are not subject of the Directive 2001/43/EC. Nevertheless, in the future it may happen that non-pneumatic tyres might replace pneumatic ones so it is interesting to see what possibilities there may be at the horizon. Ongoing work led by VTI but in cooperation between a number of organizations and companies attempts to study the feasibility of developing the composite wheel concept into a useful component [Sandberg et al, 2003]. The partners include for example Chalmers and VTI in Sweden, the Technical University of Gdansk (TUG) in Poland, Volvo Cars, Nokian Tyres, and a retread company. It has already been demonstrated that the composite wheel has a very large noise-reducing potential if properly designed, and its wet friction and hydroplaning properties should be superior, but it is unknown if it can be made durable enough, what handling and rolling resistance properties one can achieve and how competitive production costs may be. Refer to Fig. 53 for an illustration. The noise-reducing potential for a composite wheel was demonstrated earlier to be around 10 dB(A); i.e. better than that of a pattern-less tyre on a smooth surface, and much better than any type of pneumatic tyre on a rough surface. Thus, it has the potential of a technical breakthrough, if properly developed (chapter 25 in [Sandberg & Ejsmont, 2002]). In January 2005, the Michelin concept wheel; the TWEEL, was presented. It has been developed at the Michelin research center in Greenville in the USA and has in 2005 received a number of innovation awards. An article in Tire Technology International describes this wheel which has a significant resemblance to the one in the VTI project [Williams, 2005-2]. There is a video film made by Michelin which shows an Audi A4 car driving around a curvy test track at relatively high speed on a set of TWEELs. However, it has been indicated in an interview with a Michelin official that there are some problems with vibrations from the spokes, just as has been experienced in the design in Fig. 54. Nevertheless, when developed further by Michelin, it is possible that this concept may provide a technical breakthrough in terms of exterior noise emission. 17 The text in this part is partly based on an article in Tire Technology International '03 [Sandberg, 2003]
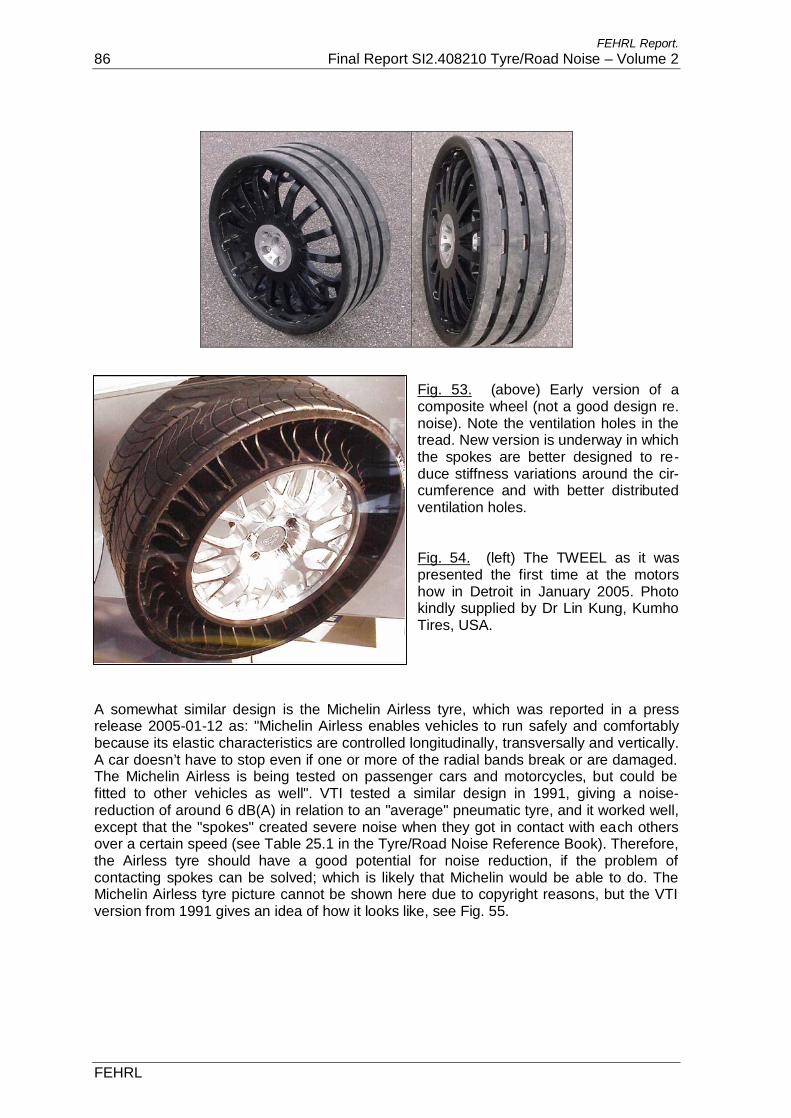
FEHRL Report. 86 Final Report SI2.408210 Tyre/Road Noise – Volume 2
FEHRL
Fig. 53. (above) Early version of a composite wheel (not a good design re. noise). Note the ventilation holes in the tread. New version is underway in which the spokes are better designed to re-duce stiffness variations around the cir-cumference and with better distributed ventilation holes. Fig. 54. (left) The TWEEL as it was presented the first time at the motors how in Detroit in January 2005. Photo kindly supplied by Dr Lin Kung, Kumho Tires, USA.
A somewhat similar design is the Michelin Airless tyre, which was reported in a press release 2005-01-12 as: "Michelin Airless enables vehicles to run safely and comfortably because its elastic characteristics are controlled longitudinally, transversally and vertically. A car doesn’t have to stop even if one or more of the radial bands break or are damaged. The Michelin Airless is being tested on passenger cars and motorcycles, but could be fitted to other vehicles as well". VTI tested a similar design in 1991, giving a noise-reduction of around 6 dB(A) in relation to an "average" pneumatic tyre, and it worked well, except that the "spokes" created severe noise when they got in contact with each others over a certain speed (see Table 25.1 in the Tyre/Road Noise Reference Book). Therefore, the Airless tyre should have a good potential for noise reduction, if the problem of contacting spokes can be solved; which is likely that Michelin would be able to do. The Michelin Airless tyre picture cannot be shown here due to copyright reasons, but the VTI version from 1991 gives an idea of how it looks like, see Fig. 55.

FEHRL Report Final Report SI2.408210 Tyre/Road Noise – Volume 2 87
FEHRL
Fig. 55. Composite wheel, invented by H E Hansson, tested by VTI in 1991, see Table 25.1 in [Sandberg & Ejsmont, 2002]. The Michelin Airless tyre somewhat resembles this design.
The project led by VTI on tyre innovations also looks at the possibility to replace the conventional patterned tyre tread with a porous tread. In fact, a few of the most recent tyres have some kind of porosity features in their treads, although not so obvious to the eye, but there is evidence that such tyres are low-noise types. Speculations and some earlier testing suggest that such a porous tread tyre may have excellent wet friction and rolling resistance properties, but may sacrifice wear. Would a greater wear (if any) be acceptable? Would side force characteristics be acceptable? Further, a crucial point is if the porous tread can be sufficiently firmly connected to the carcass. The tread produced here is made up of rubber granules bound with polyurethane to create a porous structure with interconnecting air voids. The aim of the first phase of the project was to determine the potential noise reduction and rolling resistance of a porous tread tire. Fig. 56 shows the first prototypes of the porous tread tyre made in 2004. Testing so far of the porous tread tyre has indicated very interesting results [Sandberg et al, 2005]. The results indicated that the noise emission was exceptionally low on road surfaces with a texture typical of Swedish highways. In comparison to the two commercial car tires chosen as references, the noise reduction was about 7 dB(A) for both the narrow and wide tyres which is far below any other tyre measured. On very smooth surfaces, noise reduction was lower due to low-frequency noise being present as a result of the inhomogeneities in the handmade tread. Rolling resistance was about 10 % lower than that of a Michelin Energy 3A tyre which is the best of the conventional tyres measured by TUG so far. Wet friction was poorer than on the high-performance reference tyres; but can no doubt be improved substantially if high-quality rubber compounds are used instead of the low-quality recycled rubber used in the first prototypes.

FEHRL Report. 88 Final Report SI2.408210 Tyre/Road Noise – Volume 2
FEHRL
Fig. 56. Two porous tread tyre prototypes together with the regular tyres used as carcasses for the porous tread (after buffing-off the existing tread). Provided the friction, handling and wear properties of the porous tread tyre can be managed acceptably, this tyre may offer a technical breakthrough both for noise and rolling resistance. At least for wet friction, there is also a good potential, since the air volume in the tread is comparable to that of a summer tyre (in fact, approximately 30 % air voids by volume was measured) and all porous channels are very close to each other; shortening the escape time for water from a certain point in the tyre/road interface. Although friction on icy surfaces may be good, it is speculated that traction in snow may create some problems; thus the porous tread may not be ideal for all winter conditions. Some 20 years ago, tyres filled with solid polyurethane were tested for noise reduction. VTI and TUG still have such a tyre, sometimes used for testing purposes. This filled tyre produced about 3 dB(A) lower noise than its air-inflated counterpart (both were pattern-less). It is very interesting to note that polyurethane-filled tyres are no longer considered to be unrealistic. The US-based Amerityre Corporation (a manufacturer of moulded/filled bicycle and industrial truck tyres) is currently developing this concept for automobile use. For a few years, also Goodyear in USA was involved in this development. The latest progress reported (April 2005) is that a tyre filled with polyurethane elastomer has been approved by NHTSA according to the Federal Motor Vehicle Safety Standard FMVSS 129 for use as a temporary/spare tyre [Amerityre, 2005]. FMVSS 129 is the applicable U.S. safety standard for new, non-pneumatic tyres that must be met before the tyres can be offered commercially. The appearance of this tyre is shown in Fig. 57. This author believes that a success for this concept might mean a breakthrough for lower exterior noise too, provided noise issues are addressed in the construction. It is concluded that there are several possibilities for a breakthrough in tyre design for low noise (and low rolling resistance) within the next 10 years or so, provided sufficient resources are spent on developing the concepts presented above.
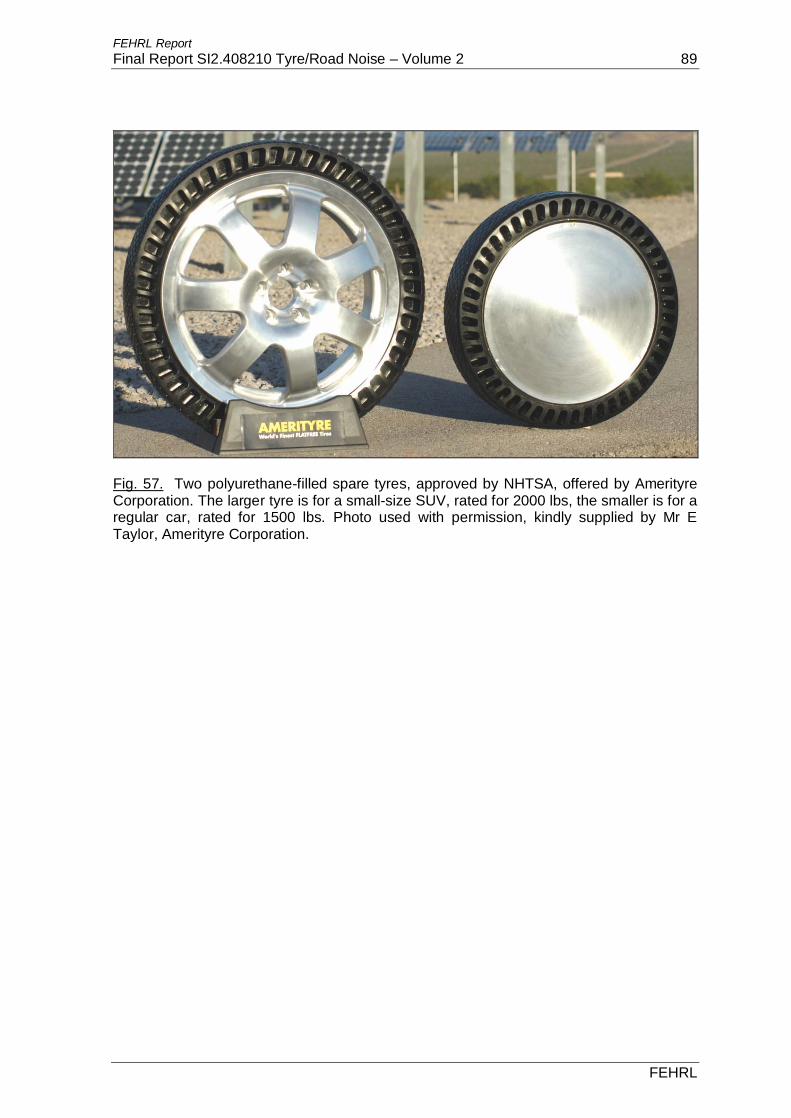
FEHRL Report Final Report SI2.408210 Tyre/Road Noise – Volume 2 89
FEHRL
Fig. 57. Two polyurethane-filled spare tyres, approved by NHTSA, offered by Amerityre Corporation. The larger tyre is for a small-size SUV, rated for 2000 lbs, the smaller is for a regular car, rated for 1500 lbs. Photo used with permission, kindly supplied by Mr E Taylor, Amerityre Corporation.

FEHRL Report. 90 Final Report SI2.408210 Tyre/Road Noise – Volume 2
FEHRL

FEHRL Report Final Report SI2.408210 Tyre/Road Noise – Volume 2 91
FEHRL
15 Suggestions for lowering of the noise limits
15.1 Policy expressions
When the ISO 10844 standard was developed some 15 years ago, the working group ISO/TC 43/SC 1/WG 27 (convened by this author) did not consider the surface as suitable This chapter reviews proposals to lower the tyre noise limits of Directive 2001/43/EC or the corresponding ECE draft regulation that have been made by various organizations or countries. This is of relevance here since one may assume that the proposed limits are based on estimation by the proposer of what is technically feasible and what is needed in order to achieve a noise-reducing effect in traffic. The Commission has expressed in a report to the Parliament and the Council willingness to follow-up and if feasible reduce the tyre noise limiting levels [Commission, 2004]. Two sections will be cited here. First a section referring to the vehicle noise limits, which will of course influence the tyre noise requirements from vehicle manufacturers to tyre manufacturers: "In fact, the introduction and regular tightening of these limits allowed for a harmonisation of the road vehicle fleet regarding noise emission characteristics, but did not prove to be a strong technical drive towards quieter vehicles, particularly in the case of delivery vans and trucks. Efforts should therefore be pursued in the future to assess the possibility of introducing tighter limits ensuring that quieter vehicles are actually being put on the market and recommending ways of removing noisier vehicles from the existing fleets." What is written specifically regarding tyres? First, the Commission describes the work which is actually the subject of this report; namely reviewing the present limits to see if the next stage set out in the Directive can be taken without compromising safety and rolling resistance. For the future following this, the following citation is of interest here: "The European Commission is pursuing its efforts at the UN/ECE level in order to propose the integration of the European tyre rolling noise provisions in Regulation N°51 of the 1958 Agreement of the World Forum for harmonisation of vehicles. However, the other contracting parties to Regulation N°51 are not considering the tyre as the only critical parameter, and suggest additional measures to address traffic noise, in particular regarding road surfaces and infrastructures." This is maybe somewhat unclear. One interpretation is that the Commission plans to, via work being conducted in the ECE, skip the tyre noise Directive and rely only on the vehicle noise Directive, or possibly supplement the latter with what is now in the tyre noise Directive? Further, measures to address traffic noise regarding road surfaces and infra-structures seem to be considered18.
18 The latter seems to this author as difficult to do within GRB and WP 29 which deal with regulations related to vehicles.

FEHRL Report. 92 Final Report SI2.408210 Tyre/Road Noise – Volume 2
FEHRL
15.2 Proposal by the UBA of Germany
When the ISO 10844 standard was developed some 15 years ago, the working group ISO/TC 43/SC 1/WG 27 (convened by this author) did not consider the surface as suitable The Umweltbundesamt (UBA) in Germany has proposed lowering of limits according to Table 6 [Stenschke, 2005], with an illustration for the car tyres in Fig. 58 [Stenschke & Vietzke, 2005]. The proposal is for a "flat rate" for C1 tyres of 71 dB(A). Together with the lower values for truck tyres, the lowering of the limits range between 1 and 6 dB(A). It is assumed here that the proposed values assume a similar treatment of measured values as the present Directive; i.e. truncation of decimals and subtraction of 1 dB. The UBA proposal is summarized as follows [Stenschke & Vietzke, 2005]: • The EU Directive on the limitation of tire/road noise emission has been effective since
4 August 2003 for approval of new types of tire. However, the limit values it sets are too high to bring about an advance in the state of the art.
• For this reason, the Federal Environmental Agency calls for distinctly lowered limit values. The proposed reductions versus the limit values of the Directive amount to 1 to 5 dB(A) for passenger car tires and 5 to 6 dB(A) for tires for commercial vehicles. Furthermore, the FEA is proposing that ambitious limit values for rolling resistance should be introduced as soon as possible.
• For the sake of better consumer information, all tires should be labelled with the type-approval values for tire-rolling noise and rolling resistance.
• Retreaded tires should be included in the scope of the Directive, at least for commercial vehicle tires because of their remarkable share of about 50% on the market.
When comparing the values in the table with the data of Figs. 15-16, it appears that the proposal would eliminate (approximately) the noisiest 20 % of the tyres. It is interesting to note that 25 % was a target discussed in ERGA-Noise and was the basis for the Nordic proposal in 1995. The following is a citation from the latter [Nielsen et al, 1995]: "25 % of the noisiest tyres on today’s market shall be replaced by less noisy tyres. This is a number mentioned in the discussions at ERGA-Noise meetings and no objections have been raised. This should ascertain that a. remaining tyres will meet high demands on safety b. there will be no dramatic effects on the market"

FEHRL Report Final Report SI2.408210 Tyre/Road Noise – Volume 2 93
FEHRL
Table 6 Lowering of noise limits suggested by the German Umweltbundesamt (UBA), according to [Stenschke, 2005]. The table also contains the criteria for low noise tyres according to ÖAL (the Austrian Noise Abatement Working Group).
67
68
69
70
71
72
73
74
75
76
77
145 155 165 175 185 195 205 215 225 235
tire width in mm
coas
t-by
leve
l in
dB(A
)
> 145 <= 165
> 165 <= 185
> 185 <= 215
> 215
EU-Limit value
ProposalUBA
Fig. 58. The proposed new tyre noise limits for car tyres proposed by UBA, together with the relationship between tyre/road noise and tyre width from measurements covering 82 types of passenger car tyres [Stenschke & Vietzke, 2005]. Values measured according to Directive 2001/43/EC (truncated and with 1 dB(A) subtracted).

FEHRL Report. 94 Final Report SI2.408210 Tyre/Road Noise – Volume 2
FEHRL
15.3 Proposal by TRL Limited
A proposal for new tyre noise limits was submitted recently by TRL Limited [Watts et al, 2005]. Table 7 shows the proposed limits for the various car tyre categories. Values in column A are measured according to Directive 2001/43/EC (truncated and with 1 dB(A) subtracted), while values in columns B and C are the measured values rounded to the nearest integer. This means that when comparing the columns with each other, the values of columns B and C as compared to column A are actually 1-2 dB more stringent than shown in the table (an average of 1.5 dB more stringent). The TRL proposal did not address C2 or C3 tyres. Table 7. The proposed new tyre noise limits for car tyres proposed by TRL Limited. See text for comments regarding comparison of column A with columns B and C.
Limit values in dB(A)
Tyre class Nominal section width (mm)
A (current limit) B1 C2
C1a • 145 72 71 71
C1b > 145 • 165 73 72 71
C1c > 165 • 185 74 72 71
C1d > 185 • 215 75 73 71
C1e > 215 • 245 76 73 71
C1f > 245 76 75 73 1 Limit values shall apply from 1 July 2008. 2 Limit values shall apply from 1 July 2010.
The above means that in the TRL proposal in column C the maximum level (before rounding) will be 71.4 dB for tyres C1a-C1e, while it is currently 73.9 dB for tyre category C1a and 77.9 dB for tyre category C1e; the latter according to column A but with the effect of truncation and subtraction added (+1.9 dB). Thus, the TRL proposal means an actual reduction in limits of 1.5 to 6.5 dB for the tyre categories C1a-C1e. This is rather similar to the UBA proposal of Table 6 which means 2 to 5 dB in reduction. Note that the principle to make noise limits independent of tyre widths favoured in both the UBA and the TRL proposal (in the latter case with an exception for extremely wide tyres) are supported not only by the data compilations (such as Fig. 15) but also by the arguments against the styling concept called plus-sizing mentioned in Section 9 of this report.
FEHRL Report Final Report SI2.408210 Tyre/Road Noise – Volume 2 95
FEHRL
15.4 Other considerations
Apart from the UBA and TRL documents, a large number of reports, papers, books and other documents have expressed as their view that the tyre noise limits in Directive 2001/43/EC are not strict enough to have any effect on traffic noise. Some of them are [SILVIA, 2005-1], [Haider et al, 2004], [ÖAL 35, 2004], [Sandberg & Ejsmont, 2002], [van der Toorn & Gerretsen, 2000]. As mentioned earlier in this report, replacement tyres are not yet subject to noise limits. In terms of the effect on road traffic noise levels, this means that the efficiency of the Directive is poor, due to the following reasons: • Replacement tyres are a substantial part of all tyres used in traffic; probably about 50
% of all tyres are replacement tyres (not considering retreaded tyres here) • Replacement tyres often use somewhat different materials than corresponding OE
tyres and are likely to be marginally noisier than OE tyres; see Section 12.1 and [Redmann et al, 2002]. The latter concludes that the noise difference to OE tyres may be 0 to 1 dB for tyres being nominally equal.
It may be concluded that replacement tyres should have to meet similar noise limits as OE tyres as soon as possible.

FEHRL Report. 96 Final Report SI2.408210 Tyre/Road Noise – Volume 2
FEHRL

FEHRL Report Final Report SI2.408210 Tyre/Road Noise – Volume 2 97
FEHRL
16 The relevance of the ISO 10844 surface
16.1 Representativity of the ISO 10844 surface
When the ISO 10844 standard was developed some 15 years ago, the working group ISO/TC 43/SC 1/WG 27 (convened by this author) did not consider the surface as suitable for testing tyres, at least not as a single surface. The main reason was that it was by that time not similar to any major surface which one would find on a considerable length of the road network. It was too quiet to be representative. This was also an expressed aim of the work, as order by ISO, since it was desired to define a surface that would reduce tyre noise contribution during the testing according to ISO 362 (nowadays similar to Directive 92/97/EC). But things have changed quite much since the 1980's, and nowadays the 10844 surface, or rather an improved version of it as is presently being developed, is more acceptable and in fact quite suitable for tyre noise testing. Of course, it is a common view among independent researchers and testing experts that it shall be supplemented by a second surface with a significantly rougher texture. The reasons why the 10844 surface (with improved specifications) is acceptable nowa-days are as follows: 1. The texture of this surface is quite similar to that of an SMA 0/8 or SMA 0/6 which are nowadays becoming increasingly popular as "semi-low-noise" surfaces in urban areas (where noise is a problem). 2. The texture of this surface and the balancing on the limit to where its sound absorption becomes important is similar to that of many thin surfacings, which are nowadays rapidly becoming popular in urban areas, not the least due to their low-noise characteristics. 3. All parties should work for an increased use of the above mentioned surfaces where noise is a problem, due to their acoustic properties; i.e. in the future one would expect to see even more use of these surfaces in urban areas. Not the least because the SILVIA project has demonstrated this need and possibility and it is likely that the SILVIA project might have such an effect on road and environment authorities. That this is the case is not strange at all. The task that was given to WG27 at the end of the 1980's was to specify a surface which gave a minimum of tyre/road noise, without affecting other vehicle noise (i.e. without substantial sound absorption). To create this, and with the poor surface measuring methods that were available by that time, WG27 had to find an acceptable balance. The principles of texture optimization were used to determine what surface that would fit the task that had been given. And WG27 succeeded quite well, since this surface has been demonstrated over and over again to be a low -noise surface; sometimes even "too low noise". The major problem was the lack of good methods to limit sound absorption to what was desired and this has been one of the major causes for the variability. But this variability was fairly acceptable by that time for ISO 362 purposes and with the limiting values by that time (when tyre/road noise was of much lower importance than now). After the introduction of ISO 10844, it cut the pre-10844 variability in ISO 362 measurements by a factor of three. This was a quite dramatic improvement.

FEHRL Report. 98 Final Report SI2.408210 Tyre/Road Noise – Volume 2
FEHRL
The same principles of texture optimization are used today to create or to select the surfaces mentioned above, so it is just natural that the ISO 10844 surface resembles surfaces that we more and more often find in noise-sensitive areas. However, this does not exclude that a rougher textured surface is also needed, in order to represent the type of surface used on many high-volume and high-speed highways and motorways where safety and durability are crucial; see below. Thus, there is not really a need to replace the existing 10844 surface; its specifications shall just be tightened and use the state-of-the-art in measuring methods, such as for sound absorption and texture. The major problem of any test track surface is almost impossible to solve: any test track surface of a type resembling ISO 10844 will hardly ever excite as much high- and medium-frequency noise as the same surface on a trafficked road will do after exposure to normal (heavy) traffic for 1-2 years. This is probably due to a combination of polishing and compaction that is hard to simulate on a test track. 16.2 Correlations between measured levels on an ISO surface
with levels on common road surfaces
TRL Ltd has studied the relation between noise levels measured on ISO surfaces and noise levels measured on a number of other surfaces [Abbott & Watts, 2003]. Twenty-nine passenger car tyres, four van tyres and eleven truck tyres together with seven road surfaces were selected for the study. These surfaces included the ISO 10844 reference surface as well as those that might typically be found on high-speed roads. Fig. 59 shows the results for the classification of passenger car tyres (PC-XX) compared to classification of the same tyres on an HRA (hot rolled asphalt) surface. Table 8 lists the correlation coefficients for CPX noise levels on the ISO surface and on SMA surfaces with all other surfaces, as tested at 80 km/h. The authors of the TRL study concluded that: • The study has examined the performance of the standard ISO test surface in relation
to other road surfaces. The data shows clearly that the rank ordering of passenger car tyres operated on the standard type approval surface is different from most other surfaces studied. Clearly, coast-by noise levels on the ISO 10844 surface are not necessarily good predictors of coast-by noise levels on other surfaces. In contrast, noise levels generated in close proximity to the SMA surface are significantly corre-lated with levels measured on all other surfaces tested except the ISO surface.
• The use of a surface such as SMA, or similar, which is in widespread use should be considered for inclusion as a standard test surface in future revisions of the tyre noise directive and for the vehicle noise regulation UN-ECE R51.02. From the data collected in this study such a surface is more representative in terms of noise generation properties.

FEHRL Report Final Report SI2.408210 Tyre/Road Noise – Volume 2 99
FEHRL
Fig. 59. Comparison of coast-by noise levels at 80 km/h on ISO and HRA surfaces for 23 car tyre sets [Abbott & Watts, 2003]. Table 8. Correlation coefficients for CPX noise levels on the ISO surface and SMA surfaces with all other surfaces tested at 80 km/h [Abbott & Watts, 2003].
Correlation (r) between noise levels on surfaces Road or test track surface With ISO surface With SMA surface
ISO 10844 -- 0.38 MARS-6 (semi-porous) 0.91** 0.52* Colsoft (thin layer with some rubber) 0.70** 0.76** Brushed concrete 0.50 0.84** MARS-14 (semi-porous) 0.41 0.86** SMA (stone mastic asphalt) 0.38 -- HRA (hot rolled asphalt) -0.07 0.85**
*significant at 1% level, ** significant at 0.1% level. The study by M+P mentioned earlier [Roovers, 2003], included also a study of the relation between noise levels measured on the ISO surface and the same type of measurements on a double-layer porous asphalt concrete (DPAC)19, for the 23 car tyres included in the study. The results are shown in Fig. 60. The difference between the most noisy and least noisy tyre on the ISO asphalt was found to be 4.4 dB(A); on the DPAC this difference was 2.9 dB(A); measured with the coast-by method specified in the Directive 2001/43/EC. 19 Unfortunately, there are no more details regarding the DPAC, such as the chipping sizes and thickness
FEHRL Report. 100 Final Report SI2.408210 Tyre/Road Noise – Volume 2
FEHRL
Fig. 60. Coast-by noise level at a speed of 80 km/h on an ISO asphalt surface versus corresponding level on the double-layer porous asphalt surface. The dotted line repre-sents a 1.00 slope of a line through the measuring points, which is drawn to illustrate the deviation of the measured data from an ideal 1.00 slope. The noise emission of a couple of the noisier tyres on the ISO surface seems to be reduced substantially on the DPAC. This is probably not by chance; it is probably due to either an unusually high air pumping contribution on the smooth and dense ISO surface which is effectively reduced by the porous surface, or by a perfect fit between the peak in the frequency spectra of these tyres on the ISO surface and the frequency of maximum sound absorption of the DPAC. It illustrates that different generation and propagation mechanisms on different surfaces may more or less favour certain tyres. A somewhat similar and partly related study was made by SINTEF in Norway [Berge et al, 2005]. As part of a larger study they compared the noise ranking of their 20 tested tyres on an ISO surface with the ranking on the other tested surfaces. They found that the quietest and the noisiest tyres were ranked in the same way on most of the surfaces, but for tyres in the medium range the ranking changed substantially depending on surface type. Examples of correlations obtained are shown in Figs. 61-62. One may conclude from the study by SINTEF that the ISO surface is not representative of what happens with tyre noise on an SMA surface with medium or large chippings; i.e. the type of surface that dominates in the Nordic countries and some other European countries. However, the correlation with a porous surface seems to be good. It was concluded that reductions of tyre noise limits on an ISO surface will not necessarily give the same benefit on the rougher surfaces included in this investigation.

FEHRL Report Final Report SI2.408210 Tyre/Road Noise – Volume 2 101
FEHRL
Fig. 61. Correlation between levels on ISO 10844 and SMA 0/11 [Berge et al, 2005].
Fig. 62. Correlation between tyre ranking on an ISO 10844 surface and a double-layer porous asphalt, designated "2LPA" [Berge et al, 2005]. In Austria, it was found that the ranking of tyres at large was preserved when comparing ranking based on measurements on an ISO surface with rankings based on measurements on common Austrian road surfaces [Haider et al, 2004]. Reversals in ranking occurred for tyres with rather similar sound levels, but this is natural, and it in fact occurred also when comparing results on different ISO surfaces.

FEHRL Report. 102 Final Report SI2.408210 Tyre/Road Noise – Volume 2
FEHRL
TRL Limited made new measurements of the noise levels on an ISO surface and an SMA surface recently [Watts et al, 2005]. These results, see Fig. 63, indicated an improved correlation when the SMA surface had smaller chippings. The tested SMA 0/10 surface in the latest experiment had chippings which are only a little larger than those of an ISO surface.
y = 0.21x + 63.6R2 = 0.10
y = 0.72x + 23.7R2 = 0.72
75
76
77
78
79
80
81
72 73 74 75 76 77 78
Maximum noise level on ISO surface, dB(A)
Max
imum
noi
se le
vel o
n SM
A, d
B(A
)
2001 TRL data - 14mm SMA 2005 TRL data - 10mm SMA
Fig. 63. Correlation between tyre noise level on an ISO 10844 surface versus two SMA surfaces. Measurements in 2001 were made on an SMA 0/14 (upper data set) but in 2005 on an SMA 0/10 (lower data set) [Watts et al, 2005]. The upper data set is the same as that used in Fig. 59. In a Dutch study to predict the influence on road traffic noise of two tyre noise regulation scenarios, the choice of reference surface was discussed [van Blokland et al, 1996]. It was found that the spread in noise levels between tyres in a certain test tyre sample varied as shown in Table 9. The same situation applies to both light and heavy vehicle tyres. For example, the standard deviation was found to be about 1.5 dB(A) for car tyres (of similar widths) on an ISO surface, 1.8 dB(A) for truck rib-patterned tyres and 2.3 dB(A) for truck block-patterned tyres. This information must be utilized when one attempts to calculate the effect on Leq levels of traffic noise when reducing tyre noise based on measurements on ISO surfaces. The range is compressed on other surfaces than ISO and similar smooth-textured ones. This was also made in the Dutch study (see further Chapter 4).

FEHRL Report Final Report SI2.408210 Tyre/Road Noise – Volume 2 103
FEHRL
Table 9. The spread between tyre brands/types as it varies due to the test surface. The spread between tyres is expressed as standard deviation around the average for the tyre category. In this table the standard deviation is normalised to 1.00 for ISO surfaces and the other values show how large the deviation is on other surfaces in relation to the ISO surface. Table adapted from [van Blokland et al, 1996]. Surface type Relative standard deviation
between tyres [dB(A)] Notes
ISO and other smooth surfaces 1.00 (reference) Urban low-noise surfaces
Medium-textured surfaces 0.86 On the majority of urban roads
Coarse-textured surfaces 0.69 On most high-speed roads
Porous surfaces 0.53 16.3 The need for an additional ISO surface
Both the TRL and the SINTEF studies have demonstrated rather clearly that the ISO 10844 surface is not satisfactory for regulating noise levels from tyres on common road surfaces such as SMA and HRA surfaces with medium or large size chippings (say from 11 mm maximum chipping size). It is very inefficient for that purpose. The ISO surface has its merits for representing low noise road surfaces such as surfaces having a texture similar to that of the ISO surface and of porous surfaces (as demonstrated by both M+P and SINTEF), but it needs a supplementary surface such as an SMA with (say) maximum 14 mm chippings. 16.4 Some ongoing work
An ISO group (ISO/TC 43/SC 1/WG42tt) currently has the task to revise ISO 10844. As a background for this, a Round Robin Test (RRT) using four tyres tested on nine surfaces was conducted in 2005. When this is written the results were not yet publicly available. It is not known whether more experiments are planned to follow in 2006. An alternative or supplement test surface with the aim of a more realistic tyre excitation for tyre noise testing will be developed in a national German project started in 2004. An ISO10844 surface (AC 0/8) and a stone mastic asphalt (SMA 0/8) in parallel will be built and tested in co-operation between BASt, FAT20 and WdK21. The surfaces are under construction in Michelstadt, Germany, on an airfield which currently is used as testing ground for vehicles and tyres. Comparison tests will be carried out for passenger car and truck tyres. Results are expected to be available in 2006. 20 German Association for Research on Automobile-Technique 21 Wirtschaftsverband der deutschen Kautschukindustrie e.V.

FEHRL Report. 104 Final Report SI2.408210 Tyre/Road Noise – Volume 2
FEHRL

FEHRL Report Final Report SI2.408210 Tyre/Road Noise – Volume 2 105
FEHRL
17 Need for new or supplementary data
Figs. 15-16 provide a good illustration of where data is missing. This review has identified the following lack of data:
• Much more data on the noise emission of C2 tyres are needed. This is the most serious lack of data
• More data on the noise emission of very narrow (135 and 145 and 155 mm) car
tyres are needed
• More data on the noise emission of very wide (235 mm and higher) car tyres are needed
• The problem of super-single heavy truck tyres shall be studied further
• Determine the real effect of tyre width by systematic rather than statistical studies;
excluding the probable effect of 92/97/EC
• Try to isolate the effect of speed category from other factors and quantify the possible influence by this parameter

FEHRL Report. 106 Final Report SI2.408210 Tyre/Road Noise – Volume 2
FEHRL

FEHRL Report Final Report SI2.408210 Tyre/Road Noise – Volume 2 107
FEHRL
18 Conclusions
The following is a compilation of conclusions from the individual chapters. Noise emissions from road traffic sources have been reduced only to a small extent and only for power unit noise, whereas no improvements are seen for tyre/road noise over the latest decades. The almost desperate needs for substantial noise reductions in society sometimes expressed by governments have no chance to come true unless more efficient tyre/road noise reductions take place. From the present situation one can conclude that already today there are much stricter car tyre noise limits indirectly imposed by Directive 92/97/EEC than that of Directive 2001/43/EC; especially for OE tyres wider than 150-170 mm. In fact, it seems that Directive 2001/43/EC more or less can be neglected in comparison to 92/97/EC, the latter of which has been in force already for almost a decade. Thus, it seems that there is immediately a technical potential for reducing the tyre noise limit values to a performance corresponding to that which OE tyres on new vehicles during type approval have to meet. This technical potential is substantial, amounting to 2 -7 dB(A) depending on tyre width (near the lower end of the range at narrow widths and near the higher end at larger widths) and what the actual tyre/road noise targets are for OE tyres related to 92/97/EC testing. The different studies reviewed in this report are quite consistent in their results, wherever the results are comparable, with regard to noise levels of existing tyres and the possible conflicts with safety and rolling resistance. Identified lacks of data include data for tyres for vans and small trucks (C2 tyres) and also for very wide tyres. The range between the noisiest and the quietest car tyres; including all tested widths, is about 10 dB(A) on an ISO surface, provided that one includes a few hundred tyres in the analysis. If one looks only at a single dimension or exchangeable dimensions (section width), the range is approximately 6-8 dB. For truck tyres, the range is about 10 dB(A) between the noisiest and the quietest tyres. This suggests that even with current tyre technology there is a great potential for noise reduction simply by selection of appropriate tyres. The average car tyre within each width class has a margin to the limit of 4-6 dB(A); relatively very few tyres are closer to the limit than 2 dB(A). The quietest tyres are 8-9 dB(A) below the limit. For truck tyres the margin from the average tyre to the limit is approximately 6 dB; very few tyres are closer to the limit than 2 dB(A). The quietest truck tyres are 9-10 dB(A) below the limit. The noise emission of retreaded tyres is similar to that of new tyres, except for the heavy vehicle tyres, for which the tested retreaded tyres were 2-4 dB(A) noisier than new tyres. However, this is not considered to be a general disadvantage of the retreading tech-nology; it is rather due to a poor selection of (probably) unmodern tread moulds for these tyres. There is a big difference in the width influence on noise measured on tyres from the 1980's (which probably were designed in the 1970's), through tyres of the late 1980's and early 1990's until the tyres measured around year 2000. The width influence was originally

FEHRL Report. 108 Final Report SI2.408210 Tyre/Road Noise – Volume 2
FEHRL
very prominent but has diminished to become insignificant in recent years; with a few exceptions: for very narrow tyres, for very wide tyres and when testing on other surfaces than the ISO surface. Within the width range of the majority of cars, width does not appear to be a significant parameter for noise any more. It is only when tyres become exceptionally wide that noise appears to increase substantially. For truck tyres, it still seems justified to distinguish between the normal and snow classes. With regard to possible conflicts in the requirements for noise, safety and rolling resistance, the following conclusions are drawn: • Although several design properties of tyres seem to be in conflict when designing for
noise reduction by conventional pattern and rubber changes, no significant conflicts have been detected on market tyres in practice.
• None of the reviewed studies could detect a significant conflict between requirements for low noise and wet road braking or aquaplaning performance. One of them, based on a very small sample seemed to indicate such a conflict but when studying the data from another perspective it turned out that the assumed conflict could be explained by a tyre width influence.
• None of the reviewed studies could detect a significant conflict between requirements for low noise and low rolling resistance.
• It follows that the limits with regard to skid resistance and rolling resistance which are planned for introduction within the near future cannot be justified from the point of view of noise; i.e., there is no reason to expect that the noise limits will mean that tyres with inferior performance concerning skid and rolling resistance will come into the market. Nevertheless, there may of course be other reasons for such limits, but this is not the subject of this report.
• Several low noise tyres that also meet high standards in other respects than noise, such as safety and rolling resistance, are available.
• The key point according to the industry is advanced technology: advanced technology will provide better performance for multiple parameters simultaneously. It will widen the area of the polar diagram of Fig. 26, not just pull out one of the items.
Unfortunately, it seems that fashion and styling concepts such as plus-sizing largely influence the tyre market as well as tyre design nowadays. Since it seems that fashion (in visual appearance of tyres) is in some conflict with low noise design principles, there should logically be a potential for better acoustical characteristics of tyres if visual appearance would not have an influence on tread pattern design. Plus-sizing is also in conflict with low noise characteristics, as it is with safety and economy. One way to counteract the plus-sizing trend is to make noise limits independent of tyre width (possibly with exception of extremely wide tyres). The tyre industry seems to accept that 1-2 dB(A) lower noise levels can be achieved with today's technology, but a technological break-through is required if they have to manage a noise reduction of more than 3 dB(A) for all the tyre categories. Independent research organizations estimate the potential for tyre noise reduction by measures on the tyres using existing technology as 4-6 dB(A). In the long term perspective (perhaps a decade), there are a number of promising concepts for low noise tyres or tyre/wheel units using new technology. Some of them may provide a breakthrough which will give substantially lower tyre/road noise in the future.

FEHRL Report Final Report SI2.408210 Tyre/Road Noise – Volume 2 109
FEHRL
There is one formal proposal for lower tyre noise limits, namely from the German Federal Environmental Agency (UBA). The proposal is summarized as follows: • Proposed reductions versus the limit values of the Directive amount to 1 to 5 dB(A)
for passenger car tyres and 5 to 6 dB(A) for tyres for commercial vehicles. • Furthermore, the UBA is proposing that ambitious limit values for rolling resistance
should be introduced as soon as possible. • For the sake of better consumer information, all tyres should be labelled with the type-
approval values for tyre-rolling noise and rolling resistance. • Retreaded tyres should be included in the scope of the Directive, at least for
commercial vehicle tyres because of their remarkable share of about 50% on the market.
A proposal from TRL Limited put forward in a recent report outlines new limits in a couple of steps that finally arrives at approximately the same levels as the UBA proposal for car tyres. Due to developments in road surface construction and use, the ISO 10844 surface can nowadays be considered as reasonably appropriate for testing of tyre/road noise according to the Directive 2001/43/EC, representing surfaces used on low- or medium-speed streets in urban areas, especially if they are optimized for low noise. The ISO surface generally gives a somewhat lower noise level than most surfaces subject to normal traffic. However, it has been consistently demonstrated that the ISO surface does not represent the ranking of tyres on more rough-textured surfaces such as exist on some urban streets and most high-speed highways. The present smooth ISO surface is suitable for optimizing tread patterns but less suitable for determining appropriate measures related to vibration excitations from road textures. In general, low-speed roads tend to have lower textures where tread patterns are important while high-speed roads tend to have rougher textures. Consequently, it is very important that a second ISO surface is specified which has a significantly rougher texture than the present one. Otherwise, tyres will be sub-optimized only for low- or medium-speed streets in urban areas.

FEHRL Report. 110 Final Report SI2.408210 Tyre/Road Noise – Volume 2
FEHRL
FEHRL Report Final Report SI2.408210 Tyre/Road Noise – Volume 2 111
FEHRL
19 Recommendations
This report clearly shows that there is a technical potential which is considerably higher than the reduction of limits considered in the further steps foreseen in the Directive 2001/43/EC. Already the Directive 92/97/EC, which has been in force for almost 10 years, puts much stricter noise requirements on car OE tyres than the 2001/43/EC. Except for very few tyres, all tyres tested in studies reviewed here already meet the limits of 2001/43/EC even after the last steps foreseen in the Directive. Therefore, it is recommended to lower the limiting values as soon as is possible from an administrative point of view. Nothing in this report, except perhaps the views of tyre manufacturers, indicates that the UBA or the TRL proposals are unrealistic or unbalanced. On the contrary, both the UBA and the rather similar TRL proposals seem to well represent a balanced approach for new limit values, bearing in mind the various results of this report. Consequently, it is recommended to use the UBA and TRL proposals in all their details as a basis for the decision on future limits. It is also recommended that not only OE tyres but also replacement and retreaded tyres shall meet such noise limits. It is recommended that the existing ISO 10844 surface is supplemented with one that is much more rough-textured and which can represent road surfaces on high-speed roads and some urban streets that use rough-textured surfaces.

FEHRL Report. 112 Final Report SI2.408210 Tyre/Road Noise – Volume 2
FEHRL

FEHRL Report Final Report SI2.408210 Tyre/Road Noise – Volume 2 113
FEHRL
20 Acknowledgements
The author has been very extensively supported in the compilation of data for this report by Dr Glaeser and Mr Alteköster of the German Federal Highway Research Institute (BASt). Special thanks go to these for all the data compiled and supplied from the impressive German research projects. Substantial support with documents have also been obtained from Dr Stenschke of the German Federal Environment Agency (UBA), the TRL Ltd in the U.K. (Mr Ainge, Dr Watts and others), Continental Tyres in Hanover (Dr Saemann), TÛV Nord in Germany (Mr Steven), M+P raadgevende ingenieurs b.v. in the Netherlands (Mr Roovers, Mr de Graaff), The Technical University of Gdansk in Poland (Dr Ejsmont) and SINTEF in Norway (Mr Berge). Valuable comments have been received from Mr Olle Nordstrom (retired from VTI), Dr Glaeser from BASt, and from Dr Watts of TRL Ltd who have reviewed the report. Finally, the author wishes to acknowledge the contributions by ETRTO in terms of making available to the project group new and unpublished data, much of which is shown or mentioned in this report. The author is grateful to all these individuals, companies and organizations.

FEHRL Report. 114 Final Report SI2.408210 Tyre/Road Noise – Volume 2
FEHRL

FEHRL Report Final Report SI2.408210 Tyre/Road Noise – Volume 2 115
FEHRL
21 References
Abbott, P.; Watts, G. (2003): "The Influence of Tyre Design on Rolling noise". Proc. of Inter-Noise 2003, Seogwipo, Korea, August 25-28, 2003.
Aimon, Dominique (2005): "Are safety and long wearlife compatible with fuel efficient tires ?" Presentation at the IEA workshop on "Energy Efficient Tyres: Improving the On-Road Performance of Motor Vehicles", 15 Nov. 2005, Paris, France. The presentation is possible to download from the website http://www.iea.org
Alteköster, Carsten (2005): “Correlation Between Rolling Noise and Wet Grip of Automo-bile Tyres”. Report F3a – kf NASSGR – 315/05, April 2005, BASt, Bergisch-Gladbach, Germany.
Amerityre (2005): "Amerityre Accomplishes Major Technology Breakthrough - Non-pneu-matic Polyurethane Tire Passes FMVSS 129 Testing". Published on the Amerityre web-page: http://www.amerityre.com/index2.cfm?group=investor&function=pr&dt=20050425
Anon. (1995): “Noise Level Limits for Tyre/Road Noise as Measured with the Measuring Procedure Proposed by ERGA-Noise - Proposal from the Nordic Countries. Letter to the Commission, 30 March 1995.
Anon. (2004): ”Merkblatt Lärmarme Reifen”. Österreichischer Arbeitsring für Lärm-bekämpfung, Vienna, Austria. Anon. (2004): "Kurzfassung: Definition und Erarbeitung eines Systems zur Förderung lärmarmer KFZ-Reifen, Variante 2, bezogen auf Österreichische Fahrbahndecken und lärmmindernde Fahrbahndecken auf dem letzten Stand der Technologie". Endbericht Proj. Nr. FFF 806231-SP/TU, Proj.Nr. Arsenal: 2.05.00127.1.0, Arsenal, Vienna, Österrike.
Beckenbauer, T.; Müller, D. (2003): “Geräuschemission runderneuerten Lkw-Reifen (Noise emission of retreaded truck tyres)”. Report 54 779/7 bec, 19 September 2003, Müller-BBM, Planegg (München), Germany. (In German). Berge, Truls; Storeheier, S.Å.; Ustad, Asbjørn (2005): "Measurements of tyre/road noise from passenger car tyres according to the EU-directive 2001/43/EC, on a number of different road surfaces". SINTEF Report STF90 A05135, SINTEF IKT, Trondheim, Norway.
BLIC/BIPAVER (2005): "Retreaded Tyres – Tyre to road rolling sound emissions". Informal document No. GRB-42-7, 42nd GRB, 5 – 7 September 2005, ECE/WP29/GRB, Geneva.
BMV, 1997: "Vorschläge zur Ergänzung der Richtlinie 92/23/EEC um Reifen/Fahrbahn-Geräusche". NALS A 5 AK 3 Nr 06-97, Paper prepared by WDK for the DIN, proposed by the Ministry of Transport (BMV) to the ECE/WP29/GRB in 1997, Bonn, Germany. Chair R51 (2005): ”Information paper about sound level limits”. Informal document GRB-42-2 to the 42nd session of GRB, ECE, Geneva, transmitted by the Chairman of Informal Group on Regulation No. 51. CLEPA (2005): ”Comparison of noise test results according to ECE R-51.02 and R-51.03”. Informal document GRB-42-6 to the 42nd session of GRB, ECE, Geneva, transmitted by CLEPA.
Commission (1997): "European Parliament and Council Directive of amending Council Directive 92/23/EC relating to tyres for motor vehicles and their trailers and to their fitting". Document COM(97) 680, 1997-12-10, EU Commission, Brussels.

FEHRL Report. 116 Final Report SI2.408210 Tyre/Road Noise – Volume 2
FEHRL
Commission (2002): "Declaration by the Commission in the Conciliation Committee on the Directive relating to the assessment and management of environmental noise". Official Journal L 189/26, 18.7.2002.
Commission (2004): "REPORT FROM THE COMMISSION TO THE EUROPEAN PARLIAMENT AND THE COUNCIL concerning existing Community measures relating to sources of environmental noise, pursuant to article 10.1 of Directive 2002/49/EC relating to the assessment and management of environmental noise". Document COM(2004) 160 Final, 2004-03-10, EU Commission, Brussels.
Commission (2006): "CARS 21 - A Competitive Automotive Regulatory System for the 21st century – Final Report". Document from the EU Commission, Enterprise and Industry, Brussels. de Roo, Foort (2005): " Reduction of rolling noise - Tyre design strategies". PowerPoint presentation by Mr de Roo of TNO, Delft, the Netherlands, at conference "Intelligent Tire Technology", November 29-30, 2005, Steigenberger Airport Hotel, Frankfurt, Germany. Duleep, K.G. (2005): "Tyres, technology, and energy consumption". Presentation from K. G. Duleep, Energy & Environmental Analysis, Inc., USA at the IEA workshop on "Energy Efficient Tyres: Improving the On-Road Performance of Motor Vehicles", 15 Nov. 2005, Paris, France. The presentation is possible to download from the website http://www.iea.org/Textbase/work/workshopdetail.asp?WS_ID=227
Ejsmont, Jerzy; Ronowski, Grzegorz (2005): ”The contribution of tire/road noise to the overall noise of cars and motircycles”. Tire Technology International 2005 (Annual Review), pp 56-59.
Engehausen, R.; Sumner, A. J. M.; Trimbach, J. (2001): “Polymer Developments to Improve Tyre Life and Fuel Economy”. Paper by Bayer AG, KA-F+E/BR, D-51568 Leverkusen, Germany, presented at the International Rubber Conference 2001.
ERF (2006): "The Socio-Economic Benefits of Roads in Europe". The European Road Federation (ERF), Brussels, Belgium (March 2006).
Fallast, Kurt; Strohmayer, Doris (2004): "Maßnahmen zur Steigerung des Ausrüstungs-grades von Kfz mit lärmarmen Reifen". PowerPoint presentation from Institut für Straßen- und Verkehrswesen, Technische Universität Graz, Graz, Austria.
Haakonsen, Gisle; Engelien, Erik; Steinnes, Margrete (2005): ”Støyplage i Norge 1999-2003 - Veitrafikken årsak til økt støyplage (Noise nuisance in Norway 1999-2003 – Road traffic the cause of increased noise nuisance)”. Article 2005-08-25-01, published by Statistics Norway at http://www.ssb.no/vis/magasinet/miljo/art-2005-08-25-01.html
Haider, Manfred; Fallast, Kurt; Strohmayer, Gerhard (2004): "Definition und Erarbeit-ung eines Systems zur Förderung lärmarmer KFZ-Reifen, Variante 2, bezogen auf Österreichische Fahrbahndecken und lärmmindernde Fahrbahndecken auf dem letzten Stand der Technologie". Endbericht Proj. Nr. FFF 806231-SP/TU, Proj.Nr. Arsenal: 2.05.00127.1.0, Arsenal, Vienna, Austria.
Harrison, Matthew (2004) : "Vehicle Refinement – Controlling Noise and Vibration in Road Vehicles". Elsevier, ISBN 0 7506 6129 1. IPG (2005): "IPG-lijst Stille Personenwagenbanden" and "IPG-lijst Stille Bestel- en vrachtwagenwagenbanden". Two pdf files for download on the Dutch IPG website http://www.innovatieprogrammageluid.nl/navigatie.html
FEHRL Report Final Report SI2.408210 Tyre/Road Noise – Volume 2 117
FEHRL
Köllman, Andreas (1993): "Ermittlung des Standes der Technik hinsichtlich der Geräuschemission von PKW-Reifen". Research Report 105 05 144, FIGE GmbH, Herzogenrath, Germany.
Marduel, J.L. (1995): "Report on sound level tests related to the definition of limits for tyre/road noise”. ERGA-Noise Document Nr. 44, EC DG III, Brussels, January 1995.
Miyabe, Subaru (2005): "Modern passenger car tires in view of technology and design". Presentation at the Tire Technology Expo 2005, Cologne, Germany.
Nelson, P. M.; Harris, G. J.; Robinson, B. J. (1993): "An examination of the relationship between tyre noise and safety performance." Project Report PR047/93, Transport Research Laboratory. Crowthorne, England. Also: ERGA-Noise document No. 39.
Nielsen, H.L.; Rehula, M.; Svendsen, R.H.; Hedberg, S. (1995): "Noise Level Limits for Tyre/Road Noise as Measured with the Measuring Procedure Proposed by ERGA-Noise - Proposal from the Nordic Countries". Document dated 30 March 1995, sent to the Commission from the four Nordic countries Denmark, Finland, Norway and Sweden. ÖAL 35 (2004): "Lärmarme Reifen". ÖAL-Richtlinie 35 Juni 2004, Österreichischer Arbeitsring für Lärmbekämpfung, in cooperation with Bundesministeriums für Land- und Forstwirtschaft, Umwelt und Wasserwirtschaft, Vienna, Austria.
Penant, C. (2005): "The Challenge of Energy Efficient Tyres". Presentation from Michelin at the IEA workshop on "Energy Efficient Tyres: Improving the On-Road Performance of Motor Vehicles", 15 Nov. 2005, Paris, France. The presentation is possible to download from http://www.iea.org/Textbase/work/workshopdetail.asp?WS_ID=227 Phillips, S. M. (1996): Assessment of the proposed European tyre noise type approval method. Project Report PR/SE/228/96, TRL Limited, Crowthorne, England.
Phillips, S.; Abbott, P. (2001): "Factors affecting Statistical Pass-by measurements". Proc. of Inter-Noise 2001, The Hague, The Netherlands. Phillips, S; Kollamthodi, S.; Nelson, P. M. (2001): "Investigations of Tyre/Road Noise". Project Report PR/SE/272/2001, TRL Limited, Crowthorne, England.
Phillips, S; Kollamthodi, S.; Nelson, P. M.; Abbott, P. G. (2003): “Study of Medium and High Speed Tyre/Road Noise”. Project Report PR/SE/849/03, TRL Limited, Crowthorne, England.
Power and Associates (2003): "JD Power and Associates 2003 Germany Original Equipment Tyre Customer Satisfaction Index Study". J D Powers and Associates, http://www.jdpa.com/studies/
Redmann, S.; Bartolomaeus, W.; Krotmann, E. (2002): "Untersuchung der Eigen-schaften von Erstausrüsterreifen und Reifen aus dem Nachrüstmarkt". Report AP-Nr. 02 530/F3 (Dec. 2002), BASt, Bergisch-Gladbach, Germany.
Reinink, H.F.; de Graaff, D.F.; Peeters, A.A.A.; Peeters, H.M. (2005): "Tyre/road noise measurements of truck tyres". Report No. M+P.DWW.03.7.1 (5 February 2005), M+P Raadgevende ingenieurs bv, P.O. Box 2094, NL-5260 CB Vught, The Netherlands.
Reithmaier, W.; Kretschmer, S.; Savic, B. (2002): "Ermittlung von Rollgeräusch- und Rollwiderstandsbeiwerten sowie Durchführung von Nassbremsversuchen mit Nutzfahr-zeugreifen (Determination of rolling noise and rolling-resistance coefficients and conduct of wet surface brake tests on utility-vehicle tires)“. UBA-Forschungsbericht 299 54 114, 2002, Umweltbundesamt, Berlin, Germany (Final report of research project No. 299 54 114 under contract to the Federal Environmental Agency (FEA)).

FEHRL Report. 118 Final Report SI2.408210 Tyre/Road Noise – Volume 2
FEHRL
Reithmaier, Walter; Salzinger, Thomas (2002): "Determination of the state-of-the-art concerning rolling noise, rolling-resistance and safety properties of modern passenger car tyres". Research report 201 54 112, TÜV Automotive GmbH, Tire-/Wheel-Test-Center, Munich, Germany. Volume 1 is the main report, whereas Volume 2 contains tables and diagrams. Also: Final report of research project No. 201 54 112 under contract to the Federal Environmental Agency (FEA).
Roovers, M. S. (2003): "Tyre/road noise measurements for passenger cars according to EU directive 2001/43". M+P Memo 16 January 2003, M+P Noise and Vibration Consultants, the Netherlands.
RWTÜV (2002): “Ermittlung des weiteren Lärmminderungspotentials bei Kraftfahrzeugen”. Final Report from RWTÜV Fahrzeug GmbH, Institut für Fahrzeugtechnik, Ginsterweg 5, D-52146 Würselen, Germany.
Saemann, E.-U.; Liederer, W.; Schmidt, H.; Fornefeld, W. (2001): “Tire/road noise – causes, influences, potential for improvements and target conflicts”. Presentation by Continental Tyres in Hanover, Germany, at Workshop "Further Noise Reduction for Motorised Road Vehicles", organized by Umweltbundesamt, 17-18 September 2001 in Berlin, Germany.
Saemann, E.-U. (2005-1): “Reducing tire/road rolling noise”. PowerPoint presentation by Dr Saemann of NVH Engineering, Continental Tyres, Hanover, Germany, at conference Intelligent Tire Technology, November 29-30, 2005, Steigenberger Airport Hotel, Frankfurt, Germany. Saemann, E.-U. (2005-2): Personal communication with Dr E-U Saemann of NVH Engineering, Continental Tyres, Hanover, Germany.
Sandberg, Ulf (1991): "Survey of noise emission from truck tires". Proc. of Inter-Noise 91, Sydney, Australia.
Sandberg, Ulf; Ejsmont, Jerzy A. (2000): "Noise emission, friction and rolling resistance of car tires - Summary of an experimental study". Proc. of NOISE-CON 2000, Newport Beach, California, USA. Sandberg, Ulf (2001): "The Effect of Regulations on Road Vehicle Noise - Final report by the I-INCE Working Party on Noise Emissions of Road Vehicles". Noise/News International, Vol 9, No 3, September 2001, pp 147-206. Also available for download on the website of the UN/ECE/WP29/GRB at (click on "GRB" and "Informal documents” – “36th session"): http://www.unece.org/trans/main/welcwp29.htm
Sandberg, U.; Ejsmont, J.A. (2002): "Tyre/Road Noise Reference Book". Informex, Harg, SE-59040 Kisa, Sweden (www.informex.info)
Sandberg, Ulf (2003): "The road to quieter tires". Article in Tire Technology International '03, Annual Review 2003, UKIP Media & Events, Dorking, Surrey, U.K.
Sandberg, U.; Ejsmont, J. A.; Kropp, W. and Larsson, K. (2003): "Low noise tires – A cooperation project in northern Europe", Paper N494, Proc. of Inter-Noise 2003, Seogwipo, Korea.
Sandberg, Ulf (2005): "Ekonomiska styr- och stimulansmedel i riktning mot lägre buller-emission från bildäck (Encouraging an increased use of low-noise tyres by means of economic stimulation)". Project Report 2005-04-20, Swedish National Road and Transport Research Institute, Linköping, Sweden.

FEHRL Report Final Report SI2.408210 Tyre/Road Noise – Volume 2 119
FEHRL
Sandberg, Ulf; Kalman, Björn; Williams A. Roger (2005): "The Porous Tread Tire – The Quietest Pneumatic Tire Measured So Far?". Proc. of Inter-Noise 2005, Rio de Janeiro, Brazil.
Schubert, J. (2003): “Experimentelle und theoretische Untersuchungen zum Reifen/-Fahrbahn-Rollgeräusch“. PhD Dissertation, Faculty for Maschinenwesen, Technical University of Dresden, Germany.
SILVIA (2005-1): “Recommendations on specifications for tyre and vehicle requirements”. SILVIA project report SILVIA-TUW-039-02-WP5-120304, Technical University of Vienna, Austria.
SILVIA (2005-2): "Guidance Manual on the Utilisation of Low-Noise Road Surfacings”. Document SILVIA-TRL-012-06-WP6-141005. Published by the Forum of European National Highway Research Laboratories (FEHRL), Brussels, Belgium.
SRA (2001): “National Environmental Programme 2002 – 2005 of the Swedish National Road Administration”. Publ No. 2001:57, Swedish Road Administration, Borlänge, Sweden.
SRA (2005): “Vägtransportsektorn 2004 - Sektorsredovisning”. Report to the Swedish Government 2005-03-15, Swedish Road Administration, Borlänge, Sweden.
Stenschke, Reiner; Jäcker-Cüppers, Michael (1999): “Reduction of Road Traffic Noise - The Legislature's Point of View”. Presentation at the Forum Acusticum Congress 1999, Berlin, Germany. Document produced by the Federal Environmental Agency (UBA), Bismarckplatz 1, 14193 Berlin, Germany. Stenschke, R.; Vietzke, P. (2000): "Noise and use characteristics of modern car tyres (State of the art)". Paper for the 7th International Congress on Sound and Vibration, 4-7 July 2000, Garmisch-Partenkirchen, Germany. Stenschke, R.; Vietzke, P. (2001): "Tyre/Road Noise Emissions, Rolling Resistance and Wet Braking Behaviour of Modern Tyres for Heavy-Duty Vehicles (State of the Art)". Proc. of Inter-Noise 2001, the Hague, the Netherlands.
Stenschke, Reiner; Rauterberg-Wulff, Annette (2004): “Umwelteigenschaften von Reifen – Stand der Gesetzgebung”. Umweltbundesamt, Berlin, Germany.
Stenschke, Reiner; Vietzke, P. (2005): “Tire/road noise emission and rolling resistance of tires – status of legislation”. Article in Tire Technology International 2005 (Annual Review), pp 36-39.
Stenschke, Reiner (2005): “Tire/road noise emission and rolling resistance of tires – status of legislation”. PowerPoint presentation by Dr Stenschke of Umweltbundesamt, Berlin, Germany, at conference Intelligent Tire Technology, November 29-30, 2005, Steigenberger Airport Hotel, Frankfurt, Germany.
Steven, Heinz (1993): Personal communication with Mr H. Steven, FIGE GmbH Kaiserstrasse 100, 5120 Herzogenrath, Germany, incl data "Anhang A" from unknown report about tyre noise measurements.
Steven, Heinz (2002): "Ermittlung des weiteren Lärmminderungspotentials bei Kraftfahrzeugen - Forschungsvorhaben 205 05 809 - Entwurf des Abschlussberichts". RWTÜV Fahrzeug GmbH, Institut für Fahrzeugtechnik, Würselen, Germany (in German).
Steven, Heinz (2004): "Noise Emission of Road Transport". Presentation at Conference "Noise Research Strategies for a Quieter Europe", Brussels 19 October 2004, CALM Network, http://www.calm-network.com .

FEHRL Report. 120 Final Report SI2.408210 Tyre/Road Noise – Volume 2
FEHRL
Storeheier, S.Å.; Sandberg, Ulf (1990): "Vehicle Related Parameters Affecting Tyre/Road Noise". Proceedings of the International Tire/Road Noise Conference 8-10 August 1990 Gothenburg, STU-information No. 794-1990, NUTEK, Stockholm (available from Prof Sandberg). van der Toorn, J.D.; Gerretsen, E. (2000): “Some comments on a proposed EU Road Vehicle Tyre Noise Directive”. TNO report HAG-RPT-000092, TNO-TPD, Delft, the Netherlands. TÜV (2004): “Pkw Reifen-Test der TÜV Automotive GMBH”. Tables with measurement results from Reifen/Räder-Test-Center, TÜV Automotive GMBH, Munich, Germany.
van Blokland, G.J.; de Graaff, D.F.; Reinink, F. (1996): "Effect of tyre noise limits on traffic noise". Proc. of Inter-Noise 96, Liverpool, U.K. Volpi, N.; Casini, D.; Poggi, A. (2003): “Monitoring of traffic noise in urban area: An Estimation of the emission and of its trend”. Proc. of Euronoise 2003, Naples, Italy.
Walter, Joe (2006): “Style over substance'”. Column in Tire Technology International, March 2006, p 10.
Watts, G.R.; Nelson, P.M.; Abbott, P.G.; Stait, R.E. and Treleven, C. (2005): "Tyre/road noise – Assessment of the existing and proposed tyre noise limits". Published project report, PPR 077, PPAD 9/107/22 SO325/VB, TRL Limited, Crowthorne, England. Williams, A. R. (2005-1): “Time to 'mind the gap'”. Editorial in Tire Technology Inter-national, June/July 2005, p 8.
Williams, A. R. (2005-2): “From a toroidal black hole to an intelligent black box”. Foreword in Tire Technology International 2005 (Annual Review), pp 7-8.
Wright, Philip; Skinner, Chris; Grimwood, Colin (2002): “The National Noise Incidence Study 2000 (England and Wales)”. Client report number 203938f, BRE Environment, Watford, U.K.
Yokohama (2005): "Yokohama AVS dB S2 - The Quiet, All-Season, Ultra-High Per-former". Specifications leaflet from Yokohama Tires, downloadable from the website http://www.yokohamatire.com/pdf/avsdb.pdf .
Documents not mentioned in the text, but which may be of interest to the reader: Reinink, H.F.; Peeters, A.A.A. (2004): “Tyre/road noise measurements of passenger car tyres according to directive 2001/43/EC”, M+P rapport M+P.SINTEF.04.1.1, 5 July 2004. The results herein are part of [Berge & Ustad, 2005]. Roovers, M.S. (2005): “IPG-lijst Stille Banden: onderbouwing eerste versie”, M+P rapport M+P.NOV.05.1.1, 20 May 2005; (in English: "IPG-list Silent Tyres: Foundation of first version"). Not many people might be able to read Dutch. Roovers, M.S. (2005): “IPG-lijst Stille Banden: Plan van Aanpak aanvullende metingen”, M+P rapport M+P.NOV.05.1.2, 9 juni 2005; (in English: "IPG-list Silent Tyres: Workplan for additional measurements"). Not many people might be able to read Dutch. Roovers, M.S. (2004), “Effecten van een marktverschuiving naar stille banden”, M+P rapport M+P.NOV.04.2.1, 14 November 2004; (in English: "Effects of a market shift towards silent tyres"). Not many people might be able to read Dutch.

FEHRL Report Final Report SI2.408210 Tyre/Road Noise – Volume 2 121
FEHRL
Turner, J. D. (2001): “Advances in Tyres and Rubber Suspension Components for the Automotive Industry”. Paper by TRL Ltd., Old Wokingham Road, Crowthorne, Berkshire RG45 6AU, U.K., presented at the International Rubber Conference 2001.

FEHRL Report. 122 Final Report SI2.408210 Tyre/Road Noise – Volume 2
FEHRL

FEHRL Report Final Report SI2.408210 Tyre/Road Noise – Volume 2 123
FEHRL
Appendix B. Results from TraNECam model

FEHRL Report 124 Final Report SI2.408210 Tyre/Road Noise – Volume 2
FEHRL

FEHRL Report Final Report SI2.408210 Tyre/Road Noise – Volume 2 125
FEHRL
B.1 Overall noise reduction following a 5 dB(A) reduction of tyre/road noise of cars
road category no of lanes ADT percent
LDVpercent
HDV road surface day evening nightLden 24 h
un-weighted
Lden 24 h weighted day evening night Lden 24 h
unweightedLden 24 h weighted
stone mastic asphalt 0/11 -1.2 -1.7 -1.7 -1.3 -1.5 58.9 57.6 51.6 57.2 60.7hot rolled asphalt -1.6 -2.2 -2.3 -1.8 -2.0 59.3 58.2 52.2 57.7 61.2stone mastic asphalt 0/6 -0.9 -1.3 -1.3 -1.0 -1.1 58.6 57.3 51.2 56.9 60.3
stone mastic asphalt 0/11 -0.7 -1.3 -1.4 -0.9 -1.1 61.0 58.8 52.6 59.1 62.1hot rolled asphalt -1.1 -1.8 -1.9 -1.2 -1.6 61.3 59.2 53.1 59.5 62.6stone mastic asphalt 0/6 -0.5 -1.0 -1.0 -0.6 -0.8 60.8 58.5 52.3 58.9 61.9
stone mastic asphalt 0/11 -1.9 -2.5 -2.5 -2.0 -2.3 59.1 58.1 52.1 57.6 61.1hot rolled asphalt -2.3 -3.0 -3.0 -2.5 -2.8 59.8 59.0 53.1 58.3 62.0stone mastic asphalt 0/6 -1.4 -1.9 -2.0 -1.6 -1.8 58.6 57.5 51.4 57.0 60.5
stone mastic asphalt 0/11 -1.2 -2.0 -2.1 -1.5 -1.8 61.0 59.1 53.0 59.2 62.4hot rolled asphalt -1.7 -2.5 -2.6 -1.9 -2.3 61.6 59.8 53.8 59.8 63.1stone mastic asphalt 0/6 -0.9 -1.6 -1.6 -1.1 -1.4 60.6 58.5 52.4 58.7 61.8
stone mastic asphalt 0/11 -1.4 -2.1 -2.7 -1.7 -2.2 71.8 70.2 64.4 70.1 73.5hot rolled asphalt -1.9 -2.6 -3.2 -2.2 -2.6 72.4 71.0 65.4 70.7 74.3stone mastic asphalt 0/6 -1.1 -1.6 -2.2 -1.3 -1.7 71.3 69.6 63.6 69.6 72.8
stone mastic asphalt 0/11 -1.0 -1.7 -2.3 -1.2 -1.7 73.5 71.2 65.1 71.6 74.6hot rolled asphalt -1.3 -2.2 -2.8 -1.6 -2.2 74.0 71.8 66.0 72.1 75.3stone mastic asphalt 0/6 -0.7 -1.3 -1.8 -0.9 -1.3 73.2 70.6 64.3 71.2 74.1
stone mastic asphalt 0/11 -2.5 -3.2 -3.5 -2.8 -3.2 72.0 70.8 66.7 70.6 74.7hot rolled asphalt -2.9 -3.6 -3.8 -3.2 -3.6 73.0 72.0 68.0 71.7 75.9stone mastic asphalt 0/6 -2.1 -2.7 -3.0 -2.3 -2.7 70.9 69.6 65.2 69.4 73.4
stone mastic asphalt 0/11 -2.0 -2.8 -3.2 -2.3 -2.8 73.3 71.4 67.1 71.7 75.5hot rolled asphalt -2.3 -3.2 -3.6 -2.7 -3.2 74.2 72.5 68.3 72.6 76.6stone mastic asphalt 0/6 -1.5 -2.3 -2.8 -1.8 -2.3 72.3 70.3 65.7 70.6 74.2
stone mastic asphalt 0/11 -2.5 -3.3 -3.3 -2.7 -3.1 68.5 67.5 61.6 67.0 70.5hot rolled asphalt -2.9 -3.6 -3.7 -3.1 -3.4 69.5 68.7 62.8 68.0 71.7stone mastic asphalt 0/6 -2.0 -2.7 -2.8 -2.3 -2.6 67.4 66.3 60.3 65.8 69.3
stone mastic asphalt 0/11 -1.9 -2.9 -3.0 -2.2 -2.6 69.9 68.2 62.1 68.1 71.4hot rolled asphalt -2.3 -3.2 -3.3 -2.5 -3.0 70.8 69.3 63.3 69.1 72.4stone mastic asphalt 0/6 -1.5 -2.4 -2.5 -1.7 -2.1 68.9 67.0 60.9 67.1 70.3
stone mastic asphalt 0/11 -2.9 -3.5 -3.6 -3.1 -3.4 70.4 69.9 63.9 69.0 72.8hot rolled asphalt -3.2 -3.8 -3.8 -3.4 -3.7 71.5 71.1 65.2 70.2 74.0stone mastic asphalt 0/6 -2.4 -3.0 -3.0 -2.6 -2.9 69.0 68.3 62.4 67.5 71.2
stone mastic asphalt 0/11 -2.4 -3.2 -3.3 -2.6 -3.0 71.5 70.3 64.3 69.9 73.4hot rolled asphalt -2.7 -3.5 -3.6 -2.9 -3.3 72.5 71.4 65.5 70.9 74.5stone mastic asphalt 0/6 -1.9 -2.7 -2.8 -2.2 -2.5 70.1 68.8 62.8 68.4 71.9
stone mastic asphalt 0/11 -1.7 -2.5 -2.0 -1.9 -2.0 79.6 78.1 72.5 77.9 81.4hot rolled asphalt -1.9 -2.7 -2.3 -2.1 -2.3 80.6 79.1 73.5 78.9 82.4stone mastic asphalt 0/6 -1.4 -2.0 -1.6 -1.5 -1.6 78.0 76.5 70.9 76.3 79.8
stone mastic asphalt 0/11 -1.1 -1.9 -1.4 -1.3 -1.5 81.0 79.0 73.7 79.2 82.6hot rolled asphalt -1.3 -2.2 -1.7 -1.5 -1.7 81.9 79.9 74.7 80.2 83.6stone mastic asphalt 0/6 -0.9 -1.6 -1.2 -1.0 -1.2 79.4 77.4 72.1 77.6 81.0
stone mastic asphalt 0/11 -1.8 -2.6 -2.2 -2.0 -2.2 79.9 78.7 72.9 78.3 81.9hot rolled asphalt -2.1 -2.9 -2.4 -2.3 -2.4 80.9 79.7 73.9 79.3 82.9stone mastic asphalt 0/6 -1.5 -2.1 -1.7 -1.6 -1.8 78.3 77.1 71.3 76.7 80.3
stone mastic asphalt 0/11 -1.3 -2.1 -1.6 -1.5 -1.6 81.2 79.4 74.0 79.5 82.9hot rolled asphalt -1.5 -2.3 -1.8 -1.7 -1.8 82.1 80.3 75.0 80.4 83.9stone mastic asphalt 0/6 -1.0 -1.7 -1.3 -1.2 -1.3 79.6 77.8 72.4 77.9 81.3
L_eq in dB(A)Delta-L_eq in dB(A)Rolling noise levels of cars - 5 dB(A)
residential streets, speed limit 30 km/h,
HDV 2%2 3000 4% 2%
5%
residential streets, speed limit 50 km/h,
HDV 2%2 3000 4% 2%
residential streets, speed limit 30 km/h,
HDV 5%2 3000 4%
5%
urban, main streets, speed limit 50 km/h,
traffic lights, HDV 4 40000 4% 3%
residential streets, speed limit 50 km/h,
HDV 5%2 3000 4%
6%
urban, main streets, speed limit 60/70 km/h, HDV 3%
4 40000 4% 3%
urban, main streets, speed limit 50 km/h,
traffic lights, HDV 4 40000 4%
6%
rural, speed limit 70 km/h, HDV 3% 2 15000 4% 3%
urban, main streets, speed limit 60/70 km/h, HDV 6%
4 40000 4%
6%
rural, speed limit 100 km/h, HDV 3% 2 15000 4% 3%
rural, speed limit 70 km/h, HDV 6% 2 15000 4%
6%
motorway, speed limit 100 km/h, HDV
15%4 40000 4% 15%
rural, speed limit 100 km/h, HDV 6% 2 15000 4%
25%
motorway, speed limit 120 km/h, HDV
15%4 40000 4% 15%
motorway, speed limit 100 km/h, HDV
25%4 40000 4%
25%motorway, speed
limit 120 km/h, HDV 25%
4 40000 4%

FEHRL Report 126 Final Report SI2.408210 Tyre/Road Noise – Volume 2
FEHRL
B.2 Overall noise reduction following a 5 dB(A) reduction of tyre/road noise of all vehicles
road category no of lanes ADT percent
LDVpercent
HDV road surface day evening nightLden 24 h
un-weighted
Lden 24 h weighted day evening night Lden 24 h
unweightedLden 24 h weighted
stone mastic asphalt 0/11 -1.3 -1.7 -1.8 -1.4 -1.6 58.7 57.5 51.5 57.1 60.6hot rolled asphalt -1.8 -2.3 -2.4 -2.0 -2.2 59.1 58.1 52.1 57.6 61.1stone mastic asphalt 0/6 -1.0 -1.3 -1.4 -1.1 -1.2 58.5 57.2 51.1 56.8 60.3
stone mastic asphalt 0/11 -0.9 -1.4 -1.5 -1.0 -1.2 60.8 58.6 52.5 59.0 62.0hot rolled asphalt -1.3 -1.9 -2.0 -1.4 -1.7 61.1 59.1 53.0 59.3 62.4stone mastic asphalt 0/6 -0.6 -1.0 -1.1 -0.7 -0.9 60.7 58.4 52.3 58.8 61.8
stone mastic asphalt 0/11 -2.1 -2.6 -2.7 -2.3 -2.5 58.8 58.0 52.0 57.3 60.9hot rolled asphalt -2.7 -3.2 -3.2 -2.8 -3.0 59.5 58.9 52.9 58.1 61.8stone mastic asphalt 0/6 -1.6 -2.1 -2.1 -1.8 -1.9 58.4 57.3 51.3 56.8 60.3
stone mastic asphalt 0/11 -1.6 -2.2 -2.3 -1.8 -2.1 60.6 58.8 52.8 58.9 62.1hot rolled asphalt -2.1 -2.8 -2.9 -2.3 -2.6 61.1 59.6 53.5 59.4 62.7stone mastic asphalt 0/6 -1.2 -1.7 -1.8 -1.3 -1.6 60.3 58.3 52.2 58.5 61.6
stone mastic asphalt 0/11 -1.7 -2.3 -2.9 -2.0 -2.4 71.5 70.0 64.2 69.8 73.2hot rolled asphalt -2.3 -2.9 -3.4 -2.5 -2.9 72.0 70.8 65.1 70.4 74.0stone mastic asphalt 0/6 -1.3 -1.8 -2.3 -1.5 -1.8 71.1 69.5 63.4 69.4 72.6
stone mastic asphalt 0/11 -1.3 -2.0 -2.6 -1.5 -2.0 73.2 70.9 64.8 71.3 74.3hot rolled asphalt -1.7 -2.5 -3.2 -2.0 -2.5 73.6 71.5 65.6 71.7 74.9stone mastic asphalt 0/6 -0.9 -1.5 -2.1 -1.1 -1.5 72.9 70.5 64.1 71.0 73.8
stone mastic asphalt 0/11 -3.2 -3.6 -3.9 -3.4 -3.6 71.3 70.5 66.4 70.0 74.3hot rolled asphalt -3.6 -4.0 -4.2 -3.8 -4.0 72.3 71.6 67.6 71.1 75.5stone mastic asphalt 0/6 -2.6 -3.0 -3.3 -2.8 -3.1 70.4 69.3 64.9 69.0 73.1
stone mastic asphalt 0/11 -2.8 -3.3 -3.8 -3.0 -3.4 72.4 70.9 66.6 70.9 74.8hot rolled asphalt -3.3 -3.8 -4.1 -3.5 -3.8 73.3 72.0 67.8 71.8 75.9stone mastic asphalt 0/6 -2.2 -2.7 -3.2 -2.4 -2.8 71.6 69.9 65.2 70.0 73.7
stone mastic asphalt 0/11 -3.2 -3.6 -3.7 -3.3 -3.5 67.8 67.2 61.2 66.4 70.1hot rolled asphalt -3.6 -4.0 -4.0 -3.8 -3.9 68.8 68.4 62.4 67.4 71.2stone mastic asphalt 0/6 -2.6 -3.1 -3.1 -2.7 -2.9 66.8 65.9 60.0 65.3 68.9
stone mastic asphalt 0/11 -2.8 -3.4 -3.5 -3.0 -3.2 68.9 67.6 61.7 67.3 70.7hot rolled asphalt -3.3 -3.8 -3.8 -3.4 -3.7 69.8 68.7 62.8 68.2 71.7stone mastic asphalt 0/6 -2.2 -2.8 -2.9 -2.4 -2.6 68.1 66.5 60.5 66.4 69.7
stone mastic asphalt 0/11 -3.7 -3.9 -3.9 -3.7 -3.8 69.7 69.5 63.6 68.4 72.3hot rolled asphalt -4.0 -4.2 -4.2 -4.1 -4.1 70.8 70.7 64.8 69.5 73.5stone mastic asphalt 0/6 -3.0 -3.3 -3.3 -3.1 -3.2 68.3 68.0 62.1 67.0 70.8
stone mastic asphalt 0/11 -3.4 -3.8 -3.8 -3.6 -3.7 70.4 69.7 63.8 68.9 72.7hot rolled asphalt -3.8 -4.1 -4.1 -3.9 -4.0 71.4 70.9 65.0 70.0 73.8stone mastic asphalt 0/6 -2.8 -3.2 -3.2 -2.9 -3.1 69.2 68.3 62.3 67.7 71.3
stone mastic asphalt 0/11 -3.6 -3.7 -3.6 -3.6 -3.6 77.7 76.9 70.9 76.2 79.8hot rolled asphalt -3.9 -4.0 -3.9 -3.9 -3.9 78.6 77.9 71.8 77.1 80.8stone mastic asphalt 0/6 -2.9 -3.1 -3.0 -3.0 -3.0 76.4 75.5 69.5 74.9 78.5
stone mastic asphalt 0/11 -3.5 -3.6 -3.5 -3.5 -3.5 78.6 77.3 71.6 77.0 80.5hot rolled asphalt -3.8 -3.9 -3.8 -3.8 -3.8 79.4 78.2 72.5 77.8 81.4stone mastic asphalt 0/6 -2.9 -3.0 -2.9 -2.9 -2.9 77.4 75.9 70.4 75.8 79.3
stone mastic asphalt 0/11 -3.6 -3.7 -3.6 -3.6 -3.6 78.2 77.6 71.5 76.8 80.4hot rolled asphalt -3.9 -4.0 -3.9 -3.9 -3.9 79.1 78.6 72.4 77.7 81.4stone mastic asphalt 0/6 -2.9 -3.0 -3.0 -3.0 -3.0 76.9 76.1 70.1 75.4 79.0
stone mastic asphalt 0/11 -3.5 -3.6 -3.5 -3.5 -3.5 79.0 77.8 72.1 77.4 81.0hot rolled asphalt -3.8 -3.9 -3.8 -3.8 -3.8 79.8 78.8 73.0 78.3 81.9stone mastic asphalt 0/6 -2.9 -3.0 -2.9 -2.9 -2.9 77.8 76.5 70.8 76.2 79.7
25%motorway, speed
limit 120 km/h, HDV 25%
4 40000 4%
25%
motorway, speed limit 120 km/h, HDV
15%4 40000 4% 15%
motorway, speed limit 100 km/h, HDV
25%4 40000 4%
6%
motorway, speed limit 100 km/h, HDV
15%4 40000 4% 15%
rural, speed limit 100 km/h, HDV 6% 2 15000 4%
6%
rural, speed limit 100 km/h, HDV 3% 2 15000 4% 3%
rural, speed limit 70 km/h, HDV 6% 2 15000 4%
6%
rural, speed limit 70 km/h, HDV 3% 2 15000 4% 3%
urban, main streets, speed limit 60/70 km/h, HDV 6%
4 40000 4%
6%
urban, main streets, speed limit 60/70 km/h, HDV 3%
4 40000 4% 3%
urban, main streets, speed limit 50 km/h,
traffic lights, HDV 4 40000 4%
5%
urban, main streets, speed limit 50 km/h,
traffic lights, HDV 4 40000 4% 3%
residential streets, speed limit 50 km/h,
HDV 5%2 3000 4%
5%
residential streets, speed limit 50 km/h,
HDV 2%2 3000 4% 2%
residential streets, speed limit 30 km/h,
HDV 5%2 3000 4%
L_eq in dB(A)Delta-L_eq in dB(A)Rolling noise levels of all vehicles - 5 dB(A)
residential streets, speed limit 30 km/h,
HDV 2%2 3000 4% 2%
FEHRL Report Final Report SI2.408210 Tyre/Road Noise – Volume 2 127
FEHRL
B.3 Overall noise reduction following a 5 dB(A) reduction for cars and light duty vehicles and a propulsion noise reduction of 5 dB(A) for heavy duty vehicles
road category no of lanes ADT percent
LDVpercent
HDV road surface day evening nightLden 24 h
un-weighted
Lden 24 h weighted day evening night Lden 24 h
unweightedLden 24 h weighted
stone mastic asphalt 0/11 -2.6 -2.3 -2.3 -2.5 -2.4 57.4 56.9 51.0 56.0 59.8hot rolled asphalt -2.9 -2.8 -2.8 -2.9 -2.9 58.0 57.6 51.6 56.6 60.4stone mastic asphalt 0/6 -2.4 -2.0 -2.0 -2.3 -2.1 57.0 56.5 50.5 55.6 59.4
stone mastic asphalt 0/11 -3.1 -2.7 -2.6 -3.0 -2.8 58.6 57.4 51.4 57.0 60.4hot rolled asphalt -3.3 -3.0 -3.0 -3.2 -3.1 59.1 58.0 52.0 57.5 61.0stone mastic asphalt 0/6 -3.1 -2.4 -2.4 -2.9 -2.6 58.2 57.0 51.0 56.6 60.1
stone mastic asphalt 0/11 -3.0 -3.0 -3.0 -3.0 -3.0 57.9 57.6 51.6 56.6 60.4hot rolled asphalt -3.4 -3.4 -3.5 -3.4 -3.4 58.8 58.6 52.6 57.5 61.4stone mastic asphalt 0/6 -2.7 -2.5 -2.5 -2.7 -2.6 57.2 56.9 50.9 55.9 59.7
stone mastic asphalt 0/11 -3.2 -3.1 -3.1 -3.2 -3.1 59.0 58.0 52.0 57.5 61.0hot rolled asphalt -3.4 -3.4 -3.4 -3.4 -3.4 59.8 58.9 53.0 58.3 61.9stone mastic asphalt 0/6 -3.1 -2.8 -2.7 -3.0 -2.9 58.4 57.3 51.3 56.8 60.3
stone mastic asphalt 0/11 -3.0 -3.0 -3.2 -3.0 -3.1 70.2 69.4 63.8 68.7 72.5hot rolled asphalt -3.3 -3.4 -3.6 -3.3 -3.5 71.0 70.3 64.9 69.6 73.5stone mastic asphalt 0/6 -2.8 -2.6 -2.8 -2.8 -2.7 69.6 68.7 62.9 68.1 71.7
stone mastic asphalt 0/11 -3.2 -3.1 -3.2 -3.2 -3.2 71.3 69.8 64.2 69.6 73.1hot rolled asphalt -3.3 -3.4 -3.6 -3.4 -3.4 72.0 70.7 65.2 70.4 74.0stone mastic asphalt 0/6 -3.2 -2.8 -2.9 -3.1 -3.0 70.7 69.1 63.3 69.0 72.4
stone mastic asphalt 0/11 -3.4 -3.7 -3.8 -3.5 -3.7 71.1 70.3 66.4 69.8 74.3hot rolled asphalt -3.7 -4.0 -4.1 -3.8 -4.0 72.3 71.6 67.7 71.1 75.5stone mastic asphalt 0/6 -3.2 -3.3 -3.4 -3.2 -3.3 69.8 69.0 64.9 68.5 72.8
stone mastic asphalt 0/11 -3.2 -3.6 -3.7 -3.3 -3.5 72.0 70.7 66.7 70.6 74.7hot rolled asphalt -3.4 -3.8 -3.9 -3.5 -3.8 73.2 71.9 68.0 71.8 76.0stone mastic asphalt 0/6 -3.1 -3.2 -3.3 -3.1 -3.2 70.8 69.4 65.2 69.3 73.3
stone mastic asphalt 0/11 -3.4 -3.7 -3.7 -3.5 -3.6 67.6 67.1 61.2 66.2 70.0hot rolled asphalt -3.6 -4.0 -4.0 -3.7 -3.9 68.8 68.4 62.4 67.4 71.2stone mastic asphalt 0/6 -3.1 -3.3 -3.3 -3.2 -3.2 66.3 65.7 59.8 64.9 68.6
stone mastic asphalt 0/11 -3.1 -3.5 -3.6 -3.2 -3.4 68.7 67.5 61.5 67.1 70.6hot rolled asphalt -3.3 -3.8 -3.8 -3.4 -3.7 69.8 68.7 62.8 68.2 71.7stone mastic asphalt 0/6 -3.0 -3.2 -3.2 -3.1 -3.2 67.3 66.1 60.1 65.7 69.2
stone mastic asphalt 0/11 -3.5 -3.8 -3.8 -3.6 -3.7 69.9 69.6 63.7 68.5 72.4hot rolled asphalt -3.7 -4.1 -4.1 -3.8 -4.0 71.1 70.8 64.9 69.7 73.6stone mastic asphalt 0/6 -3.1 -3.3 -3.3 -3.2 -3.3 68.3 68.0 62.1 66.9 70.8
stone mastic asphalt 0/11 -3.1 -3.6 -3.7 -3.3 -3.5 70.7 69.9 63.9 69.2 72.9hot rolled asphalt -3.3 -3.9 -3.9 -3.5 -3.7 71.9 71.1 65.1 70.4 74.0stone mastic asphalt 0/6 -2.9 -3.2 -3.2 -3.0 -3.1 69.1 68.3 62.3 67.6 71.2
stone mastic asphalt 0/11 -2.2 -2.9 -2.5 -2.4 -2.5 79.0 77.7 72.0 77.4 80.9hot rolled asphalt -2.4 -3.1 -2.7 -2.6 -2.7 80.1 78.8 73.1 78.5 82.0stone mastic asphalt 0/6 -2.1 -2.6 -2.3 -2.2 -2.3 77.2 76.0 70.3 75.6 79.2
stone mastic asphalt 0/11 -1.8 -2.4 -2.0 -1.9 -2.0 80.3 78.4 73.2 78.6 82.0hot rolled asphalt -1.8 -2.6 -2.1 -2.0 -2.2 81.4 79.5 74.2 79.6 83.1stone mastic asphalt 0/6 -1.8 -2.2 -2.0 -1.9 -2.0 78.5 76.7 71.3 76.8 80.2
stone mastic asphalt 0/11 -2.4 -3.0 -2.6 -2.5 -2.6 79.4 78.3 72.5 77.8 81.4hot rolled asphalt -2.5 -3.2 -2.8 -2.7 -2.8 80.4 79.3 73.5 78.9 82.5stone mastic asphalt 0/6 -2.2 -2.6 -2.4 -2.3 -2.4 77.6 76.6 70.7 76.1 79.7
stone mastic asphalt 0/11 -1.9 -2.6 -2.2 -2.0 -2.2 80.6 78.9 73.5 78.9 82.4hot rolled asphalt -2.0 -2.7 -2.3 -2.2 -2.3 81.6 79.9 74.5 79.9 83.4stone mastic asphalt 0/6 -1.9 -2.3 -2.0 -2.0 -2.1 78.8 77.1 71.7 77.1 80.6
L_eq in dB(A)Delta-L_eq in dB(A)Rolling noise levels of cars & LDV - 5 dB(A), Propulsion noise levels of HDV -5
residential streets, speed limit 30 km/h,
HDV 2%2 3000 4% 2%
5%
residential streets, speed limit 50 km/h,
HDV 2%2 3000 4% 2%
residential streets, speed limit 30 km/h,
HDV 5%2 3000 4%
5%
urban, main streets, speed limit 50 km/h,
traffic lights, HDV 4 40000 4% 3%
residential streets, speed limit 50 km/h,
HDV 5%2 3000 4%
6%
urban, main streets, speed limit 60/70 km/h, HDV 3%
4 40000 4% 3%
urban, main streets, speed limit 50 km/h,
traffic lights, HDV 4 40000 4%
6%
rural, speed limit 70 km/h, HDV 3% 2 15000 4% 3%
urban, main streets, speed limit 60/70 km/h, HDV 6%
4 40000 4%
6%
rural, speed limit 100 km/h, HDV 3% 2 15000 4% 3%
rural, speed limit 70 km/h, HDV 6% 2 15000 4%
6%
motorway, speed limit 100 km/h, HDV
15%4 40000 4% 15%
rural, speed limit 100 km/h, HDV 6% 2 15000 4%
25%
motorway, speed limit 120 km/h, HDV
15%4 40000 4% 15%
motorway, speed limit 100 km/h, HDV
25%4 40000 4%
25%motorway, speed
limit 120 km/h, HDV 25%
4 40000 4%

FEHRL Report 128 Final Report SI2.408210 Tyre/Road Noise – Volume 2
FEHRL

FEHRL Report Final Report SI2.408210 Tyre/Road Noise – Volume 2 129
FEHRL
Appendix C. Estimating the influence of vehicle body design on the test result – A theoretical approach

FEHRL Report. 130 Final Report SI2.408210 Tyre/Road Noise – Volume 2
FEHRL

FEHRL Report Final Report SI2.408210 Tyre/Road Noise – Volume 2 131
FEHRL
The model described in the following section assumes that for a single vehicle pass-by event the source may be represented as a source line of length D (m) determined from the product of the vehicle speed V (ms -1 ) and the averaging time corresponding to FAST response used for measuring the maximum pass-by noise level, t = 0.25s. The acoustic power of the source line is W watts/m. Figure D.1 shows the geometry of the site.
d
D
r
δx
θ
Receiver
Effective length of source line D = V. t (m) where V = the vehicle speed (ms-1) t = the averaging time = 0.25 s
δx = (r/cos θ) δθ
Vehicle speed V
Figure C.1: Geometry of site
The receiver is positioned a distance d from the source line which can be regarded to consist of a series of small elements of length δx of source strength Wδx, which are each omni-directional and incoherent. The total intensity received at a distance d from the source is given by
⎟⎠⎞
⎜⎝⎛==== −
−
+
−∫ ∫ dD
dW
dW
dW
rxWI
D
D 2tan
2212/
2/ 2 πθ
πδθ
ππδ θ
θ (C.1)
which assumes cylindrical spreading from the discrete source line δx. Assuming the maximum sound pressure level, Lmax, occurs when the vehicle is directly opposite the receiver at a distance d (m) and converting Equation (C.1) to sound pressure levels using logarithmic form, Equation (C.1) can be rewritten as
⎟⎠⎞
⎜⎝⎛+−−⎟
⎠⎞
⎜⎝⎛=⎟
⎠⎞
⎜⎝⎛ −
dDdW
WI
Irefref 2
tanlog10log10log10log10log10 11010101010 π (C.2)
where Iref is the reference intensity, 10-12 watts m-2 and Wref is the reference power, 10-12 watts m-1 and gives

FEHRL Report. 132 Final Report SI2.408210 Tyre/Road Noise – Volume 2
FEHRL
⎟⎟⎠
⎞⎜⎜⎝
⎛+−−= −
dVdLL W 8
tanlog10log105 11010max (C.3)
where V = D/t is the speed of the vehicle (ms-1), t = 0.25s the averaging time corresponding to FAST response and LW is the sound power level. Assuming that the dominant noise source is tyre/road noise, the maximum noise level at the receiver position is calculated by combining the noise contributions from both the farside and nearside set of tyres. Assuming the sound power level LW from both contributions is the same then Equation (C.3) can be used to determine the separate contributions from each set of tyres to the overall noise level. If the distance of separation between the wheel tracks of the vehicle is y (m) and the receiver height is h (m) then the combined noise level is given by
( )10/10/10max 1010log10 NF LLL += (C.5)
where LF and LN are the noise contributions from the farside and nearside tyres, respectively. The contribution to the overall level from the farside set of tyres, ∆Lmax, can therefore be calculated from
⎟⎟⎟
⎠
⎞
⎜⎜⎜
⎝
⎛+=∆
10
10
10max
10
101log10N
F
L
L
L (C.6)
From Equation (C.3), Equation (C.6) can be simplified to give
⎟⎟⎟
⎠
⎞
⎜⎜⎜
⎝
⎛+=∆
DC
BA
L 1log10 10max (C.7)
where
( ) 2/1221 )25.7(8
tan yhdwheredBanddVA FF
F
++==⎟⎟⎠
⎞⎜⎜⎝
⎛= −
and
( ) 2/1221 )25.7(8
tan yhdwheredDanddVC NN
N
−+==⎟⎟⎠
⎞⎜⎜⎝
⎛= −

FEHRL Report Final Report SI2.408210 Tyre/Road Noise – Volume 2 133
FEHRL
Appendix D. Predicted changes in the average roadside noise level resulting from a reduction in tyre/road noise of light vehicles

FEHRL Report. 134 Final Report SI2.408210 Tyre/Road Noise – Volume 2
FEHRL

FEHRL Report Final Report SI2.408210 Tyre/Road Noise – Volume 2 135
FEHRL
In the following graphs the reduction in average noise level on different surfaces due to a reduction in the tyre/road noise (mainly tyre/road noise) of light category 1 vehicles is predicted using the HARMONOISE source model. The total traffic flow is 1000 vehicles per hours. Category 2 vehicles include heavy 2 axle goods vehicles and buses. Category 3 vehicles include heavy vehicles with more than 2 axles (a) 50 km/h with 3% category 2 and 0.6% category 3
67
68
69
70
71
72
73
0 1 2 3 4 5 6Tyre noise reduction (dB)
LAeq
(dB)
SMA8SMA11SMA14DAC8DAC11DAC14HRA
(b) 50 km /h with 10% category 2 and 2% category 3
69
70
71
72
73
74
0 1 2 3 4 5 6Tyre noise reduction (dB)
LA
eq (d
B)
SMA8SMA11SMA14DAC8DAC11DAC14HRA
Figure D.1: Reductions in LAeq for traffic travelling at an average speed of 50 km/h

FEHRL Report. 136 Final Report SI2.408210 Tyre/Road Noise – Volume 2
FEHRL
(a) 55 km /h with 3.4% category 2 and 2.7% category 3
69
70
71
72
73
74
0 1 2 3 4 5 6Tyre noise reduction (dB)
LAeq
(dB)
SMA8SMA11SMA14DAC8DAC11DAC14HRA
(b) 70 km /h with 3.8% category 2 and 6.4% category 3
71
72
73
74
75
76
0 1 2 3 4 5 6Tyre noise reduction (dB)
LAeq
(dB
)
SMA8SMA11SMA14DAC8DAC11DAC14HRA
Figure D.2: Reductions in LAeq for traffic travelling at an average speed of 555 and 70 km/h
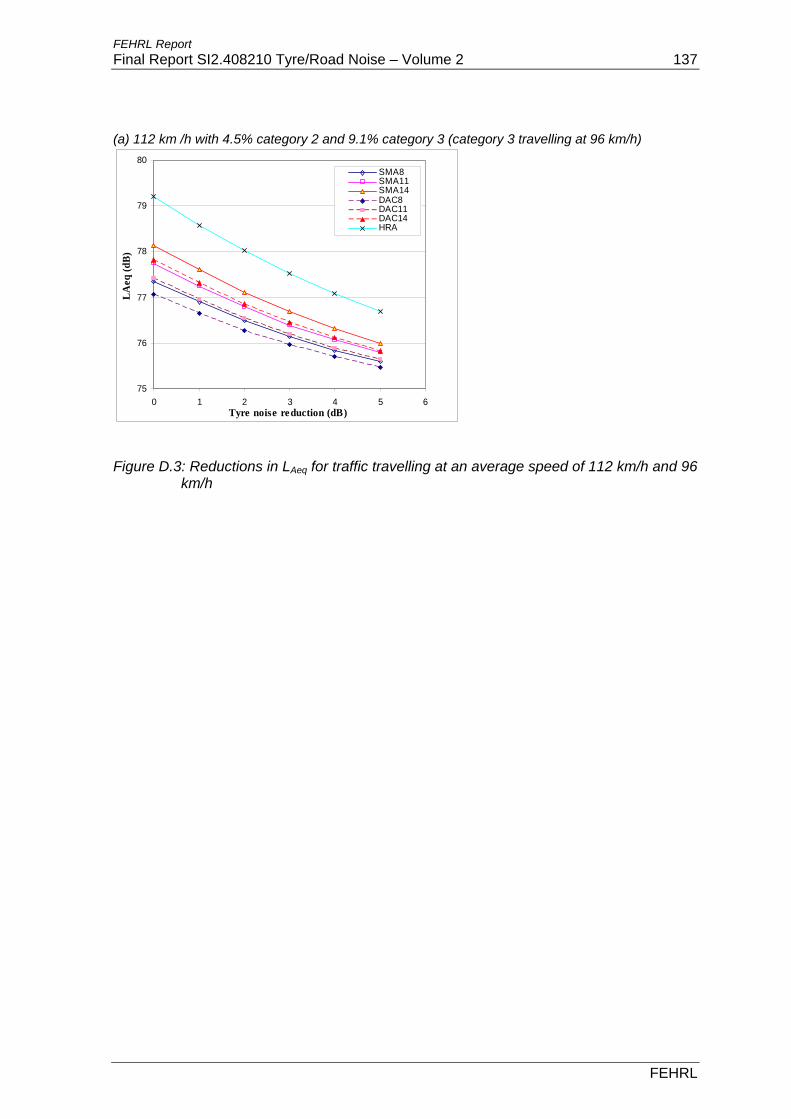
FEHRL Report Final Report SI2.408210 Tyre/Road Noise – Volume 2 137
FEHRL
(a) 112 km /h with 4.5% category 2 and 9.1% category 3 (category 3 travelling at 96 km/h)
75
76
77
78
79
80
0 1 2 3 4 5 6Tyre noise reduction (dB)
LA
eq (d
B)
SMA8SMA11SMA14DAC8DAC11DAC14HRA
Figure D.3: Reductions in LAeq for traffic travelling at an average speed of 112 km/h and 96 km/h

FEHRL Report. 138 Final Report SI2.408210 Tyre/Road Noise – Volume 2
FEHRL

FEHRL Report Final Report SI2.408210 Tyre/Road Noise – Volume 2 139
FEHRL
Appendix E. Test procedures for tyre safety and rolling resistance

FEHRL Report. 140 Final Report SI2.408210 Tyre/Road Noise – Volume 2
FEHRL

FEHRL Report Final Report SI2.408210 Tyre/Road Noise – Volume 2 141
FEHRL
E.1 Safety
For safety aspects the main problem lies in the braking performance of a car on a wet road surface1. A possible, but not checked if suitable, method to measure the wet grip performance is described in ISO/DIS 23671 (International Organisation for Standardisation, 2005b) which also forms the basis for the discussion in the UN-ECE Working Party on Breaks and Running Gear (GRF). In the following a short summary of this method is given. In the draft ISO Standard ISO/DIS 23671 the method for measuring a relative wet grip braking performance index to a reference tyre under loaded conditions for new tyres for use on passenger cars on a wet-paved surface is specified. The Standard Reference Test Tyre (SRTT), which characteristics are defined in ASTM E 1136-93(2003) “Standard Specification for A Radial Standard Reference Test Tire”, is chosen as the reference. The measurements can be carried out by either the vehicle method consisting of braking tests with a set of tyres mounted on a suitable standard model of a passenger car having an Antilock Braking System (ABS) or braking tests using a trailer or a special tyre test vehicle.
• Principle of the vehicle method: Starting with an initial speed above 80 km/h, the brakes are applied hard enough to activate the ABS system on all four wheels. The average deceleration is calculated between an initial speed of 80 km/h and a final speed of 20 km/h.
• Principle of the trailer method: The tyres are mounted on a trailer towed by a
vehicle. The braking system on the test wheel is applied firmly until sufficient braking torque results to produce maximum braking force that will occur prior to wheel lookup at a test speed of 65 km/h.
For the test the road surface may be wetted from the track-side or in case of the trailer method by a wetting system incorporated in the test vehicle or the trailer. For the whole testing area the water depth shall be between 0.5 and 1.5 mm. Due to the fact that the SRTT has a fixed dimension (195/75 R14) the case can occur that it is not possible to compare the test tyre and the reference tyre on the same vehicle. For this reason a possible use of a “control tyre” in conjunction with the reference tyre is described. Also outlined in the standard is information about the mounting of the test tyre, the load applied, the numbers of repeat runs and the tolerances allowable for each of the controlled variables. The test result is the so-called “wetgrip index” which represents the relative wet grip performance of the test tyre compared to the reference tyre. The calculation of the index is made according to given formulas.
1 The stopping distance of a passenger car from 100 km/h to 0 km/h on a dry road surface amounts to 45m-50m, on a wet surface 50-70m depending on tyre type (best and worst tyre, one tyre size) .
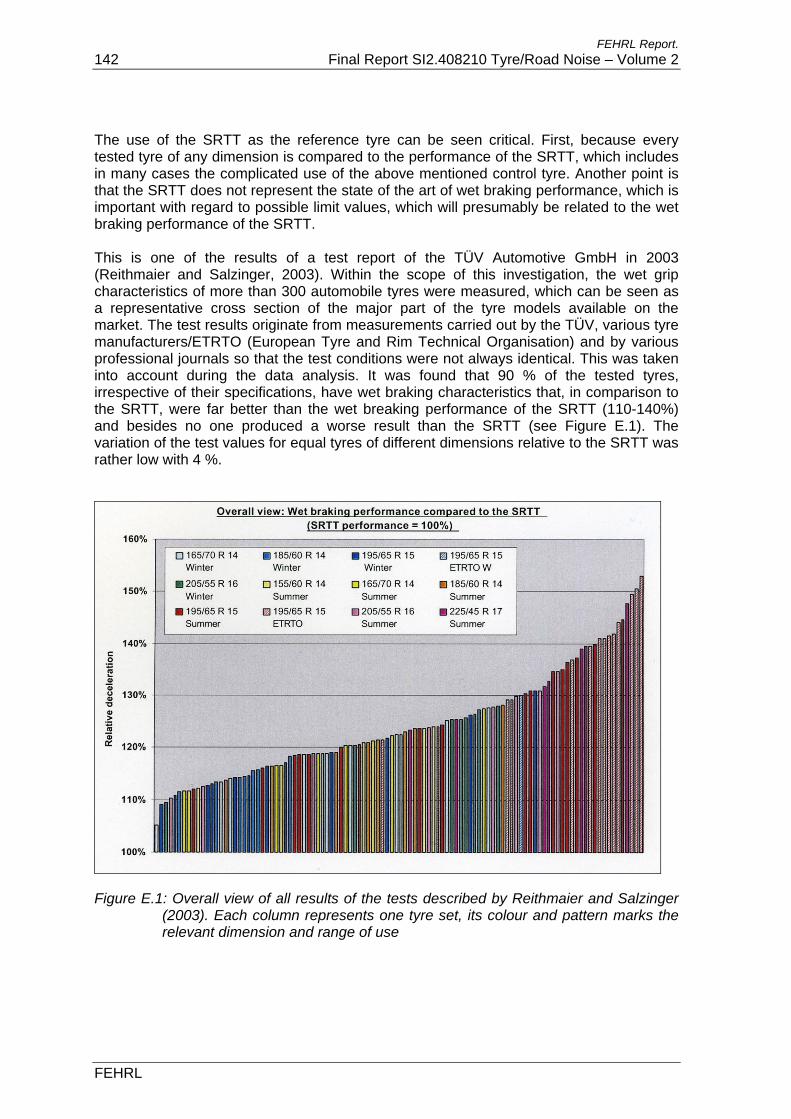
FEHRL Report. 142 Final Report SI2.408210 Tyre/Road Noise – Volume 2
FEHRL
The use of the SRTT as the reference tyre can be seen critical. First, because every tested tyre of any dimension is compared to the performance of the SRTT, which includes in many cases the complicated use of the above mentioned control tyre. Another point is that the SRTT does not represent the state of the art of wet braking performance, which is important with regard to possible limit values, which will presumably be related to the wet braking performance of the SRTT. This is one of the results of a test report of the TÜV Automotive GmbH in 2003 (Reithmaier and Salzinger, 2003). Within the scope of this investigation, the wet grip characteristics of more than 300 automobile tyres were measured, which can be seen as a representative cross section of the major part of the tyre models available on the market. The test results originate from measurements carried out by the TÜV, various tyre manufacturers/ETRTO (European Tyre and Rim Technical Organisation) and by various professional journals so that the test conditions were not always identical. This was taken into account during the data analysis. It was found that 90 % of the tested tyres, irrespective of their specifications, have wet braking characteristics that, in comparison to the SRTT, were far better than the wet breaking performance of the SRTT (110-140%) and besides no one produced a worse result than the SRTT (see Figure E.1). The variation of the test values for equal tyres of different dimensions relative to the SRTT was rather low with 4 %.
Figure E.1: Overall view of all results of the tests described by Reithmaier and Salzinger (2003). Each column represents one tyre set, its colour and pattern marks the relevant dimension and range of use

FEHRL Report Final Report SI2.408210 Tyre/Road Noise – Volume 2 143
FEHRL
Furthermore, to increase the safety of road users it is not only necessary to be aware of good wet braking performance of passenger car tyres but also of truck tyres to achieve a decrease of the braking distances of all vehicles on the roads2. So before possible limit values are established an extension of the ISO standard is reasonable to include truck tyres An important question now is, if a reduction of the noise limits in Directive 2001/43 is achievable without compromising safety. At this point one should look at the results of the measurements which are described above.
E.2 Rolling resistance
One possible method for measuring the rolling resistance is provided by the ISO 18164 (International Organisation for Standardisation, 2005a). At the moment this standard is available in the first edition from the 1st of June, 2005 and represents a compilation of three individual standards (ISO 8767:1992, ISO 9948:1992 and ISO 13327:1998) into a consolidated, technically revised single document. A complexity of rolling resistance measurements is to measure the very small rolling resistance forces in the present of the much larger wheel load forces. Due to this a very precise test equipment is needed and the test procedure has to carry out very accurate. The test dynamometer shall have a cylindrical flywheel with a diameter of at least 1.5m for passenger car and motorcycle tyres or of at least 1.7 m for truck/bus tyres. The surface of the drum shall be smooth steel or textured with a texture depth of 180 µm. For the width of the drum the only constraint is that it has to exceed the width of the test tyre tread. The test tyre is mounted on a specified test rim and runs on the surface of the powered flywheel. Among other things the standard also contains information about the allowed ranges for the following test parameters: test speed, normal load, tyre pressure and temperature. An example of a rolling resistance measuring machine is given in Figure E.2
2 Braking distance of passenger car tyres (various dimensions): 25 – 33m (deceleration from 80 to 10 km/h) (International Organisation for Standardisation, 2005a) Braking distance of truck tyres (dimension 275/70 R22,5): 106 – 119m (deceleration from 70 to 30 km/h, measured with the tyres mounted on a braked trailer pulled by an unbraked tractor) (Penant, 2005)

FEHRL Report. 144 Final Report SI2.408210 Tyre/Road Noise – Volume 2
FEHRL
Figure E.2: Two Tyre Rolling Resistance Measuring Machine, Fa. Inmess
All in all four alternative measurement principles are listed in ISO 18164, i.e. the tester has the option to measure one of four different parameters from which the rolling resistance force, which acts at the tyre/drum interface, can be calculated. In detail these are the following methods:
• Force Method: the reaction force measured at the tyre spindle; • Torque method: the torque input measured at the test drum;
• Power method: the measurement of the input to the test drum;
• Deceleration method: the measurement of deceleration of the test drum and tyre
assembly. In addition three different methods are specified to record the so called parasitic losses, which refer to loss of energy per unit distance excluding internal tyre loss, and attributable to aerodynamic loss of different rotating elements of the test equipment, bearing friction and other sources of systematic loss which may be inherent in the measurement. Furthermore the exact calculation steps to determine the rolling resistance and rolling resistance coefficient out of the measured values are given including possibly required corrections because of temperature deviations or a different drum diameter. To achieve suitable levels of repeatable test results, which can also be correlated among various test laboratories, limits for the acceptable test equipment tolerances are listed in Annex C of the standard. No conversion formula is given in the ISO document which allows to determine the influence of the rolling resistance on the fuel consumption quantitatively. This short summary of the ISO 18164 reveals a number of degrees of freedom which means the measurement can be carried out with several variants. Due to this degrees of freedom, for the same tyre measured in compliance with ISO norms, the results may differ

FEHRL Report Final Report SI2.408210 Tyre/Road Noise – Volume 2 145
FEHRL
by an estimated ±10% (Sandberg and Ejsmont, 2000; Stenschke, 2005). Therefore more stringent specifications in the ISO are necessary to obtain a greater accuracy. This is currently investigated by a working group of the ETRTO Technical Committee. In the end they hope to get a precision of ±2%. The consideration of a reduction of the noise limits in Directive 2001/43 now leads to the question if this can be done without having negative effects on rolling resistance and thus on fuel consumption and exhaust emissions. At this point one should look again at the measurements, which are mentioned above in respect of the safety aspects of tyre performance. As it is described there, the rolling resistance of the tyres was also measured.

FEHRL Report. 146 Final Report SI2.408210 Tyre/Road Noise – Volume 2
FEHRL

FEHRL Report Final Report SI2.408210 Tyre/Road Noise – Volume 2 147
FEHRL
Appendix F. Valuation information
FEHRL Report 148 Final Report SI2.408210 Tyre/Road Noise – Volume 2
FEHRL

FEHRL Report Final Report SI2.408210 Tyre/Road Noise – Volume 2 149
FEHRL
F.1 Stakeholders originally considered in project
The table below was developed in an early stage of the benefit cost analysis. Stakeholder How is the stakeholder affected?
The public (i) Almost all members of society are affected by noise from road traffic. The EU 25 member states comprise 457 million citizens. The number will rise to 470 million during the period 2005- 2025.
(ii) If changes to tyre design were to change fuel consumption, then the public would also be affected by increases or decreases in air pollution levels.
Vehicle manufacturers
Vehicle manufacturers are affected in three main ways:
(i) Vehicles must pass a noise test as part of the ‘type approval’ process. A new form of this test has been developed, for introduction sometime between 2010-2012. The test places much greater emphasis on tyre noise than the previous test, and the limit values are likely to be tightened twice before 2020. Vehicle manufacturers have stated that the use of lower noise tyres will cut the costs to them of complying with the vehicle noise type approval test. This ‘cut’ is in comparison to the alternative approach of making design changes to vehicles themselves, in order to lower engine and powertrain noise.
(ii) Vehicles are equipped with sound deadening, to make the passenger compartment quieter. This sound deadening adds weight to the vehicle, which increases manufacturing costs and fuel consumption. If lower noise tyres reduced noise from both a vehicle’s own tyres and from other traffic, then this would reduce costs of manufacture marginally.
(iii) Vehicle manufacturers purchase tyres as original equipment for the new vehicles that they sell, so are affected by any changes in the cost of purchasing tyres.
Tyre manufacturers
Tyre manufacturers will be affected by:
(i) Any increases in production costs of tyres. If manufacurers did pass on any costs, these would be a very small percentage of the purchase cost of a new vehicle. The costs would be most noticeable for after-market tyres. The purchasers of new vehicles are less price sensitive than the operators of older vehicles, who are affected by the costs of replacement tyres.
(ii) Any changes in the rate at which tyres are replaced by vehicle owners. Such changes would result in higher or lower sales volumes, and hence turnover, for tyre manufacturers.

FEHRL Report 150 Final Report SI2.408210 Tyre/Road Noise – Volume 2
FEHRL
Stakeholder How is the stakeholder affected?
Businesses that operate vehicles
Businesses in Europe own and operate almost all vehicles in classes N1, N2, N3, M2 and M3. Eurostat reports that there were 29 million lorries in the EU in 2001. Around 2.5 million new lorries are bought each year. Many cars, i.e. vehicles in class M1, are also run by businesses. However, the conditions under which cars are wholly or partly run by businesses as ‘company cars’ vary widely between member states. There is therefore no reliable way of apportioning the running costs of these vehicles solely to businesses, as some costs are partly carried by people who use the same vehicles privately.
Costs of ownership depend on:
(i) The purchase costs of vehicles and tyres;
(ii) How often tyres need to be replaced;
(iii) Increases or decreases in fuel consumption that are caused by differences in tyre design.
Members of the public who operate vehicles
Most members of the public operate only private cars, which are vehicles in category M1. In 2002, there were 212 million passenger cars in the EU25 states. Typically, 15 million new cars are sold each year. Costs of ownership depend on:
(i) The purchase cost of vehicles and tyres;
(ii) How often tyres need to be replaced;
(iii) Increases or decreases in fuel consumption that are caused by differences in tyre design.
Road authorities, cities and other road operators
Responsibility for roads falls on a wide variety of national and regional authorities, in the various member states. These authorities have responsibilities to reduce or maintain noise levels, in response to national noise legislation as well as the Environmental Noise Directive.
These responsibilities are weighed against considerations of traffic safety, minimising congestion, air quality, water and ground pollution. It is expected that this will also extend to CO2 production on the network in the future.
The road authorities will be affected by;
Real and perceived reductions, or increases, in noise levels as a result of type approval. Reductions in reality will reduce their costs. Reductions in limits that are not replicated on the road network will not achieve these savings.
Changes in tyre parameters, such as rolling resistance or friction levels may increase the costs of road-based measures needed to overcome any deficiencies.
Unexpected changes in tyre performance in critical conditions as a result of design changes may cause disproportionate costs.

FEHRL Report Final Report SI2.408210 Tyre/Road Noise – Volume 2 151
FEHRL
F.2 Benefits and costs of alternative approaches
This section considers very low noise surfaces. It also considers other policy options that would serve as alternatives to the proposed tyre noise limits in the Directive, as a means of reducing road traffic noise. Sub-section F.2.1 provides a calculation of the costs and benefits of very low noise road surfaces across the EU25. However, other policies would also achieve significant noise reductions. Future benefit cost studies might compare the benefits of further tyre noise reductions beyond the proposed 2012 tyre noise limits with each of: (i) Very low noise road surfaces; (ii) Financial incentives for scrapping older commercial vehicles. These vehicles were often built to comply with much higher vehicle noise limits than are now required of new vehicles. Scrapping older commercial vehicles also provides very significant additional air quality benefits. (iii) Intelligent speed adaptation equipment as ‘speed limiters’ in vehicles. The Commission’s investigation of fixed speed limiters in commercial vehicles has shown very large benefits for all the major environmental impacts of vehicles. See EU(2001) and Carsten (2000). The benefits to noise, accident frequency and severity, and all form sof emissions would provide very considerable, at very low cost.
F.2.1 Low noise road surfaces
The cost of very low noise surfaces for roads is around 17 Euros per square metre. This is the cost of dual layer porour asphalt surfaces that have been used on the Continent. This includes the whole cost of re-surfacing, i.e. both labour and materials. This cost figure compares to around 7 Euros/m2 for SMA (Stone Mastic Asphalt). However, the lowest noise surfaces are not as durable as other surfaces. We can calculate the cost of achieving major road noise reductions through re-surfacing roads with low noise surfaces as part of the routine replacement of worn out roads. We assume:
(i) A cost of 7 Euros/ m2 for an SMA surface, lasting 15 years; (ii) A cost of 17 Euros/m2 for a very low noise surface. This will last only 10 years..
European Union Road Federation (2005) offers the following road lengths for EU25:
• Motorways: 59100 km • National Roads 359900 km
• Secondary or regional roads 1350900 km
• Other roads 2955000 km.
Resurfacing the ‘other roads’ would not be likely to bring significant noise benefits. Many of these roads have very low traffic levels, and are in rural locations with few inhabitants.

FEHRL Report 152 Final Report SI2.408210 Tyre/Road Noise – Volume 2
FEHRL
We assume a total road width of 4 lanes for motorways and national roads, and 2 lanes for secondary and regional roads. These three classes of road together provide, for the EU25, a total of 4.4 million lane kilometres, i.e. 4.4 billion lane metres We assume a lane width of 4 metres. This includes hard shoulders and edges to roads. The total area of road to resurface would therefore be 17.6 billion m2. For very low noise surfaces, the cost would be 300 Billion Euros to resurface all roads, but the surfaces would only offer a 10 year life span. For SMA only, the cost would be 123 Billion Euros, for a 15 year life span. We note however that a very large scale programe of road re-surfacing would be likely to bring down considerably the per metre cost of resurfacing with very low noise surfaces. The difference between re-surfacing with a very low noise surface and an SMA surface would be 22 Billion Euros/annum. Detailed cost estimates and life spans are available from the study Morgan (2006). This study suggests that the advantage provided by a very low noise surface, compared to SAM, would amount to a reduction in overall road traffic noise of 2 dB(A). So a major programme to re-surface most larger roads in the EU with very low noise surfaces would deliver benefits comparable to those achievable through the changes proposed to the Directive. However, the difference lies in the costs. The costs of re-surfacing: (i) Are many times those for achieving compliance with the proposed new tyre noise limits; and (ii) The costs of re-surfacing with very low noise surfaces will recur indefinitely, whereas the costs of the changes to the Directive are likely to occur for very few years.