Embed Size (px)
Citation preview
W E RESOURCE CENlTiE FOR BUILDING E U X L E H C E
STUDY REPORT
RACKING RESISTANCE OF BRACING WALLS IN LOW-RISE BUILDINGS SUBJECT TO
EARTHQUAKE AllACK
Volume 2
Experimental Program Derivation & Assessment P.D. Herbert and A.B. King
This is the second of two volumes which combine to report on how wall bracing panels which develop slackness can rationally be used as a structural system to resist earthquakes. A summary of findings and a proposed revision to the current P21 test method and related references are contained in Volume 1. Volume 2 focuses on the experimental programme which underpins the recommended changes. It is intended that the combined report will be used by technical advisers to building product manufacturers seeking to use their product as wall bracing elements within New Zealand houses. It ~mvides the engineering rationale upon which a revision of the Wall Bradna Test and Evaluation Method known as the BRANZ P21 test method is proposed. A; such it is also intended for use by Building Control Authorities and Structural Engineers can utilise the bracing ratings derived for specific engineering design.

PREFACE
This volume contains the experimental results for the project. The completed experimental programme was undertaken in three phases, each of which is covered separately within this volume. In all cases the behaviour of timber framed bracing panels under wind or earthquake racking is examined with a view to addressing anomalies such as the degree of end restraint and the onset of premature brittle failure associated with lining degradation. The findings from this experimental programme are used to support the proposed revision to the test and evaluation method contained in Volume 1.
ACKNOWLEDGMENTS
The authors acknowledge financial support for this study from the Building Research Levy, the Public Good Science Fund of the Foundation for Research, Science and Technology and the Earthquake Commission Research Foundation. The authors wish to thank Winstone Wallboards Ltd and James Hardie and Co Pty Ltd for providing materials for this project.

RACKING RESISTANCE OF BRACING WALLS IN LOW-RISE BUILDINGS SUBJECT TO EARTHQUAKE AlTACK
BRANZ Study Report SR 78 P.D.Herbert and A.B.King
Reference Herbert, P.D and King, A.B. 1998. Report on Racking Resistance Test and Evaluation Procedure. Building Research Association of New Zealand, Study Report SR 78, Judgeford, New Zealand.
Herbert, P.D and King, A.B. 1997. Report on Racking Resistance Test and Evaluation Procedure. Building Research Association of New Zealand, Study Report SR 78, Judgeford, Wellington, New Zealand.
Abstract Lateral loads such as those produced by the effects of wind and earthquake can be resisted in buildings by cantilever action, by moment resisting frames, by shear walls, by diagonal bracing or a combination of these.
In New Zealand light timber frame construction, the resistance is provided entirely by shear walls. The total resistance of a wall is determined by summing the dependable strengths of individual full height panels located between openings. The standard method for assessing the racking resistance of wall bracing elements between openings, since 1978, has been the BRANZ P21 test. It has been known for some time that there &deficiencies with the P21 test and evaluation procedure with major problems being whether the test loading regime can adequately identify severely degrading elements, and in the assessment of wall ductility.
. .
A detailed literature survey of wall racking tests canidout around the world and the factors which contribute to bracing panel behaviour is given. Taking this into account, a three phase experimental programme was canied out on bracing panels under various loading protocols. including monotonic and reverse cyclic loading. The end studs to the specimens were either fully held down with tie-rods, or mtrained from uplift by the application of a vertical load or use of a partial restraint. A series of experiments was 'also carried out with no restraint to the end studs. The test specimens were lined with sheathings commonly found in New Zealand construction.
Both the onset of damage to the panels and the displacements at which a significant drop off in load occurred were investigated.
Methodology is presented in this report to enable an accurate computer model to be matched to the test element response. Once matched, the model may then be used to analyse the performance of the element under dynamic seismic loading and to generate seismic response spectra. The result from this analysis is quantification of the mass that the test panel can dependably restrain without the necessity to assess wall ductility.

CONTENTS Page No .
1 . EXPERIMENTAL PROGRAMME PHASE I .................................................... 1
. . ..................................................................................... 1.2 Descr~pt~on of Test Specimens 1 1.2.1 End stud uplifr Restraints used ......................................................................... 4
........................................................................................ 1.3 Phase 1 Experimental set-up 7 1.4 Phase 1 Experimental Procedure .................................................................................. 7
1.5 Phase 1 Experimental Observations ............................................................................. 8 1.5.1 General ............................................................................................................. 8 1.5.2 Monotonic Displacement Protocol with P21 Uplifi Restraints ........................ 8 1.5.3 Cyclic Load and Displacement Protocols with P21 End Restraints .............. 11 1.5.4 Cyclic Load and Cyclic Displacement Test Regime Using Various
End Restraints ................................................................................................. 15 1.5.5 Panel W17 (Lintel Specimen) ......................................................................... 18 1.5.6 Description of Light Timber Frame Bracing Panel Hysteretic Behaviour .... 20
1.6 Conclusions to Experimental Programme Phase I .................................................. 21
2 . EXPERIMENTAL PROGRAMME PHASE II .................................................... 21 2.1 Objective ..................................................................................................................... 22
................................................................................... 2.2 Description of Test Specimens 22 2.3 Displacement Protocol ................................................................................................ 23
............................................................................................................... 2.4 Observations 23 General ...................................................................................................... 23 Panel W18 . EL with P21 Restraint ................................................................ 23
............................................... Panel W19 . EL with Tie Down Rod Restraint 24 Panel W20 . PY with P21 Restraint ................................................................ 24 Panel W2I . PY with Tie Down Rod Restraint ............................................... 25 Panel W22 . PB + EL with end Straps . P21 Restraint ................................... 26 Panel W23 . PB Both Sides with P21 Restraint One End and Minimal Restraint the Other ........................................................................... 28 Panel W24 -PB Both Sides with P21 Restraint One End and 12 W Restraint the Other ............................................................................... 29
........................................ 2.5 Summary of Performance Evaluation of Phase I1 Systems 30 ........................... 2.6 Comparison of Individual Test Panel Results with Previous Work 31
2.7 Conclusions From the Phase I1 Experimental Programme ......................................... 32
3 . EVALUATION PROCEDURE USED TO DETERMINE THE DEPENDABLE SEISMIC MASS RESTRAINED ............................................... 33

Page No . ................................................................................................................ Introduction 33
Seismic Mass Rating Procedure ............................................................................. 34 Results of Phylmas Analysis for Test Programme I ................................................... 35 3.3.1 P21 Restraint .................................................................................................. 35 3.3.2 NZ4 Earthquake Record - A Comparison of Spectra ..................................... 36 3.3.3 Displacement and Acceleration spectra using various restraints .................. 37 3.3.4 Panel W16 . BL Lined Both Sides, Tie Down Rod Restraint .......................... 38 3.3.5 Panel W17 - Lintel Specimen ........................................................................ 38
DISCUSSION ........................................................................................................... 39 Boundary Conditions .................................................................................................. 39
.............. 4.1.1 Up113 Restraint Aftributable to Current P21 (1991) End Restraint 40 In-service Boundary Conditions ............................................................................. 41 4.2.1 Internal Bracing Panel /.%tern1 Wall Junction .......................................... 41 4.2.2 Internal Bracing Panel / Door Opening ...................................................... 43 Load Regime ............................................................................................................... 43 4.3.1 Load or Displacement Control ................................................................. 44
CONCLUSION ........................................................................................................ 45
REFERENCES .................................................................................................... 46
7 . APPENDIX A SMALL SCALE TESTING OF BRACING PANEL COMPONENTS ...................................................................................................... 48
8 . APPENDIX B BRACING PANEL UPLIFT ON TYPICAL TIMBER FLOORING ............................................................................................ 49

FIGURE Page No . Figure 1 : Typical Test Set-Up ............................................................................................ 3
Figure 2 : Panel W17 Configuration .................................................................................... 3 ............................................................................................... Figure 3 : P2 1 End Restraint 4
Figure 4 : Test Specimen with Tie-Rod Restraint ............................................................... 5
Figure 5 : Test Specimen with Vertical Load ...................................................................... 6
Figure 6 : Load Displacement Response for Specimens subjected to Monotonic Displacement Protocol ...................................................................................... 10
Figure 7 : Cyclic and Monotonic Load Regime for 2.4m long panels with different r i ngs ......................................................................................... 12
Figure 8 : Percentage Load Degradation from Monotonic Curve (BL) Specimens W10and W12 ................................................................................. 13
............................ Figure 9 : Displacement at Successive Cycles as a Ratio of Peak Load 14 ... . Figure 10: Hysteresis Loops for Panel W13 Specimen with Tie-Down Rod Restraint 16
................... . Figure 11: Hysteresis Plot for Specimen W14 Vertically Loaded Top Plate 17 . ............................................ Figure 12: ' Predicted Monotonic Parent Curves Panel W 17 19
....................................................... F~gure 13: Hysteresis plots for Specimens W18-W23 27 Figure 14: Hysteresis Loop for Specimen W24 .................................................................. 29
Figure 15: Comparison of Parent Curves for Lintel and Long Walls ................................. 31 Figure 16: Displacement Spectra Specimen W12 ............................................................. 35
................................................ Figure 17: Mass Restrained using Various End Restraints 38 Figure 18: Mass Restrained by Specimens W13 and W16 ................................................. 39
....................................................................................... Figure 19: Typical Wall Junction 42
Figure 20: Parent Curves Under Load or Displacement Control ....................................... 45
TABLE Table 1 : Table 2: Table 3: Table 4: Table 5: Table 6: Table 7: Table 8: Table 9: Table 10: Table 11:
Test Specimen Configurations ............................................................................ 2 Specimen Cyclic Test Regime . Load Control .................................................... 7 Specimen Cyclic Test Regime . Displacement Control ...................................... 8
............................................ Ratio of Displacement to Residual Displacemen L 14 Test Specimen Configuration ............................................................................ 22 Test Load Regime for Test programme I1 ......................................................... 23 Restrained Masses for Specimens W18-W24 ................................................... 30 Comparison of Restrained Mass for Long Wall Panel ................................... 32 Comparison of Mass Restrained using P21 End Restraint ............................... 36 Comparison of Mass Reshained using Various End Restraints ....................... 37 Lateral Force per Bottom Plate F i g .............................................................. 41

1. EXPERIMENTAL PROGRAMME PHASE I
1.1 Objective
The first phase of the experimental programme was designed to:
Determine a load/displacement protocol which enables the onset of damage of bracing panels to be identified. Determine the effect that the alternatives of either load or displacement control had, if any, on the peak resistance of the bracing systems.
Determine the effect that different boundary conditions (ie end stud uplift restraints and also the degree of sill plate fixity) had on panel strength and stiffness.
Determine the amount of restraint afforded by lintels. Provide data to verify the Phylmas computer programme. Details of the programme can be found in Section 3.
1.2 Description of Test Specimens
All frames were constructed from machine stress graded 90 x 35 mm kiln dried radiata pine studs and 90 x 45 mm kiln dried radiata pine top and bottom plates and machine stress graded to grade F5. All frames, except for panel W17 described below, were 2420 mm high and 2435 mm long. Frame studs were centred at 600 mm nailed together using two 90 x 3.15 mm gun nails. Panels W4W6 had one row of noggins at mid height. All other panels were devoid of noggins.
Bottom plates to panels W1-W16 were nailed to a 150 x 90 timber foundation beam, through a 20 mm particleboard strip, using pairs of 100 x 4 mm flat head nails at 600 mm centres. The particleboard strip represents typical flooring. The foundation beam was bolted rigidly to a purpose built steel framed test rig. The typical test set-up is shown in Figure 1.
Panel W17 was uniquely constmcted to simulate a short section of wall between two door openings. The bottom plate of the panel was fixed to a 300 x 100 mm timber foundation beam using pairs of 100 x 4 mm flat head nails at 600 mm centres. The foundation beam was fumly bolted to the laboratory strong floor and had a 20 mm strip of particleboard f d to its upper face. The door lintels were constructed using 90 x 35 mm F5 kiln dried radiata pine and were checked 15 mm into the studs. The top plate was continuous. Hold down restraints were provided at the e x m e ends of the specimen by means of 16 mm diameter tension rods clamped to the lintel and f d directly to the strong floor. This prevented uplift at the tension end of the panel during load cycling but did not prevent vettical downward movement of the end stud in compression. Ten kN load cells were used to measure the uplift in the restraining rods. (see Figure 2).
Various linings were used in the tests. Linings were used on one side only, with the exception of panels W16 and W17 which were lined both sides. All linings were fixed using galvanised clouts.

Variations in the lining material, the end boundary restraint and the loading regime are identified in Table 1 below.
-
W3 PB P2 1 CyclidDisp Control - W4 FC P2 1 Monotonic
W1
I W14 I BL I Vert Load 1 CvclidLoadControl I
PB
W11 W12 W13
Lined both sides Lintel Specimen. Refer Figure 2
P21 CvclidLoad Control W2 I PB
BL BL BL
--
W15 ~ 1 6 '
W17
The four proprietary linings used were: PB - Nominal 9.5 mm standard grade paper faced fixed with 30 x 2.5 galvanised clouts at 150 mm d c to panel perimeter. 300 mm d c at lining join and pairs of clouts at 300 mm d c on intermediate studs. FC - Nominal 7.5 mm thick smooth faced fibre cement sheet2, fixed with 40 x 2.5 galvanised clouts at 150 mm d c to panel perimeter, internal studs and noggins.
Monotonic P2 1
PY - Nominal 7.5 mm thick plywood sheet with three laminates, measured thickness was 7.8 mm and &nsity 4.1 kg/m2 fued with 30 x 2.5 galvanised clouts at 150 mm d c to sheet edges and at 300 mm d c to intermediate studs.
P21 PZ1
Tie Rod
Table 1 : Test Specimen Configurations
BL BL PB
BL - Nominal 9.5 mm enhanced paper faced bracing plasterboard3 fued as per the plasterboard pattern above but with purpose made washers beneath the nails around the panel perimeter.
Cyclic/Load CyclidDisp Control CyclidLoad Control
' Winstone Wallboards Ltd standard Gib@ plasterboard of measured thickness of 9.5 mm and density 6.7 kg/m2.
None Tie Rod
Refer Figure 2
James Hardie Haditex@ with a measured thickness of 7.6 mm and density 10.3 kg/m2
Cyclichad Control CyclidLoad Control
CyclidDisp
' Winstone Wallboards Ltd Gib@ Braceline with a measured thickness of 9.5 mm and density 8.46 kg/m2.

9 0 I 45 mm Timber lop and boltom p l a l e s ,
Olsplscemenl transducer - End B
- Loud
End A
/ 90 1 3 5 m a Tlmber studs
/ End reslralnl
i/ Dlsplacemenl transducer
I I
/ I 20 mm Perlicleboer S l e d loading lrame
\ I S 0 1 9 0 mm llmber iolrt
Figure 1 : Typical Test Set-Up
Figure 2 : Panel W17 Configuration
3

Both sides of the panel were lined with 9.5 mm plasterboard, with joints fully stopped and taped. A 25 x 1 mm (nominal) galvanised high tensile steel strap was used to form a diagonal brace within the main body of the specimen.
The panel was similar to a section of wall tested by Thurston (1993) so observations a& results from each of the tests could be readily compared.
1.2.1 End stud uplift restraints used The effect of varying degrees of uplift restraint were investigated in panels W1 to W16. Four levels of restraint were imposed as follows:
i) P21 Restraint - Consisting of a portion of stud fixed to each end of the test specimen using three No. 100 x 4 mm flat head nails fixed horizontally. The stud portion was restrained from uplifting by bearing against a mild steel angle which was bolted down to the test rig. Refer Figure 3. Reference to the P21 restraint is made throughout this document and refers to this detail.
This method of restraint is the one currently employed for the BRANZ P21 test method (King & Lim 1991) and is considered as representative of the minimum restraint afforded by the intersection of cross walls at bracing panel ends.
ii) Tie Rods - Four 16 mm diameter mild steel rods were placed in pairs at each end of the specimen. The rods extended the full height of the specimen and bolted rigidly at the bottom to the test rig. The top of the rods were bolted and hand tightened to a mild steel angle which was placed across the specimens over the end stud. The mild steel angle was mounted onto a load skate to allow the specimen to move horizontally without restraint. Refer Figure 4.
The vertical restrain! provided afull tie down Mdprevented specimen rigid body rotation. It is an adaptation of the method used in ASTM E72 (ASTM 1976) as described in Vol Z section C. 1.2
32mm dls washer (greased)
lOOxSOmm limber block
Corner of speclmen
16mm dla m.8. uplln restralnlng rod8 bolled to losdlng lrame
Figure 3: P21 End Restraint
4

Figure 4 : Test Specimen with Tie-Rod Restraint
iii) Vertical load - A vertical load was applied to specimen W14 by means of two 125 kg weights suspended from the end of a cross piece bearing onto the top plate. The other end of the cross piece was tied down to the test rig using a 16 mm tie rod. Refer Figure 5. The resultant vertical load imposed through the lever arm of the cross piece was equivalent to a vertical mass of 1000 kg. No other restraints were used.
l%e bad represented a lower storey panel carrying 8 m widh of lightweight roof and 3m width offloor. The load was mn@erred to the studr via a steel spreader beam which was packed off the fop pkxte at the studpositwns.
iv) No mrrirJ - This test was carried out without any additional restraints or gravity loads.

Figure 5: Test Specimen with Vertical Load

, * 1.3 Phase 1 Experimental set-up
Panels W1-W16 were tested in a vertical orientation in a rigid steel loading frame. Horizontal load was applied to the specimen top plate with a 30 kN closed loop electro-hydraulic ram and measured with a 20 kN load cell.
Panel W17 was tested on the strong floor with the horizontal load applied with a 90 kN closed loop electro-hydraulic ram reacting against a strong wall and measured with a 100 kN load cell. A linked pair of steel channels was screwed to the top plate, (but not over the lintels) which transferred the horizontal load to the panel.
Steel rollers were used to prevent out of plane movement of the top plate. Load cells were selected such that they were accurate to within 1% at the peak loads encountered. Linear potentiometers, reading to an accuracy of O.lmm, were used to measure:
horizontal deflections of the top and bottom plates
vextical uplift of the studs at either end of the specimen
lining slip relative to the frame.
Test load and displacement measurements were recorded using an IBM compatible PC running a proprietary software programme to record the data.
1.4 Phase 1 Experimental Procedure
Three load/displacement protocols were used:
i) Monotonic - Horizontal load was applied to the top plate at an approximately constant rate of 5 kNlmin in one direction only. The specimen was pushed until failure.
ii) Cyclic /Load Control - he maximum load reached during the monotonic test (i) above, was noted and used as the basis of controlling the loading cycle. The basic cyclic test regime is shown in Table 2.
I f 0.5 Pu* I 3 I
Table 2. Spedmen Cyclic Test Regime - Load Control * Pu = Peak load recorded in Monotonic Test.

. . . Ill i) Cyclic /Displacement Control - The displacement A u reached at the Peak load
Pu during the monotonic test was used as the basis of controlling the displacement cycles. Refer Table 3.
1.5 Phase 1 Experimental Observations
k0.6 A , + 0 . 8 A , k 0.9 A , k 1 . 0 A u + 1.1 A ,
1.5.1 General The lining commonly experienced local distortions at the fastener as the imposed displacement increased. The zone of greatest distortion was generally along the bottom plate, particularly at the extreme corners during initial cycles, but progressing along the full extent of the bottom plate and eventually along each end stud.
3 3 3 3 3
In the following section the terms "nails working" or "working hard" (when distortions were more severe) are used to describe the observation that the nail heads were embedding into the lining material. If a nail head pulled through the sheet, this is referred to as "nail head pull through".
Table 3 : Specimen Cyclic Test Regime - Displacement Control
The following observations were made at the corresponding horizontal top plate displacements. Observations for specimens subjected to cyclic loading under both load and displacement control were similar and have been grouped together under the one heading. The general description of displacement relates to the horizontal top plate displacement.
---The ends of the specimen described as end A or B are shown in Figure 1.
1 . Monotonic Dii~lacernent Protocol with P21 Uplift Restraints 1.5.2.1 PB - Specimen WI (see also Figure 6)
@, Displacement
15-30
Observations I Bottom comer nails were 'working hard', with the remainder of bottom plate f i g s "working". Damage increased and top plate nails were observed to be 'working'. Bottom comer fixings had 'pulled through'. This coincided with the maximum resistance. Resistance reasonably constant All nails to bottom plate and some of the top plate f i n g s had 'pulled through'. Large load drop off. Very little uplift of the end studs was observed.
8

1.5.2.2 FC Specimen W4 (see also Figure 6)
@ Displacement mm
Bottom plate fixings to foundation at end A almost totally withdrawn. (ie had lifted some 50 mm).
" ................ " ..... " .- ......................................................................... At 55 mm displacement the three nails of the P21 restraint were severelv bent. The linine however remained largelv undarnaeed.
Observations
20
1.5.2.3 PY Specimen W 7 (see also Figure 6)
Generally, the lining experienced little damage throughout the test. 'Twisting' of the bottom plate occurred at displacements greater than 20 mm.
Fixings began to 'work' along the bottom plate. - The tension end stud uplifted from bottom plate approximately 4 mm, equalling the uplift observed between the bottom plate and the foundation. ......... ................................................... Peak Load recorded ..... ........... ...... ................ Fixings to the lining/bottom plate continued to 'work hard', with
@ Displacement
nails at both end studs beginning to 'work'. -- The two olvwood sheets were roGtine indeoendentlv of one another.
Observations
There wglit t le drop off in resistance frok the at 30 rnm, to displacements in excess of 70 mm.
1.5.2.4 BL Specimen WIO (see &o Figure 6)
@ Displacement I mm I Observations
- - hard'. .--- The tension end stud was observed lifting from the bottom plate
15
- 15-26 26 -- 40
--....---. 55
approx 10 rnm, and the same distance was noted between bottom plate and foundation. The top plate had separated from the end stud
Bottom plate fixings were 'working slightly', and the bottom plate began to lift off the foundation beam. There was no apparent separation of the end stud from the bottom plate. Resistance increased with the fixings 'working hard'. The bottom extreme comer f h n g s were pulled through. Little increase in load but the fixings at the bottom of the end stud began to 'pull through' at each end. The bottom plate was o b s e ~ e d to be 'twisting' with the lined side pulling up higher than the unlined side. There was a drop off in load a t this point. - The fixings down the centre joint between sheets were 'working
- - i t end A by some 30 mm.
- I

Figure 6 : Load Displacement Response for Specimens subjected to Monotonic Displacement Protocol
The initial stiffnesses (up to 4 kN) are similar, approximately 1.7 kN/mm with the exception of the fibre cement lining which had an initial stiffness of ~ 3 . 3 kNImm.
The plasterboard specimen (Wl) attained a peak load of approximately 8 kN, at which time there was a marked stiffness degradation. The panel was able to sustain this load over a wide displacement range; up to around 30 mm when there was a drop off in load carrying capability. The stiffness degradation for the other panels was not as severe as W1 and they were. able to attain peak loads 50% higher. (Around 12 kN for both W4 and W7 and 14 kN for panel W10).
At the end of the test on panel WIO it was found that the bolts used to secure the angle restraint were very tight, normlly they would be only tightened by hand This may have led to the specimen being over-restrained and hence the higher peak load values. Previous tests carried out indicate that the monotonic curve would usually be similar to those obtained forfibre cement board or plywood because the hold-down strength usually limits the strength of the panel.
In all cases, the panels were able to sustain their load canying capabilities during large inelastic deformations.

1.5.3. Cvclic Load and Displacement Protocols with P21 End Restraints
1.5.3.1 PB Specimens W2 & W 3 (see also Figure 7)
I @ Displacement ( Observations I mm 5
I The bottom comer fixings were seen to be 'working'. There was little increase in displacement recorded prior to the bottom comer of the sheet fracturing. As displacements increased the top plate fixings began to work.
The bottom plate had lifted from the foundation beam by 2 mm and the end studs were just beginning to separate from the bottom plate.
" " "
The two sheets were observed to be rotating separately and the amount of differential movement across the join was approximately 10 mm. Bottom nails were 'working hard' at this point. .... " ....... " " "
During the 48 mm cycles the bottom fixings and centre nail fixings began to withdraw from the framing and nail heads embedded into the linings. -. " There was a drop off in load as several nails dong the vertical join sheared through completely, due to fatigue failure and the bottom plate fixings withdrew from the frame. The bottom plate remained securely attached to the foundation beam whilst the end studs separated from the bottom plate. On completion of the test the loose clouts were removed from the lining and a slight ovaling of the nail hole and crushing of the lining under the nail head was observed. Otherwise the plywood lining was undamaged.
...................................... 11
1.5.3.2 PY Specimens W 8 & W 7 (see also Figure 7)
1.5.3.3 BL Specimens Wl1& W12 (see ako Figure 7)
.... Complete 'pull through' occurred at the bottom comer fixings and the load dropped off in subsequent cycles. There was no uplift of bottom plate from the foundation beam.
@ Displacement
@ Displacement I Observations I
Observations
The peak load was r e c ~ r ~ e d at this $it .
- 30 Stud uplift increased to approximately 12 mm.
movement of the bottom plate had occurred at end A, however the
- mm 9 -
15
--- 23
bottom plate was Lifting some 5 mm during the reverse cycle at end B. Nail oull-throueh occurred alone each end stud during the tension cycle
- Nails of bottom corners were 'working hard' and began to embed into
- the paper face. The end stud at end A was seen to be lifting from the bottom plate by approx 6 mm, although no sh&t slip was noticeable nor any uplift of the bottom plate from the foundation observed. The bottom corner fixings had experienced complete pulled through.
- . I for a'distance d 600 mm up f ro2 the bottom plate. I 11

a) 2.4 m long Plasterboard lined panel with P21 end restraints under cyclic load control. (W 2) I b) 2.4 m long Plasterboard lined panel with P21 enc
restraints cycled under displacement control (W 3)
C) 2.4 m long ply lined panel with P21 end restraint displacement cycles (W 9) I d) 2.4 m long Braceline panel with P 21 end
restraints - cycled in load increments (W 11)
e) 2.4 m long Braceline panels with P21 end restraints - cycled in displacement increments (W 12)
Figure 7 : Cyclic and Monotonic Load Regime for 2.4 m long panels with different linings (Observe that plot scales may difler)
Cyclically loading panels W2. W5. W8 and W11 (which were identical to the panels tested monotonically), produced similar results in each case. The first cycle followed the monotonic curve almost identically. Subsequent cycles to the same displacement showed a load degradation, which was greater between 1st and 2nd cycles than

between subsequent cycles. On the first push beyond the initial displacement (for small displacements at loads less than the peak load) it again reached the monotonic curve. The monotonic curve and the parent curve of the cyclically load test specimens were reasonably well matched up to peak loading. (In all cases specimens under cyclic loading regime did not quite reach the peak loads attained during the monotonic test regime). Cycles beyond the peak load showed an increasingly large variance from the monotonic curve. The variation in load degradation for successive cycles is shown in Figure 8. The plot shows the percentage of load degradation in each cycle from the monotonic curve at various displacements for panel W10 (monotonic) and W12 (cyclicldisplacement). Figure 7 graphically shows the effects that cyclic loading has on panels with respect to similar panels subjected to monotonic load only.
Figure 8 : Percentage Load Degradation from Monotonic Curve (BL) Specimens W10 and W12
There are two features of the test results which are worth highlighting. Both o c c d for the load controlled and displacement controlled regimes:
(i) Little degradation occurs during the cyclic regime at low loads/displacements. Figure 9 shows the displacements at varying percentages of ultimate load (derived from the monotonic test) for 1st to 4th cycles for specimen W6 (plywood and cyclicldisp control). It shows that for loads up to 0.5 of the peak load, little load degradation occurs during cyclic loading. The value of Pu was taken for both the positive and negative cycles. Similar trends were observed for other panels.

Figure 9 : Displacement a t Successive Cycles as a Ratio of Peak Load
(ii) The residual (ie the displacement at zero load) after each cycle is a function of the maximum displacement of that cycle. Table 4 shows the ratio of maximum displacement to residual displacement for specimens W2 and W5, each of which was tested with P21 end restraints and under cyclidoad control. The results show a reasonably constant ratio for all loading cycles up to peak load.
Max
Table 4 : Ratio Of Displacement To Residual Displacement 14
27.8 30.1 34.1 39.5 42.7
18.9 19.9 23.2 26.0 31.1
1.5 1.5 1.5 1 J 1.4
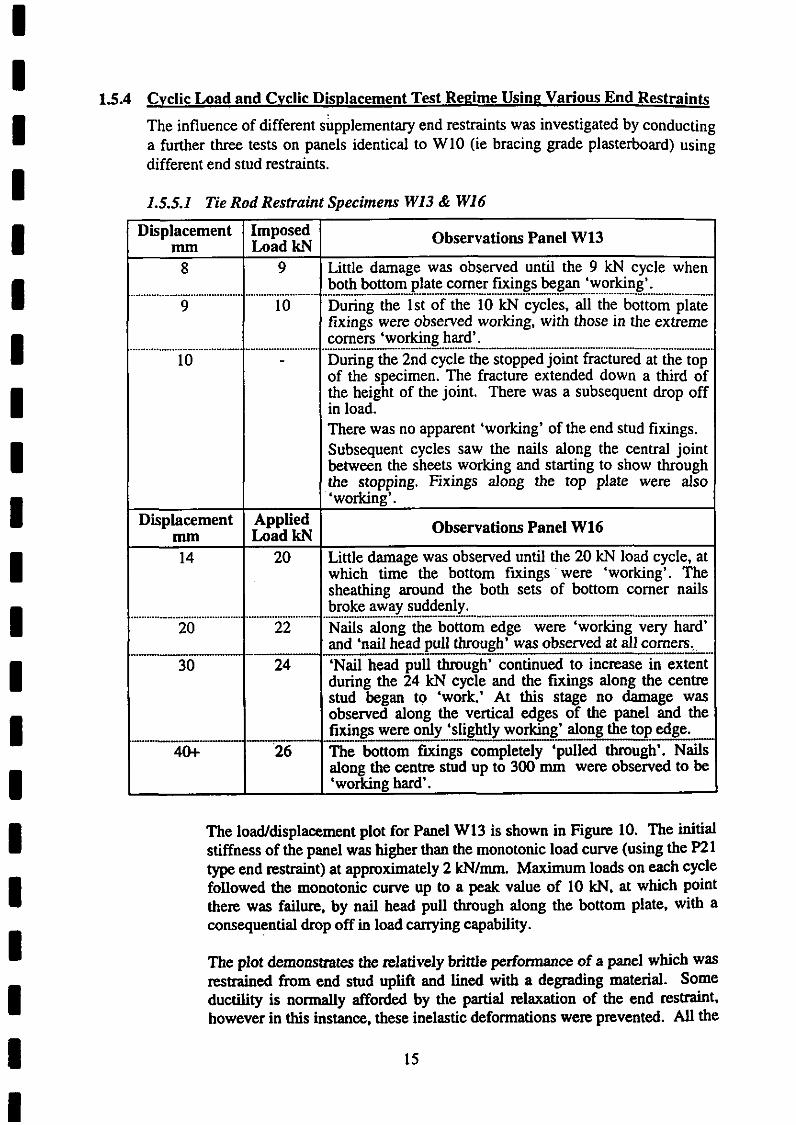
15.4 Cvclic Load and Cvclic Dis~lacement Test Reeime Usine Various End Restraints The influence of different s~pplementary end restraints was investigated by conducting a further three tests on panels identical to W10 (ie bracing grade plasterboard) using different end stud restraints.
1.5.5.1 Tie Rod Restraint Specimens W13 & W16 Displacement
mm 8 " ........................ 9
"
10
Displacement mm 14
......... ...................... 20
-. 30
-..----- 40+
.... .- ............ -
Applied Load kN
20
I
....
-
-
[mposed Load kN
9
10
corn&s 'working hard'. .
........ .................................................................................... During the 2nd cycle the stopped joint fractured at the top of the specimen. The fracture extended down a third of the height of the joint. There was a subsequent drop off in load. There was no apparent 'working' of the end stud fixings. Subsequent cycles saw the nails along the central joint between the sheets working and starting to show through the stopping. Fixings along the top plate were also 'working'.
Observations Panel W13
Little damage was observed until the 9 kN cycle when both bottom plate comer fucings began 'working'. .... - ........... During the 1st of the 10 kN cycles, all the bottom plate fixings were observed working, with those in the extreme
Observations Panel W16 --
Little damage was observed until the 20 kN load cycle, at which time the bottom fixings 'were 'working'. The sheathing around the both sets of bottom comer nails broke away suddenly.
" ....... " - - " - ....... Nails along the bottom edge were 'working very hard'
,- and 'nail head pull through' was observed at all comers.,, ---- ------
24 'Nail head oull throueh' continued to increase in extent
The load/displacement plot for Panel W13 is shown in Figure 10. The initial stiffness of the panel was higher than the monotonic load curve (using the P21 type end restraint) at approximately 2 kNImm. Maximum loads on each cycle followed the monotonic curve up to a peak value of 10 kN, at which point there was failure, by nail head pull through along the bottom plate, with a consequential drop off in load carrying capability.
-
- 26
The plot demonstrates the relatively brittle performance of a panel which was restrained from end stud uplift and lined with a degrading material. Some ductility is normally afforded by the partial relaxation of the end restraint. however in this instance. these inelastic deformations were prevented. All the
- -~~
during the i 4 kN cyde and the f ~ n g s along the centre stud began to 'work.' At this stage no damage was observed along the veaical edges of the panel and the fixings were only 'slightly - working' along the top edge. Theebottom fixings completely 'pulled through'. Nails along the centre stud up to 300 mm were observed to be 'working hard'.

load was taken through the sheeting fixings into the sheet which degraded rapidly and eventually exhibited a brittle type failure.
It would seem prudent when evaluating this type of panel to assume that it is an elastically responding element and assign it with a structural ductility factor of 1 in accordance with NZS 4203 (SNZ 1992). However, under the current P21 evaluation method (which assigns the on-set of inelastic behaviour to occur at a displacement at which half the maximum load occurs) (King & Lim 1991). specimen W13 would be rated with a yield displacement of approximately 3mm. As the maximum load was at a displacement of 12 -;;he ductility of the panel wouId be 1213 = 4.
Figure 10 : Hysteresis Loops for Panel W13 -Specimen with Tie-Down Rod Restraint
1.5.5.2 Vertical Load Used as Uplijt Restraint Specimen W14
Displacement mm
8
10
The load~displacement plot is shown in Rgure 11. Up to peak load, the hysteresis loops were similar to those using the tie down restraint. At the peak
16
Applied Load kN
9
50
Observations
There was little uplift of the end stud - approximately I mm at the 9 kN cycle.
-10
Bonom f h g s 'pulled through' the lining completely and the nails along the end studs were 'working very hard' up to 600 rnm from the bottom plate.
During the fmt excursion to 10 kN a majority of the furings along the bottom plate 'pulled through', however there was little drou off in load carrving cauacitv.

load however (=lo kN and 10 mm deflection) there was no drop off in load carrying capacity. Subsequent cycles were able to reach the nearly the same peak load even with large inelastic deformations. Peak loads of =lo kN were attained at top plate displacements of between 10 mm and 45 mm, producing stable 'fat' hysteresis loops. A single cycle at approximately 60 mm resulted in a drop off in resistance of around 20%.
Figure 11 : Hysteresis Plot for Specimen W14 - Vertically Loaded Top Plate
1.5.5.3 No Up&@ Restraint Specimen W15
Displacement mm
6
I - - reverse cycl&. 1 25 9 Seaaration of the bottom plate from the foundation
12
Applied Load kN
6
Initial stiffness was lower during the cyclic test than for the monotonic load regime. A peak load of just under 7 kN was attained, and with little reduction sustained over large displacements. Residual displacements were high when compared to other types of end restraint conditions.
Observations Panel W15
The bottom plate lifted approximately 3 mm from the
=7
I
- - foundation &am. The separation increased during the 8 kN cycle with the bottom plate only partially re-seated during 1 the
- -
~ ~ r e a s e d until the whole'of the bottom plate was 'floating' 10 mm above the foundation beam. There was no observable damage to the linings at the end of

1.5.5 Panel W17 nintel Swimen)
Displacement nun
Applied Load kN
5
8
.... .............. 8
Observations
During the 6 mm cycles fixings along the bottom plate were beginning to 'work'. A hairline crack appeared at both lintel joints on line with the outer stud. . .................. Bottom plate fixings began to 'pull through'. Crack widths at the lintels increased and extended the full depth of the lintel. ........................................ ... The lintel joints were observed to buckle out of plane and the stopped joint fractured at the junction with the panel sheathing line. There was approximately 10 mm bottom plate uplift and 3 mm separation between stud and bottom plate at end B of the panel. However at end A, the uplifts were 8 mm and zero respectively. The fixings along the top plate over the openings were 'working' but this was not observed to be occumng over the main body of the
The nature of the hysteresis loops produced in this test was consistent with the results obtained for panels tested using the standard P21 end restraints. A comparison was made between the uplift restraining force that could be attributed to the P21 end restraint and the effective restraint of the lintel.
............................. 7
Thurston (1993) found that there is a close relationship between the wall racking resistance, Pw, and rigid body rotation displacement. A w (determined by correcting the system deflection by the panel rotation) obtained during a P21 test. He plotted a number of test results and used best-fit curves matching techniques to develop a relationship between resistance and panel rigid body rotation. For a 1.8 rn long wall with no end straps the relationship was given by:
panel. ." " ......... ..... Both lintels buckled out of plane and remained so when the load was removed. The bottom plate was observed to have uplifted 20 mm at end B of the panel but not at all at end A. All the bottom plate fixings had 'pulled through' and fixings 300 mm up the end studs were 'working hard'. There was little drop off in load.
" " ........
This is plotted on Fig 1 1 for rigid body rotation displacements up to 30 mm.
7 The top plate fractured at the point where the metal strap diagonal brace was cut into that member (ie a notch type failure of the plate) and the test was terminated.

TOP Plate Dlspleament mm
Figure 12 : Predicted Monotonic Parent CUN~S - Panel W17
The predicted full restraint parent curve shown in Figure 12 was calculated using the theory published by Patton-Mallory and McCutcheon (1987). assuming a panel length of 1.8 m and that the panel was lined both sides with standard 9.5 mm Gib board. Nail slip curves used were those established by numerous past tests carried out at BRANZ. To this was addedthe parent curve as determined by Thurston (1993) of racking load and rigid body rotation displacement for a standard P21 end restraint with a 1.8 m long panel. The result is the predicted cyclic parent curve for a P21 test on a 1.8 m long panel of height 2.4 m. This curve can be compared to the parent curve of the first cycle of wall W17. (the lintel specimen) and shows the lintel restraint as being less than the P21 restraint.
The amount of restraint required to replicate the lintel can be determined as follows:
From Thurston (1993) the top plate horizontal deflection of say 10 mm due to rigid body rotation on a 1.8 m long panel, using a standard P21 restraint is caused by a racking load Pw of :
Pw = (8.7 x 10) l(1.3 + 10 O.") = 8.5 kN From simple statics this corresponds to an uplift force of the end stud
= 8.5 x 2.411.8 = 11.4 kN.
From a series of small scale tests (as described in Appendix A) the average uplift capacity of the P21 end restraint was found to be 6.5 kN.
:. The bottom plate contribution I foundation fixings = 11.4 - 6.5 kN = 4.9 kN
At the same displacement of 10 nun, the racking force on the lintel specimen is 6 kN i.e. an uplift force on the end stud of 6 x 2.4 I 1.8 = 8 kN.

The additional restraint required of the end stud over and above that afforded by the bottom plate to foundation fixings is therefore:
=8-4.9=3.1kh' 3.1 i.e. an equivalent of -x 3 (no. nails) = 1.4 nails 6.5
Therefore it is anticipated that a partial restraint of one or two 3.75 mm $ flat head nails would best represent the restraint at door openings. Further testing was carried out in Test Programme I1 to confirm the restraint required to simulate the lintel.
1.5.6. Description of Light Timber Frame Bracing Panel Hysteretic Behaviour Figure 7 shows the typical hysteretic behaviour of the lined panels. In the first part of the curve the lining fixings bend elastically and the nail shank crushes the lining material and timber. As the lateral shear load increases the nails deform plastically with the yield point being near the timberfining shear interface. As deformation continues, axial tension is established within the nail as the nail head bears against the external face of the sheathing. Partial withdrawal of the fixing typically results provided the compressive strength of the lining is sufficient. Alternatively the lining may crush beneath the fastener head. Up until this point, the system is largely elastic and full deformation recovery is usually experienced upon load removal.
With the application of further panel deformation, the nail curvature increases and to maintain nail headkhank geometry, either the nail head becomes embedded into the lining material and /or the fasteners withdraw further from the timber frame. The third possibility of the tension yielding of the fixing is very rare and can be disregarded.
From the onset of inelastic behaviour, when the load is reduced the gradient of the unloading curve is generally similar to that of the initial loading curve.
At zero load there is a residual displacement due to inelastic deformations at the fixings. Loading in the negative direction produces similar hysteresis loops.
During the next cycle to the same displacement, the nail shank is unsupported due to the previous crushing of the lining and timber. Hence the load is resisted by the cantilever action of the nail, with the support point of the nail being at the intersection with the uncrushed timber.
When the panel displacement approaches the previous cycle displacement the nail shank once again becomes supported by the crushed material and there is a corresponding strength and stiffness increase. However, the maximum load on the second cycle does not reach the maximum load of the first.
Subsequent cycles show that the hysteresis curve follows that of the second cycle, with little stiffness degradation. Once displacements reach that of previous cycles the nail shank again bears onto the uncnrshed material and there is an increase in strength and stiffness. There is also additional nail withdrawal from the timber. Load increase occurs up to approximately the parent monotonic curve.

Note that no nail withdrawal was observed for Plasterboard (PB), Fibrecement board (FC) or Braceline (BL) linings.
1.6 Conclusions to Experimental Programme Phase I
The on-set of damage to timber bracing panels lined with degrading sheets can be identified by subjecting test specimens to increasing cyclic displacements.
There is no significant difference in either the maximum lateral resistance or in the related maximum reliable displacement to which a specimen can attain by adopting a load controlled or displacement controlled load regime.
Degradation of test specimens is minimal under cyclic loading to loads up to 0.4 of peak load.
The boundary restraint of a bracing panel which is taped and stopped and which terminates at a return wall can be conservatively replicated by a 12 kN hold down.
The restraint afforded to a bracing panel terminating at a door opening is less than the current P21 method (King & Lim 1991). It is anticipated that a partial restraint equivalent to 3 kN would be more appropriate.
The Serviceability Limit State (i.e. the onset of cracking) in the lintel specimen was observed as occurring at a top lateral displacement of 6 mm.
The ratio of residual displacement after each cycle to the maximum displacement of that cycle is reasonably constant up to peak load.
2. EXPERIMENTAL PROGRAMME PHASE I1
Test Programme I indicated that the restraint afforded by door lintels is significantly lower than the P21 end restraint. Further tests were carried out in Phase I1 to ascertain the extent of this reduction o b s e ~ e d in Phase I.
The degree of restraint afforded by taped and stopped wall junctions was also to be greater than that provided by the standard P21 end restraint. A 2.4 m long panel (W24) was tested using additional end stud restraint to simulate this condition and assess its significance.
The results for specimen W24 were eventually added to the results from W17 (lintel specimen) and compared to an equivalent long wall tested by Thurston (1993).
All panels were tested in accordance with the revised test regime described in Section 2.3.

2.1 Objective
This experimental programme was designed to:
0 Detennine the effect that different lining materials and panel lengths had on the panel resistance rating using P21 end restraint and tie down rods.
0 Determine whether the proposed method of simulating in-service boundary conditions was valid for door openings andtor wall junctions.
2.2 Description of Test Specimens
The panel configurations studied are shown in Table 5.
Panel
W19 W20 W 2 1
Table 5 : Test Specimen Configuration
Lining
W22 W23 W24
PB + PB denotes a panel tined both sides with plisterboard etc. I. Standard PZ1 restraint plus a 25 x 1 mm galv. stccl ShZp used at each end. 2. Smdard PZI restraint one end. Only 1 No. 100 x 4 FH nail other end. 3. Standard PZI restraint o m end. I2 kN end restraint other end.
Restraint I Length W18 BL 1 P2 1
BL PY PY
Frame construction and test set-up was as for Phase I and described in section 0. Nailing patterns for the different lining materials was identical to those used in Phase I for each sheathing type.
1.2 m
PB + BL* PB + PB* PB + PB*
Panel W22 had two galvanised steel uplift restraining straps fixed to each end stud and to the foundation beam using six 30 x 2.5 nails to both the stud and foundation beam.
Tie Rod P2 1
Tie Rod
Panel W23 had a 25 x 1 mm (nominal) galvaaised high tensile steel strap to form a diagonal brace within the main body of the specimen. A comparison could then be made of the observations and results with those of the (isolated) lintel specimen (Panel W17) and the panel tested by Thurston (1993) both of which had a diagonal brace.
1.2 m 1.2 m 1.2 m
P21' P212 P213
1.2 m 1.8 m 2.4 m

2.3 Displacement Protocol
The following loading regime was adopted:
Table 6 : Test Load Regime for Test Programme II
Displacement f 8 m m f 15 mm i 20 nun i 2 5 m m
f 5 mm increments
2.4 Observations
No. of cycles 4 3 3 3 3
2.4.1 General The lining commonly experienced local distortions at the fastener as the imposed displacement increased. The zone of greatest distortion was generally along the bottom plate, particularly at the extreme comers during initial cycles, but progressing along the full extent of the bottom plate and eventually along each end stud.
In the following section the term "nails working" or "working ha rd (when distortions were more severe) are used to describe the observation that the nail heads were embedding into the lining material. If a nail head pulled through the sheet, this is referred to as "nail head pull through".
The following observations were made at the corresponding horizontal top plate' displacements. The general description of displacement relates to the horizontal top plate displacement.
The ends of the specimen described as end A or B are shown in E~gure 1.
2.4.2 Panel W18 - BL with P21 Restraint
@ Displacement mm 15 20
30
35
Observations
Bottom comer nails began 'working hard'. During the 1st cycle comer nails began to 'pull-through'. All bottom f d n g s were 'working'. Each tension stud uplift approx 5 mm above foundation. Bottom fixings 'working hard'. 'Nail head pull through' of bottom corner fixings. Top fixings 'working'. 'Nail head pull through' of bottom fixings.

2.4.3 Panel W19 - BL with Tie Down Rod Restraint
@ Displacement Observations
Damage to bottom fixings were similar to Panel W18. TG fixings experienced the same extent of damage as the bottom fixings. -.-.- " ............ - ....... " "
End stud fixings began "working hard'. ............ "
Virtually all the top and bottom fixings experienced 'nail head pull through'. ........................................................... "
End stud fixings experienced 'nail head pull through' for a 1 length of appro; 406 mm from top and bottom plat& Studs experienced significant minor axis flexural deformation.
Comments Hysteresis loops produced for these panels were very similar. Peak loads resisted were both just under 6 W at approximately the same displacement of 25 mm. The degradation in load carrying capacity on the 4th cycle was also very similar.
Panel W18 showed some asymmetric performance with the pull cycle being somewhat weaker (ie a peak of 4 kN) than in the push direction.
Maximum reliable displacements for the two panels were both determined to be 25 mm. Initial stiffnesses were 0.8 and 0.6 WImm for W18 and W19 respectively.
2.4.4 Panel W20 - PY with P21 Restraint
@ Displacement Observations
Bottom comer fixings beean 'workine'. Bottom plate at end A split at the junction with the nails into the foundation beam, approx 75 mm from the end of the plate. The split extended to the end of the plate. - All of the bottom fixings and 300 mm up each end stud were - - 'working'. Bottom plate split at end B in a similar manner to that which occurred at end A. The bottom plate extreme comer nails had noticeably withdrawn. Stud uplift was measured at 8 mm. Bottom plate nails over 300 mm from each end showed withdrawal. Futher splitting of the bottom plate was apparent

2.4.5 Panel W21- PY with Tie Down Rod Restraint
@ Displacement mm
Comments
-
Observations
Observations were generally the same as those for panel W 20.
" ................................ 45
55
Both tested panels produce symmetrical hysteresis loops. Peak load for W21 (7.5 kN @ 35 mm) was significantly higher than for W20 (5.5 kN @ 35 mm) indicating that the full tie- down situation is certainly not a lower bound condition.
Fixings along the top plate behaved in a similar manner to bottom plate fhngs throughout the test. -. .... .......................................................................... By the 45 mm cycles the end studs were observed to be experiencing minor axis flexural deformation, similar to that experienced by Panel W19.
" - " " ............................................. On the 55 mm cycles virtually all of the top and bottom plate fixings experienced 'nail head pull through'.
Maximum reliable displacements were determined to be 35 mm for both panels, (cf 25 mm for panels W18 and W19). Initial stiffnesses for the two panels was 0.5 kNImm and 0.4 kNImm respectively.

2.4.6 Panel W22 - PB + BL with end Straps. P21 Restraint
@ Displacement mm
Observations
Bottom comer fixings to PB lining began 'working'. ," " " - ...................................................................................... Bottom comer fixings to BL lining began 'working'. ..... ________.______.x_I______________._......________.______.x_I______________._......________.______.x_I______________._..... "
All of the bottom fixings and 300 mm up each end stud were 'working'. The foundation beam was observed to be lifting from the test rig at end B. This was due to insufficient hold down of the foundation beam to the rig at this point. The uplift was measured as 7 mm on the 30 mm cycle. . " ..... " ........-.... - Bottom comer fixings on both sides were 'working hard'. . "" .- .............................................................. All bottom comer fixings and bottom fixii.2~ to the PB lining experienced 'nail head pull through'. The remainder of the bottom fmings to the BL were 'working very hard'. ~a rnage to the bottom plate fixings was severe, with the first three fixings away from each comer having pulled through on both sides with the remainder free to move within 'slots'' formed in both linings, stud uplift was approx 6 mm. .................. ..... . " .- " " " "
The bottom plate split at the junction with the hold down straps and the nails to straps began to withdraw. Hold down straps also beean to buckle under com~ression load.
Comments The maximum reliable displacement of panel W22 was the greatest recorded for any of the tests undertaken, at 50 mm. This amply demonstrates the greater displacement capacity of shorter length panels when adequately tied to the foundations.
There was a highly asymmetric result due in part to uplift of the foundation beam at end B as noted in the observations. However this would have had little effect on the hysteresis loops produced for loads applied in the push direction.
. .

Figure 13 : Hysteresis plots for Spedmens W18-W23
27

2.4.7 Panel W23 - PB Both Sides with P21 Restraint One End and Minimal Restraint the Other
@ Displacement mm
8
Observations I Bottom comer fixings began 'working'. .......... . Bottom comer fixings experienced 'nail head pull through'. A split in the bottom plate was observed at the junction with the diagonal strap. ........ " - " .... The remainder of the bottom fixings were 'working hard'. The end studs were observed to be lifting approx 12 mm from the bottom plate. Racking loads were lower than anticipated and a second 100 x 3.75 FH nail was added to the restraint at end A - making a total of two nails at this end. --------- Bottom plate fixings began to experience 'nail head pull through'. Stud uplift was observed to be 25 rnrn at end A and 12 mm at end B. Fixings along each end stud began to 'work hard'. . ---- All bottom plate fixing experienced 'nail head pull through'. No damage to the top plate fixings were observed.
Comments The panel exhibited an asymmetric performance due to the different end restraints used. Peak load was not as high as predicted due to splitting of the bottom plate at 8 mm cycles. The peak load on the push cycle. 4.2 kN @ 25 mm (with 1 No. nail restraint) was considerably lower than for the pull cycle, 8 kN @ 40 rum.
An additional nail was added for the 30 mm and subsequent cycles. The effect of this can be seen in the 'step up' in the parent curve at those cycles. The peak loads reached on the push cycle were still less than the pull after the addition of the nail.

2.4.8 Panel W24 - PB Both Sides with P21 Restraint One End and 12 kN Restraint the Other
Comments
@ Displacement mm
8
The results showed a symmetric performance although end A was restrained by six nails.
Observations
Bottom comer fixings began 'working hard'.
From section 0 it can be seen that the uplift restraint provided by the standard P21 end restraint on a 2.4 m long panel together with bottom plate nailing was 14.1 kN. This is somewhat lower than the uplift attained in the testing of panel W24 which was approximately 17 kN on a similar boundary restraint. The initial stiffness, k of the panel in the push d i i t i o n was 3 kNlmm.
Figure 14 : Hysteresis Loop for Specimen W24
........ " " "." 15 All fixings along the bottom plate were 'working hard'. There
was approximately 8 mm uplift at end A (additional restrained end) and 12 mm at end B.
" "
25 Top plate fixings began 'working'. End stud uplift at end A was measured as 6 mm between bottom plate and foundation and 6 mm between bottom plate and stud. The corresponding uplift at end B being 16 mm and 1 mm. -
30
.... "
The top plate was observed to be moving independently of the frame, with the top plate displacing approx 10 mm more than the top of the end studs. ie the top platelstud nail shear resistance markedly diminished. .... . " - .- """ - " .....
35 The top plate split at the junction with the diagonal brace.

2.5 Summary of Performance Evaluation of Phase 11 Systems
The results from each panel were analysed using the draft evaluation procedure outlined in Volume 1 Appendix A of this report to ascertain the mass in each case which could be dependably supported by each respective wall bracing panel.
The seismic mass rating procedure outlined in section 3.2 was completed for Test Programme II specimens and the results are shown in Table 7, using the NZA ixtificial earthquake record at 5% damping.
Panel
- --
W18
EL + P21 Restraint
W19
EL + Tie Rod
w20
P Y +
P21 Restraint
W21
P Y +
Tie Rod
W22
PB+BL
P21 Restraint
w23
PB+PB
P2I Restraint
w24 Push Cycle
Sp. Disp. mm
Table 7 : Restrained Masses for Specimens W18-W24
30
Stiffness K
WImm
Period T secs.
Restrained Seismic Mass
kflanel

2.6 Comparison of Individual Test Panel Results with Previous Work
Thurston (1993) canied out a series of racking tests on long walls with various window and door openings. He concluded that the actual resistance provided by a bracing panel which terminates at a door opening may be significantly less than those determined by tests when the current P21 end restraint is used (King & Lim 1991). Conversely panels which terminate at a return wall actually experience full hold down restraint.
It is shown in section four that panels which are fully taped and stopped at a return wall have greater restraint than the P21 end restraint and that for timber framed walls on timber foundations this can be replicated by using a 12 kN restraint.
A 2.4 m panel (W24) was tested which had an equivalent 12 kN hold down applied to one of the end studs and the results together with the results of the Lintel Panel (W 17) were combined and compared to one of the composite long walls tested by Thurston. (The individual panels W24 and W17 constitute the individual panels which when combined made up Long Wall No. 5 as tested by Thurston).
The Parent curves are shown in Figure 15. When the parent curves of panels W 17 and 24 were added together on the push cycle [5] they compared well with the parent curve of the long wall [I]. Parent curves on the pull cycle however grossly over estimated the actual long wall response observed by Thurston (curves 1 versus curve 6). While the lintel response (W17) was symmetric, the degree of restraint provided by the standard P21 restraint (W24) appears considerably in excess of that actually provided by a free ended panel adjacent to the door.
Figure 15 : Comparison of Parent Curves for Lintel and Long Walls A further comparison was made beheen the long wall qnd individual wall components using the draft evaluation procedure (Volume 1 Appendix A). The 10% wall test hysteresis loops (push cycle only) were matched using the draft analysis procedure pmcribed by Phylmas and the restrainable mass at various displacement demands calculated. The results were compared to these obtained on the two

individual panels using the same procedure. Again the earthquake record used was the NZA artificial record and damping was assumed at 5%. The results are given in Table 8. The maximum reliable displacement for the long wall and for Panel W24 were both assessed as 20 mm.
The restrainable mass at displacements greater than the maximum reliable displacement are shown in italics for comparison only.
Thurston Long Wall Mass restrained by Individual Components
Table 8 : Comparison of Restrained Mass for Long Wall Panel
2.7 Conclusions From the Phase 11 Experimental Programme
Panel W24 and Panel W17 (which panels combined to match the composite long wall previously tested by Thurston) were tested in isolation. The addition of the parent curves of these two panels showed good agreement with the parent curve of the long wall. The seismic mass evaluated for Panels W17 and W24 when combined was similar to that of the long wall.
Sp. Disp. min.
10 .- ". 20 30 40 50
The restraint afforded to a bracing panel by a standard door lintel, and without vertical load, is approximately 3 kN, ie half of that used in the current P21 test procedure.
Mass kg
3625 -. 6024. 7700 9240 .- -. I1370
The reliable maximum displacement of short bracing panels was greater than for similar panels of longer length provided reliable end restraints can be assured.
Period T sec. .17 .- .21 .... " "
24 27 29
The reliable maximum displacement of short panels having the same lining were similar for both the standard P21 restraint and the tie down rod restraint. The specimen with plywood lining had the greatest displacement capacity.
W24 kg
2460 .... 4190 ..... 5533 7100 81 60
Stiffness K W m m
5.2 ... "
-
W17 kg
1150 1880 ..-.---.-........-a 2400 2 770 3400
Total kg
3610 .......... 6070 7930
"
9870 I1565

3. EVALUATION PROCEDURE USED TO DETERMINE THE DEPENDABLE SEISMIC MASS RESTRAINED
3.1 Introduction The determination of earthquake design actions is covered by Part 4 of NZS 4203 "General Structural Design Requirements and Design Loadings for Buildings" (SNZ.1992). Equivalent-static, modal and integrated time history analysis techniques are all permitted. The equivalent-static design procedure is the most common and easily applied. It is the permitted default for structures less than 15 m in height or when the fundamental response period is less than 0.45 seconds. All structures within the scope of N2.S 3604: 1990 (SAW 1990) are therefore eligible to be designed using this technique. The approach requires a lateral force coefficient to be derived for the appropriate ground conditions (three response spectra being published for Rock or very stiff soils, for Intermediate soils and for Soft soils). Each spectra is truncated at 0.45 seconds, although the unmodified elastic response is provided in each case to pennit matching for higher mode response effects to be considered. The elastic spectra were derived for a single mass oscillator with 5% critical damping. The inelastic response spectra were derived assuming an elasto-plastic post elastic responding element with equal energy principles beiig applied over the short period range and equal displacement principle over the long period range (>0.7 seconds).
While the assumed bilinear elasto-plastic post elastic response may be appropriate for many structural materials (eg. well designed reinforced concrete and steel), they are manifestly inappropriate for systems which experience ~ i ~ c a n t degradation during postelastic excitation. Wall bracing systems used in timber framed buildings are one such degrading system. An alternative model is thus required to represent the inelastic response of these and other systems, which develop slackness. Although the option remains to design such systems to remain elastic at all load levels, this is unrealistic both with regard the cost and real field response. Dowrick (1977) proposed that, provided such systems are designed to ensure they have sufficient inelastic deformation capacity, then collapse mechanisms can be avoided and satisfactory ultimate limit state performance assured. This is consistent with the generally good performance of such systems in the field. (Moss 1992; King 1990; Pender 1987; Cooney 1979).
The essential feature of the evaluation procedure proposed is that the response observed during the experimental phase is matched electronically. The electronic equivalent element then becomes the core of a non-linear time history analysis (Clough and Penzien 1975) using the design spectra from NZS 4203 as the input record. Each period on the resulting response spectra for that element is related to the mass restrained and the elastic spring stiffness of the system. The mass varies with the square of the period. Thus by limiting the mass supported by the structure such that the system displacement does not exceed that which was shown (during the experimental phase) not to induce unacceptable strength loss, then reliable system performance can be assured.

Several researchers have attempted such simulations in the past (Foschi 1977; Stewart 1987; Dolan 1991; Foliente 1993; Dean 1996). Each developed or adopted models which replicated the observed degrading characteristics of the system under consideration. The problem with each was the inability to easily input the elemental parameters to get an adequate response match. Dean (1994) proposed a spring-bar model which provided an encouraging match but suffer the same cumbersome user interface problems previously experienced. This was further refined by Deam (1994) utilising the Microsoft Windows environment to develop a purpose made computer simulation procedure. Phylmas cinched %steretic b o p Matching and Analysis System) which enables visual matching of the electronic model to that observed experimentally. This approach forms the engine used to undertake the time-history analysis used to generate the displacement response spectra and thence the determination of the maximum lateral mass which can be sustained by the system without exceeding the maximum reliable displacement.
3.2 Seismic Mass Rating Procedure
The following procedure was carried out using the Phylmas programme in determining the seismic mass rating for each of the panels tested.
(i) The hysteresis loops produced by the test specimen were matched by adjusting the ten generating parameters within the programme.
(i) A time history analysis was carried out using each of the following earthquake records (all with 5% damping) and the acceleration and displacement spectra were produced for each using the BRANZ PhylMas software; The analysis methodology isfully described in BRANZ Study Report SR73 - Seismic ratings for Residential Timber Buildings @ e m 1996).
(a) An artificial earthquake record NZA was derived by conversion of the design acceleration spectra published in NZS 4203: 1992 (SNZ 1992) from the frequency domain into the time domain.
(b) The NS component of the 1940 El-Centro earthquake - representative of the acceleration levels found in many of the worlds seismic codes.
(c) The NS component of the 1977 Bucharest earthquake - representative of a 'soft soil' with relatively large spectral accelerations and displacements in the one to two second period range.
(iii) The maximum reliable displacement at which reliable performance can be assured by observation of the test was plotted on the displacement spectra and the natural period T corresponding to this value found.
(iv) The maximum reliable displacement is the displacement to which the specimen can be cyclically loaded prior to the successive fourth cycle dropping to less than 80 % of the d m u m recorded cycle.
(v) The mass M, able to be restrained by the panel was calculated from the natural period T using the stiffness parameter used in matching the hysteresis loops.

The maximum force and displacement for linear elements subjected to dynamic excitation can be shown (Clough and Penzien 1975) to be a function of the natural period T, which for an elastic element is related to the stiffness k of the element and the restrained mass m by
The relationship is normally applied to non-linear elements for convenience even though the period of oscillation varies when there is degradation of the element. The initial stiffness is normally used to estimate k with non-linear elements.
Re-arranging equation ( I )
If Mass M is in Kg, T in secs and k in kNImm
then M = 25300 k~~ (2)
3.3 Results of Phylmas Analysis for Test Programme I
3.3.1 .P21 Restraint . Displacement spectra for tests carried out using the standard P21 end restraint are
shown in Figure 16 for specimen W12. The spectra were typical.
w
r n ' .
m .
---0Mm
rn"
0. : 0.1 012 034 O.W a10 01 027 0 1 4 OZ@ 0.28 01) Op eY Og 0 4
p.ll0dTs.m
Figure 16 : Displacement Spectra. Specimen W12
Generally the lower bound earthquake record (ie. the record which resulted in the lowest Period T and hence the lowest mass able to be restrained) was the artificial NZA record. This was true for all cases from Period T = 0 secs to approximately T = 0.35 secs when the lower bound earthquake record became the Bucharest 1977
35

earthquake record. This is not unexpected due to the latter earthquake record being representative of a soft soil site with large spectral accelerations and displacements within the one to two second range.
There was little difference between spectral displacements for earthquake records of Bucharest 1977 and El Centro 1940 up to periods of 0.2 secs.
The validity of results of the time histojanalysis is dependent upon the characteristics of the earthquake record used. NZS 4203 requires scaling over the period range of interest such that the records match theresponse spectra of individual events to the uniform risk design spectra. At least three different earthquake records are to be used to provide a representative result.
Spectral accelerations for each of the earthquake records were similar with periods greater than 0.2 secs. Shorter periods showed typically an increase in spectral accelerations for the NZA earthquake record.
3.3.2 NZA Earthquake Record - A Comparison of Swctra The control earthquake record for all the cyclidoad control tests undertaken using the P21 end restraint was the NZA artificial record.
A comparison of the spectral displacements is given in Figure 16 for specimen W12, and a comparison of mass able to be restrained for each lining-using equation (2) at varying reliable displacements is given in Table 9.
The corresponding spectral acceleration and (hence) force is shown for completeness. The initial stiffness k is taken from the appropriate Phylmas generating Parameter.
Table 9 : Comparison of Mass Restrained using P21 End Restraint
36

Note that the masses are those that will cause a panel to displace to the given spectral displacements when subjected ro the NZ4 earthquake. The ability of one lining to undergo larger deformations whilst still resisting load will be reflected in its reliable maximum displacement.
3.3.3 Displacement and Acceleration spectra using various restraints Displacement and acceleration spectra were produced for Test PaneIs W12-W15 using the NZA earthquake. record and the mass able t o be restrained by the panels determined. The results are shown in Table 10. The stiffness k shown in Table 10 is the initial stiffness parameter taken from the Phylmas generating parameter derived at the response matching phase of the Phylmas process.
It can be seen from Table 10 that the mass laterally restrained by the panels using the P21 end restraint is greater than for the corresponding spectral displacements for the tie down rod restraint system. The case which used a vertical load applied to the top plate restrained the greater lateral mass at the lower spectral displacement but was most closely represented by the P21 end restraint condition for displacements up to 40mm.
Load)
W15 (unre-
strained)
The unrestrained condition results were always significantly lower than for the other tested panels.
Figure 17 shows the relationship between mass restrained and displacements for each of the end restraint conditions at displacements of 10.20.30.40 and 50 mm.
Table 10 : Comparison Of Mass Restrained using Various End Restraints
40 10 20 30 40
1.6
0.33 0.18 0.23 0.25 0.27
4410 1310 2140 2530 2950
0.22 0.49 0.31 0.27 0.24
9.5 6.3 6.5 6.7 6.9

Note that the masses restrained by the specimen, when subjected to an earthquake record (in this instance the NZA artificial Earthquake record) will displace the specimen to the appropriate spectral displacement. For this purpose the maximum reliable displacements (MRD) have been ignored, hence displacements are shown which are in excess of the MRD.
Figure 17 : Mass Restrained using Various End Restraints
3.3.4 Panel W16 - BL Lined Both Sides, Tie Down Rod Restraint Panel W16 was tested with full restraint of both end studs using the tie down rod system. The test was carried out to investigate the effects of lining a similar panel with the same material on both sides. A comparison could therefore be made with Panel W13. A plot of mass restrained against reliable displacement is shown in Figure 18. The initial stiffness k, of Panel W13 was 2 kN1mm whilst that of Panel W16 was 3.8 kNImm. Also plotted in Figure 18 is the mass restrained by Panel W13 factored by 1.4.
As part of the background to this study report the fleet of initial stmess on mass restrained using the Phylmas programme has been investigated One key finding, as might be expected, is that the dependably restrained mass increases with panel stiffness. However, since the panel stiffness is not directly proportional to the panel length, so the dependable restrained lateral mass departs slightly from being linear with panel length. (e.g. Ratio of panels lengths = 2.0 resulting in ratio of restrained mass of 1.9.)
3.35 Panel W17 - Lintel Specimen Displacement and acceleration spectra were produced for the three earthquake records and the lower bound earthquake was found to be the NZA artificial record.

The mass which is able to be restrained by the panel under various reliable maximum displacements was determined and used in the comparison of a long wall tested by Thurston (1993). Refer to section 2.7 for further details.
Figure 18 : Mass Restrained by Specimens W13 and W16
DISCUSSION
Boundary Conditions
The seismic mass which a test panel is able to restrain is dependent upon (amongst other things), the initial panel stiffness and the maximum reliable displacement. Both of these are d M y affected by the degree of end restraint used to simulate in-service boundary conditions.
The end restraint adopted for the test specimen therefore has a major significance in determining this mass.
The current BRANZ P21 test method specifies that 'appropriate panel end restraint is to be applied'. It gives as an example 'for framed timber, the "P21 end restraint" may be used'. The 'P21 end restraint' referred to is shown in Figure 3 (i.e. an end block nailed to the outer stud with 3 No. 100 x 3.75 flat head nails acting in shear.) This is deemed to be equivalent to the restraint provided to an independent bracing panel when in service (ie as provided by a return wall with cross wall, or by a door or window lintel). implicit in the method adopted is that the neturn cross walls are restrained from lifting at loads less than the capacity of the three nails in shear.
In most instances however this method either under or over restrains the specimen for typical cases as described below. As well it does not identify the possible brittle failure of a panel which has sufficient strength to overcome the three nail shear strength by comer gusset action. In this instance the 'ductility' of the specimen could be d attributable to the end restraint rather than the lining material.
39

4.1.1 Ualift Restraint Attributable to Current P21(1991) End Restraint Thurston (1993) evaluated the performance of several test results of P21 tests with P21 type end restraints to establish a relationship between wall racking load, Pw, and wall rocking displacement, A,. The equations he derived for the curves which most closely fitted the results were:
1.2 m long panel P, = (5.6 x A ,) 1 (3 + A, 0.95) (3) 1.8mlongpanel P , = ( 8 . 7 x A , ) 1 ( 1 . 3 + ~ , ~ ' ~ ~ ) (4) 2.4 m long panel P, = (12.5 A ,) l(1.2 + A, 0.95) (5) 3.0 m long panel P, = (20 x A ,) 1 (0.4 + A, 0.95) (6)
At 30 mm lateral deflection the wall racking loads are Pw = 5.9 kN, 9.8 kN, 14.1 kN and 23.3 kN for equations (3) to (6) respectively which corresponds to end stud uplift forces of 11.9 kN, 13 kN, 14.1 kN and 18.6 kN.
The increase in uplift force with wall length can be amibuted to the effect of nailing of the bottom plate to the foundation beam.
Small scale tests were carried out to determine the uplift capacities of the 'P21 end restraint', the bottom plate to foundation beam and end stud to bottom plate connections. These are described in Appendix A. The results showed an average uplift resistance of 6.5 kN for the P21 end restraint.
Taking this test result of 6.5 kN and subtracting from the end stud u p l i force derived from equations (3) to (6) gives the effect of uplift restraint by the nailing of the bottom plate to foundation for each panel length:
1.2 m panel = 11.9 - 6.5 = 5.4 kN 1.8 m panel = 13.0 - 6.5 = 6.5 kN 2.4 rn panel = 14.1 - 6.5 = 7.6 kN 3.0 rn panel = 18.6 - 6.5 = 12.1 kN
The uplift restraint of the 2.4 m panel compared well to the maximum uplift load of 7 kN attained in specimen W15 which had no end restraints. This showed that the uplift restraint afford4 by the P21 end restraint became less dominant with panel lengths greater than 1.8 m.
The lateral shear load t r a n s f e d across the bottom plate/foundation beam c o ~ e c t i o n was determined analytically as Wig the top plate lateral load, P, divided by the number of nails. However several of the nails in the tension zone either reached or approached their withdrawal capacity. If the lateral load carrying capacity of these was zero or reduced then the lateral forcdnail is approximately as shown in Table 11. There will be some contribution to lateral resistance by the frictional component between the bottom plate and the foundation at the compression end, however this has been ignored in this simplifed analysis.

Table 11 : Lateral Force per Bottom Plate Fixing
The ultimate strength of a 3.75 rnm diameter nail in single shear, from tests described earlier is 2.17 W, which suggests that panels of lengths in excess of 2.4 m are governed by the lateral load capacity of the bottom platelfoundation nail connection rather than the P21 end restraint. This is confirmed by Thurston (1993) who plotted the predicted parent curves using full and partial (P21 end) restraint for various wall lengths. He concluded that single lined walls 3 m in length behave in a similar manner for both a fully restrained condition and the P21 end restraint. For walls less than 3 m in length the 'P21 end restraint' effectively governs the wall racking resistance.
- lateral loadhail
kN 1.5 ...... " 1.6 ........................................................ 2.0
Nail slip curves conducted over several years show the maximum lateral forcelnail in gypsum plasterboard under cyclic load to be approximately 0.35 kN. If this is translated to a typical 2.4 m x 2.4 m test panel with nail spacing at 150 rnm then maximum u~ l i f t shear transferred to the end stud can be calculated as the load per nail
No. of effective nails
4 6 7
Panel length m 1.2 1.8 ....................................................... 2.4
. (:: + 1) 2 sides = 12 W). This is times the number of nails present (i.e. 0.35 W -
Max lateral load P, kN
5.9 " " .- ........ 9.8 ........ 14.1
equivalent to the maximum uplift assessed from the P21 end restraint, with the bottom plate nail fixings taken into consideration and as obtained in equation (5). Thus the current P21 (1991) test procedure is optimum foi predicting the strength of plasterboard panels whilst down rating panels lined with stiffer, stronger material.
In-service Boundary Conditions
In order to obtain a realistic bracing rating resistance of a panel experimentally it is important that the boundaty conditions used to restrain the panel in the laboratory replicate those that will be found in-service as closely as practical.
Internal Bracine Panel I External Wall Junction
The current (1991) method of end restraint represents the minimum restraint provided by nailing the end stud to the return wall framing. However it does not represent the majority of wall junctions which are, for internal b r a d walls, usually lined and stopped at the comers, and it makes no allowance for the more direct load path between the lining of the bracing panel and the return wall. The typical wall junction is shown in Figure 19 : Typical Wall Junction

T-junction Corner
Figure 19 : Typical Wall Junction
4.2.1.1 Stopped Corner Joints The shear transfer capacity of plasterboard joints which have been taped and stopped has been measured and found to be in the order of 8 kN/m (Thurston 1993). The uplift loads associated with typical bracing panels therefore can easily be transferred to the return wall linings. The uplift force in the panel lining is transferred into the timber studs by a combination of the end brace panel stud nail fasteners and the return wall fasteners.
Nail fasteners in the end stud of the brace wall are subject to load both perpendicular and parallel to the end stud framing.
Refemng to Figure 19 it has been found that resistance to uplift of the end stud depends upon:
(1) The load carrying capacity of the nail fasteners connecting the bottom plate to the foundation, and the return wall length.
(2) The nail slip characteristics of the lining in the bracing panel, both perpendicular and parallel to the stud.
(3) The nail slip characteristics of the lining in the return wall parallel to the stud only. This can be determined by small scale testing. The minimum strength joint (ie standard plasterboard lining fixed to the studs using clouts at 300 mm centres) has been found to have a typical nail shear capacity of 0.38 kN for shear applied parallel to the paper bound edge. With nails at 300 mm centres, this results in an uplift capacity contribution of 0.38 kN x (2400B00 + 1) = 3.4 kN. In reality this may be doubled (or more) when the return joint is plastered with uplift forces being passed to the adjacent return panel (refer (5) below).

(4) The stud to bottom plate connection assumed in section 0 to be 5.4 kN for a 1.2 m long panel. Small scale testing, described in Appendix A, showed the uplift capacity of a pair of 4 mm by 100 mm nails to be 3.8 kN with an additional 50% resulting from uplift of adjacent interconnected panels. (Note that additional restraint afforded by any vertical load on the external wall has been ignored.)
(5) The shear capacity of the lining joint shear capacity found to be approximately 8 kNIm or 19 kN for a 2.4 m high wall. Such shear transfer is usually subservient to the shear capacity between the sheathing of the adjacent wall and its framing (refer (2) above).
(6) The extent that the uplifting end stud is connected to the framing of the adjacent return wall (represented in the experimental specimen by the supplementary P21 (1991) end stud uplift restraint shown in figure 3). Small scale testing indicates this restraint to be approximately 6.5 kN (refer Appendix A).
NZS 3604 1990 places no limit on the uplift force which may be imposed on the foundation/floor connections at bracing panels. Similarly the current practice when testing is to assume full foundation beam holddown is achieved. This is a deficiency of the current system that this revision is attempting to remedy. Appendix B shows that this is excessive for timber framed foundations and a more suitable limit would be 12 kN.
Ideally tests undertaken to determine bracing rating should include the lining joints and return wall to best simulate the in-service condition. However this is not practical. In the case of light timber framed construction, the restraint afforded by return walls can conservatively be taken as being equivalent to 12 kN.
4.2.1.2 Unstopped Corner Joints In instances where the internal bracing panel is not taped and stopped to the return wall the load path is somewhat different. Uplift forces in such bracing panels are transferred from the sheathing to the end stud of the panel, and then from that end stud into the stud of the adjacent wall by shear transfer through at least three nails. Thence the three nail requirement of the P21 end restraint.
42.2 Internal Bracine Panel /Door Owning Results of the experimental test simulating a panel between door openings @anel W17) is given in section 1.6.4. They show that the uplift restraint afforded by the door lintel is less than that of the P21 end restraint. Hence the use of this particular restraint to simulate the boundary condition over estimates the panel performance. Further testing was canied out in Phase I1 of this experimental programme to identify the degree of restraint afforded by a door lintel.
4.3 Load Regime
It has been questioned @can 1987) whether the P21 test procedure (1991). using a displacement specified regime is adequate to indicate the reserve strength of a test panel or in identifying severely degrading sheets. Dean suggested that a cyclic test to specified loads would be more appropriate.

The current P21 test procedure (1991) nominates a peak displacement and cycles for four excursions to this displacement. No consideration is given to the widely disparate racking performance of different systems beyond that displacement. Some lining material can sustain displacements only slightly higher that that nominated without severe loss of resistance while others can continue to sustain their resistant capacity with only insignificant strength loss. Systems which exhibit this latter response possess both greater ductility and damping and, while being much preferred, are currently given no recognition of this superior performance.
Two means of degrading bracing panels were identified and investigated. The first subjected the test panel to increasing cyclic loads, with a set number four of excursions to each load. Cycling continued at incremental loads until the lateral resistance of the system fell below 80% of the load applied during the previous cycle (i.e. the one proceeding the cycle in which significant strength loss occurs).
. . The alternative subjected the test specimen to increasing cyclic displacements with a set number of excursions to each displacement. The test continued until a maximum
.--dependable displacement was established. The maximum dependable displacement was considered to be the displacement at the cycle immediately preceding that in which the fouah cycle load resistance fell below 20% of the maximum fourth cycle resistant envelope.
In each case the test panel was subjected to cycles beyond the peak load. The onset of significant strength loss is identified.
Phase I of the experimental programme investigated the significance of load regime by subjecting different panels, first to the load regime and then replicate panels to the displacement controlled regime, as shown in Figures 7 and 10 respectively. The on-set of damage in the system is clearly identified in both.
43.1 Load or Displacement Control One objective of this first phase of the experimental programme was to ascertain whether the means of imposing the cyclic deformation influenced the assessed system capacity.
Figure 20 shows the parent curves for both the load controlled and displacement conklled regimes for three types of lining, on similar panels. The close proximity of each envelope indicates that the basis of loading is irrelevant to the assessed performance of the panel. The experimental results have shown that there is no significant difference in the peak load or peak displacements determined using either control regime.

.............. .............................. :. ....... ............ $4 .. : : r - ........ ........... ..... Swhlms W l l ..... and W12 ................ .......... l? - - .' .. .... . . . . . . . 10 - SpecAnens W8
ma WB
--- - -
-- -
Figure 20 : Parent Cuwes Under Load o r Displacement Control
There are however advantages in using a displacement control method.
The degree of control provided under displacement control is greater and the system thus safer to operate.
0 Displacement cycles are readily matched to the hysteresis loops generated in the Phylmas programme.
On reaching a particular displacement on the first cycle it is certain that the same displacement can be reached on subsequent cycles. Degradation in the lining may preclude this happening when the test is load controlled. Past P21 racking tests and results are based upon displacement control. This may be advantageous when matching test data to the Phylmas programme.
5. CONCLUSION
This report provided the details of the experimental programme undertaken as part of the review process which aimed to rationalise the basis for determining dependable earthquake and wind resistance to bracing panels used in houses.
The necessity of including some allowance for additional bracing panel uplift restraint to reflect actual in-service behaviour was clearly demonstrated and justified. The quantification of the capacity of such experimentally artificial restraint is usudy unimportant once a minimum threshold is attained since it will normally be the capacity of the sheathing material itself which controls the inservice performance.
The means or control by which the deformation is imposed has little, if any, relevance to the panel performance since it is the degrading characteristics that need to be matched as input to a suitable time-history analysis technique. The displacement control cycles are thus preferred for experimental simplicity.

REFERENCES
American Society of Testing and Materials 1976. Standard method for static load test for shear resistance of framed walls for buildings. ASTM E564. Philadelphia.
American Society of Testing and Materials 1980. Standard methods of conducting strength tests of panels for building construction. ASTM E72. Philadelphia.
Cooney, R.C & Fookes, A.H.R. 1981. New Zealand houses in earthquakes - What will happen? Large Earthquakes in New Zealand, the Royal Society of New Zealand, Napier, New Zealand.
Clough, R.W. and Penzien, J. 1975. Dynamics of Structures. McGraw-Hill. New York.
z earn,.:‘^.^. and King, A.B. 1994. The Seismic Bahaviour of Timber Structures - A state of the Art Paper. Proc Pacific Timber Engineering Conference. Gold Coast. 1:215-221.
Dearn, B.L. 1997. Equivalent Ductility for Residential Timber Buildings, Building Research Association of New Zealand. Study Report 73. Judgeford.
Dean, J.A. 1987. The Seismic Strength of Timber Frame Shearwalls Sheathed with Gibraltarboard. Research Report 87fl. Department of Civil Engineering, University of Canterbury. Christchurch.
Dean, J.A., Stewart, W.G. and Cam, A.J. 1986. The Seismic Behaviour of Plywood Sheathed Sheanvalls. Bulletin, New Zealand National Society for Eirthquake Engineering 19(1): 48-63.
Dolan, J.D. 1991. A Numerical Model to Predict the Dynamic Response of Timber Shear Walls. Proceedings. International Timber Engineering Conference, London. 4:338-345.
Dowrick, D.J. 1977. Earthquake Resistant Design, John Wiley & Sons. Chichester.
Foliente, G.C., McLain, T.E & Singh, M.P. 1993. A General Hysteresis Model for Wood Structures. Proc. ASCE Congress Structural Engineering in Hazard Mitigation. Irvine. U.S.A., pp 462-267.
Foschi. R.O. 1977. Analysis of Wood Diaphragms and Trusses Part 1: Diaphragms, Canadian Journal of Civil Engineering. Onawa 4(3):345-352.
King, A.B. 1990. Experiences of Radiata Pine buildings in earthquakes. Proc. International Timber Engineering Conference, Tokyo. pp 962-968.
Moss, P. J. 1991. The Performance of Low Rise Timber Buildings in New Zealand When Subjected to Seismic. Wind and Snow Loads. In Proc. Workshop. Full-scale Behaviour of Wood Framed Buildings in Watford U.K 1991. North Carolina University, Raleigh, USA.
Pender. M.J. & Robertson T.W. 1987. Edgecumbe Earthquake - Reconnaisance Report. Bulletin of the New Zealand National Society for Earthquake Engineering, Wellington. Vol20:3 pp 201-249.
46

Patton-Mallory M. and McCutcheon. W.J. 1987. Predicting Racking Performance Of Walls Sheathed On Both Sides. Forest Products Journal. 37(9): 27-32.
Standards New Zealand (SNZ) 1990. Code of Practice for Light Timber Frame Buildings not Requiring Specific Design, Standards Association of New Zealand, NZS 3604:1990; Wellington.
Standards Association of New Zealand (SANZ) 1984. Code of Practice for General Structural Design and Design Loadings for Buildings. Standards Association of New Zealand. NZS 4203: 1984; Wellington.
Standards New Zealand (SNZ) 1992. Code of Practice for General Structural Design and Design Loadings for Buildings. Standards New Zealand. NZS 4203: 1992; Wellington.
Stewart, W.G. 1987. The Seismic Design of Plywood Sheathed Shearwalls, Ph.D. Thesis, Department of Civil Engineering. University of Canterbury. Christchurch. 395 pp.
Thurston, S.J. 1993. Report on Racking Resistance of Long Sheathed Timber Framed Walls With Openings, Building Research Association of New Zealand. Study Report 54. Judgeford.

APPENDIX A : SMALL SCALE TESTING OF BRACING PANEL COMPONENTS
Nail pull-out tests were carried out on 10 samples to determine the pull out failure load of the typical bottom plate to timber foundation connection and the failure load of the end stud connection to the bottom plate. Six tests were also canied out on the standard P21 (1991) end restraint to determine the shear capacity.
1. Bottom Plate to end Stud
Two 90 x 3.15 mm gun nails were driven through a 300 mm long section of a bottom plate into the end grain of a 300 mm long 90 x 35 mm timber stud as used in the light timber frames evaluated in experimental phases I and 11. The specimen was then assembled into the universal testing machine, with the bottom plate being firmly fixed to the bottom platen and the stud section grasped by the jaws of a vice attached to the machine. The stud was then pulled from the bottom plate at a load rate of 2 kN per minute. Load was measured using a 10 kN load cell. The peak load recorded is shown in Table A. 1.
2. Bottom Plate to Foundation
Two 100 x 4 mm bright flat head nails were driven through a section of 90 x 45 nun timber bottom plate, through a 20 mm particleboard strip and into a 150 x 100 mm timber foundation beam. The specimen was then assembled into the universal testing machine with the foundation beam f d y fixed. The simulated bottom plate was f d y gripped and tension load (withdrawal) applied at a rate of 2 kN per minute. Load being measured with a 10 kN load cell. The peak load recorded is given in Table A.2.
3. P21 (1991) End Restraint
Three 100 x 4 mm bright flat head nails were driven through two 90 x 35 nun timber end studs 300 mm long, and were a simulation of the standard P21 (1991) end restraint. The specimens were tested in the universal testing machine with shear load being applied to one of the studs while the other was firmly fixed. The peak load recorded is given in Table A.3.
Table : A1 Table : A2
I Average ( 6.5 I
Table : A3

APPENDIX B : BRACING PANEL UPLIFT ON TYPICAL TIMBER FLOORING
Tests were carried out on a typical house floor to investigate the uplift capabilities at various locations. This may have a direct bearing on bracing ratings, as presently NZS 3604 (SNZ 1990) does not limit the axial load induced in the end studs of bracing panels. There is the possibility of a potential break down in load path from the panel to the foundation.
A 4.4 x 4.4 m square timber flooring system was constructed using 140 x 45 machine stress grade timber joists at 400 mm centres. The ends of the joists were attached to 140 x 45 mrn boundary joists. The joists were overlain with 20 mm thick particleboard flooring and all fixings were as specified in NZS 3604. The joists were supported at two locations to provide a joist span of 2.4 m.
Steel straps were firmly coach bolted to the joists at the locations marked 'X' in Figure B1 and load was applied to the straps via an overhead crane. Load was applied until localised failure of the floor occurred. Load was measured using a 100 kN load cell.
Results of the peak load resisted at the various locations are shown in Table B 1
The results in Table B1 indicate that there is sufficient load sharing within the body of the floor to accommodate the uplift forces generated in the end studs of bracing panel. However, problems may occur at the junction of floor joist and boundary joist where the failure load of 12 kN correlates to a panel bracing rating of 100 Bracing Units for a 2.4 m high wall. Further work is required to verify the significance of this potential failure mechanism.
Location A B C
D Table B1: Peak failure uplift loads applied to individual floor joists
Load At Failure kN 23 20 12
14
Fail& Mode Joist fracture Joist fracture Joist to boundary joist fixing withdrawal Joist fracture

Figure B1: Experimental procedure used to ascertain load sharing between joists
Figure B2 : Vertical load being applied to second joist with load sharing measured

THE RESOURCE CENTRE FOR BUILDING EXCELLENCE
To be the leading resource for the development of the
building and construction industry.
HEAD OFFICE AND LABORATORIES
Moonshine Road, Judgeford Postal Address - Private Bag 50903, Porima City Telephone - (04) 235-7600, Fax - (04) 235-6070
Internet - http:/ 1 www.branz.org.nz E-mail - [email protected]
NEW ZEALAND OFFICES
AUCKLAND Telephone - (09) 303-4902 (900)
Fax - (09) 303-4903 The Building Technology Centre
Victoria Park, 17 Drake Street PO Box 90524, Auckland Mail Centre
CHRISTCHURCH Telephone - (03) 366-3435
Fax - (09) 366-8552 GRE Building
79-83 Hereford Street PO Box 496
AUSTRALIAN OFFICE Telephone - (00612) 9960 0072
Fax - (006 12) 9960 0066 Level I Bridgepoint, 3 Brady Street, Mosman, Sydney
PO Box 420, Spit Junction, NSW 2088