Embed Size (px)
Citation preview

Study on the Analysis and Evolution of International and EU Shipping Final report September 2015
maritime-insight

Zoetermeer , 7 September 2015
This report was commissioned and financed by the European Commission. The views expressed herein are those of the Contractor, and do not represent an official view of the Commission.

1
Table of contents
EXECUTIVE SUMMARY i
1 Introduction 1
2 Analysis of existing situation and trends 2 2.1 Introduction 2 2.2 Economic growth and trade 3 2.3 Fleet development 7 2.4 Market developments in the sector 15 2.5 Trip-level cost structures, a comparative analysis 21 2.6 Benchmark analysis shipping companies 27 2.7 Technological developments 30 2.8 Environmental requirements 34 2.9 Maritime Security 38 2.10 Maritime Labour Employment 40 2.11 Incentives and subsidies 43 2.12 New infrastructure, ports and routes 48
3 Scenario exploration of future developments 55 3.1 Introduction 55 3.2 Overview of the main scenario assumptions 56 3.3 Scenario description 60
4 Analysis of the Position of the EU Maritime Industry Internationally 69
4.1 Introduction 69 4.2 Scope of the analysis 70 4.3 Analysis of the agreements and day-to-day conditions 71 4.4 Overview 92
5 Analysis and overview of the elements and policies that could be addressed in future maritime agreements 95
5.1 Introduction 95 5.2 Issues faced by the industry 95 5.3 Future challenges under different scenarios 100 5.4 Conclusions 105
Annex I Glossary 110
Annex II Overview of trade agreements 112
Annex III Micro/simulation – Input and Output data 120
Annex IV Benchmark analysis of shipping companies 122

i
EXECUTIVE SUMMARY
This report has been prepared for the European Commission concerning the Study on the Analysis and Evolution of International and EU Shipping, and is one of the information sources for the mid-term review of the EU Maritime Transport Strategy. The study describes the evolution of international and EU shipping, analyses international maritime agreements, and puts forward a series of steps to consolidate the EU maritime transport cluster competitiveness internationally. At the same time, the report also covers the social, environmental, and maritime-economic elements shaping the EU shipping industry of the future. Chapters 2 contains a comprehensive description of the existing situation and trends by shipping sectors, country members, trade lanes, and carriers, labour issues etc. Chapter 3 presents the scenario exploration of future developments, divided into three scenarios. Chapter 4 analyses the maritime clauses in the (maritime) agreements of the EU and its Member States and their economic relevance. Finally chapter 5 presents the findings of the stakeholder consultation and offers recommendations for future EC actions concerning the position of EU shipping in the global maritime market. Demand side key developments On the demand side of maritime shipping, from 1980 to date, the economic developments of the world regions shifted from a bi-polar world (Europe and North America) into three poles, including East Asia at the same level, with expectations of becoming the frontrunner by the year 2050, maritime transport plays a crucial role in enabling such a trend in economic growth. At the same time, there are emerging uncertainties regarding the large maritime flows of energy that might be affected by switches to unconventional resources, the increase in renewable resources, or geopolitical concerns for self-sufficiency. This could affect both the demand for maritime transport as well as port infrastructure and facilities for energy storage or refinery. Uncertainty is also fuelled by the switch in Europe over the last decade from Middle East oil towards Russian oil. Lately, this switch has been blocked due to political reasons, but it remains unclear to what extent such a blockage can be maintained. The trade relationship between the EU and China initially started as an import relationship but is becoming more balanced, given that export volumes from the EU towards China have grown faster over the last 15 years than import volumes (a factor five versus three). European exports benefit as the suppliers of processed chemical products and machinery. Furthermore rapidly rising incomes make China and other fast developing countries increasingly important export destinations for the EU. Supply side key developments On the supply side of shipping, worldwide flagging and ownership of vessels are both concentrated activities often located in different countries. Around 40% of the world fleet (expressed in terms of volume) is registered in three specialised countries: Panama, Liberia and the Marshall Islands, but these countries own less than 1% of the fleet. For Japan, South Korea and the USA, the opposite is the case, as they combine a substantial share in ownership with a low share in the flagging of the fleet (25% versus 5%). The EU and China both show a high share in ownership (32% and 13%) as well as in flagging (19% and 12%).

ii
The last 15 years have been a period of high growth for the EU in ownership and flagging, the average growth rate in ownership in this period is 7% per annum and varies by year between 4% and 10%. The average growth rate in flagging in this period is somewhat lower at 5% per annum, with higher growth rates in the period up to 2011 and lower growth rates over the last years. The growth in flagging is supported by a switch towards favourable taxation regimes in many EU countries between 1996 and 2008. There are no international agreements on taxation levels, and there appears to be a race to the bottom with regard to taxation rates and exemptions. As a response, EU Member States are likely to follow this trend to maintain their market share. Furthermore there will be pressure on the European Commission to broaden its definition of the maritime sector applicable to state aid regulations. International competition between flag states seems to move to the middle level regarding safety, environmental and labour regulations. On the one hand, international conventions set minimum standards and all successful open registries meet the international standards and show a positive performance on port state control indicators as well as for international conventions. On the other hand, requirements that are stricter than the international minimum, among others concerning crew nationality and certification or ownership, seem to be a competitive disadvantage for many European registries. While market information reveals moderate but continuous growth in most of the analysed trade lanes of the world, the analysis shows that during the EU economic recovery, markets have shifted from competitive to more concentrated in terms of number of operators, reducing the likelihood of new carriers accessing these markets. A benchmark-analysis carried out to compare European shipping lines’ performance with that of companies from Asia and Worldwide shows varying performance per transport segment, namely: Container; Dry bulk; Ferries; Tanker; Miscellaneous. The benchmark analysis made clear that on the one hand, labour costs per employee are higher for European companies than for the Asian companies, and on the other hand, employees of European companies are more efficient than their Asian competitors. The cost reductions drive the new developments of the shipping industry and its clusters, and therefore competitiveness depends to a large extent on reduced costs. This reports includes a micro-simulation and comparative analysis of the total chain costs structures by: Five cities, selected as geographically diverging important economic centres: Berlin,
Brussels, Milan, Paris, and Madrid. Five ports, selected as geographically diverging key gateways and transhipment hubs:
Bremerhaven, Antwerp, Le Havre, Marseille, and Lisbon. Two destination ports: Shanghai and Norfolk, allowing to compare the US and the Asia
linkage. Two ship sizes: 7,200 TEUs and 17,000 TEUs, being representative for the current
average container ship size and the newly emerging maximum ship size.

iii
The results of the above micro-simulation show the conditions under which a choice of port or departure and ship size changes the generalised cost structure of the trip. This report also shows the extent to which the total chain cost per container reduces from 955 to 685 Euro per TEU, in a North Europe to Far East containerised transportation, as a consequence of increasing vessel size from 4,500 to 18,000 TEUs. Equally, it can be seen how different manning unit costs impact on the operating costs within Europe, with Greece as one of the most expensive flags in Europe with 259 Euro per hour and Malta with one of the cheapest with 131 Euro per hour. Policy framework key developments The maritime transport sector has developed a global governance system with instruments such as ILO’s Maritime Labour Convention (MLC), Council Directive 2009/13/EC1 and IMO’s Convention on Standards of Training, Certification and Watchkeeping for Seafarers (STWC) implemented by Directive 2012/35/EU2. Labour costs play an important role in the shipowners’ decision for ship registration, as labour costs, together with maintenance and repairs, are one of the very few factors that shipowners can act on directly to reduce costs in the short term by looking for cheaper labour within or from outside Europe. Hence expensive European labour (mainly lower ranks) has been replaced by cheaper labour from Asian countries like the Philippines. This trend is more or less completed as most ratings are non-European and the majority of EU shipowners still prefer or are legally required to contract EU officers on their ships. In the long run shipowners have more options to influence their costs and capital investments in larger vessel or innovations, both reducing labour demand, can be an alternative for reducing labour costs by employee. With respect to economic incentives, there are exemptions to the State Aid prohibitions of the EU that contributed to the re-flagging status into EU flags. The tonnage tax is the main one, but other incentives include the reduction of social security and pension funding costs for seafarers, exemptions of personal income tax for seafarers, and exceptions on corporate tax. An analysis of the top non-EU countries of interest in this study shows that the most different support comes in Singapore, with the Maritime Cluster Fund in combination with advantageous tax condition for the maritime sector. In terms of sustainability, the environmental drivers of the shipping industry are oil spills, ballast waters, bilge water, black and grey water, harmful substances in the cargo, garbage, and organisms. However, the competitive position of the EU ports may not change dramatically. Even though fuel price may increase in the North Sea ECA, the shift of the predominant position of pre-ECA North European ports to post-ECA South European ports is limited to a small region in the North Italy, once total chain costs are considered, rather than only fuel costs. More widely, new ship technologies are also implemented with economic objectives. The drivers of technological developments in the maritime industry may include ship power efficiency, vessel hydrodynamics, safe and secure maritime transport, vessel performance, green vessels and ports, and innovative services. There are a number of technologies but the three main ones for the future are: ship size, unmanned vessels, and greening vessels and alternative methods of propulsion. 1 Council Directive 2009/13/EC of 16 February 2009 implementing the Agreement concluded by the European Community Shipowners’ Associations (ECSA) and the European Transport Workers’ Federation (ETF) on the Maritime Labour Convention, 2006, and amending Directive 1999/63/EC 2 Directive 2012/35/EU of the European Parliament and of the Council of 21 November 2012 amending Directive 2008/106/EC on the minimum level of training of seafarers
iv
Routes and port infrastructure key developments Security in international shipping has become an important issue. The threat of terrorism posed to ships and ports has led to the development of the ISPS Code by the IMO. Piracy and armed robbery at sea have become tangible security issues for shipping. And although there is progress in countering piracy, there are areas around the world that are under the risk of piracy and armed robbery at sea. In addition, disputed territories may challenge free maritime transport, such as the cases of South China Sea, and potentially the Black Sea in the EU. The emergence of alternative global shipping routes, like the North Sea Route, raises questions of unreliability, investment costs and vessel size limitations for the container shipping industry. Asian markets are likely to drive the developments for the exploration of natural resources in the Arctic region. Involvement of the EU in the development of the North Sea Route is at a lower scale and the EU could increase its level of involvement once investments in the navigation infrastructure are made by Russia. Capacity developments in Panama and Nicaragua will enable the shipping industry to sail with larger vessels than usual and to generate cost reductions. The impact on prices or profit levels will depend on the competitive nature of the trade lanes. The switch to larger vessel will reduce the number of port calls and increase the reliance on feeder transport as part of the transport chain. The importance of feedering, and negative impacts of cabotage restrictions which reduces the competitive conditions for this type of transport, will increase. Alternatively, the number of calls to ports with operational capacity needs to increase, leading to re-routing over the coming years, substituting ports with no capacity for those with capacity, and adding ports to the route to fill up the larger vessels. At the level of ports, the level of competition between the North- and South-European ports is modest, because of the natural barrier of the mountains, and because it is generally limited to a small geographical area. The transhipment function of the South-European ports faces more competition from competing ports and port developments in North-Africa. Transhipment in the North-European port range faces less external competition unless logistics patterns change, for instance to more direct calls or mainline to mainline transhipments. A future challenge for the ports is the ongoing increase in vessel size and therefore more concentrated volumes need to be handled in the ports themselves as well as on the hinterland connections. Scenario exploration and policy options A scenario approach has been followed to address the uncertainties in future developments in an explicit manner and to support the development of a robust strategy. The scenarios include the main drivers affecting the outlook and prosperity of the EU maritime industry. The aforementioned observations lead to three scenarios that are considered and evaluated in detail: a sustainability scenario, a fragmented-world scenario, and a conventional high economic growth scenario. Sustainability scenario This scenario offers good opportunities for the European maritime sector. The openness of the economies and limited trade regulations make it possible for European companies to operate smoothly in the fast growing markets of Asia and Africa. The international labour and environmental agreements offer an equal, level playing field which is beneficial to European companies as they used to be frontrunners in this field. The focus on technological progress and the smaller role of labour costs are also beneficial to the relatively high labour costs on board European ships. Moreover, the scenario offers good perspectives for maritime trade

v
with Europe. On the one hand, sustainable modes for international transportation will be sought after. Additionally, as conventional energy products become less important for the European ports, the EU can support the focus on fast-growing port activities such as container transport. Fragmented world scenario This scenario offers a serious threat for the European maritime industry as their current market share is bigger than the economic size of their region. The regional blocks will limit the options for European players to realise a substantial market share in other regions. Furthermore, the European maritime sector suffers from much stricter European environmental and safety regulations than other regions do. The limited market access and relatively modest growth of the economy slows down the increases in average vessel size and in this scenario, feedering is becoming less important. The EU and its Member States are not successful in realising their ambitions through international agreements in the field of safety, environment, labour and market access conditions. Bilateral agreements are of key importance to realise market access, and preferred supplier relationships need to be established. The EU responds to the international practice of widely used incentives and subsidies, to support and protect national industries, by widening the state aid framework for the maritime sector. In this scenario, there is less pressure on port and hinterland investments and this becomes a lower policy priority. Thus on the one hand, support of sustainability investments becomes a lower priority than in the other scenarios, as there are no globally accepted standards. On the other hand, support of automation and technological advancement to reduce sailing costs is the only way for European shipping companies to survive in a world without homogenised employment standards. Conventional high economic growth scenario The European maritime sector is likely to face high growth rates under this scenario as international maritime trade is growing at such a high rate. The relative market share of the European maritime industry might come under pressure as the centre of economic growth is located in East and South-East Asia. It is likely that maritime businesses from these regions will become more and more dominant world players. Higher concerns for the environment, safety, and labour regulations in Europe might impose extra costs on the European maritime industry. Global specialisation leaves the EU with two large deep sea markets. One market is specialised in high precision and sustainable services available to all segments of the shipping industries and the second market consist of highly modular vessels combining the most profitable shipping segments. The EU should strive to negotiate the ambitions of its Member States through international conventions. In addition, specific interest in the bilateral agreements should be given to the dominant Asian economies of China, Korea, India and Indonesia and the rapidly growing economies in Africa. In this scenario, high investments in port facilities and hinterland connections are needed to manage the growing maritime transport volumes and increasing peak flows. Transport infrastructure and management investments are a top priority for the EU and its Member States. Analysis of the position of the EU maritime industry internationally Another objective of this study was to analyse the position of the EU maritime industry at the international level by looking at the maritime agreements between the EU and its Member States with a selection of 10 non-EU partner countries, namely Russia, the USA, Brazil, Singapore, China, Turkey, the Republic of Korea, Japan, India and Panama. The selection of these ten countries was based on four criteria, namely vessel ownership, deadweight tonnage, flag of registration, and gross weight tonnage.

vi
The agreements reviewed include a number of common themes, notably commitments with regard to maritime freedoms (for instance, unrestricted access to international maritime transport), cargo sharing, cabotage operations, access to port services and maritime auxiliary services, commercial presence, etc. Several other topics were added in agreement with the Commission, such as feedering and relay, offshore services, and movement of empty containers. Cargo-sharing arrangements have decreased in the agreements of the EU and its Member States, and this appears to be consistent with the international trend. The reason for its decline is related to the emergence of the principle of freedom of maritime transport and the intensification of ’de-flagging‘ due to the spread of open ship registries. In some parts of the world however, cargo sharing continues to present significant challenges to EU operators, notably in South America. In Brazil, for instance, trade within the Mercosur region is limited only to vessels registered in that area as a result of cargo-sharing provisions included in bilateral maritime agreements, and this presents great limitations to the growing EU presence in the region. Cargo preference schemes in the US also present a source for concern due to the significant extent to which these are applied. Cabotage operations have been largely excluded from any liberalisation efforts at the international level, partly due to their politically sensitive nature in many countries. This general trend to exclude cabotage is well reflected in the agreements, as making restrictions on this point is a common approach across all agreements. In the US, due to the Jones Act, there are strict ownerships, maintenance and crewing restrictions. Attention should be paid to the Chinese cabotage regime due to the overall relevance of this region for maritime transport. Although the EU-China agreement restricts cabotage for EU operators, the agreement opens doors in terms of transport of self-owned or leased empty containers, which is not provided for in other agreements. The cabotage scheme in India is also restricted for foreign flagged vessels. With regard to feedering and relay, the former takes a higher share of overall traffic than the latter, approximately at a ratio of 85% to 15% of the total transhipment traffic globally. This means that in economic terms, feedering operations are much more relevant than relay operations. Figures on global regions indicate that feedering operations are particularly relevant in China, while relay is relevant in countries with major maritime hubs, such as Singapore. South Korea is also relevant due to the large transhipment traffic that is carried through its ports as a result of feedering and relay restrictions in China. In the US, feedering and relay remain restricted due to the Jones Act. However, the relevance of these restrictions is considered moderate due to the limited share of feedering (less than 1.5% of all transhipment traffic) and relay (0.22%) in US waterborne transport. Transhipment traffic is composed of three elements, the most important of which is feedering (85%, with hub-and-spoke networking), followed by interlining and relay (together 15%). Moreover, feedering operations within China are more important than relay operations, as close to 25% of all traffic represents feedering while only about 4% represents relay operations. Most maritime agreements of the EU and its Member States do not address feedering and relay of international cargo. Those that do mention it (for instance, the EU-China agreement) merely permit access to it, but prohibit the supply of such services for EU operators. Furthermore, both of these services form a part of cabotage operations when the transport of international cargo occurs between ports of the same country. Therefore, these services are generally prohibited for EU shipping companies.

vii
While access to port services is generally liberalised, some non-EU parties have maintained reservations regarding EU entities providing such services (for instance, pilotage, pushing and towing services which are reserved to vessels carrying the national flag). Similar restrictions are, however, applicable in the EU as well. The same applies to maritime auxiliary services. Attention should be paid to port areas in Brazil where, as a result of recent liberalising trends, the activities of EU shipping companies in ports are mainly carried out under leasing contracts which gives them the long-term benefit of securing port facilities in a more cost-efficient way. Another point of attention is Russia, where competition relating to access to port services is hindered by the large presence of ’natural monopolies’, that is State-owned enterprises. The coverage of social, environmental and safety clauses is limited in the maritime agreements which focus on reiterating the applicable international regulations. The movement of empty containers accounts for 15% of the operational costs related to container assets, representing a cost factor of €15 billion per annum for the shipping companies. Although most agreements do not address the movement of empty containers, some agreements do. For instance, the EU-China agreement permits the repositioning of empty containers between Chinese ports as an exception to cabotage restrictions. In other countries, repositioning is either attached to some conditions or not permitted at all due to cabotage limitations. For instance, in the US only containers owned or leased by the owner of the vessel can be moved. This is only permitted on a reciprocal basis, that is, if the other country provides the same possibility for US vessels. Other countries, such as Turkey and South Korea are restricted due to cabotage limitations. Similarly in India, the repositioning of empty containers falls under cabotage restrictions, and hence foreigners are not permitted to engage in this activity. With regard to offshore services, our analysis has revealed that this segment is of growing importance for the EU shipping industry. The EU’s offshore sector grew with more than 150% in GT between 2005 and 2014. This means that the EU’s share of global offshore fleet grew from 28% in 2005 to 37% in 2014 (in GT terms). The EU industry faces great competition in this segment from Asian competitors but it seems to have identified a way to maintain a competitive advantage. It does so by specialising in smaller segments, especially in building offshore support vessels and in educating highly qualified offshore service personnel. Recommendations This study explored trends in the international and EU shipping market, as well as the main challenges of the EU shipping access to key non-EU markets. The analysis concludes with a number of key trends, messages and recommendations conveyed to the European Commission regarding possible steps to reiterate at EU and non-EU forums the need of framing a global level playing field. The consortium recommends the EC to: Promote harmonisation of fiscal regimes for the maritime sector at a global level. In
absence of harmonised standards follow international developments in fiscal regimes, such as taxation levels and included scope of maritime sector, and review if existing State Aid Guidelines are still appropriate for the European registries and maritime industry to compete at a global level;
Support the improvement of the quality of services, such as efficiency of inspections and administration processing times and costs, of European registries. Consider the importance of economies of scale in this field and study the pros and contras of a further concentration of registry activities within a few registries in Europe;
Establish a shipping industry market observatory in liaison with the DG MOVE and the European Commission Competition Authority to identify mechanisms to adjust EU competition policies according to:

viii
market concentration and competition; freight rates, and quality and reliability of services provided and challenges from non-EU countries affecting the EU maritime industry’s margins;
Follow developments on the Northern Sea Route closely and, when conditions are favourable, increase the level of involvement once actual basic investments in navigation infrastructure and safety provisions are made;
Analyse the potential of the Eurasia land bridge by regions and product types; Consider involvement of TEN-T and CEF by looking at investment mechanisms to support
EU ports’ operational capacity, including substantial port and hinterland infrastructure, and development of LNG infrastructure. The ports in South Europe call for specific attention as their operational capacity to handle larger ships and options to switch to LNG infrastructure seem to be lagging behind;
Promote incentives and support mechanisms at three levels. First, sustaining favourable taxation schemes and creating mechanisms to strengthen the corporate culture and structure of EU shipping companies. Second, setting up mechanisms to attract and sustain companies to maritime clusters; and sustaining mechanisms for competence and skills building and development for the shipping industry. And third, trade facilitation by removing trade limits through diplomatic means with protectionist country/region/trade lane; reducing red tape in the EU
Research into schemes which make a maritime career more attractive for EU citizens; Support the position of the EU as frontrunner in maritime technology in practice, e.g.
R&D support measures, enabling the testing of new technologies, such as unmanned ships;
Pay a closer attention to feedering and relay operations when negotiating new agreements, and to the possibilities for EU shipping companies to carry their own cargo in a more efficient way to the port of final destination
Support further research into clarifying the eligibility requirements under the Maritime State Aid Guidelines to extend also to vessels providing offshore services .

1
1 Introduction
This study provides an analysis of the recent trends in global maritime transport and policy support to provide input to help strengthen the position of EU maritime transport internationally. The study also provides an overview of the current state of international maritime transport and provides the relevant economic assessment, statistics, data and analysis. Based on this information and findings collected, this study aims to help in proposing solutions and actions. A basic condition for an effective EU maritime policy would be to have European ships flying the flags of the Member States, thus applying EU legislation to these ships. However the global nature of international shipping makes EU policy making in this field very challenging, as many European owned ships are registered outside the EU. Hence it is important to know and understand the development of the EU flagged fleet, and see whether non-EU shipping registries develop and why. The following topics will be discussed in chapter 2 of this report: Economic growth and trade Fleet development Market developments in the sector Trip-level cost structures Technological developments Environmental requirements Security (focusing on piracy and armed robbery at sea) Maritime Labour Incentives and subsidises New infrastructure, ports and routes This analysis will lead to a number of drivers which will form the input for the exploration of scenarios for future developments presented in chapter 3. The maritime transport sector is part of a global market that has developed a global governance system based on the historic background of the ‘Mare Liberum’ principle (International Labour Organisation – ILO; International Maritime Organisation - IMO). This system is well developed, incorporating instruments such as the ILO’s Maritime Labour Convention (MLC) and the IMO’s Convention on Standards of Training, Certification and Watch keeping for Seafarers (STWC). On issues such as market access and market conditions however, ship operators still rely mostly on bilateral agreements between individual states. Besides this, the EU concluded Free Trade Agreements (FTAs) and Partnership and Cooperation Agreements (PCAs) containing provisions relevant for the maritime industry with a number of countries. FTAs, PCAs and bilateral agreements will be reviewed in chapter 4. In 2002 the European Union concluded a bilateral maritime agreement with China. In the future more agreements may be concluded with other countries. To do so it is essential to understand the needs of the European shiping industry. This study therefore assessed these needs using a survey amongst shipowners and by conducting interviews with other relevant stakeholders. In chapter 5 we will bring these needs together with our analysis of the development of EU shipping to present some actions that strengthen the competitive position of EU shipping.

2
2 Analysis of existing situation and trends
2.1 Introduction
The European Commission (EC) highlights the importance of maritime transport services for the economy of the European Union. The Athens Declaration of the EU Member States acknowledges that 75% of the EU imports and exports depend on maritime transport. Also, it underlines the need of maintaining the EU State Aid regime to support EU competition with non-EU countries, and recognises the importance of a stable innovation-friendly regulatory framework for the competitiveness of the EU fleet in the context of liberalised international maritime services3. In line with the EU declarations and strategies for the EU maritime transport and related industries, this chapter explores the macro conditions and trends of EU global maritime trade, the meso conditions of shipping company performance, the market conditions of competition at trade lane level and micro analysis of the cost structure of EU international trips. All these, together with the insights regarding technology, environment, labour, safety and security conditions, are integrated into future scenarios for the EU shipping, including outlooks and policy options for each scenario. At the Macro level, it is important to be aware of the relationship between economic growth, trade and shipping activity, the economic importance of shipping, and the evolution of fleets. At this point the cluster of maritime services around shipping will also be targeted, including shipbuilding, marine insurance, marine finance, and dredging. With respect to the Meso level of individual carrier companies and companies in the related businesses, it is important to make an analysis of the financial performance of these companies. The purpose of such a benchmarking analysis is to measure the economic and financial performances of clustered companies in subsectors, comparing performances of companies based in Europe and other regions. At the Market level, insight concerning the degree of competition is important to this analysis. There is a strong tendency towards increasing the scale of the shipping business, at the ship as well as at the company level. This leads the shipping market overall assuming a more oligopolistic character, leading to sub-optimal use of the shipping capacities and its potential within Europe. Regarding the Micro level, it is important to be aware of the different transport cost structures applicable to different segments. An important element to be taken into account is the flag impact. Different flags lead to different requirements for manning levels, minimum wages, profit taxation, etc. The different levels of analysis are brought together to build scenarios of future developments. A scenario approach has been taken to gain insight into uncertain and alternative future developments.
3 http://ec.europa.eu/transport/modes/maritime/consultations/doc/2015-mts-review/council-conclusions-on-mid-term-review-of-eu-maritime-policy.pdf

3
2.2 Economic growth and trade
2.2.1 Economic developments and maritime trade During the period 1980-2010 the world economy grew by 3.5% per year on average in terms of GDP4, resulting in an absolute growth of almost a factor of 3. Figure 2.1 presents the growth for nine world regions, namely North America, Latin America, Europe, Russia and its neighbouring countries, East Asia, South Asia, Africa, and Australia/New Zealand. As the maps show, the bipolar economic world of 1980, with North America and Europe being comparatively important has changed into three poles with East Asia as a newcomer. Furthermore, the South Asia region has shown above average growth, with 6% a year surpassing the size of the Latin American economy. The Middle East and the Russian region illustrate that economic growth is not always a given and that political unrest or economic crises can lead to a decade of economic decline.
Figure 2.1 Economic developments in the period 1980- 2010 by world region in GDP (USD 2005)
Source: World Bank data processed by project team5
Growth in GDP, trade and seaborne shipments are interlinked and continue to move in tandem. In theory trade can grow faster or slower than GDP. This relationship has varied over time, although for the last two decades the WTO 2014 and Bussierre et al find a relationship of a factor of two or of approximately two (indicating that trade grows twice as fast as GDP)6. Looking at the future this relationship is uncertain and part of the scenario makes assumptions (see appendix I). The resulting maritime trade depends on the value to volume ratio of trade
4 World band development indicator, calculated for GDP (PPP) expressed in 2005 US dollars, data downloaded from SSP database on https://secure.iiasa.ac.at/web-apps/ene/SspDb 5 Data downloaded from the SSP database on https://secure.iiasa.ac.at/web-apps/ene/SspDb 6 Bussiere, Callegari, Ghironi, Sestiere and Yamano, Estimating trade elasticities: demand composition and the trade collapse of 2008-09, authors work at Banque de France, IMF, OECD and Department of economics Boston College, 2013
GDP history
7,800
19801990
2000
2010

4
and the share of maritime mode. Currently more than 80% of global trade in terms of tonnage is transported by sea7. Figure 2.2 more specifically illustrates the developments in seaborne trade per cargo type and distinguishes oil and gas, five major bulks (iron ore, grain, coal, bauxite/alumina and phosphate), and other dry bulk and containers.
Figure 2.2 International seaborne trade, selected years (millions of tons loaded)
Source: (UNCTAD 2014)
The figure illustrates the very high growth rates in container transport and the high growth rates for the five major bulk products. The growth in sea borne oil transport is somewhat lower than average due to a higher energy efficiency of the economy, use of alternative energy sources, and increased local production in North America. Furthermore the centre of gravity for energy demand is shifting decisively towards the emerging economies, particularly to China, India and the Middle East, which has driven global energy use up by one-third8.
2.2.2 Worldwide patterns by type of cargo In this section we analyse the dominant geographical trade relationships, with specific attention to the position of the EU within these relationships. In the maps we focus on the three dominant maritime flows of liquid bulk (in tonnes for petroleum products), containers (expressed in manufactured products), and all other bulk products (among other things, agriculture, coal, ore, building material, chemicals). The illustrations have been derived from the European Transport policy Information System (ETIS plus)9 which covers the trade relationships for all countries (both EU and non-EU), in terms of imports, exports, and types of goods (52 NTR2 classes) in terms of tonnes and values for 2010 as most recent year. For each of the three product groups the three maps illustrate the ten largest trade relationships between the nine world regions in terms of combined import and export flows. The nine regions are similar to the regions in Figure 2.3. In Annex I we analyse time series developments for the relationship between economic growth and trade in more detail for the period 1999-2013.
7 UNCTAD, Review of maritime transport, United Nations Publication 2013 8 International Energy Agency, World energy outlook 2013, Paris, France 9All data and background documentation on the ETIS plus database can be downloaded from website http://www.etisplus.eu/default.aspx. Regarding worldwide trade flows there is a substantial time gap in data reporting of individual countries, further processing is needed to match tonnes and values and to fill in reporting gaps. The ETIS plus database is therefore one of the most up-to-date and comprehensive efforts available in this field.
1980 1985 1990 1995 2000 2005 2010 2011 2012 2013
oil and gas 1871 1459 1755 2050 2163 2422 2772 2794 2841 2844
five major bulks 608 900 988 1105 1295 1709 2335 2468 2742 2920
other dry cargo 1123 819 1031 1125 1928 2009 2022 2112 2169 2260
container 102 152 234 371 598 969 1280 1393 1445 1524
0
2000
4000
6000
8000
10000
12000

5
Figure 2.3 presents the dominant worldwide petroleum flows and shows that Russia is by far the main supplier for Europe, that the Middle East does so for China, and that the USA is close to self-sufficient in this regard. Of the petroleum flows between Russia and Europe more than half is transported by maritime transport10. This substantial share of maritime transport is supported by Russia’s strategy to diversify its transport routes and become less reliant on transit countries, which are a necessity for pipeline transport. Furthermore, the map illustrates that Africa also plays a role as a supplier of oil for the European and Chinese markets. Analysing historical flows shows that these flows are rather unstable and that over a period of a decade world-wide flow patterns for oil products can change radically. Examples of such changes include the switch in Europe from importing mainly Middle East oil towards Russian oil during the last ten years. Middle East oil is now the predominant source of oil products for East Asia, switching their relative focus from the USA and Europe towards the East. The instability observed over a period of ten years makes predictions concerning future flows, volumes and directions; more complex for this type of liquid bulk maritime transport than for the other types of transport.
Figure 2.3 The ten largest petroleum product flows in 2010 (million tonnes)
Source: ETIS plus database, processed by project team
In terms of volume the oil product flows are the dominant flows for the EU both as import and export trade flows. The present geopolitical concerns with Russia are an important uncertainty for the EU import flows of oil products, and might result in shifting EU import patterns towards unconventional oil and gas from the USA and Canada, deep sea oil from Brazil or back to the Middle East as the prominent supplier. At the world market level this will be in competition with the Asian countries. Both the production of deep sea oil and unconventional oil and gas can only be produced at a higher cost than from traditional sources and a geopolitically motivated reduction of the import of Russian oil is likely to result in a cost increase for Europe. The levels of export flows in oil products from the EU are mainly related to storage and refinery facilities in Europe. Both the Asian and Middle East countries put a strategic focus on increasing their own facilities in these fields. In the medium and long term this will result in increasing competition outside Europe for European ports with a large petrochemical cluster, such as
10 The share of maritime transport is based on combining two data bases. Namely the EU-Russia COMEXT data (Eurostat) for maritime transport (liquid maritime flow of above 200 million tonnes in 2010 – both import and export) with import and export trade data on crude and refined petroleum products from the COMEXT and Comtrade data (370 million tonnes in 2010 – both import and export). Eurostat data also shows that pipeline transport is the second largest mode for transport with Russia accounting for more than 30% of the total volumes. This market share is in line with the fact sheet – crude oil export capacities from Russia – of Clingendael International Energy Programme http://www.clingendaelenergy.com/. Further port info shows that the largest flows exist with the port of Rotterdam which imported around 47 million ton of mineral and crude oil in 2013 (port statistics of Rotterdam)
6
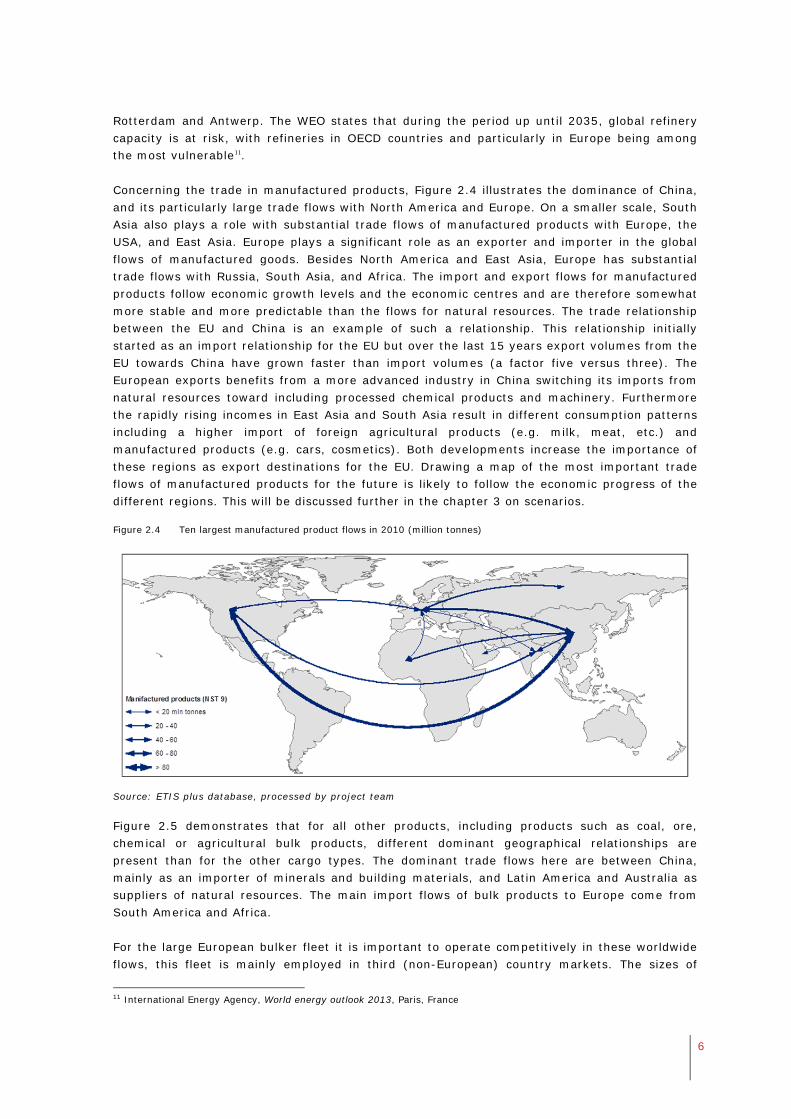
Rotterdam and Antwerp. The WEO states that during the period up until 2035, global refinery capacity is at risk, with refineries in OECD countries and particularly in Europe being among the most vulnerable11. Concerning the trade in manufactured products, Figure 2.4 illustrates the dominance of China, and its particularly large trade flows with North America and Europe. On a smaller scale, South Asia also plays a role with substantial trade flows of manufactured products with Europe, the USA, and East Asia. Europe plays a significant role as an exporter and importer in the global flows of manufactured goods. Besides North America and East Asia, Europe has substantial trade flows with Russia, South Asia, and Africa. The import and export flows for manufactured products follow economic growth levels and the economic centres and are therefore somewhat more stable and more predictable than the flows for natural resources. The trade relationship between the EU and China is an example of such a relationship. This relationship initially started as an import relationship for the EU but over the last 15 years export volumes from the EU towards China have grown faster than import volumes (a factor five versus three). The European exports benefits from a more advanced industry in China switching its imports from natural resources toward including processed chemical products and machinery. Furthermore the rapidly rising incomes in East Asia and South Asia result in different consumption patterns including a higher import of foreign agricultural products (e.g. milk, meat, etc.) and manufactured products (e.g. cars, cosmetics). Both developments increase the importance of these regions as export destinations for the EU. Drawing a map of the most important trade flows of manufactured products for the future is likely to follow the economic progress of the different regions. This will be discussed further in the chapter 3 on scenarios.
Figure 2.4 Ten largest manufactured product flows in 2010 (million tonnes)
Source: ETIS plus database, processed by project team
Figure 2.5 demonstrates that for all other products, including products such as coal, ore, chemical or agricultural bulk products, different dominant geographical relationships are present than for the other cargo types. The dominant trade flows here are between China, mainly as an importer of minerals and building materials, and Latin America and Australia as suppliers of natural resources. The main import flows of bulk products to Europe come from South America and Africa. For the large European bulker fleet it is important to operate competitively in these worldwide flows, this fleet is mainly employed in third (non-European) country markets. The sizes of
11 International Energy Agency, World energy outlook 2013, Paris, France

7
these flows are related to the stage of development of the countries, and especially to the rapidly industrialising countries which have a high demand for bulk products like coal and ores. In the future, South Asia is likely to become an increasingly prominent destination for bulk flows. The WEO for instance, expects India to become the largest importer of coal by the early 2020s12.
Figure 2.5 Ten largest product flows for all other products in 2010 (million tonnes)
Source: ETIS plus database, processed by project team
The patterns in economic developments, and associated income growth, energy production and consumption and industrial activity are dominant drivers of changing trade patterns which explain the demand for maritime transport. This section briefly summarises the dominant trade patterns by cargo types and the regions involved on which the globally operating European fleet needs to compete for their market share. These main flow patterns and possible future changes in these patterns can help to focus European efforts at improving the market conditions. For oil products and most of the bulk products there is a worldwide market and the trade patterns for these products can change in the medium term. For the EU it seems important to operate more broadly than its current market relationships, and to negotiate favourable access conditions with diverse suppliers. This makes the EU less dependent on a single supplier and can enable a smooth transition in the future. Regarding the container flows, the patterns are less volatile and insight into the economic developments of the regions will help to identify future dominant flows. Chapter 3 of this report will explore possible future economic developments and their impact on trade patterns and associated maritime transport flows by cargo type.
2.3 Fleet development
This section presents the historical fleet developments by vessel type, ownership, and flagging over the last three decades for the EU and the other main maritime countries. Furthermore, the section focuses on the developments in flagging and differences in ship registry conditions between the main registry countries in more detail. Finally, the section focusses on differences within Europe. The preliminary findings in this section will be supplemented and verified with the outcomes of the survey as executed under phase three of this study.
12 WEO, 2013

8
2.3.1 Fleet developments by vessel type, ownership and f lagging As a result of economic growth and increased maritime trade in the period 1980-2014 the world fleet has increased by 44% in terms of the number of ships, and by 185% in terms of ship volume (expressed in Gross Tonnage as the volume of the total vessel including superstructure and accommodations etc.). Figure 2.6 presents the fleet development in volumes by vessel type. Vessel types include Oil Tanker, Chemical tanker, LPG vessel, LNG vessel, Bulker, General cargo, Container, Offshore and Other. The overall growth of vessels by almost a factor of three (precisely 285%) differs strongly by vessel type. Of the main vessel types the Bulker, with a growth of a factor four, and the container vessels, with growth of a factor of 14, both show an above average growth rate. Oil tanker vessel volume has grown more modestly by a factor of 1.5 and General cargo vessel volume decreased during this period by a factor of 0.7, as a result of the increased use of containers to transport cargo.
Figure 2.6 Fleet development by vessel type (in thousand GT)
Source: data sourced from information provided by IHS Global Limited by Maritime Insight 2015
Other more specialised ship types with a high growth rate (by a factor of 11 for both) are the chemical tankers and LNG vessels. The offshore fleet has also shown an above average growth of a factor of four between 1980 and 2014. During the last decade, between 2004 and 2014, presents a much steeper increase in capacity for bulkers, container ships, chemical tankers, LNG and offshore ships than during the period before 2000. The figure includes projections for the developments in fleet capacity for the next five years as well. This is mainly based upon existing orders and demonstrates a continuation of the growth in bulker and container vessel capacity. Additionally, the fleet capacities of chemical tankers, LPG and LNG vessels, and offshore vessels continue to grow. The expected overall growth in vessel capacity is around 5% per year for the next 5 years. The differences in growth expressed in terms of the number of ships and in terms of volume, indicate that the average vessel size has doubled in volume during the last three decades. Essentially, the sizes of all vessel types, (except that of general cargo types), have increased. The scale increase of container vessels and chemical tankers has been above average with
projection

9
increases of 120% and 130% in average vessel volume, respectively. A study by ISL13 presents a long-term projection of ship size developments. The projection shows that size increases, due to overall market growth and economies of scale, are likely to continue. In the period leading up to 2040 the average size of a bulker is expected to increase by 50%, an oil tanker by 35%, and by 100% for a container ship. For containerships currently the Triple E Class is the largest operational vessel and these vessels can carry 18,000 – 19,000 TEU. However there are even larger ship designs on the drawing boards, such as the Malacca Max-class that could carry about 27,000 – 30,000 TEU. It remains to be seen which routes and ports these ships would service, and most likely they are mainly deployed on the routes between Asia and Europe. The number of routes for these vessels is restricted by demand and capacity constraints. Substantial demand volumes are needed to deploy these vessel in an economic efficient manner and currently the most dominant container routes operate between Asia and North America or Europe (see figure 2.6). For the Asia- North America route capacity constraints of the Panama canal remain an issue for these vessels and even after the Panama Canal Expansion project, the canal can only handle vessels up to 13.000 TEU (see section 2.12.1). Operational limitations can make these ships less attractive as they can only be deployed on specific routes and a selection of ports. For example, in the past the increase in oil tanker size increases had been slowed down as the number of port options reduced sharply which resulted in increasing port cost for the shippers. For the coming period the growth in average vessel size will be further supported by the reduction of the number of bottlenecks, e.g. Panama Canal expansion project (see section 2.12 on new infrastructure, ports and routes). However a fast increasing ship size will quickly hit new boundaries, like the panama expansion project which has increased the size of the vessel on this route form 6,000 TEU towards 13,000 TEU. The increase in vessel size put higher demands on port and hinterland capacities to handle larger flows. The impact of increasing peak loads on port capacity is further discussed in section 2.12. Figure 2.7 and
13‘Institute fur Seeverkehrswirschaft und Logistik (ISL), long-term projection of ship size development, Bremen, August 2014

10
Figure 2.8 present developments for the most dominant countries in the period of 1980-2014 in both flagging and ownership, expressed in terms of vessel capacity (GT). The two figures show that both worldwide flagging and ownership of vessels are concentrated activities but often not in the same locations.
Figure 2.7 Fleet development by flag (in thousands of GT)
Source: data sourced from information provided by IHS Global Limited by Maritime Insight 2015

11
Figure 2.8 Fleet development by ownership (in thousands of GT)
Source: data sourced from information provided by IHS Global Limited by Maritime Insight 2015
2.3.2 Trends in f lagging and posit ion of EU According to Article 91 of the United Nations Convention on the Law of the Sea 1982 (UNCLOS) every state shall fix the conditions for granting its nationality to ships, for the registration of ships in its territory, and for a ship’s right to fly its flag. Rather interesting in this respect, is the condition for registry of ships, namely that there must be a genuine link between the State and the ship. Thus far, nothing has yet been achieved in terms of measures and actions for defining and securing the essential ‘genuine link’ element which needs to exist in the relationship between the flag and the ship14. The system of open registry began in the 1920s when US shipowners started registering their ships in Panama to avoid increased regulations and rising labour costs. Labour costs especially are a driving force of flag changes, as labour costs, together with maintenance and repairs, are one of the very few factors that shipowners can directly try to reduce15. A study comparing US flagged vessels, (which according to the Jones Act are required to have an entirely American crew and adhere to US labour laws), with vessels flagged under open registry, with mostly Asian crews, showed that the average daily crew costs on a US flagged ship are five times higher than on a non-US flagged ship16. It should be noted that the system of open registry has become very popular and nowadays more than 40% of the worldwide share in flagging is concentrated in three specialised countries, Panama, Liberia, and the Marshall Islands. All together these countries hold less than a 1% share in the world wide ownership of ships. In contrast to such countries there are nations, such as Japan, South Korea and the USA, which have a substantial share in ownership (around 25% combined) but a very small share in the flagging of vessels (less than 5%). The EU (all Member States together) and China both show high shares in ownership, namely 32% for the EU and 13% for China in 201417. Both also demonstrate substantial shares in flagging, 19% and 12%, respectively. 14 Hosanee, N., A critical analysis of flag state duties as laid down under article 94 of the 1983 Law of the Sea Convention, United Nations New York, 2009 15 Stopford, M., Maritime Economics, 2009 16 USDOT, Comparison of U.S. And Foreign Flag Operating Costs, Technical report, US Department of Transportation, 2011 17 data sourced from information provided by IHS Global Limited by Maritime Insight 2015, please note that differences in percentages can easily occur between studies depending on scope, data filters or cut offs and source of data. In this study

12
Although the EU still has a substantial share in flagging, the fleet has expanded more slowly than the worldwide average, especially during the 1980s and 1990s. If this is broken down per vessel type, the growth in EU country flagging for bulker and container ships is lower than average. The growth in EU flagging is also lower than the growth in EU fleet ownership. The faster growth in EU ownership than in EU flagging is related to the use of flags of open registries or local flags when ships re engaged in trade outside of EU waters. The EU fleet in terms of ownership has expanded faster than the worldwide average (period 2000-2014). For all three major ship types (oil, bulker, container) the EU growth is above average18. Potential explanations for the increased use of open registries, besides lower labour costs are favourable tax policies (tonnage tax, tax exemptions), the economic advantage of lowered environmental, labour and safety standards, the quality of services, and the ease of registration. Over the years the differences between the open registries and the EU flags state registries have diminished as a substantial number of EU countries have introduced the tonnage taxation system as well and most open registries comply with minimum international regulations. The competitive differences occur therefore at a more nuanced level, e.g. tax exemptions within the tonnage tax system or recognition of labour certificates, or on other aspects as quality of services. Below we discuss the various items in more detail. Regarding environmental, safety and labour standards a study by Elizabeth de Sombre19 on flagging standards concludes that in practice the economic advantage of lowered standards is offset by collective action by international organisations and states. Du Sombre notes that overall, open registries are pressured to raise their standards while traditional maritime states lower their standards somewhat. The principles of this framework are confirmed through recent data of the yearly shipping industry flag state performance table for 201420. In this overview the main open registries, such as the Marshall Islands, Panama, Liberia, and Singapore, all have a positive score for their performance on port state control indicators, as well as on the ratification of conventions. The port state control indicators in the flag state performance table1 8 include scores for the three main Port State Control authorities, namely the Paris MOU, the Tokyo MOU, and the United States Coast Guard. Countries with many negative performance indicators for the port state control indicators or ratification of convention indicators do not play a prominent role in world wide ship registry. The competition is therefore restricted to the registers with an adequate performance on these indicators. European countries also score positively on performance indicators for these indicators and compete therefore with the main open registers. Further European registries sometimes set higher standards than internationally required and at times impose stricter inspections which according to industry are considered cumbersome. For labour standards the registries differ in their requirements regarding nationalities of officers and crew, and for certification requirements21. For the registries of Panama, Liberia, the Marshall Islands, Malta and the UK there are no requirements with regard to the nationality at all. Several EU Member States have requirements regarding the nationality of the master of the ship or a minimum percentage requirement for the nationalities of the crew. The limitations in choice of crew nationality have an impact on the manning costs of a vessel following wage
we have included EU countries (therefore Norway and Switzerland are not included), ships of 100 GT and above (often larger cutoff points are used), type of ships included (e.g. offshore is not included in this percentage) and status of second registries (we have included 2nd registries in the EU) 18 data sourced from information provided by IHS Global Limited by Maritime Insight 2015 19 De Sombre, E., Flagging standards: globalisation and environmental, safety, and labour regulations at sea, Cambridge, MA: MIT press, 2006 20 ICF/ISF, Shipping industry flag state performance table 2013/2014, 2014 21 Hill Dickinson, International ship registration requirements, Liverpool, UK, 2013
13
differences between European and non-EU Member States. Besides the nationality requirements, labour regulations and inspections of the flag state also seem important and representatives from the industry indicate that inspections of European flag states are considered to be more cumbersome than from open registries. Regarding taxation policies almost all countries recognise the global, competitive nature of the maritime sector and apply favourable taxation policies. Most EU Member States have reformed their taxation policies and use a tonnage tax. For several countries the introduction of the tonnage tax has been an important step in reversing the trend of slow growth or decreases in flagging into a positive trend. Examples include Denmark, France, Belgium, Spain, France, and the UK, all of which introduced the tonnage tax during the period of 1998-200522. In this competitive race countries such as Greece and Cyprus, which were already using tonnage tax since the 1970s, have further reduced their rates and included several tax exemption options. The three main open registers, Panama, Liberia and the Marshall Islands, apply a tonnage tax as well, though there is some competition with falling rates and tax breaks. Within Europe Malta seems to have advantageous tax conditions for ship owners and charterers applying complete tax exemptions for ships over 1,000 net tons. 23 Internationally Singapore applies many tax exemptions to the maritime sector to strengthen their position as maritime cluster2 2 . In general the lack of international coordination in the field of taxation has resulted in a reduction of tax rates or increasing number of tax exemptions in most countries. This ‘race to the bottom’ on the issue of taxation is likely to continue without international coordination in the near future. This implies that worldwide maritime nations are likely to lower their taxes, either by reducing tax rates, increasing number of tax exemptions or expanding the definition of the maritime cluster. EU Member States need to consider whether to follow this trend knowing that not following will affect their market share especially in the less value added and more cost competitive segments. Another competitive factor is the ownership requirements which differ per registry24). In general, the main open registries make it rather easy to establish a legal entity in these countries without any further ownership requirements. Most EU Member States, like Denmark, the UK, the Netherlands or Greece, have more specific ownership requirements, like minimum ownership shares for their own citizens, or for EU and EFTA natural and legal persons. Within Europe, Malta is an exception with no nationality requirements for shareholders or directors. This condition in combination with other favourable conditions, like tax regime and labour regulations, supports the growth of the registry of Malta towards a number one position in Europe. The differences in registries mentioned above has a net result that some European shipowners flag out their vessels to specialised countries like Panama, Liberia and the Marshall Islands. Besides these three countries an upcoming country for vessel registration is Singapore, which shows the highest growth rate in flagging vessel capacity over the last five years. However, if we compare the EU with other developed countries such as the USA, Japan, and South Korea, EU Member States (or some of them) seem to approach global competition in flagging in a better way, as loss of market share in flagging is lower for Member States than for above mentioned countries.
22 Oxford economics, The economic value of the EU shipping industry, A report for the European Community Shipowners’ Association (ECSA), 2014 23 Deloitte, Shipping Tax Guide, 2013 24 Hill Dickinson, International ship registration requirements, Liverpool, UK, 2013

14
Tax reductions in many EU Member States seem to be an important factor by which EU Member States have not lost a larger share of their flags. However, to remain competitive further pressure on taxation levels seems likely and without international minimum standards EU Member States will need to follow this trend. Regarding ownership and crew, safety, security and environmental regulations, European flags could follow two approaches: 1) Comply with the international standards. Promote European interests for higher standards
through international organisations but do not implement higher standards for Europe alone as this might affect the competitive position of the European industry in this global market;
2) EU flag states use higher standards to protect environmental, safety, and labour conditions and focus on the market segments with higher value added activities (e.g. offshore vessels, LNG vessels). This means that EU flag states will lose some of their current market share for less value added market segments. This approach can be combined with the EU further striving to extend the international conventions in this field, or alternatively extend the port state control instruments, to improve the level playing field for EU Member States.
Table 2.1 looks at the average age of the fleet by flag state, which might be an indication that older ships prefer certain flag states. The table shows that the average age of the European fleet is somewhat lower in terms of fleet ownership, than in terms of flagging, reflecting the higher growth rate in ownership compared with flagging. The table shows that the countries with the highest increases in flagging over the last five years, namely Singapore and the Marshall Islands, show the lowest average age by flag. The high growth of Singapore and Marshall Island over the last five year consists also of many new vessels reducing the average age of the fleet in these countries. The average age figures do not confirm theories that old and less environmentally friendly ships are more likely to flag under these open registries. A final conclusion on this theory cannot be observed in the data for the aggregated level of all vessels as different contradiction trends might not be feasible in the aggregated figures. For example some registries grow by a combination of newly build vessels and the reflagging of older and less environmentally friendly vessels.
Table 2.1 Average age of fleet in years by flag and ownership 2014
Group By flag By owner country
EU 18,9 15
CHINA 14,1 13,8
JAPAN 16,3 10,2
KOREA 28,1 21
PANAMA 15,4 16,9
LIBERIA 10,4 30,6
SINGAPORE 7,9 11,4
MARSHALL ISLANDS 8,5 17,7
USA 29 22,6
Rest of World 22,5 24,1
Source: data sourced from information provided by IHS Global Limited by Maritime Insight
2.3.3 Flagging trends by EU Member States In the sections above, flagging was mainly discussed at the level of the EU. This following section demonstrates that there is a wide variety in flagging between EU countries. The important EU flagging countries in terms of GT are Malta, Greece and Cyprus, followed by Italy, Germany, Denmark, and the UK. Over the last fifteen years large differences have become apparent between EU countries showing both increases and decreases in the flagging of vessels (expressed in GT). The top three countries showing increases were Belgium with an index of

15
7.1, Spain with 7.8, and Portugal with 8.5. In absolute volumes the growth was highest in Malta and Greece. The top three decreasing countries were Poland, Romania, and Bulgaria (which all approach zero).
Figure 2.9 Flagging by EU country (in thousands GT)
Source: data sourced from information provided by IHS Global Limited by Maritime Insight
For the three fastest increasing and decreasing flagging countries a micro model on shipping costs has been applied to analyse which factors are explaining the differences in development. The results are reported in section 2.5.2
2.4 Market developments in the sector
The port and maritime industry is typically a highly competitive sector due to the many different players, large volumes transported, long distances covered due to the considerable spatial separation of production and consumption. The nature of this competition has changed in recent years however. Nowadays, ports and the maritime industry compete as part of the supply chains to which they belong. In fact, to strengthen their position in their logistics chains, shipping companies sometimes take over terminal operating companies, as well as shipping agents all over the world; examples of these are displayed in tables 2.2 and 2.3. Terminal operating companies are the main suppliers of throughput services, and agents coordinate all the actors and transactions in a port of call, and when shipping companies integrate with operating companies or agents, it tends to be to control the quality of services and to use the knowledge of the local transactions so that core maritime services are run cost-efficiently. The forms of control of the maritime industry and ports however, are likely to become increasingly flexible as in addition to mergers, recent developments include as well alliances, joint ventures and dedicated handling activities. Cooperation may involve carriers, terminal operating companies, port authorities, hinterland operators, and hinterland terminal operators. Some examples for container transport are displayed in Table 2.2 where shaded cells refer to the occurrence of integration, sometimes under a specific name: in that case, the latter is indicated. As can be seen, 14 out of the top 20 container shipping companies have integrated vertically with port terminal operations, sometimes under an "own brand" name. This integration spans the wide, global scope of terminals at which these shipping companies call . This shows the increasing power that shipping companies try to gain and do effectively gain over large international logistics chains, building increasing power vis-à-vis large shippers which saw their power increase before.25

16
Table 2.2 Cooperation within the container liner industry
Rank Operator TOC Hinterland transport
operator Hinterland terminal
operator
1 Maersk APM Terminals
2 MSC TIL
E-gate
3 CMA-CGM Terminal Link CMA-CGM Intermodal CMA-CGM
Intermodal
4 Evergreen
5 Cosco Cosco Pacific Cosco Logistics
6 Hapag Lloyd
7 APL
APL Logistics
8 Hanjin
Hanjin Transportation
9 China Shipping China Shipping Terminal
Development Co
10 MOL
11 OOCL
12 NYK
13 Hamburg Süd
14 PIL
15 Yang Ming
16 K-Line
17 Hyundai
18 ZIM
19 UASC
20 CSAV
Source: Van de Voorde, E., and Vanelslander, T. (2014)25
Container lines also integrate with hinterland transportation services, hinterland terminals, and with shipping agencies. Although integrating with independent agents is rare, there are cases in which agents are acquired by shipping companies to later make them a department or subsidiary to the shipping company. Vertical integration into terminal operations not only occurs in the container market, but also in the dry bulk and general cargo markets. Table 2.2 shows instances of leading shipping companies holding stakes in TOCs in the latter two markets, which clearly illustrates the tendency to integrate of shipping companies into port terminal operations. It is probably even more evident for dry bulk operations to be integrated than for containerised operations, as they require dedicated and very specific handling operations that in practice cannot be shared, since moreover they are often linked to the mining plant. That implies that the power of these large dry bulk shipping companies against the end consumer is even higher than in the case of shipping companies, and further increasing over time. The spatial distribution is much more concentrated than in the case of containers, where globalisation is key. The only market where much less vertical integration has taken place is the tanker market. This is most likely due to the nature of the operations involved: not in all cases, transfer superstructure is needed other than pipeline connections with refineries and the like, so that production and handling are mostly in the same hands.
25 Van de Voorde, E., Vanelslander, T., Trends in the maritime logistics chain: vertical port co-operation : strategies and relationships, 2014.

17
Table 2.3 Cooperation within the dry bulk and general cargo industry
Dry bulk General cargo
Company Location Company Location
Fednav: FMT
Terminals USA, various locations
Canal Terminal Company: Canal
barge Illinois
Gearbulk Maleisia, Florida, Antwerp, Santos,
Paranagua, Flushing Grimaldi Group: Euroterminal nv Antwerp
Odfjell
Rotterdam, Houston, Charleston,
Dalian, Jiangyin, Ulsan, Singapore,
Sohar
Matson: Matson terminals Inc. Hawaii
Stolt Nielsen:
Stolthaven
Terminals
All continents North Transportation Company
Limited USA, various locations
Crowley Gulfport, Jacksonville (2), Port
Everglades, Pennsauken, San Juan
Tropical Shipping: Inland
Transportation Caribbean
Source: Enhancements to Van de Voorde, E., and Vanelslander, T. (2014)
The driving forces of integration include: increasing control over costs, pricing, entry and exit behaviour, access to technology and knowledge, reduced uncertainties, supply assurance and reduced complexities. Developments in the maritime industry require paying attention to shifting competitive balances and market power. Anti-trust enforcement revolves around the identification and measurement of market power. To verify whether and how the container shipping industry’s market power is evolving, an analysis of market competition in trade lanes between the key origins/destinations was performed. The trade lanes are shown in Table 2.4. The information is based on a dataset developed by the Department of Transport and Regional Economics of the University of Antwerp, and updated to 31st December 2014 (TPR-UA containerised trade database)26:
Table 2.4 Trade lanes for the analysis of competition27
Origin Destination
Africa US
Australasia US
Central America incl. Mexico US
Far East US East Coast and US Gulf
Far East US West Coast
Indian Sub-Continent US
Mediterranean US East Coast and US Gulf
Middle East US
North Europe US East Coast and US Gulf
South America East Coast US East Coast and US Gulf
US Africa
US Australasia
US Central America incl. Mexico
US Indian Sub-Continent
US Middle East
US East Coast and US Gulf Far East
26 TPR-UA containerised trade database 2014. Department of Transport and Regional Economics of the University of Antwerp Database. Elaborated based on ‘Dynaliners Weekly’ reports on containerised world trade flows from January, 2005 to December, 2014. 27 Ibid

18
Origin Destination
US East Coast and US Gulf Mediterranean
US East Coast and US Gulf North Europe
US East Coast and US Gulf South America East Coast
US West Coast Far East
Overall, these origin/destinations have seen containerised trade flows grow annually with an average of 3.9% from 2005 to 2013. Although trade flows reduced the containerised trade volumes during the crisis, the two main regions with clear declines from 2007 to 2010 were the Far East and the US West Coast. For most regions, the trend is a slow but clear recovery28. Interestingly, the three main destinations in international containerised trade were the East and West Coasts of the US, and the Far East. From 2009 to 2013, these three regions together accounted for 78% of the total flow for the regions listed above. This may have to do with the fact that traditionally the North America-Asia trade lane (west-bound and east-bound) has been the most important, as it is almost double the trade between North Europe-Asia in 2012 according to the World Shipping Council. And more importantly, there is no data available at shipping line level for the Far East-Europe trade lane, otherwise the US-Far East route would account for approximately 45% of the trade lanes listed above. Regarding the concentration of the trade flows as a first market measurement, the shipping industry overall can be viewed as an oligopolistic market. The lowest concentration ratios (CR) were seen in the US East Coast and US Gulf - Far East trade lane in 2008 with 33%29. The record of the highest concentration ratio was seen in the same year on the Australasia – US trade lane with 91%. In general, all trade lanes from 2008 to 2010 showed increases in their concentration ratios to 62% on average, but such concentrations decreased from 2011 to 2013, to 59% Regarding the EU, in the North-Europe to US East Coast and the Gulf of US trade lane, since 2010 MSC has been in the top of the chart in terms of volume carried, followed by Hapag‐Lloyd and Maersk Line. The growth of MSC from 2005 to 2013 has been remarkable, with an average annual growth rate of 13%. On the contrary, Hapag-Lloyd and Maersk Line dropped by 1% and 6% respectively in the same period. Other carriers like APL and CMA-CGM also performed well in the North-Europe to US East Coast and the Gulf of US trade lane, although their volumes are considerably lower compared to the top carriers in this trade lane. The inbound flow has similar trends, with an annual growth rate of 16% for MSC, and declines of 2% for the Hapag-Lloyd Line and 4% for the Maersk Line. The main trend shows a reduction in the concentration ratios in these trade lanes during and after the economic slowdown. Although concentration ratios have gone down with the consolidation of the economic recovery in the past couple of years, they still remain high. A high concentration enables carriers leading the trade lane to act in oligopolistic manners. They are able to exercise market power to control prices and excess capacity, (which are typically used as entry deterrents to markets), limit the number of carriers offering services in
28 Concentration Ratio in this study measures the share of the top 4 carriers in the total volume moved in a trade lane, or CR4 from now on in this study, and it can vary between 0 and 1, with .5 for instance meaning that 50% of the total volume of the trade lane is moved by the top 4 carriers ranked by their volume of TEUs moved in the trade lane.
19
the trade lanes, and in turn leave shippers and consumers in vulnerable positions with limited options to access better prices and reliable services3031. A second important indicator is the Instability Index (II), which reflects the degree of competition in the market, i.e. supply and demand. The index also provides an indication of the level of market openness in a trade lane. The degree of competition is captured in two ways in this context: on the one hand, by the number of new entrants to a trade lane and on the other hand by the changing volume moved by each carrier in a trade lane. Interestingly, trade lanes tend to balance themselves by having the same number of carriers entering into operations as the number of carriers ending operations. In general, 2009 showed the most changes in carriers’ entries and exits, with 31 counts in total for all trade lanes. While in terms of volumes 2010 was the most competitive year, with 3.200,000 TEUs changing from carriers to carriers in all trade lanes. Since then, competition has stabilised. This means that 2009 and 2010 were years where markets reorganised, and shifted from highly competitive to stable with low entry and exit. The trade lanes with the most intense competition activity reported were: the US East Coast and Gulf of US - South America East Coast with 4 entries and 4 exits in the year 2007; and the inverse trade with 3 entries and 3 exits same year. In terms of volume, the most competitive trade lane was the Far East – US West Coast in 2010, with 2 carriers entering with a total of 771,000 TEUs and 844,000 TEUs leaving with one carrier. Analysing the two indicators together, the Concentration Ratio and the Instability Index, it is possible to gain a snapshot of the market structure and its dynamics. Figure 2.10 displays the two indicators and separates them according to their median to arrive at four quadrants: Low Concentration Ratio and Low Instability Index, Low CR4 and High II, High CR4 and Low II, and High CR4 and High II. Figure 2.10 presents the four quadrants. The bottom left quadrant, Low CR4 and Low II, implies that the market is competitive in its structure but there may not be competitive pressures among the players. The possibility of individual carriers exercising market power under such conditions is limited. The bottom right quadrant, Low CR4 and High II, represents low market structure concentration but high competitive pressures among the players. Various competition strategies may emerge under this condition. Competition regulations may pay closer attention to the emerging competition strategies so as to prevent collusion behaviour among players in their efforts to increase their market shares. As discussed above, stable and concentrated markets, as an indication of possible presence of collusion, may enable carriers for instance to profit from fuel prices variations. Fuel prices represent the highest operating cost of the shipping industry; and it has been estimated that under collusion, carriers may not delay passing fuel price increases through to freight rates, whilst passing fuel price drops through to freight rates may take up to half a year. And as demonstrated by Fung (2014), ocean carriers’ collusive behaviour is easier to sustain in stable environments, because it is more likely to agree on the price adjustments, and less likely to misinterpret competitors’ pricing behaviour32. In conclusion, collusion in the shipping industry may delay passing on the benefits of reduced fuel prices for the shippers and final consumers.
30 Bertho, F., The Impact of Liner Shipping Trade and Competition Regulations on the Market Structure, Maritime transport Costs and Seaborne Trade Flows. PhD Thesis. Institut d’Etudes Politiques de Paris, 2012. 31 Bertho, Fabien and Borchert, Ingo and Mattoo, Aaditya, The Trade-Reducing Effects of Restrictions on Liner Shipping (June 1, 2014). World Bank Policy Research Working Paper No. 6921. Available at SSRN: http://ssrn.com/abstract=2456044 32 Fung, M., Ocean Carriers’ Collusion Under Antitrust Immunity: Evidence of Asymmetric Pass-Through. Review of Industrial Organization. Vol 45, Iss 1, pp 59-77, 2014

20
This concern about competition drove the Global Shippers Forum to file complaints before the EC and the US Federal Maritime Commission in October 2013 and November 2013 respectively, and to call for investigating the impact of the P3 Global Alliance for instance, on grounds of potential collusive behaviour on price and service arrangements33. The Chinese competition authority blocked the P3 precisely on the grounds of potential market concentration and reduced competition34. The top right quadrant in Figure 2.10 represents High CR4 and High II, and can be described as highly concentrated but still highly competitive, and entry and exit from the markets are still regular. The top left quadrant, High CR4 and Low II, means that the market is heavily concentrated, and it is highly stable. Here competition policies to assure market openness may be necessary. And what is more, under such conditions searching for maritime agreements with players’ countries who hold the market power may be one of the few venues for potentially smaller and newer entrants to the market. A comparative analysis of the market structure shows a clear shift. Previously there was a situation with highly competitive trade lanes, where some were heavily concentrated but others were not, leaving options for potentially new or smaller carriers to enter some of the markets. This has shifted to the recent situation where the market became more highly concentrated and stable. Thus, considerations like the ones described for the top left quadrant may be needed. The case for enhancing maritime agreements may be a possibility to ensure free market access for the global shipping industry.
Figure 2.10 Market Structure Dynamic by Trade Lane (2006 and 2013)
33 http://www.globalshippersforum.com/Media/ 34 http://www.hg.org/article.asp?id=32948
0
0,1
0,2
0,3
0,4
0,5
0,6
0,7
0,8
0,9
1
0 0,1 0,2 0,3 0,4 0,5 0,6
CR4
-Con
cent
ratio
n Rat
io
II - Instability Index
Africa - US 2010Africa - US 2013US - Africa 2010US - Africa 2013Australasia - US 2008Australasia - US 2013US - Australasia 2008US- Australasia 2013CenAm&Mex - US 2008CenAm&Mex - US 2013US - CenAm&Mex 2008US - CenAm&Mex 2013Far East - USEC 2006Far East - USEC 2013USEC - Far East 2006USEC - Far East 2013Far East - USWC 2006Far East - USWC 2013USWC - Far East 2006USWC - Far East 2013IndSubCon - US 2006IndSubCon - US 2013US - IndSubCon 2006US - IndSubCon 2013Mediterranean - USEC 2006Mediterranean - USEC 2011USEC - Mediterranean 2006USEC - Mediterranean 2011Middle East - US 2006Middle East - US 2013US - Middle East 2006US - Middle East 2013North Europe - USEC 2006North Europe - USEC 2013SouthAmEC - USEC 2006SouthAmEC - USEC 2013

21
The data indicates that although it tends to be oligopolistic at an aggregate level, the concentration ratios vary substantially between trade lanes. Therefore, competition policies should not be devised based on a one-size-fits-all principle35. For instance, anti-trust exemption policies for smaller carriers in the US East Coast and US Gulf-Far East, with concentration ratios of 39% on average during the 2007 to 2013 period, need not be as crucial as for smaller carriers in the Australasia – US trade lane. The Australasia - US trade lane carriers need to compete in a highly concentrated trade lane with an average 74% concentration ratio in the same period. Small carriers in the Australasia – US trade lane may be required to put in more effort to create economies of scale at a competitive level. If those carriers were aiming at creating a consortium to achieve such a scale, general anti-trust policies would restrict them from doing so, thus reducing the competition levels in the trade lane. Regarding the EU, the North Europe to US East Coast trade lane, there is an upward trend in the market concentration, yet it is lower compared with the rest of the trade lanes. This indicates that the need to monitor the effects of competition policies closely is not so urgent. The Mediterranean to US East Coast line however, shifted from low concentration and high competition, to low competition and high concentration. This suggests that competition policies may need to be examined in view of the trends in the trade lane, to assure collusive behaviour is not taking place in these trade lanes. The following section simulates the conditions under which shipping companies may be either more or less competitive, as well as the influencing factor of ports of call, ship size, and flag states.
2.5 Trip-level cost structures, a comparative analysis
Cost structures of the shipping industry are also an element to take into account for the analysis of carriers’ competitiveness and market competition. This section describes the generalised chain cost of the container shipping industry, based on actual data collected from the wider shipping and port industry, to which a model developed by University of Antwerp - TPR is applied. The model simulates and compares hinterland, port and sea transport costs of moving cargo on specific trips and vessels characteristics, with a relevant selection made for the purposes of this report as follows: 1. Origin: Berlin, Brussels, Paris, Milan, and Madrid; 2. Port of Departure: Bremerhaven, Antwerp, Le Havre, Marseille and Lisbon; 3. Port of Destination: Shanghai, China and Norfolk, USA; 4. Ship cargo capacity: from 4,500 to 17,000 TEUs; and 5. Ship flags: Belgium, Spain, Portugal, Greece, Malta, and Poland The simulation of the effects that may be brought on ships’ operating costs by: Slow steaming, is described in section 3.3.3 Conventional high economic growth scenario Environment-based fuel cost changes, is described in section 2.8 Environmental
requirements
2.5.1 Cost effects by origin, port of departure, and destination of the tr ip Analysing the different origins of the cargo shows that the total costs of the chain (hinterland, port, and sea costs) would encourage shippers to use the nearest ports, although this does not always happen in practice. For instance, Table 2.5 shows that cargo originating from the Berlin area minimises the total chain costs when using Bremerhaven as the departure port, regardless
35 Sys, C., Inside the Box: Assessing the Competitive Conditions, the Concentration and the Market Structure of the Container Liner Shipping Industry. PhD Thesis. University of Ghent and University of Antwerp, 2010 (Note that the Investigation covered from 2003 to 2009. This investigation extends that analysis to 2013).

22
of the destination port, i.e. Far East or US East Coast. Cargo originating from Brussels minimises costs through Antwerp, Paris through Le Havre, and Madrid through Lisbon, taking into account the five selected European ports. A possible explanation is that the hinterland costs of moving cargo to distant ports are higher than the port cost structure and sea transport cost savings36. Such features however, do not apply to the Far East destination for cargo originating in Milan. Milan uses the Port of Marseille to minimise hinterland costs. However, total chain costs are lower in Antwerp, due to the generalised cost structure of the port that offsets hinterland costs from Milan to Antwerp. The port capacity of Antwerp seems to be a reason for such advantages vis-à-vis Marseille for cargo originating from Milan, as cargo can be loaded in larger ships and substantially reduce the generalised costs at the port and of sea transport. Such advantages cannot materialise for the case of the US East Coast as a destination, as can be seen in table 2.5. This is because both the hinterland and total chain costs for cargo originating in Milan is minimised if cargo is shipped through Marseille. Yet again, the analysis indicates that larger ship size contributes toward reducing generalised cost of the trips. Therefore port competitiveness based on cost reductions may require growing capacity to handle larger ships. Although Antwerp is able to handle larger ships, the ports of New York and Norfolk are only able to handle ships of up to 7,200 TEUs37. Hence, any trip from North Europe to the US East Coast through New York or Norfolk will only be able to be carried out by ships of up to 7,200 TEUs. Under these conditions, there are not enough savings in the total chain costs from Antwerp to offset the hinterland costs from Milan, leaving Marseille at a competitive advantage. The decision of whether to ship through any of the five EU ports analysed here depends largely on the costs at the port and at sea. The comparative analysis of costs at EU ports and at international sea indicates that of the five considered ports, Antwerp is the least costly port for Far East destinations. However, for US East Coast destinations, the most competitive port without including hinterland costs is Lisbon. Lisbon is notably competitive in port and sea costs for the US East Coast trade lanes, but not for the Far East Trade lane. This suggests a negative relationship between the length of the deep sea transport and Lisbon’s competitiveness. Therefore, for ports with similar cost structures as Lisbon, competing for the Far East trade lanes requires increasing port capacity for handling ultra large container ships (ULCSs). For shorter deep sea trade lanes or short sea shipping, or where hinterland costs are favourable (e.g. cargo origin from Madrid to Lisbon) or not required (e.g. transhipment, feedering, or relay), Lisbon or other ports alike can compete, which may be a reason for the port of Lisbon’s 13% growth in TEU movements noted in the last reporting year, from 2012 to 201338.
36 The micro-simulation is informative with respect to indicating where cost structures may lead to competitiveness of each section of the total chain. A sensitivity analysis was performed as part of the model testing done in van Hassel, Meersman, H., Van de Voorde, E., Vanelslander, T. - Impact of scale increase of container ships on the generalised chain cost, Proceedings of the IAME Annual Conference, International Association of Maritime Economists, Norfolk, 16-18/07/2014 . And the fact that simulations are based on exports or imports does not make a difference in the generalised costs adding up the three sections of the chain (Hinterland, Port, and Sea costs), as can be seen in van Hassel, E. below 37 van Hassel, E., Meersman, H., Van de Voorde, E., Vanelslander, T.- Impact of scale increase of container ships on the generalised chain cost, Proceedings of the IAME Annual Conference, International Association of Maritime Economists, Norfolk, 16-18/07/2014 38 Port of Lisbon, Publicaçáo Estadistica 2013.

23
Table 2.5 Total Chain Costs by Origin, Departure Port, and Destination Port
EU region Trip Port Capacity
Limitation
Total Chain Costs
Origin Departure
Port
Destination
Port
Max
Ship
Size
(TEU)
Port
Limiting
Ship Size
Generalised Costs
at EU Ports and
International Sea
(A)
Hinterland
Cost (B)
Total
(A+B)
North Europe
to Far East
Brussels
Bremerhaven
Shanghai1 17000
606
420 1,026
Paris 599 1,205
Berlin 356 962
Milan 749 1,356
Madrid 1,619 2,225
Brussels
Antwerp 573
164 737
Paris 352 925
Berlin 522 1,095
Milan 631 1,204
Madrid 1,291 1,864
Brussels
Le Havre 584
387 972
Paris 245 829
Berlin 733 1,318
Milan 693 1,277
Madrid 1,070 1,655
South Europe
to Far East
Brussels
Marseille
Shanghai1 7200
Marseille 788
686 1,474
Paris 672 1,460
Berlin 994 1,781
Milan 561 1,348
Madrid 862 1,650
Brussels
Lisbon Lisbon 741
1,623 2,364
Paris 1,396 2,137
Berlin 2,189 2,931
Milan 1,695 2,436
Madrid 557 1,298
North Europe
to US East
Coast
Brussels
Bremerhaven
Norfolk2 7200 US ports
448
420 868
Paris 599 1,047
Berlin 356 804
Milan 749 1,198
Madrid 1,619 2,067
Brussels
Antwerp 419
164 584
Paris 352 771
Berlin 522 941
Milan 631 1,050
Madrid 1,291 1,710
Brussels
Le Havre 426
387 813
Paris 245 671
Berlin 733 1,159
Milan 693 1,119
Madrid 1,070 1,496
24
EU region Trip Port Capacity
Limitation
Total Chain Costs
Origin Departure
Port
Destination
Port
Max
Ship
Size
(TEU)
Port
Limiting
Ship Size
Generalised Costs
at EU Ports and
International Sea
(A)
Hinterland
Cost (B)
Total
(A+B)
South Europe
to US East
Coast
Brussels
Marseille
Norfolk2 7200 US & EU
ports
480
686 1,166
Paris 672 1,152
Berlin 994 1,474
Milan 561 1,041
Madrid 862 1,342
Brussels
Lisbon 404
1,623 2,028
Paris 1,396 1,801
Berlin 2,189 2,594
Milan 1,695 2,099
Madrid 579 984
1. Trip: Origin-Departing Port-Tanger Med-Suez Channel (way point)-Yantian-Hong Kong-Ningbo-Shanghai 2. Trip: Origin-Departing Port-New York-Norfolk
Source: Own elaboration based on van Hassel, E., Meersman, H., Van de Voorde, E., Vanelslander, T. (2014)39
39 van Hassel, E., Meersman, H., Van de Voorde, E., Vanelslander, T. Impact of scale increase of container ships on the generalized chain cost, Proceedings of the IAME Annual Conference, International Association of Maritime Economists, Norfolk, 16-18/07/2014

25
Figure 2.11 Port and Sea costs structure by Ship Size in a North Europe to Far East trade lane
Trip: (Bremerhaven-Rotterdam-Tanger Med-Suez Channel (Way Point) Yantian-Hong Kong-Ningbo-Shanghai)
Source: Own elaboration based on van Hassel, E., Meersman, H., Van de Voorde, E., Vanelslander, T. (2014)40
40 Ibid
Port - ; 6,95
Port - ; 19
Sea - ; 31
Sea - ; 45
Sea - ; 94
Sea - ; 165
Port - ; 200
0
100
200
300
400
500
600
700
800
900
1.000
1800
0
1700
0
1640
0
1310
0
1070
0
9700
7200
6000
4500
EUR/T
EU
Ship Size (TEUS)

26
2.5.2 Cost effects of vessel characterist ics Ship size has been regarded as the strategic result of cost savings through economies of scale. Figure 2.11 shows that generalised chain costs indeed decrease according to changing the ship size from 4,500 to 18,000 TEUs. More importantly, it shows changes in the generalised chain costs of the trips. Size contributes to important economies of scale with respect to fuel consumption, with cost reductions of approximately 17%. Other economies of scale are seen in fixed costs, manning, lubricants and oil, and management costs at sea. Ship size also stresses port capacities, reflected in increased terminal handling costs (THC) by approximately 13%. Fuel costs at the port and port dues also increase in relative terms with respect to the total chain costs for a trip. The end result is a decrease of the total chain costs from 955 to 585 Euro per TEU. For a full description of each one of the components of the total chain cost components, reference is made to Annex III Micro/Simulation data. In relation to the vessel operating costs comparison by flag state shown in figure 2.12, the estimation was based on an average 22 crew per vessel, and the capacity is 16,400 TEUs. Surprisingly, the fastest growing flags in Gross Tonnage (GT) are not cheaper in terms of operating costs than the fastest dropping flags in GT. Greece and Malta, the fastest growing and largest flags in the EU in terms of GT, are at the complete opposite extreme in operating costs. Greece is the most expensive flag with 259 Euro per hour, whilst Malta is the cheapest among the selected flags with 131 Euro per hour. Belgium and Portugal have higher operating costs compared to the fastest declining flag states, Poland, Romania, and Bulgaria. And Spain, which is one of the fastest growing, has lower operating costs than Poland. The two largest Flag States, Greece and Malta, also increased substantially in the period from 2000 to 2014. The analysis shows that the main differences in operating costs are attributed to crew, followed by management and administration costs.
Figure 2.12 Container ship operating costs per hour by selected EU flags (2015)
Source: Own elaboration based on van Hassel, E., Meersman, H., Van de Voorde, E., Vanelslander, T. (2014); Guy Sulpice (2011); Ecorys (2009); USDOT (2011); and Greiner and Stephens (2012)41.
41 van Hassel, E., Meersman, H., Van de Voorde, E., Vanelslander, T., Impact of scale increase of container ships on the generalized chain cost, Proceedings of the IAME Annual Conference, International Association of Maritime Economists, Norfolk, 16-18/07/2014. Sulpice G., Study on EU Seafarers Employment,2011. Ecorys Labour market issues and intra-EU regular maritime transport (task 1B and 3-6) 2009. Greiner, R. and Stephens, M., Shipping operating costs: Current and future trends. USDOT (Comparison of U.S. and Foreign-Flag Operating Costs) 2011.
050
100150200250300
Bel
gium
Spa
in
Port
ugal
Gre
ece
Mal
ta
Pola
nd
Rom
ania
Bul
garia
EU27
+2
Fastest growing flags Growing flags Fast dropping flags
EUR/H
r
Crew cost InsuranceStores costs Repair & MaintenanceManagement & Administration

27
2.6 Benchmark analysis shipping companies
Whereas the previous section focuses on container liner markets, this section presents a benchmark analysis of the economic performance of shipping companies in all shipping markets For the purpose of this study the dimensions for the segmentation of the shipping industry are geographical and business sector-related. The first aim is to compare European shipping lines’ performance with that of companies from Asia and Worldwide. Secondly the analysis is carried out by differentiating performance per type of transport segment, namely: Container; Dry bulk; Tanker; and Miscellaneous. The Ferry sector has been excluded from the analysis because companies active in this segment do not compete in different regions. The Miscellaneous sector covers those shipping companies that operate in different market segments. Full account of data clustering approach, data sources employed and analysis outcome is provided in Annex IV. The data collection was based on three different sources, which provide information on companies’ data from 2009 to 2013, required to perform the analysis. The PwC Global Shipping Benchmark database; The Avention database; and Targeted desk research on companies’ financial statements. The extensive data collection and research activity resulted in the analysis of more than 500 companies. However, only approximately 200 companies provided financial data (i.e. sales, operative incomes) with the required detail and completeness. Information on the number of employees and on the cost of personnel is provided only by a smaller share (approximately 110 companies). Over half of these are European companies42 (52%), one-third Asian (34%), with the most of the remaining companies coming from North America (10%). Companies from South America, Australia and Africa are significantly less well represented in the database (4%), due to limitations in data availability. Most companies researched are government-owned, not publicly listed, or provide consolidated data from holdings for which shipping is a minor business.
Figure 2.13 Geographical distribution of companies
Economic analyses of the shipping industry are based on three different indicators, which are presented in the following sections: Costs of personnel per employee Costs of personnel on sales Sales per employee
42 The European geographic cluster includes EU and EFTA countries.
52%
34%
10%2% 1% 1%
Europe Asia North America South America Oceania Africa

28
Cost of personnel per employee Cost of personnel per FTE (Full Time Equivalent employee) indicates how much the average employee is remunerated by the company, in gross value (includes wages, taxes on labour, social security, other benefits, etc.). Since financial statements do not generally provide for separate numbers for on board personnel and for shore based personnel, the aggregated number of workers in terms of FTE is considered. Figure 2.14 summarises the average labour cost per employee broken down per transport segment and region. No matter which transport segment is concerned, the average cost per employee is higher for European shipping companies than for Asian ones. The widest gaps are found in the Container and Miscellaneous sectors with European shipping companies facing average costs per employee of two times higher than their Asian counterparts.
Figure 2.14 Cost of personnel per FTE broken down per transport segment and region (€ ‘000)
The gap in labour cost between European and Asian companies does not come as a surprise. Several studies have reported on the different labour regimes and the economic convenience coming from cheaper East Asian labour force in particular43. According to our findings, not only the wages, but also labour taxes and social security costs tend to be higher for the employees of European companies. In this context several European shipping companies have mitigated their costs for on board personnel by having their fleet or part of their fleet under open registry.44 Shipping companies using open registries may avoid the strict regulations of developed countries and benefit from several advantages including the reduction of operating expenses as the labour costs involved in ship operation. Other advantages include the easy registration of maritime vessels, lower taxes, and freedom of control by the country of registry.45 Several of the companies selected for the analysis have their fleet fully or partially flying an open registry flag46. This actually
43 See, among others, Wagtmann M. A. and Poulsen R. T., Recent developments and probable future scenarios concerning seafarer labour markets, 2009 Kilkauer T. and Morris R. Into Murky waters: globalisation and deregulation in Germany’s shipping employee relations Employee Relations, 2002 44 Argiroffo E., Flags of Convenience and Substandard Vessels: A Review of the ILO’s Approach to the Problem, 110 INT’L LAB. REV. 437, 438 (1974). 45 Richard J. Payne, Flags of Convenience and Oil Pollution: A Threat to National Security, 3 HOUS. J. INT’L L. 67, 67, 1980. 46 The International Transport Workers’ Federation (ITF) declared FOCs for the following countries and registers: Antigua and Barbuda, Bahamas, Barbados, Belize, Bermuda (UK), Bolivia, Burma, Cambodia, Cayman Islands, Comoros, Cyprus, Equatorial Guinea, Faroe Islands (FAS), French International Ship Register (FIS), German International Ship Register (GIS), Georgia Gibraltar (UK), Honduras, Jamaica, Lebanon, Liberia, Malta, Marshall Islands (USA), Mauritius, Moldova, Mongolia, Netherlands, Antilles, North Korea, Panama, Sao Tome and Príncipe St Vincent, Sri Lanka, Tonga, Vanuatu. See: www.itfglobal.org/en/transport-sectors/seafarers/in-focus/flags-of-convenience-campaign/
114
8993
114
5752
37
91
70 7167
88
Container Dry Bulk Miscellaneous Tanker
Europe Asia Global
29
applies to more than 80% of European shipping companies in the sample. Unfortunately, this practice has a detrimental effect on the employment opportunities for European ratings and seafarers. Sales per employee As shown in Figure 2.14, even if several European companies fly an open registry flag, their average labour cost per employee is higher than for the Asian companies, whilst according to our benchmark analysis (see Figure 2.15), the personnel in European companies is slightly more efficient than the personnel in Asian companies. Indeed, the average sales per employee of European shipping companies are always higher than those of Asian companies. Sales per employee indicate how much turnover the company generates for each full time equivalent employee (FTE). The indicator provides information on the productivity of the personnel. It is however, impacted among other things, by different labour conditions and laws (i.e. across countries, sectors, etc.), the labour intensity of the shipping sector, the level of training of employees, the quality of equipment employed, optimal planning and organisation. Sales can also vary as companies are restructured, or lease vessels, to respond to a peak in demand.
Figure 2.15 Productivity of personnel broken down per transport segment and region (€ ‘000)
Cost of personnel on Sales The incidence of labour costs on sales is higher for European companies than for Asian companies (see chart below). Indeed, the high level of productivity of personnel employed by European companies does not counterbalance the lower labour cost of personnel employed by Asian companies. Hence, European companies are less competitive than Asian companies in this regard. It is interesting to note that the widest gaps are found in the Miscellaneous and Container sectors, meaning that European companies are suffering more from competition in these sectors than in others. It is also relevant to note that only a small part of the overall costs faced by shipping companies are related to labour. Indeed, other operative and financial costs might have a greater influence in this respect.
9271.038
440
2.097
644 720
396
1.629
832 774
418
1.655
Container Dry Bulk Miscellaneous Tanker
Europe Asia Global

30
Figure 2.16 Cost of personnel on Sales. Breakdown per geographical region and business type
In conclusion, as a general trend, European companies are confronted with higher costs of personnel when compared to companies based in Asia or in other regions. This issue has been only partially overcome by investing in personnel productivity, as demonstrated by the good performances in terms of sales per employee.
2.7 Technological developments
Ship sizes seem to be ever increasing as a result of increased competition in the shipping industry; causes are shown in Figure 2.17, combined with the permanent search for cost cutting, and the fact that technologies enable larger ships. Shippers and consumers demand more sea freight, and expect that service to be reliable, and the reaction of the shipping industry is increased capacity but with the same number of ships. This allows better control over the fleet to provide reliability of service47 on the one hand, but on the other hand, this also reduces competition and therefore the number of carriers available for shippers. Ports are reacting to the trend toward larger ship sizes with investments, better access to ports, mainly from already existing mega-ports. This increased capacity is coupled with the growing capacity of terminal operators to handle the cargo within an acceptable period of time, i.e. increased terminal productivity)48. The competition is important because it generally leads to innovations in ship size, advances in information technology, the introduction of low emission ships, tracking, tracing and monitoring, use of composite materials in the shipping industry, and new engines49. An increase in average sizes of container ships can be observed over the last 50 years, and even more during the past ten years (see Figure 2.18).
47 Sys, C., Blauwens, G., Omey, E., Van de Voorde, E., and Witlox, F., In search of the link between ship size and operations. Transportation planning and technology-issn 0308-1060-31, p. 435-463, 2008 48 Ibid 49 Sys, C., Inside the Box: Assessing the Competitive Conditions, the Concentration and the Market Structure of the Container Liner Shipping Industry. PhD Thesis. University of Ghent and University of Antwerp, 2010 (Note that the Investigation covered from 2003 to 2009. This investigation extends that analysis to 2013).
6%
4%
12%
4%3%
2% 2%3%
4%3%
8%
3%
Container Dry Bulk Miscellaneous Tanker
Europe Asia Global

31
Figure 2.17 Trend towards larger containerships50
Source: Sys, C. (2010)
Figure 2.18 Evolution of the container ship size (Cellular Container Vessels)51
Source: Tran and Haasis (2014)
50 Ibid 51 Nguyen Khoi Tran, Haasis H., An empirical study of fleet expansion and growth of ship size in container liner shipping, International Journal of Production Economics, Volume 159, Pages 241-253, ISSN 0925-5273, January 2015
- development of 45' high cube/palletwide containers
Terminal operators
- search for competitive advantage
- rationalisation/investment
- formation of alliances- the capacity of terminals to load and discharge such vessels within
an acceptable time frame - competitive nature forces to advance towards
the next size echelon
- the capabilities of terminals to deliver and despatch large
consignments of containers and the effectiveness of hinterland linkages
- permanent strive for cost cutting - technical difficulties, e.g. maximum stack height limitations
- to serve expanding market - the ability of container terminals to physically berth such unitsCarrier
- the move to individual and confidential service
contracting
- development of mega-ports
- port access
Market
trend towardslarger containerships
- increase of volume of container trade - introduction of containerisation
- alter trading patterns - no technical limitations to build larger ships
- shift from owner ship towards long
term chartering of new tonnage- construction of adjusted port to shore infrastructure
- on-going conversion of cargoes to
containerisation- increased implementation of IT-possibilities
Technology
Shipper/customer (Port) authorities- increasing demand - ongoing deregulation- demanding greater reliability at lower total cost - environmental reasons

32
Furthermore, much research is being conducted into innovating and improving the characteristics of vessels. Researchers from different organisations have started investigating the possibilities of unmanned vessels. Because of the fact that they require fewer or even no personnel on-board, there needs to be a reliable team to remotely control unmanned vessels. This goes in line with the reskilling of seafarers and candidates to meet the highly competent and capable labour needs for this kind of work. This may be an answer to the problem of making the maritime industry more attractive and sustainable because unmanned ships can reduce speeds, from 16 to 11 knots for example, and in doing so, save up to 50% of the fuel they currently use. CO2 and other emissions will be reduced and the shipping industry can make massive savings due to lower fuel consumption. Technology is already available to achieve this, but current legislation prohibits unmanned ships. In order to change the law, research must demonstrate whether safety in unmanned vessels is at least as good as on existing manned vessels. Reskilling of seafarers to match their competences and capabilities to the needs of the new job vacancies, should include more rewarding and new and more valuable job vacancies, developing and attracting the best human resources of the EU. (see also section 2.10 on Maritime Labour). The competitiveness of the shipping industry is also associated with port-related technologies, as the technological development of ships cannot continue without ports being able to support more advanced ship operations. The Port Community Systems (PCS) are one of the most important port related technological developments, designed to match the growing efficiency and levels of operations of the new ships. These PCS allow seamless and reliable information sharing between the ship and all the relevant port and logistics operators. Technological developments influence the costs (investment and operating costs) for the maritime industry and the levels of competition. Examples of technological developments include increasing ship sizes, unmanned vessels, or alternative methods of propulsion. Despite the existence of technological developments, there is still no clear understanding of the extent of the diffusion of these innovations at the global level. For instance, while ships will continue to grow in size, optimisation of ship designs could drive technological developments towards a more differentiated design based on the specialised trade lanes that the shipping industry serves. Consider for instance, short sea shipping versus deep sea shipping, or the straits and channels used for sea transport which differ per trade lane. Recently, the shipping industry introduced a number of technological developments, either due to: maritime transport needs, environmental, safety, security and labour regulations, efficiency needs, and fuel needs.
Some of the technologies that may respond to such drivers can be introduced either through retrofitting or through new buildings, such as those shown in Table 2.6.

33
Table 2.6 Technological developments under testing by the shipping industry5253
Ballast Water Treatment System Smaller engine/de-rating (speed reduction)
Pure gas engine
Low sulphur heavy fuel oil Reduction of seawater ballast capacity Air cushion
Liquefied Natural Gas SCR system Wind & solar power
System efficiency improvement (Aux)
SOx scrubber Ship Size and advanced ship design
Hull shape optimisation Lightweight constructions Unmanned vessels (airplane piloting model)
Waste heat recovery Dual fuel engine Vessels interconnectivity (Ship 3.0)
Propulsion efficiency devices Water emulsification Cargo and ship integrity monitoring systems
Distillate fuel Humid air motor/ direct water injection
New materials
EGR system Hybrid propulsion system Robotics at the sea
Low NOx tuning Counter rotating propulsion Supply chain perspective (coordination with stakeholders)
Shaft generators Self-unloading systems
Source: Own elaboration with enhancements from to DNV (2012) Shipping 2020, Futurenautics (2014) Shipping 3.0, and Skaarup Shipping Corporation (2012).
Table 2.6 list a number of technological developments taken up by the shipping and maritime industry likely to respond to a number of priorities, which are54: 1) Efficient and reduced power used on board vessels, 2) Improved hydrodynamic and performance and reduced vessel impact at the sea, 3) Safer, secure, and efficient maritime transport, 4) Improved overall vessel performance, 5) Efficient and environmentally friendly vessel powering, and 6) New concepts for innovative services. The above technological initiatives for innovation require different amounts of investments, but also have different operational cost impacts. Depending on the level of pressure to automate or increase productivity, the desire to invest in new technologies will be higher or lower. One of the recent considerations for the maritime industry is fuel-related. The use of Heavy Fuel Oil (HFO)requires less capital investments compared to Liquefied Natural Gas (LNG). However, the operating costs of HFO + scrubber compared to LNG are higher (see Table 2.7). Additionally, although HFO + scrubbers and LNG are comparable regarding their RoI over 15 years, LNG also entails supply chain efficiencies and flexibility, as for smaller ports LNG can be supplied by trucks, rail and feeders.
Table 2.7 Fuel needs and challenges55
HFO + scrubber LNG
Cost of scrubber Extra Capex on engines and tanks
Extra investment with an RoI of 15% over 15 years Extra investment with an Rol of 15% over 15 years
Additional OPEX: maintenance cost, extra consumption, logistics products.
Lower maintenance and operational costs
Existing logistic costs Loss of commercial space
52 DNV, Shipping 2020, 2012 53 Futurenautics, Shipping 3.0 The speculation is over, October (2014 54 Sames, Vessels for the Future, European Shipping Week 2015. 2015-03-02. 55 Semolinos, P., LNG as bunker fuel: Challenges to overcome, 2013
34
2.8 Environmental requirements
Environmental regulations and standards are traditionally key drivers of vessel design and business strategies in the shipping industry. Since the SOLAS Convention 1974, double hull designs are required in all passenger ships56. After the Exxon Valdez accident, the USA required the double hull design on oil tankers with the oil Pollution Act 1990. The IMO followed with the creation of the MARPOL convention in 1992 for tankers’ oil spills prevention. Finally the EU accelerated the phasing in of double hull design requirements for oil tankers in the Regulation EC 417/2002. To date, four large developments regarding emission legislation in international shipping can be distinguished, namely MARPOL ANNEX VI, the energy efficient design index (EEDI), the Ship Energy Efficient Management Plan (SEEMP) and the White paper of the EU (European Commission, 2011)57. A number of additional regulations and standards have emerged over the last four years and up to 2020 with tight sulphur emissions. The shipping industry has responded through innovation and new technologies, some of which are mentioned in preceding sections. The driving and emerging environmental regulations in place today include:
Table 2.8 Environmental regulations and standards due for the maritime industry58
2015 2016 2017 2018 2019 2020
SEEMP 0.1% ECA
Sulphur
limit
NOx III Cargo
liquefaction
(IMSBC
Code
amendment)
EU CO2
monitoring,
reporting,
and
verification
(MRV)
Future
ECAS
EEDI II Global
SOx
limit
US BW
Requirement
EEDI I Ballast
Water
Convention
Polar Code Low
Sulphur
Availability
Review
0.5% Global
SOx Limit
EEDI
III
EEDI 0 EU
Recycling
Regulation
EC CO2
Monitoring
and
Reporting
Verificatio
n (MVR)
Operational
requirement
on CO2.
Energy
Efficiency
Operational
Index
(EEOI)
56 https://treaties.un.org/doc/Publication/UNTS/Volume%201184/volume-1184-I-18961-English.pdf 57 Laurence, Sys, Vanelslander, and van Hassel (2014) Is new emission legislation stimulating the implementation of sustainable (retrofitting) maritime technologies?. Conference proceedings International Forum on Shipping, Ports and Airports (ISFPA) 2014. 58 IMO, and DNV, Shipping 2020, 2012; Laurence, Sys, Vanelslander, and van Hassel (2014) Is new emission legislation stimulating the implementation of sustainable (retrofitting) maritime technologies?. Conference proceedings International Forum on Shipping, Ports and Airports (ISFPA) 2014.

35
An example of the drivers of the environmental regulations are the emissions from shipping due to the burning of the sulphur content of marine fuels. This contributes to air pollution in the form of sulphur dioxide and particulate matter. Another example is GHG emissions from shipping, which led IMO59 and EC60 to impose environmental standards through their Member States to limit the emission of greenhouse gases. The use for instance of LNG is expected to bring emissions on NOx by approximately 90%, and fuel costs compared to Heavy Fuel Oil are down by approximately 10%, and if LNG is compared to Low Sulphur Maritime Gas Oil, the cost is 40% lower. Accounting for such differences, compliance with sulphur regulations with the introduction of LNG may represent a generalised chain cost saving of around 5.2% for 4,500 TEUs Ships and 3.3% for 18,000 TEUs Ships.
Figure 2.19 Fuel Cost Savings by shift from HFO to LNG1
1. Trip: Bremerhaven Port-Tanger Med-Suez Channel (way point)-Yantian-Hong Kong-Ningbo-Shanghai
Source: Own elaboration based on van Hassel, E., Meersman, H., Van de Voorde, E., Vanelslander, T. (2014) and
DNV (2012)
It is important to analyse the potential effects on the competition in the deep-sea shipping between seaports of the emerging international maritime emission regulations on the one hand and the potential underlying economic motivations fostering the discussion of introducing ECAs (Emission Control Areas) on the other hand. The scope is limited to the main container liners and the North European and Mediterranean ports of call. For the policy-related part, it has been found that the political theory of public choice suggests that not the green lobby but rather the petrochemical lobby is the major driving factor provoking the very strict emission caps61. An alternative explanation can be traced to international energy policy and the 'greening' of the policy. The potential port shift from North Europe towards Mediterranean ports seems 59 In case of the IMO’s Marine Environment Protection Committee (MEPC), it considered and pushed for GHG emission controls to be mandatory, which led to setting the ‘Regulations on Energy Efficiency for Ships’ in MARPOL Annex VI Chapter 4. http://www.imo.org/en/OurWork/Environment/PollutionPrevention/AirPollution/Pages/GHG-Emissions.aspx 60 In October 2014 the European Council endorsed the February 2014 European Parliament Resolution calling the European Commission and the Member States to set an EU target of 40% reductions of GHG by 2030 compared to 1990. The EC CO2 Monitoring and Reporting Verification System (MRV) was then adopted on 29th April, 2015, enter into force the 1st July 2015, and first reporting period to come on 1st January 2018. 61 Sys, C., Vanelslander T, Adriaenssens, M., Van Rillaer, I., International Emission Regulation in sea transport: economic feasibility and impacts, Transport Research D (research ready, publication forthcoming) 2015
0,00
200,00
400,00
600,00
800,00
1.000,00
1.200,00
HFO LNG
EUR/T
EU
4500 TEU Ship 18000 TEU Ship

36
unlikely due to logistics disadvantages and service problems in South-European ports, port consolidation, economies of scale, the specific nature of long distance container shipping and a growing environmental awareness in North European ports. Finally, no convincing proof has been delivered that the main liner companies are unprepared for this legislation and should be persuaded to rearrange their routes in favour of Mediterranean ports solely due to the various emission regulations. The legal analysis however pointed out that the current enforcement regime of MARPOL Annex VI should be improved in order to rule out the possibility of a low degree of compliance in order to protect the competiveness of complying ships62. This argument is based on the fact that despite increasing fuel prices in the North Sea ECA (see Table 2.9), the shift of predominant position of pre-ECA North-European ports to post-ECA South-European ports is limited to a small region in North-Italy. This is based on a Shanghai-Antwerp trip.
Table 2.9 Fuel cost increase from North Sea ECA introduction
Sailing
distance Distance ECA MDO/HFO Increase in fuel costs
Ports in ECA (1) (2) (3) (4)
Southampton 10,464 220 1.476 3.1%
Hamburg 10,931 687 1.476 9.3%
Bremerhaven 10,970 726 1.476 9.8%
Zeebrugge 11,246 1,002 1.476 13.2%
Rotterdam 11,333 1,089 1.476 14.2%
Le Havre 11,571 1,327 1.476 16.9%
The impact of introducing the North Sea ECA on the most interesting port of call from a hinterland region point of view and based on total chain costs, can be found by comparing Figure 2.20 and Figure 2.21. In addition to the ports from Table 2.9, Marseille and Koper are therefore added as the two South European ports in the analysis, due to their importance. Marseille is one of the busiest ports in the EU and is the base of CMA CGM63, whilst Koper is a key port for landlocked central EU countries, which typically are the newly-emerging battlefields for European ports64. In those figures, the hinterland regions where the North European ports in the loop are the most interesting ones are coloured purple, for Koper, they are dark blue, and for Marseille green. Yellow are the regions with an equal split between North European ports and Marseille, while light-blue are the regions with an equal split between North European ports and Koper. Orange is a battle area between Marseille and Koper, whereas brown finally is a battle area between all concerned ports. As it can be seen, Figure 2.12 differs very little from Figure 2.20, which implies that North European ports hardly give in hinterland regions to South European ports as a consequence of the North Sea ECA. Only in North Italy, there is a minor shift towards a battle area from a few areas which previously were purely in hands of the North European ports.
62 Maritime Transport V – Technological, Innovation and Research, Worrying clouds? International Emission regulations and the consequences for deep sea shipping and European ports, Sys, C., Vanelslander T., Adriaenssens, M., Barcelona, 27/6/2012, Acciaro Michele, Vanelslander Thierry, Sys Christa, Ferrari Christa, Roumboutsos Athena, Giuliano Genevieve, Lam Siu Lee Jasmine, Kapros Seraphim.- Environmental sustainability in seaports : a framework for successful innovation, IAME 2013 Conference July 3-5, Marseille, France - 2013, p. 1-25 How would EEDI influence Chinese shipbuilding industry? 2014, Maritime Policy and Management, Jianing Zheng, Hao Hu & Lei Dai, pages 495-510 63 http://www.worldportsource.com/ports/review/FRA_Port_of_Marseille_89.php 64 http://www.worldportsource.com/ports/review/SVN_Port_of_Koper_607.php
37
Figure 2.20 Division of hinterland without North Sea ECA zone
Figure 2.21 Division of hinterland with North Sea ECA zone
38
2.9 Maritime Security
The EU Maritime Security Strategy, adopted on 24 June 201465, identifies a number of threats against maritime security: a. Threats or use of force against Member States’ rights and jurisdiction over their maritime
zones; b. Threats to the security of European citizens and to economic interests at sea following acts
of external aggression including those related to maritime disputes, threats to Member States’ sovereign rights or armed conflicts;
c. Cross-border and organized crime, including maritime piracy and armed robbery at sea, trafficking of human beings and smuggling of migrants, organised criminal networks facilitating illegal migration, trafficking of arms and narcotics, smuggling of goods and contraband;
The Strategy puts emphasis on the importance of the naval capabilities of the Member States to challenge a number of the threat in case these would occur in reality. Unfortunately many navies of the Member States have witnessed large budget cuttings since the end of the Cold War to such a scale that global operations may be difficult to realise. But also the flagging status of the merchant navy plays a role. During the Falkland Crisis in 1982 the United Kingdom was only able to conduct the logistical operation to retake these island because UK flagged vessels were pressed into service to support the navy. With the reduced number of UK flagged ships this would be very difficult if not impossible nowadays according to British experts66. Unfortunately this does not only apply to the British navy only but to all navies of the European Union. There were already problems for EU navies to carry out two operations at the same time (the Libya crisis of 2011 and anti-piracy operation Atalanta)67. In order to play a role on the global level they rely on their own auxiliary ships or in case of emergencies the merchant ships flying EU flags. The number of auxiliary ships has dropped down sharply in EU navies (together with the number of warships)68. For example, in 1980 the Royal Navy of the United Kingdom alone had fifteen tankers; today it has just five Tankers. Carrying on from this, as of 2014 the German Navy has five Tankers, the French Navy has four Tankers, and the Italian Navy has three Tankers. These are the navies of four principle European members of the NATO alliance, and yet today their combined auxiliary strength, the thing which is most crucial to maintaining effective fighting forces at distance from their nation’s shore, is on a par with what one of these states had just thirty-four years ago. Most of the above listed threats can have a direct or indirect impact on maritime shipping. The strategy however does not spell all these threats in detail. One of these could be named here. With the introduction of the Exclusive Economic Zone (EEZ, article 55) the United Nations Convention on the Law of the Sea (UNCLOS) generated a new potential for military conflicts at sea. The maximum 200 Nautical Miles wide zone gives coastal states sovereign rights for the purpose of exploring and exploiting, conserving and managing the natural resources, whether living or non-living (Art.56 UNCLOS). This resulted in the need for additional boundary demarcation at sea. A specific role in this process is given to islands, which according to article 121 UNCLOS islands generate their own territorial sea and EEZ. The article also explains what an island is, or what it actually not is: “Rocks which cannot sustain human habitation or economic life of their own shall have no exclusive economic zone or continental shelf”. Since these wordings in UNCLOS many coastal states have tried to convince other states that 1. They are the sovereign state of certain islands, and 2. In case of doubt whether it is actually an
65 The Council of the European Union, European Union Maritime Security Strategy, Brussels, 24 June 2014 66 The Telegraph, Drop in UK-registered ships risks damage to British economy, 6 March 2015 67 http://europesworld.org, We must merge our 23 navies to safeguard the EU’s security, 1June 2012 68 www.europeangeostrategy.org: The US pivot: how far do European navies want to reach?, 28 September 2014

39
island, deployed military units on it on a semi-permanent basis to testify that it can sustain human habitation and hence define it as an island in the meaning of UNCLOS which is entitled to its own EEZ. Many of the present island disputes are in Asian waters, close to important international shipping lanes (e.g. Spratly Islands in the South China Sea in Figure 2.22). An escalation of these conflicts could result in redirecting international shipping from Asia to Europe and additional transport costs.
Figure 2.22 South China Sea disputes and international shipping lanes
Source: Reuters
During the Libya crisis in 2011 it became clear that European navies are not that well equipped to handle a large security crisis close to the European Union without the support of the United States Navy69. Of all the threats listed in the EU Maritime Security Strategy above the threats against port security and piracy and armed robbery at sea have had the largest effect on shipping since the beginning of the 21st century. Port security is arranged by the International Ship and Port Facility Security (ISPS) Code is an amendment to the Safety of Life at Sea (SOLAS) Convention (1974/1988) on minimum security arrangements for ships, ports and government agencies and came into force in 2004. In the next section we will discuss ISPS in relation to workload of ship crews.
69 American Enterprise Institute, NATO at sea: Trends in allied naval power, September 2013

40
Piracy and armed robbery against ships Piracy, according to Article 101 UNCLOS, is conducted (1) on the high seas against (2) another vessel and (3) for private gain. The IMO apples a wider definition and speaks not of piracy, but of acts of armed robbery against ships or at sea, thus also encompassing attacks in territorial waters and in internal waters like ports. There can also be a political dimension to such acts. The distinction between piracy (in international waters) and armed robbery in territorial waters and internal waters (ports) remains very important. This is because Article 105 UNCLOS entitles all states to combat piracy in international waters, while in all other cases only the coastal state has jurisdiction to act. Piracy and armed robbery against ships have undergone a change in patterns. In 2000, most incidents occurred in territorial waters and ports, with the exception of the Strait of Malacca where ships moving at high speed were also subject to piracy and armed robbery. In West Africa and in the Gulf of Guinea there has been a concentration of attacks on ships in the Port of Lagos and the nearby Nigerian coast. Here, the pirates’ objective is usually to steal cargo, although frequently crew members are also kidnapped and held for ransom. In Latin America, robbery is the main threat to maritime security, affecting inland waterways as well as coastal waters and ports. The issue however rose to the top of the international maritime policy agenda at the end of the last decade, when the majority of incidents occurred in international waters, concentrated off the coast of Somalia. The International Maritime Bureau noted recently however that pirate attacks on the world’s seas had fallen in 2013 for the third consecutive year. Small tanker hijacks however, by armed gangs are escalating in Southeast Asia70. This last development has been one of the reasons for China’s decision to construct new oil and gas pipelines and ports in Myanmar, thus avoiding piracy waters when transporting oil from Middle East to China71. Ships in piracy affected areas need to implement specific security measures. The “Best Management Practices to Deter Piracy”, an informational guide and set of recommendations developed by maritime industry and security professionals, provides a minimal set of core practices that ships might reasonably be expected to adopt for their protection. Within the European Union a discussion is ongoing whether private and armed guards are allowed to protect EU flagged ships. While most European Navies have been established with the aim to protect their national merchant ships around the world and keep international shipping lanes open, it is difficult from an operational point of view to have military personnel on board of merchant ships in piracy affected areas. Yet, the EU led naval operation in Somalia (EU NAVFOR Somalia – Operation Atalanta) was successful in combating piracy in the region. The next section will include a subsection on the effects of these additional security measures on the workload of the crew members.
2.10 Maritime Labour Employment
The maritime transport sector is part of a global market which has developed a global governance system based on the historic background of Mare Liberum (International Labour Organisation – ILO; International Maritime Organisation - IMO). This system is well developed with instruments such as the ILO’s Maritime Labour Convention (MLC), transposed into EU legislation by Directive 2009/13/EC, and the IMO’s Convention on Standards of Training, Certification and Watchkeeping for Seafarers (STWC), implemented by Directive 2012/35/EU.
70 International Maritime Bureau, 2014 third quarter global piracy report, October 2014 71 Piracy Daily, Piracy surge justifies China´s investment in Myanmar oil terminal, 21 July 2014

41
Crew sizes have become smaller due to technological changes, greater efficiencies (larger ships) and a push from shipowners to save labour costs. The skills required by maritime professionals have become more complex due to technological developments and the increasing emphasis on multi-model supply chains. In the last decade security tasks have been added above the usual working tasks of crews in order to comply with the ISPS code (International Ship and Port Facility Code, as part of the International Convention for the Safety of Life at Sea SOLAS, 1974), as well as additional security tasks to address piracy threats. The effect that larger ships have on saving labour costs is also interesting to note, as illustrated by the two examples below: 1) When the capacity of a vessel dedicated to bulk liquid transport is increased by 275%, the costs of crew increase by only 2.68%, and the technical costs by 25.64%; thus the daily crew costs (data for 2007) were US$ 2610 in a refined fuels tanker of 40,000 DWT, but only US$ 2680 in both an Aframax tanker of 100,000 DWT and in a Suezmax of 150,000 DWT. 2) For bulk carriers, the cargo capacity and the operating costs also show decreasing average costs, that is, returns of scale. Thus, when the cargo capacity is increased by 500%, the crew costs increased by only 4.91% and the technical costs by 77.82%72. Section 2.3.2 above mentioned the role which labour costs play in the shipowners’ decision for ship registration, as labour costs, together with maintenance and repairs, are one of the very few factors that shipowners can directly act to reduce73. This has resulted in a strategy undertaken by large ship-owning countries and ship-owners to look for cheaper labour from outside Europe and reduce their employment of European seafarers74. European ratings are particularly affected by this development, as illustrated in Table 2.10 below.
Table 2.10 Maritime labour development in EU 2000-2010
2000 2010 difference Officers 105492 140777 35285 Ratings 130000 105611 24389 Total 235492 246388 10986
Source: Final Report Study on EU Seafarers Employment, 2011, DG MOVE
A European Research project demonstrated the considerable variation in manning levels (deck and engineering/engine officers as well as ratings) for feeder container, product carrier and Ro-Ro ships types between EU Member States. The study concluded that: Member States tend to have individual approaches with regard to the determination of safe
manning levels; Standard tables or catalogues on safe manning are not used in the majority of member
states; and, Safe manning levels are determined mainly based on internal experience gathered.
According to this project there is little standardisation of the vessel manning determination process across Member States. This means that a similar ship may require different manning levels within the EU, which leads to different operating costs and a disturbance of the level playing field within the EU.
72 Silos,F.Piniella n J.M., Monedero J., Walliser J., Trends in the global market for crews: A case study, in Marine Policy, 36, 2012 73 Stopford, M., Maritime Economics, 2009 74 ETF, How to enhance training and recruitment in the EU shipping industry. 2011

42
Most Member States lost many of their ratings which were replaced by cheaper labour from outside the EU. Thanks to the accession of Bulgaria to the EU in 2007, which added almost 20,000 ratings to the EU total, the total loss of ratings in the EU became much smaller75. The opposite development occurred at the officer’s level, which grew significantly. The main reasons for this are that shipowners still prefer EU trained officers above non-EU trained officers, and that in many Member States it is a legal requirement to have EU officers on EU flagged ships. The replacement of EU crew by cheaper crew from other countries was and still is largely organised by manning agencies. Under the MLC these agencies have to be checked by states who are party to the MLC, or certified in case these companies are located in a country which is not a member of the MLC. This system should ensure that these agencies will provide a better quality of services than in the past, but it is too soon to verify this. Precise figures on employment in the EU shipping sector are difficult to deliver, as has been concluded by a recent study for DG MOVE. The main reason for this difficulty is a lack of available data in most Member States76. The most recent report on shipping employment was commissioned by ECSA and gives an overview of direct and indirect employment in the EU shipping sector77. Within the total amount of shipping employment, 63% of workers are involved in freight transport (including towing and dredging), 27% in passenger transport, 9% in service and offshore support activities, and 1% in renting and leasing (Figure 2.23).
Figure 2.23 Direct employment in the EU shipping industry by sub-sector, 2012
Source: Oxford Economics
The Oxford Economic study on maritime employment states that although the EU fleet grew strongly between 2004 and 2012, the growth in seafarers’ employment did not increase in proportion but lagged behind instead. The report provides a possible explanation for this, namely that many modern ships where launched which needed smaller crews due to the level of modern technology and automated systems. Although completely unmanned ships may be a faraway picture, the tendency towards smaller crews is clearly visible. Unfortunately, the study does not provide data for the development of seafarers’ employment per sub-sector since
75 DG MOVE, Study on Seafarers Employment, Final report, May 2011 76 Ibid 77 Oxford Economics, The Economic Value of the EU Shipping Industry, April 2014
0
50000
100000
150000
200000
250000
300000
350000
400000
Freighttransport
Passengertransport
Service &Offshore
support service
Renting andleasing

43
2012, and these figures cannot be distilled for EU and non-EU employees on board of EU flagged vessels. According to the European and Economic Social Committee (EESC,) regarding working conditions in shipping, problems arise from the casualisation of jobs, the increasing use of manning agencies, and the lack of a direct or only a remote employment relationship with the shipping companies. Often, working and living conditions on board are poor and accommodation on board inadequate, especially for women and cadets, and communication facilities are lacking. Furthermore, inadequate manning levels increase fatigue and put the safe operation of vessels at risk. A recent DG MOVE study analysed the additional work load brought on by security measures for crew members (ISPS & Piracy and armed robbery against ships)78. It estimated that the overall annual security-related workload of the EU fleet under 500 GT (for piracy and ISPS measures, covering all crew, all vessel types, and all security levels) was at 792,000, 24-hour days in total. Per ship this was 83, 24 hour person-days. It was also noted that 90% of this work is done by ratings and around 92% of it is due to ISPS, rather than piracy-related duties. The study calculated an imputed annual cost of $40.2 million. This figure is most likely overstated as most ship operators do not hire additional crew to perform these security tasks or pay the existing crews more. In combination with understaffed vessels this additional security related workload may compromise ship safety and functioning and lead to hazardous levels of crew fatigue. To avoid such conditions it seems that in practice a clear distinction in performing these security tasks have been made by most ship crews. Crew members regard ISPS duties are not protective against real threats, whereas they see piracy-protection efforts as providing protection against a real and concrete threat for their own protection. Because of this implementation of ISPS tasks is somewhat routine, while anti-piracy measures are executed with far greater vigour and attention, and with an eye to actual benefit.
2.10.1 Training needs in the marit ime sector In section 2.7 we mentioned that technological changes have effects on training needs in the sector. The competitiveness of European transport industry is linked intimately to the continuous development and renewal of the skills and competences of its workers. The transformation in European economic, competitive and technological landscape is likely to require innovative skills over the next years. The maritime sector, for instance within offshore, is no exception to this. According to the European Centre for the Development of Vocational Training CEDEFOP skill adaptation and mobility within the labour market are particularly important for job creation when technological innovations drive growth and bring about sectoral shifts and occupational change. Initial vocational education and training as well as continuous training during the working life can help workers adapt to change and keep pace with the changing environment.79 Some studies are suggesting that in the transport sector training employees while on the job is required in order to meet up with increasing requirements. ETF points at the fact that jobs in the transport sector are becoming more and more technical of nature and that there is not enough supply to fill this gap80.
2.11 Incentives and subsidies
Arguments for subsidies in ship building and ship operations outperforming technology require financial and regulatory aids. The EU to protect employment, to meet environmental regulation
78 DG MOVE, Study to assess the impact of security on the workload of all categories of ship crew members -interaction with manning levels of ships, 2013 79 European Parliament (2013). Combining the entry of young people in the labour market with the retention of older workers. 80 ETF, How to enhance training and recruitment in the EU shipping industry. 2011

44
or promote structurally important companies, have authorised State Aids; provided it does not put other competitors in other Member States in competitive disadvantage. Articles 107 and 108 of the Functioning of the EU, prohibit State Aid, but there are exemptions, that apply to the Maritime Sector, and that can be granted to shipowners, ship management companies, shipbuilders, ferry operators and ports and terminals. For maritime transport, the State Aid guidelines cover: 1. Tonnage tax 2. Taxation of seafarers 3. Aid for the repatriation of seafarers 4. Aid to investment for environmental purposes 5. Aid to training 6. Public service obligations and public service contracts 7. Start-up aid to short sea shipping. The tonnage tax had generally been seen as the driver for re-flagging in some EU Member States81. For a more comprehensive analysis of the effect of the tax regimes, see section 2.3.2 on fleet development. Yet, a number of non-EU countries have come up with additional benefits for the maritime industry registering flags in their countries or locating their activities at their shores (see table 2.11). In general what have worked for Malta and Singapore is the tax exemptions, whilst relying in a large shipping industry based in their countries, driving up economies development and strong specialisation in maritime clusters. The tax exemption in Singapore for instance can bring the rates from 20% to zero.82. An important type of incentive in the liner shipping industry is the possibility of regulatory incentives. Two of the most important ones relate to competition law allowing creating consortia agreements83, capacity, price fixing, and other anti-trust exemptions (e.g New Zealand, Australia, the EU, US, Singapore, Japan)84. Moreover, incentives have more recently been used by ports to keep carriers calling at them. For instance, in the United States, pressures over the risks of carriers not calling at Portland led port authorities to incentivise carriers to ease financial difficulties after economic slowdowns and keep their trade lane active85. Other incentives include port due reductions, which can be granted under a number of criteria, such as: carriers responding to port authorities’ request to bring the vessels to service them at the port at a given time; good environmental practices proven with Rotterdam Bureau of Green Awards, ISO 14001 certifications, or Environmental Ship Index (ESI) discounts; when the cargo is agricultural bulk; upon second port calls; deep sea transhipment; if the ship is a feeder; if the ship meets a TEU size criterion; roll-on-roll-off scheduled services; if numbers of calls to the port exceed minimum thresholds; if the vessel is for short sea shipping; if the vessels perform national cabotage. , There are also incentives due to strategic interests, for instance the carrier calling the port for direct intercontinental routes and with minimum requirements in gross tonnage, etc8687.
81 http://ec.europa.eu/competition/consultations/2012_maritime_transport/belgium_2_en.pdf 82 http://www2.deloitte.com/content/dam/Deloitte/global/Documents/Energy-and-Resources/dttl-ER-Shipping-Tax-Guide-6countries.pdf 83 See the press release of the EC (2014) on Antitrust: Commission extends validity of special competition regime for liner shipping consortia until April 2020. http://europa.eu/rapid/press-release_IP-14-717_en.htm 84 New Zealand Productivity Commission (2012) International Freight Transport Services Inquiry. Appendix E -NZ's regulatory approach to international shipping. 85 http://www.oregonlive.com/business/index.ssf/2014/02/port_of_portland_plans_to_subs.html 86 Port of Lisboa (2013) Tariff Regulations 87 Port of Rotterdam (2015) General Terms and Conditions

45
Each country may have its own strategic interest, which is then reflected in its incentives and subsidies. Table 2.11 shows examples of incentives, subsidies or support measures for the shipping industry and its cluster by the countries of interest in this study, as well as for the top growing, declining, and consolidated flags in the EU depicted in section 2.3.3 in this report. There are three countries with increases in their controlled fleet as a share of the world deadweight tonnage, Singapore, Panama, and Belgium. Singapore however is increasingly controlling foreign flag ships, whilst Belgium is increasingly controlling national flag ships. Panama remained almost the same in share of foreign flag controlled fleet. Incentives, subsidies and in general national policies and support, had different effects on the shipping industry. On the one hand, Singapore’s incentives for instance, stimulated an increase in the controlled fleet, and the incentives seem to allow for a growing attraction of foreign flags more than of national flags. Belgium’s incentives on the other hand, stimulated the controlled fleet of national flags more than foreign flags. In the case of China, USA, Turkey, India, Russia, Greece, and Spain, incentives were not able to sustain the growth of the controlled fleet at the same speed as the rest of the world, and resources seem to be concentrated in retaining or attracting vessels into their national flags perhaps as a major trend of similar policies, or what was mentioned (in section 2.3.2) to be ‘the race to the bottom’ in tax exemption for retaining national flags. Brazil’s incentives were also not able to cope with the growth of the controlled fleet of the rest of the world, and incentives and support policies worked less for national flag ships than for foreign flag ships. Finally, there is Panama and Malta, whose controlled fleet increased and decreased correspondingly, but the share of foreign flags remained almost unchanged in both cases.
Table 2.11 Support mechanisms for the shipping industry and its cluster
Countries Incentives and subsidies for the shipping
industry and maritime cluster
Controlled fleet (Deadweight tonnage share of world total)
20002014
Foreign Flag in DwT 20002014
Source
China
Subsidy on recycling/shipbuilding (half for scrapping and half for new orders)
5.39%4.38% 43.50%0.37%
Bloomberg 2013; Ernst & Young 2014; UNCTAD RMT 2000 and 2014
Three year tax holiday for port structures construction
Environmental awareness tax credits
USA
Harbor Maintenance Tax waiver
6.67%0.71% 75.42%28.30%
USDOT‐MARAD 2011; Ernst & Young 2014; UNCTAD RMT 2000 and 2014
Customs Processing of Inbound Containers on Great Lakes
Shipper Tax Credits
Investment Tax Credits
Accelerated Depreciation
Matching Capital Grants
Capital construction fund
Construction reserve fund
Subsidies for special cargo
Marine Highway Title XI Loan Guarantees
Marine Transportation Infrastructure Finance & Innovation Act
Turkey
Support to SMEs
1.32%0.53% 8.75%3.27%
OECD 2011; Ernst & Young 2014; UNCTAD RMT 2000 and 2014
Support for R&D activities in maritime industry
Export credits for the shipping industry (Turk Eximbank)
Brazil
Shipbuilding, conversion, modernization and overhaul of ships
1.21%1.16% 31.35%86%
Ernst & Young 2014; UNCTAD RMT 2000 and 2014
Suspension of the Import Duty, IPI, PIS and COFINS for asset acquisition for port facilities
Reduced tonnage tax by 70% since 2002

46
Countries Incentives and subsidies for the shipping
industry and maritime cluster
Controlled fleet (Deadweight tonnage share of world total)
20002014
Foreign Flag in DwT 20002014
Source
India
Shipowners retain sales income taxes from abroad
1.65%0.91% 10.58%3.99%
Ernst & Young 2014; UNCTAD RMT 2000 and 2014
Import of new vessels have open general licence
100% grant for inland water transport investments
Easy or zero customs duties related to the maritime industry
Income tax incentives
Russia
VAT exemption on import vessels
2.18%0.39% 46.61%14.88%
Ernst & Young 2014; UNCTAD RMT 2000 and 2014
Some vessels sales are no VAT
No assets tax for shipowners or shipbuilders
No transport tax
Subsidies for acquisition of new vessels
Excise tax
Reduced profit tax
No land tax
Customs duties exemptions
Singapore
Maritime Cluster Fund
2.56%6.17% 38.33%60.30%
Ernst & Young 2014; UNCTAD RMT 2000, 2014; and PwC 2015.88
Investment tax incentives for shipping industry and tax exemptions from 20% to 0% as long as it is controlled and managed from Singapore, or through Double Tax Agreements with 58 foreign countries.
Incentives for environmental awareness
Panama
Consular and tax discounts based on gross tonnage registered
19.89%21.21% 100%99.83%
Ernst & Young 2014 ; UNCTAD RMT 2000, 2001, and 2014
Increasing registration discounts based on increasing number of registered vessels
Exempt income tax for international operations (Panama as transit point)
Income tax exemption and non‐double taxation with the USA, The Netherland, and Cyprus
Parallel registration allowed
Greece
Greek flag vessels from Greek shipyards exempt from tonnage tax for 6 years
18.21%4.60% 69.50%8.54%
Ernst & Young 2014 ; UNCTAD RMT 2000 and 2014
Tonnage tax
Malta
No income tax or any other duty regarding registration, operation, or transaction of the shipping companies
5.9%4.35% 99.9%99.39%
Ernst & Young 2014 ; UNCTAD RMT 2000, 2001, 2014, Deloitte (2015)89
Tax credits
Tax refunds
Freight taxes exception upon reciprocity from shipowners’ country
15% income tax to seafearers if work outside Malta
Belgium
Tonnage tax
0.0%0.49% 97.97%54%
Ernst & Young 2014 ; UNCTAD RMT 2000, 2001 and 2014
Accelerated depreciation
Investment deduction
Tax exemption from risk capital
Suspended customs duties
VAT exemptions
Negotiated Harbor fees exemptions
No freight tax
Employer social security contribution exemption
88 https://www.pwc.com/sg/en/tax/assets/publication-solutionsforshippingco.pdf 89 http://www2.deloitte.com/content/dam/Deloitte/global/Documents/Energy-and-Resources/dttl-ER-Shipping-Tax-Guide-6countries.pdf

47
Countries Incentives and subsidies for the shipping
industry and maritime cluster
Controlled fleet (Deadweight tonnage share of world total)
20002014
Foreign Flag in DwT 20002014
Source
Employee’s social security contribution partial exemption
Tax exemption on dividends
Flemish government grant for strategic investments in tangible fixed assets
Flemish government grant for strategic training projects
Flemish grants for ecological investments
Flemish PPP for unloading and loading facilities
Walloon investment, training and environmental subsidies through European Structural Funds
Investment credits
Portugal
Exemption on corporate income tax
0.2% 0.06% NA86.81%
Ernst & Young 2014 ; Port of Lisboa 2013; UNCTAD RMT 2000, 2001 and 2014
Exemption on capital gains
Exempted 70% of profits from maritime transport
Reduced income corporate tax of 5% until year 2020
Ceilings on taxable incomes based on job creation
Seafearers exempt from income tax
Financial and tax grants provided on a case‐by‐case basis
Port due discounts
Spain
Fast asset depreciation
0.3%0.13% 94.18%68.64%
Ernst & Young 2014 ; UNCTAD RMT 2000, 2001 and 2014
Tonnage tax
Canary Islands allowance
Tax credits for safety and environment
90% contribution to employer’s national insurance
No freight tax
Canary Island special registry exempt from special tax
Financial support for shipbuilding companies
State guarantee on 35% of the financed price for acquisition or renovation of vessels
Environmental aware deductions
Poland
No freight tax
0.23%0.17%
NA98.47%
Ernst & Young 2014 ; UNCTAD RMT 2000, 2001 and 2014
Tonnage tax applies, under certain tax payer conditions. Then Corporate Income Tax is waived.
Tax exemptions
Tax credits
Romania Recent Smart Specialisation Strategies (RIS3) for maritime transport and clusters
0.37%0.06% 52.78%94.73%
MARE/2012/07‐REF.No2; UNCTAD RMT 2000, 2001 and 2014
Bulgaria Short sea shipping national policies 0.2%0.08% NA80%
MARE/2012/07‐REF.No2; UNCTAD RMT 2000, 2001 and 2014
Source: Own elaboration
Thus, incentives can be classified according to their contribution to control and flags of their fleet as follows: Incentives supportive of the overall shipping industry with strong appeal for foreign flags
(i.e. Singapore)

48
Incentives supportive of the overall shipping industry with strong appeal for national flags (i.e. Belgium)
Incentives mainly retaining national flags (i.e. China, USA, Turkey, India, Russia and Spain) Incentives mainly retaining foreign flags (i.e. Brazil) No grants, subsidies, subventions, or any other type of incentive, other than exemptions,
but with very attractive cost structures for foreign flag ships to register their vessels
A closer analysis of the two types of incentives that are supportive of the overall shipping industry demonstrates that there are common features as well as differences. The key commonality between Singapore and Belgium is the large support mechanisms on shipping and maritime clusters formation. Cluster development incentives include: 1) manpower development co-funds for manpower, training initiatives and capabilities; 2) business development with eligible expenses incurred in the initial development of new maritime companies and organisations setting up, or existing maritime companies and organisations expanding into new lines of maritime businesses; and 3) supporting productivity gains through improved business processes and technological solutions. In sum, competences, capabilities, and innovation support for the maritime cluster, not only for the shipping companies but for the whole maritime cluster, seem to build upon basic tax and investment incentives with the aim of bringing industry from basic development and growth potential to the competitive edge. The key differences are 1) the absence of tonnage tax in the case of Singapore and its presence in Belgium, and 2) the strong focus on national shipping industries promotion in Belgium, whilst international shipping industries is the focus of Singapore. Overall, Belgium looks for more inward looking cluster formation, whilst Singapore for a more outward looking cluster formation. Singapore is looking at the international shipping cluster based on their territory, rather than protecting or promoting a shipping cluster based on national flags. For the performance in terms of controlled and share of foreign flags, Singapore seems to have an edge regarding the scale and scope of operations thanks to the support to shipping companies regardless of their fleet flags, compared to the national flagged supported shipping companies in Belgium.
2.12 New infrastructure, ports and routes
2.12.1 New intercontinental routes New intercontinental routes might influence the route choice and competitive position of ports and carriers. Two alternative intercontinental routes are under discussion, namely the Northern Sea Route, between Europe and Asia, and the land bridge between China and Europe. Furthermore, capacity expansions of the Panama and Suez Canal or the construction of the Nicaragua canal might have substantial influence on the route choice and operation options and costs for carriers. Northern Sea route The North Sea Route potentially saves between 20% and 40% of the travel distance between North Europe and the North part of East Asia (Japan, Korea, North part of China). For example, a 24% distance reduction could be realised between Shanghai and Rotterdam. Substantial research has been done over the years to estimate the potential of this North route. As early

49
as the 1990s the International Northern Sea Route Programme (INSRP)90 studied the potential of this route and their findings were more recently reconfirmed and remain valid in 201091: 1) there will be less ice but annual fluctuations make the route unreliable; 2) besides savings in travel time, there is also the additional cost for carriers to ice-strengthen
their vessels; and 3) substantial investments in navigation infrastructure still need to be made (actual, serious
investments are currently not being made). A recently published study92 in 2014 by an internationally co-operative group of researchers states that the advantage of the distance reduction is offset by many factors including harsher weather and free floating sea ice. This requires more expensive ship construction and ice movements lead to unpredictable arrival times for ships. Furthermore the remoteness and lack of communication systems increase the risk inherent with artic operations and shallow waters limit vessel sizes. For these reasons the researchers concluded that this route is a less reliable seasonal alternative to the Suez Canal, especially for container transport. The lack of current use of this route seems to confirm the complexity of using this route. Although climate change will reduce the amount of ice in this area it is in our view unlikely that this route will become a primary sailing route in the short to medium term. The issues of unreliability, additional investment costs and vessel size limitations seem to be major obstacles for the container shipping industry. In the short to medium term higher potential exists for shipping traffic to the Arctic driven by available mineral and energy sources in the region. Asian markets especially are likely to drive Arctic resource developments, for example for China this will reduce its dependency on the Strait of Malacca for the flow of critical resources. Involvement of the EU in the development of the artic area, and transport to and from this area, seems very relevant. Involvement of the EU in the development of the North Sea Route could be on a lower scale and the EU could increase its level of involvement once actual investments in the navigation infrastructure are made by Russia. Land bridge Asia and Europe Besides the Northern Sea route there is also renewed interest in using a land bridge between Asia and Europe as an alternative for the maritime flows through the Suez Canal. The most famous land bridge is the trans-Siberian railway and the New Eurasian land bridge has been established and routed through Kazakhstan. Over the last years the first regular services have been established, such as the three weekly services of the Transpharma Express between Chongqing (China) and Duisburg / Antwerp, or the service between Lodz, Poland to Chengdu in China. In 2014, the number of containers transported on the land bridge was still small and estimated at around 25 thousand TEU by the Russian railways. Regarding the future potential of the land bridge as an alternative for the Suez route, capacity constraints will set an upper limit. The Trans-Siberian railway line can handle up to 200,000 TEU of containerised international transit freight per year (Russian Railways). Other unofficial estimates on service levels, requiring additional investments, might be higher. Even if 500 or 600,000 TEU is considered, this will still be a relatively modest share of the large Euro-Asian
90 Ragner, C.L., Nothern Sea Route Cargo Flows and Infrastructure – Present State and Future Potential, FNI report 13/2000, Lysaker: Fridtjof Nansen Institute, 2000 91 Moe, A. and Jensen O., Opening of new artic shipping routes, standard briefing for Directorate-General for external policies of the Union, study requested by the European Parliament, 2010 92 Farre A.B., Stephenson S.R., Chen, L., Czub M., Dai Y., Demchev D., Efimov Y., Graczyk P., Grythe H., Keil K., Kievekas N., Kumar N., Liu N., Matelenok I., Myksvoll M., O’Leary D., Olsen J., Pavithran S., Petersen E., Raspotnik A., Ryzhov I., Solski J., Suo L., Troein C., Valeeva V., Rijckevorsel J. and Wighting J., Commercial artic shipping through the Northeast passage: routes, reources, governance, technology and infrastructure, Polar geography, 37:4, DOi: 10.1080/1088937X.2014.965769, 2014

50
container flows. For example, the EU - China container flows are already above 10.000,000 TEU and are likely to see substantial growth in the future (see chapter 3 on scenarios). A presentation by Dr. Xuezong of the Shanghai Maritime University concludes that the market share of the Eurasian land bridge, including the new Eurasian land bridge through Kazakhstan, will remain at less than 5% of the total flows between China and Europe. Other research93, applying a strategic network choice model for calculating the impacts of the land bridge option, suggests that from a demand perspective, a significant market share can be realised in East and Central EU Member States (between 10% and 20%). The market potential for West-EU Member States seems very limited, due to relatively lower shipping costs to West Europe and relatively higher transport costs on the land bridge in comparison with East-Europe. From a transport cost perspective the most beneficial connections for the land bridge are the connections between inland locations in West China and locations in East and Central Europe. For these connections the savings on hinterland transport costs, to and from the ports in East China and West or South Europe, are much higher than for South or West European locations. This is because these are served very competitively by large container ships. The analysis of the market demand shows that this route is potentially interesting at least for part of the industry in East Europe. An important aspect will be if substantial return flows can be organized to avoid the running of empty trains. Another uncertainty is the supply side options as current capacities are limited and substantial investments and international cooperation would be needed to increase the capacity on these connections. For the European Union the land bridge option can be feasible for specific niche markets or geographical parts of the EU. For the total trade between the EU and Asia the impacts are likely to be small. Regarding the land bridge, even after substantial investments, the capacity of this route is limited from a European perspective. At maximum this line can handle a few percent of the total trade flows between Europe and East Asia, but as mentioned for specific relationships, between East Europe and West China, the land bridge option has the potential of a larger market share. Finally the EU itself has already its own alternative to the Chinese land bridge running. Since 1993 the TRACECA programme (Transport Corridor Europe-Caucasus-Asia) involving the European Union and East European, Caucasian and Central Asian countries aimed to develop an alternative transport corridor for the traditional Moscow centred transport connections of the majority of the participating countries. Many EU funded projects have been implemented since the establishment of TRACECA, and some were able to identify and implement a business case for transport on this corridor, like for instance the transport of LPG from Kazakhstan via Azerbaijan and Georgia towards the EU. Canal expansions In the international maritime flows the Suez and Panama Canals are critical links in enabling the current flow patterns. For transport flows between the Atlantic Ocean and Pacific Ocean, the Panama canal expansions and Nicaragua Canal project are important developments. The Panama Canal expansion project (also called the Third Set of Locks Project) intends to double the capacity of the Panama Canal by 2016 by creating a new lane of traffic and allowing more and larger ships to transit. Recently, the development of the competing Nicaragua canal at the end of 2014, has also been announced. The Nicaragua channel is heavily supported by Chinese investors and should function as an economic and geopolitical competitor for the Panama Canal which is considered to be partly US dominated.
93 Tavasszy, L., Minderhout, M., Perrin, JF and Notteboom T., A strategic network choice model for global container flows: specification, estimation and application, Journal of Transport Geography 19 (2011) 1163-1172, 2011

51
Canal developments, allowing larger vessels, and the competition between these canals could result in falling prices for the canal passing and lower cost for the industry sailing these routes. An analysis of Panama Canal route compared to other routes has been made with the Panama Canal Route Competitive Analysis Model94, which assesses the competitiveness of maritime routes based on total transportation expenses95. In the analysis the maritime transportation costs are derived from alternative route itineraries applied to different vessel types and vessel sizes. One of the main findings of this study is that the value of Canal routes increases in times of heightened fuel prices. This means that the relevance of the Panama canal for the industry is scenario depended related to energy price developments The expansion of the Panama Canal is also of importance from an environmental point of view as it will prompt reductions in the total world CO2 emissions96. The Canal's expansion will prevent the saturation point from being reached and will avoid diversion of traffic to potentially longer alternative routes, such as the Suez Canal and Cape Horn. This will help in reducing distances and fuel consumption. In addition, the widening of the Canal may promote the construction of use of modern-type post-Panamax vessels, making the transportation of freight more efficient through economies of scale. The Panama Canal Expansion study for the US97 emphasizes the increased size of the vessels from 6,000 to 13,000 TEU passing the canal, and the impacts of these changes on transport costs and infrastructure. The increased vessel sizes will result in more concentrated port calls and a much higher volume of containers that must be moved at each port call. These higher peak loads are likely to favour ports which have greater capacities for container handling, storage, and movement to inland destinations. The use of larger ships also leads to a greater use of feeder services. The option of using larger ships will reduce the transport costs between the Gulf Coast and the West Coast of the USA, and Asia and the West Coast of the USA and Europe. Besides the construction work in Latin America, the new Suez Canal project has started in Egypt, enlarging the transit capacity of the Suez corridor. The most important benefit of the new project is that it enables transiting in two directions at the same time, minimizing waiting time for transiting ships. The Canal authority estimates for instance, that waiting times can be reduced from between 8 and 11 hours to less than 3 hours. Furthermore, this will increase the numerical capacity of the waterway, in anticipation of the expected growth in world trade. The impacts of the canal expansions and developments on Europe are threefold: lower transport costs (in time or costs) can stimulate trade between EU and the West coast
of the USA (in case of Panama or Nicaragua canal) or Asia and East Africa in case of the Suez Canal. The Panama Canal expansion will also reduce trade barriers between East of the USA and Asia, which will make both markets more competitive for EU export products. The magnitude of these impacts is difficult to predict without a more in depth analysis of the supply chain characteristic and the capability to take advantage of the scale economies;
capacity developments allow the shipping industry to sail with larger vessels than usually on this route and to realize cost reduction. The impact on prices or profit levels will depend on the competitive nature of the trade lane. The switch to larger vessel will reduce the number of port calls and increase the reliance on feedering as part of the transport chain. The
94 Ungo, R. and Sabonge, R., A competitive analysis of Panama Canal routes, Maritime Policy & Management, 39(6) 555-570, 2012 95 Ibid 96 De Marucci, S., The expansion of the Panama Canal and its impact on global CO2 emissions from ships, Maritime Policy & Management, 39(6) 603-620, 2012 97 U.S. department of transportation, maritime administration, Panama Canal expansion project, prepared by Economic Development Research Group Inc., Boston, MA, 2013

52
importance of feeder transport, and negative impacts of cabotage regulations reducing competitive conditions for this type of transport, will increase;
increasing vessel sizes, supported by canal expansions, will reduce the number of call for European ports and increase the peak loads to be handled in the ports and on hinterland connections (see below).
2.12.1 Port capacity demand Port growth and ship size developments The high growth in container transport flows has increased world container port throughput to a level of 650 million TEU in 2013 (UNCTAD, 2014). China holds the largest share in container port throughput with 25% of the total world container port throughput; no less than seven out of the ten largest container ports are located in China. The other three ports in the top ten are located in Asia as well (Singapore, Busan and Dubai). Five of the ports listed between 10th and 20th place in this ranking are located outside Asia in the West Countries, two of them in the USA, and three in Europe (Rotterdam, Hamburg and Antwerp). The container throughput is likely to continue growing at a rate of 5-6% a year (UNCTAD 2014), resulting in a rapidly increasing demand for container facilities. The container throughput is expected to grow globally, with the highest growth rates in volumes in East and South Asia, following the economic developments in these regions. The expected increases in ship size mentioned earlier in this study (see section 2.3 and above) will also result in more concentrated port calls, putting additional pressure on port and hinterland capacities. As the industry has switched their approach more and more to a chain based approach, valuating the quality of the chain rather than individual ports or connections, policy makers could benefit of a more integrated approach as well. The forecasted growth of maritime transport, see scenario section, in combination with larger vessels call for additional port investments in their access routes, quay and terminal capacity. But probably the largest challenges is in on the hinterland capacity of many European ports, The hinterland connection forms a large part of most transport chain costs and most routes are already heavily utilised within Europe. This is often the result of a mixture of port and urban related transport flows on the rail and road network in Europe causing congestion, environmental pollution and safety concerns. Supplying safe, environmental friendly and reliable hinterland connections is a long term and highly complicated policy challenge for Europe. The complexity to realize infrastructure in highly urbanized areas, in combination with increasing environmental and safety pressure to limit access for freight transport on combined networks, the capacity and reliability of the hinterland connections might become more and more the bottleneck in the transport chains to- and from Europe. Part of these challenges have been set out in recent studies on nine corridors within Europe set out the challenges for future infrastructure development in these core hinterland corridors98. Competitive situation of European ports The competitive position of European ports can be analysed at the level of port ranges, the North European port range versus the South European port range, and at the level of the ports within a range.
98 http://ec.europa.eu/transport/themes/infrastructure/ten-t-guidelines/corridors/corridor-studies_en.htm

53
At the level of the port ranges the competition between the North and South European ports is still modest for both hinterland and transhipment transport. A study by Newton et al99 demonstrates that these ports are really only competitive for a rather small geographical area. The natural barriers formed by the mountains between North and South Europe limit the competition between these two port ranges. In the coming decades this situation is likely to remain”. This means that most ports are predominantly competing with ports in their own range or other ports located in the same region. In the Mediterranean area, South European ports are competing with each other but also face severe competition from North African ports for their transhipment flows. In the West part of the Mediterranean Sea, the European ports of Algeciras, Valencia, Marsaxlokk and Gioia Tauro compete for transhipment flows with the port of Tangier in Morocco. Over the last five years these ports together, including the EU ports and Tangier, have shown a growth of more than 30% in TEU100, with Tangier growing at the highest rate of 112%, and lower than average growth rates for Gioia Tauro and Valencia. Of the European ports, Algeciras shows the highest growth rate and like Tangier, benefits from its location on the cross section of east-west (Asia- Europe) and north-south (Europe- Africa) flows. The competitive position of the port of Tangier is further strengthened by its close relationship with world leading terminal operators and container shipping industry, for example illustrated by the investments of APM terminals in terminal capacity. Finally the port of Tangier can benefit of local environmental, safety and labour regulations, which are considered, at least by European ports, as less stringent. South ports mention that "one-size-fits-all" regulatory approaches do not work as, for example, Emission Control Area regulations might have a different impact on South ports than North ports. The competitive position of South European ports is different from North European ports as they face more competition for their transhipment markets from non-European ports, like North African ports and ports in Turkey. In the East of the Mediterranean Sea, the port of Piraeus competes with Port Said. Substantial investments in container handling capacity in the port of Piraeus over the last year have resulted in a growth in container flows from only 600,000 TEU in 2009, to more than 3.000,000 TEU in 2013. The success of these investments is closely related to the strategic involvement of Cosco Holding. This Chinese state owned conglomerate obtained a concession for 35 years in Pireaus to operate a part of the container terminal101. Besides Cosco Pacific, the world´s fifth largest container terminal operator, the holding also has an interest in Cosco Container lines, the world´s fifth largest container liner company. In the future Asyaport located near Istanbul in Turkey is likely to become a new competitor, the terminal operator in this port is linked with MSC container liners. Ports in the North European port range are mainly competing for hinterland and transhipment flows with other ports within this range. For the market share in the transhipment market the North European port range (Le Havre – Hamburg range) faces less competition from ports outside the range (e.g. ports in Spain, UK, Scandinavia). These ports have less scale advantages and are geographically less advantageously located to combine transhipment and hinterland flows. However, for ports in the North range, the size of the transhipment market is uncertain as overall market developments such as a trend towards increased hub-spoke flows, driven by increasing vessel size, or more direct flows, driven by hinterland developments and access options, influence their transhipment markets. , The London Gateway development For example competes for the UK market, as a port of direct call for UK hinterland transport, with
99 Newton S, Kawabata Y, Smith R., The balance of container traffic amongst European ports. Final report. Panteia, Zoetermeer, 2011 100 IAHP world ports 101 Clingendael, Chinese Investment in the Port of Pireaus, Greece: The relevance for the EU and the Netherlands, February 2014

54
transhipment flows from ports in the North European port range, and especially with feeder flows from the ports of Zeebrugge, Antwerp or Rotterdam. Similarly, in the Baltic Sea, direct flows to Sweden, Poland or Russia compete with feeder flows from ports in the north range like Bremen, Hamburg and Rotterdam. Other developments An important development for European ports, like Rotterdam and Antwerp, with large petrochemical clusters, is the increasing investment in refinery facilities in Asian and Middle East countries. These new and upcoming competitive facilities might affect the large petrochemical flows of processed products from European ports. The WEO102 stated in 2013 that over the period to 2035, global refinery capacity is at risk, with refineries in OECD countries, and particularly in Europe, among the most vulnerable. The uncertainty in the use of future energy carriers is recognised by the ports and, for example, the port of Rotterdam has prepared alternative scenarios regarding its position as energy port (including growth in conventional energy carriers and use of biofuels). Finally the introduction of new logistical concepts might influence the competitive position of EU ports. Mainline transhipments (in which containers are not transhipped from a large deep sea ship to a small short sea ship, but from a deep sea ship to another deep sea ship to match various line services calling at different locations), might be substantial as this will extend the geographical scope of competing ports. The traditional transhipment pattern of a long distance journey on a deep-sea ship and a short distance on a small ship is geographically more restricted as it is not efficient to sail too long on small ship instead of a large deep-sea ship. In the case of transhipment between two deep-sea vessels the sailing costs are equal and the location of transhipment can be anywhere along the trade line as it does not influence the sailing costs. Following this concept, the transhipment of a container between Shanghai and London can take place in Singapore or Dubai as well, instead of the current options of Antwerp or Rotterdam.
102 International Energy Agency, World Energy Outlook 2013, Paris, France

55
3 Scenario exploration of future developments
3.1 Introduction
A scenario approach has been followed to address the uncertainties in future developments in an explicit manner and to support the development of a robust strategy. The scenarios include the main drivers affecting the outlook and prosperity of the EU maritime industry. The outlook and prosperity of the maritime industry is influenced by exogenous drivers outside the sector, like macro-economic or demographic developments, and sector specific developments for the maritime industry, such as environmental, labour or security regulations for the maritime sector. This chapter describes the external macro-economic scenarios and integrates the sector specific developments into these scenarios. In total three scenarios were distinguished, varying in economic growth, openness and international co-operation, and sustainability. The maritime drivers to be included in the scenarios have been introduced and discussed in the previous section. The three scenarios in this study are the sustainability scenario, the fragmented world scenario, and the conventional development scenario. The scenarios have been developed by combining existing available insights on external uncertainties, like economic growth in Europe or China, with sector specific insights for the maritime sector which were derived from the analysis carried out in the previous chapter and were verified with stakeholders from the maritime sector. The scenarios are long term scenarios and describe the main transitions over the coming decades in the period up to 2050 and intermediate results are discussed for 2030. A long term period is chosen to analyse the impacts of more fundamental changes, such as common use of alternative fuels or changes in the economic importance of regions. For these developments a long term view is needed to assess their full impacts. These scenarios are differentiated along the main characteristics for the maritime sector and can be briefly described as: The sustainability scenario describes a world that is making relatively good progress towards sustainability. The world is characterised by an open, globalised economy, with relatively rapid technological change directed towards environmentally friendly processes, including clean energy technologies and yield-enhancing technologies for land. For the maritime sector, the economic developments and international cooperation create a high growth in demand for maritime transport, especially in manufactured products and associated container transport. The growth in conventional energy carriers such as oil and coal is low in this scenario as these energy sources are only used for dedicated purposes. Technological progress and environmental regulation results in more efficient vessel design and operations, slow steaming and gas-fuelled engines. International cooperation results in a more global playing field regarding environmental, safety and labour regulations. The fragmented world scenario can be characterised by the world being separated into regions with extreme poverty, pockets of moderate wealth, and a bulk of countries that struggle to maintain living standards for a strongly growing population. Regional blocks of countries have re-emerged with little coordination between them. The world has de-globalised, and international trade, including energy resources and agricultural markets, are severely restricted. For the maritime sector, this represents a low growth scenario affected by both the lack of economic growth and the de-globalisation of the economy. Worldwide energy and agricultural flows are diminished by the focus on the self-sufficiency among countries and trade blocks. The focus in this scenario is oriented more toward short sea shipping, facilitating trade within the own region, than on deep sea shipping. Region and country specific safety,

56
environmental and labour regulations make it difficult to operate worldwide, and European companies are affected by stricter regulations from the EU. The conventional development scenario is oriented toward economic growth. This is a high economic growth scenario with an energy system dominated by fossil fuels, resulting in high GHG emissions. The high economic growth in all parts of the world and increased globalisation of the economy strongly increases maritime trade demand for all types of maritime vessels. The strong reliance on traditional energy sources, and technological progress to exploit more complex sources efficiently, supports a high growth in the maritime transport markets for oil and gas. Industrial growth and consumptive growth, driven by rising incomes, result in high growth figures both for bulker transport as well as container carriers. The economic centre of the world has moved to East Asia and flows to this region from other Asian regions (South Asia and Middle East) and Africa are dominant. Europe is a relatively modest economic player and its maritime sector is challenged to keep its market share in the global market. As a starting point for the scenarios we have used long term global projections from the OECD for economic growth and environmental growth103. These scenarios are supplemented with demographic and education level forecasts from the IIASSA104, and long term energy consumption forecasts from Vienna University105.
3.2 Overview of the main scenario assumptions
This section briefly presents an overview of different assumptions for the main drivers of the three scenarios. The scenario drivers are subdivided in table 3.1, presenting drivers for the economy, natural resources, and demographic developments. Increasing productivity and income level per capita, due to higher education levels or better access to capital, are important factors explaining changing consumption patterns from basic consumption for low-income households, like basic food and energy products, towards more manufactured products for middle income households, like electronic products or cars. This last aspect has a strong impact on the trade relationship between the EU and developing countries with a strongly increasing middle class. Table 3.2 presents the maritime drivers. The developments on the macro-economic, demographic, and energy scenario drivers as presented in Table 3.1 are described in Annex IV. In table 3.1, the economic drivers are subdivided in frontier growth, convergence speed and openness. A high frontier growth means that the productivity of the economic front runners among the countries is growing fast. The convergence speeds assumes how fast the gap between the front runners and the less advanced economies is diminishing. Finally, the openness is a measure on how easy it is to trade.
103 Chateau J, R. Dellink, E. Lanzi and B. Magne, long-term economic growth and environmental pressure: reference scenarios for future global projections, OECD 2013 104 KC, S., Lutz, W., The human core of the shared socioeconomic pathways: population scenarios by age, sex and level of education for all countries to 2100. Global Environmental Change, 2014 105 Csereklyei Z. and S. Humer, projecting long-term primary energy consumption, department of economics, working paper No. 152, May 2013

57
Table 3.1 includes scenario assumptions on the price and type of natural resources. Conventional stands for oil, gas and goals, while unconventional stands for shale gas, shale oil and tar oil. Regarding the population, assumptions are included on the population growth and education level. The size of the population is a weight factor in the overall consumption and productivity of a country. The education level is an important indicator for the productivity per capita. Both are of high relevance to explain developments in trade volumes and type of products. For example, assuming constant productivity, a doubling of the population can result in a doubling of the size of the economy and associated trade flows.
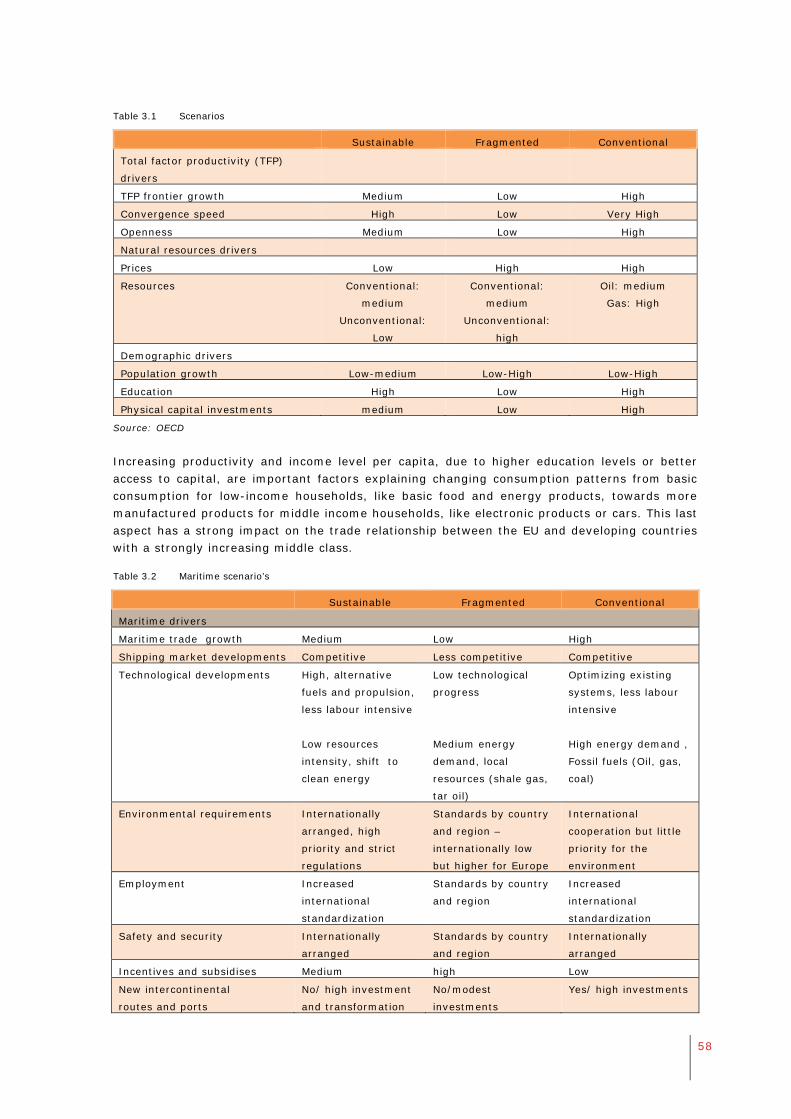
58
Table 3.1 Scenarios
Sustainable Fragmented Conventional
Total factor productivity (TFP)
drivers
TFP frontier growth Medium Low High
Convergence speed High Low Very High
Openness Medium Low High
Natural resources drivers
Prices Low High High
Resources Conventional:
medium
Unconventional:
Low
Conventional:
medium
Unconventional:
high
Oil: medium
Gas: High
Demographic drivers
Population growth Low-medium Low-High Low-High
Education High Low High
Physical capital investments medium Low High
Source: OECD
Increasing productivity and income level per capita, due to higher education levels or better access to capital, are important factors explaining changing consumption patterns from basic consumption for low-income households, like basic food and energy products, towards more manufactured products for middle income households, like electronic products or cars. This last aspect has a strong impact on the trade relationship between the EU and developing countries with a strongly increasing middle class.
Table 3.2 Maritime scenario’s
Sustainable Fragmented Conventional
Maritime drivers
Maritime trade growth Medium Low High
Shipping market developments Competitive Less competitive Competitive
Technological developments High, alternative
fuels and propulsion,
less labour intensive
Low resources
intensity, shift to
clean energy
Low technological
progress
Medium energy
demand, local
resources (shale gas,
tar oil)
Optimizing existing
systems, less labour
intensive
High energy demand ,
Fossil fuels (Oil, gas,
coal)
Environmental requirements Internationally
arranged, high
priority and strict
regulations
Standards by country
and region –
internationally low
but higher for Europe
International
cooperation but little
priority for the
environment
Employment Increased
international
standardization
Standards by country
and region
Increased
international
standardization
Safety and security Internationally
arranged
Standards by country
and region
Internationally
arranged
Incentives and subsidises Medium high Low
New intercontinental
routes and ports
No/ high investment
and transformation
No/modest
investments
Yes/ high investments
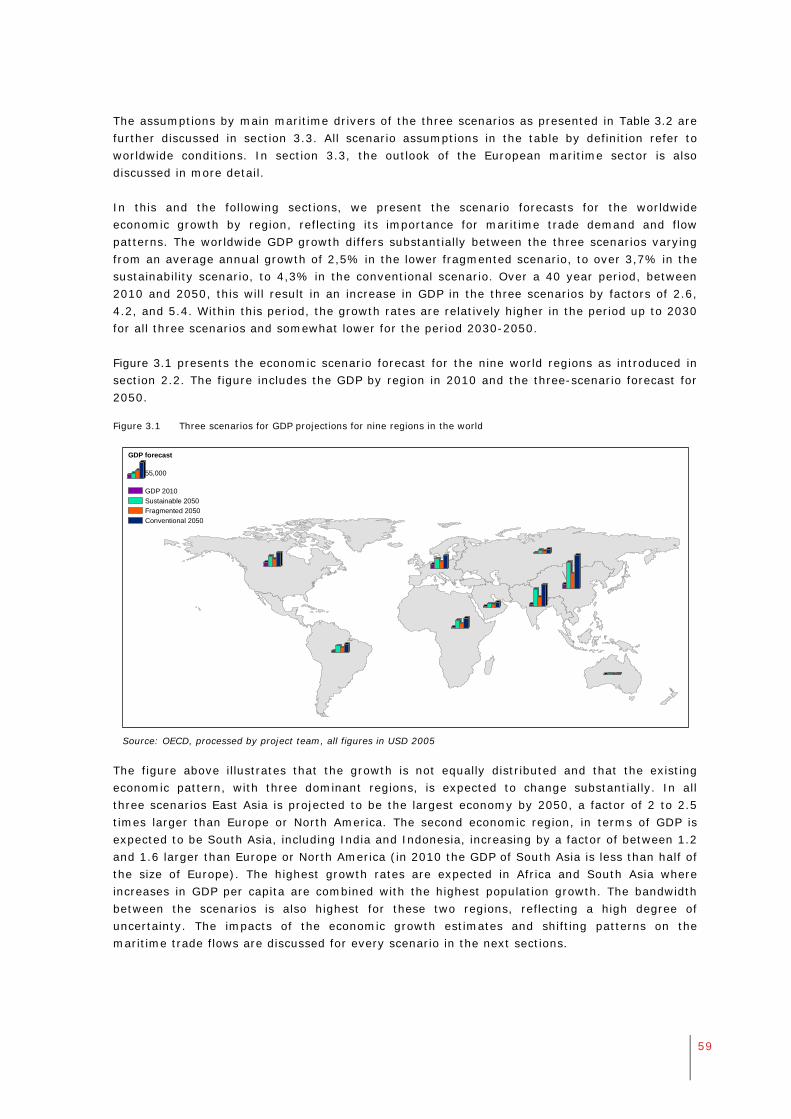
59
The assumptions by main maritime drivers of the three scenarios as presented in Table 3.2 are further discussed in section 3.3. All scenario assumptions in the table by definition refer to worldwide conditions. In section 3.3, the outlook of the European maritime sector is also discussed in more detail. In this and the following sections, we present the scenario forecasts for the worldwide economic growth by region, reflecting its importance for maritime trade demand and flow patterns. The worldwide GDP growth differs substantially between the three scenarios varying from an average annual growth of 2,5% in the lower fragmented scenario, to over 3,7% in the sustainability scenario, to 4,3% in the conventional scenario. Over a 40 year period, between 2010 and 2050, this will result in an increase in GDP in the three scenarios by factors of 2.6, 4.2, and 5.4. Within this period, the growth rates are relatively higher in the period up to 2030 for all three scenarios and somewhat lower for the period 2030-2050. Figure 3.1 presents the economic scenario forecast for the nine world regions as introduced in section 2.2. The figure includes the GDP by region in 2010 and the three-scenario forecast for 2050.
Figure 3.1 Three scenarios for GDP projections for nine regions in the world
Source: OECD, processed by project team, all figures in USD 2005
The figure above illustrates that the growth is not equally distributed and that the existing economic pattern, with three dominant regions, is expected to change substantially. In all three scenarios East Asia is projected to be the largest economy by 2050, a factor of 2 to 2.5 times larger than Europe or North America. The second economic region, in terms of GDP is expected to be South Asia, including India and Indonesia, increasing by a factor of between 1.2 and 1.6 larger than Europe or North America (in 2010 the GDP of South Asia is less than half of the size of Europe). The highest growth rates are expected in Africa and South Asia where increases in GDP per capita are combined with the highest population growth. The bandwidth between the scenarios is also highest for these two regions, reflecting a high degree of uncertainty. The impacts of the economic growth estimates and shifting patterns on the maritime trade flows are discussed for every scenario in the next sections.
GDP forecast
55,000
GDP 2010
Sustainable 2050
Fragmented 2050
Conventional 2050

60
3.3 Scenario description
3.3.1 Sustainable world Economic growth and maritime trade patterns Maritime trade growth in this scenario relates closely to economic growth and the current elasticity of almost a factor of 2 higher growth in trade than in economy levels over time. The sustainable scenario assumes a decoupling between economic growth and transport and in the long term an elasticity of below 1 will occur. This means that 1% of economic growth generates less than 1% of additional maritime trade. For the whole period it is assumed that maritime growth is in line with GDP growth of a factor of 4 in the period up to 2050. Within the maritime sector growth will be especially high for manufactured products and associated container transport. In comparison with the existing dominant trade flows as presented in section 2.2, upcoming dominant container flows will be South-South relationships, especially between South Asia and East Asia. Furthermore, as a result of substantial economic growth in Africa and South America these regions are becoming more and more important destinations for container carriers. In this scenario internationally operating firms become even more separated from their home countries. Maritime flows for energy products This scenario assumes a strong increase in energy efficiency and an increasing use of renewable sources of energy. Both developments are enabled by technological progress and supported by international environmental regulations. For the maritime sector this leads to a very modest growth in the transport of conventional energy carriers such as oil and coal. Although the increase in gas transport is higher, it is also under the levels of the other two scenarios. The switch to renewable resources cannot take place in the short term and the demand for conventional resources will drop after 2030. The maritime fleet development for oil tankers, LNG and LPG vessels will slow down in this scenario. Market developments - Impacts on shipping of technological progress, changing fuel cost and manning costs Technological progress in combination with stringent environmental regulations for sulphur and CO2 emissions have steered the shipping industry into a sustainable direction. The shipping industry takes advantage of a more efficient design of ships, with cost efficient gas-fuelled engines and slow steaming. Largely unmanned vessels, enabled by technological progress and co-operation on international legislation, make slow steaming an attractive option. Specialised labour on board ships is limited and flexible, with helicopters transporting the crew in and out where needed. Strict international labour conventions will make the nationality of flagging and crew a less important competitive issue. The generalised chain costs of a North Europe-Far East trip drop by about 4%. This represents yearly savings of € 177 million for the industry (in 2012 prices). Additional savings come from efficiency gains, slow steaming, and from lower operating costs for fuels like LNG, with total yearly savings up to € 399 million for the trade lane, at 2012 prices. Safety and security Safety and security will be smaller problems than today due to international cooperation, technological solutions and substantial economic progress in existing conflict areas. Coastal states worldwide will have developed coast guards which are able to enforce their coastal state jurisdiction in an effective way. EU coast guard functions will have even been integrated into one organisation acting in coastal jurisdictions in all Member States. EU shipowners can rely on strong EU navies which are able to protect EU flagged vessels and keep international sea routes secure. Territorial disputes at sea, specifically in the East Asian region, have been

61
solved peacefully by concluding maritime boundary agreements according to the principles of the international law of the sea. Incentives and subsidies Improved international cooperation also prevents an ongoing race to the bottom between countries providing incentives and subsidies to attract maritime businesses, and benefits a country’s own industry. The trade agreement between Europe and the US is the starting point for improving the international level playing field and these agreements are extended with a wider set of nations in a next stage. The shipping companies operate in a competitive environment and open market access makes it possible to benefit from scale advantages. The openness of the economies enables the EU fleet to operate successfully in the rapidly growing South-to-South flows. In this scenario the existing incentives and subsidies are focussed on sustainability aims instead of on protecting the interests of the national industry. New routes and port investments International cooperation and investments result in a well-functioning Eurasia land bridge between Europe and China with an increased capacity. Although capacities are not sufficient to become a major competitor for the Suez Canal route, the land bridge is an interesting alternative for specific niche markets and regions. The route is especially competitive for flows between West China and East Europe with a high value of time. The reduction in oil, gas and coal flows to European ports affects the petrochemical activities in European ports. The switch to renewable energy sources and efficiency measures makes the transport of energy products a less important activity for carriers and ports. The high increase in container activity, driven by economic growth and global interactions, results in substantial investment needs for European ports and hinterland connections. In the hinterland transport more sustainable modes of transport, rail, inland waterway and short sea shipping, play dominant role. Furthermore, there is a strong focus on port and infrastructure management to optimise the use of the available facilities. Information technology in combination with (semi-) automated vehicles and vessels increases the capacity of the infrastructure, reduces waiting times, and optimises the use of existing infrastructure. Outlook for European maritime sector This scenario offers good opportunities for the European maritime sector. The openness of economies and limited trade regulations makes it possible for European companies to operate smoothly in the fast growing markets of Asia and Africa. International labour and environmental agreements offer an equal, level playing field which is beneficial to European companies as they used to be frontrunners in this field. The focus on technological progress and the smaller role of labour costs are also beneficial to the relatively high labour costs on board European ships. Moreover, the scenario offers good perspectives for maritime trade with Europe. On the one hand, sustainable modes for international transportation will be sought after. These include deep sea shipping with innovative vessels for intercontinental trade, and short sea shipping for intra-European trade, which will together stimulate the utilisation levels of seaports. On the other hand, re-shoring may apply for a wider group of industries, bringing the production activity that moved out to China, back to Europe as a consequence of increased wage and transportation costs in large parts of Asia. The latter may imply a higher share of intra-European maritime transportation as compared to the 2014 situation.

62
Policy options The EU and its Member States can successfully negotiate their interests through international conventions in the field of safety, environment, labour and market access conditions. In this scenario bilateral agreements and port state control measures play a less profound role. The EU can improve its impact in international organisation through a better coordinated approach among its members. The EU can support the European ports with their switch towards renewable energy sources like biofuels. Furthermore, as conventional energy products become less important for the European ports, the EU can support the focus on fast-growing port activities such as container transport. The growth in maritime transport also calls for an increasing importance of sustainable hinterland transport modes such as short sea, inland waterways and rail in combination ICT-driven transport management solutions. Europe aims to be the front runner in transport management and the integration of ICT and transport; this is done by actively supporting demonstration cases as part of living labs. In this scenario, the EU actively supports the improvement of the conditions for gas-fuelled ships in the European ports. This includes sufficient capacity of fuels stations, to be supported in the transfer period, and Europe-wide regulations arranging port access for gas fuelled ships. The EU takes an active role in stimulating the transition towards largely unmanned vessels. This is done through international channels as well as by being a front runner in the EU territory itself (in terms of regulation and allowing test tracks). The international regulations create a competitive level of playing field for the European flag states and additional EU regulations can be diminished in this scenario. The maritime industry in this scenario is dominated by high value added segments and Europe has a relatively strong position and well-developed system, which is a good starting position. However to maintain its leading position more investments are needed in research and development and education of specialised maritime employment.
3.3.2 Fragmented world Economic growth and maritime trade patterns In the fragmented world scenario, the economic growth is very modest at 2.5% a year on average. The world remains strongly divided in blocks with developed countries and regions with severe poverty. De-globalisation and a strong regional focus have a negative impact on maritime trade flows and the growth in maritime transport. Therefore, maritime growth is assumed to have a growth factor of no more than 2.5 times until 2050. Furthermore the focus on regional economic blocks will result in a relatively higher growth for short sea transport and a lower growth for deep sea transport. Additionally, the average travel distance will diminish as a result of de-globalisation. Maritime flows for energy products In this fragmented world, self-sufficiency is very important, especially in the field of energy and agriculture. For their energy supply, countries rely on local sources such as unconventional oil and gas (shale and tar) or coal (for example in China). The maritime transport volumes of agricultural products and energy carriers are severely affected in this scenario. Trade patterns are also switching from Russia and the Middle East towards the USA and Canada. Market developments - Impacts on shipping of technological progress, changing fuel costs and manning costs The shipping sector is organised by relatively small regional players and their market is protected by local regulations. The technological progress and innovations in the shipping sector are low in this scenario and emission levels are relatively high. Furthermore, the ships

63
are conventionally staffed and labour costs remain an important competitive cost. The lack of international cooperation results in country- or region-specific labour regulations putting very different requirements on the sectors. Competition is based strongly on high ship speed, 27 Knots for instance. The yearly economic losses for the North Europe-Far East trade lane, driven mainly by the reduced international trade with ASEAN countries and China, port congestion due to the increased number of smaller vessels, and increased Heavy Fuel Oil (HFO) consumption due generally use of 9,700 TEU vessels or smaller. The reason for the backlash felt by larger vessels is the need for speed, the lack of international agreements on enforcement mechanisms for environmental regulations, (especially the sulphur emissions in ECAs), which then do not succeed as well in guiding carriers’ investments into sustainable technologies like scrubbers for HFO, or to cleaner engines based on LNG fuels. Yearly crew and repair and maintenance costs increase steadily. International resources depletion and increase HFO costs per TEU to reach up to 83% of the port and sea costs in the North Europe - Far East trip.
Figure 3.2 Evolution of Port and Sea costs on the fragmented scenarios
Trip: Bremerhaven-Tanger Med-Suez Channel (Way Point) Yantian-Hong Kong-Ningbo-Shanghai
Source: Own elaboration based on van Hassel, E., Meersman, H., Van de Voorde, E., Vanelslander, T. (2014)106
Safety and security Extreme poverty in several parts of the world remains an incentive for piracy, and in certain parts of the world security is an important concern, not only at sea but also in ports. International sea routes are therefore sometimes blocked for short or longer periods, and
106 van Hassel, E., Meersman, H., Van de Voorde, E., Vanelslander, T., Impact of scale increase of container ships on the generalized chain cost, Proceedings of the IAME Annual Conference, International Association of Maritime Economists, Norfolk, 16-18/07/2014
0
500
1.000
1.500
2.000
2.500
3.000
3.500
2020 2030 2040 2050
EURo/
TEU
YearSea Sea Sea Sea Sea Sea Sea Sea Sea Sea Port
Port Port Port Port Port Port Port Port Port Port Port

64
international shipping has to look for alternative (longer) routes to evade these insecure areas. Due to further cost cutting on the security budgets of Member States, EU shipowners cannot rely on strong EU navies to protect EU flagged vessels and to keep international sea routes secure. Territorial disputes at sea, specifically in the East Asian region, have led to armed conflicts which have blocked maritime transport to these areas. Only a few coastal states worldwide have developed coast guards which are able to enforce their coastal state jurisdiction in an effective way. EU coast guard functions do not cooperate efficiently and fail to implement coastal state jurisdiction. Incentives and subsidizes Incentives and subsidies are widely used to support and protect national industries. Global institutions do not function properly and the EU needs to negotiate its interests with changing coalitions. The EU Member States increase the protection of their own maritime industry, driven by a lack of global coordination, with more favourable taxation rates and an increasing number of tax exemptions. New routes and port investments Opening up new routes, like the North sea route or Eurasia land bridge requires complex international coordination and investments. In this fragmented world this is unlikely to be realised. The required port investments are rather modest in this scenario, in line with the modest growth in transport flows. The focus on short distance flows has slowed down the increases in vessel size volumes. Therefore, most ports can cope with the future sizes of the vessels, without large investment programmes for deepening access routes. Port congestion might occur however, due to the increased number of vessels. The hinterland investments are less substantial in this scenario following a lower growth in trade volumes and less concentrated calls by large vessels. The focus on self-sufficiency in energy and agricultural products limits the need for port infrastructure to store and refine oil or gas and agricultural bulk products. Outlook for European maritime sector This scenario offers a serious threat for the European maritime industry as their current market share is bigger than the economic size of their region. The regional blocks will limit the options for European players to realise a substantial market share in other regions. Furthermore, the European maritime sector suffers from much stricter European environmental and safety regulations than other regions do. As a result of the trade within regional blocks, short sea shipping will become a relatively more important activity in comparison with deep sea shipping. The limited market access and relatively modest growth of the economy slows down the increases in average vessel size and in this scenario, feeder transport becomes less important. Lack of international and EU protection will force the maritime sector to arrange its own security, putting additional costs on maritime transport. Policy options The EU and its Member States are not successful in realising their ambitions through international conventions in the field of safety, environment, labour and market access conditions. Bilateral agreements are of key importance to realise market access, and preferred supplier relationships need to be established. In particular the US and Canada are important partners in this fragmented world and as source of energy and food supply. Furthermore, port state control measures are supported by the EU. These agreements require less global coordination and can still be effective in realising a preferred, level playing field as shippers prefer to have flexibility for their ships in gaining access to markets. The EU puts pressure on

65
its neighbouring countries in the Mediterranean area to comply with the port state control measures as well and to avoid competitive differences in this field. The EU responds to the international practice of widely used incentives and subsidies, to support and protect national industries, by widening the state aid framework for the maritime sector. The growing segment of maritime activities not related to transport is included in the state aid framework to support Europe’s position in this segment. Furthermore, the EU sets stricter requirements on ships sailing in EU territory, as in other regions in the world, to protect EU employment in the maritime sector. This protection covers all levels of employment including more basic employment and the maritime sector plays an important role in reducing unemployment within the union. For global transport, outside the EU territory, such protection is not feasible, due to the competitive nature of the global shipping sector. In this scenario, there is less pressure on port and hinterland investments and this becomes a lower policy priority. Support of sustainability investments becomes a lower priority than in the other scenarios, as there are no globally accepted standards. That means that in international waters and in the other continents, ships should use technologies that are competitive, and economy prevails over sustainability. However, support of automation and technological advancement is a key requisite, as that it may be the only way for European shipping companies to survive in a world without homogenised employment standards. Also in this scenario research and developments investments are of high importance for the EU maritime sector to remain competitive.
3.3.3 Conventional high economic growth scenario Economic growth and maritime trade patterns This scenario is the high growth scenario for the maritime sector, combining a high economic growth of on average more than 4% a year, and a relationship of economic growth and trade of a factor of almost 2 (in line with the last 20 years) in the first period, declining towards 1 in the long term. The higher growth in trade also results in a higher growth rate for maritime transport volumes, slightly reduced by decreasing volume to value ratios. In this scenario, maritime trade is expected to grow on average by between 5% and 6% a year, resulting in volumes of 3 to 4 times larger in 2030, and volumes of between 6 and 10 times larger in 2050 compared to 2014 levels. These high growth rates are expected in all market segments of the maritime transport market. The highest growth rates are concentrated in Asia and Africa and South-South trade flows will be dominant. The flows to and from Europe will be relatively modest compared to the Asian flows. To maintain its worldwide position in shipping European companies in intra-Asian flows are needed. Maritime flows for energy products Oil and especially the transport of gas, will flourish as conventional sources remain the most important sources of energy and technological progress is used to exploit deep sea or polar sources for oil and gas. In this scenario, the oil tanker, LPG, and LNG vessels have the highest growth rates of all three scenarios. The flow patterns in oil products are more diversified as Brazil, Africa, and the North Pole area are becoming more and more important locations of production, besides Russia and the Middle East. The unconventional oil and gas sources (shale oil and gas) peak temporarily in 2020 and after that the market share of these sources will decline. Market developments - Impacts on shipping of technological progress, changing fuel cost and manning costs International cooperation is focused on economic growth and environmental concerns will have a lower priority. Safety and security regulations are taken to ensure smooth and efficient operations. Furthermore, there is an international agreement on resolving trade barriers and

66
on promoting a global, level playing field. Operationally speaking, ships will run on LNG to reduce fuel and maintenance costs, rather than for environmental concerns. As shown in Figure 3.3, two container shipping markets develop. The stacked bar on the right hand side represents a North Europe to Far East trade lane trip cost structure in the slow steaming market. This is a service for industries with high resilience to long and variable cycle times in their supply chains. These supply chains are resilient due to high interconnectivity between actors, which allows for the reallocation and re-scheduling of resources in real time upon informed changes. For this market segment a large increase in average vessel size is assumed. The stacked bar on the left hand side represents a trip cost structure in the fast steaming market for the same trade lane. This is a service for industries shifting from air to sea transport, thanks to technological developments in reefer and temperature controlling containers for sea transport. For the second market, shorter cycle times are required, less ports are called at, and carriers use smaller vessels as a result of more customised transportation routes due to better integration with their supply chains from shippers to consumers.
Figure 3.3 Port and Sea costs on a conventional high growth scenario
Fast steaming trip: Bremerhaven-Hong Kong-Ningbo-Shanghai
Slow steaming trip: Bremerhaven - Tanger Med – Yantian - Hong Kong – Ningbo - Shanghai
Source: Own elaboration based on van Hassel, E., Meersman, H., Van de Voorde, E., Vanelslander, T. (2014)107
Safety and security Safety and security remain problems which at times lead to insecure shipping areas. International sea routes are therefore sometimes blocked for short periods, and international shipping has to look for alternative (longer) routes to evade these insecure areas. For some areas, EU navies can assist in protecting EU shipping from threats like piracy. Most coastal states worldwide however, need further assistance with the development of coast guard functions to enforce their coastal state jurisdiction in an effective way. EU coast guard 107 Ibid
0
200
400
600
800
1.000
1.200
1.400
1.600
9700 TEUs 25 Knots 4 Calls 18000 TEUs 22 Knots 6 Calls
EURO
/TEU
Sea Sea Sea Sea Sea Sea Sea Sea Sea Sea Port
Port Port Port Port Port Port Port Port Port Port Port

67
functions have made slow improvements towards further cooperation. Territorial disputes at sea, specifically in the East Asian region, are mostly still unresolved and remain a threat for the maritime security in these areas. Incentives and subsidies Following these international agreements, the national options to promote their industry with incentives and subsidies are limited. As international interest is focussed on economic growth, incentives and subsidies to realise sustainability aims are minimal and don’t play an important role. Overall, the industry can operate rather freely without large financial disturbances. New routes and port investments New routes are likely to be fully implemented, including for instance, the North Sea Route, as limited attention to sustainability causes ice to melt faster and opens up the route for much longer periods during the year. This reinforces the use of intercontinental maritime traffic and the North sea route is especially used as a seasonal alternative for the flows between North Europe and North East Asia. In combination with the large scale exploitation of polar oil and mineral resources, investments in Scandinavian ports are needed to manage these flows. In Europe there is a strong need for increasing port facilities to store liquid gas and the petrochemical industry continues and increases its operation. Furthermore coal remains a prominent resource for power plants in Europe and is imported from various locations such as Colombia and Canada. The enormous growth in container transport puts pressure on port terminal and hinterland investments. The strong increase in vessel size demands more flexibility from the ports and hinterland connections to handle more concentrated flows. Investments in dedicated freight infrastructure are needed to disentangle long distance freight flows form urban passenger flows. Outlook for European maritime sector The European maritime sector is likely to face high growth rates under this scenario as international maritime trade is growing at such a high rate. The relative market share of the European maritime industry might come under pressure as the centre of economic growth is located in East and South-East Asia. It is likely that maritime businesses from these regions will become more and more dominant world players. Higher concerns for the environment, safety, and labour regulations in Europe might impose extra costs on the European maritime industry. In this high growth and highly competitive scenario, EU industries with a leading worldwide position, for instance in container transport, might face high growth opportunities. Vice versa, the EU industry in segments with a less dominant position might disappear or become restricted to niche markets as a result of this international competition and global specialisation. This global specialisation leaves the EU with two large deep sea markets. One market is specialised in high precision, sustainable, and Internet of Things-based services available to all segments of the shipping industries; consolidated from long standing knowledge, research, and technological development and innovation in the maritime industry applied to the vessels of the future. Another is a modular vessels design combining the most profitable shipping segments in a single vessel design, taking the passenger/ro-ro/bulk vessels concepts diversification to new levels not seen before. The common denominator in these two markets is that competition is not based on costs, but on offering high standards, new trade lanes, and innovative services. In the high growth scenario these specialised segments will reach the necessary economies of scale.
68
Policy options The EU should strive to negotiate the ambitions of its Member States through international conventions. In addition, specific attention should be given to negotiating and concluding e bilateral agreements s with the dominant Asian economies of China, Korea, India and Indonesia and the rapid growing economies in Africa. Security is a prominent EU activity and the EU plays an active role in coordinating EU Member State navies to assist in protecting EU shipping from threats like piracy. Furthermore, the EU will actively support the training of coast guards in high risk areas especially along the trade lines of high importance to Africa and South and East Asia. In this scenario, high investments in port facilities and hinterland connections are needed to manage the growing maritime transport volumes and increasing peak flows. Transport infrastructure and management investments are a top priority for the EU and its Member States. Especially investments in dedicated freight infrastructure are needed to disentangle long distance freight flows form urban passenger flows. Investments in transport management and ICT solutions are needed to deal with the fast growing volumes as infrastructure investments alone are not sufficient. As global specialisation of the maritime industry is developing swiftly in this scenario it is important that Europe focuses on a selected number of market segments in which it has a good chance to be world leading. For these selected market segments strong government support is needed to ensure technological advancement for the European industry. The changes are highest for Europe in high value market segments and if clusters of innovation including government, industry and educational institutions can be created for these segments.
69
4 Analysis of the Position of the EU Maritime Industry Internationally
4.1 Introduction
In 2007, the European Commission adopted its plan to place and implement an integrated, horizontal and cross-sector maritime policy.108 In 2009, the Commission updated its strategic goals and recommendations and issued a Communication that outlined the main strategic goals for EU maritime transport up to 2018.109 The strategy is built on the premise that the competitiveness of the sector should be strengthened while at the same time, the environmental performance should be enhanced. Two main issues are referred to in the strategy. The first is the ability of the sector to offer cost-efficient maritime transport services that are in line with the EU’s needs to achieve sustainable economic growth. The second issue addresses the long-term competitiveness of the shipping sector in the EU and the increase in the capacity needed to generate both value and working places in the EU, directly as well as indirectly. In 2014, in the context of the Maritime Ministerial Meeting held in Athens, Greece, the Ministers responsible for the Maritime Transport of the European Union and the EEA declared their commitment to “intensify efforts at bilateral, multilateral and international level efforts to ensure free access to markets and further liberalisation of trade in maritime services. This is to occur mainly through maritime transport agreements, or free trade agreements on a reciprocal basis, acknowledging that this would benefit the EU shipping industry, stimulate economic development, attract business activities, and foster investments.”110 Against this background, this section will analyse the position of the EU maritime industry from an international perspective. This objective will be achieved by: (1) investigating in-depth the existing bilateral agreements between the EU or individual
Member States, and ten key partner countries of the EU in maritime transport (selected on the basis of the criteria mentioned below);
(2) examining the maritime clauses of existing free trade agreements (FTAs), partnership and cooperation agreements (PCAs) with non-EU countries other than the ten selected non-EU countries;
(3) assessing the market access conditions in the maritime transport sector of the ten selected non-EU countries, focusing also on the differences between the market access conditions stipulated under the bilateral agreement and those faced during daily operations;
(4) analysing differences in the level of liberalisations in the various agreements; (5) studying the benefits (type of benefit and relating economic value) gained by the EU
shipping industry from agreements and existing bilateral maritime transport agreements between the EU or Member States with third countries
(6) examining the level of coverage of social, environmental and safety clauses in the bilateral agreements.
108 Commission Communication, An Integrated Maritime Policy for the European Union, COM(2007) 575 final of 10.10.2007 109 Commission Communication, Strategic goals and recommendations for the EU’s maritime transport policy until 2018, COM (2009) 8 110 Athens Declaration, Mid-Term Review of the EU’s Maritime Transport Policy until 2018 and Outlook to 2020. 7 May 2014.

70
In the next section we will first select ten non-EU partner countries. Subsequently, this section analyses the aspects mentioned above. This chapter presents the findings of desk research. Results from the consultations with key stakeholders are included in the next chapter. Obtaining relevant information proved difficult on certain subjects. In such cases, the following efforts were made to gain the necessary information: Search and identify the countries’ national databases that collect the relevant data; Search for generic maritime transport data available publicly or through international
databases; Search and identify relevant studies or other materials; For aspects such as feedering and relay operations, except in very few cases, no data
could be obtained due to lack of access. Furthermore, data on relay is not generally recorded, not even by the shipping companies since the relay operation is not mentioned on the bill of lading (only the place of final destination). Accordingly, it is very difficult to accurately assess the extent to which relay operations take place in the selected countries.
4.2 Scope of the analysis
The selection of the 10 non-EU maritime countries is based on four criteria, namely vessel ownership, deadweight tonnage, flag of registration, and gross weight tonnage. Table 4.1 presents the top countries for each of these criteria, as well as the list of non-EU countries that will be included in the study due to their importance in the maritime transport sector. This list has been approved by the EC as well.
Table 4.110 non-EU/EEA countries in the maritime industry/criterion and final list of countries selected for analysis (data year: 2013)
Vessel ownership
Deadweight tonnage
Flag of registration
Gross weight tonnage
List approved by the EC
1 China Japan Panama Russia Russia
2 Japan China Liberia USA USA
3 USA Republic of Korea Marshall Islands Brazil Brazil
4 Singapore Singapore Hong Kong Turkey Singapore
5 Russia USA Singapore Norway China
6 Turkey Taiwan Bahamas China Turkey
7 Republic of Korea
Bermuda China Egypt Republic of Korea
8 Indonesia Turkey Japan Algeria Japan
9 Vietnam Hong-Kong Republic of Korea Colombia India
10 Taiwan India India Saudi Arabia Panama
The scope of this review includes the analysis of the EU and MS bilateral agreements with these ten countries, which amount to a total of 75 agreements. Furthermore, our analysis includes 14 EU trade agreements which impact the EU’s maritime trade relationship with 34 non-EU countries, and 10 partnership and cooperation agreements.

71
In total, 99 agreements111, which cover the EU’s maritime trade relations with 109 countries across the globe, have been analysed. An overview of all of these agreements is included in Annex II. 90% of all trade between the EU and the rest of the world is transported by sea. This makes maritime transportation an important cornerstone for the EU’s economy, and an important incentive for it and its Member States to enter into bilateral and multilateral agreements with other countries in order to facilitate maritime trade. The EU has been active in concluding various types of agreements with these ten countries. The EU signed a detailed maritime agreement with China in December 2002, the first purely maritime agreement concluded at EU level.112 The EU has also concluded an agreement with Central America, where Panama is one of the signatories to the treaty.113 Furthermore, a free trade agreement exists with South Korea, and negotiations have been finalised for an agreement with Singapore.114 Furthermore, the EU has concluded a partnership and cooperation agreement with the Russian Federation.115 Negotiations are currently ongoing with a number of countries. The EU and the USA are undertaking negotiations as part of the Trans-Atlantic Trade and Investment Partnership (TTIP), where maritime transport-related aspects will also be addressed. A free trade agreement is currently being negotiated with Japan as well.116 Negotiations with India for a comprehensive free trade agreement were started in 2007 and are currently ongoing.117 The relationship between Brazil and the EU is governed by the EU-Brazil framework cooperation agreement signed in 1992, but this instrument only deals with maritime issues to a limited extent.118 However, Brazil is part of Mercosur119 and as such part of the EU’s ongoing negotiations for a free trade agreement with that group.120
4.3 Analysis of the agreements and day-to-day conditions
4.3.1 Relevance of the partner countries for maritime trade with the EU In order to put our analysis into perspective, it is necessary to consider the extent to which the ten selected partner countries with whom the EU or the Member States concluded agreements are relevant actors in the maritime transport sector. This will also better indicate the weight of maritime commitments made in the agreements and thus provide a clearer understanding of the EU’s position on trade with these countries. The following figures show the export and import trends between the EU and these ten countries in maritime transport.
111 The number of 99 agreements refers only to the number of relevant agreements that have been analysed. During our pre-screening of relevant agreements we have excluded a large number of irrelevant agreements that fall outside the scope of our study (e.g., agreements relating to mutual administrative assistance in customs matters or any other agreements with no reference or relevance to maritime transport, e.g. the cooperation agreement with ASEAN countries). Furthermore, the total figure of 99 agreements does not take into account secondary instruments such as amendments, additional protocols, exchange of letters, etc. These have been analysed as well, but for efficiency purposes not included in the overview table in Annex II. 112 EU Council Doc No. 8388/1/02 Rev. 1, “Agreement on Maritime Transport between the European Community and its Member States, of the one part, and the Government of the People’s Republic of China, of the other part”, (30 September 2002), hereinafter, “the EU-China Maritime Agreement” or “the Agreement”. 113 EU-Central America association agreement, available at http://trade.ec.europa.eu/doclib/press/index.cfm?id=689, last accessed on 02.02.2015 114 European Commission Press Release, EU and Singapore present text of comprehensive free trade agreement, 20 September 2013, available at: http://europa.eu/rapid/press-release_IP-13-849_en.htm 115 Partnership and Cooperation Agreement between the European Communities and their Member States, of the one part, and the Russian Federation, of the other part. 116 DG TRADE, ‘Japan;’, available at: http://ec.europa.eu/trade/policy/countries-and-regions/countries/japan/ (last accessed 25 February 2015). 117 DG TRADE, ‘India’, available at: http://ec.europa.eu/trade/policy/countries-and-regions/countries/india/ (last accessed 28 April 2015). 118 Framework Agreement for Cooperation between the European Economic Community and the Federative Republic of Brazil, OJ L262, 01/11/1995, p. 54. 119 Mercosur (or Common Market of the South) region includes Argentina, Brazil, Paraguay, and Uruguay 120 DG TRADE, ‘Brazil’, available at: http://ec.europa.eu/trade/policy/countries-and-regions/countries/brazil/ (last accessed 28 April 2015).

72
Figure 4.1 EU export to top ten countries (in million euros)
Source: Eurostat – total export carried on sea
Figure 4.2 EU import from top ten countries (in million euros)
Source: Eurostat – total import carried on sea
The figures above indicate the value of goods moved by ship based on the Eurostat Comext database. They also show that in terms of EU exports, the US and China are the most relevant trading partners for the EU. In terms of EU imports (total values in million Euros), the most relevant partners are China, the US and Russia (for the latter, the statistics also include the value of oil and gas transported by sea to Europe). The partner countries analysed have proven to be of major interest to the EU not only because of the reasons highlighted above, but also because they show great potential and development in their maritime sectors. To bring the importance of the maritime sectors of the selected countries into perspective, a short overview of the sector is presented. China is the EU’s second largest trading partner, while the EU is the largest for China. Considering that more than 80% of global trade is carried by sea, maritime transport is the backbone of the Sino-EU economic relations. The USA is the second biggest partner of the EU (for 2013), in terms of gross weight of goods handled (inwards and outwards) for EU-28 main ports.121 Furthermore, the US ranks second behind China for overall containerised port traffic in the world.122 As for Russia, it holds 121 Eurostat 122 UNCTAD (2013)
020000400006000080000
100000120000140000160000180000
2005
2010
2013
020000400006000080000
100000120000140000160000180000200000
2005
2010
2013
73
the world's largest medium-payload fleet, capable of navigating both inland waterways and sea routes.123 The EU is the biggest trading partner and investor for Turkey. Nearly 40% of its imports come from the EU, and just over 50% of its exports go to the EU.124 Approximately 85% of Turkey's foreign trade is carried by maritime transport.125 Another country that relies heavily on maritime transport for conducting trade is Japan. In terms of value, the maritime sector was responsible for 88.1% of the imports and 71% of the exports for the country, in 2012.126 Furthermore, the Japanese fleet (both the nationally flagged and the beneficially owned fleet) ranks second in the world, after the Greek fleet.127 Between 2008 and 2012, there has been a steady increase of 15% in the trade flow in goods between the EU and Central America, which makes this region and its countries of growing importance to the EU. Panama, being part of this region, is of great relevance, especially the country’s maritime sector with its Panama Canal. The Panama Canal is the nerve centre for global maritime transport that generates a variety of economic activities. Panama was ranked first among the countries for the registration of vessels of the world merchant fleet, which is composed of 8,221 ships and a total of more than 223 million gross tonnes.128 In Singapore, there are over 5,000 maritime service companies, including more than 120 international shipping groups.129 As of 2011, Singapore was the busiest port in the world in terms of annual vessel arrival tonnage (2.12 billion gross tonnes) and the world's top bunkering port (43.2 million tonnes).130 In the same year, the Port of Singapore's annual container throughput was ranked second behind Shanghai, and it should be noted that Singapore’s Registry of Ships ranks among the top 10 worldwide.131 India is highly dependent on its maritime sector since 95% of the merchandise trade in terms of volume, and 65% in terms of value are transported by sea.132 It is important to highlight that India is short of vessels and as a result of this foreign-flagged vessels are the ones dominating the Indian maritime sector. These account for the transport (excluding coastal shipping) of 92% of India's merchandise trade.133 According to UNCTAD data, Korea had the world's fifth largest fleet in deadweight terms (3.79% of total dwt) consisting of 47.4 million tonnes (1,189 vessels), of which 61.8% (453 vessels) was foreign flagged.134 Furthermore, its merchant fleet capacity more than doubled in size between 2006 and 2011, from 15 million gross tonnes to 32 million gross tonnes.135 In 2011, Brazil's exports and imports of maritime transport services amounted to US$4.8 billion and US$9.5 billion, respectively.136 According to the WTO, at end December 2011, the Brazilian-flagged navigation fleet comprised 156 ships, operated by 41 companies, with a total capacity of 2.9 million deadweight tonnes (DWT). Oil tankers represented 45.4% of total
123 http://www.globalsecurity.org/military/world/russia/morflot.htm 124 WTO Trade Policy Review: Turkey (2012), WT/TPR/S/259, para. 3. 125 WTO Trade Policy Review: Turkey (2012), WT/TPR/S/259, para. 82. 126 Trade Policy Review Japan, WT/TPR/S/276 (2013), p. 98 127 Ibid. 128 Port Maritime Statistical Bulletin. January-December-2013. Available at: http://www.amp.gob.pa, last accessed on 03.02.2015 129 WTO Trade Policy Review: Singapore (2012), WT/TPR/S/267, p. 70 130 Ibid. 131 Ibid. 132 WTO Trade Policy Review: India (2011), WT/TPR/S/249, p. 162 133 Ibid. 134 UNCTAD (2011a). 135 WTO Trade Policy Review: Republic of Korea, WT/TPR/S/268, p. 149, 2012 136 WTO, Trade Policy Review: Brazil, WT/TPR/S/283, 17 May 2013, para. 4.222.

74
DWT capacity, followed by bulk carriers (18.2%), container ships (14%), and general cargo ships (5.6%).137
4.3.2 Cargo sharing The rationale behind cargo sharing was to provide a mechanism that protects and promotes the national shipping market by guaranteeing automatic supply of cargoes and generates demand for domestic flag vessels. The importance of cargo sharing, however, has declined significantly in recent years as countries gradually phased them out. This trend is in line with our findings in the examined agreements as well. The reason for this decline is related to the emergence of the principle of freedom of maritime transport, which set the basis for the elimination of measures that restrict free trade.138 Furthermore, the relevance and importance of cargo sharing has been diminished also due to the intensification of “de-flagging” and the spread of open ship registries since these enable shipowners to benefit from more efficient cost conditions (see chapter 2). A difference should be made between cargo sharing and cargo preference. Cargo sharing arrangements can exist between two countries on a bilateral reciprocal basis as well as between a number of countries as part of a multilateral agreement. Cargo preference occurs within the same country and aims to facilitate or promote the domestic maritime shipping by according preference to domestic shipping vessels over foreign ones. No relevant information could be obtained regarding the size and economic relevance of cargo sharing and cargo preference in each of the selected countries except in Japan and the US which are presented below. The main reason for this was the lack of data and partially also the confidential nature of such information (in particularly regarding cargo preference schemes). Where data is available, this would be kept by the local statistical bureaus, ministries of transport or maritime transport authorities. Status under EU and MS agreements Provisions relating to the removal of cargo-sharing are present across the agreements of the EU and its Member States as a concrete manifestation of the signatory parties’ commitments to providing unrestricted access to the international maritime market.139 More specifically, the agreements concluded between the EU and its Member States with all ten countries considered in this study generally stipulate that the parties will be prohibited from introducing cargo-sharing clauses in their future bilateral agreements with third countries. In Russia, the bilateral maritime agreements with the EU Member States do not address issues related to cargo sharing and cargo preferences. However, no unilateral or multilateral/bilateral cargo sharing arrangements are currently in place. There are special rules applicable on government cargo, and more specifically, on non-commercial cargoes owned by the state. 140 Since 1962, the Republic of Korea has had a rigorous cargo preference scheme to promote the national flag vessel’s development. However, South Korea underwent a policy reform which ultimately abolished the cargo preference scheme. Furthermore, the FTA between the EU and South Korea explicitly eliminates any cargo sharing arrangements and this agreement
137 Ibid. 138 Parameswaren B., The Liberalization of Maritime Transport Services, Hamburg Studies on Maritime Affairs, Springer, 2004, p. 55. 139 See for instance, Art 4(3)(a) of the EU-China Maritime Agreement. 140 The Merchant Shipping Code of the Russian Federation.

75
supersedes any previous restriction on this aspect that might have been imposed by the Member States’ bilateral agreements.141 Member States’ bilateral agreements concluded with India, Turkey, Singapore, and Panama also pledge to eliminate cargo sharing. They stipulate that the parties will be prohibited from introducing cargo-sharing clauses in their future bilateral agreements with third countries. Some agreements also require the parties not applying such cargo-sharing arrangements in case they exist in previous bilateral agreements, or that such cargo sharing arrangements terminate within a reasonable period of time, in case they exist in previous bilateral agreements. The agreements of India with Poland and Germany contain a ‘parity in cargo allocation’ clause, which means that they allocate bilateral cargoes to flags of either country on the basis of equality of tonnage and earnings.142 India’s agreement with Bulgaria envisages a cargo sharing that allocates equal quantities of cargo to their respective flag vessels.143 Finally the EU-China Agreement explicitly excludes the introduction of cargo sharing clauses in future agreements with third countries concerning maritime transport and terminates such provisions in the case they exist in previous bilateral agreements.144 This means that EU operators do not face discriminatory treatment in this respect145. The examination of the agreements shows that the removal of cargo sharing arrangements is a common trend across the agreements that the EU or MS concluded with other countries. Other sources Although cargo-sharing has been gradually removed, cargo preference schemes remain present in many of the countries studied. In India, government cargo, the shipment of crude oil, and at least 40% of cargo carried by liner shipping companies must be reserved for Indian flag ships.146In Brazil domestic law requires that government cargo and government-controlled cargo can only be transported by Brazilian flagged vessels.147 The same applies for exports of crude oil extracted from Brazil, which is an important segment for major EU oil companies. There is a possibility for a waiver, which can be granted only on a reciprocal basis on up to 50% of the government-controlled cargo.148 Beyond this, waivers may be granted only when no Brazilian vessel is available. The WTO notes, based on data provided by the Brazilian authorities, that 5,350 waivers were granted to foreign vessels between 2008 and 2011.149 In fact, maritime traffic restrictions are in place throughout the Mercosur region as a result of existing bilateral cargo sharing agreements among the countries in the region. Pursuant to these agreements, access to the market is reserved only to vessels flying the flag of those countries. The agreements specifically envisage the equal share of cargo between the national flag vessels of the contracting parties, and hence cannot be viewed as a form of regional cabotage.
141 Article 7.47(4) of the EU-Korea FTA. 142 E.g., Article 5 of the Protocol between the Government of India and the Government of Poland regarding shipping services (1970). 143 Article 4 of the India-Bulgaria Merchant Shipping Act of 1976. 144 Article 4(3) of the EU-China Agreement. 145 This was also corroborated during the consultation process with the industry representatives and Member States (see chapter 5) where no evidence of discriminatory treatment on this aspect was found. 146 Indian Ministry of Commerce, India and WTO Trade in Services – Conditional offer on Maritime Transport Services, available at: http://commerce.nic.in/trade/international_trade_matters_service_indianpapers_mts_1.asp 147 Decree Law No. 666 (2 July 1969). See also, WTO Trade Policy Review, ‘Brazil’, WT/TPR/S/283 (2013), para. 4.229. 148 Ibid. 149 WTO Trade Policy Review, ‘Brazil’, WT/TPR/S/283 (2013), para. 4.229.

76
Table 4.2 Cargo transportation share of Japanese merchant fleets (until 2012)
Year
Export Import Total trade
Marine
cargoes
Transported
by
Japanese
merchant
fleets
Share
(%)
Marine
cargoes
Transported
by
Japanese
merchant
fleets
Share
(%)
Marine
cargoes
Transported
by
Japanese
merchant
fleets
Share
(%)
1990 84 33 39,3 712 470 66,0 796 503 63,1
1995 116 39 33,4 771 530 68,7 886 569 64,2
2000 130 35 26,9 807 539 66,8 937 574 61,2
2005 134 45 33,8 816 530 64,9 950 575 60,5
2010 156 45 28,7 759 466 61,4 925 511 55,8
2011 150 52 34,6 753 536 71,2 903 588 65,1
2012 161 42 26,0 799 522 65,3 960 564 58,7
Source: SooYeob Kim, Cargo Preference and Restrictions, APEC Working Group (2014)
In Japan a share of Japanese commercial cargo is transported by Japanese vessels only (see Table 4.2 above). Although Japan has no generally applicable laws supporting cargo preference, there are Government financing and direct licensing that makes it easier for Japanese flag carriers.150 In 2012, 58.7% of the Japanese maritime cargo was transported by Japanese ships.151 One year before, this share was as high as 65.1%. Since data on this aspect is not available for the other countries, no general conclusions can be drawn with regard to them. For the same reason, it also remains uncertain whether the same happens in other countries as well. In the US, cargo preference has been retained to a larger extent than in other countries. In fact, preference for US-flagged, US-built and US-owned ships to move national cargo is a policy set out under national law.152 Furthermore, under the Jones Act, it has a rich scheme of reservations, including: the shipment of exports financed by government, at least 50% of all government-generated cargo, 100% of cargoes generated by the Export-Import Bank, and 75% of certain agricultural commodities are to be carried by US vessels. In a five year period through to 2011, the cargo preference programs generated over 70 million revenue tonnes of cargo and over $9 billion of ocean freight revenue for international trading U.S.-flag vessels.153
4.3.3 Cabotage restrict ions The prohibition of cabotage entails the inability of foreign flagged vessels from moving domestic cargo within two ports of the same country. There was a lack of relevant data regarding the relevance of and economic benefits of gaining access to cabotage in each of the selected countries except in the US which are presented below. Furthermore, accessing countries’ domestic maritime databases with the purpose of retrieving relevant data has proved challenging. Despite this relevant data was available for the US. There, cabotage or coastwise trading represents only a limited share of the total waterborne transport market. In 2011, cabotage
150 SooYeob Kim, Cargo Preferences and Restrictions Applying to Specific Trades, APEC 40th Transportation Working Group 2014. 151 Ibid 152 Merchant Marine Act of 1920 153 US Transport Institution, ‘Cargo Reservation’, available at: http://www.trans-inst.org/cargo-reservation.html (last accessed February 2015).

77
or coastwise trade represented only 146m metric tons, which is 6.8% of the total waterborne trade of 2,148m metric tons. Meanwhile foreign trade (import and export) amounted to more than 1,300m metric tons, that is, 62.5% (see Table 4.3 below). Furthermore, it is relevant to note that cabotage in the US has decreased with 21,8% in the period between 2006-2011. This decline is the result of reduced coastwise movement of petroleum (crude oil and petroleum products) by 21,6% between 2006-2011.154 In turn, the decline in coastwise petroleum trade is the result of an 8.4% decline in the consumption of U.S. petroleum products.155 All these figures indicate that the US cabotage market is not significant in comparison to foreign trade and its relevance has been decreasing over the years.
Table 4.3 U.S. Waterborne Trade 2006-2011 (Million metric tons) – Putting coastwise trade in overall trade perspective
Source: U.S. Dept. of Transportation – U.S. Water Transportation Statistical Snapshot (2013)
Status under EU and MS agreements The provision of cabotage services are generally prohibited in all agreements. However, restrictions on cabotage services are common at the international level due to their politically sensitive nature. In fact, cabotage services have also been excluded from the scope of GATS negotiations because the Members did not want to liberalise trade in this area.156 Our analysis of the agreements showed that in all agreements, cabotage is explicitly excluded from “unrestricted access” to maritime markets, and remains reserved for national flag ships. Whilst restrictions on pure domestic cargoes may not constitute a prime barrier to international maritime trade, cabotage limitations will have an impact on feedering and relay of international cargo (see the subsequent sections). Therefore, it is relevant to understand the cabotage regime of the ten selected countries and how these impact EU operators. China imposes strict restrictions and prohibits EU-owned companies and EU-flagged vessels from engaging in domestic cabotage traffic. The establishment of the Shanghai Free Trade Zone brought certain changes which are discussed in the next sub-section. Despite the Chinese cabotage restrictions, EU companies may transport self-owned or leased empty containers between ports after registration (see section on movement of containers below). Furthermore, while the Chinese law envisages the possibility to grant exemptions from cabotage restrictions, none have been granted to EU operators yet.157 In Japan, cabotage is also reserved for national-flagged vessels. However, EU shipping companies benefit from the Friendship, Commerce and Navigation treaties concluded between
154 US Department of Transportation, 2011 US Water Transportation Statistical Snapshot, (2013), p.1. 155 Ibid. 156 Parameswaren B., The Liberalization of Maritime Transport Services, Hamburg Studies on Maritime Affairs, Springer, 2004, p. 349. 157 WTO Trade Policy Review: China (2012), WT/TPR/S/264, para. 212.

78
Japan and several EU Member States that provide for Japan allowing ships to access cabotage services on a reciprocal basis. These MS are Denmark, the U.K., France, and the Netherlands as well as Norway, an EEA Member. Under the provisions of those agreements, Japan permits flagged vessels of the aforementioned countries to engage in maritime transportation between ports of Japan. This is allowed based on individual application, and only in cases where the cargo is part of international maritime transport and the cargo is transhipped between vessels flying the flags of the same country.158 Cabotage operations in Korea are also restricted both under the Free Trade Agreement that the EU has concluded with it,159 as well as under national legislation.160 Singapore has only concluded a limited number of agreements with EU Member States. However, even in those limited agreements, cabotage remains restricted to national vessels only.161 The bilateral agreements of the EU Member States with India also restrict cabotage to national vessels. This is also reinforced in Indian domestic legislation, where the Merchant Shipping Act 1958 reserves cabotage for Indian flag vessels. Exceptions to this prohibition include foreign flagged vessels which may be chartered and granted a special periodic license if no suitable Indian-flagged vessel operates on the route in question. Other sources China has recently shifted its cabotage policy towards partially opening up this segment in the ambit of a pilot free trade zone in Shanghai. In the context of the China (Shanghai) Pilot Free Trade Zone (CSPFTZ), the rules relating to cabotage operations, and particularly the relay of international cargo, have been modified.162 Since September 2013, non-Chinese-flagged container ships, directly or indirectly owned by Chinese invested shipping companies (that is, business entities registered in China that obtained a shipping registration certificate there, and engage in international ocean shipping business) will be permitted to engage in international relay when moving import or export containers on routes between domestic coastal ports and Shanghai Port.163 This new measure benefits mainly Chinese owners of vessels whose vessels are flagged outside of China. The Chinese authorities only recently approved the first foreign-flagged cabotage operation in January 2015.164 EU operators face cabotage restrictions also in Brazil, where domestic legislation restricts foreigners from engaging in cabotage operations.165 Foreign vessels, including EU vessels, have to be chartered by Brazilian shipping companies to operate in coastal trade (and this is subject to a special authorisation). Waivers may be granted on one of three grounds: (a) when Brazilian vessels are not available; (b) on grounds of public interest; (c) when the Brazilian vessel required is under construction and there is a need for a
substitute.166 Under any of these three grounds, EU vessels can also obtain a cabotage waiver in Brazil.
158 WTO Trade Policy Review Japan, WT/TPR/S/276 (2013), p.142 159 Article 7.4(1) of the Free Trade Agreement between the EU and South Korea. 160 Korean Maritime Transport Act. See also WTO Trade Policy Review: Republic of Korea (2012). 161 Article 8(a) of the Singapore-Germany bilateral maritime agreement (2000). 162 Framework Plan for the China (Shanghai) Pilot Free Trade Zone, promulgated on 18 September 2013 by the State Council; see also Announcement on the Trial Implementation in Shanghai of Domestic Coastal Shipping by Chinese-Invested Foreign-Flagged Ocean-going Vessels of the Ministry of Transport (27 September 2013). See also WTO Trade Policy Review: China (2014), WT/TPR/S/300, para. 4.120. 163 WTO Trade Policy Review: China (2014), WT/TPR/S/300, para. 4.120. 164 Shen C., China allows coast trade for three Cosco foreign-flag vessels, Lloyd’s Loading List, 16 January 2015, 165 Law 9432/98 (Shipping Act) and Law 193/2004 (on standard for charter in cabotage). 166 Articles 7 and 9 of Law No. 9,432 (8 January 1997); see also WTO Trade Policy Review, ‘Brazil’, WT/TPR/S/283 (2013), para. 4.230.

79
In the US, cabotage rules are governed under the Merchant Marine Act of 1920 (the “Jones Act”)167 which imposes restrictions on the cabotage of international cargo either directly or via a foreign port. Section 27 of the Act states that all US domestic trade must be carried on vessels that are under US registry, built in the US, and manned by US citizens (also known as the Jones Act ‘fleet’).168 This is a much stricter cabotage restriction than in other countries, where no conditions are imposed on where the ship was built or which nationality the crew has. Permitting cabotage operations only to US-built vessels makes the US cabotage rules even less favourable for EU shipping companies than is the case in other non-EU countries where no such requirement is foreseen. The scope of the Jones Act’s limitation is broader than only coastwise trade. Restrictions on US-built, -owned and -registered vessels extend for instance, to vessels engaging in fisheries,169 dredging,170 marine mining and waste disposal171 which must all meet the Jones Act’s requirements. Finally, barges and supply ships for the oil and gas industry are covered by the Jones Act as well and are thus restricted for EU shipping companies. All this underlines the broad spectrum of vessels falling within the restrictions of the Jones Act. In Turkey, cabotage is also restricted under the domestic Cabotage Law No. 815. This stipulates that merchant maritime transport services can only be provided by Turkish-flagged ships. Turkey operates a so-called two-register system, which consists of the Turkish National Ship Registry and the Turkish International Ship Registry. It is important to describe the link between these two ship registries and how they apply to foreign-owned vessels in permitting access to the domestic cabotage market. The former (the national) registry is reserved only for vessels that are owned by Turkish citizens and companies that are majority-owned (51% or more) by Turkish nationals.172 Ships that can be registered in the Turkish International Ship Registry and fly the Turkish flag are the ones owned by Turkish and/or foreign individuals that are domiciled in Turkey, and foreign-owned companies which are incorporated under Turkish law (or have a presence through subsidiaries or branches). It is relevant to note that ships registered in the International Ship Registry are allowed to perform cabotage operations. This means that in practice, there is greater room for EU involvement in engaging in cabotage operations in Turkey since EU owned vessels can be registered in this Registry. Similarly in Russia, cabotage and towage between sea ports are reserved for vessels flying the flag of the Russian Federation.173 There is an exception to the prohibition if this is specifically permitted in an international treaty with Russia, or in case it is specifically granted by the Russian government.174 However, all of the maritime agreements between Russia and the EU Member States reserve cabotage, towing, salvage, and piloting for domestic vessels only.175
167 Merchant Marine Act of 1920 (The “Jones Act”), 46 U.S.C. § 55102(b) (2006). 168 Section 27, Merchant Marine Act of 1920 (The “Jones Act”), 46 U.S.C. § 55102(b) (2006). 169 46 U.S.C. 12108 170 46 U.S.C. 292 171 Transportation of Sewage Sludge Act (Public Law 100-329, 102 Stat. 588) amended 172 Commercial Law No. 6762 173 Article 4 (1), The Merchant Shpping Code of the Russian Federation 174 Article 4 (2), The Merchant Shpping Code of the Russian Federation 175 Article 8 (3) of the Maritime Agreement with Germany, Article 6 (2) of the Maritime Agreement with France, Article 5 (2) of the Maritime Agreement with Belgium and Luxembourg, Article 3 of the Maritime Agreement with Spain, Article 6 (3) of the Maritime Agreement with Latvia.

80
4.3.4 Feedering of international cargo For the purposes of our study, feedering operation is defined as the pre- and onward transportation of international cargoes by sea, notably containerised, between ports located in a country. Status under EU and MS agreements Most agreements examined do not specifically address either feedering or relay of international cargo176. Indeed, only few countries in the world allow for foreigners to carry out such operations. Feedering services and relay of cargo form part of cabotage operations when the transport of international cargo happens between ports of the same country.177 Accordingly, the provision of these operations is reserved for national service suppliers. Therefore, considering the limitations discussed above on cabotage across the agreements, we can conclude that feedering and relay, when conducted within the same country, are restricted in the same way as cabotage, unless there is an exception. Furthermore, from an operational perspective of the industry, feedering operations are intertwined not only with cabotage and relay but also with the movement of empty containers since all these are very often mixed activities on one ship. So even if feedering (or recapturing of empty containers) is allowed in country A a vessel still has a disadvantage if it is not allowed to combine this with other flows. Other sources The economic importance of not having direct access to feedering is double: one misses potential traffic as a company, but one also has to rely on outsourced feedering services, which probably are more expensive. In order to estimate the economic importance of feedering, a proxy is to look at the transhipment volumes and rates of specific countries. Transhipment is composed of three elements, the most important of which is feedering (85%, with hub-and-spoke networking), followed by interlining and relay (together 15%).178 H The same assumption has been used in the context of a recent study on transhipment volumes in the ambit of the EU’s PORTOPIA project.179 However, the lowest level of geographical detail available is that of subcontinents (see Table 4.4).
176 Exceptions include the EU-China Agreement, which provides that “one party shall allow shipping companies of the other party to have access to and use of, on a non-discriminatory basis and on agreed terms between the companies concerned, feeder services provided by shipping companies registered in the former party for the international cargo between the ports of China.” (Article 4(4)). Another example is Article 135(10) of the EU-Ukraine Association Agreement (2014) which provides that “[e]ach Party shall allow services suppliers of international maritime transport of the other Party to have use of, on a non-discriminatory basis and on agreed terms between the companies concerned, feeder services between the ports of Ukraine or between the ports of individual Member States of the European Union that are provided by the service suppliers of maritime transport registered in the former Party.” 177 Parameswaren B., The Liberalization of Maritime Transport Services, Hamburg Studies on Maritime Affairs, Springer, 2004, p. 350. See also the definition of feedering used by the EU in its Free Trade Agreements, e.g., Art 124(7) of the EU-Georgia Free Trade Agreement. 178 Notteboom et al., State of the European Port System – market trends and structure update transshipment volumes 2014. 179 Notteboom et al., State of the European Port System – market trends and structure update transshipment volumes 2014. See further http://www.portopia.eu/.

81
Table 4.4 Estimated container transhipment activity by region (transhipment volume and incidence)
Source: Notteboom et al. (2014), based on Drewry (2008 and 2013)
Most transhipment operations (in terms of volume) take place in the Far East and the South East Asia region (see Figure 4.3).180
Figure 4.3 - Container volumes transhipped in 2012
Source: Notteboom et al. (2014)181
For China, where transhipment appears to be around 28% of the total loaded/unloaded volumes (see table above), implying approximately 25% feedering of all traffic, there is a very strong economic importance of being able to exploit these services. For the United States, transhipment represents only 1.5% of the total loaded/unloaded volumes. That means that a bit less than 1.5% of all traffic concerns feedering volumes, which is relatively small. For the USA the economic importance of feedering seems therefore limited in the total shipping picture. Although the volume is likely to increase due to the Panama Canal 180 Notteboom et al., State of the European Port System – market trends and structure update transshipment volumes 2014, p. 7, available at: http://ec.europa.eu/transport/modes/maritime/studies/doc/2014-01-08-partim-transshipment-volumes.pdf (last accessed February 2015). 181 Notteboom et al., State of the European Port System – market trends and structure update transshipment volumes 2014, p. 9.

82
expansion which will result in increased vessel sizes and less but more concentrated port calls. Furthermore, the low share of feedering might also partly be the result of a non-functioning feeder market in the US. Other contributing factors include the restrictions imposed by the Jones Act and the cheaper costs of ships in Asia. A further complexity is that it is not just about counting tonnages for feedering (and the same goes for relay in section 5.3.5): if the ship does not get filled with sufficient feedering cargo, it will not sail at all (in the longer run), not for purely local cargo either, at least in those regions where transhipment shares are high. So: the value of missing feedering, relay, etc. is higher than what can be seen from the volumes individually. Moreover, due to increasing ship size, with fewer calls per continent, importance of feedering, relay, etc. is increasing, as suggested also in Table 4.4 which shows a three time increase in global transhipment volumes between the period 2000 to 2012. With respect to cost impact, the surplus cost for European operators depends on the distance over which feedering is to be done, multiplied by the surplus price per mile one has to pay compared to the cost when doing operations themselves.182
4.3.5 Relay of international cargo For the purposes of this study, relay of international cargo is defined as the practice of one company carrying cargo from one country to an overseas destination on its own vessel, transferring the cargo from one vessel to another operated by the same company in another port of that country. It also covers for instance a vessel sailing from China to Europe calling a port in India, where the relay takes place, transferring some of its cargo to a vessel of the same group that is coming from Africa on the way to Australia. The relative importance of relay in comparison to feedering can be assessed by looking at data on transhipment. As described above, transhipment activities are composed of 85% feedering and 15% interlining and relay activities. This means that feedering operations represent a much higher traffic than relay, and hence relay operations are of less importance to shipping companies than feedering operations. Indicatively, and, based on the data presented above, relay operations can represent up to 4.2% in China where transhipment is around 28%. In the US, this percentage can be as low as 0.22%, where the total transhipment is 1.5%. In addition,
182 To do a full estimation, one would have to do a full input-output analysis for each of those, assuming that the data are available, is not the case: not all companies report, and even when reporting, flows are aggregated and feedering, relay, etc. cannot be split off.

83
Figure 4.4 below shows a snapshot of the main relay ports that play a crucial role in maritime transport that connects the EU with Asia. In particular, it confirms the importance of China in relay operations, and also highlights the role that other East and Southeast Asian countries (notably South Korea and Singapore) play in relay operations. Furthermore, the higher percentage of relay operation in China in comparison to the US is also linked to its close proximity to these major maritime hubs (i.e., South Korea and Singapore). This makes it easier for operators to engage in relay operations between different ports and transfer cargo between ships with different destinations. A similar advantaged is less prominent in the US, which in turn contributes to the lower percentage of relay operations.
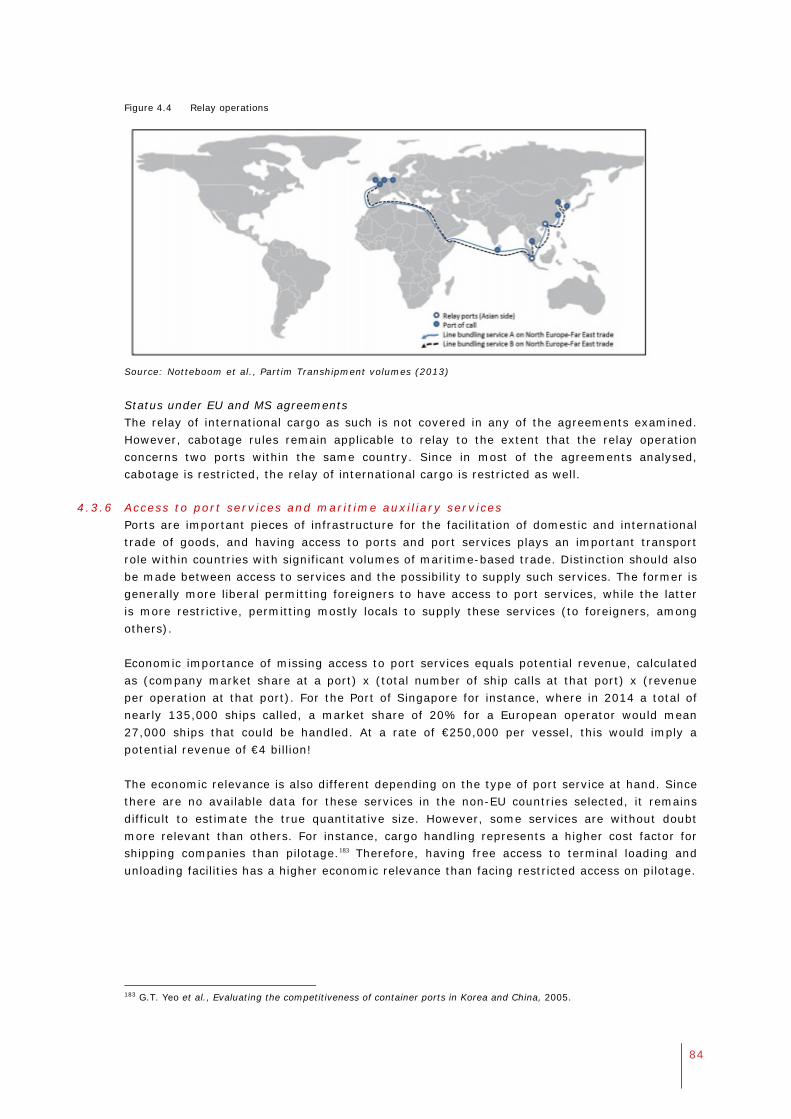
84
Figure 4.4 Relay operations
Source: Notteboom et al., Partim Transhipment volumes (2013)
Status under EU and MS agreements The relay of international cargo as such is not covered in any of the agreements examined. However, cabotage rules remain applicable to relay to the extent that the relay operation concerns two ports within the same country. Since in most of the agreements analysed, cabotage is restricted, the relay of international cargo is restricted as well.
4.3.6 Access to port services and marit ime auxil iary services Ports are important pieces of infrastructure for the facilitation of domestic and international trade of goods, and having access to ports and port services plays an important transport role within countries with significant volumes of maritime-based trade. Distinction should also be made between access to services and the possibility to supply such services. The former is generally more liberal permitting foreigners to have access to port services, while the latter is more restrictive, permitting mostly locals to supply these services (to foreigners, among others). Economic importance of missing access to port services equals potential revenue, calculated as (company market share at a port) x (total number of ship calls at that port) x (revenue per operation at that port). For the Port of Singapore for instance, where in 2014 a total of nearly 135,000 ships called, a market share of 20% for a European operator would mean 27,000 ships that could be handled. At a rate of €250,000 per vessel, this would imply a potential revenue of €4 billion! The economic relevance is also different depending on the type of port service at hand. Since there are no available data for these services in the non-EU countries selected, it remains difficult to estimate the true quantitative size. However, some services are without doubt more relevant than others. For instance, cargo handling represents a higher cost factor for shipping companies than pilotage.183 Therefore, having free access to terminal loading and unloading facilities has a higher economic relevance than facing restricted access on pilotage.
183 G.T. Yeo et al., Evaluating the competitiveness of container ports in Korea and China, 2005.
85
Status under EU and MS agreements The majority of the agreements examined include commitments to liberalise access to a wide spectrum of services at ports, including: tug and towing assistance, provisioning, fuelling and watering, garbage collecting and ballast waste disposal, port captain's services, navigation aids, shore-based operational services essential to ship operations, including communications, water and electrical supply, emergency repair facilities, anchorage, berth and berthing services. However, these kinds of liberalisation commitments are included in almost all maritime agreements, and therefore do not create specific benefits for EU operators alone. Russia’s agreements with the EU Member States reserve the provision of towing, salvage, and piloting for foreign vessels for domestic entities only. Russia’s agreements with Germany and Latvia provide for national treatment regarding access to port services and auxiliary services in respect of vessels under the flag of a third country, but which is operated by maritime companies of either of the contracting parties.184 This provides a benefit since ship operators will be able to rely on the provisions of the agreements even if their ships are flagged in third countries. This is not common in other bilateral agreements, and it depends on the manner in which a “vessel” is defined. In almost all bilateral maritime agreements that we examined, the agreements apply only to vessels that fly the flag of the contracting parties. Only in more recent agreements, for instance the EU-China agreement, are vessels defined more broadly to include also flying the flag of a third country as long as the vessel is owned or operated by a shipping company of the MS. Singapore’s agreements with the EU Member States restrict the provision of pilotage, towage, and even salvage operations to national vessels only.185 Although pilotage is generally regarded as restrictive, the same is less present for towage for salvage operations in other maritime bilateral agreements. Despite this, all of Singapore’s agreements reinforce the international standard of granting non-discriminatory treatment to EU vessels with respect to access to ports, stays in ports, use of port facilities, the collection of fees, etc.186 Access for EU vessels to the ports of South Korea is included in the bilateral agreements that exist with the Member States187 and this is also reinforced in the FTA that the EU concluded.188 Following a general trend, the provision of pilotage and towage services remain restricted to locals only.189 Regarding Japan, the existing agreements pledge to uphold free access to ports and auxiliary services. In the agreements of other non-EU countries, access to port services and auxiliary services have also been liberalised but these do not include any specific benefit that would only be available for EU shipping companies.
In China, EU operators have access to all major port services and maritime auxiliary services. China applies a compulsory pilotage for all foreign vessels due to safety and environmental concerns, but grants equal treatment on pilotage fees.190 Port charges are determined by the
184 Article 8 (2) of the Maritime Agreement with Germany, Article 6 (2) of the Maritime Agreement with Latvia 185 Article 8(a) of the Singapore-Germany bilateral maritime agreement (2000). 186 For instance, see Article 5 of the Singapore-Germany bilateral maritime agreement (2000). 187 Among others, see Article 1(1) of the South Korea-UK bilateral maritime agreement (1994), Article 5 of the South Korea-Germany bilateral maritime agreement (1994). 188 Article 7.47(3)(b) of the EU FTA with South Korea. 189 South Korean Pilotage Act. 190 WTO Trade Policy Review: China (2012), WT/TPR/S/264, para. 223.

86
government (notably by the Ministry of Communications and the National Development and Reform Commission), but these are applied uniformly across the country.191 Limitations exist with regard to the provision of pushing and towing services, which due to restrictions on cabotage (see above), are limited to wholly Chinese-owned companies that also fly the Chinese flag.192 This means that EU shipping companies cannot provide such services in domestic Chinese ports. Other sources New possibilities (and of course accompanying challenges) may arise for EU shipping companies in Brazilian ports. In Brazil, activities of EU shipping companies in ports are mainly carried out under leasing contracts, which have a renewable 25 year duration. This is the result of a liberalising trend in the access to ports and port facilities segment. This reached its height in 2012, when the leasing of public ports areas was also permitted to foreign companies. This has created a long-term benefit for EU shipping companies which can secure port facilities (e.g. loading and unloading facilities or cargo terminals) in a more cost-efficient way. Furthermore, foreign shipping companies (including many EU entities) also operate their private terminals to handle their own cargo. While establishing such a private terminal has significant benefits for EU operators, it is a burdensome process to acquire such a terminal due to regulatory complexities (for instance on the definition of what amounts to “own” cargo) and requirements that the development of a private terminal be open to tender. In Russia, competition relating to access to port services is hindered by the large presence of “natural monopolies”. Currently, around 264 marine terminal operators are active in handling and storing cargo at Russian ports.193 Around 40% of them are included in the Register of Natural Monopolies, which implies that the tariffs for their services are established by the state.194 The remaining operators can independently charge their tariffs based on supply-demand changes. In Singapore, preferential corporate tax regime for the maritime sector and further investments in port infrastructure have been implemented in an effort to raise the local ports’ competitiveness vis-à-vis other ports in the region. The principle of non-discriminatory access to port services is applied, excluding berth and berthing services.195 Singapore has liberalised (i.e. issued more than one licence) for certain port services, such as towage and bunkering. Pilotage service is provided by one licensee, PSA Marine Private Limited, for reasons of navigational safety. Maintenance and repair services are carried out by private companies/shipyards.
4.3.7 Commercial presence Having a commercial presence in the territory of another country comprises any type of business or professional establishment, including the establishment and maintenance of a juridical person, a branch or a representative office. This mode permits a physical proximity between the foreign maritime service provider and the consumer, which increases its importance in international maritime transport. Although the majority of international maritime transport services can be provided without the need for a local presence, establishing local offices became increasingly important in the 191 Ibid., para. 224. 192 Ibid., para. 220. 193 OECD, Competition in ports and port services, Submission of the Russian Federation, DAF/COMP(2011)14 (2011). 194 Ibid. 195 WTO Trade Policy Review, ‘Singapore’, WT/TPR/S/267/Rev.1 (2012), para. 49 et seq.

87
wake of growing multimodal transport which often requires local offices that coordinate activities across the different modes of transport. Legislation in most countries impose challenges on the establishment of local presence by foreign transport operators mainly through horizontal restrictions that apply to all foreign entities across all service sectors.196 The most prominent restrictions include restrictions on foreign equity ownership, rules requiring a certain composition of the board of the local enterprise or key personnel, or administrative hurdles which, through their complexity, act as a counter incentive for foreigners to open a local office. Status under EU and MS agreements In most treaties, the parties are obliged to permit international maritime service suppliers of the other party to have some form of commercial presence in the territory of the other party under conditions of establishment and operation no less favourable than those accorded to its own service suppliers, or at the very minimum under the principle of MFN. Indeed, this appears to be a common international trend, which also accompanies the requirement of having a commercial presence in a country in order to operate a fleet in the country in question. However, what can be done with these local offices is limited through other rules on foreign participation, requirements on composition of management and directors of the local enterprise, etc. Although there are differing rules among the 10 countries studies, it is possible to establish some form of commercial presence in each of them. In the US Friendship Commerce and Navigation agreements with the EU Member States, national treatment is provided in respect of establishing a commercial presence in the US for the shipping companies of the EU Member States. Domestic legislation sets out the further rules on this. Foreigners can establish subsidiaries but the operation of a vessel is contingent on the vessel being wholly owned by US citizens.197 Also, companies owning vessels must be US citizens, and a corporation is considered a citizen if it is registered under domestic laws, it’s CEO and chairman of the board of directors are US citizens and no more than a minority of the number of directors necessary to constitute a quorum are non-citizens.198 The EU-China Agreement goes further in this respect by creating a wider range of benefits for EU operators. Article 5 of the Agreement obliges the parties to permit shipping companies of the other party to establish wholly-owned or jointly-invested subsidiaries, branch or representative offices in respect of activities for the provision of international maritime cargo transport and logistics services, including door-to-door multimodal operations. This reflects on two aspects, namely on the possibility for EU operators to have a commercial presence in China, and secondly, on what activities they can carry out through these representations. More specifically, the Agreement permits EU operators to establish a commercial presence in China through the following a broader spectrum of legal forms: subsidiaries, branches, or representative offices.199 Additionally, the foreign equity limitation has been abolished for these forms; they may be wholly foreign owned or established with a Sino-foreign joint-venture. Again, this entails a more liberal approach (and hence more beneficial position) for EU operators than for other countries’ operators. The activities that can be carried out 196 Bejamin Parameswaran, ‘The Liberalization of Maritime Transport Serrvices’, Springer, p. 63. See also, OECD Doc. No. DSTI/DOT/MTC(2001)13 (31 October 2001), p. 16. 197 46 USC 12103 (General eligibility requirements) 198 46 USC 50501 (Entities deemed citizens of the US) 199 Art 5 of the EU-China Maritime Agreement.

88
through these commercial entities include the provision of international maritime cargo transport and logistics services, cargo soliciting, making and handling bills of lading, negotiating and signing service contracts, engaging in marketing activities, and owning the equipment necessary for these economic activities. Furthermore, according to Article 8 of the EU-China Agreement, EU companies are entitled to employ key personnel to work in their subsidiaries, branches, or representative offices in China in accordance with Chinese laws, and irrespective of their nationality (whether local, EU or other nationality). Other sources Russia’s legislation allows for foreign companies and individuals to own 100% shares of companies, with the note that they cannot acquire more than 50% of companies with strategic importance.200 It should be noted that there are no other legal form restrictions, as foreign companies can establish subsidiaries and branch offices in Russia and there are no limitations on the composition of the board members of the local offices.201 Japan has no limitations on the maximum foreign equity share.202 EU companies can also establish subsidiaries and branches in order to operate or support their activities there.203 In Singapore, there are no limitations on market access or national treatment with respect to providing maritime transport services through commercial presence in Singapore. Moreover, Singapore has no laws or regulations restricting foreign participation in international maritime freight and passenger transport. The FTA with South Korea envisages no restrictions by Korea Establishment of a registered company for the purpose of operating a fleet under the national flag of Korea with respect to international maritime cargo transport.204 China restricts foreign ownership to 49% when it comes to establishing international maritime shipping companies.205 In fact, foreign investors, including EU ones, are not allowed sole proprietorship of any investment.206 There are no requirements imposed by Chinese laws on minimum nationality requirements for the composition of board members of a maritime transport company. In India, reform measures have been adopted to increase the competitiveness of maritime transportation services through, inter alia, allowing 100% foreign investment in the shipping sector, including for coastal shipping.207 Although Indian flag vessels must be owned by Indian entities, foreign investment of up to 100% is permitted in Indian ship-owning and ship-operating companies.208 This in turn enables foreigners to obtain the same privileges as granted to Indian shipping companies while maintaining control over the company, whose
200 Federal law No. 147-FZ ‘On Natural Monopolies’ as of August,17 1995; Federal law No.57-FZ ‘Procedures for Foreign Investments in the Business Enterprises of Strategic importance for Russian National Defence and State Security’ as of April, 29 2000 201 Merchant Shipping Code of the Russian Federation; Federal law No. 261-FZ ‘On Sea Ports of the RF and on the Amendments to some Legislative Acts of the RF’ as of November,8 2007. See also OECD, ‘Services Trade Restrictiveness Index Regulatory Database: Russia’ (accessed May 2015). 202 OECD, ‘Services Trade Restrictiveness Index Regulatory Database: Japan’ (accessed May 2015). 203 Marine Transportation Act; Companies Act, Article 936 204 Annex on schedule of commitments by South Korea, Maritime transport services. 205 Article 5 of the Provisions on Administration of Foreign Investment in International Maritime Transportation, available at: http://www.china.com.cn/chinese/PI-c/559870.htm (accessed May 2015). 206 Article 4 of the Order of the Ministry of Commerce No. 6 of 2009. 207 WTO Trade Policy Review, ‘India’, WT/TPR/S/182/Rev.1 (2007), para. 143. See also OECD, ‘Services Trade Restrictiveness Index Regulatory Database: India’ (accessed May 2015). 208 Cabotage Regulations and India’s Shipping Industry (2007), available at: http://www.asialawprofiles.com/Article/1971108/Cabotage-Regulations-and-Indias-Shipping-Industry.html?Print=true&Single=true. See also OECD, ‘Services Trade Restrictiveness Index Regulatory Database: India’ (accessed May 2015).

89
Indian flag-bearing vessels are also entitled to engage in the Indian coastal trade.209 Next to this, there is no restriction in the Indian law for foreigners to establish subsidiaries or branch offices.210 This is not the case in Brazil, where under Law No. 9,432, Brazilian-flag vessels must be owned by natural persons residing or domiciled in Brazil, or by a Brazilian shipping company. Subject to this caveat, the national law does not impose foreign equity limitations as far as the international maritime transportation is concerned.211 Firms providing maritime cabotage services must be majority-owned by Brazilian nationals.212 The captain, the chief engineer and two-thirds of the crew of a Brazilian-flag vessel must be Brazilian nationals. To obtain authorization to operate as a Brazilian shipping company, an enterprise must be established in Brazil under Brazilian law, and own at least one ship technically adequate for the service envisaged. These criteria set a high threshold for foreign entities to operate in Brazil. Nonetheless, consultation with Member States and industry has revealed that EU entities undertake to fulfil these conditions in order to be able to operate in Brazil (see next chapter for more details). The differences in comparison with India, as presented above, relate to the requirements for the ownership of locally flagged vessels. In India, de jure, ownership is limited to Indians only but in practice foreigners can own vessels indirectly through ship-owning companies. In Brazil, ownership is limited to natural persons residing or domiciled in Brazil. In Brazil, there are also additional crew requirements attached to a locally flagged vessel.
4.3.8 Movement of empty containers The movement of empty containers impacts on the operational costs of shipping companies. It is estimated that shipping companies spend on average €103 billion per year in the management of their container assets (purchase, maintenance, repairs), of which €15 billion for the repositioning of empty ones.213 This means that repositioning accounts for 15% of the operational costs related to container assets. Status under EU and MS agreements The examination of the maritime agreements of the EU Member States showed that movement of empty containers or the repositioning of equipment in general does not form part of the agreements. Therefore, this aspect will be addressed mostly through domestic laws, and the interpretation of whether empty containers amount to cargo (and hence fall under cabotage restrictions) or not varies on a case-by-case basis. Other sources The movement of empty containers has gained increasing importance over the past years. Figure 4.5 below shows the total container handlings at world ports, categorised according to full and empty, as well as the incidence of empty movements and transhipment.
209 Ibid. 210 COMPANIES ACT, 1956 [Act No. 1 OF 1956] Section 581ZL.: http://www.mca.gov.in/Ministry/pdf/Companies_Act_1956_13jun2011.pdf (accessed May 2015). 211 OECD, ‘Services Trade Restrictiveness Index Regulatory Database: Brazil’ (accessed May 2015). 212 Ibid. 213 Rodrigue J.P.,‘The Repositioning of Empty Containers, in The Geography of Transport Systems, Routledge, 2013.

90
Figure 4.5 Loaded and empty container movements as shares in total world container movements
Source: Transport Research Institute, Empty Container Repositioning, Edinburgh Napier University (2014)
The figure shows that the number of empty container movements has risen sharply since 2000. West countries are generally net importers, meaning there are not enough export loads to fill all the containers that arrive there with imported goods. Even if an export load is likely to be available, if the container must sit idle for more than 1-2 weeks then the loss of revenue becomes an issue and the container owner would prefer to send the container to China where a load will definitely be found. Therefore, it is interesting to examine the position of China with respect to the movement of containers, and what rules apply to EU entities in this respect. The EU-China agreement explicitly applies to the movement of equipment as well, particularly concerning empty containers not being carried as cargo against payment between ports of China or between ports of a Member State of the EU.214 Since 2003, reforms in the Chinese laws permitted foreign lines to transport empty containers between Chinese ports. Under these laws, after undergoing registration formalities, foreign shipping companies may transport self-owned or leased empty containers. 215 Before 2003, empty containers were considered “domestic cargo”, and their movement was restricted under cabotage rules. The EU-China agreement builds on the same liberalisation trend, and therefore, EU companies are permitted to move empty containers between Chinese ports despite the restrictions maintained on cabotage.
214 Art 2(1) of the EU-China Maritime Agreement. 215 WTO Trade Policy Review: China (2012), WT/TPR/S/264, para. 212.

91
In other countries, the approach towards empty containers has been more diverse. Under US federal law, foreign vessels can transport their empty containers only if they are owned or leased by the owner of the vessel and are transported for its use in handling cargo for foreign trade.216 This is done only on a reciprocal basis.. Similarly, in the case of South Korea, the repositioning of equipment remains restricted due to cabotage limitations.217 Finally the same restriction applies to India. With regard to the other non-EU countries, no relevant information was found on this aspect. As an effort to find the relevant information, we analysed studies, various reports and publicly available information of the competent authorities of the selected countries, as well as researched the domestic cabotage laws in order to find out whether the movement of empty containers amounts to movement of cargo (and hence falling under the domestic cabotage regime).
4.3.9 Offshore services Evidence suggests that the offshore sector represents a growing economic relevance to the EU. In fact, within the EU-controlled fleet, the strongest growth between 2005 and 2014 was recorded amongst offshore vessels, where the sector grew with more than 150% in GT between 2005 and 2014 (the largest growth among other sectors where EU vessels are active).218 Furthermore, the EU’s share of the world offshore fleet increased from 28% in 2005, to 37% in 2014 (in gross tonnage terms).219 This points to a significant increase of this sectors relevance over the past decade. It is also interesting to note that the estimated turnover of the EU dredging industry was €8.3 billion in 2013 (estimated by European Dredging Association) and around 25 thousand people are directly employed in this sector.
Figure 4.6 Growth of the EU offshore service sector 2005-2014
Source: Oxford Economics (2014)
The offshore services segment is also expected to increase in the coming years, particularly in terms of demand for competent personnel.220 Demand for oil and gas is expected to increase up to 2030, due to the level of development in China, India and other areas in the industrialising world. Next to these regions, offshore market is also developing in Russia and Brazil. Most important countries to improve conditions for the dredging sector are USA
216 46 U.S. Code § 55107 217 South Korea Marine Transportation Act. 218 APEDA Ministry of Commerce India, March 2015 available at: http://agriexchange.apeda.gov.in/news/newssearch.aspx?newsid=19562 . See also KPMG, ‘Vibrant India’ (2014), p. 33, available at: https://www.kpmg.com/US/en/IssuesAndInsights/ArticlesPublications/Documents/vibrant-india-best-place-business.pdf; The Economic Times India, http://articles.economictimes.indiatimes.com/2015-03-19/news/60286869_1_transshipment-cabotage-foreign-vessels. 219 Oxford Economics, ‘The economic value of the EU shipping industry’ (2014). 220 Report of the Task Force on Maritime Employment and Competitiveness and Policy Recommendations to the European Commission (2011).

92
(protected regime by law) and China (market is not formally protected but in practice no foreign companies are active in this field). Status under EU and MS agreements Offshore service ships include, among others, ships laying or repairing undersea cables or pipelines, ships prospecting for oil, ships conducting oceanographic research, and ships servicing offshore wind, gas and oil installations. These aspects are not addressed in the maritime agreements analysed.
4.3.10 Social, environmental and safety clauses Status under EU and MS agreements The agreements of the ten selected countries with the EU and its Member States cover social, environmental and safety issues only to a limited extent and in a generic manner (i.e., not specifically in the maritime transport context). Safety is partially addressed in the bilateral maritime agreements of the Member States with the non-EU countries. The bilateral agreements stipulate that if a vessel of an EU Member States is involved in an accident or encounters any danger while in the territorial waters or port of the non-EU countries, that country is required to provide protection and assistance to the vessel, crew, passengers and cargo without any discrimination as to payment for the services rendered. Temporary storage of cargo or equipment rescued will usually not be subject to customs duties. Most of these requirements again stem from international regulations, and are applicable in general across the world.
4.4 Overview
One of the objectives of this study was to analyse the position of the EU maritime industry at the international level by looking at the existing bilateral agreements between the EU and its Member States, as well as with key non-EU partner countries. This chapter aimed to analyse the scope and coverage of these agreements and the benefits they offer to EU shipping companies across the globe. It also aimed at assessing the practical, day-to-day challenges that EU operators face. The agreements analysed include a number of common themes, notably commitments on maritime freedoms (e.g., unrestricted access to international maritime transport), cargo-sharing, cabotage operations, access to port services and maritime auxiliary services, commercial presence, etc. Several other topics were added in agreement with the Commission, such as feedering and relay, offshore services, and movement of empty containers. The conclusions outlined below give an overview of the challenges currently existing in the ten countries. Chapter 5 will add to this the results of the stakeholder consultation. Cargo-sharing arrangements have declined in the agreements of the EU and its Member States, and this appears to be consistent with the international trend. The reason for this decline is related to the emergence of the principle of freedom of maritime transport and the intensification of “de-flagging” (i.e., the process of removing a vessel from a national registry and registering it in another country, see chapter 2) due to the spread of open ship registries. While cargo-sharing is gradually removed through the maritime agreements, cargo preferences, de facto or de jure still exist in some countries. In the US, a wide range of cargo types are reserved only for Jones Act vessels (i.e., flagged, owned, and built in the US). This includes government cargo, cargo generated by the Export-Import Bank, and certain agricultural commodities in the context of food assistance provided by USAID, a

93
government agency providing assistance to foreign countries. In Brazil, cargo reservation are in place for government cargo, and exports of crude oil extracted from Brazil, which can only be transported by domestic flag vessels. In Japan, although cargo preference is not mandated by law, a large share of the Japanese maritime cargo is transported by Japanese flag carriers. In 2012 alone, close to 60% of the Japanese maritime cargo was transported by Japanese ships. In India, government cargo, the shipment of crude oil, and at least 40% of cargo carried by liner shipping companies must be reserved for Indian flag ships. Cabotage operations have been largely excluded from any liberalisation effort at the international level, partly due to their politically sensitive nature in many countries. This general trend to exclude cabotage is well reflected in the agreements. In the US, the Jones Act provides a stricter regime since ships must also be built in the US in order to be allowed to operate. Yet, coastwise trade represents only a limited share of the total waterborne transport, amount to 6.8%, whereas foreign trade amounts to 62.5%. Accordingly, the strict regime of the Jones Act is mitigated by the limited share of the cabotage operations in the total US waterborne transport. Consideration should be given also to the Chinese cabotage regime due to the overall relevance of this region for maritime transport. Through the Shanghai Free Trade Zone, China has recently permitted cabotage for Chinese-owned but foreign flagged vessels. The cabotage scheme in India also deserves attention. Pursuant to domestic legislation, foreign flagged vessels may be chartered and granted a special periodic license if no suitable Indian-flagged vessel operates on the route in question. Considering the growing trade flows to and from India, as well as the shortage of Indian-flagged vessels suitable for coastal trade, this may hold key benefits for EU shipping companies. It must be acknowledged, however, that this situation in India is not entirely new. With regard to feedering and relay, the former takes a higher share of overall traffic than the latter, approximately at a ratio of 85% to 15% of the total transhipment traffic. This means that in economic terms and on a global scale, feedering operations are much more relevant than relay operations. Figures on global regions indicate that feedering operations are particularly relevant in China, and the South East Asia region. South Korea is also relevant due to the large transhipment traffic that is carried through its ports are a result of feedering and relay restrictions in China. In the US feedering and relay are also problematic due to the stringent requirements imposed under the Jones Act. However, the problem is considered moderate due to the limited share of feedering and relay, which represented merely 1.5% (in 2012) of the overall US waterborne transport. Moreover, feedering operations within China are more important than relay operations, as close to 25% of all traffic represents feedering while only about 4% relay operations. Most maritime agreements of the EU and its Member States do not address feedering and relay of international cargo. Those that do mention it (e.g., the EU-China agreement) merely permit access to it, but prohibit the supply of such services for EU operators. Furthermore, both of these services form part of cabotage operations when the transport of international cargo happens between ports of the same country. Therefore, these services are generally prohibited for EU shipping companies. Access to port services is generally liberalised in the agreements. Nonetheless, the examination of the agreements and other available studies has not revealed any prominent difficulty for EU operators to have access to the ports of the ten selected countries. The same applies to maritime auxiliary services. Consideration should be given to port areas in Brazil where as a result of recent liberalising trends, the activities of EU shipping companies in ports are mainly carried out under leasing contracts which gives them the long-term benefit of securing port facilities in a more cost-efficient way. Almost all agreements of the EU and its Member States provide for the possibility for EU shipping companies to establish some form of commercial presence in the ten partner

94
countries. The permitted forms range from representative offices to branches and subsidiaries. However, the extent of services that a foreign company can do with these local offices depends on other horizontal restrictions, in particularly on the share of permitted foreign equity in a company, restrictions on composition of board members, and other administrative hurdles imposed by domestic law upon the foreign entity. Such restrictions have an impact on the possibility for EU operators to access the markets of the foreign countries. A few countries must be highlighted in this regard as being problematic. The effectiveness of having a commercial presence in the US is hindered by the fact that the operation of a vessel is contingent on the vessel being wholly owned by US citizens, where a company qualifies under this title when meets a set of stringent administrative requirements. China has a 49% threshold on maximum foreign equity shares permitted in local companies, which means that control of the company will remain at the hands of locals. The coverage of social, environmental, and safety clauses are limited in the maritime agreements and are focused on reiterating the applicable international regulations. Our desk research has not revealed any significant country that should be marked for attention. Some stakeholders, however, did raise safety issues that they face in the day-to-day operation in the US and China (see next chapter). The movement of empty containers accounts for 15% of the operational costs related to container assets, representing a cost factor of €15 billion p.a. for the shipping companies.221 Although most agreements do not address the movement of empty containers, some agreements do. For instance, the EU-China agreement permits the repositioning of empty containers between Chinese ports as an exception to cabotage restrictions. Where the agreements do not regulate the movement of containers, local regulations will be applicable. Accordingly, in the US only containers owned or leased by the owner of the vessel can be moved. In other countries, such as South Korea and India, movement of empty containers is restricted due to cabotage limitations. With regard to the other non-EU countries, no relevant information was found on this aspect. With regard to offshore services, our analysis revealed that this segment is of growing importance for the EU shipping industry. The EU’s offshore sector grew with more than 150% in GT between 2005 and 2014. This means that the EU’s share of global offshore fleet grew from 28% in 2005 to 37% in 2014 (in GT terms). The EU industry faces great competition in this segment from Asian competitors especially because of lower costs but EU operators seems to have identified a way to maintain a competitive advantage. They do so by specialising in smaller segments, especially in building offshore support vessels and in educating highly qualified offshore service personnel.
221 Rodrigue J.P., The Repositioning of Empty Containers, in The Geography of Transport Systems, Routledge, 2013.

95
5 Analysis and overview of the elements and policies that could be addressed in future maritime agreements
5.1 Introduction
Chapter 2 of this report presented and analysed a number of trends describing the evolution of international and EU shipping: Economic growth and trade Fleet development Market developments in the sector Trip-level cost structures Technological developments Environmental requirements Security (focusing on piracy and armed robbery at sea) Maritime labour Incentives and subsidises New infrastructure, ports and routes In chapter 3 a scenario approach was followed to address the uncertainties in future developments in an explicit manner and to support the development of a robust strategy. The scenarios include the main drivers affecting the outlook and prosperity of the EU maritime industry. Three scenarios were considered and evaluated in detail: a Sustainability Scenario, a Fragmented World Scenario, and a Conventional Growth Scenario. In chapter 4 the existing bilateral agreements between the EU or individual Member States, and ten partner countries in maritime transport were reviewed as well as the maritime clauses of existing free trade agreements (FTAs), partnership and cooperation agreements (PCAs) with non-EU countries other than the ten selected non-EU countries. Both chapters 2 and 4 analysed the facts, while in this chapter 5 the opinions of stakeholders are included and connected with the three scenarios developed in chapter 3 in order to determine future actions for the EU to strengthen the position of EU shipping internationally. The stakeholder analysis consisted of interviews, an online survey and a short survey. In the next section the perceptions of the stakeholders on the trends and existing agreements will be discussed. In section 5.3 future challenges of the European maritime sector will be analysed according to the above mentioned scenarios. Finally these perceptions of the stakeholders and our own analysis from previous chapters will be synthesised in section 5.4 which will present maritime trends, a message and our recommendation(s) per topic.
5.2 Issues faced by the industry
Substantial market disruption exists which prevents, for example, shippers to benefit from lower oil prices. In a highly concentrated market, with little competition, carriers are reluctant to transfer the benefits of lower oil prices in the form of lower freight rates. Another example of market disruption is related to the increasing practice of operating in alliances including various shipping lines offering different quality levels. In this situation the shipper can pay for services to a shipping line that has high schedule reliability and on-time arrivals, but the service is executed by another shipping line as part of the alliance, which has lower reliability and on-time arrivals. These practices, which can only exist under non- or low-

96
competitive conditions, have a negative impact on the competitiveness of the European maritime industry and the European economy as it increases transport costs. Stakeholders stress their fear for market concentration and call for mechanisms to strengthen competition in the long term, and reduce market concentration. Such mechanism should balance the improved margins of the shipping industry with the interest of consumers to benefit from competition. Table 5.1 presents the challenges as mentioned by the stakeholders. Among the challenges affecting shipping companies’ margins are: inexistent or unreliable transhipment services; nationality requirements of the crew members, as well as the need to apply for visas in certain ports; cabotage restrictions requiring shipping companies to hire national services at less competitive rates; inefficient security checks; inefficient cargo handling; sometimes requirements to use expensive compulsory pilotage and towage at an excessive level; excessive port dues and charges; briberies requested to enable on-time port operations; lack of efficient customs brokerage; limited offshore support services; discriminatory treatment against foreign shipping companies; unreliable port information; and procedures and payment for temporal import of offshore equipment until it leaves the country.
Table 5.1 Challenges that hinder competitiveness of the European maritime industry
Main challenges hindering competitiveness to the EU shipping industry
A.
Ch
ina
B.
US
A
C.
Ru
ssia
D.
Bra
zil
E.
Ind
ia
F.
Tu
rke
y
G.
Oth
er:
_W
est
A
fric
a,
Au
stra
lia
, E
gy
pt,
Me
xic
o
Transhipment X Nationality/residency/visa X X X Cabotage restrictions X X X X X X Security checks X X Cargo-handling X X Pilotage X X Towage X X Port dues and charges X X Dishonest use of power and bribery X X X X X Customs brokerage X X Taxations issues X X Repair/maintenance services X X
Offshore services X X Discriminatory treatment X X Unreliable port information X Temporary import X X
At the outset, our consultations with the Member States revealed that their individual bilateral maritime agreements are to some extent ‘dormant’, that is, agreements that are legally still in force, but not (or no longer) applied in practice. This is particularly true for older agreements that date as far back as the 1960s and 70s. Possible reasons for this ‘dormant’ status include the replacement of regulations by international actors (such as the WTO). Some Member States also pointed to the gradual take-over of competences in the maritime field by the EU, limiting the Member States’ individual capabilities to conclude maritime agreements where the EU has already done so or is engaged in negotiations. This should also be considered in light of the fact that the bargaining power of the EU as a whole

97
in negotiations with third countries is better than in cases where individual Member States negotiate on their own. Both Member States and industry representatives have highlighted that EU operators continue to face significant challenges regarding cargo sharing and cargo preference in Brazil and across the entire Mercosur region222 due to bilateral cargo sharing agreements between the countries in the region. Although some EU companies are already present in Brazil, they are required to re-flag their vessels there and comply with other domestic regulations (e.g., hiring of domestic crew, etc.) in order to gain access to the market. While this might be the case in other countries as well, the inputs received from stakeholders point out mainly Brazil in this respect. Regarding cabotage, some of the Member States consulted have remarked that the importance of cabotage depends mainly on the economic relevance of the partner countries. In major partner countries, such as US or China, it is more important. However, cabotage is a sensitive issue in many countries and a pragmatic approach should therefore be applied, focusing on realistic market openings. A key focus should be on maintaining a level playing field for international shipping in order to avoid unfair competition. Cabotage rules that are applied equally for all foreign operators are thus considered less damaging on level playing field than cabotage rules that are relaxed only for some non-EU Member States. Furthermore, the industry considers that simply having an agreement with third countries can represent significant benefits in terms of having access to the market, while specific maritime liberalisation (and ultimately cabotage liberalisation) could be considered as additional benefits. With respect to the Jones Act, industry representatives have confirmed that the instrument is more restrictive than cabotage rules in other countries. In fact, the Jones Act extends also to other maritime operations, such as dredging. The EU shipbuilding industry, including repair and maintenance, have voiced their concern about the negative impacts by the requirement of ships being built in the US since they are effectively barred from selling vessels to be used in the US coastal trade. Furthermore, the Jones Act restricts vessels from having repair and conversion services done outside the US.223 If ships are repaired elsewhere than the US, the work is subject to declaration and the payment of a 50% import duty upon return to the US224, which acts as counter incentives for shipowners to undertake repairs in the EU. These aspects were noted by the industry as a cause for concern, especially since the EU does not exclude maritime manufacturers from the US or any other third countries. Ship brokers and agents highlighted the importance of feedering services, as increasing ship size implies less ports being called, thus increasing the distance between ports and customers. This also reflected on the relevance of feedering operations in promoting sustainable transport since this way cargo will be transported by sea rather than by road. The shipping industry maintains that feedering and relay operations have been recurring issues as there are few countries in the world that permit such operations. Indeed, feedering is important in growing markets, in particularly in China, India, US, and Russia. Although the respondents did not explain the reason for these choices, the most likely rationale lies in the high volume of goods transported that have their origin or final destination in these countries, and thus necessitate a high level of domestic feedering. Regarding relay operations, despite the fact that relay operations represent around 4.2% of all traffic in
222 Mercosur (or Common Market of the South) region includes Argentina, Brazil, Paraguay, and Uruguay 223 46 U.S.C.12101 (a) and 12132 (b) 224 Tariff Act of 1930, as amended and codified at 19 U.S.C. 1466.

98
China, stakeholders have indicated that EU shipping companies may face a particular challenge there. Due to domestic cabotage rules, EU operators are not permitted to perform relay operations in China. The European Union Chamber of Commerce in China through its Maritime Transport Working Group remarked that this barrier represents a serious problem for EU shipping companies. This is because they do not have the flexibility to optimise route networks and are forced to tranship cargoes originating in China to overseas ports (mainly to South Korea and Singapore), or to rely on a domestic-flagged vessel to transport cargo from one port to another within China.225 Both options result in additional costs and a loss of efficiency. According to the Chamber, it may even be cheaper for EU-operators to tranship cargo outside of China instead of using domestic feeder services that are more expensive.226 Shippers also expressed concerns about feedering and relay in terms of added operational costs to the end-to-end supply chain. The costs arise from the outsourcing of this service to domestic companies since the foreign company are unable to provide these services themselves. The respondents perceived these factors as producing negative impacts in terms of effectiveness, efficiency and reliability of service. However, no indication was given of whether the ability to provide these services by the EU shippers themselves would be a desirable solution. Regarding access to ports and auxiliary services, some of the Member States that were consulted pointed out that a key element of each maritime agreement is to provide free access for their operators to the ports of the non-EU countries. Including access to ports provisions in an agreement gives more certainty and confidence to the industry. In the context of access to ports and port services, Member States highlighted that Brazil maintains a discriminatory lighthouse fee which applies to EU vessels, and applies each time a foreign ship uses a port in a different Brazilian State. The fees are not uniform for all Member States’ vessels due to separate concessions made by different EU Member States with Brazil. With respect to safety, some Member States have highlighted that maritime agreements bring the benefit of dealing with marine casualties and ships in distress. In this case, parties pledge to provide assistance to the vessels of the other party in the same way as they do for their nationals. While this is also required under international law, the bilateral agreements add the further value of ensuring a bilateral cooperation between the authorities (including matters such as investigation), which is not necessarily the case under international law. Furthermore, agreements also ensure that government officials of one party can enter the non-EU country to perform flag state duties (such as inspections). For instance, officials from Cyprus are permitted to access Cyprus’ vessels when these are in India, pursuant to the agreement concluded between the two countries. This greatly facilitates the enforcement of maritime rules even when vessels are far from Cyprus. The Cypriot authorities remarked that the system works smoothly and represents an added value of the agreement. It is also interesting to note that in the USA, the ‘Safe Port Act’227 and the ‘Implementing Recommendations of the 9/11 Commission Act’228 of 2007, require a 100% container scanning of all cargoes to be loaded on board of vessels that are bound for the USA. This requirement is not active yet and its implementation has been set to 2016. There is no
225 European Chamber, European Business in China: Position Paper 2014/2015: Maritime Transport Working Group’, July 2014, p. 351. 226 Ibid. p. 352. 227 Security and Accountability For Every Port Act of 2006, Pub.L. 109–347 228 Implementing Recommendations of the 9/11 Commission Act , Pub.L. 110–53, AUG. 3, 2007

99
similar requirement in the EU, where there is only sample screening requirement.229 The US requirement will inevitably lead to increases in costs for the industry since it requires substantial additional costs related to cargo handling and logistics. Safety remains a challenge for EU operators in China as well. The challenges relate to the risk of accidents due to ignorance of navigational rules, high density traffic (especially near ports) and fraudulent practices in declarations of dangerous cargo.230 Regarding offshore services, consultation with the Member States highlighted that offshore services represent an important market for EU operators in Brazil, the US and Russia. In Brazil, EU shipowners face major restrictions in gaining access to this segment because they need to flag their vessels under the domestic flag and comply with other domestic conditions (for example, relating to hiring of crew). Furthermore, access for foreign companies is hindered through technical and safety standards which can be different in all countries. China is a different case and according to the industry there are formally no obstacles to work in China, but in practice this is impossible. Furthermore, consultation with stakeholders has confirmed that there is a lack of clarity on whether EU offshore vessels are eligible for State aid. This in turn, puts EU offshore service providers at a competitive disadvantage since they are unable to obtain financial support. Their competitiveness on an international scale may thus be jeopardised in the long term. The EU shipping industry as well as Member States, have voiced a strong position for not excluding offshore services from eligibility to State aid since these amount to shipping activities in a similar way as transport services do.231 While there is a slowly shifting policy by the European Commission to acknowledge the fading distinction between ‘services’ and ‘transport’ activities,232 the current Maritime Transport State Aid Guidelines still remain unclear. The Royal Association of Netherlands Shipowners has indicated that not being eligible for State aid has acted as an incentive to flag out offshore service vessels to non-EU countries, in particular to Singapore.233 In addition, the situation is further weakened by the fragmented approach even among the EU Member States when it comes to tax incentives for offshore services. For instance, in the UK, Germany, Malta and the Netherlands, offshore services can be eligible for a special taxation that is otherwise available only for shipping activities.234 On the other hand, in Italy, France, and Ireland, for instance, the approach adopted is more restrictive, and only vessels that engage in some kind of transportation of goods or passengers can be eligible for a special tax regime.235 The situation outside the EU is also characterised by a mixed approach. For instance, Singapore implemented tax incentives to support this sector. It offers a tax exemption to income (application required for non-Singapore flagged vessels) derived from the operation of various vessels outside the limits of the port of Singapore regardless of the
229 Based on risk management procedures in line with the Wold Customs Organisation SAFE Framework of Standards 230 European Chamber, ‘European Business in China: Position Paper 2014/2015: Maritime Transport Working Group’, (July 2014), p. 352. 231 See the results of the Public Consultation on Maritime State Aid Guidelines in particularly regarding Question B6.3. Results are available at: http://ec.europa.eu/competition/consultations/2012_maritime_transport/index_en.html (last accessed February 2015). 232 During a recent Danish case the EC extended the State aid exemption regime to dredging and cable-laying activities for seafarers in Denmark. Commission decision of 13 January 2009 on State aid C 22/07 (ex. N. 43/07). 233 See comments of the Royal Association of Netherlands Shipowners on the public consultation relating to the Maritime State aid Guidelines (2012), p. 4, available at: http://ec.europa.eu/competition/consultations/2012_maritime_transport/rads_en.pdf 234 PwC, Corporate taxation in the global offshore shipping industry (2014). 235 Ibid.

100
characteristics of the vessel in question.236 Other non-EU countries, such as the US or India, have a more restrictive approach and do not offer similar tax incentives.237 Consultation with industry representatives confirmed that the importance of the EU offshore service sector has increased exponentially in recent years.238 Europe already plays a key role in this sector, in particular through the Nordic countries such as Norway and Denmark, but also through the United Kingdom and the Netherlands. These countries are important due to the specialised ships they build to maintain offshore installations. Furthermore, qualified personnel are supplied mainly from EU Member States, notably from the UK, Denmark, Italy, and Sweden.239 On the international level, EU companies face a number of challenges related to offshore services. The main challenge is competition from Asian companies, in particularly Chinese. This was highlighted by both ECSA and the Norwegian Shipowners’ Association240. In particular, ECSA highlighted that EU shipbuilders cannot compete on shipbuilding with countries like China when it comes to building relatively ‘simple’ ships, such as container ships of bulk carriers, because it is much cheaper to build them there. Therefore, EU shipbuilders specialise in smaller sectors such as offshore support vessels, which require a more qualified workforce and technology. Consultation with the Member States revealed some other benefits that the maritime agreements can adduce. On a general level, the principle of freedom of maritime navigation, access to ports and port services, and the possibility to develop maritime cooperation were highlighted as key benefits of the agreements. On a more specific level, the Member States have highlighted that their agreements are often concluded with non-EU countries that used to be discriminative in their treatment of foreign vessels or are important suppliers of seafarers (for instance, the Philippines or Sri Lanka). Some EU Member States (e.g., the Netherlands and Cyprus) have concluded agreements to facilitate the inflow of maritime labour supply from these countries.
5.3 Future challenges under different scenarios
A scenario exploration has been included (see chapter 3) to address the uncertainties in future developments in an explicit manner. In this section, the future challenges for the European maritime sector are discussed for three scenarios. These future challenges are scenario-dependent and the three scenarios as set out in Chapter 3 differ on macro-economic and maritime drivers and are labelled as: • Sustainability Scenario describes a world that is making good progress towards
sustainability and this scenario combines an open, globalised economy with relatively rapid technological change. International cooperation results in a more global playing field regarding environmental, safety and labour regulations;
• Fragmented World Scenario describes a world separated into regional blocks of countries with little coordination between them. The world has de-globalized and international trade is restricted. International coordination is not functioning, even existing regulations and conventions are ignored or poorly enforced, and a wide variety of region or country specific regulations exists affecting the level of playing field;
236 PwC, Corporate taxation in the global offshore shipping industry (2014). 237 PwC, Corporate taxation in the global offshore shipping industry (2014). 238 ECSA, ‘ECSA brings offshore shipping into the fold’, available at: http://www.ecsa.eu/news-and-media/9-latest-news/145-ecsa-brings-offshore-shipping-into-the-fold. See also, Oxford Economics, ‘The economic value of the EU shipping industry’, 239 Report of the Task Force on Maritime Employment and Competitiveness and Policy Recommendations to the European Commission (2011). 240 ECSA, ‘The Economic Value of the EU Shipping Industry’, (2014); Norwegian Shipowners Association, available at: http://ec.europa.eu/competition/consultations/2012_maritime_transport/nsa_en.pdf

101
• Conventional Growth Scenario is oriented towards economic growth and in this high growth scenario fossil fuels play a dominant role resulting in high GHG emissions. The world has increasingly globalised and the economic centre of the world is in Asia with dominant South-South trade flows. International cooperation is well functioning in this scenario creating a rather equal level of playing field for the industry.
The three scenarios are long term scenarios and address possible fundamental changes in the global economy, maritime sector or international cooperation. The scenarios describe transitions in the period up to 2050 and their intermediate results for 2030. In this section, the scenario insights are enriched with the perception of stakeholders on challenges for their sector. In general the time horizon of stakeholders is more focussed on short or medium term issues instead of long term issues. The challenges raised by the stakeholders are included as part of the scenario where this issue is assumed to be most important. The focus of the discussion in this section is on the ten countries as selected in chapter 4. Additional countries are included in the discussion if specifically indicated by stakeholders. Specific attention is given to future conditions issues where the playing field is not even, either by trade barriers, market competitiveness, abusive incentives or regulation.
5.3.1 Trade developments In the Sustainable Scenario a level playing field is internationally arranged and few specific challenges are left to address at a bilateral level. This is completely different in the Fragmented World Scenario, where international conventions are not successful and bilateral agreements are crucial in gaining market access. In this scenario, the USA and Canada are important partners and bilateral agreements should arrange a preferred position for Europe to ensure energy and food supply. As the world is divided in regional blocks, and the world market in unreliable, it is important to have preferred partnerships or to include countries with essential natural resources within the trade block. Both the USA and Canada have valuable natural resources from the perspective of Europe and historical and cultural ties make a functioning partnership with these countries more likely than with other countries outside Europe. The Conventional Growth Scenario is characterised by high economic and trade growth, especially in the South-South corridor. To remain a leading world player, the European maritime sector needs good market access to China and India especially reflecting their dominant position in the world economy. Furthermore, focus on Russia is needed as a main supplier of the dominant conventional fuels in this scenario. Under this scenario, African countries show a high growth of their economy, increasing their market relevance for the European maritime sector. In this scenario it is important that European countries improve their market access to the West African countries. Today’s concerns about protectionist measures in some African countries, like Ghana and Nigeria mentioned by the stakeholders, need to be addressed. Other countries of specific relevance mentioned by the stakeholders, not part of the ten countries out of section 4, are Canada and Mexico in all shipping segments. Regarding the offshore segment the USA and China especially are mentioned as significant but (semi-)closed markets.
5.3.2 Fleet registry competitors The challenges regarding the competitiveness of the European registries differ for the three scenarios. In the Sustainability Scenario, international conventions set higher standards for environment, safety and labour conditions. On top of the international standards, regulations by the EU are not needed in this scenario, and a level playing field exists for the European flag states on this aspect. The aspect of fiscal competition is still unsolved and this is a remaining issue for EU flag states in the competition with Singapore, China, Panama and other open registries like Liberia and the Marshall Islands. The Conventional Growth Scenario

102
has much in common with the Sustainability Scenario except the lack of attention for environmental regulations. Under both scenarios quality of services of the registries is considered, besides fiscal conditions as an important competitive aspect. The importance of a high quality registry service is emphasized by industry stakeholders and in particular they have emphasized their preference to avoid cumbersome inspections. In their view, open registries, such as Panama, score well on service aspects and minimize the number of cumbersome inspections. Additional administrative requirements and inspections seems not to be necessary to score well on Port State Control indicators. For instance, the Tokyo Memorandum of Understanding on Port State Control, which includes China, Japan, Korea, Russia, Singapore, and other Asia-Pacific countries, have the three main open registries, Panama, Liberia and Marshall Islands in their white list. Most European flags are in the white list as well but some European flags, such as Belgium, Sweden and Luxemburg are positioned in the grey list. Open registries seem to remain in white lists for reasons of fewer costs and less administrative burden. It is therefore a challenge for European flags to improve their performance to move up to the white list, and for instance through better information and reducing processing times and costs. Under the Fragmented World Scenario, the level playing field is affected by the lack of new developments in international conventions on the environment, safety and labour, and a weak compliance with of the existing international agreements. Different regulations between EU and competing registries, such as China, Singapore and Panama, are a challenge for the competitive position of European flag states. Increasing protectionism under this scenario is a concern for the EU. Stakeholders point out that protectionism might force a flagging-out process to non-EU flags in order to access regionalised and protectionist markets. Operating under another flag is attractive in regions where market access is restricted or other flags can operate more beneficially, for example by applying lower labour and environmental standards. As international conventions, setting global standards are less relevant and often not enforced in this scenario different regional blocks set their own labour, safety and environmental standards that the fleet needs to comply with to access the market in their region. As European flags states are likely to use stricter regulations it is for European shipowners attractive to operate in these markets under non-European flags, either open registries or local flags. Although the level of change depends on the scenario assumptions, it is most likely that labour costs play a less dominant role, due to automation of activities on board and an increasing average ship size, in the future. The importance of labour costs varies between the short and long term. If the industry needs to act directly labour costs are one of the few costs they can influence in the short term. A long term strategy has much more options and, for example, future labour costs can be traded with capital investment to sail more economically with larger vessels or innovations can be stimulated to reduce energy consumption or labour intensity.
5.3.3 Market competiveness In the Sustainability Scenario, international conventions on employment, safety, security, environment and market access set good standards to ensure market competitiveness. In this scenario, market access is liberalised and the European shipping industry can compete in most countries under comparable market conditions. In some countries and regions, such as Russia, Brazil and West Africa, market protectionism remains an issue but as a result of the open international political climate it is less severe than under the other scenarios. Market conditions in China remain a high priority, mainly due to the high relevance that this market
103
represents for the EU and its central position in global supply chains. For example inefficiencies in Chinese ports have large domino effects on delays of supply chains serviced by ultra large container vessels. In the Fragmented World Scenario market competitiveness is a high priority issue for the European maritime industry in many countries including the USA and China. The USA is highly important due to the size of its economy, and visa requirements, cabotage, and discriminatory treatment are reinforced under the Fragmented World Scenario. The shipping industry is under economic pressure and to improve margins the market changes from low concentration and high competition to more concentration and less competition. Reduced margins are the norm, except in very highly specialised or highly diversified segments. Currently some aspects of the market are not liberalised, see section 5.2, and this is likely to become more severe under the Fragmented World Scenario and less severe, but still an issue, under the Conventional Growth Scenario. Under these scenarios market disruptions are likely to increase in nature and size. The low-competitive conditions in the Fragmented World Scenario have a negative impact on the competitiveness of the European maritime industry and the European economy as it increases transport costs. Under the Conventional Growth Scenario international conventions are functioning well and overall competitive conditions are better than in the Fragmented World Scenario. But still many of today’s challenges, such as unreliable customs brokerage, lengthy security checks, cargo handling delays, and lack of sufficient repair and maintenance services are likely to remain issues at least in the short and medium future.
5.3.4 New routes and ports Regarding new international routes, the Sustainability Scenario specifies the potential for the Eurasia land bridge between Europe and China. In the long term, depending on political change in North Korea, this route can potentially also be extended to South Korea. For a successful operation of this line, active co-ordination and partnership is needed between European countries, Russia and China. Alternative routes exist for the Eurasian Land Bridge and depending on the routing, Mongolia and or Kazakhstan are important partners as well. The Northern Sea Route is considered under the Conventional Growth Scenario which combines a high growth in trade volumes between Asia and Europe with increased global warming due to a high increase in the use of fossil fuels. To establish this route international co-operation with Russia and Asian countries, like the Republic of Korea, Japan and China, seems crucial for an efficient operation of this route. In the Fragmented World Scenario weak international cooperation and regional focus of trade flows reduces the interest in new routes. In the Sustainability Scenario, a switch towards more sustainable fuels has been realised by the European and international shipping industry. An EU-wide LNG network is an important element for the future competitiveness of EU ports. At the moment North European ports seem more active to develop LNG facilities and this might reinforce their leading position under this scenario compared to South European ports. Stakeholders state that incentives to set up LNG facilities favour the North European ports where there is a longer tradition of clean energy and environmental regulations. It is advisable that the EU focuses on a balanced approach including the South-European ports from the start. For ports with a strong position in handling energy carriers, such as coal or oil, or ports with a large petrochemical processing industry, a substantial transition is needed to maintain their competitive positions. Alternative energy carriers, such as biofuels, might be part of new activities in the

104
ports replacing loading, unloading, storage and processing activities for conventional energy carriers. In the Fragmented World Scenario, port capacity needs are more modest than in the other two scenarios and Europe might apply port state control instruments more frequently as a substitute for the lack of international conventions to preserve Europe’s interests. Under this scenario, the increase in ship size and associated infrastructure needs, are also more modest. A low economic growth in combination with trade barriers reduces freight volumes in this scenario and associated demand for vessel volumes. Furthermore a higher share of regional flows, instead of global flows, makes an increase in vessel size less attractive. For larger vessels is the trade-off, between lower sailing cost and higher transhipment cost, more advantageous for global flows than for regional flows. In the Conventional Growth Scenario, port capacity demand increases very quickly and an increasing average ship size results in higher peak loads. Stakeholders emphasize that there is especially a need in South European ports to upgrade their operational capacity to handle larger ship sizes and increased transhipment services. Furthermore, in this scenario, substantial port and hinterland infrastructure investments are needed to serve the European economy efficiently.
5.3.5 Incentives and support In the Sustainability Scenario, international conventions set worldwide applicable standards for an equal level playing field but these standards do not cover taxation levels. Hence fiscal competition will remain with countries, such as Singapore, offering advantageous tax conditions for the maritime industry. The scope of incentives can cover maritime transport activities or wider definitions of the maritime cluster, for example including offshore or on land activities. The EU's relations with West African countries are in this scenario, similar to the other two scenarios, a high priority. From the shipping industry there is a call of attention for trade, ports and infrastructure capacity building support from the EU to West and other African countries. As international conventions are rather generally implemented under the Sustainability Scenario, which sets an equal level of playing filed regarding labour, environmental, safety and security regulations, competition between companies will focus on quality and price as all other conditions are rather similar. Countries can support their own industry by offering high quality and efficient services, for example flag registration or compliance with conventions, at low costs and a reduced administrative burden for the maritime industry. Economies of scale play an important role in offering high quality services at low cost and the ongoing worldwide concentration of market shares in few specialized registries is likely to continue. It is questionable whether the large number of European registries can all play an important role under these conditions. Most likely market forces result in a further concentration of registry activities within Europe or European countries need to be willing to increase support for their relative small registries. Further regions can improve their competitive condition by offering business development facilities, improved maritime education and support of research and development in the maritime field. In line with smart specialization strategies regional options can be identified for the Maritime Industry. In the Fragmented World Scenario, the world is divided into various regional blocks, and countries support their industry with supportive measures and hinder the entrance of competitors with protectionist regulations. In this scenario, the EU faces issues of fair competition with almost all countries outside their economic partnership. Under this scenario the EU has to rely on bilateral agreements to improve competitive conditions. This process will results in a variety of agreements and regulations for the maritime industry to comply

105
with. From an economic perspective this variety in regulations, compared to global regulations, is inefficient and results in increasing costs of trading goods. Under this scenario local governments support their own industry by setting advantageous standards for their own industry and international competitors are required to meet these standards as well. Local governments also provide direct transfers to their own maritime industry and other supportive measures such as tax exemptions, beneficiary access to capital and privileged conditions for port related services. Some of these actions might violate existing agreements but under this scenario international conventions and their implementation play a marginal role. In the Conventional Growth Scenario, international cooperation and conventions are functioning relatively well, ensuring a level playing field. In this scenario, due to high growth rates, dominance of the Asian countries (East Asia is by far the largest economic region in the world, see Chapter 3), should be avoided and specific attention is needed for the relationships with Asian countries, such as China and Singapore. International cooperation, within the EU and between the EU and other partners, will be needed to negotiate effectively with these dominant Asian economies. Furthermore, in this liberalised world, Asian registries and open worldwide registries have a strong market position.. Many aspects under this scenario, like focus of competition on taxation levels and quality of services, are similar to the Sustainability Scenario. Biggest difference is the lack of international attention for environmental issues and increased importance of Asia.
5.4 Conclusions
This study explored key trends in the international and EU shipping market, as well as the main challenges of the EU shipping access to key non-EU markets. The analysis concludes with a number of key trends, messages and recommendations conveyed to the European Commission regarding possible steps to reiterate at EU and non-EU forums the need of framing a global level playing field.
5.4.1 Market condit ions: Trends, Possible next steps, and Recommendations
Fleet registry competitors Trends: EU shipping risks flagging out if they stay at disadvantage as a result of uneven global playing field on fiscal competition; lack of harmonised implementation of international conventions on environment, safety (IMO), and labour (ILO); the quality of the registry services; the inspection and enforcement standards of Port State Controls; and the use of competitive registries to access otherwise protectionist markets. Possible next steps: To level the playing field on fleet registry competition. It is important to follow development at global level on fiscal regimes and make efforts for harmonization; to develop and harmonize enforcement of environmental, safety, and labour standards through international organisations, to promote efficiency among registries and maritime authorities, taking into account the market access to provision of services by all the EU maritime industry. Recommendation(s): Promote harmonisation of fiscal regimes for the maritime sector at a global level. In absence of harmonised standards follow international developments in fiscal regimes, such as taxation levels and included scope of maritime sector, and review if existing Maritime State Aid Guidelines are still appropriate for the European registries and maritime industry to

106
compete at a global level; Support the improvement of the quality of services, efficiency of inspections and administration processing times and costs, of European registries. Consider the importance of economies of scale in this field and study the pros and contras of a further concentration of registry activities within a few registries in Europe.
Market competiveness Trend: The highly competitive shipping industry faces tight economic performance. Reduced margins have been the norm, except in very highly specialised or in highly diversified segments. In between the specialised and diversified segments, container liner industry markets had to change dynamics to improve their margins, from low concentration and high competition, to more concentration and less competition. The EU maritime industry margins have been also hindered by non-competitive challenges as described in section 5.2. Possible next steps: To balance out improved margins in the shipping industry and reduced market concentration, to allow shippers and consumers to benefit from competition, and to reduce the likelihood of shipping companies to engage in collusive behaviour. Recommendation(s): Establish a shipping industry market observatory in liaison with the DG MOVE and the European Commission Competition Authority to identify mechanisms to adjust EU competition policies according to: 1) market concentration and competition; 2) freight rates, and quality and reliability of services provided and 3) challenges from non-EU countries affecting the EU maritime industry’s margins.
New routes and ports Trends: The importance of new routes varies according to the considered scenario. A Sustainability Scenario specifies the potential for the Eurasia land bridge between Europe and China; whilst the Conventional High-growth Scenario specifies the potential of the Northern Sea Route. Possible next steps: A successful operation of the Sustainability Scenario requires an active co-ordination and partnership between the European countries, Russia and China. For a successful operation of the Conventional Scenario, international co-operation with Russia and Asian countries, like the Republic of Korea, Japan and China, seems crucial for an efficient operation of this route. Recommendation(s): Follow developments on the Northern Sea Route closely and, when conditions are favourable, increase the level of involvement once actual basic investments in navigation infrastructure and safety provisions are made. Analyse the potential of the Eurasia land bridge by regions and product types. Trends: The main challenges for the European ports are scenario dependent and can be summarised as:
107
1) development of a balanced EU-wide LNG network as an important element for future competitiveness of EU ports;
2) ports should prepare for the transition of conventional fuels towards more sustainable sources of energy and
3) economic growth and an increasing average ship size result in high growth in peak flows to be managed by ports and hinterland infrastructure.
Possible next steps: There is a need to balance the LNG network development to include South European ports from the start. For ports with a strong position in handling energy carriers, such as coal or oil, or ports with a large petrochemical processing industry, a substantial transition is needed to retain their competitive positions. Alternative energy carriers, such as biofuels, might be part of this transition of port activities. The operational capacity of ports and hinterland infrastructure in Europe needs to be upgraded to handle larger ship sizes and increased transhipment services. These actions involve transport infrastructure as well as management solutions, including ICT solutions, further automation of flows and logistic concepts better differentiating between high speed urgent flows and less urgent flows. Recommendation(s): Consider involvement of TEN-T and CEF (Connecting Europe Facility) by looking at investment mechanisms to support EU ports’ operational capacity, including substantial port and hinterland infrastructure, and development of LNG infrastructure. The ports in South Europe call for specific attention as their operational capacity to handle larger ships and options to switch to LNG infrastructure seem to be lagging behind.
Incentives Trends: The comparative analysis showed multiple incentives operational around the world. The incentives try to ease one or more of the following burdens from stakeholders: operational, financial, and regulatory. Alternatively, incentives contribute to building up their operational, scale or scope capabilities. These incentives tend to have positive effects on the decision to select a flag. Possible next steps: For upgrading the EU maritime industry, access to incentives to the level of the most competitive flags is needed. Recommendation(s):
Promote incentives and support mechanisms at three levels. First, sustaining favourable taxation schemes and creating mechanisms to strengthen the corporate culture and structure of EU shipping companies. Second, setting up mechanisms to attract and sustain companies to maritime clusters; facilitating bank finance; and sustaining mechanisms for competence and skills building and development for the shipping industry. And third, trade facilitation by removing trade limits through diplomatic means with protectionist country/region/trade lane; reducing red tape in the EU; and supporting favourable unionisation to the maritime industry industrial relations.

108
Labour Trend: For shipowners, labour is one of the few cost items which they can directly act upon to reduce transport costs. As a consequence, there has been an ongoing process during several decades to reduce labour costs through technological developments, increasing ship size and replacing expensive labour with cheaper labour. Combined with additional security, related workload for existing crews in piracy-affected areas has led to situations where fatigue of crew members is more often the standard than the exception. The whole process has also worsened shipping’s reputation for attracting new employees, and has limited possibilities for including new labour and training of new labour. Although the trend of reducing labour costs will be difficult to stop independently, there are a few areas where improvements can be made. Possible next steps: In the long run, as result of an increasing average ship size and further automation of activities on board, the share of labour costs of the overall shipping costs is likely to reduce. This development is beneficial for the European Maritime Industry as long as it remains a front runner in innovation and adoption of new technologies. Recommendation(s): Research into schemes which make a maritime career more attractive for EU citizens. Support the position of the EU as frontrunner in maritime technology in practice, e.g. R&D support measures, enabling the testing of new technologies, such as unmanned ships.
5.4.2 Agreements Many of the older bilateral maritime agreements, while still in force, appear to have gained a ‘dormant’ status as the contracting parties seldom invoke them. In general all countries exclude foreign operators from cabotage.
Feedering and relay Most maritime agreements of the EU and its Member States do not address feedering and relay operations. Those that do mention them merely permit access, but prohibit the supply of such services for EU operators. Due to the increasing ship sizes, feedering is becoming more and more important. Relay operations are an important component in making maritime traffic more cost efficient through optimal routing. Feedering also presents additional operational costs due to the necessity to outsource these operations to domestic shippers. Possible next step(s): Based on the findings outlined in Sections 4.3.4, 4.3.5, and 5.3, feedering and relay operations necessitate a more careful consideration during negotiations with third countries, in particularly regarding the possibility for EU shipping companies to engage in these services for the transportation of their own cargo. Recommendation(s): Pay a closer attention to feedering and relay operations when negotiating new agreements, and to the possibilities for EU shipping companies to carry their own cargo in a more efficient way to the port of final destination.
109
Offshore The offshore market is particularly important in Brazil, the US and Russia, but EU shipowners face restrictions in gaining access to this segment due to the need to use domestic flag vessels and abide by additional domestic rules. Possible next step(s): The industry has also voiced its concern about the lack of clarity regarding eligibility of EU offshore service providers for State Aid. Although the EU offshore industry is particularly important when it comes to building specialised vessels and training qualified personnel, competition from Asian companies is growing rapidly. Recommendation(s): Support further research into clarifying the eligibility requirements under the Maritime State Aid Guidelines to extend also to vessels providing offshore services.

110
Annex I Glossary
Cabotage Regulation of transport services between two points in the same country, restricting it to its own flag vessels. Cargo sharing The reservation and division of maritime traffic between designated trading partners who agree that vessels owned or controlled by either will carry a specified percentage of the cargo moving between them. Cargo preference (or Cargo reservation) Cargo Preference refers generally to legal requirements for the carriage of government-impelled cargoes on the vessels flagged within the registry of that government for the purpose of promoting a national merchant marine. Feedering Feedering operation is defined as the pre- and onward transportation of international cargoes by sea, notably containerised, between ports located in a country. Hub-and-spoke networking Hub-and-spoke networking is a system of connections arranged like a chariot wheel, in which all traffic moves along spokes connected to the hub at the centre. The model is commonly used in industry, in particular in transport, telecommunications and freight. Sea transport, where feeder ships transport shipping containers from different ports to a central container terminal to be loaded onto larger vessels. Interlining Arrangements between carriers to take part in a continuous route to complete delivery of a shipment. Jones Act The Merchant Marine Act of 1920, also known as the Jones Act, is a United States federal statute that provides for the promotion and maintenance of the American merchant marine. Among other purposes, the law regulates maritime commerce in U.S. waters and between U.S. ports. Section 27 of the Jones Act, deals with cabotage and requires that all goods transported by water between U.S. ports be carried on U.S.-flag ships, constructed in the United States, owned by U.S. citizens, and crewed by U.S. citizens and U.S. permanent residents Most-favoured-nation principle Most-favoured-nation principle means the country which is the recipient of this treatment must, nominally, receive equal trade advantages as the "most favoured nation" by the country granting such treatment. Open ship registry Ship registration under a national flag available to all ships regardless of nationality of shipowner. Port State Control Port State Control (PSC) is the inspection of foreign ships in other national ports by PSC officers (inspectors) for the purpose of verifying that the competency of the master and officers on board, and the condition of the ship and its equipment comply with the requirements of international

111
conventions (e.g. SOLAS, MARPOL, STCW, etc.) and that the vessel is manned and operated in compliance with applicable international law. Regional cabotage Regulation of transport services between two points in the same region of countries, restricting it to their own flag vessels. Relay of international cargo relay of international cargo is defined as the practice of one company carrying cargo from one country to an overseas destination on its own vessel, transferring the cargo from one vessel to another operated by the same company in another port of that country. Slow steaming Slow steaming refers to the practice of operating transoceanic cargo ships, especially container ships, at significantly less than their maximum speed (around 18 knots’ Transhipment A distribution method whereby containers or cargo are transferred from one vessel to another to reach their final destination, compared to a direct service from the load port of origin to the discharge port of destination. This method is often used to gain better vessel utilization and thereby economies of scale by consolidating cargo onto larger vessels while transiting in the direction of main trade routes.
112
Annex II Overview of trade agreements
This annex presents the list of agreements between the EU and its Member States, of the one part, and non-EU countries, of the other part which fall within the scope of our analysis.241 The agreements were obtained from various sources: through existing databases (UNTS, EU Treaties Database, DG TRADE website) as well as through bilateral contact with the Member States’ competent authorities.
The Member States with whom we consulted also confirmed the agreements that they have with the ten selected countries. These Member States also gave us permission to use and analyse their agreements.
Nonetheless, the list of agreements presented below may not be complete since some of the agreements may be kept confidential and, where lacking any confirmation from the MS, there is no possibility to obtain these or verify their current legal status.
Table A 1 Bilateral/Multilateral Agreements with relevant maritime clauses between the EU/MS and the top 10 countries
Top 10
Country
EU / MS Agreement
1. Russia Belgium and
Luxembourg
Maritime Agreement between the Belgo-Luxembourg Economic
Union and the Union of Soviet Socialist Republics (with protocol of
17 November 1972 and exchange of letters of 17 November 1972).
Signed on 17 April 1974 Moscow, Entered into force 1 April 1974 2. Cyprus Agreement on merchant shipping, signed 1985
3. Latvia Maritime Agreement between the governments of the Republic of
Latvia and the Russian Federation, Signed on 22 February 1995
Moscow, Entered into force 15 May 1995 4. Germany Maritime Agreement between Germany and the Union of Soviet
Socialist Republics. Signed on 7 January 1991 Bonn
5. France Maritime Agreement between the Union of Soviet Socialist
Republics and France. Signed on 20 April 1967 Paris
6. Spain Convention on maritime transport between the Kingdom of Spain
and the Russian Federation. Signed 22 May 2001 Moscow. Entered
into force 17 January 2006 7. Sweden Traktat-01071 Bilateral 1973-04-05 1973-05-05 Sjöfartsavtal
SÖ 1973:4 (text not available)
Traktat-01072 Bilateral 1973-04-05 1973-05-05 Protokoll ang.
ömsesidig skattebefrielse för sjöfartsföretag SÖ 1973:5 (text not
available) 8. USA EU Agreement between the European Community and the United
States on the mutual recognition of certificates of conformity for
marine equipment, signed 27.02.2004 Washington (EU-US Marine
Equipment Agreement)
241 Source for list of agreements: DG TRADE: http://ec.europa.eu/trade/policy/countries-and-regions/agreements/#_other-countries (last accessed 9 December 2014).

113
Top 10
Country
EU / MS Agreement
9. Germany Treaty of Friendship, Commerce and Navigation (with Protocol and
exchange of notes). Signed at Washington, on 29 October 1954
10. Greece Treaty of Friendship, Commerce and Navigation. Signed at Athens,
on 3 August 1951
Exchange of letters concerning the above-mentioned Treaty.
Athens, 22 October 1953 and 18 January 1954 11. Ireland Treaty of Friendship, Commerce and Navigation (with Protocol and
annexed Minutes of Interpretation). Signed at Dublin, on 21
January 1950
12. Italy Treaty of Friendship, Commerce and Navigation between the United
States of America and the Italian Republic. Signed at Rome, on 2
February 1948
13. Luxembourg Treaty of Friendship, Commerce and Navigation (with Protocol).
Signed at Luxembourg, on 23 February 1962
14. Netherlands Treaty of Friendship, Commerce and Navigation (with Protocol and
exchange of notes). Signed at The Hague, on 27 March 1956
15. Belgium Treaty of Friendship, Establishment and Navigation (with Protocol ).
Signed at Brussels, on 21 February 1961.
16. Denmark Treaty of Friendship, Commerce and Navigation between the United
States of America and the Kingdom of Denmark (with Protocol).
Signed at Copenhagen, on 01 October 1951
17. Denmark Exchange of notes constituting an agreement relating to jurisdiction
over vessels in United States deepwater ports. Signed at
Washington, on 17 and 22 August 1978
18. Finland Exchange of notes constituting an agreement relating to jurisdiction
over vessels utilizing the Louisiana Offshore Oil Port. Signed at
Washington, on 1 December 1982
19. France Exchange of letters constituting an agreement concerning the
Louisiana off-shore oil port (Loop). Signed at Washington, on 24
March and 6 April 1983
20. Germany Exchange of notes constituting an agreement concerning
jurisdiction over vessels utilizing the Louisiana Offshore Oil Port.
Signed at Washington, on 15 September 1981, 4 September 1981,
and 2 July 1981 21. Greece Exchange of notes constituting an agreement relating to jurisdiction
over vessels utilizing the Louisiana Offshore Oil Port. Signed at
Athens, on 7 and 12 May 1982
22. Italy Exchange of notes constituting an agreement concerning
jurisdiction over vessels utilizing the Louisiana Offshore Oil Port.
Signed at Washington, on 12 and 19 January 1982
23. Netherlands Exchange of notes constituting an agreement concerning the
jurisdiction of the United States over Netherlands vessels utilizing
the Louisiana Offshore Oil Port (LOOP). Signed at Washington, on 9
and 16 March 1981

114
Top 10
Country
EU / MS Agreement
24. Poland Agreement between the United States of America and Poland
relating to jurisdiction over vessels utilizing the Louisiana Offshore
Oil Port. Signed at Washington, on 30 March 1984, 10 April 1984
25. Sweden Traktat-00060 Bilateral 1930-10-29 1930-10-29, Ministeriella
noter ang. ömsesidig befrielse från sjöfartsavgifter för lustfartyg
SÖ 1930:58 (text not available)
Exchange of notes constituting an agreement relating to jurisdiction
over vessels in United States deepwater ports. Signed at
Washington, on 17 and 22 August 1978 26. United
Kingdom
Exchange of notes constituting an agreement concerning the use of
the Louisiana Offshore Oil Port (LOOP) by vessels registered in the
United Kingdom, the West Indies Associated States or its other
territories or flying the flag of the United Kingdom. Signed at
Washington, on 14 and 25 May 1979 27. Belgium Agreement between the United States of America and Belgium
relating to jurisdiction over vessels utilizing the Louisiana Offshore
Oil Port. Signed at Washington, on 1 and 9 December 1983
28. Spain Exchange of letters constituting an agreement concerning
jurisdiction over vessels using the Louisiana Offshore Oil Port
(LOOP). Signed at Madrid, on 5 and 22 November 1983
29. France Agreement between the Government of the United States of
America and the Government of France respecting maritime claims
and litigation. Signed Washington, on 14 March 1949
30. Brazil EU Framework Agreement for Cooperation between the European
Economic Community and the Federative Republic of Brazil -
Exchange of Letters between the European Economic Community
and the Federative Republic of Brazil on maritime transport. Signed
at Brasilia, on 29 June 1992 31. Romania Agreement concerning maritime transport. Signed at Brasilia, on 5
June 1975
32. Germany Agreement concerning maritime transport. Signed at Brasilia, on 4
April 1979
33. Germany Protocol on maritime transport. Signed at Bonn on 30 November
1963
34. Germany Protocol on maritime transport. Signed at Brasilia, on 17 November
1992
35. Bulgaria Agreement on maritime commercial navigation. Signed at Sofia on
19 August 1982
36. France Maritime Agreement. Signed at Paris, on 24 October 1975
37. Poland Agreement on maritime transport. Signed at Warsaw, on 26
November 1976
38. Sweden Traktat-00179 Bilateral 1971-09-22 1971-09-22 Ministeriella
noter om konsultationer i sjöfartsfrågor SÖ 1971:35 (text not
available)

115
Top 10
Country
EU / MS Agreement
39. Singapore Germany Agreement between the Government of the Federal Republic of
Germany and the Government of the Republic of Singapore on
maritime transport. Signed at Berlin, on 15 June 2000
40. China EU Agreement on maritime transport between the European
Community and its Member States, of the one part, and the
government of the People's Republic of China, of the other part.
Signed at Brussels, on 6 December 2002 41. EU Protocol amending the Agreement on maritime transport between
the European Community and its Member States, of the one part,
and the Government of the People's Republic of China, of the other
part, to take account of the accession of the Czech Republic, the
Republic of Estonia, the Republic of Cyprus, the Republic of Latvia,
the Republic of Lithuania, the Republic of Hungary, the Republic of
Malta, the Republic of Poland, the Republic of Slovenia and the
Slovak Republic to the European Union. Signed at Beijing, on 5
September 2005 42. Cyprus Agreement on maritime transport, signed 1990
43. Germany Agreement on maritime transport. Signed at Peking, on 31 October
1975
44. Germany Arrangement between the Federal Ministry of Transport,
Construction and Housing of the Federal Republic of Germany and
the Ministry of Communications of the People's Republic of China
concerning cooperation in the fields of inland shipping and
waterways. Signed at Beijing, on 1 December 2003 45. Germany Agreement on maritime transport. Signed at Peking, on 9 May 1995
46. Latvia Agreement between the Government of the Republic of Latvia and
the Government of the People's Republic of China on maritime
transport. Signed at Beijing, on 15 April 2004
47. Lithuania Agreement on maritime transport between the Government of the
Republic of Lithuania and the Government of the People's Republic
of China. Signed at Beijing, on 23 April 2007
48. Netherlands Agreement on maritime transport. Signed at Peking, on 14 August
1975
49. Romania Agreement on maritime transport. Signed at Peking, on 8 April
1976
50. United
Kingdom
Agreement concerning maritime transport. Signed at London, on 17
July 1996
51. France Agreement between the Government of the French Republic and the
Government of the People's Republic of China concerning maritime
transport. Signed at Peking, on 28 September 1975
52. Sweden Traktat-00644 Bilateral 1975-01-18 1975-01-18 Sjöfartsavtal
SÖ 1975:5 (text not available)
Traktat-00639 Bilateral 1908-07-02 1909-06-14 Vänskaps-,
handels- och sjöfartstraktat SFS 1909:113 (text not available) 53. Turkey EU Agreement creating an association between the European Economic
Community and Turkey - Protocol n° 1: provisional protocol -

116
Top 10
Country
EU / MS Agreement
Protocol n° 2: financial protocol - final Act – Statements. Signed at
Ankara, on 12 September 1963, , OJ L361/1 1977 54. Latvia Maritime Agreement between the Government of the Republic of
Latvia and the Government of the Republic of
Turkey. Signed at Riga, on 4 June 1997
55. Sweden Traktat-01165 Bilateral 1962-01-27 1962-01-27 Ministeriella
noter med upphävande av tullkoncessionen i 1929 års handels- och
sjöfartstraktat och 1939 års tilläggsavtal SÖ 1962:12 (text not
available)
Traktat-01160 Traktat-01156 Bilateral 1939-03-24
Tilläggsavtal till handels- och sjöfartstraktaten den 29 sept. 1929
SÖ 1939:20 (text not available)
Traktat-01156 Bilateral 1929-09-29 1931-05-29 Handels- och
sjöfartstraktat SÖ 1931:9 (text not available) 56. South
Korea
EU Free trade Agreement between the European Union and its Member
States, of the one part, and the Republic of Korea, of the other
part. Signed at Brussels, on 06 October 2010
57. EU Framework Agreement between the European Union and its Member
States, of the one part, and the Republic of Korea, of the other
part. Signed at Brussels, on 10 May 2010
58. EU Protocol to the Framework Agreement for Trade and Cooperation
between the European Community and its Member States, on the
one hand, and the Republic of Korea, on the other hand, to take
account of accession of the Czech Republic, the Republic of Estonia,
the Republic of Cyprus, the Republic of Latvia, the Republic of
Lithuania, the Republic of Hungary, the Republic of Malta, the
Republic of Poland, the Republic of Slovenia and the Slovak
Republic to the European Union. Signed at Brussels, on 16
November 2005 59. EU Framework Agreement for Trade and Cooperation between the
European Community and its Member States, on the one hand, and
the Republic of Korea, on the other hand. Signed at Luxembourg,
on 28 November 1996 60. Netherlands Agreement on maritime transport between the Government of the
Republic of Korea and the Government of the Kingdom of the
Netherlands. Signed Seoul, on 3 February 1995
61. Netherlands Exchange of notes between the Kingdom of the Netherlands and the
Republic of Korea to extend the Agreement on maritime transport
to Aruba. Signed at Seoul, on 20 January and 13 February 1998
62. Cyprus Agreement on maritime transport between the Government of the
Republic of Cyprus and the Government of the Republic of Korea.
Signed at Nicosia, on 2 December 2008
63. United
Kingdom
Agreement concerning maritime transport. Signed at Seoul, on 11
August 1994
64. Bulgaria Agreement between the Government of the Republic of Korea and
the Government of the Republic of Bulgaria on maritime transport.
Signed at Sofia, on 16 June 2005

117
Top 10
Country
EU / MS Agreement
65. Germany Agreement between the Government of the Federal Republic of
Germany and the Government of the Republic of Korea on maritime
shipping. Signed at Leipzig, on 3 May 2012
66. Japan EU Agreement between the European Community and the Government
of Japan on Cooperation and Mutual Administrative Assistance in
Customs Matters, signed on 30 January 2008, OJ L62/24
06.03.2008 67. Denmark Friendship, Commerce and Navigation Agreement between Denmark
and Japan, signed 1867 (not obtained)
68. Sweden Traktat-00588 Bilateral 1911-05-19 1911-07-17 Handels- och
sjöfartstraktat SFS 1911: (text not available)
69. India Cyprus Agreement on maritime transport between the Government of the
Republic of Cyprus and the Government of India, signed 1997 70. Bulgaria Agreement on maritime transport between the Government of India
and the Government of Bulgaria, signed 1976 71. Croatia Agreement on the Maritime Transport by and between the
Government of India and the Government of Croatia, signed 1997 72. Germany Agreement between the Government of the Federal Republic of
Germany and the Government of India on maritime shipping. 73. Czech
Republic
Agreement on maritime transport between the Government of the
Czech Republic and the Government of India, signed 1978 74. Poland Protocol between the Government of India and the Government of
Poland, signed 1970 75. Panama EU EU-Central America association agreement. Signed on 29 June 2012
Table A 2 presents the trade agreements that have a maritime transport component.
Table A 2 Overview of the EU’s trade agreements
Non-EU country
Agreement Date of entry into force
1. Chile Agreement establishing an association between the EC and its Member States and the Republic of Chile (2004)
1 March 2005
2. South Africa Agreement on Trade, Development and Cooperation between the European Community and its Member States, of the one part, and the Republic of South Africa, of the other part
1 May 2004
3. Colombia and Peru
Trade Agreement between the European Union and its Member States, of the one part, and Colombia and Peru, of the other part
5 November 2014
4. Republic of Korea
Free trade agreement between the EU and its Member States, of the one part, and the Republic of Korea, of the other part Framework Agreement for Trade and Cooperation between the European Community and its Member States, on the one part, and the Republic of Korea, on the other part
1 July 2011
5. CARIFORUM States
Economic Partnership Agreement between the CARIFORUM States, of the one part, and the European Community and its Member States, on the other part
Signed in 2008 (not in force, but ratified by 14 EU MS)
6. Central America
EU-Central America association agreement Signed in 2012 (not in force, but ratified by majority of EU MS)

118
Non-EU country
Agreement Date of entry into force
7. Morocco Euro-Mediterranean Agreement establishing an association between the European Communities and their Member States, of the one part, and the Kingdom of Morocco, of the other part
1 March 2000
8. Jordan Euro-Mediterranean Agreement establishing an Association between the European Communities and their Member States, of the one part, and the Hashemite Kingdom of Jordan, of the other part
1 May 2002
9. Algeria Euro-Mediterranean Agreement establishing an Association between the European Communities and their Member States, of the one part, and the People’s Democratic Republic of Algeria, of the other part
1 September 2005
10. Serbia Stabilisation and Association Agreement between the European Communities and their Member States of the one part, and the Republic of Serbia, of the other part
1 September 2013
11. Albania Stabilisation and Association Agreement between the European Communities and their Member States, of the one part, and the Republic of Albania, of the other part
1 April 2009
12. Montenegro Stabilisation and Association Agreement between the European Communities and their Member States, of the one part, and the Republic of Montenegro, of the other part
1 May 2010
13. Georgia Association Agreement between the European Union and the European Atomic Energy Community and their Member States, of the one part, and Georgia, of the other part
Signed June 2014 (not yet in force)
14. Moldova Association Agreement between the European Union and the European Atomic Energy Community and their Member States of the one part, and Moldova, of the other part
Ratified by Moldova in July 2014, and by the EP in November 2014
15. Ukraine Association Agreement between the European Union and its Member States, of the one part, and Ukraine, of the other part
Signed March 2014.
Table A 3 Trade Agreements with no or limited relevance to maritime transport
Non-EU country
Agreement
Mexico Economic Partnership, Political Coordination and Cooperation Agreement between the European Community and its Member States, of the one part, and the United Mexican States, of the other part
Palestine Liberation Organization
Euro-Mediterranean Interim Association Agreement on trade and cooperation between the European Community, of the one part, and the Palestine Liberation Organization (PLO) for the benefit of the Palestinian Authority of the West Bank and the Gaza Strip, of the other part
Syria Cooperation Agreement between the European Economic Community and the Syrian Arab Republic Israel Euro-Mediterranean Agreement establishing an association between the European Communities
and their Member States, of the one part, and the State of Israel, of the other part Egypt Euro-Mediterranean Agreement establishing an Association between the European Communities
and their Member States, of the one part, and the Arab Republic of Egypt, of the other part East and South
Africa States Interim Agreements establishing a framework for an Economic Partnership Agreement between the East and South Africa States, on the one part, and the European Community and its Member States, on the other part
Tunisia Euro-Mediterranean Agreement establishing an association between the European Communities and their Member States, of the one part, and the Republic of Tunisia, of the other part
Lebanon Euro-Mediterranean Agreement establishing an Association between the European Communities and their Member States, of the one part, and the Republic of Lebanon, of the other part
Bosnia and Herzegovina
Interim Agreement on trade and trade-related matters between the European Community, of the one part, and Bosnia and Herzegovina, of the other part
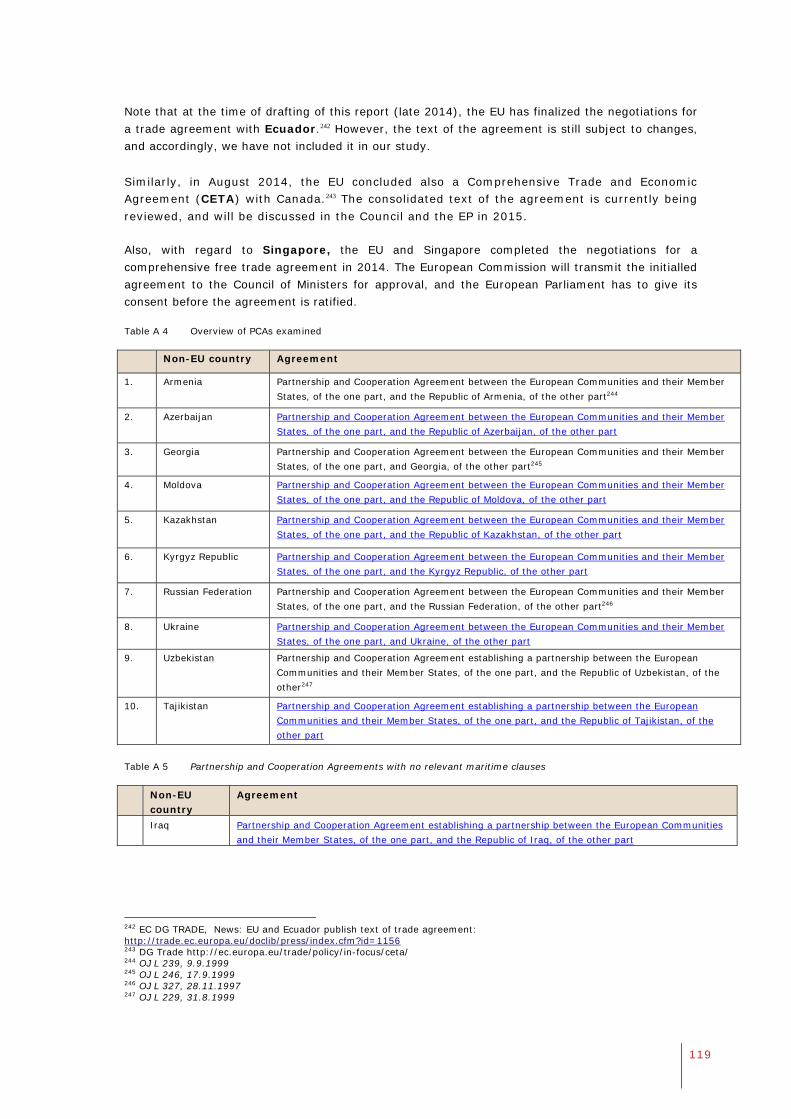
119
Note that at the time of drafting of this report (late 2014), the EU has finalized the negotiations for a trade agreement with Ecuador.242 However, the text of the agreement is still subject to changes, and accordingly, we have not included it in our study. Similarly, in August 2014, the EU concluded also a Comprehensive Trade and Economic Agreement (CETA) with Canada.243 The consolidated text of the agreement is currently being reviewed, and will be discussed in the Council and the EP in 2015. Also, with regard to Singapore, the EU and Singapore completed the negotiations for a comprehensive free trade agreement in 2014. The European Commission will transmit the initialled agreement to the Council of Ministers for approval, and the European Parliament has to give its consent before the agreement is ratified.
Table A 4 Overview of PCAs examined
Non-EU country Agreement
1. Armenia Partnership and Cooperation Agreement between the European Communities and their Member States, of the one part, and the Republic of Armenia, of the other part244
2. Azerbaijan Partnership and Cooperation Agreement between the European Communities and their Member States, of the one part, and the Republic of Azerbaijan, of the other part
3. Georgia Partnership and Cooperation Agreement between the European Communities and their Member States, of the one part, and Georgia, of the other part245
4. Moldova Partnership and Cooperation Agreement between the European Communities and their Member States, of the one part, and the Republic of Moldova, of the other part
5. Kazakhstan Partnership and Cooperation Agreement between the European Communities and their Member States, of the one part, and the Republic of Kazakhstan, of the other part
6. Kyrgyz Republic Partnership and Cooperation Agreement between the European Communities and their Member States, of the one part, and the Kyrgyz Republic, of the other part
7. Russian Federation Partnership and Cooperation Agreement between the European Communities and their Member States, of the one part, and the Russian Federation, of the other part246
8. Ukraine Partnership and Cooperation Agreement between the European Communities and their Member States, of the one part, and Ukraine, of the other part
9. Uzbekistan Partnership and Cooperation Agreement establishing a partnership between the European Communities and their Member States, of the one part, and the Republic of Uzbekistan, of the other247
10. Tajikistan Partnership and Cooperation Agreement establishing a partnership between the European Communities and their Member States, of the one part, and the Republic of Tajikistan, of the other part
Table A 5 Partnership and Cooperation Agreements with no relevant maritime clauses
Non-EU country
Agreement
Iraq Partnership and Cooperation Agreement establishing a partnership between the European Communities and their Member States, of the one part, and the Republic of Iraq, of the other part
242 EC DG TRADE, News: EU and Ecuador publish text of trade agreement: http://trade.ec.europa.eu/doclib/press/index.cfm?id=1156 243 DG Trade http://ec.europa.eu/trade/policy/in-focus/ceta/ 244 OJ L 239, 9.9.1999 245 OJ L 246, 17.9.1999 246 OJ L 327, 28.11.1997 247 OJ L 229, 31.8.1999

120
Annex III Micro/simulation – Input and Output data
The micro/simulation is based on a data collected and modified from a previous study to fit the purpose of the present study. The micro/simulations aid the calculation of the total chain costs for containerised trade including hinterland, port operations and sea transport. The micro/simulation requires the following input data: 1. Hinterland data (Inland transport)
a. Cargo data (Value of import, export, container size, and content deprecation); b. Road data (Cost per hour and per kilometre, External cost, Hinterland handling cost,
waiting time at port, handling time at port, load capacity) c. Rail data (Cost per hour and per kilometre, fixed cost, external cost, handling cost at
hinterland, waiting time at port, handling time at port, average train speed, load capacity, and dwell time at hinterland terminal);
d. Inland Water Transport (Size of inland ship, hourly loaded sailing cost, hourly empty sailing cost, hourly waiting cost, external cost, cost of handling container at hinterland, waiting time at port, handling time at port, and dwell time at hinterland terminal)
2. Terminal data (Port operations) a. Containers loading and unloading as a percentage of the terminal capacity; b. Terminal traffic (Throughput, Ship size TEUs handling capacity, Occupation rate, %
loaded and unloaded); c. Terminal resources (Quay wall equipment, Terminal equipment, operational data) d. Cost parameters (Port crew, Port dues, Tug boats, pilotage, Mooring/Unmooring,
Shifting, and Handling). 3. Ship data (Sea transport)
a. Operational data (Percentage design speed, and percentage payload) b. Running cost (Manning, Store, Insurance, Repair and Maintenance, and Management
and Administration) c. Voyage cost (Heavy Fuel Oil, Marine Diesel Oil, Ship Lub oil, and Channel) d. Capital cost (Yearly depreciation, and Interests of capital costs) e. External costs at sea
The micro/simulation based on input data generates an output table with cost calculations per TEU for each one of the three transport segments (Hinterland, Port, and Sea). The total chain cost per TEU represents the cost of transporting cargo from each one of the EU NUTS-2 regions to the destination port. The hinterland costs take the cheapest option between road, rail, or Inland Water Transport. Output cost concepts: External cost: Cost of internalising CO2, NOx, SOx, and PM10 costs Mooring cost: Cost of securing the ship to a fixed structure at the port Stores cost: Cost of deck maintenance materials and mooring ropes Tug boats cost: Cost of pushing or towing the vessels Shifting cost: Cost of shifting vessels from stream to berth or from berth to stream Lub oil cost: Cost of lubricating deck and vessel machinery Repair and maintenance cost: Cost of service of repair and maintenance, excluding stores Pilotage cost: Cost of guiding the vessel into and out of the port, and to communicate with the tug boats in the local language, Crew/Manning cost: Cost of the crew/manning at the port or at the ship

121
Port dues: Cost of dues paid to the port authority for granting access to the port Value of time: Cost incurred when the vessel stays at the port and in transit at sea Cannel cost: Cost for passing through the Suez Channel THC: Cost for terminal handling.

122
Annex IV Benchmark analysis of shipping companies
Scope of Benchmark analysis To analyse the international shipping trends a benchmark of their economic performance is performed. Four indicators are selected, constructed as a ratio between financial performances and employment levels. These are the cost of personnel per employee, the cost of personnel on sales, the sales per employee, and operating income per employee. These indicators will provide information on the differences across sectors and world regions regarding labour costs and the productivity of the sector. The approach entails the analysis of the industry through the comparative assessment of market clusters. For the purpose of this study the dimensions for the segmentation of the shipping industry are geographical and business sector-related. The first aim is to compare European shipping lines’ performance with that of companies from Asia and Worldwide. Secondly the analysis is carried out by differentiating performance per type of transport segment, namely: Container; Dry bulk; Ferries; Tanker; Miscellaneous. The cluster-approach and the following benchmark is calculated with regard to the economic performance. Approach to data collection The data collection is based on three different sources, which provide information on companies’ data from 2009 to 2013, required to perform the analysis. The PwC Global Shipping Benchmark database; The Avention database; and Targeted desk research on companies’ financial statements. The need to use information from the different sources is justified by the complexity of the industry and the large number of companies active in it. In order to provide the most comprehensive body of information, the range of companies researched was set as wide as possible. Below, a summary presentation of the rationale for the use of multiple sources is provided.

123
Figure A 1 Sources of information and rationale for their use
The extensive data collection and research activity resulted in approximately 200 companies for which financial data were available. However, information on the number of employees and on the cost of personnel was provided only by a smaller share (approximately 110 companies). These represent the panel on which the analysis presented in this section is carried out. Below, the contribution from each source is detailed. The PwC Global Benchmark database contains information on approximately 180 companies, differentiated by shipping sector. The data is, however, incomplete and focuses on financial rather than economic aspects. Compared to the set of one hundred companies for which the database holds complete financial data, information on employment levels and related indicators are only present for thirty companies. In addition to the lack of information available at the general level, economic analyses at the cluster level (either geographical or business activity-based) cannot be performed without sufficiently homogeneous and populated clusters. Therefore, in order to integrate the database additional sources were taken into consideration. This activity focused on two research streams: the integration of information
Avention® Database
Research on financial sheets
Companies: ~180
Fin. data for: ~100
PwC Global Shipping Benchmark DB
Integrations: ~300
Researches: ~50
Fill DB gaps Add companies
Eco. data for: ~30
Companies providing financial data (sales, op. income)
Companies providing data on FTEs
Companies providing data on cost of personnel
~200
~130
~110

124
for those companies included in the database, but lacking economic data for the construction of the indicators, and the inclusion of companies which were not present in the initial database at all. A desk research on financial statements was conducted to integrate information lacking from single sources. Overall, approximately 300 additional shipping companies from the Avention database were assessed. Out of this, only fifty were selected to carry out company-level research due to the low reliability of the remaining companies’ information. The analysis of international shipping trends required a thorough research of data and information. As a preliminary requirement, the activity was set to cover the different geographical areas as much as possible in order to identify shifts in transportation trends from one world region to another. Geographic clustering To consider geographical trends, shipping companies needed to be judged according to the region they belong to. This activity required a certain guiding logic to overcome obvious issues stemming from the fact that the maritime sector is by definition international. Three different approaches have been considered to geographically cluster shipping companies: Referring to the flag on companies’ fleets; Referring to the legal head office of each company; Referring to the beneficial ownership. Finally it has been opted for clustering the shipping companies according to the beneficial ownership. The reasons of this choice are explained hereafter. Several shipping companies generate revenues, jobs, and value far from their legal head office location. Thus the location of the legal offices cannot be considered as a valid definition for a company’s location. Similarly, as 73% of the world fleet is foreign flagged248, it is not proper to consider flags as a driver either. Several flags differ in the requirements about crew nationality and/or qualifications. These, along with other incentives, impact the choices made by companies to register their vessels under different flags, depending on the ship managing or crew managing firm decisions249. The debate on the international focus of shipping companies has long involved experts. When considering the legal head office of shipping companies, it cannot be neglected that the analysis of the ownership of ships and shipping companies is a complex matter that often results in a corporate web250. In these contexts, it is no surprise that for instance almost 350 shipping companies are headquartered in Luxemburg, a small land-locked country251. Similarly, the largest container shipping company of the world, the Mediterranean Shipping Company, is based in Switzerland, and provides no public information. In keeping with the purpose of this report, as well as with the historical PwC analyses on which this report partially relies, a standardised approach had to be followed to geographically define companies. Adopting the concept defined in the United Nation Review of Maritime Transport, ultimate ownership (legal based) was separated from beneficial ownership252. The geographical location was thus defined as the region mostly benefiting from
248 UNCTAD, 2014 – Review of Maritime Transport, United Nations. 249 See, among others, Wagtmann M. A. and Poulsen R. T. 2009 Recent developments and probable future scenarios concerning seafarer labour markets. 250 Interesting hints on this matter are provided by OECD Directorate For Science, Technology And Industry, 2003, Ownership and Control of Ships. 251 KPMG 2013, Luxembourg, a safe harbor for shipping companies, June 2013 252 UNCTAD, 2014 – Review of Maritime Transport, United Nations, ch.2 par.B

125
the activity of the company. Usually the choice coincided with the operational head office location. The choice is not free of biases however, as corporate structures can be complex and internationally dispersed. Some of the major shipping companies approached their business with a multi-regional focus and established different offices in different locations. It is often the example of European and Asian-based headquarters, which both refer to the same parent company – a mere financial holding firm. In these cases, the evaluation was performed on the basis of turnover volumes, employment and, where relevant, parent-company location. Complexity of corporate structures The complexity of corporate structures caused additional methodological issues. Ramified structures often resulted in incomplete, partial or misleading information. An obstacle arose in that shipping companies are not necessarily public253 and thus do not provide corporate data. When shipping companies are part of multi-sectorial holdings, however, information may be available at a consolidated level, but not for the shipping business sector. In addition, of the companies researched, a few only provided data for the branch/parent involved in leasing and management activities (while operational ones were outsources to others). Data from these companies also involved out of scale economic ratios, as i.e. sales per FTE254 could exceed €30 million per year. Each of these examples was encountered several times during the research and required additional effort to find specific information from alternative sources. Ultimately, some companies were excluded from the analysis255 as their data was not considered reliable or to be aligned with the study. Identification of business activity Companies were selected on the basis of their business activity to break down traffic-type trends and statistics. As for the geographical clustering approach, the activity-based breakdown was sometimes complex. Companies tend to differentiate their business into more shipping sectors. In several cases, companies gained more revenues from other activities than those for which they are top competitors and are widely recognised as world-leaders. In a few cases, information was found at the subsidiary level, allowing the inclusion of single database entries for each business area of activity. In other cases the business activity was identified as that which accounted for at least two-thirds of the average annual turnover. When none of these options were viable, information was included in the miscellaneous set. Sample description Economic data were collected for over 100 companies, which resulted from the integration of the initial PwC database. Most of the information is related to Container companies (24%), Dry Bulk (22%), Miscellaneous transportation (21%) and Tankers (20%). Fewer companies listed in the database have Ferry (13%) as their main business.
253 The Mediterranean Shipping Company is the most representative example, with a private parent company in Switzerland and local branches in several countries. 254 Full time equivalent employee 255 The exclusion did not necessarily involved both the financial and economic aspects of the analysis, as – i.e. for the last case presented – the financial indicators are not impacted by the misaligned number of FTEs.

126
Figure A 2 Business-related distribution of the database
Whereas information on sales and operating income is generally available, information on employees’ compensation and labour costs is not always reported by companies. Data is mostly available for European companies (approximately 50 data entries) and for Asian companies (approximately 30 data entries). Only a few North American companies provide sufficient information. The table below reports on the shipping companies considered in the sample. For each company included in the sample the table indicates the Geographic region of the beneficial ownership, the main business type and whether all or part of the fleet fly a FOC.
Company Geographical
region Business Type Open Registry
Algoma Central Corporation North America Dry bulk Yes
Atlantska Plovidba dd Europe Dry bulk Yes
Augusta Due Europe Tanker n/a
Azuma Shipping Co., Ltd. Asia Dry bulk Yes
Baltic Trading Ltd North America Dry bulk n/a
Belships ASA Europe Dry bulk Yes
Berlian Laju Tanker Tbk PT Asia Tanker Yes
Box Ships Inc Europe Container Yes
Chang Jiang Shipping Group Phoenix Co. Asia Dry bulk n/a
China COSCO Holdings Company Limited Asia Miscellaneous Yes
China Merchants Energy Shipping Co.,
Ltd
Asia Tanker Yes
China Shipping Container Lines Co Ltd Asia Container No
Cia Chilena de Navegacion InterOceanica South America Miscellaneous n/a
Cma Cgm SA Europe Container Yes
Compagnie Maritime Belge SA Europe Dry bulk No
Concordia Maritime AB Europe Tanker Yes
Costamare Inc Europe Container Yes
Daiichi Chuo Kisen Kaisha Asia Dry bulk Yes
Dalmare Europe Tanker No
d'Amico Europe Tanker No
Dampskibsselskabet NORDEN Europe Dry bulk No
Danaos Corporation Europe Container Yes
24% 22% 21%20%
13%
Container Dry bulk Miscellaneous Tanker Ferries
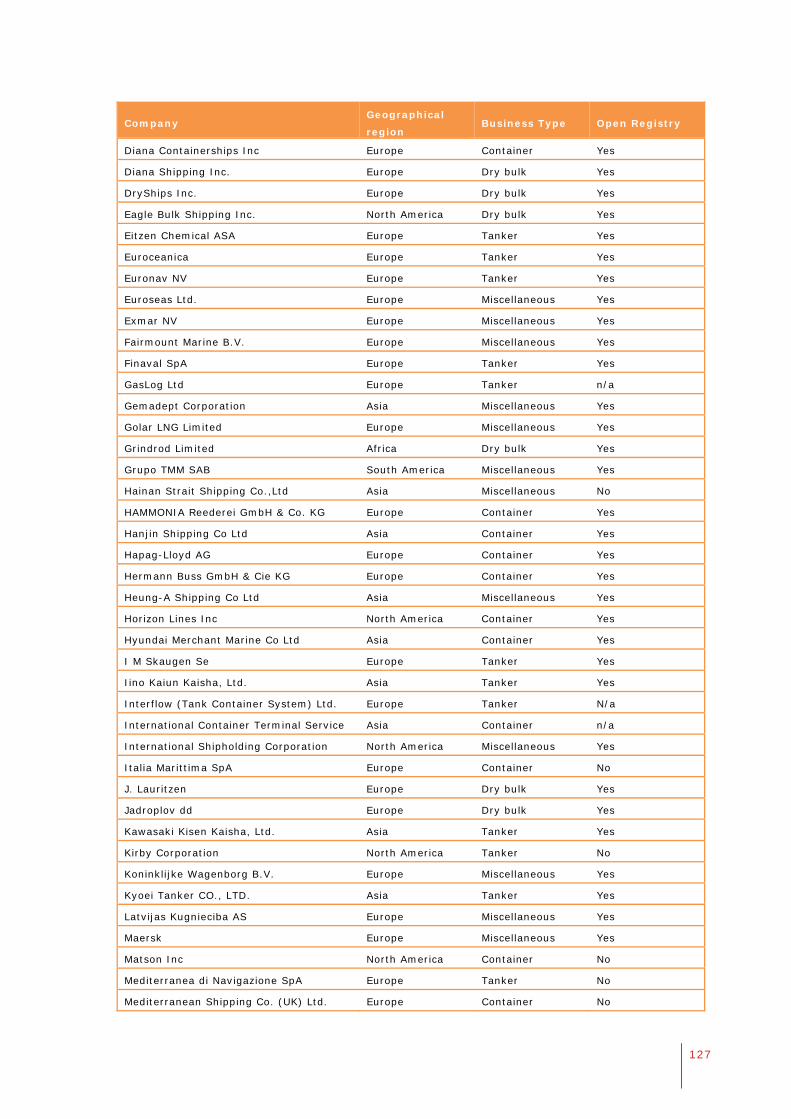
127
Company Geographical
region Business Type Open Registry
Diana Containerships Inc Europe Container Yes
Diana Shipping Inc. Europe Dry bulk Yes
DryShips Inc. Europe Dry bulk Yes
Eagle Bulk Shipping Inc. North America Dry bulk Yes
Eitzen Chemical ASA Europe Tanker Yes
Euroceanica Europe Tanker Yes
Euronav NV Europe Tanker Yes
Euroseas Ltd. Europe Miscellaneous Yes
Exmar NV Europe Miscellaneous Yes
Fairmount Marine B.V. Europe Miscellaneous Yes
Finaval SpA Europe Tanker Yes
GasLog Ltd Europe Tanker n/a
Gemadept Corporation Asia Miscellaneous Yes
Golar LNG Limited Europe Miscellaneous Yes
Grindrod Limited Africa Dry bulk Yes
Grupo TMM SAB South America Miscellaneous Yes
Hainan Strait Shipping Co.,Ltd Asia Miscellaneous No
HAMMONIA Reederei GmbH & Co. KG Europe Container Yes
Hanjin Shipping Co Ltd Asia Container Yes
Hapag-Lloyd AG Europe Container Yes
Hermann Buss GmbH & Cie KG Europe Container Yes
Heung-A Shipping Co Ltd Asia Miscellaneous Yes
Horizon Lines Inc North America Container Yes
Hyundai Merchant Marine Co Ltd Asia Container Yes
I M Skaugen Se Europe Tanker Yes
Iino Kaiun Kaisha, Ltd. Asia Tanker Yes
Interflow (Tank Container System) Ltd. Europe Tanker N/a
International Container Terminal Service Asia Container n/a
International Shipholding Corporation North America Miscellaneous Yes
Italia Marittima SpA Europe Container No
J. Lauritzen Europe Dry bulk Yes
Jadroplov dd Europe Dry bulk Yes
Kawasaki Kisen Kaisha, Ltd. Asia Tanker Yes
Kirby Corporation North America Tanker No
Koninklijke Wagenborg B.V. Europe Miscellaneous Yes
Kyoei Tanker CO., LTD. Asia Tanker Yes
Latvijas Kugnieciba AS Europe Miscellaneous Yes
Maersk Europe Miscellaneous Yes
Matson Inc North America Container No
Mediterranea di Navigazione SpA Europe Tanker No
Mediterranean Shipping Co. (UK) Ltd. Europe Container No

128
Company Geographical
region Business Type Open Registry
Mitsui OSK Lines Ltd Asia Miscellaneous Yes
Nanjing Tanker Corporation Asia Tanker No
Navigazione Montanari S.p.A. Europe Tanker No
Navios Europe Dry bulk Yes
Neptune Orient Lines Ltd. Asia Container Yes
Nile Dutch Africa Line B.V. Europe Miscellaneous Yes
Nippon Yusen Kabushiki Kaisha Asia Container Yes
NSB Niederelbe Schiffahrtsgesellschaft
mbH & Co. KG
Europe Container Yes
Odfjell SE Europe Tanker Yes
Orient Overseas (International) Limited Asia Container No
Oskar Wehr KG Europe Miscellaneous Yes
Overseas Shipholding Group, Inc. North America Tanker Yes
Pacific Basin Shipping Limited Asia Dry bulk No
Pan Ocean Co., Ltd Asia Container Yes
Paragon Shipping Inc. Europe Dry bulk Yes
Pelayaran Tempuran Emas Tbk PT Asia Container Yes
Petrolimex Joint Stock Tanker Company Asia Tanker No
Precious Shipping Public Company
Limited
Asia Dry bulk Yes
Premuda SpA Europe Miscellaneous Yes
PT Samudera Indonesia Tbk Asia Container No
Rederi AB Transatlantic Europe Miscellaneous Yes
Regional Container Lines PCL Asia Container No
Safe Bulkers, Inc. Europe Dry bulk Yes
Seaspan Corporation Asia Container Yes
Shreyas Shipping & Logistics Ltd Asia Container n/a
Sincere Navigation Corporation Asia Dry bulk Yes
Singamas Container Holdings Limited Asia Container No
Sinotrans Shipping Limited Asia Dry bulk Yes
Sloman Neptun Schiffahrts-AG Europe Miscellaneous Yes
SMIT Internationale N.V. Europe Miscellaneous Yes
Star Reefers UK Ltd. Europe Miscellaneous n/a
StealthGas Inc. Europe Miscellaneous n/a
Stolt-Nielsen S.A. Europe Tanker Yes
Teekay Corporation North America Tanker Yes
The Shipping Corporation of India Ltd. Asia Dry Bulk n/a
Thoresen Thai Agencies Public Co. Ltd. Asia Dry bulk No
Torm Europe Tanker Yes
Ultrapetrol (Bahamas) Limited North America Miscellaneous Yes
U-Ming Marine Transport Corp. Asia Dry bulk No
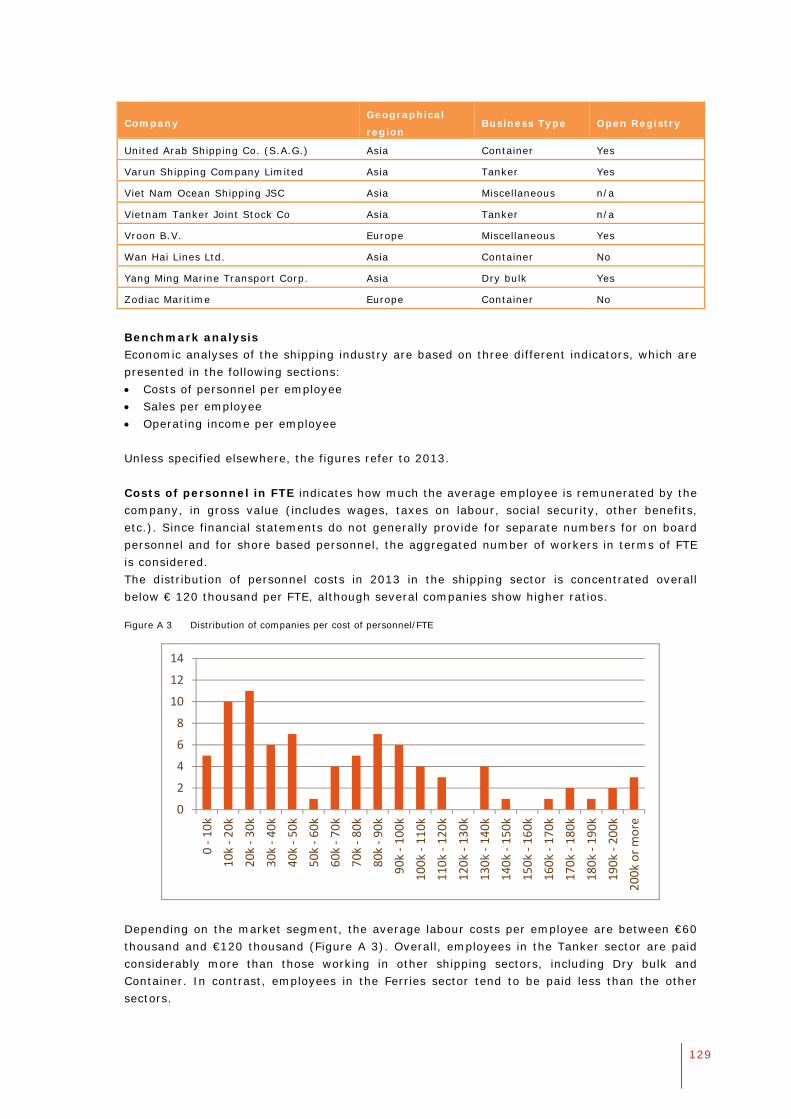
129
Company Geographical
region Business Type Open Registry
United Arab Shipping Co. (S.A.G.) Asia Container Yes
Varun Shipping Company Limited Asia Tanker Yes
Viet Nam Ocean Shipping JSC Asia Miscellaneous n/a
Vietnam Tanker Joint Stock Co Asia Tanker n/a
Vroon B.V. Europe Miscellaneous Yes
Wan Hai Lines Ltd. Asia Container No
Yang Ming Marine Transport Corp. Asia Dry bulk Yes
Zodiac Maritime Europe Container No
Benchmark analysis Economic analyses of the shipping industry are based on three different indicators, which are presented in the following sections: Costs of personnel per employee Sales per employee Operating income per employee Unless specified elsewhere, the figures refer to 2013. Costs of personnel in FTE indicates how much the average employee is remunerated by the company, in gross value (includes wages, taxes on labour, social security, other benefits, etc.). Since financial statements do not generally provide for separate numbers for on board personnel and for shore based personnel, the aggregated number of workers in terms of FTE is considered. The distribution of personnel costs in 2013 in the shipping sector is concentrated overall below € 120 thousand per FTE, although several companies show higher ratios.
Figure A 3 Distribution of companies per cost of personnel/FTE
Depending on the market segment, the average labour costs per employee are between €60 thousand and €120 thousand (Figure A 3). Overall, employees in the Tanker sector are paid considerably more than those working in other shipping sectors, including Dry bulk and Container. In contrast, employees in the Ferries sector tend to be paid less than the other sectors.
0
2
4
6
8
10
12
14
0 ‐ 10k
10k ‐ 20k
20k ‐ 30k
30k ‐ 40k
40k ‐ 50k
50k ‐ 60k
60k ‐ 70k
70k ‐ 80k
80k ‐ 90k
90k ‐ 100k
100k ‐ 110k
110k ‐ 120k
120k ‐ 130k
130k ‐ 140k
140k ‐ 150k
150k ‐ 160k
160k ‐ 170k
170k ‐ 180k
180k ‐ 190k
190k ‐ 200k
200k or more

130
Figure A 4 Sectorial breakdown on average cost of personnel/FTE per sector (€ ‘000)
From a geographical point of view, the results show that Asian companies’ employee costs are much lower than those of European companies. This result does not come as a surprise. Several studies have reported on the different labour regimes and the economic convenience coming from cheaper East Asian labour force in particular256. According to our findings, not only the wages, but also labour taxes and social security costs tend to be higher for the employees of European companies.
Figure A 5 Geographical breakdown on average cost of personnel/FTE per region
Consistent findings in this sense are obtained when measuring the impact of shipping companies’ personnel costs on their respective volumes of sales: the incidence is three times higher in Europe (9%) than in Asia (3%). Globally such a percentage is on average, halfway between the two. On the one hand, the results show that European shipping companies spend three times more on labour than their Asian counterparts257. On the other hand, it is also relevant to note that only a small part of the overall costs faced by shipping companies are related to labour. Indeed, other operative and financial costs might have a greater influence in this respect.
256 See, among others, Wagtmann M. A. and Poulsen R. T. 2009 Recent developments and probable future scenarios concerning seafarer labour markets; Kilkauer T. and Morris R. 2002 Into Murky waters: globalisation and deregulation in Germany’s shipping employee relations Employee Relations 257 Due to the limited and unbalanced information collected on other than European and Asian companies, a “rest of the world” cluster would be too unbalanced and poorly populated to provide reliable figures. Therefore it was opted to consider the “global” cluster.
€ 64 € 68€ 58
€ 72
€ 96
Container Dry bulk Ferries Miscellaneous Tanker
€96.325
€48.041
€72.121
Europe Asia Global

131
Figure A 6 Geographical breakdown on average cost of personnel as percentage of sales
It is worth noting that shipping companies using open registries”258 may avoid the strict regulations of developed countries and benefit from several advantages including the reduction of operating expenses as the labour costs involved in ship operation. Other advantages include the easy registration of maritime vessels, lower taxes, and freedom of control by the country of registry.259 Several of the companies selected for the analysis have their fleet fully or partially flying a FOC. This actually applies for the large majority of shipping companies based in the EU, Asia or other regions. The International Transport Workers’ Federation (ITF) declared FOCs for the following countries and registers: Antigua and Barbuda, Bahamas, Barbados, Belize, Bermuda (UK), Bolivia, Burma, Cambodia, Cayman Islands, Comoros, Cyprus, Equatorial Guinea, Faroe Islands (FAS), French International Ship Register (FIS), German International Ship Register (GIS), Georgia Gibraltar (UK), Honduras, Jamaica, Lebanon, Liberia, Malta, Marshall Islands (USA), Mauritius, Moldova, Mongolia, Netherlands, Antilles, North Korea, Panama, Sao Tome and Príncipe St Vincent, Sri Lanka, Tonga, Vanuatu.260 The current analysis, however, does not track those shipping companies under open registries possibly taking advantage of reduced labour costs. This is because the initial methodological choice was to identify the geographical locations on the basis of the regions benefitting most from the activity of companies. In addition, several shipping companies have vessels under different open registries, which makes any analysis based on open registries unfeasible. Sales per employee indicate how much turnover the company generates in for each full time equivalent employee (FTE). The indicator provides information on the productivity of the personnel. It is however, impacted among others, by different labour conditions and laws (i.e. across countries, sectors, etc.), the labour intensity of the shipping sector (e.g. ferries tend to require more staff, etc.), and the profitability of the sector. Sales can also vary as companies are restructured, or lease vessels, to respond to a peak in demand. The distribution of the database population in terms of sales on FTE is concentrated between € 100 and € 700 thousand. A few companies (mainly tankers) report much higher productivity rates, exceeding €2,000 per employee.
258 Enrico Argiroffo, Flags of Convenience and Substandard Vessels: A Review of the ILO’s Approach to the Problem, 110 INT’L LAB. REV. 437, 438 (1974). 259 Richard J. Payne, Flags of Convenience and Oil Pollution: A Threat to National Security, 3 HOUS. J. INT’L L. 67, 67 (1980). 260 International Transport Workers’ Federation website, accessible at: www.itfglobal.org/en/transport-sectors/seafarers/in-focus/flags-of-convenience-campaign/
9%
3%
6%
Europe Asia Global

132
Figure A 7 Distribution of shipping companies according to average ranges of sales on FTE (€ ‘000)
Ferries and Miscellaneous sectors present lowest level of productivity per employee among shipping segments. Conversely, Container and Dry Bulk demonstrate slightly higher employee productivity. The Tanker sector shows the higher value by far, with over twice the ratio than the aforementioned sectors.
Figure A 8 Sectorial breakdown on average sales/FTE per cluster (€ ‘000)
Overall, European companies are those related with higher sales/FTE ratios, followed by Asian ones. It is interesting to note that the difference in productivity ratios between European and Asian companies is small. The Global average productivity level, which also considers companies from North and South America, Africa and Oceania, is lower than for European companies, but in line with Asian companies.
Figure A 9 Geographical breakdown on average sales/FTE per region (€ ‘000)
Operating income is a measure of profitability indicating how much revenue will eventually become profit for a company. By dividing this by the number of FTEs, it provides an indication of how much income each employee generates for investors. In contrast with the sales/FTE indicator, the analysis of the operating income is less volatile to the demand, as it also considers the costs of the companies’ business activities. It thus considers how companies are managed and how efficient the employees are in transforming their activities into profits.
02468
10
121416
0k ‐ 100k
100k ‐ 200k
200k ‐ 300k
300k ‐ 400k
400k ‐ 500k
500k ‐ 600k
600k ‐ 700k
700k ‐ 800k
800k ‐ 900k
900k ‐ 1000k
1000k ‐ 1100k
1100k ‐ 1200k
1200k ‐ 1300k
1300k ‐ 1400k
1400k ‐ 1500k
1500k ‐ 1600k
1600k ‐ 1700k
1700k ‐ 1800k
1800k ‐ 1900k
1900k ‐ 2000k
2000k ‐ 2100k
2100k ‐ 2200k
2200k ‐ 2300k
2300k ‐ 2400k
2400k ‐ 2500k
2500k or more
€ 668€ 770
€ 488 € 447
€ 1.428
Container Dry bulk Ferries Miscellaneous Tanker
$863 $798 $794
Europe Asia Global

133
The distribution of operating income of FTEs shows diverging results. Several companies (i.e. 35) recorded negative results in 2013, hence their average operating income per employee was also below zero. Most companies (i.e. 54) tend to concentrate around a ratio of around € 0 and € 60 thousand. A few companies, mainly European and in the Oil and Gas sector, show very high ratios, over € 190 thousand per employee.
Figure A 10 Distribution of shipping companies per ranges of operating income on FTE
Relevant differences are found on the comparison of average operating income per employee by transport sector. In particular, while the Dry bulk sector performance is nil overall, the Container segment has the highest efficiency. The other sectors lie in between, with Ferries showing a positive but limited operating income per employee, as expected due to the high number of personnel required to perform the operative activities.
Figure A 11 Sectorial breakdown on average operating income/FTE per cluster (€ ‘000)
European companies have amongst the highest levels of average operating income per employee (€ 30.7 thousand). In contrast, Asian shipping companies’ operating income per employee is, on average, the lowest (€ 4.4 thousand). Indeed, this indicator is negatively affected by the economic performance recorded by several Asian shipping companies in 2013 (Figure A 12).
0
5
10
15
20
25
30
35
40
< 0
0 ‐ 10k
10k ‐ 20k
20k ‐ 30k
30k ‐ 40k
40k ‐ 50k
50k ‐ 60k
60k ‐ 70k
70k ‐ 80k
80k ‐ 90k
90k ‐ 100k
100k ‐ 110k
110k ‐ 120k
120k ‐ 130k
130k ‐ 140k
140k ‐ 150k
150k ‐ 160k
160k ‐ 170k
170k ‐ 180k
180k ‐ 190k
190k or more
€ 40
€ 0
€ 7
€ 26€ 23
Container Dry bulk Ferries Miscellaneous Tanker

134
Figure A 12 Geographical breakdown on average operating income/FTE per region (€ ‘000)
Europe – Asia market comparison In this section, the economic performance of European Shipping companies will be compared against the Asian ones. As reference the performance of shipping companies at global level is also provided. Unfortunately, due to lack of data, it has not been possible to compare European and Asian companies with American, African and Oceanian companies. The comparison analysis considers the following different market segments: container shipping; dry bulk shipping; miscellaneous shipping; and tanker shipping. The comparison does not consider the Ferry sector because of the lack of reliable information for Asian companies. The Asian and European shipping companies show similar trends in most market segments, supporting the hypothesis that the international shipping market is global. Container shipping As provided in the figure below, European companies in the container shipping sector tend to remunerate their employees much more than their Asian counterparts. This result was expected, as container ships in Europe tend to have a higher number of European on-board staff, which are better paid.
Figure A 13 Cost of personnel/FTE, comparison between European and Asian Container shipping companies' performance
The container shipping sector appears more performing in Europe in terms of sales per employee, than in Asia or globally. Hence, on the one hand European companies face higher labour costs per employee compared to Asian companies, but on the other hand, their employees tend to be more efficient. Indeed, both sales per employees and operating income per employees are higher in European companies than for Asian counterparts.
€ 31
€ 4
€ 21
Europe Asia Global
€‐
€20.000
€40.000
€60.000
€80.000
€100.000
€120.000
2009 2010 2011 2012 2013
Europe Container Asia Container Global Container

135
Figure A 14 Sales/FTE, comparison between European and Asian Container shipping companies' performance
Both European and Asian companies in the panel increased their operating income in 2010, which then stabilised in the following years. Interesting to note is that both the sales on employees and the operating income on employees show similar trends for the different geographical areas. The Container sector was impacted globally by the market, leaving the differences between European and Asian companies almost equal.
Figure A 15 Operating income/FTE, comparison between European and Asian Container shipping companies' performance
Dry bulk shipping Shipping companies involved in Dry bulk transport present very similar trends in Europe and Asia. The difference in costs of personnel between European and Asian dry bulk companies was much wider in 2009. Over the years, this gap has been reduced, becoming marginal in 2012, and widening again in 2013. As for other market segments, the average labour costs per employee is significantly higher for European companies than for Asian ones.
€‐
€200.000
€400.000
€600.000
€800.000
€1.000.000
2009 2010 2011 2012 2013
Europe Container Asia Container Global Container
€(20.000)
€‐
€20.000
€40.000
€60.000
€80.000
€100.000
€120.000
€140.000
2009 2010 2011 2012 2013
Europe Container Asia Container Global Container

136
Figure A 16 Cost of personnel/FTE, comparison between European and Asian Dry bulk shipping companies' performance
As opposed to the Container shipping sector, the Dry bulk sector shows that the gap between European and Asian companies in terms of sales per employee has decreased over the last five years. It has found a stable level during the last three.
Figure A 17 Sales/FTE, comparison between European and Asian Dry bulk shipping companies' performance
For both European and Asian companies, the performance in terms of Operating income per employee decreased sharply between 2010 and 2013, with the gap between the two diminishing as was the case in the sales per employee figure.
Figure A 18 Operating income/FTE, comparison between European and Asian Dry bulk shipping companies' performance
Miscellaneous shipping The miscellaneous shipping sector, which considers companies having relevant operations in more than one market segments, presents stable trends of costs of personnel on employees.
€‐
€20.000
€40.000
€60.000
€80.000
€100.000
€120.000
2009 2010 2011 2012 2013
Europe Dry Bulk Asia Dry Bulk Global Dry Bulk
€‐
€500.000
€1.000.000
€1.500.000
€2.000.000
€2.500.000
2009 2010 2011 2012 2013
Europe Dry Bulk Asia Dry Bulk Global Dry Bulk
€(100.000)
€‐
€100.000
€200.000
€300.000
€400.000
€500.000
2009 2010 2011 2012 2013
Europe Dry Bulk Asia Dry Bulk Global Dry Bulk

137
Also the gap between the higher European costs of personnel and the lower Asian costs is more or less constant over the period.
Figure A 19ost of personnel/FTE, comparison between European and Asian miscellaneous transportation shipping companies' performance
European companies typically present higher labour productivity than their Asian counterparts. However, this gap was substantially reduced in 2013 with level of sales per employee becoming almost equal for European and Asian companies.
Figure A 20 Sales/FTE, comparison between European and Asian miscellaneous shipping companies' performance
The Miscellaneous transportation sector does not show a clear operating income trend, possibly due to the differentiation of the business activities. This leads some sectors to perform better than others depending on the changes in demand for those activities.
Figure A 21 Operating income/FTE, comparison between European and Asian miscellaneous transportation shipping companies' performance
€‐
€20.000
€40.000
€60.000
€80.000
€100.000
€120.000
2009 2010 2011 2012 2013
Europe Miscellaneous Asia Miscellaneous Global Miscellaneous
€‐
€100.000
€200.000
€300.000
€400.000
€500.000
€600.000
2009 2010 2011 2012 2013
Europe Miscellaneous Asia Miscellaneous Global Miscellaneous
€(30.000)
€(20.000)
€(10.000)
€‐
€10.000
€20.000
€30.000
€40.000
€50.000
2009 2010 2011 2012 2013
Europe Miscellaneous Asia Miscellaneous Global Miscellaneous

138
Tanker shipping The comparison between costs of personnel per employee shows a closing gap between the European companies and the Asian companies. Still, in 2013, the average cost of personnel for European Tanker companies was higher than for the Asian ones.
Figure A 22 Cost of personnel/FTE, comparison between European and Asian Tanker shipping companies' performance
Tanker sector shipping companies saw a mild increase in sales per employee in the last five years, with a limited increase in the efficiency of European companies over the Asian companies from 2011.
Figure A 23 Sales/FTE, comparison between European and Asian Tanker shipping companies' performance
Although there were increases in sales per employee, the Tankers’ performance in terms of Operating income tended to decrease in European companies as well as in Asian companies, although at different speeds. This seems to be related to a certain reduction in personnel which was not however, balanced by the reduction in operating costs.
Figure A 24 Operating income/FTE, comparison between European and Asian Tanker shipping companies' performance
€‐
€20.000
€40.000
€60.000
€80.000
€100.000
€120.000
€140.000
2009 2010 2011 2012 2013
Europe Tanker Asia Tanker Global Tanker
€‐
€500.000
€1.000.000
€1.500.000
€2.000.000
€2.500.000
2009 2010 2011 2012 2013
Europe Tanker Asia Tanker Global Tanker
€(200.000)
€(150.000)
€(100.000)
€(50.000)
€‐
€50.000
€100.000
€150.000
€200.000
€250.000
2009 2010 2011 2012 2013
Europe Tanker Asia Tanker Global Tanker