Embed Size (px)
Citation preview

72 Oil and Gas Facilities • August 2014 August 2014 • Oil and Gas Facilities 73
SummarySevere slugging is a transient multiphase-flow phenomenon that can occur in pipeline-riser systems, particularly in offshore produc-tion of oil and gas. It is characterized by large pressure fluctuations at the base of the riser and is accompanied by fluctuations in fluid delivery from the top of the riser. This unstable phenomenon is un-desirable because production and equipment are affected adversely by the large pressure and flow-rate fluctuations. In this study, air-/water-flow experiments have been carried out at the S-shaped-riser facility in the multiphase-flow laboratory of the Norwegian Uni-versity of Science and Technology (NTNU) and have been com-pared with results from a flow simulator (OLGA®). The results obtained in the work show that stability maps, pressure amplitudes, and slug frequencies are in acceptable agreement with each other; however, some deviations are seen regarding the slug frequencies at low flow rates.
IntroductionThe petroleum industry has been forced to focus on development in deep seas because the demand for oil is increasing rapidly and few new fields have been discovered recently. This has led to a re-markable growth in subsea technology over the past few decades, and novel engineering solutions have been implemented to reduce costs, thereby making marginal fields economically and technically viable. One of these engineering solutions is the transportation of reservoir fluids from wells to processing units in the form of mul-tiphase flows. A broad term, “flow assurance,” is used for the large range of challenges related to safe design and operation of such multiphase-transportation systems. Some typical flow-assurance concerns are (Bai and Bai 2010)
• System deliverability: pressure drop vs. production, pipeline sizing, pressure boosting, slugging, and emulsion
• Thermal behavior: temperature distribution, temperature change because of startup and shutdown, insulation options, and heating requirements
• Solids and chemical inhibitors: hydrates, waxes, asphaltenes, and scaling
Among these flow-assurance concerns, management of slugging in system deliverability has received much interest in recent years.
Slugging can be categorized as either small-scale hydrodynamic slugging or large-scale severe slugging. Hydrodynamic slugging is an intermittent flow regime that can be observed in straight pipes at flow conditions in which the separated flows are unstable. These liquid slugs are usually short and occur at high frequency. The re-ceiving facility can, in most cases, manage hydrodynamic slugging
with little difficulty; however, severe slugging is large-scale flow instability of which long propagating liquid slugs can be a great challenge to the downstream processing units.
Severe slugging is frequently called “terrain slugging” or “riser slugging,” and it is attributed mainly to the terrain geometry, where liquid slugs can be formed at low points in a pipeline-riser system. It is characterized by large pressure fluctuations at the base of the riser and is accompanied by fluctuations in fluid delivery from the top of the riser (Schmidt et al. 1985). The basic process of severe slugging in a vertical riser has been described by a number of au-thors (Schmidt et al. 1980, 1985; Fabre et al. 1990). Schmidt et al. (1980, 1985) described a typical unstable periodic cycle of severe slugging (Fig. 1). The cycle is broken down into a slug-buildup stage, when the liquid accumulates in the lower part of the riser after a blockage in the bend at the riser base. A slug-production stage starts when the liquid reaches the top of the riser. The liquid flow is accelerated as bubbles start to penetrate through the bend, leading to a gas blowdown and a rapid emptying of the liquid in the riser. This severe slugging is a compressibility problem, in which gas trapped upstream of a blockage is compressed and subsequently provides the pressure for the accelerated blowdown. During this stage of the cycle, the maximal pressure at the bottom of the riser is close to the hydrostatic pressure of the liquid-filled riser.
This unstable phenomenon is undesirable because production and equipment are affected adversely by the large pressure and flow-rate fluctuations. The potential problems of severe slugging are (Shotbolt 1986; Montgomery and Yeung 2002)
• Periodic, unstable flow: overpressure in separators, high-level trips, and unnecessary flaring of gas, which is not acceptable environmentally.
• Increased mechanical stresses: high liquid velocities during the blowdown period; a highly fluctuating liquid inventory in the
Study on Severe Slugging in an S-Shaped Riser: Small-Scale Experiments
Compared With Simulations
Sangmin Park, Hyundai Heavy Industries, and Ole Jørgen Nydal, Norwegian University of Science and Technology
Copyright © 2014 Society of Petroleum Engineers
Original SPE manuscript received for review 6 October 2013. Revised manuscript received for review 5 June 2014. Paper (SPE 171559) peer approved 10 June 2014.
Fig. 1—Typical cycle of severe slugging (Fabre et al. 1990).
1. Slug Generation 2. Slug Production
Cycle
Time
1 2 3 4
Pre
ssur
e
3. Bubble Penetration 4. Gas Blowdown
72 Oil and Gas Facilities • August 2014 August 2014 • Oil and Gas Facilities 73
riser that induces stresses and reduces the operating life of the riser. The influence of the internal slug flow on the movements of a flexible riser can be important, and has been demonstrated computationally by a dynamic simulation with a coupled slug-flow and structural model (Ortega et al. 2012).
• Increased backpressure: increased average riser-base pressure because of severe slugging, which reduces the flow from the well. The increase in backpressure may be sufficient to kill the well.
Choking can eliminate severe slugging, but the increased back-pressure will then lower the production rates. Although gas lifting can provide stable oil and gas production, it normally requires large amounts of gas and extensive compression systems. A conservative approach to the potential operational problems is to design the re-ceiving facility (first-stage separator or slug catchers) for predicted sizes and frequencies of severe slugging. However, the space at an offshore installation is often limited, so it is, in general, most preferable to avoid unstable production at the design stage by pre-dicting the conditions that trigger severe slugging and to operate the production system in the stable regions.
The quality of flow simulators becomes important when the models are used for design purposes. Severe slugging was a strong motivation for starting the development of the dynamic multi-phase-flow simulator OLGA (Bendiksen et al. 1991), which is a 1D multiphase-flow simulator developed by the joint-research pro-gram at the Institute for Energy Technology (IFE) and SINTEF. Since the first version was commercialized in the early 1990s,
OLGA has been the most broadly used tool in the field of dynamic simulation of petroleum-transportation systems (Bendiksen et al. 1991; Mokhatab and Towler 2007). It is, therefore, of general in-terest to compare OLGA predictions with experimental data for se-vere slugging.
The work described in this paper includes severe-slugging ex-periments in an S-shaped riser and numerical simulations of the cases with OLGA. The experiments were carried out in the mul-tiphase-flow laboratory at NTNU. The stability maps indicating severe-slugging modes are generated both from experiments and from simulation. Some time series of pressure and liquid fraction are presented in each severe-slugging mode. The comparisons be-tween experiments and simulations include pressure amplitudes and slug frequencies for a range of flow rates.
Identification of Severe Slugging in an S-Shaped RiserAn S-shaped riser, used to transport reservoir fluid from the seabed to the production vessel, is a crucial component of an offshore floating-production system. Severe slugging formed in such an S-shaped riser has been identified as a flow regime of concern to op-erators because it differs from that in a catenary riser (Fig. 2).
Schmidt et al. (1985) and Taitel (1986) presented various iden-tifications of severe-slugging modes, which were mainly based on a rigid vertical riser. Tin (1991) categorized several types of se-vere-slugging modes in an S-shaped riser by use of visual observa-tions. Because the severe slugging can be quite diverse, depending also on the upstream pipe geometries (undulating, horizontal, or inclined), we have distinguished between only two types of severe slugging here:
• Severe Slugging-I (SS-I): Full blockage by liquid at the bottom bend of the first riser, with liquid penetrating some distance into the upstream flowline during the slug-generation period.
• Severe Slugging-II (SS-II): Partial blockage by liquid at the bend of the first riser, with gas passing through the bend also during the slug-generation period.
• Stable Flow: Nearly constant inlet pressure and no apparent slug buildup, which essentially means that steady hydrody-namic slug flow is in the riser. Small oscillating flow without the apparent characteristics of severe slugging is defined here as the stable flow.
The preceding list is a simple classification of severe-slugging modes, which has been used before, and seems to avoid ambi-
Fig. 2—Riser applications (Montgomery and Yeung 2002).
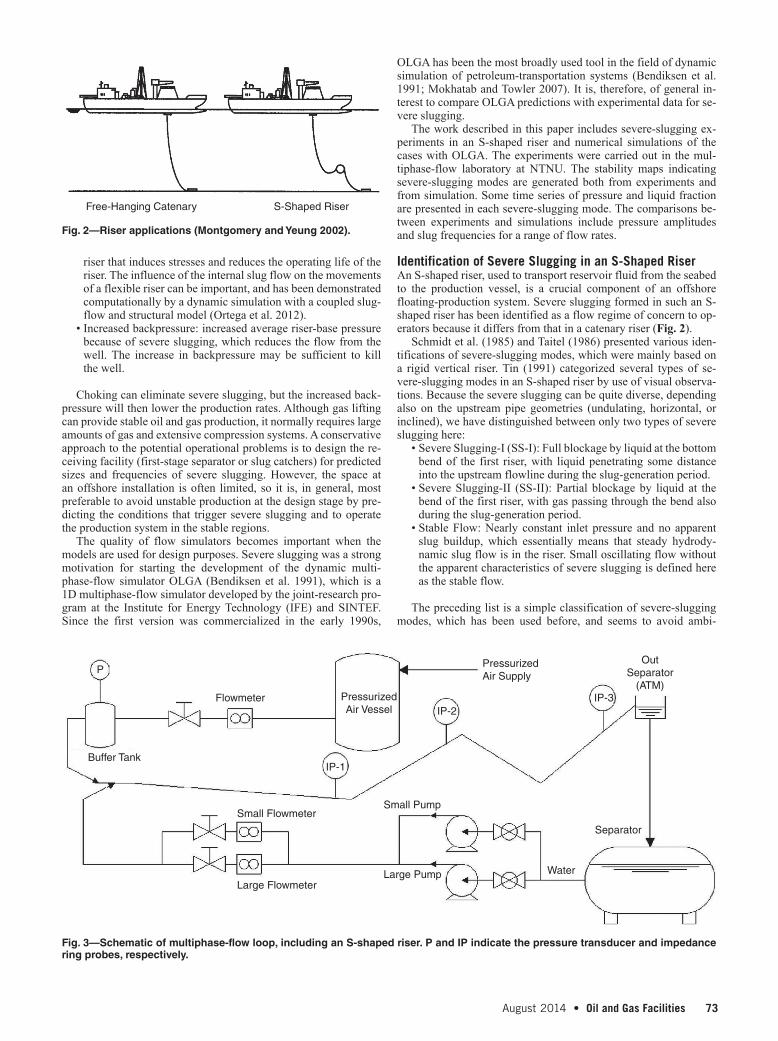
Fig. 3—Schematic of multiphase-flow loop, including an S-shaped riser. P and IP indicate the pressure transducer and impedance ring probes, respectively.
Free-Hanging Catenary S-Shaped Riser
P
IP-1
Flowmeter
Buffer Tank
Small Pump
PressurizedAir Supply
OutSeparator
(ATM)PressurizedAir Vessel
Separator
WaterLarge Pump
Small Flowmeter
Large Flowmeter
IP-2IP-3

74 Oil and Gas Facilities • August 2014 August 2014 • Oil and Gas Facilities 75
guity and definition of special transition modes that can be geom-etry dependent.
Experimental FacilityFig. 3 is a schematic of the multiphase-flow loop, including an S-shaped riser. Air is supplied from a central line of 7 bara and is reduced to approximately 4 bara by a pressure-reduction valve. Af-terward, the air pressure is further reduced by a control valve in-stalled in its feeding line that flows into the buffer tank, which is included to simulate a long upstream pipe. For storage and trans-portation of water, the flow loop has a separator and centrifugal pumps on the basement floor. The flows are controlled by valves installed in the single-phase feeding lines on the ground floor and are metered upstream of the valves by means of flowmeters (vortex, electromagnetic, and Coriolis). Air and water flow into the S-shaped riser through a mixing section. At the outlet, air is vented out to the atmosphere and the water is recycled back to the feeding line through a separator. The experiments were carried out under ambient conditions (atmospheric pressure and temperatures of ap-proximately 18–22°C). Fig. 4 shows the geometry of the S-shaped riser together with locations of the instrumentation. The flowline is 25 m in length, and the outlet separator is at a 6.68-m height. The combination of the two risers gives an effective height of 7.85 m (4.26-m height of the first riser+3.59-m height of the second riser). The flowline was made of transparent acrylic plastic with an inner diameter of 0.05 m to allow visual observation of flow regimes.
The pressure transducer installed at the top of the buffer tank mea-sures the absolute pressure at a sampling rate of 5 Hz and provides the basic pressure time traces for identifying the flow pattern. The impedance ring probes measure the holdup (water volume fraction) at their respective locations and are logged at a sampling rate of 1 Hz. Data acquisition and loop control are effected through a Lab-VIEW (National Instruments 2014) implementation. A summary of the experimental facility is given in Table 1.
An important part of this system is the air buffer tank added to the flowline. The buffer tank is installed just before the inlet
Fig. 4—Geometry of an S-shaped riser (0.05-m inner diameter).
P
0.72 m
10.22 m 3.25 m 2.24 m 2.12 m
6.68 m
3.09 m4.26 mIP-1
IP-2IP-3
High-pressureair tank
Buffer tank
Outlet(1 am)
Air source
Water source
IP-3
IP-2
IP-1
Fig. 5—Grid system for OLGA simulation (unit grid length=0.25 m, inner diameter=0.05 m).
TABLE 1—SUMMARIZATION OF EXPERIMENTAL FACILITY
Pipeline-Riser Geometry Length 25 m Height of first riser 4.26 m Height of second riser 3.09 m Inner diameter 0.05 m
Buffer-Tank Volume 0.255 m3 Pressure-Transducer (P)
Sampling Rate 5 Hz
Impedance-Ring-Probe (IP-1, IP-2, IP-3) Sampling Rate
1 Hz
Fluid Water Ambient Condition Air Ambient Condition
Range of Flow Rates Water ≈ 0.7 m/s (USL)
Air ≈ 7.0 m/s (USG)
TABLE 2—TOPOLOGY OF S-SHAPED RISER (ε = 2×10⁻⁶ m)
Pipe Length (m) Diameter (m) Inclination (degrees)
1 1.30 0.5 –70.0 2 0.50 0.05 –70.0 3 2.50 0.05 –5.0 4 6.05 0.05 –4.0 5 1.20 0.05 –1.8 6 0.50 0.05 16.0 7 0.50 0.05 50.0 8 1.00 0.05 61.8 9 0.60 0.05 20.8
10 2.05 0.05 –31.2 11 0.50 0.05 –12.0 12 0.50 0.05 24.0 13 0.70 0.05 64.0 14 1.60 0.05 77.0 15 1.20 0.05 90.0 16 1.00 0.05 0.0
74 Oil and Gas Facilities • August 2014 August 2014 • Oil and Gas Facilities 75
of the downward slope to simulate a large-volume pipe upstream. This adds compressibility to the system and facilitates severe slug-ging. The experiments described in this paper were conducted with a volume of 0.255 m3, which is almost equivalent to 130 m of pipe. The downward slope toward the base of the first riser promotes the buildup of the severe slugging by creating stratified flow.
Setup for SimulationIn the simulation of this study, OLGA v.6.3 (Schlumberger 1991) was used. The grid system of the S-shaped riser modeled is shown in Fig. 5, and the topology is given in Table 2. The buffer tank is in-cluded at the first section (PIPE-1) of the flowline with a short pipe, the volume of which is equivalent to 0.255 m3. The air inlet is mod-eled with a mass source in the first node of PIPE-1, and the water inlet is modeled with a mass source in the last node of PIPE-2, which is declined to prevent water from flowing into the buffer tank. In case reverse flow occurs at the outlet, only air is allowed to flow into the flowline. The outlet pressure is atmospheric pres-sure, and the temperatures of the air source, the water source, and the outlet are fixed to 20°C (ambient conditions). Pressure/volume/temperature data are created with PVTsimTM v.19 (Calsep 2009). Some equation-of-state (EOS) models were tried for comparison, but the results of the pressure calculation were almost the same re-
gardless of the EOS used. Finally, the Peng- Robinson (Peng and Robinson 1976) EOS was used.
OLGA requires specification of the maximum and minimum timesteps during the simulations. The timestep is set to be in the range between 0.001 and 1 second, and the default timestep control is applied (a Courant-Friedrich-Levy criterion based on the fluid velocities). The transient simulations are made until repetitions of more than 10 slugging periods are obtained, after initialization with the solution of the steady-state processor of OLGA. As a result, variations of the pressure and the holdup that vary with time are ex-tracted for post-processing at the points of air source—IP-1, IP-2, and IP-3. Visualization of the simulation results has been made with an in-house animation program.
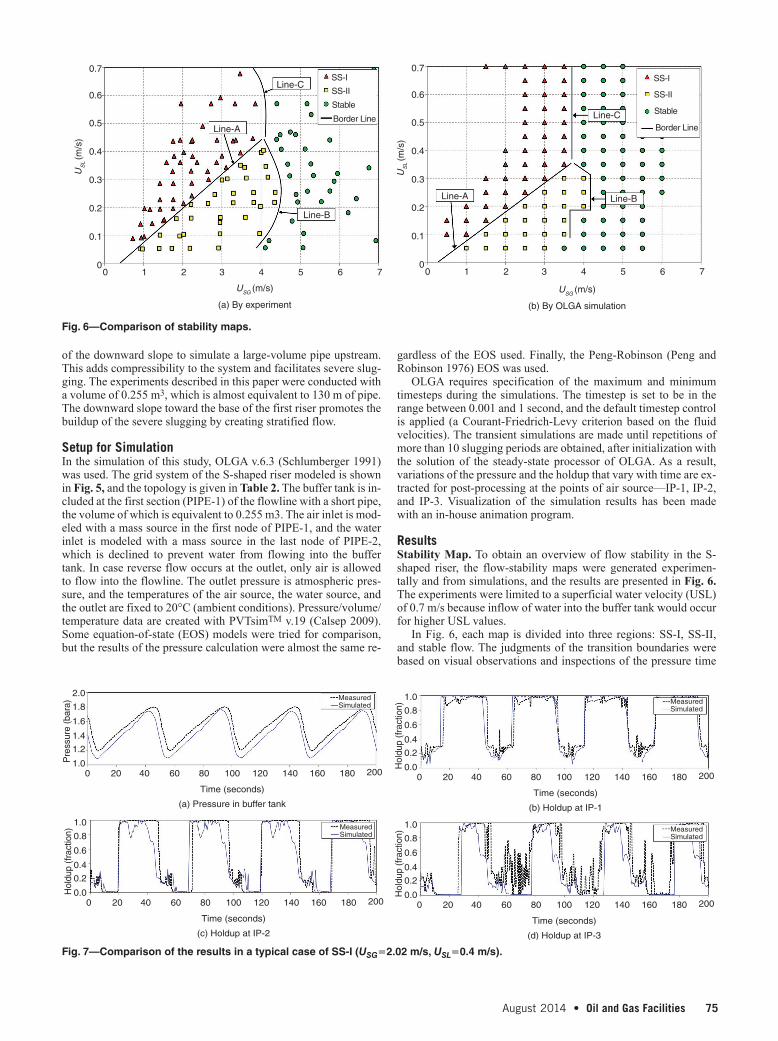
ResultsStability Map. To obtain an overview of flow stability in the S-shaped riser, the flow-stability maps were generated experimen-tally and from simulations, and the results are presented in Fig. 6. The experiments were limited to a superficial water velocity (USL) of 0.7 m/s because inflow of water into the buffer tank would occur for higher USL values.
In Fig. 6, each map is divided into three regions: SS-I, SS-II, and stable flow. The judgments of the transition boundaries were based on visual observations and inspections of the pressure time
Fig. 6—Comparison of stability maps.
0.7SS-I
SS-II
Stable
Border Line
0.6
0.5
0.4
0.3
0.2
0.1
00 1 2 3 4 5 6
Line-B
Line-B
USG (m/s)
US
L (m
/s)
Line-A
Line-A
Line-C
Line-C
7
0.7
0.6
0.5
0.4
0.3
0.2
0.1
00 1 2 3 4 5 6 7
(a) By experiment
USG (m/s)
US
L (m
/s)
(b) By OLGA simulation
SS-I
SS-II
Stable
Border Line
Fig. 7—Comparison of the results in a typical case of SS-I (USG=2.02 m/s, USL=0.4 m/s).
2.0
1.8
1.6
1.4
1.2
1.00 20 40 60 80 100
Time (seconds)
(a) Pressure in buffer tank
MeasuredSimulated
120 140 160 180 200
1.0
0.8
0.6
0.4
0.2
0.00 20 40 60 80 100
Time (seconds)
(b) Holdup at IP-1
Pre
ssur
e (b
ara)
Hol
dup
(fra
ctio
n)
Hol
dup
(fra
ctio
n)
Hol
dup
(fra
ctio
n)
MeasuredSimulated
120 140 160 180 200
1.0
0.8
0.6
0.4
0.2
0.00 20 40 60 80 100
Time (seconds)
(c) Holdup at IP-2
MeasuredSimulated
120 140 160 180 200
1.0
0.8
0.6
0.4
0.2
0.00 20 40 60 80 100
Time (seconds)
(d) Holdup at IP-3
MeasuredSimulated
120 140 160 180 200
76 Oil and Gas Facilities • August 2014 August 2014 • Oil and Gas Facilities 77
traces. The border lines between regions are, therefore, not precise because the definition of stable flow can be somewhat subjective. The first border line designated as Line-A indicates the transition from SS-I to SS-II. The second line, Line-B, corresponds to the transition from SS-II to stable flow. The third line, Line-C, repre-sents the direct transition from SS-I to stable flow.
In all cases (i.e., Line-A, Line-B, and Line-C), relatively good correspondence is observed between the flow-stability maps gen-erated from experiments and from simulations. OLGA has a ten-dency to slightly underpredict the region of the SS-II regime and to slightly overpredict the SS-I region. The SS-II, with only partial blocking at the bend, is a case in which small-scale flow effects at the bend may be important. A sensitivity analysis on the grid refine-ment or the curvature of the bend has not been made in these simu-lations. This may improve the simulation results for SS-II and the transition into stable flows. However, the operational significance of the SS-II regime is less than that of SS-I because the pressure os-cillations in SS-II are rather small.
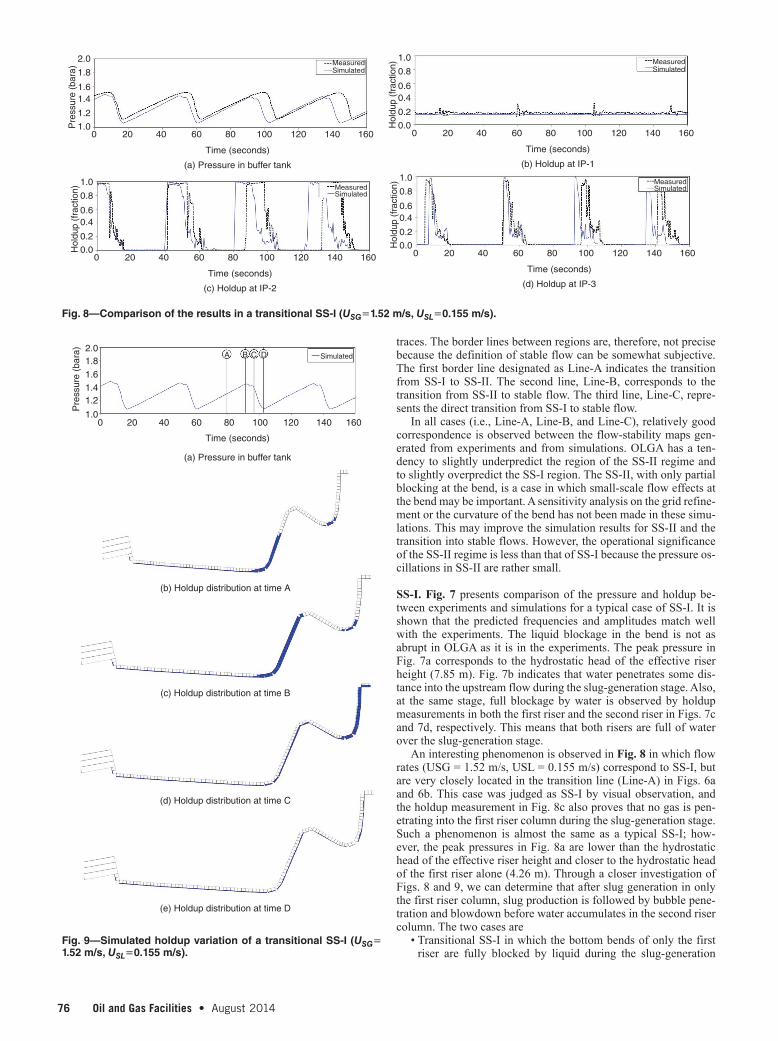
SS-I. Fig. 7 presents comparison of the pressure and holdup be-tween experiments and simulations for a typical case of SS-I. It is shown that the predicted frequencies and amplitudes match well with the experiments. The liquid blockage in the bend is not as abrupt in OLGA as it is in the experiments. The peak pressure in Fig. 7a corresponds to the hydrostatic head of the effective riser height (7.85 m). Fig. 7b indicates that water penetrates some dis-tance into the upstream flow during the slug-generation stage. Also, at the same stage, full blockage by water is observed by holdup measurements in both the first riser and the second riser in Figs. 7c and 7d, respectively. This means that both risers are full of water over the slug-generation stage.
An interesting phenomenon is observed in Fig. 8 in which flow rates (USG = 1.52 m/s, USL = 0.155 m/s) correspond to SS-I, but are very closely located in the transition line (Line-A) in Figs. 6a and 6b. This case was judged as SS-I by visual observation, and the holdup measurement in Fig. 8c also proves that no gas is pen-etrating into the first riser column during the slug-generation stage. Such a phenomenon is almost the same as a typical SS-I; how-ever, the peak pressures in Fig. 8a are lower than the hydrostatic head of the effective riser height and closer to the hydrostatic head of the first riser alone (4.26 m). Through a closer investigation of Figs. 8 and 9, we can determine that after slug generation in only the first riser column, slug production is followed by bubble pene-tration and blowdown before water accumulates in the second riser column. The two cases are
• Transitional SS-I in which the bottom bends of only the first riser are fully blocked by liquid during the slug-generation
2.01.81.61.41.2
1.00 20 40 60 80
A B C D
100
Time (seconds)
(a) Pressure in buffer tank
(b) Holdup distribution at time A
(c) Holdup distribution at time B
(d) Holdup distribution at time C
(e) Holdup distribution at time D
Simulated
120 140 160
Pre
ssur
e (b
ara)
Fig. 9—Simulated holdup variation of a transitional SS-I (USG= 1.52 m/s, USL=0.155 m/s).
Fig. 8—Comparison of the results in a transitional SS-I (USG=1.52 m/s, USL=0.155 m/s).
2.0
1.8
1.61.4
1.2
1.00 20 40 60 80 100
Time (seconds)
(a) Pressure in buffer tank
MeasuredSimulated
120 140 160
Pre
ssur
e (b
ara)
1.0
0.8
0.60.4
0.2
0.00 20 40 60 80 100
Time (seconds)
(b) Holdup at IP-1
MeasuredSimulated
120 140 160
Hol
dup
(fra
ctio
n)
1.0
0.8
0.60.4
0.2
0.00 20 40 60 80 100
Time (seconds)
(c) Holdup at IP-2
MeasuredSimulated
120 140 160
Hol
dup
(fra
ctio
n)
1.0
0.8
0.60.4
0.2
0.00 20 40 60 80 100
Time (seconds)
(d) Holdup at IP-3
MeasuredSimulated
120 140 160
Hol
dup
(fra
ctio
n)
76 Oil and Gas Facilities • August 2014 August 2014 • Oil and Gas Facilities 77
stage. The length of the liquid penetrating into the upstream flow is quite short (Fig. 9).
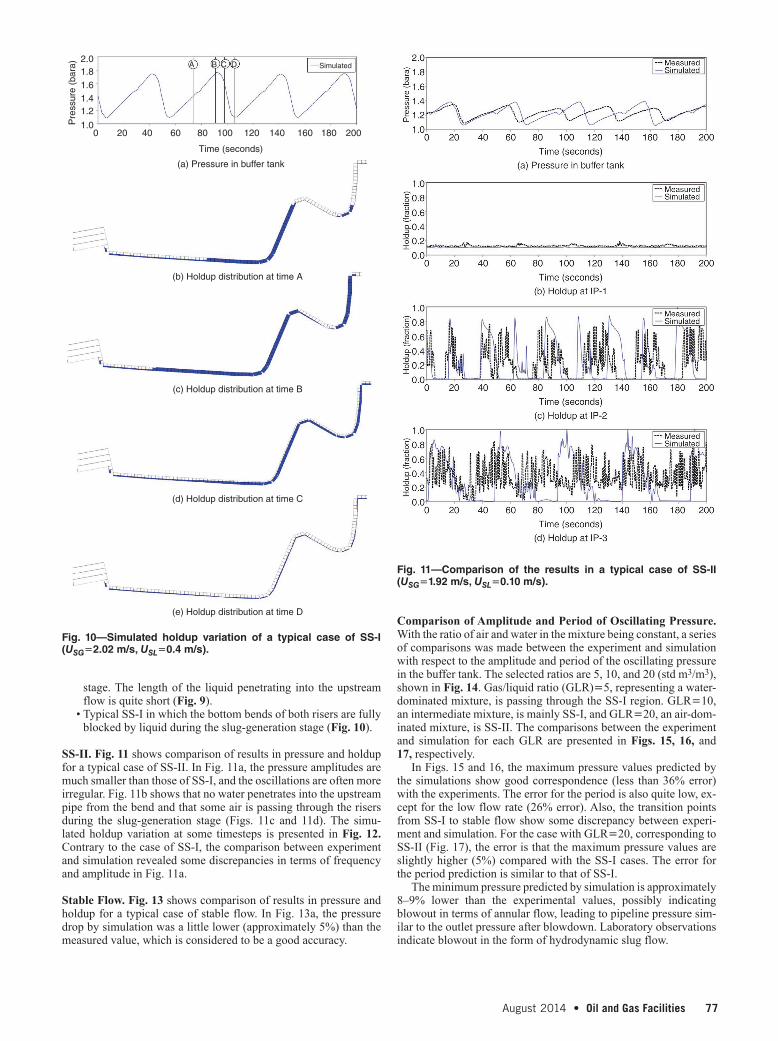
• Typical SS-I in which the bottom bends of both risers are fully blocked by liquid during the slug-generation stage (Fig. 10).
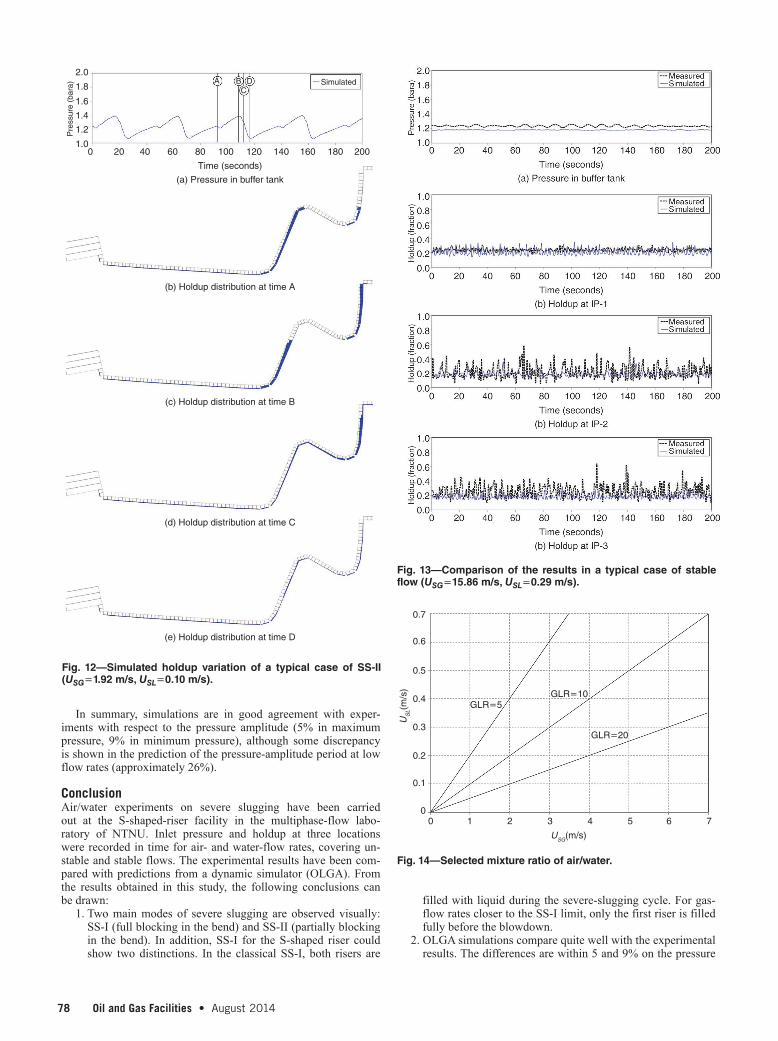
SS-II. Fig. 11 shows comparison of results in pressure and holdup for a typical case of SS-II. In Fig. 11a, the pressure amplitudes are much smaller than those of SS-I, and the oscillations are often more irregular. Fig. 11b shows that no water penetrates into the upstream pipe from the bend and that some air is passing through the risers during the slug-generation stage (Figs. 11c and 11d). The simu-lated holdup variation at some timesteps is presented in Fig. 12. Contrary to the case of SS-I, the comparison between experiment and simulation revealed some discrepancies in terms of frequency and amplitude in Fig. 11a.
Stable Flow. Fig. 13 shows comparison of results in pressure and holdup for a typical case of stable flow. In Fig. 13a, the pressure drop by simulation was a little lower (approximately 5%) than the measured value, which is considered to be a good accuracy.
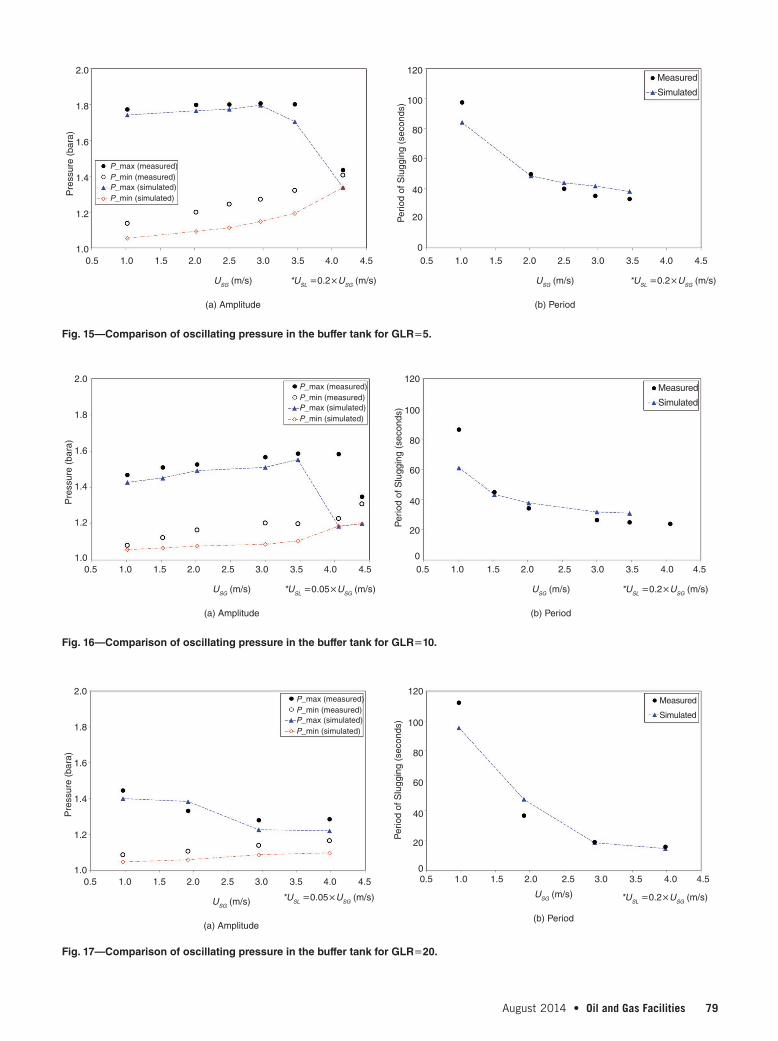
Comparison of Amplitude and Period of Oscillating Pressure. With the ratio of air and water in the mixture being constant, a series of comparisons was made between the experiment and simulation with respect to the amplitude and period of the oscillating pressure in the buffer tank. The selected ratios are 5, 10, and 20 (std m3/m3), shown in Fig. 14. Gas/liquid ratio (GLR)=5, representing a water-dominated mixture, is passing through the SS-I region. GLR=10, an intermediate mixture, is mainly SS-I, and GLR=20, an air-dom-inated mixture, is SS-II. The comparisons between the experiment and simulation for each GLR are presented in Figs. 15, 16, and 17, respectively.
In Figs. 15 and 16, the maximum pressure values predicted by the simulations show good correspondence (less than 36% error) with the experiments. The error for the period is also quite low, ex-cept for the low flow rate (26% error). Also, the transition points from SS-I to stable flow show some discrepancy between experi-ment and simulation. For the case with GLR=20, corresponding to SS-II (Fig. 17), the error is that the maximum pressure values are slightly higher (5%) compared with the SS-I cases. The error for the period prediction is similar to that of SS-I.
The minimum pressure predicted by simulation is approximately 8–9% lower than the experimental values, possibly indicating blowout in terms of annular flow, leading to pipeline pressure sim-ilar to the outlet pressure after blowdown. Laboratory observations indicate blowout in the form of hydrodynamic slug flow.
Fig. 10—Simulated holdup variation of a typical case of SS-I (USG=2.02 m/s, USL=0.4 m/s).
2.01.81.61.41.2
1.00 20 40 60 80
A B C D
100
Time (seconds)
(a) Pressure in buffer tank
(b) Holdup distribution at time A
(c) Holdup distribution at time B
(d) Holdup distribution at time C
(e) Holdup distribution at time D
Simulated
120 140 160 180 200
Pre
ssur
e (b
ara)
Fig. 11—Comparison of the results in a typical case of SS-II (USG=1.92 m/s, USL=0.10 m/s).
78 Oil and Gas Facilities • August 2014 August 2014 • Oil and Gas Facilities 79
In summary, simulations are in good agreement with exper-iments with respect to the pressure amplitude (5% in maximum pressure, 9% in minimum pressure), although some discrepancy is shown in the prediction of the pressure-amplitude period at low flow rates (approximately 26%).
Conclusion Air/water experiments on severe slugging have been carried out at the S-shaped-riser facility in the multiphase-flow labo-ratory of NTNU. Inlet pressure and holdup at three locations were recorded in time for air- and water-flow rates, covering un-stable and stable flows. The experimental results have been com-pared with predictions from a dynamic simulator (OLGA). From the results obtained in this study, the following conclusions can be drawn:
1. Two main modes of severe slugging are observed visually: SS-I (full blocking in the bend) and SS-II (partially blocking in the bend). In addition, SS-I for the S-shaped riser could show two distinctions. In the classical SS-I, both risers are
filled with liquid during the severe-slugging cycle. For gas-flow rates closer to the SS-I limit, only the first riser is filled fully before the blowdown.
2. OLGA simulations compare quite well with the experimental results. The differences are within 5 and 9% on the pressure
Fig. 13—Comparison of the results in a typical case of stable flow (USG=15.86 m/s, USL=0.29 m/s).
Fig. 14—Selected mixture ratio of air/water.
0.7
0.6
0.5
0.4GLR=5
GLR=10
USG(m/s)
US
L(m
/s)
GLR=200.3
0.2
0.1
00 1 2 3 4 5 6 7
Fig. 12—Simulated holdup variation of a typical case of SS-II (USG=1.92 m/s, USL=0.10 m/s).
2.0
1.8
1.6
1.4
1.2
1.00 20 40 60 80
A BC
D
Time (seconds)
(a) Pressure in buffer tank
(b) Holdup distribution at time A
(c) Holdup distribution at time B
(d) Holdup distribution at time C
(e) Holdup distribution at time D
Pre
ssur
e (b
ara)
100 120 140 160 180 200
Simulated
78 Oil and Gas Facilities • August 2014 August 2014 • Oil and Gas Facilities 79
Fig. 15—Comparison of oscillating pressure in the buffer tank for GLR=5.
2.0 120Measured
Simulated100
80
60
40
20
0
Pre
ssur
e (b
ara)
Per
iod
of S
lugg
ing
(sec
onds
)1.8
1.6
1.4
1.2
1.00.5 1.0 2.01.5 3.02.5
USG (m/s) USG (m/s) *USL =0.2×USG (m/s)*USL =0.2×USG (m/s)
(a) Amplitude (b) Period
4.03.5 4.5 0.5 1.0 2.01.5 3.02.5 4.03.5 4.5
P_max (measured)P_min (measured)P_max (simulated)P_min (simulated)
Fig. 16—Comparison of oscillating pressure in the buffer tank for GLR=10.
2.0 120Measured
Simulated100
80
60
40
20
0
Pre
ssur
e (b
ara)
Per
iod
of S
lugg
ing
(sec
onds
)
1.8
1.6
1.4
1.2
1.00.5 1.0 2.01.5 3.02.5
USG (m/s) USG (m/s) *USL =0.2×USG (m/s)*USL =0.05×USG (m/s)
(a) Amplitude (b) Period
4.0
P_max (measured)P_min (measured)P_max (simulated)P_min (simulated)
3.5 4.5 0.5 1.0 2.01.5 3.02.5 4.03.5 4.5
Fig. 17—Comparison of oscillating pressure in the buffer tank for GLR=20.
2.0 120Measured
Simulated100
80
60
40
20
0
Pre
ssur
e (b
ara)
Per
iod
of S
lugg
ing
(sec
onds
)
1.8
1.6
1.4
1.2
1.00.5 1.0 2.01.5 3.02.5
USG (m/s)USG (m/s) *USL =0.2×USG (m/s)*USL =0.05×USG (m/s)
(a) Amplitude(b) Period
4.0
P_max (measured)P_min (measured)P_max (simulated)P_min (simulated)
3.5 4.5 0.5 1.0 2.01.5 3.02.5 4.03.5 4.5

80 Oil and Gas Facilities • August 2014 August 2014 • Oil and Gas Facilities PB
amplitudes. The deviations on the slug periods are largest at low flow rates (26% maximum difference). OLGA overpre-dicts the SS-I region slightly in the flow-regime map.
Nomenclature USL = superficial water velocity, m/s USL = superficial water velocity, m/s ε = roughness, m
AcknowledgmentsThis work was supported by the Industrial Strategic Technology Development Program (10038605, Development of Methodology for Subsea Production System Configuration and Verification) funded by the Ministry of Trade, Industry and Energy (Korea).
ReferencesBai, Y. and Bai, Q. 2010. Subsea Engineering Handbook. Burl-
ington, Massachusetts: Gulf Professional Publishing/Elsevier.Bendiksen, K.H., Maines, D., Moe, R., et al. 1991. The Dy-
namic Two-Fluid Model OLGA: Theory and Application. SPE Prod Eng 6 (2): 171–180. SPE-19451-PA. http://dx.doi.org/10.2118/19451-PA.
Calsep. 2009. PVTSim 19. Lyngby, Denmark: Calsep International Consultants.
Fabre, J., Peresson, L., Cortevllie, J. et al. 1990. Severe Slugging in Pipeline/Riser Systems. SPE Prod Eng 5 (3): 299–305. SPE-16846-PA. http://dx.doi.org/10.2118/16846-PA.
Mokhatab, S. and Towler, B.F. 2007. Severe Slugging in Flexible Risers: Review of Experimental Investigations and OLGA Predictions. Petroleum Science and Technology 25 (7): 867–880. http://dx.doi.org/10.1080/10916460601006198.
Montgomery, J.A. and Yeung, H.C. 2002. The Stability of Fluid Production From a Flexible Riser. J. Energy Resour. Technol. 124 (2): 83–89. http://dx.doi.org/10.1115/1.1467646.
National Instruments. 2014. LabVIEW System Design Software, http://www.ni.com/labview/.
Ortega, A., Rivera, A., Nydal, O.J. et al. 2012. On the Dynamic Re-sponse of Flexible Risers Caused by Internal Slug Flow. Proc., ASME 2012 31st International Conference on Ocean, Off-shore and Arctic Engineering, Rio de Janeiro, 1–6 July, Vol. 5, 647–656. OMAE2012-83316. http://dx.doi.org/10.1115/OMAE2012-83316.
Peng, D.Y. and Robinson, D.B. 1976. A New Two-Constant Equa-tion of State. Industrial and Engineering Chemistry Fundamen-tals 15 (1): 59–64. http://dx.doi.org/10.1021/i160057a011.
Schlumberger. 1991. OLGA Dynamic Multiphase Flow Simulator v. 6.3. Houston, Texas: Schlumberger Limited.
Schmidt, Z., Brill, J.P., and Beggs, H.D. 1980. Experimental Study of Severe Slugging in a Two-Phase-Flow Pipeline-Riser Pipe System. SPE J. 20 (5): 407–414. SPE-8306-PA. http://dx.doi.org/10.2118/8306-PA.
Schmidt, Z., Doty, D.R., and Dutta-Roy, K. 1985. Severe Slugging in Offshore Pipeline Riser-Pipe Systems. SPE J. 25 (1): 27–38. SPE-12334-PA. http://dx.doi.org/10.2118/12334-PA.
Shotbolt, K. 1986. Methods for the Alleviation of Slug Flow Prob-lems and Their Influence on Field Development Planning. Pre-sented at the European Petroleum Conference, London, 20–22 October. SPE-15891-MS. http://dx.doi.org/10.2118/15891-MS.
Taitel, Y. 1986. Stability of Severe Slugging. Int. J. Multiphase Flow 12 (2): 203–217. http://dx.doi.org/10.1016/0301-9322(86)90026-1.
Tin, V., 1991. Severe Slugging in Flexible Risers. Proc., 5th BHRG International Conference on Multiphase Production, Cannes, France, 507–525.
Sangmin Park is a senior researcher and team leader in the Process Re-search Department at Hyundai Heavy Industries, Korea. He has more than 10 years of experience in onshore and offshore plant design in the oil and gas industry, with additional experience in leading floating- liquefied-natural-gas and floating-storage-regasification-unit projects. He performed joint research on subsea multiphase-flow assurance at NTNU from 2011 to 2012. Park holds a BS degree in mechanical engi-neering and an MS degree in fluid dynamics, and is currently pursuing a PhD degree in chemical plant engineering at Pohang University of Sci-ence and Tech nology, Korea.
Ole Jørgen Nydal is a professor in the Department of Energy and Pro-cess Engineering at NTNU. Previously, he worked for IFE, which he joined at the time when nuclear research engineers were shifting atten-tion to oil and gas challenges. Nydal participated in the group that de-veloped the OLGA flow simulator for multiphase oil/gas pipe transport. His work at IFE included experimental work, numerical programming, and research management. In 1998, Nydal was appointed professor at NTNU, where he established a flow laboratory and a research group on multiphase pipe flows in close collaboration with oil and gas compa-nies. His main research interest is multiphase-flow dynamics, both ex-perimental and numerical. Nydal holds an MSc degree in physics from NTNU and a PhD degree in fluid mechanics from the University of Oslo.


![[PPT]Slug · Web viewSlug flow in S-shaped risers Simulating S-riser in OLGA Extending the simplified MATLAB model for L-riser to S-riser Comparing the results from OLGA and MATLAB](https://img.dokumen.tips/doc/110x75/5aad95117f8b9a9c2e8e7f2d/pptslug-viewslug-flow-in-s-shaped-risers-simulating-s-riser-in-olga-extending.jpg)
![Predicting the gains for European wells - · PDF fileExample cycle: Slug size 0.05 t [s]] Casing top Casing bottom Avg BHP - dyn P c,max ... Liquid hold-up in pipelines, severe slugging,](https://img.dokumen.tips/doc/110x75/5a732f4f7f8b9a9d538e5efb/predicting-the-gains-for-european-wells-alrdc-a-example-cycle-slug-size.jpg)