Embed Size (px)
Citation preview

Study on Model Simulation of Meteorological Parameters
and Air Concentrations in South East Asia by using
WRF and CMAQ
Pham Van Sy1* and Keiichi Sato2
1Center for Environmental Research, Vietnam Institute of Meteorology
Hydrology and Environment, Vietnam.
*Contact address: 5/62 Nguyen Chi Thanh, Hanoi, Vietnam.
E-mail: [email protected] 2Asia Center for Air Pollution Research, Japan.
E-mail: [email protected]
Abstract
The model simulation study was performed for Southeast Asian region in which a few modeling study
has been conducted. Meteorological parameters simulated by Weather Forecast and Research Model (WRF) and
air quality data simulated by Community Multi-scale Air Quality (CMAQ) modeling system were compared by
the monitoring data in Vietnam, China and Thailand. Temperature, relative humidity and wind field were
relatively well reproduced by the model, whereas there large discrepancy from the observed rainfall data. The
air quality simulation of some air pollutants such as SO2, NOx, O3 are generally agreed with daily
concentrations. However, in some cases, there is large discrepancy, which implies that more elaboration of WRF
and CMAQ model is necessary. The model results showed concentrations of SO2 and NO2 are high in urban
area in Vietnam, China and Thailand.
1. Introduction
Many recent researches and observed data from satellite and air quality monitoring stations have
demonstrated severe air pollution in East Asia, and total emission of Asian area has been being highly greater
than that of Europe and America. Because this increasing trend is continuing, air pollution in East Asian region
will be a big problem in the future. It will have significantly negative effect on lives and health of not only
people in this region but also other continents.
The atmospheric modeling analysis is helpful to analyze the temporal and spatial variation of air
pollutants and coverall the status of air pollution in the region. There are a number of modeling study in

Northeast Asia such as MICS Asia project (Carmichael, 2007), whereas there is a few of modeling study in
Southeast Asian region (Engart and Leong, 2001) because of occasional heavy squall and equatorial convection.
In this research, simulation results of meteorological parameters obtained by Weather Research and Forecasting
(WRF) model and air concentrations (air quality) by Community Multiscale Air Quality (CMAQ) model were
compared with observation data. Then, the feasibility of model simulation was discussed based on comparison
results.
2. Model description
2.1. CMAQ modeling
The Community Multiscale Air Quality (CMAQ) model (Byun and Chere, 2006) developed by U.S.
Environmental Protection Agency is a three-dimensional eulerian atmospheric chemistry and transport modeling
system that simulates gaseous species, acid deposition, fine particulate matter, etc. in the troposphere. Designed
as a one-atmosphere model, CMAQ can address the complex couplings among several air quality issues
simultaneously across spatial scales ranging from local to hemispheric. The CMAQ source code is highly
transparent and modular to facilitate extensibility through community development.
CMAQ is a third-generation air quality model that is designed for applications ranging from regulatory
and policy analysis to understanding the complex interactions of atmospheric chemistry and physics.
First-generation air quality models simulated air quality using simple chemistry at local scales, and Gaussian
plume formulation was the basis for prediction. Second-generation models covered a broader range of scales
(local, urban, regional) and pollutants, addressing each scale with a separate model that often focused on a
single pollutant (e.g., ozone). Third-generation models, like CMAQ, treat multiple pollutants simultaneously up
to continental or larger scales, often incorporating feedback between chemical and meteorological components.
The Model-3/CMAQ system was first released to public in July 1998 and had a recent update release in October
2006.
In this research, CMAQ version used is 4.6, carbon mechanism IV (CBM-IV). The domain has the
same horizontal size as WRF (as described in I.1 section), but different in vertical size with only 6 layers
because of limited technical capability when creating emission files.
In order to make comparison between CMAQ results and observed data, the simulated data is
interpolated by 4 nearest grid points at co-ordinate which is the same location of air quality monitoring station,
and these length of distances are weighted factors. The simulated data is extracted and compared in daily,
weekly or monthly depending on data feature of observing station such as frequency, available data. The result
of pollutants simulation from CMAQ depend on much REAS emission data, therefore, this research just assess,
but not analyze deeply the reasons.
2.2. WRF model and model domain
Weather Forecast and Research Model (WRF) is developed with co-operation of many organizations
over the world such as NCAR/MMM, NOAA/NCEP, AFWA. WRF is open source code with many preeminent

features. Therefore, as its first appearance it has been received significant interest and widely applied in
professional weather forecast as well as researches in many countries. It is regularly updated with the latest
version 3.2.1, which is employed in this research.
Figure 1. Map of model domain.
WRF model was run with Mercator projection centered at 18º N and 105º E. Terrain data derived from
the US. Geological Survey (Figure 1) and global 25-category data of vegetation type and land-use data, with a
resolution of 20 second. The WRF domain fixed in the research includes 158 x 108 grid cells, with the
resolution of 30 x 30 km, extended from 0º N to 360º N and 87º E to 123º E. Horizontal resolution applied was
the same in both WRF and CMAQ, but different in vertical resolution, whereas WRF has 28 vertical layers,
CMAQ just has 6 layers in the sigma co-ordinate system, up to 500 hPa in height.
The input meteorological data used for WRF initialization are global reanalysis data with 6 hours on
average with the period from December, 2008 to December, 2009. The WRF output files were processed by
Meteorology Chemistry Interface Processor version 3.4 (MCIP 3.4) for subsequent chemical transport
simulation by CMAQ. In order to minimize initial errors, WRF model was run 10 days before the modeling
period.
2.3. Emission inventory
(a) Anthropogenic emission
Anthropogenic emission used in the research were obtained from Regional Emission Inventory in Asia
(REAS) including some species: CH4, CO, NH3, NOx, and VOC for whole Asian from December, 2008 to
December, 2009, they are annual data with 0.50º x 0.50º in resolution . They were extracted and interpolated
into decided domain for the research area, besides they were also converted to suitable format for requirement of
CMAQ model (Figure 2).
(b) Biogenic emission
Hanoi, Vietnam

Biogenic emission were obtained from Global Inventory for Chemistry-Climate Studies (GICC) for
global area from 1997 – 2005, including CO, NOx, SO2, and VOCs. They are monthly data with 10º x 10º in
resolution (Figure 3). They were calculated based on product of SPOT-vegetation satellite and ATSR. Ratio
factors were separately applied for forecast ecosystem and grassland to ensure continuous data in some periods,
and month average data were considered seasonal inventory factors in whole period.
Figure 2. Map of SO2 anthropogenic contribution in the research area interpolated from
emission inventory of Asian area in 2009.
As the same as anthropogenic emission, biogenic emission data was extracted and interpolated into
researching domain. Due to biogenic emission data is just from 1997 to 2005, whereas year simulated is 2009,
therefore it is calculated as follow: (i) Calculating increase/decrease rate of monthly biogenic emission at each
grid point in whole the period, (ii) Multiplying them with 2005 biogenic emission to make 2009 biogenic
emission.

Figure 3. Map of global biogenic emission of NOx, 10ºx10º resolution in
2005.
3. Results and discussion
3.1. Simulation of Meteorological Parameters over South-East Asia
For assessing the simulation results of meteorological parameters, the time series of their simulation
data were extracted at co-ordinate which is the same as location of weather monitoring stations employed 4
nearest grid points – interpolated method with distance lengths considered for weighted coefficients (Figure 4).
Figure 4. Map of temperature distribution in the model domain on January 1,
2009.
Tan Son Hoa, station
Lang, station

Figure 5. Comparison of modeled (blue) and observed (red) temperature in January (on the
left) and July (on the right) at Lang station (above) and Tan Son Hoa station (below).
The comparing results at two stations show that, temperature simulation showed generally good
reproduction in the research region, most time profiles comparison perform high coincidence. However, in some
points, temperature simulating value is not still high accurate, it is sometimes higher and lower than observed
data, and slight dephasing (Figure 5).
Due to just have absolute humidity from WRF output files; therefore, relative humidity is calculated
based on some other weather parameters such as absolute humidity, temperature, pressure. The conversion
formula as describing below:
7.5*
237.36.11*10T
TsE (1)
air air
air er
( * * 1)
*pwat
H M PE
H M M
(2)
*100p
s
ERH
E (3)

in which:
Es, Ep : Saturate water vapor pressure and water vapor pressure;
T : Air temperature;
H, RH : Are absolute humidity and relative humidity respectively;
Mair, Mwater : Air density and water density respectively.
Figure 6. Map of relative humidity distribution in the model domain on January 1, 2009.
Lang, station
TanSonHoa, station
Vietnam

Figure 7. Comparison of modeled (blue) and observed (red) relative humidity in January (on the
left) and July (on the right) at Lang station (above) and Tan Son Hoa station (below).
Figure 6 illustrates relative humidity distribution in the model domain on January 1, 2009, and Figure 7
shows comparison of modeled and observed relative humidity 2 stations in Vietnam. The comparison indicates
that WRF simulated relative humidity fairly well in general, the simulated and observed time profile are
concurrent. However, the same as temperature simulation, the WRF value is higher than observed data in some
period of time, especially; most simulated value is 5–15% higher than observed data at Tan Son Hoa station in
July.
Figure 8 illustrates wind field in the model domain on January 1, 2009, and Figure 9 shows comparison
of modeled and observed wind velocity at 2 stations in Vietnam. WRF did not reproduce wind field well in both
time profile and amplitude. The reasons of this discrepancy may be as follows: (i) WRF is not probably good in
simulation with such coarse resolution (30 x 30 km) because of terrain affect; (ii) The wind around weather
monitoring station is influenced by local obstacle such as: high building, trees, mountain; (iii) Sensitiveness of
wind measuring devices do not meet small reflective changes of wind in the short time.

Figure 8. Map of wind field in the model domain on July 1, 2009.
Figure 9. Comparison of modeled (blue) and observed (red) wind velocity in January (on the
left) and July (on the right) at Lang station (above) and Tan Son Hoa station (below).
Lang, station
TanSonHoa, station
Vietnam

Comparison of rainfall at two stations Lang (in the north of Vietnam) and Tan Son Hoa (in the south of
Vietnam) indicates that rainfall simulation was not so good (Figure 10, 11 and 12). At Lang station, its value is
lower than observed value, whereas rainfall simulation is much higher than measured data about 5–15 mm at
Tan Son Hoa station. However, when making comparison of rainfall on whole domain, it shows high
resemblance between WRF rainfall simulation and satellite observed data, especially in periods which heavy
rainfall occurs. These reasons can be explained as follow: (i) Humid diagram of WRF model is not able to
perform well for local humid convection at coarse resolution 30 x 30 km. (ii) Extracted simulating data which is
the same as site of weather monitoring stations was interpolated 4 nearest grid points, therefore, it perhaps get
error from the impacts of other areas.
Figure 10. Comparison of rainfall contribution in research area between modeled result (left)
and satellite observed data by NASA (right) on January 20, 2009.
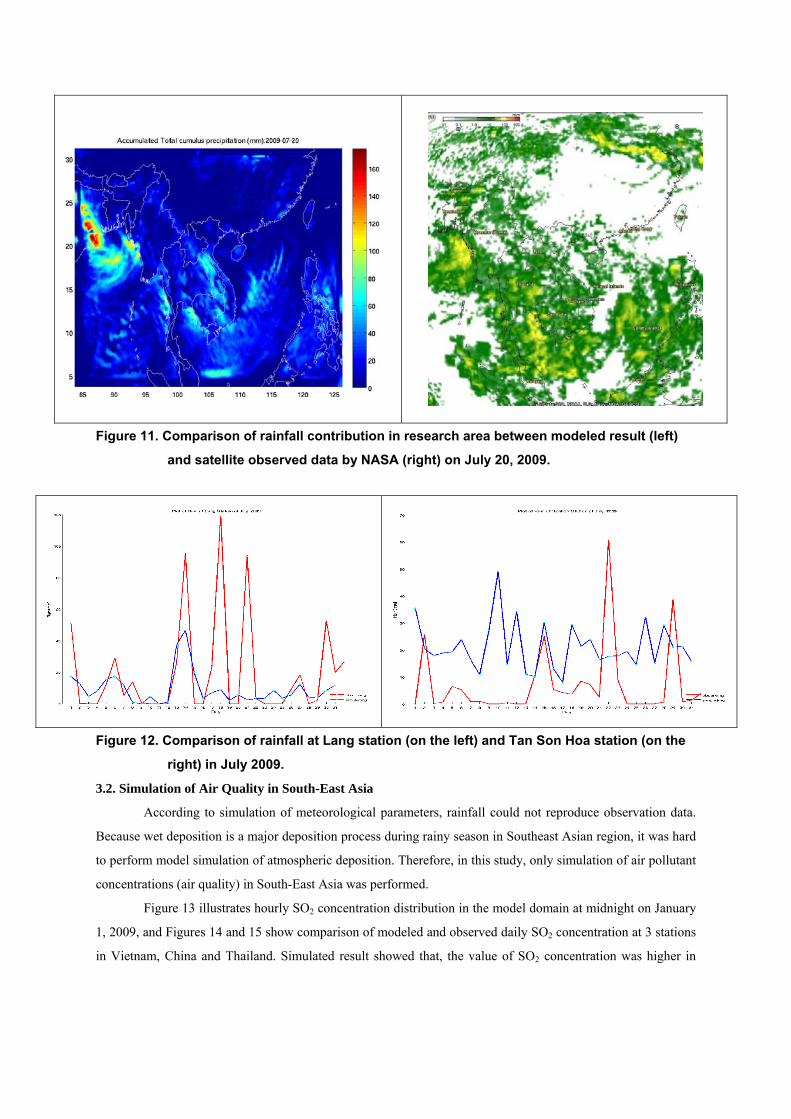
Figure 11. Comparison of rainfall contribution in research area between modeled result (left)
and satellite observed data by NASA (right) on July 20, 2009.
Figure 12. Comparison of rainfall at Lang station (on the left) and Tan Son Hoa station (on the
right) in July 2009.
3.2. Simulation of Air Quality in South-East Asia
According to simulation of meteorological parameters, rainfall could not reproduce observation data.
Because wet deposition is a major deposition process during rainy season in Southeast Asian region, it was hard
to perform model simulation of atmospheric deposition. Therefore, in this study, only simulation of air pollutant
concentrations (air quality) in South-East Asia was performed.
Figure 13 illustrates hourly SO2 concentration distribution in the model domain at midnight on January
1, 2009, and Figures 14 and 15 show comparison of modeled and observed daily SO2 concentration at 3 stations
in Vietnam, China and Thailand. Simulated result showed that, the value of SO2 concentration was higher in

some regions of south central China, fluctuating from 50 g/m3 to 170 g/m3, the highest value was showed at
Chiang Mai, Thailand up to 450 g/m3. At Lang station in Vietnam, the simulated SO2 concentration was
generally agreed with the observed data in view of both value and time profile in January and July. On the other
hand, the comparisons at Hongwen and Bangkok were not good; the simulated value is much greater than
observed data, about 20 to 60 g/m3. The reason of this discrepancy was not clear, but local variability could be
one of the reasons.
Figure 13. Distribution map of SO2 concentration in the model domain at 0h on January 1, 2009.
Figure 14. Comparison of modeled (blue) and observed (red) SO2 daily concentration in
January, 2009 at Lang station, Vietnam (on the left) and Hongwen station and China
(on the right).
Lang
Nhabe
Vietnam
Hongwen
Bangkok

Figure 15. Comparison of modeled (blue) and observed (red) SO2 daily concentration in July,
2009 at Lang station, Vietnam (on the above left) and Hongwen station, China (on
the above right) and Bangkok station, Thailand (below).

Figure 16. Distribution map of NO2 concentration in the model domain at 0h on July 1, 2009.
Figure 17. Comparison of modeled (blue) and observed (red) NO2 daily concentration at
Bangkok station, Thailand (left) in February, 2009 and Hongwen station, China
(right) in January, 2009.
Lang
Nhabe
Bangkok Vietnam
Hongwen

Figure 18. Comparison of modeled (blue) and observed (red) NO2 daily concentration at
Bangkok station, Thailand (left) and Hongwen station, China (right) in July, 2009.
Figure 16 illustrates hourly NO2 concentration distribution in the model domain at midnight on July 1,
2009, and Figures 17 and 18 show comparison of modeled and observed daily NO2 concentration at 2 stations in
China and Thailand. Simulated result showed NO2 concentration was high value at a coastal line in the South
China sea and in some large city which include considerable traffic activities. The comparison at Bangkok
station and Hongwen station indicated the relatively good performance of CMAQ model in both value and time
profile of NO2. On the other hand, there are some differences in some periods. Reproduction of local
photochemical production of NO2 should be elaborated.
Figure 19. Distribution map of NH3 concentration in the model domain at 0 h on January 1,
2009.
Hongwen
Lang
Nhabe
Bangkok Vietnam

Figure 20. Comparison of modeled (blue) and observed (red) NH3 daily concentration at Lang
station, Vietnam in January (left) and July (right), 2009.
Figure 19 illustrates hourly NH3 concentration distribution in the model domain at midnight on January
1, 2009, and Figure 20 show comparison of modeled and observed daily NH3 concentration at the Lang station
in Vietnam. The result of NH3 simulation can clearly suggest that, the NH3 concentration is high value in areas
which have high livestock and cultivate activities, especially in some regions of India, China, north and south of
Vietnam. Due to the limited observation data, the comparison was made only at the Lang station, Vietnam. It
showed that CMAQ model performed well NH3 in January, whereas in July the NH3 simulation did not well
reproduced, especially at the end of July the observed NH3 concentration showed increasing tendency,
whereas the simulated result showed decreasing trend. The reason of large discrepancy in summer may be
attributable to gas-aerosol interaction of ammonia.
Figure 21. Distribution map of O3 concentration in the model domain at 0h on January 1,
2009.
Hongwen
Lang
Nhabe
Bangkok Vietnam

Figure 22. Comparison of modeled (blue) and observed (red) O3 daily concentration at Lang
station, Vietnam in January (left) and July (right), 2009.
Figure 21 illustrates hourly O3 concentration distribution in the model domain at midnight on January 1,
2009, and Figure 22 show comparison of modeled and observed daily O3 concentration at the Lang station in
Vietnam. O3 concentration was high in most areas of China such as Shanghai and Guangzhou, whereas it
showed low value in both north and south of Vietnam, just about 50 g/m3. Due to the limited observation data,
the comparison of O3 was made at only the Lang station, Vietnam. Figure 20 clearly showed that CMAQ
reproduced well O3 concentration in January, but there is quite large discrepancy in July. The reason is probably
attributable to technical problems of O3 monitoring device. Comparison in summer should be further considered
when the observation data are available at the other site.
4. Conclusions
The research shows that, meteorological parameter obtained from the WRF model, which is used in the
CMAQ model to simulate air quality over Southeast Asia in 2009 is generally reliable. Emission data obtained
from REAS inventory is acceptable, however it need more elaboration in some specific areas. The air quality
simulation of some air pollutants such as SO2, NOx, O3 based on REAS emission inventory are generally agreed
with daily concentrations by means of comparison of observation data of these species in January and July, 2009
at some air quality monitoring stations in Vietnam, China and Thailand. However, in some cases, there is large
discrepancy. In order to perform better reproduction, elaboration of WRF and CMAQ model is necessary.
Concentrations of SO2 and NO2 are high in some regions, cities of China such as Shanghai and Guangzhou and
Bangkok, Chiang Mai in Thailand, Hanoi, and Ho Chi Minh in Vietnam. These results suggest that air quality in
large cities is important issues now and future.

5. Acknowledgements
The author wish above thank to the Network Center (NC) which sponsored as well as gave me an
opportunity to effectuate idea of researching acid deposition over South-east Asia in the EANET Research
Fellowship program in 2010. I also thank to Dr. Keiichi Sato who always supported, gave useful advices in the
research success from beginning to end. ACAP staff, too, deserve my thanks for creating the most convenient
conditions both in material and spirit for me during 4 months studied in ACAP.
6. References
Byun, D.W. and Schere, K.L. 2006. Review of the governing equations, computational algorithms, and other
components of the Model-3 Community Multi-scale Air Quality (CMAQ) modeling system. Applied
Mechanics Review. 59: 51-77.
Carmichael, G.R., Sakurai, T., Streets, D., Hozumi, Y., Ueda, H., Park, S.U., Fung, C., Han, Z., Kajino, M.,
Engardt, M., Bennet, C., Hayami, H., Sartelet, K., Holloway, T., Wang, Z., Kannari, A., Fu, J.,
Matsuda, K., Thongboonchoo, N. and Amann, M. 2007. MICS-Asia II: the model inter-comparison
study for Asia phase II methodology and overview of findings. Atmospheric Environment. 42:
3468-3490.
Engart, M. and Leong, C.P. 2001. Regional modelling of anthropogenic sulphur in Southeast Asia. Atmospheric
Environment. 34: 5935-5947.