Embed Size (px)
Citation preview

Study on Economic Partnership Projects in Developing Countries in FY2015
Study on Gas-Fired Combined Cycle Power Plant Project in
Malaysia
Final Report
February 2016
Prepared for:
The Ministry of Economy, Trade and Industry
Prepared by: Tokyo Electric Power Services Co., Ltd.

Reproduction Prohibited

Study on E
conomic P
artnership Projects in D
eveloping Countries in FY
2015 S
tudy on Gas-F
ired Com
bined Cycle P
ower P
lant Project in M
alaysia F
ebruary 2016
The M
inistry of Econom
y, Trade and Industry
Prepared by:
Tokyo E
lectric Pow
er Services C
o., Ltd.

Preface
This report summarizes the study being prepared for Study on Economic Partnership Projects in Developing
Countries in FY 2015 commissioned by the Ministry of Economy, Trade and Industry.
This Study, “Study on Gas-Fired Combined Cycle Power Plant Project in Malaysia”, was made in order to
examine the viability of the project to construct 1,000MW to 1,400MW high efficient Gas-Fired Combined Cycle
Power Plant by using natural gas which produced in Malaysia.
We hope that the report will be helpful for the realization of the project and be of reference to all the members
concerned.
February 2016
Tokyo Electric Power Services Co., Ltd.

Project Site Map
Source: prepared by the Study team based on Google Map
Kapar
Kuantan

List of Abbreviation
Abbreviation Full Name
B/C Benefit Cost Ratio
CA Credit Agricole
CCPP Combined Cycle Power Plant
CCS Carbon Dioxide Capture and Storage
CDM Clean Development Mechanism
CO2 Carbon Dioxide
DSCR Debt Service Coverage Ratio
DOE Department of Environment
EC Energy Commission
EIA Environmental Impact Assessment
EIRR Economic Internal Rate of Return
EOJ Embassy of Japan
EPC Engineering, Procurement and Construction
EPU Economic Planning Unit
FIRR Financial Internal Rate of Return
FIT Feed in Tariff
F/S Feasibility Study
FSA Fuel Supply Agreement
GDP Gross Domestic Production
GT Gas Turbine
GW Giga Watt(1GW = 1,000,000.kilo Watt)
GWh Giga Watt hour(1GWh = 1,000,000.kilo Watt hour)
IBRD International Bank for Reconstruction and Development
IDC Interest during Construction
IFC International Finance Corporation
IMF International Monetary Fund
IPP Independent Power Producer
JBIC Japan Bank for International Cooperation
JETRO Japan External Trade Organization
JICA Japan International Cooperation Agency
JPY Japanese Yen
KeTTHA Ministry of Green Technology and water
kW kilo Watt (1kW = 1,000W)
kWh kilo Watt hour (1kWh = 1,000Wh)
LHV Lower Heating Value
MAC Maximum Allowable Concentration

Abbreviation Full Name
MPa Mega Pascal
MMBTU Million British Thermal Unit
MMCFD Million Cubic Feet per Day
MW Mega Watt (1MW = 1,000,000 Watt)
MWh Mega Watt hour(1MWh = 1,000,000 Watt hour)
NEXI Nippon Export and Investment Insurance
NOx Nitrogen Oxides
NPV Net Present Value
O&M Operation and Maintenance
ODA Official Development Assistance
OECD Organization for Economic Co-operation and Development
PM Particle Matter
PPA Power Purchase Agreement
SC Super Critical
TPP Thermal Power Plant
TNB Tenaga Nasional Berhad
TSO Transmission System Operator
TWh Tera Watt hour
US¢ United State Cent
USC Ultra Super Critical
US$ United States dollar
VAT Value Added Tax

i
Table of Contents
Preface
Project Site Map
List of Abbreviations
Table of Contents
Executive Summary
(1) Background and Necessity of the Project ............................................................................................... S-1
Background of the Project ...................................................................................................................... S-1 1)
Necessity of the Project .......................................................................................................................... S-1 2)
(2) Basic Policy of Project Scope Determination ......................................................................................... S-2
Basic Policy of Project Scope Determination ......................................................................................... S-2 1)
Conceptual Design and the Specifications of Main Equipment.............................................................. S-2 2)
(3) Overview of the Project Plan .................................................................................................................. S-3
Project Scope .......................................................................................................................................... S-3 1)
Project Cost Estimation .......................................................................................................................... S-5 2)
Outline of Preliminary Financial and Economic Evaluation .................................................................. S-6 3)
Evaluation of Environmental and Social Impacts ................................................................................... S-8 4)
(4) Project Implementation Schedule ........................................................................................................... S-9
(5) Advance on the Technical Aspect of Japanese Companies .................................................................. S-10
(6) Map of the Project Area in the Country ................................................................................................ S-11
Chapter 1 Overview of the Host Country and Sector
(1) Malaysia’s Economic Condition ............................................................................................................. 1-1
Brief economic history ........................................................................................................................... 1-1 1)
Recent Macro-economic condition ......................................................................................................... 1-1 2)
Major Industries ...................................................................................................................................... 1-2 3)
Balance of Payment ................................................................................................................................ 1-4 4)
Recent Foreign Exchange Rates ............................................................................................................. 1-5 5)
Foreign Reserve and External Debt ........................................................................................................ 1-6 6)
Fiscal Condition ...................................................................................................................................... 1-7 7)
Chapter 2. Study Methodology
Description of the survey ........................................................................................................................ 2-1 (1)
Survey methods and systems .................................................................................................................. 2-3 (2)
Survey Schedule ..................................................................................................................................... 2-4 (3)

ii
Chapter 3. Justification, Objectives and Technical Feasibility of the Project
(1) Background of the Project and Its Necessity .......................................................................................... 3-1
1) Scope of the project ................................................................................................................................. 3-1
2) Present state analysis and future outlook ................................................................................................. 3-3
3) Effects of project implementation ........................................................................................................... 3-5
4) Comparison with other options ............................................................................................................... 3-6
(2) Enhancement and rationalization of energy utilization ........................................................................... 3-8
(3) Examinations required for determining the contents of the project ........................................................ 3-9
1) Demand outlook ...................................................................................................................................... 3-9
2) Analysis of the problems at examination and determination of the contents of the project .................... 3-9
3) Technical aspect...................................................................................................................................... 3-9
(4) Summary of the project ........................................................................................................................ 3-24
1) Basic policies for determining detailed contents of the project ............................................................. 3-24
2) Conceptual design and specifications of equipment subject to the design ............................................ 3-24
3) Description of proposed project ............................................................................................................ 3-95
4) Problems and solutions in the adoption of proposed technology and system........................................ 3-95
Chapter 4 Environmental and Social Consideration
(1) Confirmation of the environmental and social status of the project site ................................................. 4-1
1) Natural environment ............................................................................................................................... 4-1
2) Environmental status .............................................................................................................................. 4-6
3) Social enviroment ................................................................................................................................... 4-9
(2) Comparison and examination of the environmental impact prediction and assessment and the
alternatives ........................................................................................................................................................ 4-14
1) Air quality ............................................................................................................................................. 4-14
2) Water quality (Thermal effluent) .......................................................................................................... 4-16
3) Noise ..................................................................................................................................................... 4-18
(3) Consideration of mitigation measures (including avoidance, minimization and substitute) ................ 4-20
1) Atmosphere ........................................................................................................................................... 4-20
2) Water quality ........................................................................................................................................ 4-20
3) Transportation of materials ................................................................................................................... 4-20
4) Flora and fauna ..................................................................................................................................... 4-20
5) Waste management ............................................................................................................................... 4-21
6) Greenhouse gas (CO2)- facility operation (exhaust gas) ....................................................................... 4-21
(4) Screening for environmental aspect of candidate sites and considerations by Survey Team ............... 4-22
(5) Development of the environmental checklist (Draft) ........................................................................... 4-23
1) JICA Guidelines/ JBIC Guidelines ....................................................................................................... 4-23
2) Result of the review of the environmental and social consideration in the project .............................. 4-23
(6) Development of the monitoring plan (implementation system and method, etc) ................................. 4-41
1) Outline of the monitoring plan.............................................................................................................. 4-41

iii
2) Environmental monitoring system ........................................................................................................ 4-42
(7) Confirmation of the environmental social consideration system and organization of the host country 4-43
1) Environmental administration of Malaysia ........................................................................................... 4-43
2) Outline of the environmental laws and regulations in Malaysia ........................................................... 4-43
3) Outline of the EIA (Environmental impact assessment) of the host country required for the project
implementation and the strategy ................................................................................................................... 4-51
Chapter 5. Financial and Economic Evaluation
(1) Project Cost Estimation .......................................................................................................................... 5-1
1) Construction Cost (Engineering, Procurement and Construction: EPC) ................................................ 5-1
(2) Preliminary Financial and Economic Analysis ....................................................................................... 5-3
1) Framework of the Analysis ..................................................................................................................... 5-3
2) Preliminary Financial Evaluation ........................................................................................................... 5-4
3) Preliminary Economic Evaluation .......................................................................................................... 5-8
4) Conclusion ............................................................................................................................................ 5-12
Chapter 6 Project Implementation Schedule
Chapter 7. Implementing Organization
(1) Overview of the Implementing Agency .................................................................................................. 7-1
(2) Organization of the Recpieient Country for Project Implementation ..................................................... 7-3
Chapter 8 Technical Advantage of Japanese Company
(1) Assumed participating form from Japan(Financing、Supply of Equipment and Facilities and Operation
and Management) ............................................................................................................................................. 8-1
1) Financing ................................................................................................................................................ 8-1
2) Supply of Equipment and Facilities ........................................................................................................ 8-1
3) Operation and Management .................................................................................................................... 8-2
(2) Japanese company’s competitive advantage (Technical and Economical Point of View) ..................... 8-3
Chapter 9 Prospects of Funding for This Project
(1) Prospects of funding for this project .............................................................................................................. 9-1
1) Funding Sources and Funding Plan of the Project .................................................................................. 9-1
2) Examination of TNB funding ................................................................................................................. 9-3
3) Japanese government’s attitude to Malaysia ........................................................................................... 9-7
(2) Feasibility of Financing the Project ........................................................................................................ 9-8
1) Feasibility to obtain funding from Japan ................................................................................................. 9-8
2) TNB’s possibility of borrowing and equity participation ....................................................................... 9-8

Executive Summary


S-1
(1) Background and Necessity of the Project
Background of the Project 1)
Main power sources in Malaysia comprise thermal power generation by gas and coal fuels. In year 2012, the
ratio of gas and coal fired thermal power generation in total power generation was 45.4% and 41.5%
respectively. But the ratio of gas power generation tends to decrease because the natural gas supply and
demand in the domestic was tight in response to the cheap gas prices over the past decade.
Though nuclear power plant is developed in the medium and long-term power development plan, it's unlikely
that such development proceeds soon. It is expected that development plans of thermal power generation
which uses gas and coal as a fuel become a key plan in the future.
So far Malaysia's electricity tariff is cheaper than that of other Asian countries because the government had
issued a subsidy, and had become a cause of squeezing the financial.
In Malaysia, fuel subsidies have been abolished from December 2014 as part of the financial reform
As a result, the electricity tariff is raised by 17%, .,and it has become a concern that leads to an increase in
the production costs for the manufacturing industry, etc.
Necessity of the Project 2)
The Malaysian government has announced the 11th Malaysia Plan in May 2015 to increase the installed
capacity of 7,626MW.
On the other hand, the construction of one gas fired combined cycle power plant which is listed in that Plan
has been delayed, this project is planned in its place. Malaysia plans to enact the five-year plan according to
each development in order to operate a long-term vision plan and set the growth target of the macro economy,
and indicates the direction with respect to the relevant department. It lays an inductive role of carrying
investment decisions of the private sector. So this project which is aimed to contribute towards its completion
is very important.

S-2
(2) Basic Policy of Project Scope Determination
Basic Policy of Project Scope Determination 1)
(a) Consider the contents and technical aspects of the project
Obtain and analyze documents and other general information on Malaysia's power industry
Survey the candidate sites for the planned power plant, nearby substations, the conditions of transmission
lines and other materials as well as the characteristics of natural gas to be used as fuel, so that conceptual
design for the combined cycle power plant is conducted
Develop a rough project implementation plan based on the conceptual design above
(b) Environment and society consideration
Possible impacts on the social environment by the project: we will assess the effects on the social
environment such a the land acquisition, employment promotion, economic benefits and other impacts by the
plant construction.
Permits and licenses to be acquired in Malaysia: we will survey potential environmental impacts and related
laws and regulations as well as permits and licenses needed for the project.
(c) Financial and economic analysis
Estimation of construction costs: we will roughly estimate the construction costs based on the conceptual
design.
Feasibility: we will conduct financial and economic analysis as part of efforts to consider appropriate ways to
raise funds and sell electricity, so that we can make the new facility profitable.
Conceptual Design and the Specifications of Main Equipment 2)
Proposed power plant facilities are advanced high efficiency combined cycle power plants and there are
construction and operation experiences in Japan and other foreign countries so far.
The followings are the main equipment for this project.
Gas turbine
Heat recovery steam generator
Steam turbine
Generator
BOP (Gas compressor, water treatment facility and waste water treatment facility, etc)
Electrical and Instrumentation and Control (I&C) equipment

S-3
(3) Overview of the Project Plan
Project Scope 1)
This project is the plan for constructing a advanced high-efficiency gas turbine combined cycle power generation
facility (for 500 to 700 MW 2 units) in Kuantan and Kapar in the Malay Peninsula. The combined cycle power
generation technology that is applied in this project is the high-efficiency power plant based on the 1600C class
gas turbine (The power generation efficiency in LHV is 60%. The application of this technology that has been
established within Japan enhances the participation possibilities of the Japanese companies into this project as
well as contributes to the reduction of greenhouse gas emission such as CO2.)
The main components of the high-efficiency combined cycle power plant consists of a gas turbine generator, an
heat recovery steam generator, and turbine generator facility. The plant also includes the following facilities.
Gas turbine accessories (intake filter, lubrication oil facility, 3S clutch, etc.)
Turbine accessories (condenser, boiler feed pump, condensate pump, circulation water pump, deaerator,
condenser cleaning facility, etc.)
Generator accessories (seal oil equipment, cooling equipment, etc.)
Electric facility
Control facility
Compressed air facility
Gas compressor
Water treatment facility
Waste water treatment facility
Cooling water facility
Fire fighting facility, etc.

S-4
Table 1 shows scope of works for this project.
Table 1 Scope of Works
Item Contents
Target sites Kuanatan and Kapar
Power output and number
500 to 700 MW 2 units
Scope of implementation
Combined cycle power generation plant construction: 1 set
Civil works
Detail design of the combined cycle power plant
Production, transportation, and installation of a combined cycle power plant (gas turbine and its accessories, HRSG and its accessories, turbine and its accessories, generator and its accessories, electric facility, control facility, environment facility, compressed air facility, cooling water facility, firefighting facility, etc.)
Test operation of the power plant
Consulting service
Out of the scope of implementation
The following items are to be implemented under TNB.
Land acquisition of power plant facilities, transmission line, substation, gas pipelines associated with this project
(Source: prepared by the Study Team)

2
Project C2)
The Constru
running cost
A. P
C
G
S
T
L
B.
C. D. E. To
Note *1. C*2. In
A. P
C
G
S
T
Lrecla
B.
C. D. E. To
(SourNote *1. W
ac
*2. C
*3. In
Cost Estimati
uction (Engin
t are estimate
Comp
Construction Power Plan
Civil Work
Gas supply sy
Substation
Transmission
Land acquisiti
Sub-total
Consulting Se
ContingencyInterest durinotal
ontingency (Phnterest during co
Comp
Construction Power Plan
Civil Work
Gas supply sy
Substation
Transmission
Land acqamation*1
Sub-total
Consulting Se
Contingency Interest durinotal
rce) Study Team
While a land for analysis, its cosconstruction sitontingency (Ph
nterest during c
ion
neering, Proc
ed as the follo
Tab
ponent
Work
ystem
Line
ion
ervices
(Physical)*ng construction
hysical) is estimonstruction is e
ponent
Cost
ystem
Line
quisition
ervices
(Physical)*2 ng construction
m
a scheduled cost is estimated te in Kuantan whysical) is estim
construction is e
curement and
owing Tables.
ble 2 Total Co
Project S
To(JPY
*1 n*2
mated at a 10% oestimated based
Project
To(JPY
and
n*3
onstruction site as newly acqui
will be acquired.mated at a 10% o
estimated based
(Source: pre
S-5
d Constructio
.
ost of Project
Site: Kuantan
otal Cost Y million)
94,204.1
4,222.4
250.0
4,727.0
1,630.0
5,371.5
108,405.0
1,970.3
10,840.5737.9
121,953.7
of total construcd on funding by
Site: Kapar
otal Cost Y million)
92,204.1
16,041.0
490.0
5,289.0
123.0
4,330.7
118,477.8
1,970.3
11,847.8874.6
133,170.5
in Kapar has bired land at the. In addition, RMof total construc
d on funding by
epared by the
on: EPC) cos
t (before taxe
Foreign Currency
(JPY million
64,543
3,854
200
4,253
165
73,015
1,577
7,301737
82,632
ction costs exclJICA Yen Loan
Foreign Currency
(JPY million
64,543
14,184
392
4,760
13
83,892
1,577
8,389874
94,733
een already owe unit price (RMM130 million iction costs excl
y JICA Yen Loan
e Study Team
st, the initial
es)
n)
Local Cu(JPY m
.1 2
.4
.0
.0
.0
-
.5 3
.2
.5
.9
.1 3
luding land acqun
n)
LocCurre
(JPY m
.1 2
.0
.0
.0
.0
-
.1 3
.2
.2
.6
.1 3
wned by TNB, foM15.6/ft2) at ws estimated for luding land acqu
n
m)
l investment
urrency million)
27,661.0
368.0
50.0
474.0
1,465.0
5,371.5
35,389.5
393.1
3,539.0 -
39,321.6
quisition
cal ency
million)
27,661.0
1,857.0
98.0
529.0
110.0
4,330.7
34,585.7
393.1
3,458.6 -
38,437.4
for the purpose which the land f
land reclamatioquisition
cost and the
of the financialfor a scheduledon.
e
l d

S-6
Outline of Preliminary Financial and Economic Evaluation 3)
Preliminary Financial and Economic Evaluation is made with the following preconditions.
Table 3 Summary of the Basic Assumption
Item Assumption Power Production Annual Power Production (After Auxiliary):1229.8MW
Plant Factor:50% Annual Power Production:5,386.5GWh
Project Implementation Period
2018-2041*1
Project period 21years(2021 – 2041) Funding Sources JICA Yen Loan:about 85%
Equity:about 15% As alternative funding sources, JICA Private Sector Investment Finance and JBIC Buyers Credit are also considered
Funding Condition Interest:LIBOR+20bp*2 Repayment period: 25 years(including 7 year grace period)
Depreciation Period:21years(for Power Plant equipment) Depreciation method: Straight line method
Terminal Value*1 50% of EPC costs including power plants, civil works, gas supply system and sub-station
Interest during construction
LIBOR+20bp*3
Revenue Unit Price: 34.73sen/kWh*4 Fuel Unit Costs RM42.24/GJ(HHV)*5 Contingency (Physical) 10% Taxes and Duties Corporate Income Tax:24.%
Goods and Service Tax (GST):6% Custom Duties:0% GST on imported goods: 6%
O&M Expenses 2% of Costs of power plant Foreign Exchange Rate RM=JPY26.41*6
(Note) *1 Land acquisition and reclamation will be taken place in 2017 *2. LIBOR=0.113% (2016/1/15) is applied. *3. Terminal value is the present value of the purchase price by Off-taker at the end of the project period when the project period is extended. It is estimated at 50% of the EPC costs. *4. The Levelized Electricity Cost (LEC) at which TNB eventually concluded PPA in Prai gas fired combined cycle power project for which Energy Commission, Malaysia, conducted a public notice for tender in 2012 becomes as a benchmark tariff. Thus, the benchmark tariff is applied. *5. The fuel price which was defined in RFP for a fired gas combined cycle power project by Energy Commission, Malaysia in 2012 is applied. *6 Foreign exchange rates on January 15, 2016 are applied.
(Source: prepared by the Study Team)

S-7
The result is shown below.
Table 4 Preliminary Financial and Economic Evaluation
Evaluation Index
Evaluation
Kuantan Kapar
1 Financial Internal Rate of Return (FIRR) 3.54% 2.99%
2 Equity IRR 12.88% 10.86%
3 Economic Internal Rate of Return (EIRR) 5.63% 4.57%
Weighted Average Cost of Capital (WACC) 2.52% 2.48%
(Source: prepared by the Study Team)
(a) FIRR
The FIRR of the project is calculated based on the assumption mentioned before. The FIRRs of the project in 2
candidate sites of the project are shown in Table 4. The FIRRs of the project in both project candidate sites are
more than WACCs. Thus the project in both project sites has a financial viability.
(b) Equity IRR
While FIRR measures the financial viability of the whole project, the equity IRR represents the return which
attributes to project equity holders. Since the capital structure of the project assumes about 15% of equity
investment from TNB, the equity IRR is a return for TNB as an equity investor. The equity IRR of the project in
Kuantan and Kapar is 12.88% and 10.86%.
(c) EIRR
In utilization of the basic assumption above, the EIRR of the project was calculated as shown in Table 4. The
economic viability of the project was assessed by comparing the IRR at which the economic benefit of the
project is equal to the economic cost of the project, that is EIRR, with the cost of social capital in Malaysia, 4.5%
(yields of the 20-year government bond in February 2016).
S-8
Evaluation of Environmental and Social Impacts 4)
Outline of the environmental laws and regulations that includes EIA procdure in Malaysia is organized.
The candidate site of Kuantan Pahang is a flat area located between Federal Route 3 and the coast line.
Land acquisition of this site does not start yet. In the future, this procedure of land acquisition and compensation
will be conducted.
The candidate site adjoins Gebeng where is industrial area consisting of small and medium scale industries such
as wood processing industries, metal works factories and concrete ducting company. Moreover, there is Kuantan
port to the southeast of the candidate site
The candidate site of Kapar Selangor is almost cultivated land as current status.
The site adjoins a coal-ash disposal site for coal fired power plant (2420MW KAPAR ENERGY VENTURE
(KEV)) that is contributing 15% of the country’s energy demand in Malaysia.
The candidate site is owned by TNB. Mangrove grows in the ocean side of the candidate site.
Regarding environmental and social consideration, study team referred to “JICA GUIDELINES FOR
ENVIRONMENTAL AND SOCIAL CONSIDERATIONS” and “JBIC GUIDELINES FOR CONFIRMATION
OF ENVIRONMENTAL AND SOCIAL CONSIDERATIONS” to go through all issues. And it was proposed
monitoring plan during construction and operation phase.
As a result of this study, there are no critical concerns about two candidate sites. However, it is necessary to pay
attention to the following matters in environmental impact assessment study.
【Kuantan Pahang】
・Land Acquisition and compensation
・Impact on resort site that exists 3km north of the site(Landscape and so on)
【Kapar Selangor】
・Cumulative impact of the existing power plants (air quality, thermal effluent)
・Cutting mangrove

S-9
(4) Project Implementation Schedule
Our assuming project implementation schedule is shown in the diagram below.
Figure 1 Project Implementation Schedule
(Source: prepared by the Study Team)

S-10
(5) Advance on the Technical Aspect of Japanese Companies
Japanese manufacturers of power generation system have continuously paid effort to improve efficiency and
reliability of the system, competing with manufacturers of the US and Europe, and they also continuously
paid effort for cost reduction to win severe international bidding of power plant construction projects.
As a result, in the field of state-of-the art J class gas turbines, which are the key prime movers of the studied
combined cycle power plant project, Japanese manufacturer has competitive advantages over manufacturers
of the US and Europe from the viewpoint of its capacity, efficiency, less environmental impact and operating
experiences,
.
From operation, maintenance and management aspect of CCPP, technical knowledge and experiences of
Japanese manufacturers and Japanese utilities can contribute to assist TNB in his operation, maintenance and
management of CCPP.

S-11
(6) Map of the Project Area in the Country
Figure 2 Map of the Project Area in the Country
(Source: prepared by the Study Team based on Google Map)
Kapar
Kuantan


Chapter 1 Overview of the Host Country and Sector


1-1
(1) Malaysia’s Economic Condition
Brief economic history 1)
The Malaysia’s economic structure had been quite mono-culture where it relied on exports of raw materials such as
tin and natural rubber under UK colonial for long periods of time since 19th century. Malaysia had started to
diversify its export products into other raw materials such as crude oil, palm oil and liquefied natural gas beside
these two products. Under the administration of Prime Minister Mahathir bin Mohamad, which continued for more
than 20 years since 1981, Malaysia was successful in diversifying its economy from the dependence on exports of
raw materials to the development of manufacturing industry including electrical and electronics industries such as
IC and semiconductor, service sector and tourism with proactive uses of foreign investments. This has led the
reduction of the economy’s reliance on natural resources. The exports of industrial products currently exceeds more
than a 60% of the total exports, and the share of exports to advanced countries such as Europe is relatively high.
As a result, the Malaysian economy expanded by around 10 % annually from 1988 to 1996, driven by a high level
of investment and hearty private consumption. With experiencing massive slowdown of the economy caused by
Asian currency crisis in 1998 and the negative economic growth driven by the slowdown of the US economy
followed by the series of terrorist attacks in the U.S. in 2001 as well as the impact of economic crisis in 2008, the
economy has grown by 4-7% annually, and the per-capita GDP has exceeded more than US$ 10,000 since 2012.
Meanwhile, with its high reliance of the economy on foreign demand due to the relatively smaller size of domestic
market compared with other Asian countries, the Malaysian economy is still vulnerable to slowdown in global
economic activities. Also, with the increasing economic powers of emerging countries such as China while the
economies of advanced countries has slow-downed before and after the economic crisis in 2008, the Malaysian
economy is also easily affected by the Chinese economy as well as the economies of advanced countries since the
shares of exports to China has expanded to more than 13 % of total exports.
Under current Prime Mister NAJIB, Malaysia is attempting to achieve high-income status by raising per-capita
GDP to more than $15,000 by 2020 and to move further up the value-added production chain by attracting
investments in Islamic finance, high technology industries, biotechnology and service industries.
Recent Macro-economic condition 2)
In 2014, the Malaysian economy expanded by 6% annually, which was the highest growth rate since 7.7% growth
in 2010, driven by an export increase in the first half of 2014 and resilient private consumption supported by
favorable income and labor environment and government’s support to low-middle income households. On the
supply side, the growth was led by manufacturing, services and construction sectors. The economic growth
decelerated to 5.3% in the first half of 2015 due to weak export growth of mining sectors caused by declines in
commodities prices and slowdown in the export growth to China which is the largest export destination for
Malaysia. On the demand side, the private consumption expanded by 7.6% in the first half of 2015. The consumer
spending was underpinned by wage rises, modest growth in employment and government cash transfers, including
flood relief payments early in 2015. However, growth in the private consumption moderated after the introduction
of Goods and Services Tax (GST) in April 2015. The government maintained the growth in the consumption

1-2
expenditure at 5.5% in the first half of 2015, but the government fixed investments fell by 3.7% in part because
some projects by state-owned enterprises were completed. The private sector fixed investment grew by 7.5%. The
fixed investment overall increased by 4.0% in the first half of 2015. The exports fell by 2.2% in terms of volume in
the first half of 2015, outpacing a 0.9% decline in imports. As a result, the current account surplus was narrowed.
In the 3rd quarter of 2015, the exports has moved toward recovery, especially the exports of electrical and
electronics products, driven mainly by the weak currency. The private consumption expanded moderately due to the
continued adjustment to the introduction of GST and inflationary pressure caused by the weak currency. As a result,
the real GDP growth in the 3rd quarter in 2015 moderated to 4.7% compared with 4.9% in the previous period. The
World Bank has forecasted the economy to grow 4.7 % in 2015. In 2016, while the public and private fixed
investments are expected to increase, the private consumption growth is expected to be moderate, affected by the
slowdown in real disposal income and softer labor market. Thus, the Malaysian government lowered the economic
forecast to between 4.0% and 5.0% growth in 2016, which is below the estimation of the economic growth in 2015.
Uncertainty in the global economic conditions is a risk factor to the Malaysian economy which has high reliance on
exports.
With the relatively stable inflation rate, uncertainty about domestic and global economic environment and its
moderate economic growth, the central bank has not changed its policy interest rate since July 2014. Recent
inflation has been on a rising trend due to the transfers of impact caused by depreciation of Malaysia Ringgit (RM)
to the prices of imported products, as well as increases in fuel retail prices due to the removal of fuel subsidies in
December 2014, and the introduction of GST in April 2015. However, the impact of the introduction of GST on
inflation is estimated to be limited since the prices of goods which were subject to VAT (10% of tax rate) that
existed before the introduction of GST has been declined and many essential goods are exempted from GST.
Table 1-1 Selected Economic Indicators 2007 2008 2009 2010 2011 2012 2013 2014 2015
GDP Growth Rate (%) 6.3 4.8 -1.5 7.4 5.2 5.6 4.7 6.0 4.7 Per capita GDP($US) 7,379 8,647 7,439 8,920 10,253 10,653 10,796 11,049 10,073 Current Account(% of GDP) 15.9 17.1 15.5 10.9 11.6 5.8 4.0 3.5 2.9
CPI(%) 2.0 5.4 0.6 1.7 3.2 1.7 2.1 3.1 3.2
(Source:IMF (2015) Malaysia, Staff Report for the 2014 Article IV Consultation, IMF(2012) Malaysia, Staff Report for the 2011 Article IV Consultation)
Major Industries 3)
(a) Industrial structure
In terms of the contribution of each industrial sector to GDP, the service sector accounts for 54 % of GDP, followed
by the manufacturing sector and the agriculture sector which account for 37 % and 9% of GDP respectively in 2014.
In 2002, the service sector accounted for 49% of GDP, followed by the manufacturing sector and the agriculture
sector which accounted for 42 % and 9% of GDP respectively. Thus, the contribution of the service sector to GDP
has increased. This implies that the economic structure of Malaysia has been shifted from the reliance on plantation
and exports of natural resources to more industrialization followed by service economies. In the manufacturing
sector, beside electrical and electronic product industries, automobile industry and food industry have become main
industries. In the service sector, tourism, IT industry and Islamic finance which the government has recently
1-3
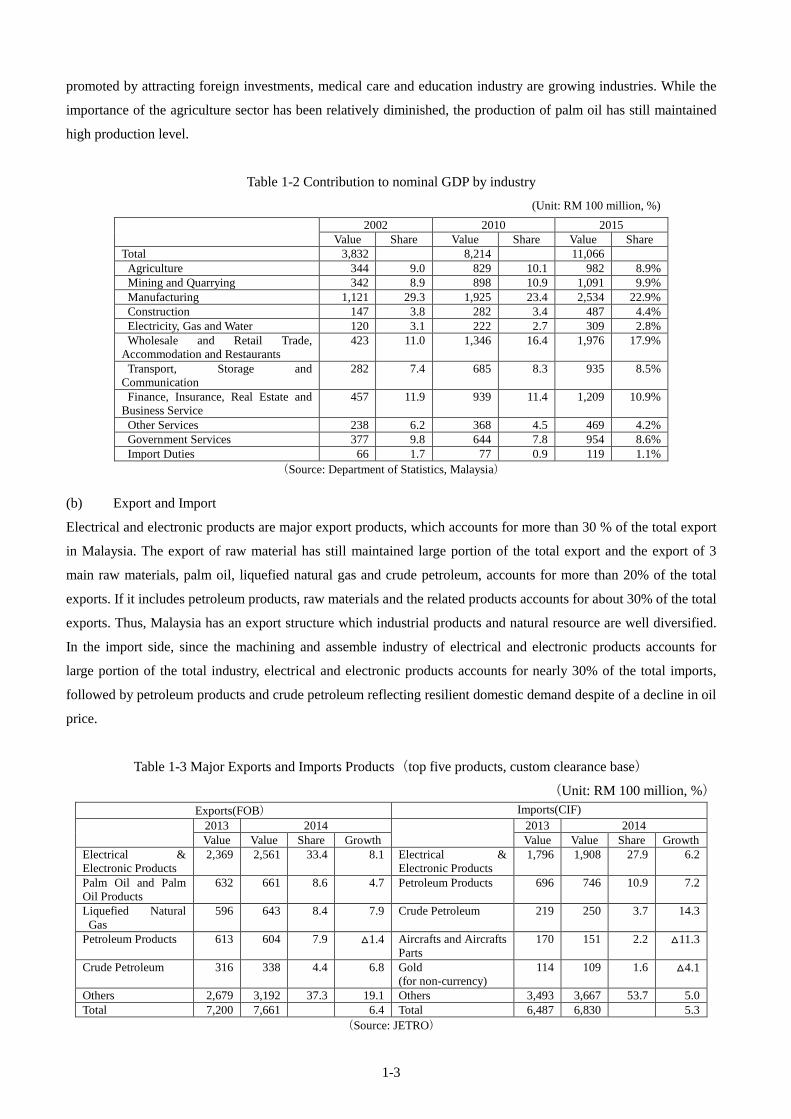
promoted by attracting foreign investments, medical care and education industry are growing industries. While the
importance of the agriculture sector has been relatively diminished, the production of palm oil has still maintained
high production level.
Table 1-2 Contribution to nominal GDP by industry
(Unit: RM 100 million, %)
2002 2010 2015 Value Share Value Share Value Share
Total 3,832 8,214 11,066 Agriculture 344 9.0 829 10.1 982 8.9% Mining and Quarrying 342 8.9 898 10.9 1,091 9.9% Manufacturing 1,121 29.3 1,925 23.4 2,534 22.9% Construction 147 3.8 282 3.4 487 4.4% Electricity, Gas and Water 120 3.1 222 2.7 309 2.8% Wholesale and Retail Trade,
Accommodation and Restaurants 423 11.0 1,346 16.4 1,976 17.9%
Transport, Storage and Communication
282 7.4 685 8.3 935 8.5%
Finance, Insurance, Real Estate and Business Service
457 11.9 939 11.4 1,209 10.9%
Other Services 238 6.2 368 4.5 469 4.2% Government Services 377 9.8 644 7.8 954 8.6% Import Duties 66 1.7 77 0.9 119 1.1%
(Source: Department of Statistics, Malaysia)
(b) Export and Import
Electrical and electronic products are major export products, which accounts for more than 30 % of the total export
in Malaysia. The export of raw material has still maintained large portion of the total export and the export of 3
main raw materials, palm oil, liquefied natural gas and crude petroleum, accounts for more than 20% of the total
exports. If it includes petroleum products, raw materials and the related products accounts for about 30% of the total
exports. Thus, Malaysia has an export structure which industrial products and natural resource are well diversified.
In the import side, since the machining and assemble industry of electrical and electronic products accounts for
large portion of the total industry, electrical and electronic products accounts for nearly 30% of the total imports,
followed by petroleum products and crude petroleum reflecting resilient domestic demand despite of a decline in oil
price.
Table 1-3 Major Exports and Imports Products(top five products, custom clearance base)
(Unit: RM 100 million, %) Exports(FOB) Imports(CIF)
2013 2014 2013 2014 Value Value Share Growth Value Value Share Growth
Electrical & Electronic Products
2,369 2,561 33.4 8.1 Electrical & Electronic Products
1,796 1,908 27.9 6.2
Palm Oil and Palm Oil Products
632 661 8.6 4.7 Petroleum Products 696 746 10.9 7.2
Liquefied Natural Gas
596 643 8.4 7.9 Crude Petroleum 219 250 3.7 14.3
Petroleum Products 613 604 7.9 △1.4 Aircrafts and Aircrafts Parts
170 151 2.2 △11.3
Crude Petroleum 316 338 4.4 6.8 Gold (for non-currency)
114 109 1.6 △4.1
Others 2,679 3,192 37.3 19.1 Others 3,493 3,667 53.7 5.0 Total 7,200 7,661 6.4 Total 6,487 6,830 5.3
(Source: JETRO)

1-4
In terms of destination of Malaysia’s export and import, in 2014, the largest export destination was Singapore,
accounting for 14.2% of the total exports, followed by China (12.1%) and Japan (10.8%). The high growth of
exports to Singapore, U.S, Hong Kong SAR, Australia, India and EU led the increase in the total exports in 2014.
Out of exports to Singapore, the exports of IC and crude petroleum increased. Exports of electrical and electronic
products such as phone devices and IC were major exports to the U.S. Exports to China recorded RM 92.3 billion
which was down by 4.8% from the previous year, first time decrease in two years due to a significant decrease in
the exports of law materials such as refined copper and petroleum oil. In terms of the import, China is the largest
import destination for Malaysia, followed by Singapore, Japan and the U.S. The imports from China and Singapore
significantly increased by 8.7% and 6.9 % respectively. Major import products from China were electronic parts
which are used as components of electrical and electronic products and construction materials. As for imports from
Singapore, increases in imports of IC and crude petroleum were particularly significant.
Table 1-4 Major Direction of Exports and Imports(custom clearance base)
(Unit: RM 100 million, %)
Exports(FOB) Imports(CIF) 2013 2014 2013 2014
Value Value Share Growth Value Value Share Growth Singapore 1,004 1,088 14.2 8.4 People’s Republic
of China 1,063 1,155 16.9 8.7
People’s Republic of China
970 923 12.1 △4.8 Singapore 802 857 12.5 6.9
Japan 792 827 10.8 6.3 Japan 564 547 8.0 △2.9 USA 581 644 8.4 11.0 USA 507 523 7.7 3.3 Thailand 399 403 5.3 0.9 Thailand 386 396 5.8 2.6 Hong Kong SAR 313 370 4.8 18.5 Korea 307 317 4.6 3.4 Australia 292 330 4.3 12.8 Indonesia 279 277 4.1 △0.8 India 257 319 4.2 23.9 Australia 165 202 3.0 22.7 EU28 653 728 9.5 11.6 EU28 703 711 10.4 1.1 Total 7,200 7,661 6.4 Total 6,487 6,830 5.3
(Source:JETRO)
Balance of Payment 4)
(a) Current Account
The current account in Malaysia had been balanced or small deficits in 1990’s until Asian economic crisis in
1998-99. However, the increased price competitiveness on global export markets due to the currency depreciation
by more than 50% from 1996 to 1998 has led the current account surplus since 1998. However, the surplus has
shrunk after it recorded 17.1% of GDP before the Lehman shock in 2008, and the surplus in 2015 is estimated at
2.9% of GDP. This leads lower buffer against unstable capital outflows. The main factor of this large reduction of
the current account surplus is structural changes in the Malaysian economy, such as the expansion of domestic
demands including domestic consumption and corresponding increases in domestic investments. However, the
reduction in the current account surplus in recent years was mainly caused by slowdown in the exports of mineral
fuels reflecting lower crude oil price as well as flagging exports to China which is the largest trade partner reflecting
sluggish economic growth of the Chinese economy.

1-5
Table 1-5 Balance of Payment
(Unit: $US billion) 2007 2008 2009 2010 2011 2012 2013 2014 2015
Trade Balance 37.8 51.5 39.9 42.4 49.5 40.5 34.3 35.5 33.1 Imports 176.3 199.2 157.0 199.0 228.6 222.1 215.5 226.3 228.6 Exports 138.5 147.7 117.1 156.6 179.1 181.6 181.2 190.8 195.5
Current Account Balance 29.8 39.4 31.4 27.1 33.5 17.6 12.3 11.7 10.4 Financial Account Balance -11.3 -35.6 -22.8 -6.2 7.6 -7.5 -5.0 -30.5 -2.7 Overall Balance 13.2 -5.5 3.9 -0.8 30.9 1.3 4.6 -18.8 7.7 Capital Account Balance (% of GDP) 15.9 17.1 15.5 10.9 11.6 5.8 4.0 3.5 2.9
(Source: IMF (2015) Malaysia, Staff Report for the 2014 Article IV Consultation, IMF(2012) Malaysia, Staff Report for the 2011 Article IV Consultation)
(b) Financial Account
The inward direct investment in 2014 decreased to RM 34.2 billion, declining by 29% from 2013. This was the first
decrease in last 2 years. An increase in personnel costs and labor related issues such as securing of workers as well
as increases in energy costs due to the abolishment of the government’s subsidies to electricity and gas prices were
major factors. In 2015, the inward direct investment recorded RM 29.2 billion by the third quarter of 2015 (up
11.1% compared with the same period of the last year). The outward direct investment in 2014 increased to RM
51.3 billion in the first time in last 3 years, increasing by 26.6% from 2013.
The portfolio investment has recorded outflows since the second half of 2014. Foreign investor concerns about the
narrowing current account surplus mentioned above, downward pressure on exports caused by declining prices of
commodities in recent years and sluggish economic growth of China, market expectation of future interest hikes
with the recovery of the U.S economy, domestic political unrest related to the finances of the government-owned
investment company 1MDB, and the currency depreciation. This has caused an increase in downward pressure on
the foreign exchange rate.
Table 1-6 Financial Account
(Unit: $US billion) 2014 2015
1Q 2Q 3Q 4Q 1Q 2Q 3Q Inward Direct Investment 5.8 12.2 8.3 7.9 8.6 13.9 6.7 Outward Direct Investment 20.4 16.6 6.2 8.1 9.8 17.8 7.0 Portfolio Investment -13.4 6.9 -11.0 -20.4 -7.9 -11.8 -24.4
(Source: Bank Negara Malaysia)
Recent Foreign Exchange Rates 5)
Malaysian Ringgit depreciated by 3-7% annually since 2011 against the US dollar. Rapid depreciation of the
currency started with the market expectation of further shrink of the current account surplus reflecting significant
declines in oil prices since the second half of 2014. After the depreciation calmed down in the first half of 2015, the
currency further depreciated in August and September 2015, and depreciated by 27.7% in the first 9 months of 2015.
Since then, the currency has been in upward trend and it marked RM 4.3/US$ at the end of December, declining by
22.9% in 2015, which is lowest level since Asian crisis. The currency has also significantly depreciated against
Japanese Yen since the second half of 2015, declining by 21.9% in 2015. This currency depreciation is caused by (a)
concerns about the deterioration of fiscal and trade balance caused by declining prices of commodities such as
petroleum oil and natural gas which account for about 30% of the exports and the economic slowdown of China, (b)

1-6
uncertainties about the global economic outlook, (c) portfolio investment outflows partly caused by market
expectation of future interest hike with the recovery of U.S economy, and (d) political unrest mentioned above.
Figure 1-1 Exchange Rate
(Source: Bank Negara Malaysia)
Foreign Reserve and External Debt 6)
The foreign reserves declined to US$ 94.0 billion at the end of October 2015 and the ratio of foreign reserves to
short-term external debt (debt with maturities with less than 1 year) moderated to 1.2 times, marginally above the
threshold of 1.0 times defined by IMF due to the central bank’s intervention to support the value of RM. Thus,
Malaysia is vulnerable to pressures on capital outflows, if international investors shifts into further risk aversion,
and starts further recovery from emerging markets. Since the reserve is sufficient to finance 8.7 months of retained
imports, though the import coverage ratio (in month of imports) has declined, it is unlikely that Malaysia faces a
shortage of foreign reserve in the meantime.
Figure 1-2 Foreign Reserves Figure 1-3 External Debt
(Source: Ministry of Finance, Malaysia)
The ratio of external debt to nominal GDP kept a level of 60-70% in the last 3 years. The ratio is in upward trend in
2015 and it recorded 73.4% at the end of September 2015. The rise of the ratio reflects mainly the valuation effect
from the significant depreciation of RM against major currencies. More than half of the total external debt is of
medium- and long-term tenure, and about 35% of the total external debt is denominated in RM, mainly in the form
of non-resident holding of RM-denominated securities. In general, it is considered that there is higher risk of rapid
capital outflows if the level of external debt is high. However, since bilateral currency swap arrangements and so
called Chiang Mai Initiatives, the swap mechanism of foreign currency reserves, has undertaken, there is little
likelihood of incurring massive capital outflows which were happened in Asian currency crisis.

1-7
Fiscal Condition 7)
The Malaysia’s fiscal situation had deteriorated since massive fiscal stimulus packages to support the economic
slowdown after Lehman shock in 2008. With the increased government debt outstanding, the ratio of fiscal deficit
to GDP deteriorated from 3.28% in 2007 to 7.0% in 2009, and the ratio of government debt outstanding to GDP
increased to 53.7% in 2013 which was close to 55% of legal limit1 from 41.5% in 2007. In addition, incomes from
the oil and gas sector which accounted for about 30% of the government revenue had steadily decreased due to
changes in the industrial structure and declines in commodity prices. Meanwhile, obligatory spending such as social
security was expected to increase. Thus, the fiscal consolidation was unavoidable.
In a response to the deterioration of fiscal situation, the government has started the fiscal consolidation which
targets to achieve nearly 0% of fiscal deficit in 2020 in order to reduce its vulnerability of economy after the general
election in May 2013. The Fiscal Policy Committee was created to serve as the policy-making body for the
formulation and implementation of fiscal strategies. The review of increased subsidies was started, and the
reduction of subsidies to gasoline and diesel fuel prices for households in September 2013, the abolishment of
subsidies to sugar in October 2013, and the reduction of subsidies to electricity bills in January 2014, and the
removal of all fuel subsidies(saving of about RM10.7 billion) were undertaken. GST (6% of tax rate) which limits
the tax exemptions was introduced in April 2015 with the abolishment of VAT (10% of tax rate) and Service Tax
(6% of tax rate). Also, Malaysia introduced a Medium Term Fiscal Framework and performance-based budget
formulation aiming at effective and efficient budget allocation and securing medium-term fiscal sustainability.
As a result of the implementation of measures to reduce the fiscal deficit, the ratio of the fiscal deficit to GDP
recorded 3.5% and 3.2% (estimation) in 2014 and 2015 respectively, and the ratio of the government debt
outstanding to GDP recorded 53.5% and 52.9% (estimation) in 2014 and 2015 respectively, all of which have
shown a trend toward improvement, though the paces are slow. However, due to the remained high reliance of the
revenue on incomes from the oil and gas sector, the World Bank and IMF noted that if the prices of commodities
continue to be lower, there is a need to take further actions to cut public expenditure, improve the quality of public
expenditure, take further tax measures such as broader tax base in order to achieve a balanced budget by 20202。
1 Loan Act 1959, Government Funding Act 1983 2 IMF (2015), Malaysia, Staff Report for the 2014 Article IV Consultation, the World Bank (2015), Malaysia Economic Monitor,
December 2015

1-8
Figure 1-4 Government Debt and Fiscal Deficit(% of GDP)
Note: the data after 2015 were IMF predictions。 Sources: IMF (2015), Malaysia, Staff Report for the 2014 Article IV Consultation, IMF (2012), Malaysia, Staff Report for the 2011 Article IV Consultation
According to IMF debt-sustainability analysis conducted in 2014, the ratio of debt outstanding to GDP will decline
to 49% in 2019 under the base-line scenario (5% of real economic growth and return to profitable in primary
balance in 2018), the ratio will decline to 50% in 2019 under the scenario where the primary balance will remain
same, and the ratio will increase to 56% in 2016 and then decline under the most severe scenario where the primary
balance will deteriorate by 1%. Thus, it was not expected that the ratio would dramatically deteriorate in all
scenario conducted in the analysis.

Chapter 2. Study Methodology


2-1
Description of the survey (1)The candidate construction sites for the power plant in this survey are found in the following five areas in
Malaysia. From these candidates, we have selected Kuantan and ④ Kapar as a candidate sites in the
final phase. (The details of the site selection will be discussed in (3), Chapter 3.)
① Kuantan
② Pasir Gudang
③ Pulau Inda
④ Kapar
⑤ Port Dickson
The following shows the survey items in this survey project:
a) A survey for selecting the candidate construction sites
Carry out a surveys the topographic and geographical features, cooling water intake method, access to power
grid, access for transportation of heavy cargos and others for selection of the power plant construction sites.
b) A survey for confirmation of basic information
Carry out the following surveys to evaluate environmental and social impact and to ensure the accuracy required
in each of the work items of power plant basic designing, execution plan and cost estimation.
a. Evaluation of environmental impact
Based on the JICA environmental guideline, check to see if there are problems with the environmental and
social impact, and evaluate and study the current conditions of the planned power plant construction site and
planned gas/water pipeline construction area.
b. Study of fuel supply plan
Confirm the interface position between the existing gas pipeline network and each candidate site and the scope
of responsibility of facilities.
c. Study of major equipment specifications
Giving consideration to the location of the candidate site, work out an overall program of the project including
the gas pipeline and power transmission and transformation facilities, and the major specifications.
d. Conceptual designing
Establish basic concept on the outline program of premises layout, type, scale and unit capacity of the plant,
basic configuration of combined cycle power generation facilities, condenser cooling system, civil engineering
facilities, power transmission and transformation facilities, and others.
e. Economic and financial analysis

2-2
In the economic analysis, analyze and evaluate the economic benefit from the viewpoint of national economy,
and implement the program.
Make sure that the agency is capable of performing the construction and operation of the project for a specified
period of time with a specified efficiency.
To get qualitative effects, make sure that the short-term power supply capabilities and energy securities
(intermediate- and long-term effects) are ensured, and TNB human resources are effectively used. Also make
sure that creation of employment and economic ripple effect are achieved.
c) Major specifications of gas combined cycle power plant
Study and plan the major specifications in the overall program of the project including the gas pipeline and power
transmission and transformation facilities.
a. Site Layout Plan
Create the optimum proposal on the site layout plan of the power plant, based on the basic configuration of the
facilities. In the study of the layout, give consideration access to the fuel, cooling water and to the transmission
line at the site and position of the existing structures inside the existing power plant. Further, pay attention to
get the layout that provides an economical layout plan, and cooling water intake and discharge position which
ensures ease of operation and maintenance and provides countermeasures for environmental impact (noise,
vibration or emission gas) and warm effluent flowing around the power plant. In the case of a cooling tower
and air-cooled condenser, it is further necessary to ensure the optimum cooling effect.
b. Plant type, scale and unit capacity
Giving an overall judgment of the survey result in this survey project, study the type and scale of the plant.
Further, study the unit capacities of the power generation facilities and their combinations by giving
consideration to the gas turbine simple cycle. Further, establish the basic configuration of the combined cycle
power generation facilities.

2-3
Survey methods and systems (2)In the implementation of this survey project, a major portion of the proposal was made by Tokyo Electric Power
Services Co., Ltd., where part of the work was commissioned to Sumitomo Corporation, Japan NUS Co., Ltd. and
OPMAC Corporation. The following illustrates the organization structure:
Environmental & Social Consideration Eiichi KATO JAPAN NUS CO., LTD.
Fuel Planning Mitsuo NOMURA TEPSCO
Research on Power Supply Circumstance Etsuko KOBAYASHI TEPSCO
Thermal Power Plant Kenji MIKATA TEPSCO
Transmission and Distribution A Tatsuo HIRASAWA TEPSCO
Transmission and Distribution B Hiroaki YOSHIZAWA TEPSCO
Transmission and Distribution C Ryotaro YOSHIDA TEPSCO
Construction Plan Akira KOJIMA TEPSCO
Coordination/Fuel Procurement Plan Takashi AOTA Sumitomo Corporation
Economic & Financial Analysis Toshihisa IIDA OPMAC Corporation
Power System Analysis Masakazu SATO THE Power Grid Solution Ltd.
Leader Hideyuki OKANO TEPSCO

2-4
Survey Schedule (3)
Figure2-1Survey Schedule
2015
October
November
December
2016
January
February
Site
Investigation
Domestic
work
Report
▼
▼
▼
Inception Report Draft Final Report Final Report

Chapter 3. Justification, Objectives and Technical
Feasibility of the Project


3-1
(1) Background of the Project and Its Necessity
1) Scope of the project
This project is the plan for constructing a cutting-edge high-efficiency gas turbine combined cycle power
generation facility (for 500 to 700 MW 2 units) in Kuanatan and Kapar in the Malay Peninsula. The
combined cycle power generation technology that is applied in this project is the high-efficiency power plant
based on the 1600C class gas turbine (The power generation efficiency in LHV is 60%). The application of
this technology that has been established within Japan enhances the participation possibilities of the Japanese
companies into this project as well as contributes to the reduction of greenhouse gas emission such as CO2.
Figure 3-1 Image of a high-efficiency combined cycle power plant (Reference)
(Source: Siemens, Prai Power Plant – Malaysia sets a new trend regarding efficiency and emission in South East
Asia)

3-2
The main components of the high-efficiency combined cycle power plant include a gas turbine generator, an
heat recovery steam generator, a steam turbine and generator. The plant also includes the following facilities.
Gas turbine accessories (inlet air filter facilities, lubricating oil facilities, 3S clutch, etc.)
Turbine accessories (condenser, boiler feed water pump, condensate pump, circulating water pump,
deaerator, condenser ball cleaning facility, etc.)
Generator accessories (seal oil equipment, cooling equipment, etc.)
Electric facility
Control facility
Compressed Air facility
Gas compressor
Water treatment facility
Waste water treatment facility
Cooling water facility
Fire fighting facility, etc.
Table 3-1 shows the outline of the current plan for the scope of the construction of the combined cycle power
plant as intended for this project.
Table 3-1 Implementation scope of this project
Item Contents
Target sites Kuanatan and Kapar
Power output and quantity
500 to 700 MW 2 units
Scope of implementation
Complete set of combined cycle power generation plant
Civil engineering and construction
Detail design of the combined cycle power plant
Production, transportation, and installation of a combined cycle power plant (gas turbine and its accessories, steam turbine and its accessories, heat recovery steam generator and its accessories, generator and its accessories, electric facility, control facility, environment facility, pneumatic facility, cooling water facility, fire fighting facility, etc.)
Test operation of the power plant
Consulting service
Outside of the scope of implementation
The following items are to be implemented under the TNB.
Power plant, transmission lines, substation, gas construction site accommodation associated with this project
(Source: Prepared by the Survey Team)

3-3
2) Present state analysis and future outlook
In 2014, the Energy Commission issued the following information in Peninsular Malaysia Electricity Supply
Industry Outlook 2014. While the electricity consumption per capita was 1,101 kWh as indicated by
electricity supply-demand status in Malaysia in 1990, the consumption in 2012 was 3,902 kWh, which shows a
strong growth of 5.9% over 22 years.
Table 3-2 Data relating to energy intensity, demand, and elasticity
(Source: Peninsular Malaysia Electricity Supply Industry Outlook 2014 by Energy Commission)
Table 3-3 shows the power sales volume, power generation volume, peak demand, and annual output growth of
the past 7 years (2007 to 2013) and future 20 years (2014 to 2033) as of 2014.
Peninsular Malaysia 2005 2006 2007 2008 2009 2010 2011 2012
GDP at 2005 prices (RM million) 453,451 479,450 509,486 534,981 524,726 567,605 597,866 635,163
Population ('000 people) 21,075 21,370 21,662 21,951 22,241 22,656 23,132 23,429
Final Energy Demand (ktoe) 32,195 34,390 37,921 38,530 34,521 35,593 35,968 36,683
Electricity Consumption (ktoe) 6,366 6,669 7,030 7,307 7,567 8,145 8,427 8,791
Electricity Consumption (GWh) 73,987 77,504 81,710 84,924 87,950 94,666 97,939 102,174
PER CAPITA
GDP at 2005 prices (RM million) 21,516 22,436 23,520 24,371 23,593 25,053 25,846 27,110
Final Energy Consumption (toe) 2 2 2 2 2 2 2 2
Electricity Consumption (kWh) 3,627 3,772 3,869 3,955 4,178 4,234 4,361
ENERGY INTENSITY
Final Energy Consumption (toe/GDP
at 2005 prices (RM million))71.0 71.7 74.4 72 65.8 62.7 60.2 57.8
Electricity Consumption (toe/GDP
at 2005 prices (RM million))14.0 13.9 13.8 13.7 14.4 14.4 14.1 13.8
Electricity Consumption (GWh/GDP
at 2005 prices (RM million))0.163 0.162 0.16 0.159 0.168 0.167 0.164 0.161

3-4
Table 3-3 Revised assumption of long-term energy demand
(Source: Peninsular Malaysia Electricity Supply Industry Outlook 2014 by Energy Commission)
Except for the data in 2009, which is the year of the Lehman Crisis, the electric power sales volume (GWh),
electric power generation volume (GWh), and the peak demand have all shown reasonable growths for each of
the 6 years in average, which are 5.27%, 4.58%, and 3.85%.
As the outlook for the 10 years from 2014 to 2023, the electric power sales volume (GWh), the electric power
generation volume (GWh), and the peak demand are expected to increase by 3.10%, 2.90%, and 2.80%, which
indicate a drop of around 2% in comparison to those of the past 7 years.
In addition, for the period of 20 years from 2014 to 2033, the electric power sales volume (GWh), electric
power generation volume (GWh), and the peak demand are expected to increase by 1.60%, 1.50%, and 1.40%
respectively, which indicate a further slowdown in the increase.
The future slow-down of the increase of the power demand as predicted above is due to the slow-down of the
economic growth of China and continuing global trend of low crude oil price.
Year Sales (GWh) Growth (%)Generation
(GWh)Growth (%)
Peak
Demand
(MW)
Growth
(%)
MW
increase
2007 79,575 5.50% 90,283 4.40% 13,620 4.80% 630
2008 84,464 6.10% 94,370 4.50% 14,007 2.80% 387
2009 82,276 ‐2.60% 92,623 ‐1.90% 14,245 1.70% 238
2010 89,533 8.80% 100,991 9.00% 15,072 5.80% 827
2011 92,291 3.10% 103,354 2.30% 15,476 2.70% 404
2012 96,257 4.30% 106,884 3.40% 15,826 2.30% 350
2013 99,921 3.80% 111,020 3.90% 16,562 4.70% 736
2014 103,804 3.90% 114,549 3.20% 17,152 3.60% 590
2015 107,563 3.60% 117,834 2.90% 17,697 3.20% 545
2016 111,366 3.50% 121,794 3.40% 18,282 3.30% 585
2017 115,275 3.50% 125,860 3.30% 18,880 3.30% 598
2018 119,301 3.50% 130,045 3.30% 19,492 3.20% 612
2019 123,446 3.50% 134,350 3.30% 20,111 3.20% 619
2020 127,383 3.20% 138,421 3.00% 20,721 3.00% 609
2021 131,310 3.10% 142,474 2.90% 21,288 2.70% 568
2022 134,982 2.80% 146,243 2.60% 21,794 2.40% 506
2023 136,680 1.30% 147,869 1.10% 21,979 0.80% 185
2024 141,360 3.40% 152,718 3.30% 22,524 2.50% 545
2025 144,340 2.10% 155,725 2.00% 22,938 1.80% 414
2026 147,008 1.80% 158,390 1.70% 23,300 1.60% 363
2027 149,519 1.70% 160,886 1.60% 23,637 1.40% 337
2028 151,982 1.60% 163,328 1.50% 23,965 1.40% 328
2029 154,457 1.60% 165,781 1.50% 24,294 1.40% 329
2030 156,781 1.50% 168,070 1.40% 24,598 1.30% 304
2031 159,008 1.40% 170,458 1.40% 24,934 1.40% 337
2032 161,292 1.40% 172,907 1.40% 25,279 1.40% 345
2033 163,474 1.40% 175,245 1.40% 25,608 1.30% 329
3.10% 2.90% 2.80%
1.60% 1.50% 1.40%
2014‐2023
2014‐2033
HISTO
RICAL
FORECAST
Average period growth rates, % pa:

3-5
Although future slow-down of energy demand is predicted, an increase of 3% or less is predicted for the future
10 years so that the power supply development is necessary according to the demand.
Table 3-4 shows the power supply development plan. The power supply development plan was reviewed as a
result of the high energy demand and the delay of the system linkage with Sarawak. In the revised power
supply development plan, the operation commencement schedule of the combined cycle power plant (1000
MW) was brought forward to 2018 from the original schedule of 2020 due to the expectation of high energy
demand and control of the short-time extension. In addition, an introduction of a combined cycle power plant
of 2000 MW in 2021 is planned as an alternative to the system linkage with Sarawak. However, since the
system linkage with Sarawak is delayed to 2024, as the alternative, the operation commencement of a coal
power plant of 1000 MW is planned for 2023.
Table 3-4 Power supply development plan
(Source: Peninsular Malaysia Electricity Supply Industry Outlook 2014 by Energy Commission)
3) Effects of project implementation
Since the power supply development is planned according to the energy demand outlook, the development
contributes to the development of the society and the economy of Malaysia.
Year Recommended Plant‐Up
2014 S.J. Jambatan Connaught CCGT Extension (300MW)
2015 TNB Janamanjung (Unit 4) (1,010MW), CBPS Redevelopment (384.7MW)
2016
Hulu Terengganu (250MW), Ulu Jelai (372MW)
Tg Bin Energy (1,000MW), Tembat (15MW), TNB Prai (1,071.43MW), KLPP/
GSP Extension (675MW)
2017Pengerang Co‐Generation (400MW), Segari Extension (1,303MW), S.J. Sultan
Iskandar CCGT Extension (275MW), TNB Manjung Five (1,000MW)
2018Additional Chenderoh (12MW), Jimah East Power (1,000MW), New CCGT
(1000MW)
2019 Jimah East Power (1,000MW)
2020 Tekai (156MW)
2021 New CCGT (2,000MW)
2022 Telom (132MW)
2023 Coal (1000MW)
2024 Sarawak: 2 x 1000MW, Nenggiri (416 MW)

3-6
In Malaysia, although construction of coal-fired power plants is promoted for their low generation cost, recently,
the trend towards global warming prevention measures is increasing. This project, which introduces the
high-efficiency combined cycle power generation technology, contributes to the global warming prevention also
for its combined cycle power generation of lower greenhouse gas emission than the coal-fired gas power plant,
and its efficiency exceeding 60%.
In addition, the low Malaysian ringgit by the world wide collapse of oil prices and slow-down of the Chinese
economy, low interest rate financing such as JICA and JBIC finance tool is required for the funding and from
this aspect also, high concessional finance tool of JICA and JBIC is intended to meet the intention of such
Malaysian government
4) Comparison with other options
The following three proposals are assumed as the options (alternative proposals) in addition to this proposed
project.
(a) Alternative proposal 1: Construction of an ultra-supercritical coal-fired power plant
(b) Alternative proposal 2: Increase of power trading volume (no construction of a power plant)
(c) Alternative proposal 3: Introduction of renewable energy
(a) Alternative proposal 1: Construction of an ultra-supercritical coal-fired power plant
In Malaysia, based on the fuel diversification, construction of ultra-supercritical coal-fired power plants is being
promoted due to its low generation cost. Therefore, the base power supply is being established.
On the other hand, a greenhouse gas reduction target value is assigned to each country by COP21 and the
Malaysian Government is also obliged to make efforts to reduce greenhouse gases. Although an
ultra-supercritical coal-fired power plant has a high generation efficiency, which is 42%, it emits more
greenhouse gases than a combined cycle power generation system (60% generation efficiency).
In addition, construction of an ultra-supercritical coal-fired power plant of 600 MW 2 requires initial fund
exceeding 200 billion yen which is more expensive than that of this project (120 billion yen) and, in practice, a
large amount of loan should be avoided due to the low ringgit caused by low crude oil price.
Based on the environmental and funding aspects described above, construction of ultra-supercritical coal-fired
power plants cannot be a realistic option.
(b) Alternative proposal 2: Increase of power import volume

3-7
This alternative proposal is to handle the power supply by increasing the power trading volumes from other
countries, instead of construction of a power plant. While an increase of energy demand is expected, this
proposal will neither be able to handle the future demand increase as expected nor respond to the replacement
due to the deterioration and decrease of supply capability due to the handling of a replacement, which are not
included in the demand-supply outlook. Therefore, without a plan for construction of power plants, power
trading is to be used constantly. As currently exercised, the use of power trading is meaningful to handle peak
demand, however, the use of imported power as the constant power will cause significant economic damage to
the country.
(c) Alternative proposal 3: Introduction of renewable energies
Promotion of the introduction of renewable energies is the issue that is discussed as energy strategies in terms of
environment improvements and the use of renewable energies such as solar power generation and wind power
generation should be promoted as the policy of the country.
However, as a replacement of the existing coal-fired power plants, vast amounts of funding and time are
required to generate the equivalent volume of energy so that this proposal is not realistic. Renewable energies
such as solar power generation and wind power generation have lower intensity than fossil fuels and
significantly susceptible to the natural environment so that the functions for the stable power supply cannot be
expected, unlike the existing power plants.
As indicated above, each of the alternative proposals has many issues to be resolved and also requires a vast
cost and time to achieve the effects equivalent to those of the proposed project.
In Malaysia, hydro-electric power plants and coal fired thermal power plants are operated as base power
source, while combined cycle power plants are operated as load adjusting power source. Recently power
consumption in the big city such as Kuala Lumpur becomes large. So, generating plants for load adjusting play
important role for load adjusting. In the future, when Malaysia develops and big cities increase, role of
combined cycle power plant becomes important. .

3-8
(2) Enhancement and rationalization of energy utilization
This project realizes the enhancement and rationalization of energy (natural gas) utilization by applying the
high-efficiency combined cycle power generation system.
The combined cycle power generation system is widely used as an extremely reliable and established
technology. Kawasaki Thermal Power Plant No.2 of TEPCO introduced a gas turbine (M701J) that has the
combustion temperature of 1600C for the high-efficiency combined cycle power generation system in 2015.
The gross thermal efficiency of the power generation system has improved up to 60%, enabling enhancement
and rationalization of the use of natural gas.
In addition, this system is effective for environmental measures. The system can achieve excellent emission
values for carbon dioxide and nitrogen oxide.

3-9
(3) Examinations required for determining the contents of the project
1) Demand outlook
As the long-term energy demand outlook (2012 version),we assume the following: for the electric energy sales -
99,921 GWh in 2013, 134,982 GWh in 2022 (increase by 35%), and 161,292 GWh (increase by 61%) in 2032,
for the electric power generation - 111,620 GWh in 2013,146,243 GWh (increase by 32%) in 2022 and 172,907
GWh (increase by 54%) in 2032, for the peak energy demand – 16,562 MW in 2013, 21,794 MW (increase by
32%) in 2022, and 25,279 MW (increase by 53% in 2032.
2) Analysis of the problems at examination and determination of the contents of the project
The following items are listed up as a key issues in order to examine and determine the contents of the project.
(a) Grasping and examining the technical issues
Selection of power plant construction site
Study on the gas turbine to be applied
Study on shaft configuration
Study on site layout plan
Power system analysis
(b) Grasping and examining the environmental and social issues
Situation of natural and social environment of the power plant construction site
Whether or not resettlement and measurement
Exhaust gas emission from the power plant
(c) Grasping and examining the economical and financial evaluation
Economical and financial evaluation based on the various conditions indicated by TNB
Economical and financial evaluation of finance sources except Japanese ODA loan
3) Technical aspect
In this section, the technical aspects of the above item 2), (a) are grasped and examined in detail.
(a) Selection of candidate sites of the power plant
a) Selection criteria for candidate sites for the planned power plant
Criteria for choosing candidate sites for the planned power plant are as follows:
① The site should have a sufficiently large area that can arrange power plant equipment, a water
treatment system, a switching station and other necessary facilities.

3-10
② Natural gas can easily be obtained.
③ Sea water can be taken and sea depth should be sufficiently deep. (even at low tide).
④ Fresh water can also be obtained (or it should be able to take water from somewhere).
⑤ There should be transmission lines and substation near the candidate site.
⑥ There should be roads, a port or other infrastructure facilities that can be used to transport heavy
cargoes.
The following five locations are listed up as the candidate sites for the planned power plant from the technical
and economic point of view, after estimating the size of the power generation equipment (Figure 3-1).
- Kapar
- Pulau Indah
- Port Dickson
- Kuantan
- Pasir Gudang
Figure 3-2 Candidate locations subject to this survey
(Source: Created by survey team)

3-11
Pulau Indah was rejected from the candidates site list because it is difficult to acquire land and construct a
transmission line and gas pipeline which across the sea from the financial and technical point of view.
Meanwhile, Pasir Gudang has also been removed from the candidates site list for this project as the location had
been designated a site for a separate project commonly known as the Track 4A Project.
Therefore, Kuantan, Kapar and Port Dickson are selected as a candidate of project site and on-site surveys for
there have conducted.
b) Comparison and evaluations of the candidate sites
Comparison and evaluations of the candidate sites have been conducted in the following eight categories:
progress of land acquisition; site area; geological features; fresh water supply; intake and discharge
channel; gas supply; power cables and substations; possible impacts on the environment and society.
The assessment results are shown in Table 3-8.
The detailed assessment results for each site are as follows:
(i) Kapar
Progress of land acquisition
The land has already been acquired. Sugar canes and palm trees are currently grown in the border area.
However, the land owner has received compensation and given the green light to the construction work,
including leveling of ground. Prior notice is expected to be sent to the land owner six months before the start
of the work.
Site area
The site area is large enough for the power plant to be installed.
Geological features
The ground is very soft between the surface and a depth of 20 meters, so land improvement is essential. Piles
of 60 to 70 meters are estimated to be required. The site is currently 2.0 meters above sea level, but the project
requires an elevation of 5.0 meters. Taking into account those factors, the ground is expected to sink by 30 cm
over the coming 30 years.
Fresh water supply
A water supply pipe has been laid along a road near the planned construction site for the power plant. So we
need to inform the waterworks bureau of the needed amount of water to confirm whether we can secure a
necessary quantity of water for the planned facility.
Intake and discharge channel
The planned construction site for the power plant has a gently shelving shallow beach in front of it, so a channel
to draw and discharge water has to be extended to offshore (2.5 km from the shoreline). There are many
mangrove trees along the coast, so the water intake and drainage channel (pipe) should be laid outside the
mangrove forest. We will also consider installing the channel under the forest as an alternative method.

3-12
Gas supply
We are considering remodeling a metering station near the Kapar coal-fired power plant so that we can connect
a gas pipe to the planned power plant. We are also weighing setting up a new metering station near the
planned power plant to link a gas pipe to the new plant.
Transmission lines and substations
There is a 500/275-kV substation next to the planned construction site for the new power plant, and the existing
substation has an enough area on its site to install new facilities.
Impacts on natural and social environment
We will need to carefully consider measures to address the issue of soft ground and plans to cut the trees. As
there is a mangrove forest near the planned construction site for the new power plant, the trees need to be cut to
construct a channel to draw and discharge water. It is concerned that the discharged hot water may also
negatively affect the environment. Special attention should be given to the polymerization associated with
exhaust gas from the existing coal-fired power plant, as well as the repeated discharge of hot water and other
cumulative impacts.
(ii) Port Dickson
Progress of land acquisition
The candidate area is located on the site of an existing power plant, so the land acquisition is not necessary.
Site area
The land area is too small to install two 600 to 700MW combined thermal power plants. Thus, the location is
not appropriate as a candidate site in terms of the land area.
Geological features
The candidate area is located on the site of an existing power plant, and no problem such as land subsidence has
been reported so far. Thus, there would be no problem if setting up a new facility there.
Fresh water supply
There is a pipe on the existing plant site to supply water to the facility, so the planned power plant could also
receive water from the pipe.
Intake and discharge channel
The problem is that there is not enough space to install a water inlet and a water intake channel there.
Wastewater from the planned power plant may create a circulation of hot water, raising the temperature of water
drawn to the existing power plant. That could decrease the efficiency of the existing facility (the possibility of
the hot water circulation has been examined). The location is inappropriate as a candidate site, because it is
difficult to construct a water intake and drainage channel there and the planned facility could negatively affect
the ocean temperature.

3-13
Gas supply
Gas can be supplied via a pipe from the metering station near the existing power plant.
Transmission lines and substations
There is not enough space to add a new substation unit on the site of the existing substation. Therefore, the
location is not appropriate as a candidate site.
Impacts on natural and social environment
Under the plan, the existing power plant will just be expanded, so no grave impact on the social environment is
expected. However, careful attention should be paid to some factors, such as the polymerization associated
with exhaust gas from the existing power plant and the repeated discharge of hot water.
(iii) Kuantan
Progress of land acquisition
Negotiations to acquire the land are now under way, and the negotiation is expected to end shortly.
Site area
The planned construction site for the new power plant has a sufficient area.
Geological features
Piles of about 20 meters are estimated to be required, because the ground is made of sand. The site is currently
1.5 to 2.0 meters above sea level, and the land level needs to be raised to 4.0 meters eventually according to the
power plant construction plan.
Fresh water supply
A water supply pipe has been laid along a road near the planned construction site for the new power plant. So
we need to inform the waterworks bureau of the needed amount of water to confirm whether we can secure a
necessary quantity of water for the planned facility.
Intake and discharge channel
The waters 500 to 600 meters from the coast near the planned construction site for the new power plant reach a
sufficient depth, so there would be no problem with constructing a water intake and drainage channel there.
Gas supply
A new gas pipe connecting the construction site for the planned power plant with the existing gas pipe line, as
well as a new metering station, need to be installed.
Transmission lines and substations
A new power cable and switching station need to be set up to connect the planned power plant to the existing
275-kV power cable.
Impacts on natural and social environment
The planned construction site for the new power plant is flat, so large-scale land reclamation will not likely be
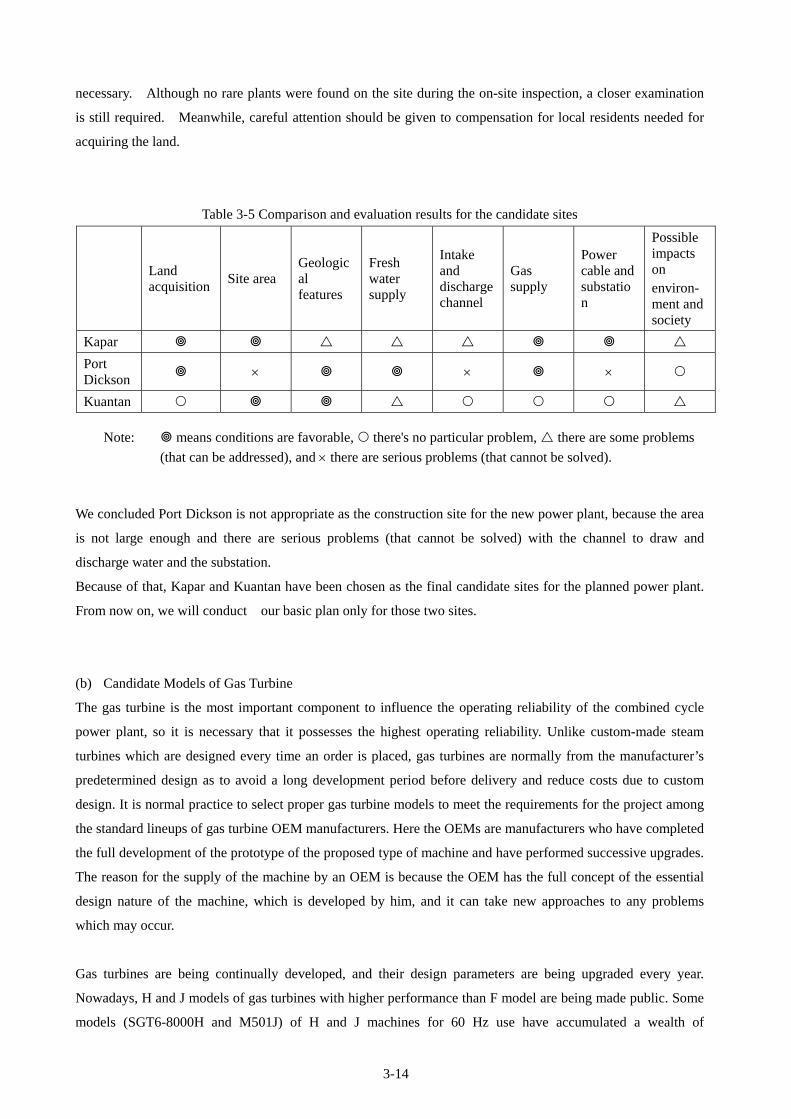
3-14
necessary. Although no rare plants were found on the site during the on-site inspection, a closer examination
is still required. Meanwhile, careful attention should be given to compensation for local residents needed for
acquiring the land.
Table 3-5 Comparison and evaluation results for the candidate sites
Land acquisition
Site area Geological features
Fresh water supply
Intake and discharge channel
Gas supply
Power cable and substation
Possible impacts on environ- ment and society
Kapar
Port Dickson
Kuantan
Note: means conditions are favorable, there's no particular problem, there are some problems
(that can be addressed), and there are serious problems (that cannot be solved).
We concluded Port Dickson is not appropriate as the construction site for the new power plant, because the area
is not large enough and there are serious problems (that cannot be solved) with the channel to draw and
discharge water and the substation.
Because of that, Kapar and Kuantan have been chosen as the final candidate sites for the planned power plant.
From now on, we will conduct our basic plan only for those two sites.
(b) Candidate Models of Gas Turbine
The gas turbine is the most important component to influence the operating reliability of the combined cycle
power plant, so it is necessary that it possesses the highest operating reliability. Unlike custom-made steam
turbines which are designed every time an order is placed, gas turbines are normally from the manufacturer’s
predetermined design as to avoid a long development period before delivery and reduce costs due to custom
design. It is normal practice to select proper gas turbine models to meet the requirements for the project among
the standard lineups of gas turbine OEM manufacturers. Here the OEMs are manufacturers who have completed
the full development of the prototype of the proposed type of machine and have performed successive upgrades.
The reason for the supply of the machine by an OEM is because the OEM has the full concept of the essential
design nature of the machine, which is developed by him, and it can take new approaches to any problems
which may occur.
Gas turbines are being continually developed, and their design parameters are being upgraded every year.
Nowadays, H and J models of gas turbines with higher performance than F model are being made public. Some
models (SGT6-8000H and M501J) of H and J machines for 60 Hz use have accumulated a wealth of
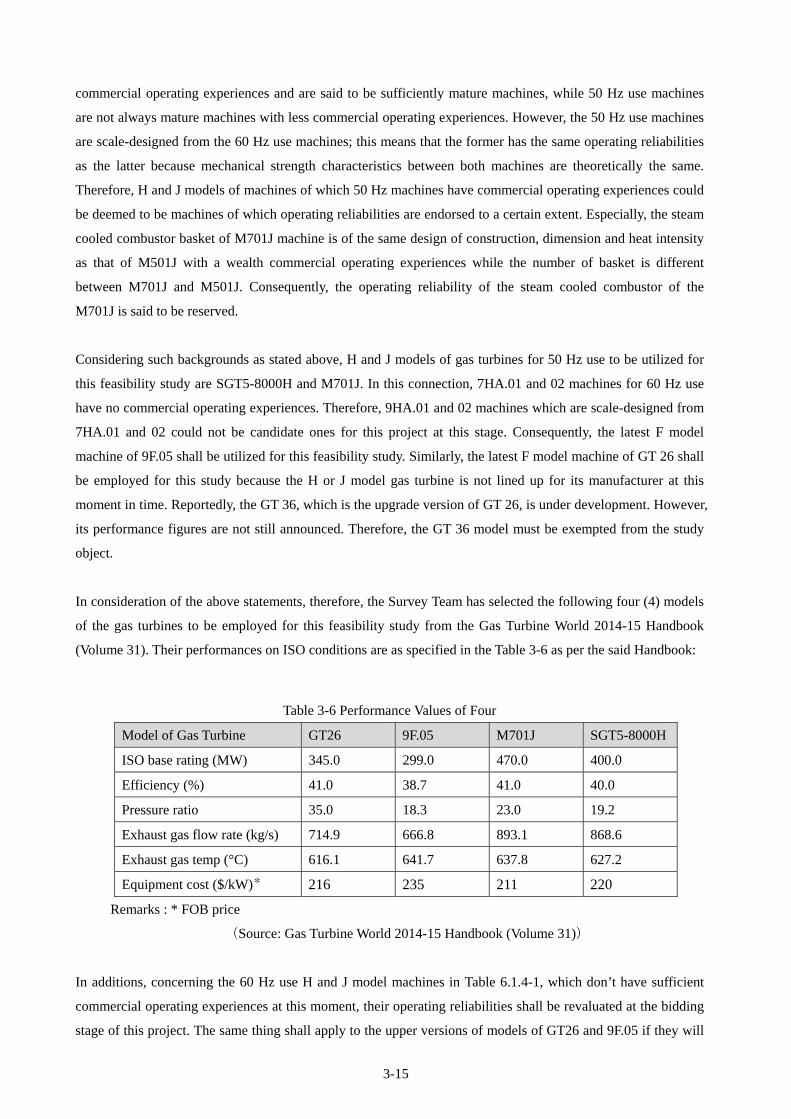
3-15
commercial operating experiences and are said to be sufficiently mature machines, while 50 Hz use machines
are not always mature machines with less commercial operating experiences. However, the 50 Hz use machines
are scale-designed from the 60 Hz use machines; this means that the former has the same operating reliabilities
as the latter because mechanical strength characteristics between both machines are theoretically the same.
Therefore, H and J models of machines of which 50 Hz machines have commercial operating experiences could
be deemed to be machines of which operating reliabilities are endorsed to a certain extent. Especially, the steam
cooled combustor basket of M701J machine is of the same design of construction, dimension and heat intensity
as that of M501J with a wealth commercial operating experiences while the number of basket is different
between M701J and M501J. Consequently, the operating reliability of the steam cooled combustor of the
M701J is said to be reserved.
Considering such backgrounds as stated above, H and J models of gas turbines for 50 Hz use to be utilized for
this feasibility study are SGT5-8000H and M701J. In this connection, 7HA.01 and 02 machines for 60 Hz use
have no commercial operating experiences. Therefore, 9HA.01 and 02 machines which are scale-designed from
7HA.01 and 02 could not be candidate ones for this project at this stage. Consequently, the latest F model
machine of 9F.05 shall be utilized for this feasibility study. Similarly, the latest F model machine of GT 26 shall
be employed for this study because the H or J model gas turbine is not lined up for its manufacturer at this
moment in time. Reportedly, the GT 36, which is the upgrade version of GT 26, is under development. However,
its performance figures are not still announced. Therefore, the GT 36 model must be exempted from the study
object.
In consideration of the above statements, therefore, the Survey Team has selected the following four (4) models
of the gas turbines to be employed for this feasibility study from the Gas Turbine World 2014-15 Handbook
(Volume 31). Their performances on ISO conditions are as specified in the Table 3-6 as per the said Handbook:
Table 3-6 Performance Values of Four
Model of Gas Turbine GT26 9F.05 M701J SGT5-8000H
ISO base rating (MW) 345.0 299.0 470.0 400.0
Efficiency (%) 41.0 38.7 41.0 40.0
Pressure ratio 35.0 18.3 23.0 19.2
Exhaust gas flow rate (kg/s) 714.9 666.8 893.1 868.6
Exhaust gas temp (°C) 616.1 641.7 637.8 627.2
Equipment cost ($/kW)* 216 235 211 220
Remarks : * FOB price
(Source: Gas Turbine World 2014-15 Handbook (Volume 31))
In additions, concerning the 60 Hz use H and J model machines in Table 6.1.4-1, which don’t have sufficient
commercial operating experiences at this moment, their operating reliabilities shall be revaluated at the bidding
stage of this project. The same thing shall apply to the upper versions of models of GT26 and 9F.05 if they will

3-16
have been commercialized up to the time.
(c) Type of Shaft Configuration
Here made is the simple comparison study on the type of the shaft configuration of the combined cycle power
plant (hereinafter to be collectively called as CCPP) comprised of the two (2) gas turbines, two (2) heat
recovery steam generators (hereinafter to be collectively called as HRSGs), one (1) or two (2) steam turbines
and generator(s).
Basically, there are two (2) types of shaft configurations. One is called single-shaft configuration where the gas
turbine and steam turbine shafts are connected on the same shaft. In this case, the larger capacity generator
common to gas and steam turbines is employed and the plant is consisted of two (2) units of single-shaft CCPPs.
In case of this shaft configuration, two (2) types are to be considered. One is the type with a clutch between the
generator and the steam turbine. The gas turbine and generator can be started as the steam turbine is in standstill
by disengaging the clutch. The steam turbine will go on after the steam flow enough for start-up of the steam
turbine is produced with the HRSG. Therefore, the auxiliary boiler capacity will be limited as the steam flow for
cooling of the steam turbine rear stage blades. Other is the type without the clutch. For comparison of the shaft
configuration, the former is the candidate as this type is recently prevalent for large capacity single-shaft CCPPs
and tends to be a standard design endorsed with a wealth of experiences.
The other is called a multi-shaft configuration where the gas turbine and steam turbine shafts are separate. In
case of this shaft configuration, two (2) types could be considered. One is that one (1) gas turbine is
accompanied with one (1) steam turbine, which can be called 1 on 1 multi-shaft configuration type. The other is
that two (2) gas turbines are accompanied with one (1) common steam turbine to which the steam from two (2)
HRSGs is introduced. This configuration is called as 2 on 1 multi-shaft type. Therefore, the steam turbine
capacity in this configuration doubles approximately the preceding shaft configuration.
In case of the multi-shaft configuration type, a bypass stack with a diverter damper used to be equipped for a
simple cycle mode operation of the gas turbine. The size of the diverter damper is larger as the gas turbine unit
capacity is large. In case of the H/J class gas turbine for 50 Hz use, the damper size exceeds eight (8) meters
square. It is impossible to expect reliable operation for long time of such a larger size damper that is activated in
atmosphere of the higher temperature more than 600oC. Consequently, in this shaft configuration study, the
bypass stack with the diverter damper is not considered for any types of shaft configurations of Type A, Type B
and Type C which are depicted in Figure 3-3.
The comparison study is performed from the viewpoints of plant thermal efficiency, operating flexibility,
operability, start-up requirement, application experience, plant operating reliability, plant maintenance cost,
installation footprint area, phased construction, construction cost, power generation cost, transportation and
influence on electrical networks among above three (3) types of CCPP shaft configurations.

3-17
Figure 3-3 Type of Shaft Configuration
ST GEN
Stack
HRSG GT GEN
Stack
ST GEN
HRSG GT GEN
Type A: 1 on 1 Multi-shaft Configuration
Stack
HRSG GT GEN
Stack
Type B: 2 on 1 Multi-shaft Configuration
ST GEN
HRSG GT GEN

3-18
(Source: Survey Team)
As shown above, in cases of Types A and B CCPPs, two (2) generators are individually employed for the gas
and steam turbines. In addition, in case of Type B CCPP, one (1) steam turbine with a double capacity, into
which steams from two (2) HRSGs are introduced, is employed.
In case of Type C CCPP, one (1) large capacity generator common to both gas and steam turbines is employed.
The study results described above are summarized in Table 3-7. The cell highlighted by yellow color show that
the type of CCPP of the cell is more advantageous than other type(s) of CCPP in terms of the related
comparison item. As shown in this table, if the shaft configuration is selected by the total area of highlighted
cells, the Type B and C CCPPs are equally ranked as a top priority and Type A CCPP a bottom priority.
Therefore, Type B or Type C should be selected looking overall.
The type of shaft configuration to be selected is changeable depending upon where the priority is placed. If the
priority, for example, is placed on the economy (construction cost and power generation cost) of the project,
Type B CCPP shall be selected. However, in case of Type B, the influence on the electrical networks resulting
from the detailed analysis must be technically acceptable. If not so, Type B shall not be selected.
Regarding the economy of the project, Type C is advantageous next to Type B. For example, the power
generation cost of Type C is more advantageous by 1.2 % than Type A.
Therefore, Type C is recommendable from a comprehensive point of view.
Type C: Single-Shaft Configuration
HRSG
Stack
GEN GT ST
HRSG
Stack
GEN GT ST
Clutch
Clutch

3-19
Table 3-7 Summary of Comparison Study Results on Type of Shaft Configuration of CCPP
Comparison Item Type of Shaft Configuration
A B C
1. Thermal Efficiency Base (100%) + 0.3 % + 0.1 %
2. Operational Flexibility Base Less flexible Similar
3. Operability Base Similar Slightly simple
4. Start-up Requirement Steam Base Similar Similar
Power for Starting device
Base Similar Similar
5. Application Experience Base Similar Similar
6. Operating Reliability POPH Base (100%) 2.2 % + 0.1 %
POPE Base (100%) Same + 0.9 %
7. Maintenace Cost Base Slightly less Slightly less
8. Footprint Area of Power Block Base (100%) 30 % 10 %
9. Phased Construction No No No
10. Construction Cost Base (100%) 10.2 % 5.1 %
11. Power Generation Cost Base (100%) 2.3% 1.2%
12. Transportation Base Similar Slightly difficult
13. Influence on Electrical Networks Base Double Same
(Source: Survey Team)
(d) Power system analysis
In Malaysia, power system analysis in FS is conducted by TNB. After that, the contractor will also conduct a
power system analysis. Therefore, the result of power system analysis is not disclosed to the third party.
Even though the Survey team requested TNB to disclose the data of power system analysis, such data has not
been disclosed the Survey team.
However, TNB explained the Survey team that there is no problem in the grid of Malaysia when 1000MW to
1400MW CCPP will be put into operation. This matter was mentioned and mutually confirmed in the Minutes
of Meeting of 2nd site survey.
(e) Study on site layout plan
Site layout plans of Kuantan and Kapar where are selected as candidate sites were studied based on the land
reclamation, intake and discharge channel routes, transmission lines and gas pipeline route.
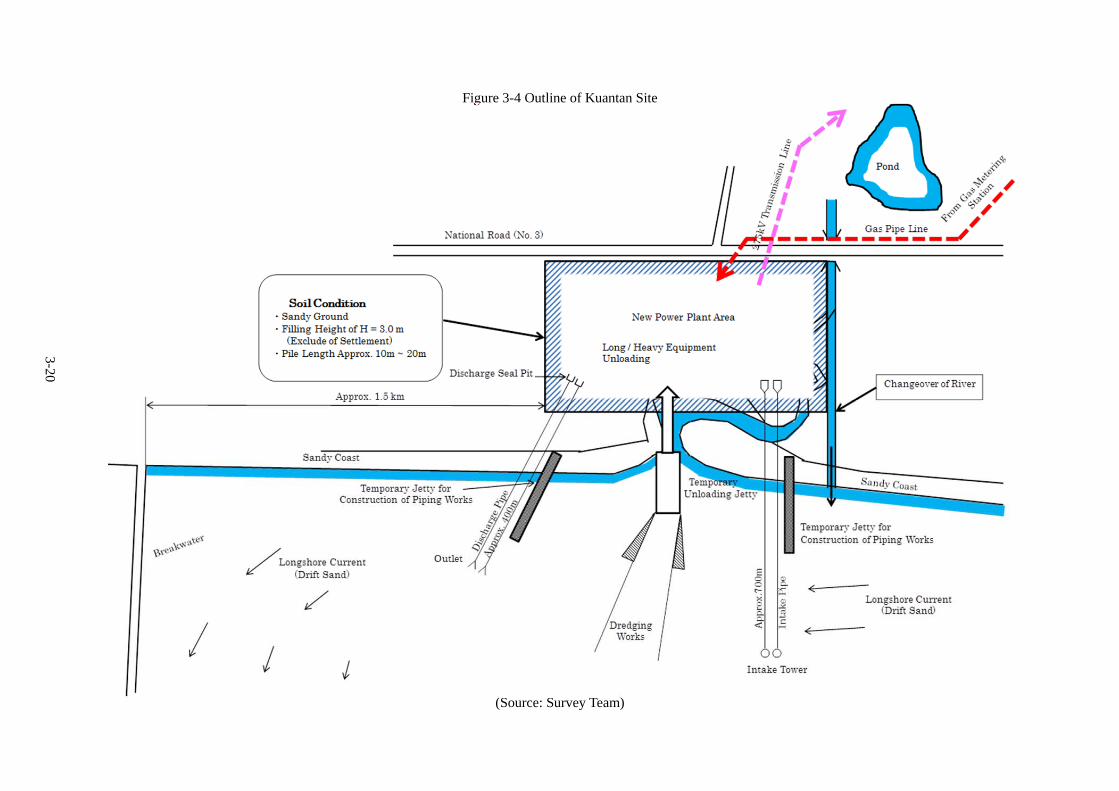
3-20
Figure 3-4 Outline of Kuantan Site
(Source: Survey Team)

3-21
Figure 3-5 Outline of Kapar Site
(Source: Survey Team)

3-22
(f) Environmental aspect
a) Situation of natural and social environment of candidate sites for the planned power plant
(i) Kuantan
Land acquisition of Kuantan site is under negotiation. But, there is no problem in the negotiation. TNB
requested the local consultant to examine relocation of the river where exists in the site.
(ii) Kapar
TNB has owned Kapar site. There are mangroves at coast line in front of the site. Therefore, it is recommended
that mangroves will be moved to construct the intake and discharge channels and will return there.
b) Resettlement of residences
(i) Kuantan
Land acquisition of Kuantan site is under negotiation. But, there is no problem in the negotiation. TNB
requested the local consultant to examine relocation of the river where exists in the site.
(ii) Kapar
TNB has owned Kapar site. There are mangroves at coast line in front of the site. Therefore, it is recommended
that mangroves will be moved to construct the intake and discharge channels and will return there.
c) Air pollutant emission from the power plant
NOx will be exhausted from gas fired combined cycle power plant. NOx value is extremely low and satisfies
the emission limitation value of Malaysia.
In the other hand, since waste water will properly treated and discharged to the sea. So, there is no impact on the
sea by waste water.
(g) Issues of financial and economical aspect
a) Financial and economical evaluation based on the conditions instructed by TNB
Conditions of financial and economical evaluation for the project are bench mark tariff, fuel cost per kW and
availability of 1Prai CCPP. In such case, since fuel cost per kW is high and availability is low, FIRR and EIRR
become worse.
b) Financial and economical evaluation based on the finance sour except Japanese ODA loan
Since Malaysia is categorized as Uppermost-Middle-Income Countries, financial and economical evaluation
based on other finance sources such as JICA overseas investment and JBIC buyers credit in addition to Japanese
ODA loan were conducted.
1 EC announced the concession tender for Prai Combined Cycle Power Plant in 2012. TNB eventually concluded PPA of Prai CCPP.

3-23
(h) Examination of the technical approach
The combined cycle power generation technology is applied to achieve the maximum energy-saving effect and
reduction of the environmental impact. Table 3-8 shows the plant performance improvements that are achieved
by applying the high-efficiency gas turbine. As a result of applying the J or H type gas turbine, a plant
efficiency improvement by about 20% can be expected in comparison to that of the ultra-super critical coal fired
power plant (USC coal fired thermal power plant).
Table 3-8 Plant performance improvements by applying the cutting-edge gas turbine
Item J type gas turbine base CCPP
USC coal fired thermal power plant
Gross thermal efficiency 19.7 % increase (61.7%) Base (42.0%)
Carbon dioxide emission 17,556,345 tCO2 / year decrease
Base
(Source: Survey Team)

3-24
(4) Summary of the project
1) Basic policies for determining detailed contents of the project
(a) Consider the contents and technical aspects of the project
Obtain and analyze documents and other general information on Malaysia's power industry
Survey the candidate sites for the planned power plant, nearby substations, the conditions of power cables
and other materials as well as the characteristics of natural gas to be used as fuel, so that we can develop
the best specifications for the combined cycle power plant
Develop a rough process plan based on the specifications above
(b) Pay close attention to the environment and society
Possible impacts of the project on the social environment: we will assess the effects of the land acquisition,
employment promotion, economic benefits and other impacts that the plant construction would have on the
social environment.
Permits and licenses to be acquired in Malaysia: we will survey potential environmental impacts and
related laws and regulations as well as permits and licenses needed for the project.
(c) Financial and economic analysis
Estimate of construction costs: we will estimate the expected construction costs based on the developed
specifications.
Assessment of business profitability: we will conduct financial and economic analysis as part of efforts to
consider appropriate ways to raise funds and sell electricity, so that we can make the new facility
profitable.
2) Conceptual design and specifications of equipment subject to the design
(a) Expected Plant Performance by Candidate Gas Turbine
The CCPP shall be comprised of the candidate gas turbine which is available in the present world market and
the bottoming system suited to it. The CCPP performance shall be changeable depending upon the type of
candidate gas turbine and the type of the bottoming system. In addition, the performance shall be influenced by
ambient conditions and fuel gas properties. For the purpose, conditions for calculation are defined as specified
below.

3-25
a) Ambient Conditions
The ambient conditions are specified as shown below pursuant to those of TUANKU JAAFAR Power Staion.
Dry bulb temperature 32.0 oC
Relative humidity 80.0 % RH
Wet bulb temperature 29.0 oC
Barometric pressure 101.3 kPa
Minimum dry bulb temperature 18.0 oC for definition of maximum power output
b) Fuel Gas Property
Delivery pressure 30.0 bar (g)
Delivery temperature 25.0 oC
Composition (vol. %)
Methane 85.24
Ethane 4.35
Propane 1.37
i-Butane 0.05
n-Butane 0.03
i-Pentane 0.06
n-Pentane 0.02
Benzene 0.02
Nitrogen 1.58
Carbon dioxide 7.27
Total 100.00
Net specific energy (Lower heating value) 40,310 kJ/kg (calculated from above composition)
c) Candidate Models of Gas Turbines
The plant performance shall be calculated for the four (4) candidate models of gas turbines of which
performance values are shown in Table 6.1.4-1 of the previous section.
d) Type of the Bottoming System
The combined cycle plant is a combination of a “Topping System” of a gas turbine with Brayton Cycle and a
“Bottoming System” of a boiler-steam turbine with Rankine Cycle. The performance of the combined cycle
plant is changeable due to how the bottoming system is designed for the given topping system of the gas turbine.
In general, the more complicated is the cycle of the bottoming cycle, the higher is the performance of the
combined cycle plant. In case of employment of the F, H, and J class gas turbines, the triple-pressure and reheat

3-26
cycle bottoming system is commonly employed.
Figure 3-6 Combined Cycle System
(Source:Thermal and Nuclear Power Engineering Society Introductory course Sep.2015 page39
Retouched by Survey Team)
About thermodynamic cycle
1. Brayton cycle
Brayton cycle is a fundamental thermodynamic cycle of gas turbine, named after Mr. George Brayton, USA, which consists of the following four processes (in case of open cycle)
(1) Ambient air is compressed and sent to combustors, through adiabatic compression process. (Power is necessary)
(2) The compressed air then runs through a combustor, where fuel is burned, heating the air—a constant-pressure (isobaric) heating process
(3) The heated, pressurized air then gives up its energy, expanding through a turbine, extracting work, through adiabatic expansion process.
(4) Exhaust gas from turbine is mixed by ambient air and cooled, through isobaric heat rejection process.
Work produced by turbine, after work to drive the compressor is deducted, is gas turbine power.
Topping System
(Rankine cycle)
Bottoming System
(Brayton cycle)
Generator
Fuel
Air
Combustion gas
Vapor
Generator
Condenser
Gas Turbine
Stuck
Pump
Feed- water
Steam
Turbine
HRSG
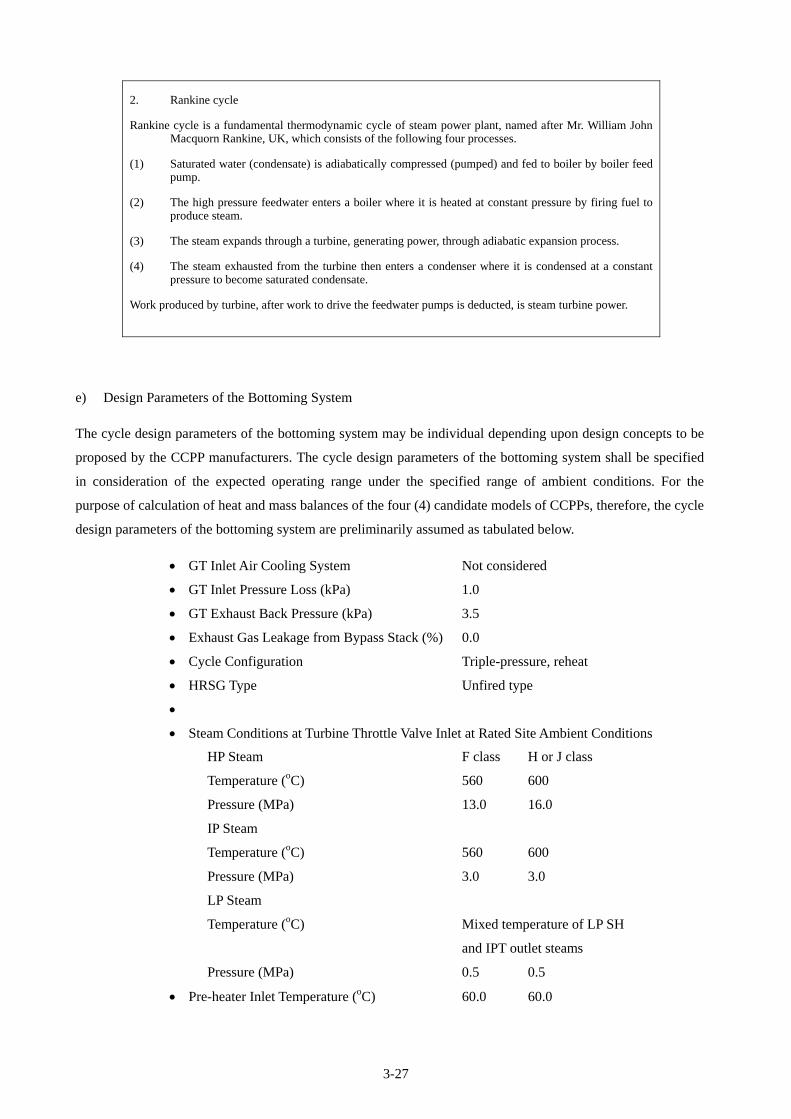
3-27
2. Rankine cycle
Rankine cycle is a fundamental thermodynamic cycle of steam power plant, named after Mr. William John Macquorn Rankine, UK, which consists of the following four processes.
(1) Saturated water (condensate) is adiabatically compressed (pumped) and fed to boiler by boiler feed pump.
(2) The high pressure feedwater enters a boiler where it is heated at constant pressure by firing fuel to produce steam.
(3) The steam expands through a turbine, generating power, through adiabatic expansion process.
(4) The steam exhausted from the turbine then enters a condenser where it is condensed at a constant pressure to become saturated condensate.
Work produced by turbine, after work to drive the feedwater pumps is deducted, is steam turbine power.
e) Design Parameters of the Bottoming System
The cycle design parameters of the bottoming system may be individual depending upon design concepts to be
proposed by the CCPP manufacturers. The cycle design parameters of the bottoming system shall be specified
in consideration of the expected operating range under the specified range of ambient conditions. For the
purpose of calculation of heat and mass balances of the four (4) candidate models of CCPPs, therefore, the cycle
design parameters of the bottoming system are preliminarily assumed as tabulated below.
GT Inlet Air Cooling System Not considered
GT Inlet Pressure Loss (kPa) 1.0
GT Exhaust Back Pressure (kPa) 3.5
Exhaust Gas Leakage from Bypass Stack (%) 0.0
Cycle Configuration Triple-pressure, reheat
HRSG Type Unfired type
Steam Conditions at Turbine Throttle Valve Inlet at Rated Site Ambient Conditions
HP Steam F class H or J class
Temperature (oC) 560 600
Pressure (MPa) 13.0 16.0
IP Steam
Temperature (oC) 560 600
Pressure (MPa) 3.0 3.0
LP Steam
Temperature (oC) Mixed temperature of LP SH
and IPT outlet steams
Pressure (MPa) 0.5 0.5
Pre-heater Inlet Temperature (oC) 60.0 60.0

3-28
Condenser
Terminal Temperature Difference (oC) 2.8
Temperature (oC) 41.8
Pressure (kPa)
Temperature rise (oC) 7.0
Cooling System
Type Once-through type
Type of cooling water Sea water
Cooling water inlet temperature (oC) 32.0
Cooling water outlet temperature (oC) 39.0
Cooling water inlet temperature (oC) 25.0
for definition of maximum power output
f) Heat and Mass Balance Calculation Results
The heat and mass balances of the single-shaft type CCPPs by the four (4) candidate models of gas turbines are
calculated based on the conditions stated in the previous sub-section. The heat and mass balance is made for one
(1) power train of single-shaft configuration CCPP, while the plant is comprised of two (2) power trains. The
expected performance calculation results per one (1) train of the plant are summarized as tabulated in Table 3-9.
Table 3-9 Expected Plant Performance Calculation Results
Type of Candidate Gas Turbine GT26 9F.05 M701J SGT5-8000H
Plant Gross Power Output (MW) 448.9 405.2 629.4 536.4
GT Gross Power Output (MW) 304.0 263.5 420.9 352.5
ST Gross Power Output (MW) 144.9 141.7 208.5 183.9
Plant Gross Thermal Efficiency (%) 58.4 57.4 60.3 58.7
Auxiliary Power Requirement (MW) 11.4 9.0 14.6 12.0
Plant Net Power Output (MW) 437.5 396.2 614.9 524.4
Plant Net Thermal Efficiency (%) 56.9 56.1 58.9 57.4
Fuel Flow Rate (t/hr) 68.5 63.0 93.2 81.5
ditto (MMcfd at 15oC and 760 mmHg) 71.0 65.2 96.5 84.4
Flue Gas Flow Rate (wet t/hr) 2,404 2,242 2,994 2,920
ditto (wet Nm3/hr) 1,915,000 1,786,000 2,390,000 2,326,000
Thermal Effluent Water Flow Rate (t/hr) 33,300 31,500 43,900 40,100
(Source: Survey Team)

3-29
As shown in Table 3-9, the plant net power output under the specified rated site ambient conditions for the
CCPP by a candidate gas turbine of each OEM gas turbine manufacturer ranges from approx. 400 MW to
approx. 615 MW and plant net thermal efficiency from 56 % to 59 %. At this stage, the environmental
assessment and impact analysis on electrical networks by this project must be conducted using the performance
figures of the CCPP by M701J gas turbine. In this connection, the maximum gross power output of one (1)
power train by M701J on the minimum ambient temperature of 18 oC is roughly estimated at 700 MW.
The heat and mass balance diagrams of one (1) train of CCPP by the candidate gas turbine are shown in the
following figures.
Figure 3-7 Heat and Mass Balance Diagram of One (1) Train of CCPP by Alstom GT26 Gas Turbine
Figure 3-8 Heat and Mass Balance Diagram of One (1) Train of CCPP by GE 9F.05 Gas Turbine
Figure 3-9 Heat and Mass Balance Diagram of One (1) Train of CCPP by MHPS M701J Gas Turbine
Figure 3-10 Heat and Mass Balance Diagram One (1) Train of CCPP by Siemens SGT5-8000H Gas Turbine

3-30
3-30
Figure 3-7 Heat and Mass Balance Diagram of One (1) Power Train of CCPP by Alstom GT26 Gas Turbine
(Source: Survey Team)
268.9 G 103.9 G 557.1 G 2,403.7 G
1.2 G 3,511.9 H 2,961.7 H 251.5 H 88.5 H
270.1 G 140.2 T 13.4 P 60.7 G 0.41 P 0.56 P 101.3 P
3,499.0 H 568.0 T 2,984.5 H 248.8 T 60.0 T 83.2 T
13.4 P 3.79 P
563.0 T 305.4 T
*3 *1
*4
2,403.7 G
713.5 H
104.8 kPa
631.7 T
317.1 G
3,608.6 H
3.00 P
568.0 T
270.1 G 103.9 G G t/hr
3,497.6 H 2,956.1 H H kJ/kg
12.7 P 0.39 P P MPa
1.2 G 560.0 T 245.8 T T oC
140.2 T
0.0 G Steam
713.5 H 318.3 G 435.3 G Water
101.3 kPa 2,403.7 G 3,591.2 H 3,006.0 H Cooling Water
631.7 T 713.5 H 2.94 P 0.37 P Gases
104.8 kPa 560.0 T 269.7 T
631.7 T *3 256.4 G
3,150.2 H
3.15 P
365.3 T
*4
471.3 G
0.0 H
0.66 P
T
240.9 T 435.3 G
68.56 G 2,419.9 H
40,356 *1 2,334.4 G 8.1 P(kPa)
25.0 T 32.2 H 33,300 G 41.8 T
101.3 kPa 39.0 T
32.0 T *2435.9 G
175.8 H 435.9 G
0.66 P 179.3 H
*2 40,783 41.9 T 0.66 P
40,442 220.0 T 42.7 T
68.8 T 88.8 T
33,300 G
32.0 T
LHV+Sensible Heat (kJ/kg)
LHV+Sensible Heat (kJ/kg)
LHV+Sensible Heat (kJ/kg)
kW
Plant Net Power Output
Type of Fuel Natural Gas
29.0 oC
Auxiliary Power437,500 kW
Plant Net Thermal Eff 56.9 %
58.4 Plant Gross Thermal Eff %
11,400
Gross Power OutputkW
kW
kW Plant total 448,900
Gas turbine
Steam turbine
304,000
144,900
Heat and Mass Balance Diagramat Rated Ambient Conditions
Type of Gas Turbine Alstom GT26
Operating Conditions Dry Bulb Temperature 32.0 oC
Ambient Pressure 101.3 kPa
Net Specific Energy 40,310 kJ/kg
Relative Humidity 80.0 %
Wet Bulb Temperature
HP SH
RHTR
IP SH LP SHHP EVA IP EVA LP EVAHP ECO IP ECO LP ECO
HPT IPT LPTTurbine Air Compessor
Combustor
from Gland Seals
TCACoole
Fuel GasHeater
Fuel Gas Comp

3-31
3-31
Figure 3-8 Heat and Mass Balance Diagram of One (1) Power Train of CCPP by GE F9.05 Gas Turbine
(Source: Survey Team)
302.5 G 103.5 G 529.7 G 2,242.0 G
1.4 G 3,511.9 H 2,968.5 H 251.6 H 89.6 H
303.8 G 148.6 T 13.4 P 4.0 G 0.51 P 0.68 P 101.3 P
3,499.0 H 568.0 T 3,063.6 H 253.8 T 60.0 T 84.4 T
13.4 P 3.79 P
563.0 T 335.4 T
*1
2,242.0 G
743.9 H
104.8 kPa
657.3 T
292.4 G
3,608.6 H
3.00 P
568.0 T
303.8 G 103.5 G G t/hr
3,497.6 H 2,963.2 H H kJ/kg
12.7 P 0.49 P P MPa
1.1 G 560.0 T 250.8 T T oC
148.6 T
0.0 G Steam
743.9 H 293.5 G 412.0 G Water
101.3 kPa 2,242.0 G 3,591.2 H 3,045.0 H Cooling Water
657.3 T 743.9 H 2.94 P 0.48 P Gases
104.8 kPa 560.0 T 290.1 T
657.3 T 288.4 G
3,145.7 H
3.15 P
363.4 T
444.6 G
0.0 H
0.78 P
T
240.9 T 412.0 G
62.95 G 2,413.7 H
40,356 *1 2,178.3 G 8.1 P(kPa)
25.0 T 32.2 H 31,500 G 41.8 T
101.3 kPa 39.0 T
32.0 T *2412.5 G
176.0 H 412.5 G
0.78 P 179.7 H
*2 40,783 41.9 T 0.78 P
40,380 220.0 T 42.8 T
37.2 T 57.2 T
31,500 G
32.0 T
Net Specific Energy 40,310 kJ/kg
Relative Humidity 80.0 %
Wet Bulb Temperature
Heat and Mass Balance Diagramat Rated Ambient Conditons
Type of Gas Turbine GE 9F.05
Operating Conditions Dry Bulb Temperature 32.0 oC
Ambient Pressure 101.3 kPa
Gross Power OutputkW
kW
kW Plant total 405,300
Gas turbine
Steam turbine
263,500
141,800
57.4 Plant Gross Thermal Eff %
9,000
396,300 kW
Plant Net Thermal Eff 56.1 %
LHV+Sensible Heat (kJ/kg)
LHV+Sensible Heat (kJ/kg)
LHV+Sensible Heat (kJ/kg)
kW
Plant Net Power Output
Type of Fuel Natural Gas
29.0 oC
Auxiliary PowerHP SH
RHTR
IP SH LP SHHP EVA IP EVA LP EVAHP ECO IP ECO LP ECO
HPT IPT LPTTurbine Air Compessor
Combustor
from Gland Seals
Fuel GasHeater
Fuel Gas Comp

3-32
3-32
Figure 3-9 Heat and Mass Balance Diagram of One (1) Power Train of CCPP by MHPS M701J Gas Turbine
(Source: Survey Team)
345.1 G 105.2 G 730.5 G 2,994.2 G
1.5 G 3,587.9 H 2,939.2 H 251.6 H 83.2 H
346.7 G 149.2 T 16.5 P 116.6 G 0.51 P 0.68 P 101.3 P
3,574.8 H 608.0 T 3,129.6 H 239.8 T 60.0 T 78.1 T
16.5 P 3.79 P
603.0 T 362.1 T
*3 *1
*4
2,994.2 G
746.8 H
104.6 kPa
656.6 T
445.6 G
3,699.1 H
3.00 P
608.0 T
346.7 G 105.2 G G t/hr
3,573.7 H 2,933.8 H H kJ/kg
15.7 P 0.49 P P MPa
1.7 G 600.0 T 236.8 T T oC
149.2 T
0.0 G Steam
746.8 H 447.3 G 569.4 G Water
101.3 kPa 2,994.2 G 3,681.5 H 3,098.5 H Cooling Water
656.6 T 746.8 H 2.94 P 0.48 P Gases
104.6 kPa 600.0 T 316.0 T
656.6 T *3 329.1 G
3,158.3 H
3.15 P
368.8 T
*4
617.8 G
0.0 H
0.78 P
T
240.9 T 569.4 G
93.17 G 2,436.6 H
40,356 *1 2,901.1 G 8.1 P(kPa)
25.0 T 32.2 H 43,900 G 41.8 T
101.3 kPa 39.0 T
32.0 T *2570.1 G
176.0 H 570.1 G
0.78 P 179.5 H
*2 40,783 41.9 T 0.78 P
40,399 220.0 T 42.7 T
46.9 T 66.9 T
43,900 G
32.0 T
Net Specific Energy 40,310 kJ/kg
Relative Humidity 80.0 %
Wet Bulb Temperature
Heat and Mass Balance Diagramat Rated Ambient Conditions
Type of Gas Turbine MHPS M701J
Operating Conditions Dry Bulb Temperature 32.0 oC
Ambient Pressure 101.3 kPa
Gross Power OutputkW
kW
kW Plant total 629,400
Gas turbine
Steam turbine
420,900
208,500
60.3 Plant Gross Thermal Eff %
14,600
614,800 kW
Plant Net Thermal Eff 58.9 %
LHV+Sensible Heat (kJ/kg)
LHV+Sensible Heat (kJ/kg)
LHV+Sensible Heat (kJ/kg)
kW
Plant Net Power Output
Type of Fuel Natural Gas
29.0 oC
Auxiliary PowerHP SH
RHTR
IP SH LP SHHP EVA IP EVA LP EVAHP ECO IP ECO LP ECO
HPT IPT LPTTurbine Air Compessor
Combustor
from Gland Seals
TCACoole
Fuel GasHeater
Fuel Gas Comp
Gas TurbineCombustor
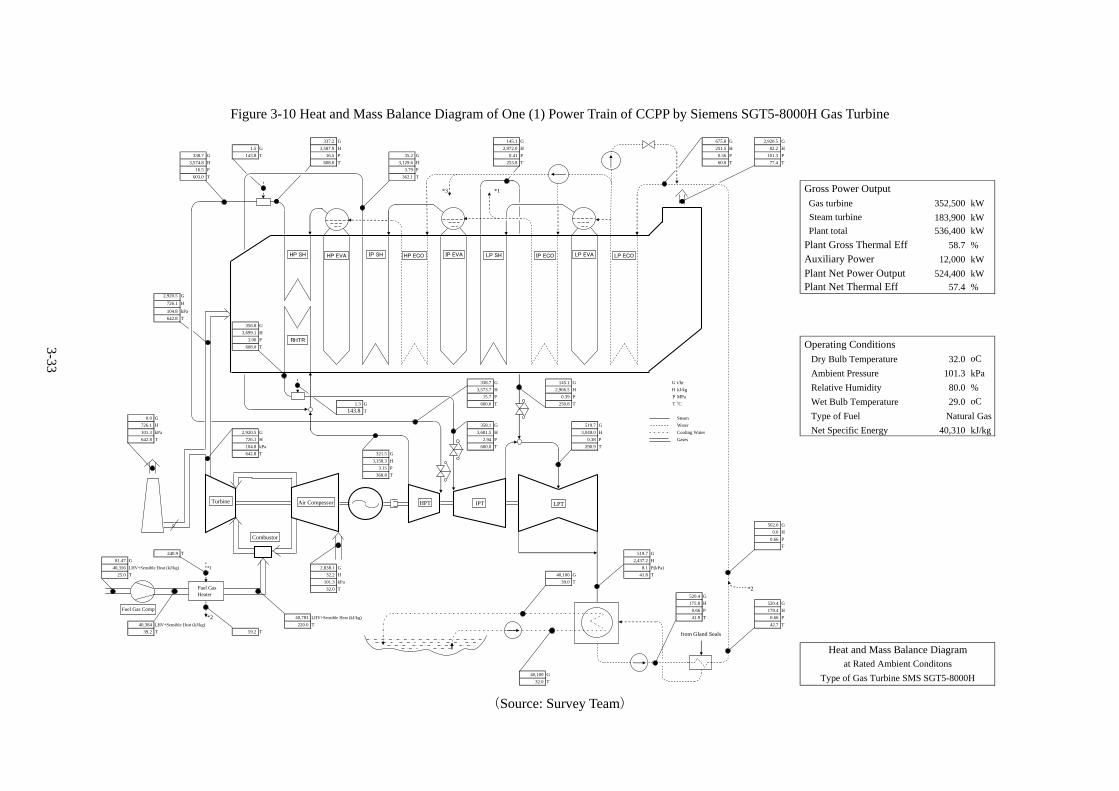
3-33
3-33
Figure 3-10 Heat and Mass Balance Diagram of One (1) Power Train of CCPP by Siemens SGT5-8000H Gas Turbine
(Source: Survey Team)
337.2 G 145.1 G 675.8 G 2,920.5 G
1.5 G 3,587.9 H 2,972.0 H 251.5 H 82.2 H
338.7 G 143.8 T 16.5 P 35.2 G 0.41 P 0.56 P 101.3 P
3,574.8 H 608.0 T 3,129.6 H 253.8 T 60.0 T 77.4 T
16.5 P 3.79 P
603.0 T 362.1 T
*3 *1
2,920.5 G
726.1 H
104.8 kPa
642.8 T
356.8 G
3,699.1 H
3.00 P
608.0 T
338.7 G 145.1 G G t/hr
3,573.7 H 2,966.5 H H kJ/kg
15.7 P 0.39 P P MPa
1.3 G 600.0 T 250.8 T T oC
143.8 T
0.0 G Steam
726.1 H 358.1 G 519.7 G Water
101.3 kPa 2,920.5 G 3,681.5 H 3,049.0 H Cooling Water
642.8 T 726.1 H 2.94 P 0.38 P Gases
104.8 kPa 600.0 T 290.9 T
642.8 T 321.5 G
3,158.3 H
3.15 P
368.8 T
562.0 G
0.0 H
0.66 P
T
240.9 T 519.7 G
81.47 G 2,437.2 H
40,356 *1 2,838.1 G 8.1 P(kPa)
25.0 T 32.2 H 40,100 G 41.8 T
101.3 kPa 39.0 T
32.0 T *2520.4 G
175.8 H 520.4 G
0.66 P 179.4 H
*2 40,783 41.9 T 0.66 P
40,384 220.0 T 42.7 T
39.2 T 59.2 T
40,100 G
32.0 T
LHV+Sensible Heat (kJ/kg)
LHV+Sensible Heat (kJ/kg)
LHV+Sensible Heat (kJ/kg)
kW
Plant Net Power Output
Type of Fuel Natural Gas
29.0 oC
Auxiliary Power524,400 kW
Plant Net Thermal Eff 57.4 %
58.7 Plant Gross Thermal Eff %
12,000
Gross Power OutputkW
kW
kW Plant total 536,400
Gas turbine
Steam turbine
352,500
183,900
Heat and Mass Balance Diagramat Rated Ambient Conditons
Type of Gas Turbine SMS SGT5-8000H
Operating Conditions Dry Bulb Temperature 32.0 oC
Ambient Pressure 101.3 kPa
Net Specific Energy 40,310 kJ/kg
Relative Humidity 80.0 %
Wet Bulb Temperature
HP SH
RHTR
IP SH LP SHHP EVA IP EVA LP EVAHP ECO IP ECO LP ECO
HPT IPT LPTTurbine Air Compessor
Combustor
from Gland Seals
Fuel GasHeater
Fuel Gas Comp

3-34
(b) Power generation equipment
a) Gas Turbine and Auxiliary System
(i) Design Codes and Standards
The gas turbine system shall be basically designed as per ISO 3977-3 “Gas turbines-Procurement-Part 3: Design
requirements” and ISO 21789 “Gas turbine applications-Safety.”
(ii) Gas Turbine
The gas turbine shall be of single shaft configuration, open cycle, heavy duty F class temperature level type with
dry low NOx design suitable for the specified natural gas.
The gas turbine design shall be with a minimum number of bearings, and shall be located on a steel frame or on
adequate steel structures and concrete foundation, so sized as to withstand the transient torque imposed on the
shaft in case of short circuit of the generator or out-of-phase synchronization, whichever is larger. The power
output shall be taken out at the cold end of the shaft.
The gas turbine shall be complete with all auxiliary systems such as starting system, lube oil supply system, inlet
air filtration system, fuel gas supply system, turning device, control and monitoring equipment necessary for safe,
reliable and efficient operation with the fuel specified. The gas turbine shall be designed for indoor installation in
an enclosure to meet the specified noise requirements.
During start-up the gas turbine combustor is cooled by steam from an auxiliary boiler and the cooling steam is
switched over from the auxiliary boiler to the HRSG coupled with the gas turbine after the conditions of the steam
from the HRSG is established.
The gas turbine shall be designed for continuous base load operation according to the manufacturer’s standard,
burning natural gas with the specified composition range. The gas turbine shall be capable of start-up, loading and
shut down using the specified natural gas.
The gas turbine shall be provided with an automatic start-up and control system capable of being operated from
the central control room of the plant.
The control system of the gas turbine shall be such that it is capable of performing the following operations as a
simple and combined cycle:
Constant load operation at all loads between the minimum and full loads
Governor free (droop) operation
Turbine inlet temperature constant operation
No load operation for certain periods of limited time without being not synchronised as a simple cycle

3-35
Minimum load operation not more than 30% of the full load as a combined cycle on the full power of the
steam turbine keeping all the bypass valves closed.
Automatic purging cycle to ensure that specified natural gas is removed from the gas turbine and entire
exhaust system up to the exit of the stacks. Purging time shall be adjustable.
The load rejection from the full load without tripping for easy re-synchronization.
The gas turbine shall be of horizontally split case construction for convenience for maintenance and shall permit
easy access to stationary and moving blades without undue difficulties.
The entire gas turbine casing shall be heat and sound insulated in such a manner as to allow easy removal and
replacement for overhaul and inspection. The insulation material shall be of asbestos free non-combustion and
chemically inert material and shall be covered by sheet metal. The design of the heat and sound insulation shall be
in a manner to avoid the lube oil soaking in.
Around the gas turbine there shall be working space of at least 0.8 m width without any interference by piping,
cabling, walls, etc.
The journal bearings shall be of sleeve bearing type. The axial thrust force shall be oriented in one direction
during all steady state operating conditions and shall be absorbed by an adjusted axial thrust bearing. All main
bearings of hydrodynamic type shall be equipped with bearing oil outlet temperature indicators and monitors and
vibration indicators and monitors. The monitors shall be capable to actuate alarm and/or trip as per manufacturers’
practices.
Borescope parts for inspection of all critical inner parts shall be provided.
Figure 3-11 shows the longitudinal cross section of the typical J class gas turbine which is one of the candidate gas
turbines applicable for this Project.

3-36
Figure 3-11 Longitudinal Cross Section Drawing of Typical J Class Gas Turbine
(Source: Courtesy of MHPS)

3-37
(iii) Starting System
The starting device and associated power supply equipment shall be suitable for the acceleration of the gas
turbine/generator and the extended operation during purge and compressor cleaning cycles. The rating of the
starting device shall be determined so as to produce the starting and acceleration torque with a proper margin to
allow for the gas turbine/generator to accelerate to the rated speed from standstill within 25 minutes (excluding
the purge and synchronization time) on all machine state conditions without any difficulties throughout the
specified ambient temperature range. The starting device and starting power supply capacity shall be minimized as
long as the train will be accelerated within the specified time.
The following two (2) types of starting devices are conceivable for such a large capacity gas turbine and generator
of the separate shaft type CCPP as required for this plant.
A synchronous generator/motor with a static frequency converter
A squirrel cage type motor with a torque converter
The starting system should preferably be rated without limit on the number of starts attempted in succession and
without restricting the rate of starting.
Interlocks shall be provided to prevent the gas turbine/generator from starting in case the lube oil pressure is not
sufficient to rotate the gas turbine/generator rotor.
Any starting device shall disengage automatically and shut down before it reaches the maximum allowable speed.
The starting device is normally disengaged at the self-sustaining speed or idle speed and is at rest during operation.
Failure of the disengagement shall automatically abort the starting sequence.
The gas turbine/generator shall be capable of starting instantaneously from any standstill conditions as long as it is
on reserve condition.
The starting control system, including any pre-start actions such as turning, shall be of manual and automatic as
defined below:
Manual start: The start-up sequence shall be held and advanced at the events such as cranking, purging,
firing and at the minimum governor setting speed.
Automatic start: The start-up sequence shall be automatically advanced to the minimum governor setting
speed or the readiness to synchronizing or to the pre-set load.
The starting control system shall be provided with an automatic purge function to ensure safe operation.

3-38
(iv) Lube Oil Supply System
The lube oil supply system shall be basically designed as per the requirements of the latest version of API 614 or
equivalent standard. A complete lube oil system shall be provided and shall be fully integrated with jacking oil
system (if applicable), oil purification system and dirty oil drains for the gas turbine/generator. The lube oil system
shall have sufficient capacity to accommodate the requirements of the systems that will be supplied with the lube
oil.
The system shall include sufficient standby equipment to allow any items of equipment within the lube oil system
to be taken out of service for maintenance without restricting the operation of the plant.
The lube oil system shall be preferably common to that of the steam turbine in case of a single-shaft configuration.
The retention time of the oil reservoir shall not be less than eight (8) minutes based on the normal flow rate of oil
and the retention capacity which is the total volume below the minimum operating level in accordance with API
Standard 614 in case of a lube oil system without sufficient commercial operating experiences.
Alarms shall be at least made on the occurrence of the following situations:
Lube oil supply pressure low
Lube oil reservoir level low
Lube oil discharge temperature high
Lube oil supply temperature high
Lube oil filter differential pressure high
All bearing drain lines and oil wells are to be provided with visual indicators capable of being observed from a
local platform or operating floor level.
The outlets of relief valves shall be routed to the oil reservoir tank.
In the event of AC power failure, the emergency DC oil pump to be operated for rundown of the rotating shafts
and bearing cool-down shall be automatically put into operation. A combined AC/DC tandem motors-driven pump
shall not be accepted.
Where oil is supplied from a common system to two (2) or more machines, the characteristics of the oil shall be
specified by the Contractor. The Contractor shall ensure that the specified oil meets the requirements of the
different machines and is locally procurable. Figure 3-12 is a typical flow diagram of lube oil supply system
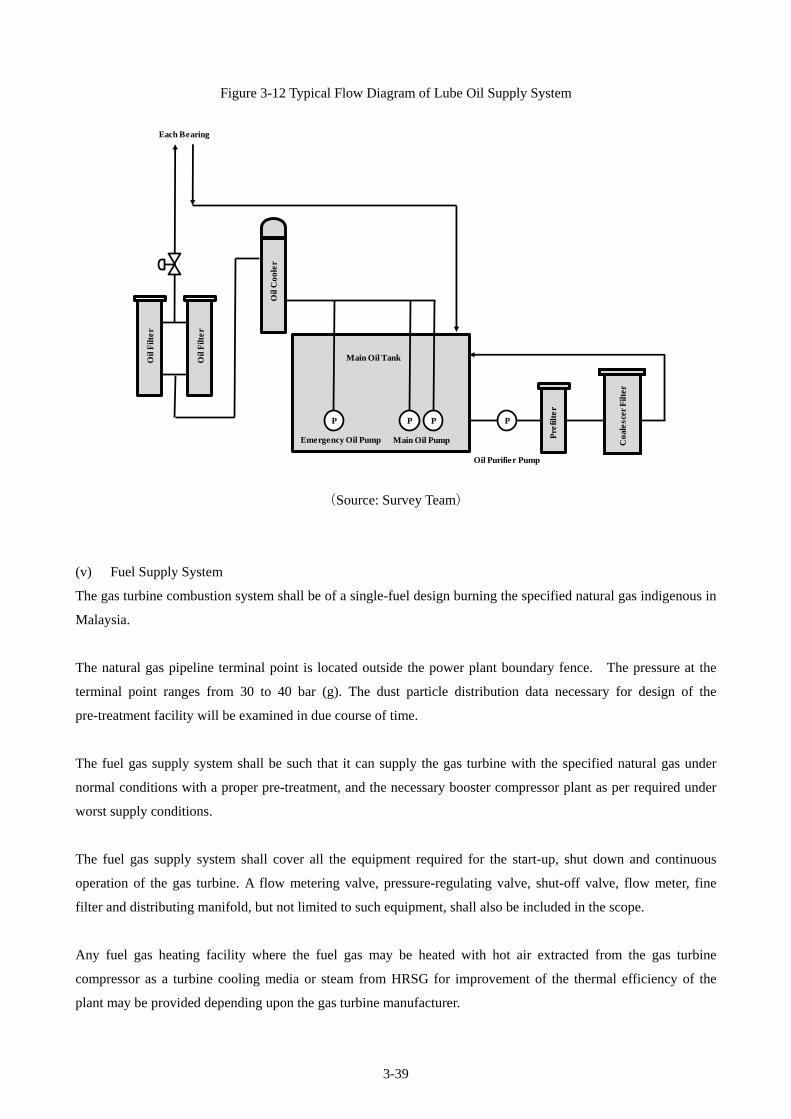
3-39
Figure 3-12 Typical Flow Diagram of Lube Oil Supply System
(Source: Survey Team)
(v) Fuel Supply System
The gas turbine combustion system shall be of a single-fuel design burning the specified natural gas indigenous in
Malaysia.
The natural gas pipeline terminal point is located outside the power plant boundary fence. The pressure at the
terminal point ranges from 30 to 40 bar (g). The dust particle distribution data necessary for design of the
pre-treatment facility will be examined in due course of time.
The fuel gas supply system shall be such that it can supply the gas turbine with the specified natural gas under
normal conditions with a proper pre-treatment, and the necessary booster compressor plant as per required under
worst supply conditions.
The fuel gas supply system shall cover all the equipment required for the start-up, shut down and continuous
operation of the gas turbine. A flow metering valve, pressure-regulating valve, shut-off valve, flow meter, fine
filter and distributing manifold, but not limited to such equipment, shall also be included in the scope.
Any fuel gas heating facility where the fuel gas may be heated with hot air extracted from the gas turbine
compressor as a turbine cooling media or steam from HRSG for improvement of the thermal efficiency of the
plant may be provided depending upon the gas turbine manufacturer.
P P P
Main Oil Tank
Emergency Oil Pump Main Oil Pump
Oil
Coo
ler
Oil
Filt
er
Oil
Filt
er
Each Bearing
P
Pre
filte
r
Coa
lesc
er F
ilter
Oil Purifier Pump

3-40
Any other conditions necessary for the design of the gas turbine shall be examined at the detailed design stage.
(vi) Air Intake System
i) General
The air supply for a gas turbine shall be taken from a high-level atmospheric air inlet external to the gas and steam
turbine building. The air intake shall also be positioned to avoid the ingress of any exhaust gases from the main
stack of the heat recovery steam generator.
The design of the hood shall permit ready access to the air filtration system. After filtration, the air shall be
directed to the inlet flange of the gas turbine compressor.
The intake system shall be complete with inlet screen and louvers, filters, airtight duct from filters to compressor
inlet, foreign object damage protection screen, sound attenuators and all controls and instrumentation necessary
for safe control.
The number of access points and penetrations into the air inlet system for maintenance and inspection shall be
minimized. Any door or hatch shall be capable of being securely locked, and interlocks shall be provided to
prevent any attempted start with any door or hatch not properly closed.
Figure 3-13 is a typical Air Intake System with Two (2)-stage Filtration System
ii) Air Filtration System
The air intake filtration system shall be accomplished by a multi-stage dry system. The filter elements shall be
preferably of washable reuse type to minimize industrial waste. The air filtration system shall be so designed that
its initial weight arrestance efficiency will not fall below 99.5 % for ASHRAE test dust. For the purpose, it is
preferable that the filtration system is comprised of E6 class of first stage, E9 class of second stage and H11 class
of last stage filter elements.
The replacement interval of filter elements shall not be shorter than 6,000 operating hours for the dust
concentration of 0.1 mg/m3 with ASHRAE test dust.
The air intake shall be equipped with a silencer downstream of the filtration system and the whole of the ducting
shall be sealed to avoid ingress of unfiltered air.
The air filters chosen shall be suitable to reduce the sand, dust and salt content of the atmospheric air to a level
which is not detrimental to the life of the gas turbine unit and under the most adverse atmospheric conditions of
the site.
A self-cleaning type air filtration system shall be acceptable as an alternative. The filter system shall be composed
of high efficiency media filter cartridges to meet the above replacement requirement, which can be cleaned
automatically by reverse pulses of compressed air taken from the intermediate stage of the gas turbine air
compressor. The sound pressure level during the reverse cleaning operation shall not exceed 85 dB (A) at the

3-41
distance of 1 m from the system.
The design shall minimize the inlet system pressure drop. The instrumentation and control equipment shall also be
kept to a minimum but must include a differential pressure monitor across every stage of the filtration system.
iii) Air Inlet Ductwork
The ductwork shall be complete with all the necessary expansion joints, guide vanes, supports and supporting
steelwork, vibration isolators, flanges, silencing equipment, cladding and any other items necessary to complete
the system.
The expansion joint shall be such that no loads or forces are transmitted to the gas turbine inlet flange.
Sliding joints shall not be used in the ductwork. All expansion joints shall be flanged for removal without
disturbing the main sections of the ductwork.
No entrapped nuts, bolts or rivets shall be used inside the ductwork downstream of the filtration system.
Bypass doors shall be provided in the ductwork to allow the air filtration system to be bypassed in the event of
excessive differential pressure across the filtration system. The construction of the bypass door shall be preferably
of a counter weight type. An alarm in the control room shall be initiated on high filter differential pressure. On
further increase in differential pressure, a further alarm shall be initiated together with automatic opening of the
bypass doors.
iv) Silencer
A silencer shall be provided to control the noise from the air compressor to the specified level. The silencer
acoustic panels shall be designed for the service life of thirty (30) years at the full load condition of the gas turbine.
The silencer shall be capable of being removed from the ductwork without dismantling or removing any other
ductwork than that containing the silencer. The silencer acoustic panels shall be constructed from stainless steel.
The infill and panels shall be fully resistant to the worst atmospheric conditions anticipated on the site.
Precautions shall be taken to prevent settling or packing of the infill material. The infill material shall be of
vermin proof.
v) Foreign Object Damage (FOD) Protection Screen
Since there is a possibility of foreign objects entering the gas turbine and causing damage of rotating parts, the
FOD protection screen shall be installed at the compressor inlet to reduce the size of objects that can enter to a
size that is not liable to cause such damage. The location of the screen shall be sufficiently upstream to avoid the
potential for large objects to cause significant localized flow blockage that may induce blade failure.

3-42
Figure 3-13 Typical Air Intake System with Two (2)-stage Filtration System
(Source: Survey Team)
b) Heat Recovery Steam Generator (HRSG) System
(i) General
The HRSG is of triple-pressure, natural or forced circulation, reheat type outdoor installation of proven design in
accordance with the requirements of the ASME B&PV Code or equivalent, where applicable. It is designed to
accept the maximum exhaust gas flow rate from a gas turbine at base load output for the minimum specified
ambient temperature, and the heating surfaces are be designed to take into account the variation on the
temperature/flow profile which may occur in the combustion gas leaving the gas turbine under different loads of
the gas turbine and ambient conditions.
The HRSG are capable of coping with the inherent start-up and shut down of the gas turbine without undue
thermal stress. It is designed to operate on the exhaust gas from the gas turbine when it is fired with the specified
natural gas fuel.
An exhaust gas bypass system is not equipped because the damper to control the exhaust gas is of huge dimension
for the H and J class gas turbines and the reliable operation of the damper is not expected.

3-43
The HRSG is designed so as to minimize the back-pressure against the gas turbine while generating the steam
with specified conditions. It is constructed of heat transfer modules as large as possible, factory-tested and
shippable to shorten the installation time. The Figure 3-14 is the typical Vertical Gas Flow Type HRSG.

3-44
Figure 3-14 Vertical Gas Flow Type HRSG
(Source: Survey Team)
To minimize the outage time for inspection and maintenance, provision is made to allow ready access to the flue
gas path, tubing, and other pressure parts. Access doors with integral seals to prevent gas leakage into the
atmosphere shall be provided.
The HRSG is designed for outdoor installation and entirely weatherproof. Canopies is provided to protect both
personnel and equipment (drum fittings, valve and circulating pumps) from the external environment.
The steam drums is sized sufficiently large to accommodate water level variations during start-up and during
operating transient conditions without resorting to wasteful water dumping or risk of carry over. The drum
capacity is also sufficient such that tripping of any one (1) operating boiler feed water pump will not cause the
HRSG to trip prior to standby boiler feed water pump reaching its operating load.
The HRSG is arranged with the total pressure parts comprising steam drums, superheaters, reheaters, evaporators,
economizers, headers, down comers and integral pipe work in the form of a self-contained unit supported by its
own steel structure. This structure is to be quite independent of any building except for normal points of
interconnection with access galleries, platforms, or stairways.

3-45
The design of the HRSG and associated ancillary and auxiliary systems are developed for both base load and
cycling service in particular where component material stress and structural design are concerned. Any special
features for the HRSG necessary to permit both constant and variable pressure operation for the turbine steam
temperature matching are incorporated.
Design and Operating Conditions
The HRSG is designed to be suitable under normal and abnormal operating conditions to match the proven
combined cycle plant design. The gas side of the HRSG passages are designed for the maximum temperature,
pressure and mass flow rate that can be anticipated under all operating conditions (including a trip situation).
Under conditions of total load rejection, the thermal load on the HRSG is rapidly dumped to the condenser by
means of the steam bypass system without actuation of pressure safety valves.
The HRSG is to be designed such that it is started-up together with the gas turbine.
The HRSG design is optimized for continuous efficient operation over the entire operating range of the gas
turbine.
The feed water quality meets the requirements of the HRSG and steam turbine as per the applicable codes.
(ii) Design Standards and Codes of Practice
All materials, designs, manufacture, construction, and inspection and testing conform to criteria and
recommendations of the relevant codes and standards.
All pressure parts, mountings, fittings and sub-assemblies are designed, constructed, and tested to conform to the
requirements of the approved Inspection Authority.
(iii) Design and Construction of HRSG
i) HRSG Gas Path
The gas turbine exhaust gas path through the HRSG will be horizontal or vertical with water and steam tubing
located horizontally/vertically across the gas stream to suit the plant layout and as per the manufacturer’s standard
design.
The heating surfaces of various heat transfer modules in the gas stream reduce the gas temperature to the lowest
value practicable for the specified natural gas to the gas turbine without risk of low temperature corrosion at the
economizer outlet or within the stack. The feed water temperature is so controlled that metal temperatures in any
parts of the economizer will remain above 60 oC to protect them from corrosion due to carbonic acid.

3-46
The tubes and headers in each plenum are completely drainable and provision is made to allow access to the
tubing for inspection and maintenance.
ii) Tubes
The tubes are of solid drawn or electrical resistant welding (EWR) steel as per the manufacturer’s experience. The
design, manufacture and testing of the tubes are in accordance with the relevant standard specification.
Adequate circulation ratio is taken into account to minimize circulation upsets that may occur during rapid
start-up or load change. Fins added to the heat transfer tubing to improve the heat transfer characteristics are
continuously welded to the outside surface of the tubes. All welds and tube connections to headers are located
outside the gas passage and readily accessible for inspection and maintenance.
iii) Superheaters and Reheaters
The HP superheater tubing shall be designed and located in the HRSG unit such that the steam temperature at
delivery to the steam turbine will not exceed the HP steam chest and rotor stated limits, with the gas turbine at
base continuous output with the highest anticipated ambient temperature, without recourse to desuperheating the
steam.
The design is compatible with the requirements of constant and variable pressure operation and the variable
characteristics of the gas turbine exhaust gas flow.
The HP, IP and LP superheaters are designed to ensure even distribution of steam through the tubes at all loads.
Superheaters and reheaters are of fully drainable elements. Superheater and reheater tubes are designed under the
conditions of no steam flow in the tubes during start-up.
iv) Evaporators
The HP, IP and LP evaporators are designed to operate over the full load range of the HRSG without drumming or
vibration and to ensure an even distribution of water through the tubes. The evaporator elements are designed to
be drainable completely.
v) Economizers
The HP, IP and LP economizers are designed to ensure stable non-steaming operation/single phase flow
throughout the full operating range of the HRSG. The economizer elements are completely drainable.
vi) Condensate Preheater
A condensate preheater for the HRSG as the last heat recovery module is provided to maximize the heat recovery
efficiency by decreasing the temperature of the gas leaving the HRSG. The condensate preheater is designed to

3-47
withstand the condensate extraction pump shut off head.
vii) Steam Temperature Control
The steam temperature at the outlet of the superheaters and reheaters is controlled using direct spray type
desuperheaters. The capacity of each desuperheater is determined taking all operating conditions into
consideration.
The spray water control system is equipped with a motorized isolation valve in the common line, interlocked to
close automatically when the steam temperature reaches below a set point and to prevent water induction into the
steam turbine.
viii) Safety Valves
The number, capacity and location of safety valves are specified in accordance with the requirements of the
international relevant codes and/or standards. The safety valves at the superheater outlet are sized to have a
discharge capacity equal to at least 20% of the maximum steam quantity generated by the HRSG. The safety
valves at the steam drum have total discharge capacity equal to at least the remaining of the maximum steam
quantity required for the protection of the HRSG.
Safety valves on the reheater are sized to pass the maximum reheater flow without a rise in reheater inlet pressure
of more than 10% of the highest set pressure.
ix) HRSG Insulation and Cladding
The whole of the HRSG is insulated internally and/or externally and all external insulation shall be cladded in
accordance with the specification to provide an entirely weatherproof unit suitable for outdoor operation.
The insulation is of proven material suitable for continuous service at the maximum operating temperature.
x) Access and Inspection Doors
Adequate access and inspection doors of an approved type and size shall be provided to allow free entry for
maintenance and cleaning of the HRSG gas-path and pressure parts.
xi) Blowdowns and Drains
The steam drum is provided with a continuous drum water blowdown connection, located to ensure preferential
discharge of concentrated drum water, complete with parallel slide isolating and regulating valves in accessible
positions adjacent to the drum connection.
Intermittent blowdown and drain pipes are provided where necessary from all drainable sections of the HRSG

3-48
down to the intermittent blow down tanks. And the HRSG is provided with continuous and intermittent blowdown
tanks.
An adequate number of electrically operated blowdown valves and superheater and reheater drain valves are
provided for automatic operations during start-up, load operation, and shut down of the HRSG.
xii) Preheater Recirculation System
The preheater recirculation pump is provided so that the preheater inlet feed water temperature is kept higher than
that specified by the HRSG manufacture to protect the preheater tubes from the low temperature corrosion due to
carbonate acid.

3-49
c) Steam Turbine and Auxiliaries
Steam turbine system is composed of steam turbine proper and its auxiliaries (such as condenser, deaerator and
pumps).
An illustration (bird’s eye view) of tandem compound steam turbine, which is expected to be applied to this
project, is shown on the Figure below. The steam turbine is of mixed pressure (Triple pressure levels), reheat
condensing type. Steam exhausted from the high pressure turbine is reheated at the HRSG, and brought back to
the intermediate pressure turbine as an IP steam. Then, the steam is led to the center of the low pressure part from
the intermediate pressure turbine, where it is mixed with LP steam from HRSG. The steam at the outlet of the low
pressure turbine is cooled and condensed at the condenser located under the LP turbine and fed to HRSG as feed
water.
The steam turbine maximum capability shall be defined so as to cope with such parameters as steam pressure,
temperature and flow rate to be developed by the HRSG under conditions where the gas turbine is operated at the
maximum capability ambient temperature.
The steam turbine shall be complete with all auxiliary systems such as a steam condenser, lube oil supply system,
control oil supply system, admission steam stop and throttling valves, governing system, steam bypass system,
turning device, and control and monitoring equipment.
Electro-hydraulic (EH) turbine governor is employed.
The table below shows major specifications of steam turbine for combined cycle application (with J class gas
turbine and shaft arrangement of Type C)
Table 3-10 Major Specifications of Steam Turbine
Item Specification
Type Tandem compound
TC2F
Output 208.5 MW
Steam Conditions
(at turbine inlet)
HP: 16.0 MPa/600 ℃
IP: 3.0 MPa/600 ℃
LP: 0.5 MPa
Speed 3000 rpm
Casings HP-IP: 1(or HP:1, IP:1),
LP: 1
Exhaust Pressure 8.1 kPa
(Source:Prepared by survey team)

3-50
Condenser is of surface, single shell, 1 pass (or 2 pass) type and the figure below shows bird’s eye view of typical
condenser, which is expected to be applied to this project. Titanium or stainless steel will be used as material of
cooling tubes.
Deaerator is of spray and tray, or spray type, whose typical bird’s eye view is shown below.
Table 3-11 Specifications of Turbine Auxiliaries
Item Specification
Condenser Single shell
Deaerator Spray/tray type
Condensate pumps 100%×2
(Source:Prepared by survey team)
Figure 3-15 Bird’s Eye View of Steam Turbine
(Source:Thermal and Nuclear Engineering)

3-51
Table 3-12 Specifications of Condenser
Item Specification
Type Surface, single pressure, single
shell, 1 pass (or 2 pass) type
Condenser Pressure 8.1 kPa
Cooling Tube Material Titanium, or stainless steel
Condenser Supporting
Method
Concrete foundation
Relevant auxiliary Facility On-load condenser tube cleaning
equipment
(Source:Prepared by survey team)
Figure 3-16 Bird’s Eye View of Condenser
(Source:Prepared by survey team)
Expansion Joint
Adaptor
Upper shell
Water box
Flush box
Lower shell

3-52
Figure 3-17 Bird’s Eye View of Deaerator
(Source:Prepared by survey team)
Steam inlet
Spray nozzle
Partition plate
Shell

3-53
d) Generator and Auxiliaries
(i) Generator
The structure of the generator is shown in the Figure 3-18 by a bird's-eye view. This structure is typical structure
based on many experiences in the past.
Figure 3-18 Generator Bird’s Eye View
(Source: prepared by the Survey Team)
(ii) Generator Auxiliary Machines
i) Seal oil system
Seal oil system is to seal hydrogen to cool rotor and core in a generator. The system removes impurities by
vacuum processing from separated oil from lubrication system and supplies oil to seal of generator both sides.
Generator inner pressure difference between hydrogen and seal oil are kept by mechanical differential pressure
control valve. The hydrogen side oil is returned to the lubricant oil system after hydrogen removal at extended
batch and float trap, and mixture the oil of the air side at air extraction tank.

3-54
ii) Cooling system
Stator cooling system is to supply high purity water to stator coil of water cooling. After the water which raised
purity at ion exchange tower is pressurized with a pump, and having cooled off with an air conditioner, it is
controlled to regulated temperature at a temperature control valve. The pure water is transported to stator coil
through the membrane filter. The rotor cooled by hydrogen gas is composed of a hydrogen gas cooler, a hydrogen
gas cylinder storage, etc.
e) Electrical equipment
(i) Outline of electrical system
The Combined Cycle Power Plant (CCPP) consists of two (2) blocks equipped with combined cycle
power generators. Each unit’s electrical system will be designed based on a single shaft configuration
with one (1) generator, one (1) gas turbine (GT) and one (1) steam turbine (ST), as well as one (1)
generator step-up transformer (GST).
In case of Kuantan site, the voltage of the power output generator will be stepped up to 275 kV
utilizing a generator step-up transformer, while in case of Kapar site, the voltage of generator will be
stepped up to 275 or 500 kV utilizing a generator step-up transformer. The output from these
transformers is transmitted to the 275kV or 500 kV switchyards (AIS or GIS).
When the blocks are in operation, the power source to the unit`s auxiliary loads under the 6.3 kV unit
bus will be fed from the unit auxiliary transformer (UAT) and the 275 kV GIS via a start-up auxiliary
transformer (SAT). During unit shut down and start-up, the power source to the unit auxiliary loads
will be fed from the 275 kV GIS via a start-up auxiliary transformer (SAT).
The UAT shall be branched from the IPB, which generates output between a generator and a generator
step-up transformer. The UAT shall be connected to 6.3 kV unit bus 1A (2A) and 1B (2B) via the
circuit breakers. (2A) and (2B) are symbols of unit 2. On the other hand, the SAT shall be connected
to 6.3 kV common buses C and D via the circuit breakers.
Three (3) phases, and three (3) winding-type transformers (split transformers) will be used for the
UAT and SAT. The capacity of each secondary winding is half the kVA capacity of the UAT and SAT.
The auxiliary system and associated equipment shall be designed with flexibility and adequate
redundancy to provide a reliable source of power for all auxiliaries that will be required for the new
plant.
Essential equipment that cannot be permitted to stop during a blackout (such as the bearing oil pump,
seal oil equipment, battery charger, and lighting for emergencies) are supplied with electricity from an
essential switchgear line to which the diesel engine generator will be connected. For the purpose of
plant safety, the diesel engine generator should only be used as a safety stop and not to restart the
plant after a blackout.

3-55
(ii) Generators
i) Generator specifications
An overview of the specifications of the generator is shown in the above item d).
ii) Type of Generator Cooling System
The generators` cooling system shall be a hydrogen gas or air cooled type system. As a result of
recent technological advances that have enhanced cooling performance and windage loss reduction,
an air-cooling system will be adopted for less than 350 MVA class generators. It is not possible to
adopt an air-cooling type system for this project because the generator capacity of this plant is 535 to
596 MVA. As such, it will be necessary to use a hydrogen supply system for generator cooling at this
plant and this shall be included in the Scope of Works by the Contractor.
(iii) Seal oil unit and Hydrogen Supply System
i) Seal Oil unit
The seal oil system for the hydrogen cooling system shall include all pumps, motors, coolers,
detraining tanks, piping, valves and float traps. The system shall be configured to automatically
maintain the oil at the shaft seals at a pre-set positive pressure above that of the hydrogen in the stator
casing. Oil drains from the hydrogen side seals shall be collected in detraining tanks. A seal oil local
control panel shall also be provided.
The generator shall have shaft seals at both ends to prevent hydrogen leaking from the stator casing
through the circumferential clearances between the casing end shields and the shaft.
The normal seal oil pump shall be driven by an AC motor. A separate full duty AC motor driven
standby pump and DC motor driven emergency pump shall also be provided.
ii) Hydrogen Supply System
A complete hydrogen gas supply system shall be provided for the hydrogen cooled generator.
The equipment shall include circulating fans, gas leakage measurement equipment, hydrogen coolers,
all piping, valves, and control and indicating devices for filling the generator with hydrogen. The
system shall also automatically maintain the correct stator gas pressure, purity and humidity levels
during operation.
The automatic gas dryer shall continuously dry the hydrogen.
The hydrogen control panel and associated instrumentation for controlling and continuously
monitoring the hydrogen coolant shall be furnished for the generator. The panel shall be furnished
complete with all the necessary regulating and controlling devices, indicators, alarms, purity,
temperature and pressure gauges and recorders, etc.
A hydrogen generation plant shall be set up (if required). In addition to the hydrogen generator
control panel, gas canisters, and gas cansiter rack to store the gas canisters shall also be provided.

3-56
iii) Carbon Dioxide (CO2) Supply System
A carbon dioxide supply manifold, pipes and valves shall also be furnished for the complete purging of
air or hydrogen gas from the hydrogen cooled generator. Gas canisters and gas cansiter rack shall also
be provided.
(iv) Excitation System
i) Exciter
The generator will be provided with a thyristor static excitation system, which will make it possible to
provide a full ceiling voltage (either positive or negative) almost instantaneously in the event of
disruptions to the system.
The excitation system includes necessary components such as an excitation transformer, a field circuit
breaker, and an initial excitation device.
For the static thyristor exciter arrangement, the excitation transformer shall be branched from the
generator’s main circuit and thus the supply of power from any other power source shall not be
allowed.
ii) Automatic Voltage Regulator System
The automatic voltage regulator (AVR) shall be of an immediate response excitation type regulator
and will utilize a dual system microprocessor. The AVR device should be installed in an
air-conditioned room. The AVR functions shall include the following:
Automatic voltage regulator (90R)
Field voltage regulator (70R)
Over excitation limiter (OEL)
Under excitation limiter (UEL)
Power system stabilizer (PSS)
Automatic reactive power regulator (AQR)
Automatic power factor regulator (APFR)
Manual voltage regulator (MVR)
Other necessary functions
(v) Generator main circuit
i) Isolated Phase Bus (IPB)
The IPB duct should be a self-cooling design capable of carrying the maximum generator rating while
continuously limiting any increase in the bus temperature to 65deg.
A sunshade should be installed so that any part of the IPB that is outdoors can suppress any rise in
heat due to the sun.
Automatic condensation draining facilities shall also be provided.

3-57
ii) Bushing Current Transformer
A current transformer for control, regulation, protection and metering of the generator should be
provided in the generator stator terminal bushing both on the lines and on neutral sides.
The CT for metering shall be of accuracy class 0.2. The current rating on the secondary side shall be
one (1) A.
iii) Voltage transformer (VT) and surge absorber (SA)
An Instrument Voltage Transformer(VT)and a Surge Absorber (SA) (arrestor & condenser) shall be
installed between the generator and generator step-up transformer. These should be installed in an
independent cubicle. The VT used for metering, including the watt-hour meter, shall be of accuracy
class 0.2. The surge condenser capacity shall be as recommended by the generator manufacturer.
iv) Earthing Switch (ES)
An Earthing Switch for the generator circuit shall be installed in the VT/SA cubicle.
The closing minimum requirement of the generator’s earthing switch is non-voltage of the generator,
release of the generator’s circuit breaker, and the release of the incoming circuit breaker of the unit
bus.
v) Generator Neutral Grounding
The generator’s neutral point shall connect to a neutral grounding device via one core cable. The
generator’s neutral grounding systems will consist of a resistor or a single phase transformer plus a
resistor. Selection of grounding system, appropriate current and resistance values will follow the
generator manufacturer’s recommendation.
(vi) Transformers
i) Generator Step-up Transformer
Generator Step-up Transformer (GST) shall be three-phase in a single tank, two windings, 50 Hz,
outdoor, oil-immersed type. GST shall provide an off-load tap changer.. The cooling type shall be the
oil natural air forced and oil forced air forced type (ONAF/OFAF). The phase connection shall be
YNd11. The GST for unit-1 shall step up from generator voltage (21.0 kV) to transmission line voltage
(330 kV). The GST for unit-2 shall step up from generator voltage (21.0 kV) to transmission line
voltage (220 kV). A current transformer (CT) will be installed in the transformer for protection and
measurement.
As for the rated capacity of the transformer, a reasonable value will be selected based on IEEE
C57.91-95.
Connection method:
Low voltage side (generator side): by Isolated phase bus (IPB)
High voltage side (switchyard side): by high voltage XLPE cable
Neutral point: direct grounding

3-58
ii) Unit Auxiliary Transformer
The Unit Auxiliary Transformer (UAT) shall step down from the generator voltage (21.0 kV) to
medium voltage unit bus A and B (6.3 kV).
The unit auxiliary transformer shall be three-phase in a single tank, three windings, 50 Hz, outdoor,
oil-immersed type. UAT shall provide an on-load tap changer. Each secondary winding will have the
same capacity. The cooling type shall be the oil natural air natural (ONAN) type. The phase
connection shall be Dyn1.
Neutral point shall be resistance grounding.
iii) Start-up Auxiliary Transformer
The Start-up Auxiliary Transformer (SAT) shall step down from the 220kV to medium voltage
common bus C and D (6.3 kV).
The start-up auxiliary transformer shall be three-phase in a single tank, three windings, 50 Hz, outdoor,
oil-immersed type. SAT shall provide an on-load tap changer. Each secondary winding will have the
same capacity. The cooling type shall be the oil natural air natural (ONAN) type. The phase connection
shall be Yyn0d11.
Neutral point of high voltage winding shall be direct grounding and neutral point of low voltage
winding shall be resistance grounding.
iv) Two (2) winding transformer and three (3) winding transformer
A 6.3kV system is planned by 2 group composition.
The secondary transformer side of the UAT or SAT will be connected to a 6.3kV Bus line through a
breaker: the system will have two circuits connecting the 3 winding transformer from the two
secondary windings to the the 6.3kV bus.
In general, with a 3 winding transformer, the capacity of the secondary winding is half that of a 2
winding transformer, and the impact of any short-circuit current in the event of a short-circuit accident
at the 6.3kV bus is limited.
When a reduction in the size of the secondary transformer side circuit and other factors are considered,
the cost of both transformers become almost equivalent, although it cost slightly more to manufacture
a 3 winding type transformer.
Consequently, for the project, a 3 winding transformer will be selected.
Figure 3-19 shows the Outline of a 3 and a 2 winding transformer

3-59
Figure 3-19 Outline of 3 and 2 Winding Transformer
(Source:Survey team)
(vii) Unit Electric Supply
The unit electric supply shall be configured from the unit auxiliary transformer (UAT) and the starting
auxiliary transformer (SAT). The equipment used for power plant operation shall be powered from the
unit transformer. The equipment used for common equipment and balance of plant (BOP) equipment
shall be powered from the starting auxiliary transformer system.
During power plant start-up or shutdown, the unit electric power will be supplied from the starting
auxiliary transformer via a bus-tie breaker with 6.3kV switchgear.
Moreover, as an electric power source for emergencies, one (1) set of three (3) phase diesel engine
generators will be installed for the power plant, and this will enable the plant to obtain safe electricity
upon the total cessation of the operation of the power plant.
i) MV Switchgear
A 6.3 kV unit MV switch gear shall supply necessary auxiliary power for plant operation.
The design of the 6.3kV unit bus shall be based on the two configurations of 1A (2A) and 1B (2B).
The unit auxiliary transformer shall step-down from the generator voltage (21.0 kV) to the unit bus
voltage of 6.3kv. The start-up auxiliary transformer shall step-down from transmission line voltage
(220 kV) to common bus C and D voltage of 6.3kv.
Unit buses 1A (2A)/1B (2B) and C/D shall be connected via a bus-tie circuit breaker and a disconnect
switch.
The bus-tie circuit breaker shall be installed on the common bus side. The bus-tie disconnect switch
shall be installed on the unit bus side.
In general, the bus-tie circuit breaker shall remain open and the disconnect switch shall remain closed.
The bus-tie breaker shall close whenever a generator trip occurs or the voltage of the unit bus is lost.
The common bus C/D will then supply electric power to unit bus 1A (2A)/ 1B (2B).
The type of circuit breakers shall be a 7.2kV Vacuum Circuit Breaker (VCB) or a SF6 Gas Circuit
Breaker (GCB). The insulation type shall be air insulation or solid insulation.
ii) 400v Low Voltage Switchgear
The transformers which can step down to 400V from 6.3kV are equipped with a low voltage
3 winding transformer 2 winding transformer
6.3 kV 6.3 kV
Impedance Impedance

3-60
switchgear. The low voltage switchgear transformers shall be dry-type transformers such as cast resin
type transformers and shall be installed indoors. Neutral point of the transformer shall be grounded
directly.
The low voltage auxiliary power of the plant shall consist of the unit low voltage switchgear buss,
essential switchgear buss, common switchgear buss and balance of plant low voltage switchgear buss.
The low voltage switchgear shall be configured with a three (3) phase four (4) wire system. The type
of circuit breakers shall be air circuit breakers (ACB). For the motor the ACBs shall be the three (3)
poles type and for the four (4) wire system the ACBs shall be the four (4) poles type.
iii) 400 V Motor Control Center
The MCC supplies power to the small electric motors and 400 V or 230 V power to the plant. The bus
lines are of 3-phase, 4-wire type. Buses are formed with the line bus (L1, L2, and L3) and neutral bus
(N). The 230 V single-phase loads are supplied from power between the neutral line and phase lines.
The switchgear shall be of a drawer type.
iv) 220 V DC Supply System
The 220 V DC supply system shall have battery equipment and the DC load shall be supplied by the
power from the DC distribution board. The plant can stop safely using DC power from the battery
whenever there is a blackout. It will therefore be necessary to install two battery chargers with a
capacity of 100%. One battery charger shall connect to the essential BUB and one more set will be
connected to the common bus.
The DC supply system shall provide a silicon dropper for voltage control during boost charge of the
battery.
v) Uninterruptible Power System
The uninterruptible power system (UPS) shall be able to supply continuous AC power to the essential
loads. The UPS shall be supplied with an AC supply source and a 220 V DC supply system. UPS will
be connected to the output of battery charger without a silicon dropper.
vi) Emergency Diesel Generator Equipment
The plant shall have at least one (1) emergency diesel generator. It shall be capable of supplying
emergency power from the emergency diesel generator equipment. Emergency AC power shall be
supplied from the emergency diesel generator to the unit 400 V essential buses of unit-1 & unit-2 and
to the common essential bus.
vii) Site Grounding
IEEE-80 recommendations shall be used to determine grounding system requirements for this plant.
The entire ground grid system shall exclusively utilize copper conductors with exothermic
connections for in-ground connections.
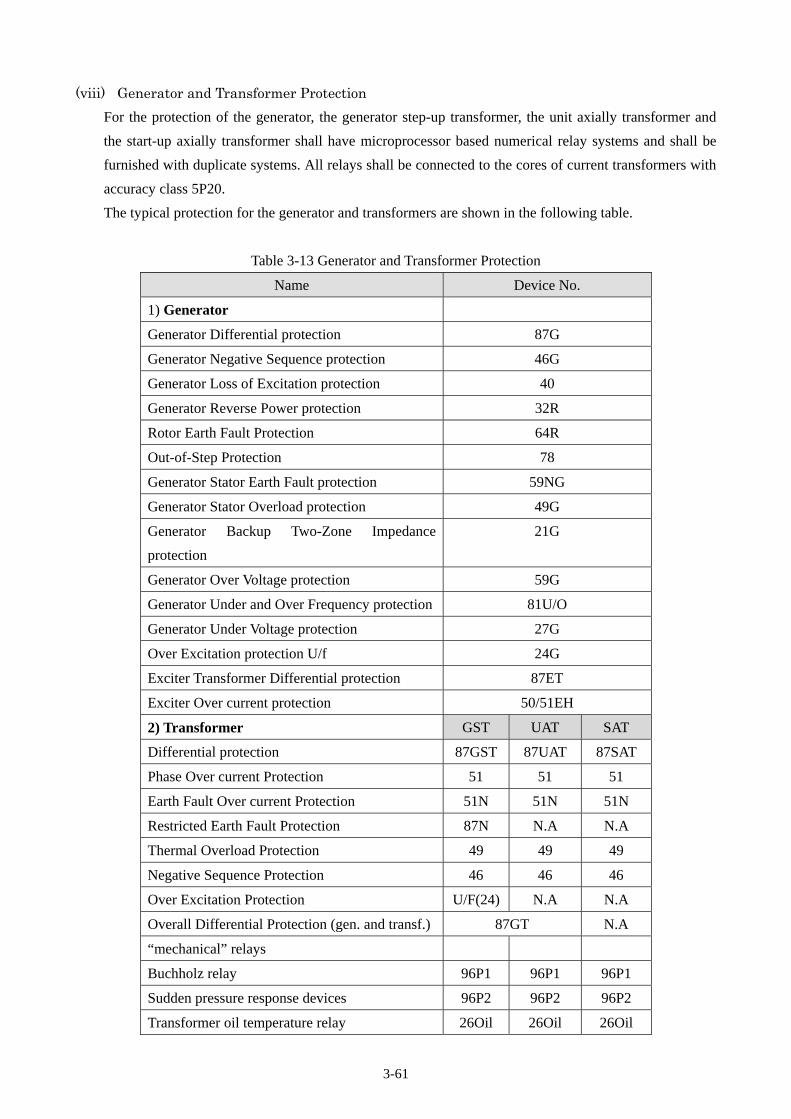
3-61
(viii) Generator and Transformer Protection
For the protection of the generator, the generator step-up transformer, the unit axially transformer and
the start-up axially transformer shall have microprocessor based numerical relay systems and shall be
furnished with duplicate systems. All relays shall be connected to the cores of current transformers with
accuracy class 5P20.
The typical protection for the generator and transformers are shown in the following table.
Table 3-13 Generator and Transformer Protection
Name Device No.
1) Generator
Generator Differential protection 87G
Generator Negative Sequence protection 46G
Generator Loss of Excitation protection 40
Generator Reverse Power protection 32R
Rotor Earth Fault Protection 64R
Out-of-Step Protection 78
Generator Stator Earth Fault protection 59NG
Generator Stator Overload protection 49G
Generator Backup Two-Zone Impedance
protection
21G
Generator Over Voltage protection 59G
Generator Under and Over Frequency protection 81U/O
Generator Under Voltage protection 27G
Over Excitation protection U/f 24G
Exciter Transformer Differential protection 87ET
Exciter Over current protection 50/51EH
2) Transformer GST UAT SAT
Differential protection 87GST 87UAT 87SAT
Phase Over current Protection 51 51 51
Earth Fault Over current Protection 51N 51N 51N
Restricted Earth Fault Protection 87N N.A N.A
Thermal Overload Protection 49 49 49
Negative Sequence Protection 46 46 46
Over Excitation Protection U/F(24) N.A N.A
Overall Differential Protection (gen. and transf.) 87GT N.A
“mechanical” relays
Buchholz relay 96P1 96P1 96P1
Sudden pressure response devices 96P2 96P2 96P2
Transformer oil temperature relay 26Oil 26Oil 26Oil

3-62
Name Device No.
HV winding temperature relay 26WH 26WH 26WH
LV winding temperature relay 26WL 26WL 26WL
Protection of the tap changer N.A 63OLTC 63OLTC
(Source:Survey team)
(ix) Communication System
A communication system will be constructed to facilitate the management and supervision of the power
plant.
i) Telephone Facility
A cordless telephone network shall be prepared for plant yard connection. A private branch exchange
(PBX) shall be installed and the PBX will be used to connect to a public telephone network and for
internal calls.
ii) CCTC System
CCTV (closed-circuit television) equipment shall be installed for remote monitoring of device
operation and to enhance yard security. The equipment shall use color cameras and offer the following
functions: nighttime monitoring, zoom function, tilt function, and automatic and manual focus
adjustment function. The monitor screens are to be installed in the central control room and the
security office.
iii) Clock Device
Clock equipment equipped with a GPS (global positioning system) shall be installed.
The DCS and the major control devices are to be made synchronous with the clock.
Synchronization with the SCADA system is also taken into consideration.
iv) Public Address System
A public address system with microphone stations to be used for normal paging to certain selected
areas shall be provided. Paging can be established through a paging microphone and the areas to be
served can be selected through zone selector switches or push buttons with indicating lights.
v) Radio Paging System
A complete land mobile radio telephone system for general plant communications, including a base
station transceiver and mobile transceivers shall be provided.
(x) Cable and Cable way
i) Cable
Power cables will use XLPE of a copper conductor and control cables will use the vinyl insulation

3-63
vinyl sheath cable of a copper conductor.
A cable made of armor wire of a nonmagnetic material is used for the HV cable of a single core. Fiber
optical cable should be enclosed in an armor cable or should be laid in a protective tube.
ii) Cableway
A cableway uses a tray and/or a conduit pipe. The optimal capacity and route of the cableway will be
selected based on the construction method and the site condition. The conduit pipes are still pipes,
PVC pipes, concrete pipes or ceramic pipes. Asbestos pipe shall not be used.
f) Instrument & Control System
(i) Basic concept
Start, stop and normal operation of the plant is operated by the minimum number of staff in the central
control room.
All necessary plant operation information is constantly monitored at the operator station of central
control room.
Large-scale screen is not but can be installed in the central control room. The reason is appropriate
number of operator station is installed in the central control room including the operator station for
exclusive use of the leader.
Minimum hardware controller as the urgent operation of the plant is installed.
At the time of accident of main and auxiliary equipment, runback to low load or safely stop without
needing the regulated manual operation will start.
(ii) Automation
i) Plant automatic start
The plant start is automated. But manual operation is necessary at plant cold start operations (electrical system,
completion of each system finishing) and at the time of operations such as the following examples.
Circulating water system
Auxiliary steam system
Closed cooling water system
Compressed air system
Turbine oil system
Turbine turning system
Generator seal oil system
Generator hydrogen system
Waste water system
Manual operation is usually not required at the time of warm and hot start.

3-64
ii) Plant normal operation
The test operation for check of the important equipment is conducted by the manual start operation from central
control room. Each test operation is conducted in response to the manual start order sequentially.
(Example)
Turbine main valve closing test
Turbine emergency oil pump start test
iii) Plant automatic shutoff
The automation range at the time of the plant stop is from normal operation to a condensate pump stop, and
meanwhile, the manual operation does not need.
At a long term maintenance stop by the plan of customer, manual operations are necessary such as the following
example after automatic shut off.
(Example)
Circulate water system
Vacuum break
Auxiliary steam system
Closed cooling water system
Compressed air system
Turbine oil system
Turbine turning system
Generator seal oil system
Generator hydrogen system
iv) Trip Interlock
Boiler, turbine and generator tripping interlock concept is shown in Table 3-13.

3-65
Table 3-13 Tripping interlock concept
Event Concept
Gas Turbine
Failure
Gas turbine will be tripped immediately by shutting-off of the fuel shut
off valve. Turbine will be concurrently tripped to prevent the wet steam
due to the tripping of the boiler by gas turbine trip signal.
Turbine Failure Turbine will be tripped immediately by closing of the turbine valves, and
the bypass system will be activated. However, if the bypass system is not
activated, Boiler will be tripped immediately.
By Turbine trip, the Generator will be concurrently tripped, which means
the simultaneous opening of both generator circuit breaker and excitation
field.
Generator failure Generator will be immediately tripped by the simultaneous opening of
both generator circuit breaker and excitation field switch, and Turbine
will be concurrently tripped for stopping generator and preventing the
extended accident.
Grid failure Disconnecting from the grid, the plant will reduce the load to minimum
load by using the bypass system and continue the island operation.
(Source: prepared by the Survey Team)
g) Fuel (Natural Gas) Supply
There are existing gas pipe lines near the both candidate sites of Kapar and Kuantan, and fuel gas can be supplied
to new CCPPs by installing new gas pipeline branched at existing gas pipeline to new CCPP.
(i) Kapar site
Kapar site is located near existing Kapar coal fired power station (Former Port Klang power station on Fig. 3-16).
There is existing gas pipeline led to existing Kapar coal fired power station and there is existing gas metering
station near existing Kapar coal fired power station. Gas supply to the candidate Kapar site could be available by
branching new gas pipeline from existing gas pipeline to existing Kapar coal fired power station to the candidate
site. New gas metering station will be installed near the new Kapar CCPP site, or existing gas metering station
may be modified to supply additional gas to the new Kapar CCPP sit.

3-66
Figure 3-20 Gas Supply Pipeline to Kapar Site
(Source:Google earth, added by survey team)
(ii) Kuantan Site
There is existing gas pipeline near the candidate Kuantan site, which runs 1.71 km apart from the proposed site.
Gas supply to the candidate Kuantan site could be available by branching new gas pipeline from existing gas
pipeline. New gas metering station will be installed at the branch point of the existing gas pipeline, or it could be
installed near the new Kuantan CCPP site, which will be finally determined at design and construction stage,
taking TNB’s intention into consideration.
Existing gas pipeline
Existing gas metering station
New gas pipeline
New gas metering station
Identified site for power plant

3-67
Figure 3-21 Gas Supply Pipeline to Kuantan Site
(Source:Google earth, added by survey team)
(iii) Chemical composition, pressure, temperature and flow of natural at terminal point
Chemical composition, pressure, temperature and flow of natural gas at terminal point are confirmed as follows
and it can be applicable to gas turbines proposed as fuel gas.
Table 3-14 Characteristics of Natural Gas
(Source:Prepared by survey team)
New gas pipeline
Existing gas pipeline
New gas metering station

3-68
Required natural gas pressure at the inlet of the candidate gas turbines for new CCPP is expected to be around 5
MPa (The required gas pressure may differ by manufacturer and type of gas turbine) and gas compressors may be
necessary to be installed, to boost up the gas pressure at the terminal point.
Natural gas flow to the candidate gas turbines for new CCPP is expected to be maximum 193 MMSCFD. (This
flow may differ by manufacturer and type of gas turbine). This flow of natural gas required to new CCPP is
considered to be supplied by Petronas through existing PGU pipeline system.
h) Common facilities
(i) Compressed Air System
The compressed air can be classified into control air and service air. The control air is supplied to the drive
sources for air operated control valves and other air operated control devices. The control air should be oil-free
in conformance with the international standards. Service air is used for sealing, cleaning and maintenance of
plant auxiliaries. The following shows a schematic diagram of Compressed air system.
Figure 3-22 Schematic diagram of compressed air facility system
(Source:Prepared by survey team)
(ii) Fire fighting system
The facilities such as gas turbine, steam turbine, HRSG, generator, transformer, fuel system and facilities designed
to handle hazardous materials should be provided with fire hydrants, fixed fire extinguish systems, fire alarm
and detectors. Fire fighting system is designed and constructed to comply with relevant Malaysian regulations and
in accordance with international standards such as National Fire Protection Association (NFPA). The central
control room should be provided with fire protection and fire alarm panels in order to ensure centralized
monitoring of the fire extinguishing/preventing/monitoring equipment. The following shows a schematic diagram
of Fire fighting system.

3-69
Figure 3-23 Schematic diagram of Fire fighting system
(Source:Prepared by survey team)
(iii) Water Treatment and Waste Water Treatment System
Raw water or city water supplied to CCPP are treated by water treatment system to be used as water required for
station services of CCPP, such as make up water to HRSG, make up water for auxiliary cooling water system,
service water for washing and maintenance of facilities, fire fighting water, potable water and sanitary water. The
water treatment system would consist of pre-treatment system, filtered water tank, demineralization plant and
potable water system. Raw water supplied to CCPP at the terminal point is coagulated and sedimented, as
necessary, to obtain filtered water that will be used as service water and fire fighting water. Filtered water is
treated by demineralization plant through ion exchange process which produces demineralized water to be
supplied as make up water to HRSG, make up water for auxiliary cooling water system and other requirements.
Details of water treatment system will be determined at detail design stage considering quality of supplied raw
water and required water quantity and quality of the CCPP.
Figure below shows conceptual process of water treatment system.

3-70
Figure 3-24 Conceptual Process of Water Treatment System
(Source:Prepared by survey team)
Effluent discharged from the processes of CCPP is treated by waste water treatment system to fulfil environmental
requirement stipulated by relevant regulations at discharge point of CCPP boundary. The waste water treatment
system would consist of waste water pond, coagulation and sedimentation pond, filters, neutralization pond,
sludge thickener and dehydrator.
Details of waste water treatment system will be determined at detail design stage considering quality, quantity and
frequency of effluents from CCPP and requirement of environmental regulations.
Figure below shows conceptual process of waste water treatment system.
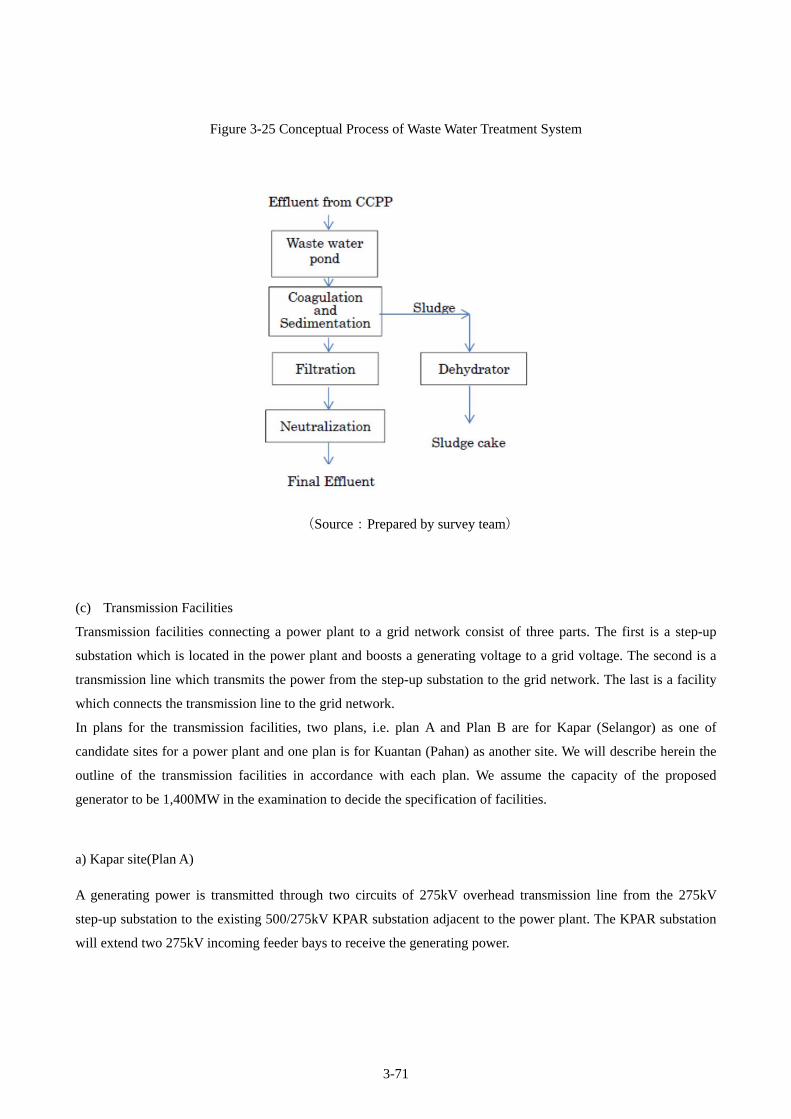
3-71
Figure 3-25 Conceptual Process of Waste Water Treatment System
(Source:Prepared by survey team)
(c) Transmission Facilities
Transmission facilities connecting a power plant to a grid network consist of three parts. The first is a step-up
substation which is located in the power plant and boosts a generating voltage to a grid voltage. The second is a
transmission line which transmits the power from the step-up substation to the grid network. The last is a facility
which connects the transmission line to the grid network.
In plans for the transmission facilities, two plans, i.e. plan A and Plan B are for Kapar (Selangor) as one of
candidate sites for a power plant and one plan is for Kuantan (Pahan) as another site. We will describe herein the
outline of the transmission facilities in accordance with each plan. We assume the capacity of the proposed
generator to be 1,400MW in the examination to decide the specification of facilities.
a) Kapar site(Plan A)
A generating power is transmitted through two circuits of 275kV overhead transmission line from the 275kV
step-up substation to the existing 500/275kV KPAR substation adjacent to the power plant. The KPAR substation
will extend two 275kV incoming feeder bays to receive the generating power.

3-72
(i) Step-up substation
The 275kV substation is formed to be outdoor type air insulated switchgear (AIS) and the busbar formation is 1.5
circuit breakers. It has two 275kV outgoing feeder bays. Figure 3-26 shows single line diagram of the step-up
substation. Since there are two generator units, two sets of a step-up oil-filled transformer are installed and six gas
circuit breakers (GCBs) are installed also.
Figure 3-26 Single line diagram of the step-up substation at Kapar site(Plan A)
(Source: Survey Team)
Table 3-15 shows the specifications of main facilities of the step-up substation.
Table 3-15 The specifications of main facilities of the step-up substation at Kapar site (Plan A)
Oil-filled transformer
Primary voltage(kV) 20
Secondary voltage(kV) 275
Capacity(MVA) 750
GCB
Rated voltage(kV) 275
Rated continuous current(A) 4,000
Rated breaking current(kA) 50
(Source: Survey Team)

3-73
(ii) Transmission Line
i) Specification
The specifications of the transmission line between the step-up substation and the existing KPAR substation are
shown in the following table.
Table 3-16 Outline of Specifications of Transmission Line Components at Kapar Site (Plan A)
Voltage 275 kV
Number of circuits 1 route with 2 circuits
Route length 0.80 km
Supporter type Self-supporting lattice steel tower
with double circuits
Foundation Pad and chimney type or pile
foundation
Insulator Porcelain or Glass
Conductor 4 bundled ACSR ZEBRA
Earthwire ACSR SKUNK and OPGW
(Source: Survey Team)
ii) Design Conditions
Based on TNB design standard, the Survey Team proposes the following basic design conditions for the Project.
Ambient Temperature
Maximum air temperature: 40 0x
Minimum air temperature: 21 1n
Mean air temperature: 32 ºC
Wind Pressure
The following values are based on the wind velocity at 10 m height, and are adjusted according to
the height of the components.
Conductor & earthwire: 430 N/m2
Insulator: 430 N/m2
Tower: 820 N/m2

3-74
Right of Way
20m for each side from the center (40 m in total) *, In the case of a single transmission line without
other parallel transmission lines.
iii) Tower and Foundation
The standard type towers will be generally applied to the new transmission line. In this case, self-supporting
lattice steel tower with double circuits will be applied to the target transmission line. Also, pad and chimney type
as well as pile type are applied according to the foundation loads and bearing capacity at the site.
iv) Insulator
Porcelain or glass insulators are generally applied to 275 kV transmission lines. The specifications of the
insulators for the target transmission line are shown in the following table.
Table 3-17 Specification of Insulators
Type of String Specified
mechanical load
[kN]
Number of discs
[units/string]
Suspension 120 21
Tension 120 21
(Source: TNB)
v) Conductor and Earthwire
The standard type of conductors applied to 275 kV transmission lines are ACSR ZEBRA and the number of
bundles depends on the transmission capacity. In this case, the 4 bundled conductors will be applied. The standard
type of ground wires are ACSR SKUNK and OPGW equivalent to ACSR SKUNK.
Also, the maximum operating temperature of conductors is 75 ºC. Minimum clearances of conductors to the
ground etc. are shown in the following table.

3-75
Table 3-18 Minimum Clearance of Conductor to Ground etc.
Applied area/objects 275 kV
Normal ground 7.31 m
Roads 10 m
To metal clad or roofed buildings, or other buildings or
structures upon which a man may stand 5.18 m
To other electric power line wires (line or earth) 4.57 m
(Source: TNB)
vi) Outline of the Transmission Line Route
The Survey Team conducted the preliminary route study by the field survey and using satellite images (Google
Earth). It was found that some existing transmission lines passed through the area between the step-up substation
and the existing KPAR substation. Therefore, it will be necessary for the new transmission line to cross them.
Although it is assumed that no other critical obstacle exists on the planned route, further detailed study should be
conducted in the detail design stage. The target transmission line is 1 route with 2 circuits and the route length is
approximately 0.80 km.
(iii) Grid connection
Two circuits of the 275kV transmission lines from the power plant are connected to the 275kV incoming bays
which are extended at 500/275kV KPAR substation. KPAR substation is outdoor type AIS and busbar formation is
1.5 circuit breakers at 500kV side and double busbars at 275kV side. Extended 275kV bays shall be outdoor type
and double busbars formation same as existing. Figure 3-27 shows the single line diagram. The extended busbars
shall be directly joined to the existing busbars.
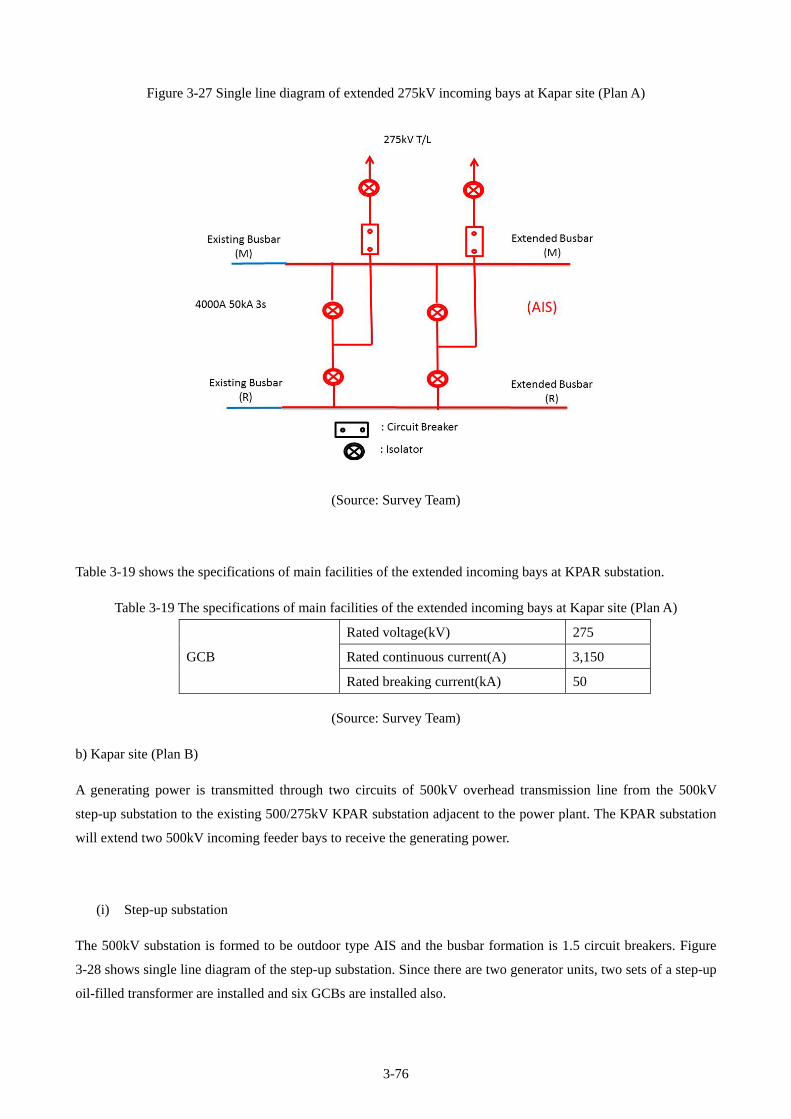
3-76
Figure 3-27 Single line diagram of extended 275kV incoming bays at Kapar site (Plan A)
(Source: Survey Team)
Table 3-19 shows the specifications of main facilities of the extended incoming bays at KPAR substation.
Table 3-19 The specifications of main facilities of the extended incoming bays at Kapar site (Plan A)
GCB
Rated voltage(kV) 275
Rated continuous current(A) 3,150
Rated breaking current(kA) 50
(Source: Survey Team)
b) Kapar site (Plan B)
A generating power is transmitted through two circuits of 500kV overhead transmission line from the 500kV
step-up substation to the existing 500/275kV KPAR substation adjacent to the power plant. The KPAR substation
will extend two 500kV incoming feeder bays to receive the generating power.
(i) Step-up substation
The 500kV substation is formed to be outdoor type AIS and the busbar formation is 1.5 circuit breakers. Figure
3-28 shows single line diagram of the step-up substation. Since there are two generator units, two sets of a step-up
oil-filled transformer are installed and six GCBs are installed also.

3-77
Figure 3-28 Single line diagram of the step-up substation at Kapar site (Plan B)
(Source: Survey Team)
Table 3-20 shows the specifications of main facilities of the step-up substation.
Table 3-20 The specifications of main facilities of the step-up substation at Kapar site (Plan B)
Oil-filled transformer
Primary voltage(kV) 20
Secondary voltage(kV) 500
Capacity(MVA) 750
GCB
Rated voltage(kV) 500
Rated continuous current(A) 4,000
Rated breaking current(kA) 50
(Source: Survey Team)

3-78
(ii) Transmission Line
i) Specification
The specifications of the transmission line between the step-up substation and the existing KPAR substation are
shown in the following table.
Table 3-21 Outline of Specifications of Transmission Line Components at Kapar Site (Plan B)
Voltage 500 kV
Number of circuits 1 route with 2 circuits
Route length 0.63 km
Supporter type Self-supporting lattice steel tower
with double circuits
Foundation Pad and chimney type or pile
foundation
Insulator Porcelain or Glass
Conductor 4 bundled ACSR CURLEW
Earthwire ACSR SKUNK and OPGW
(Source: Survey Team)
ii) Design Conditions
Based on TNB design standard, the Survey Team proposes the following basic design conditions for the Project.
Ambient Temperature
Maximum air temperature: 40 ºC
Minimum air temperature: 21 ºC
Mean air temperature: 32 ºC
Wind Pressure
The following values are based on the wind velocity at 10 m height, and are adjusted according to
the height of the components.
Conductor & earthwire: 430 N/m2
Insulator: 430 N/m2
Tower: 820 N/m2
Right of Way
25 m for each side from the center (50 m in total) * In the case of a single transmission line without
other parallel transmission lines.

3-79
iii) Tower and Foundation
The standard type towers will be generally applied to the new transmission line. In this case, self-supporting
lattice steel tower with double circuits will be applied to the target transmission line. Also, pad and chimney type
as well as pile type are applied according to the foundation loads and bearing capacity at the site.
iv) Insulator
Porcelain or glass insulators are generally applied to 500 kV transmission lines. The specifications of the
insulators for the target transmission line are shown in the following table.
Table 3-22 Specification of Insulators
Type of String Specified
mechanical load
[kN]
Number of discs
[units/string]
Suspension Top and middle phase 160 23
Bottom phase 160 25
Tension 160 or 210 25
(Source: TNB)
v) Conductor and Earthwire
The standard type of conductors applied to 500 kV transmission lines are 4 bundled ACSR CURLEW. The
standard type of ground wires are ACSR SKUNK and OPGW equivalent to ACSR SKUNK.v
Also, the maximum operating temperature of conductors is 75 ºC. Minimum clearances of conductors to the
ground etc. are shown in the following table.
Table 3-23 Minimum Clearance of Conductor to Ground etc.
Applied area/objects 500 kV
Normal ground 10 m
Roads 12 m
To metal clad or roofed buildings, or other buildings or
structures upon which a man may stand 6 m
To other electric power line wires (line or earth) 6 m
(Source: TNB)

3-80
vi) Outline of the Transmission Line Route
Based on the transmission line route plan from TNB, the Survey Team conducted the preliminary route study by
the field survey and using satellite images (Google Earth). It was found that an existing transmission line passed
through the area between the step-up substation and the existing KPAR substation. Therefore, it will be necessary
for the new transmission line to cross it. Although it is assumed that no other critical obstacle exists on the
planned route, further detailed study should be conducted in the detail design stage. The target transmission line is
1 route with 2 circuits and the route length is approximately 0.63 km.
(iii) Grid connection
Two circuits of the 500kV transmission lines from the power plant are connected to the 500kV incoming bays
which are extended at 500/275kV KPAR substation. KPAR substation is outdoor type AIS and busbar formation is
1.5 circuit breakers at 500kV side and double busbars at 275kV side. Extended 500kV bays shall be outdoor type
and 1.5 circuit breakers formation same as existing. Figure 3-29 shows the single line diagram. The extended
busbars shall be directly joined to the existing busbars.
Figure 3-29 Single line diagram of extended 500kV incoming bays at Kapar site (Plan B)
(Source: Survey Team)

3-81
Table 3-24 shows the specifications of main facilities of the extended incoming bays at KPAR substation.
Table 3-24 The specifications of main facilities of the extended incoming bays at Kapar site (Plan B)
GCB
Rated voltage(kV) 500
Rated continuous current(A) 4,000
Rated breaking current(kA) 50
(Source: Survey Team)
c) Kuantan site
A generating power is transmitted through four circuits of 275kV overhead transmission line on quad tower from
the 275kV step-up substation to a newly installed 275kV switching station. Moreover, the power is transmitted
through four circuits of 275kV overhead transmission line on separate dual tower from the 275kV switching
station to the existing 275kV overhead transmission lines. The existing 275kV transmission lines are divided into
two transmission lines at the connecting point. The 275kV transmission lines from the switching station are
respectively connected to the existing 275kV transmission line. It means that each of divided 275kV transmission
lines is connected to the power plant. Figure 3-30 shows power flow at Kuantan site.
The scope of work under the project is upto a power plant and a step-up substation. However, we examine
including transmission lines, a switching station and a grid connection for the confirmation of the stability of
power supply.

3-82
Figure 3-30 Power flow at Kuantan site
(Source: Survey Team)
(i) Step-up substation
The substation is formed to be outdoor type gas insulated switchgear (GIS) and functioned as a 275/132 kV main
grid substation in addition to a step-up substation. The busbar formation is double busbars for both 275kV side
and 132kV side. Figure 3-31 shows single line diagram of the step-up substation. Since there are two generator
units, two sets of step-up oil-filled transformer are installed and twelve 275kV circuit breakers, ten 132kV circuit
breakers and two sets of 275/132kV oil-filled transformer are installed also. Table 3-25 shows the specifications of
main facilities of the step-up substation.

3-83
Figure 3-31 Single line diagram of the step-up substation at Kuantan site
(Source: Survey Team)
Table 3-25 The specifications of main facilities of the step-up substation at Kuantan site
Oil-filled transformer
(for step-up)
Primary voltage(kV) 20
Secondary voltage(kV) 275
Capacity(MVA) 750
Oil-filled transformer
Primary voltage(kV) 275
Secondary voltage(kV) 132
Capacity(MVA) 240
Circuit breaker (GIS)
Rated voltage(kV) 275
Rated continuous current(A) 4,000/1,600
Rated breaking current(kA) 50
Circuit breaker (GIS)
Rated voltage(kV) 132
Rated continuous current(A) 3,150/1,600
Rated breaking current(kA) 31.5
(Source: Survey Team)

3-84
(ii) Transmission Line
i) Specification
The specifications of the transmission line between the step-up substation and the planned switching station, and
that between the planned switching station and the existing TKLG - GBID transmission line are shown in the
following table.
Table 3-26 Outline of Specifications of Transmission Line Components at Kuantan Site
Transmission line between step-up
substation and switching station
Transmission line between switching
station and TKLG – GBID
transmission line
Voltage 275 kV 275 kV
Number of
circuits
1 route with 4 circuits 2 routes with 2 circuits
Route
length
6.93 km 5.0 km
Supporter
type
Self-supporting lattice steel tower
with quadruple circuits
Self-supporting lattice steel tower with
double circuits
Foundation Pad and chimney type or pile
foundation
Pad and chimney type or pile
foundation
Insulator Porcelain or Glass Porcelain or Glass
Conductor 3 bundled ACSR ZEBRA 3 bundled ACSR ZEBRA
Earthwire ACSR SKUNK and OPGW ACSR SKUNK and OPGW
(Source: Survey Team)
ii) Design Conditions
Based on TNB design standard, the Survey Team proposes the following basic design conditions for the Project.
Ambient Temperature
Maximum air temperature: 40 ºC
Minimum air temperature: 21 ºC
Mean air temperature: 32 ºC
Wind Pressure
The following values are based on the wind velocity at 10 m height, and are adjusted according to
the height of the components.

3-85
Conductor & earthwire: 430 N/m2
Insulator: 430 N/m2
Tower: 820 N/m2
Right of Way
20 m for each side from the center (40 m in total) * In the case of a single transmission line without
other parallel transmission lines.
iii) Tower and Foundation
The standard type towers will be generally applied to the new transmission line. In this case, self-supporting
lattice steel tower with quadruple circuits will be applied to the transmission line between the step-up substation
and the planned switching station. Meanwhile, the tower with double circuits will be applied to the transmission
line between the planned switching station and the existing TKLG - GBID transmission line. Also, pad and
chimney type as well as pile type are applied according to the foundation loads and bearing capacity at the site.
iv) Insulator
Porcelain or glass insulators are generally applied to 275 kV transmission lines. The specifications of the
insulators for the target transmission line are shown in the following table.
Table 3-27 Specification of Insulators
Type of String Specified
mechanical load
[kN]
Number of discs
[units/string]
Suspension 120 21
Tension 120 21
(Source: TNB)
v) Conductor and Earthwire
The standard type of conductors applied to 275 kV transmission lines are ACSR ZEBRA and the number of
bundles depends on the transmission capacity. In this case, the 3 bundled conductors will be applied. The standard
type of ground wires are ACSR SKUNK and OPGW equivalent to ACSR SKUNK. The specifications of the
conductors for the target transmission line are shown in the following table.
Also, the maximum operating temperature of conductors is 75 ºC. Minimum clearances of conductors to the
ground etc. are shown in the following table.

3-86
Table 3-28 Minimum Clearance of Conductor to Ground etc.
Applied area/objects 275 kV
Normal ground 7.31 m
Roads 10 m
To metal clad or roofed buildings, or other buildings or
structures upon which a man may stand 5.18 m
To other electric power line wires (line or earth) 4.57 m
(Source: TNB)
vi) Outline of the Transmission Line Route
Based on the transmission line route plan from TNB, the Survey Team conducted the preliminary route study by
the field survey and using satellite images (Google Earth). As a result, it is assumed that no critical obstacle exists
on the planned route. However, further detailed study should be conducted in the detail design stage. The
transmission line between the step-up substation and the planned switching station is 1 route with 4 circuits and
the route length is approximately 6.93 km. Meanwhile, the transmission line between the planned switching
station and the existing TKLG - GBID transmission line is 2 routes with 2 circuits and the route length is
approximately 5.0 km.
(iii) Switching station
A switching station is different from a substation and mainly consists of busbars and switchgears without
transformers converting voltage. This 275kV switching station has switching function for the grid network and the
configuration is eight 275kV feeder bays and one bus-section bay. It is formed outdoor type GIS with a single
busbar formation. Figure 3-32 shows single line diagram of the switching station. One of the purposes to use a
switching station is to improve stability and credibility on the grid by shortening a failure section of transmission
line. Four circuits of the transmission lines on quad towers are divided two sets of two circuits of transmission
lines on dual towers at this place.

3-87
Figure 3-32 Single line diagram of the switching station at Kuantan site
(Source: Survey Team)
Nine circuit breakers are totally installed and Table 3-29 shows the specifications of main facilities of the
switching station.
Table 3-29 The specifications of main facilities of the switching station at Kuantan site
Circuit breaker (GIS)
Rated voltage(kV) 275
Rated continuous current(A) 4,000/1,600
Rated breaking current(kA) 50
(Source: Survey Team)
(iv) Grid connection
The generating power is transmitted through four circuits on quad towers from the step-up substation to the
switching station and through two sets of two circuits on dual towers from the switching station to the connecting
point to the grid. Each circuit on dual towers is directly connected to the existing 275kV TKLG - GBID
transmission lines and the power is provided to the grid. As shown in Figure 4-8, transmission lines between

3-88
TKLG substation and GBID substation are divided into two parts and hereby the generating power is individually
transmitted to each 275kV transmission line. In Figure 3-33, GBPS is a newly installed step-up substation and
GBSS is a newly installed switching station. Besides, Figure 3-33 shows the generating power is provided through
132kV transmission lines from 132kV side of the step-up substation to KMAN substation and GBNG substation
also.
Capacity of the existing 275kV TKLG - GBID transmission lines may be short for this generating power as they
are.
Figure 3-33 Connecting plan of transmission lines at Kuantan site
(Source: TNB)

3-89
(d) Civil engineering facilities
a) Kuantan Site
(i) Topographic and geographical features
i) Topographic features
This site is flat and has an elevation of MSDL + 1.5 through 2.0 meters. On the north of the site, there is a small
river flowing into the ocean from the hinterland.
ii) Geographical features
In terms of geographical features, this area is composed of sandy ground and there is no problem with the
foundation processing and consolidation settlement.
(ii) Front sea area
i) Topographic features of ocean floor
This front sea area has a beautiful coast characterized by an almost straight sandy beach and water of high quality
(without contamination). This coast does not have a gently shelving shallow beach, so the 8-meter deep point is
about 1,000 meters.
ii) Geographical features of ocean floor
Sands are heaped on the surface layer. Geographical features are considered to be characterized by sandy ground.
This must be confirmed in the phase of feasibility study.
(iii) Civil engineering facilities
i) Modification work of the existing river
There is a river that traverses the National Route 3 from the hinterland and flows into the ocean. On the north in
the premises, this river must be modified to run straight. Since the river is under the charge of the Irrigation
Department, this problem must be discussed with the Irrigation Department, regarding the approval and designing
(water channel structure, width and gradient) required for the modification work. In this case, it is necessary to
find out a discharge method that protects the existing coastline against possible deformation due to water
discharge from the river.
ii) Foundation work
In the location of this power plant program, trees will be removed from the ground surface. Relatively
high-quality earth and sand will be used to provide an about 1.5-meter embankment. Since this place is made up
of a sandy ground, there will be a slight land subsidence in the initial stage due to embankment. However, a
long-term consolidation settlement will not occur. Accordingly, there is no need for ground improvement to
provide against possible land subsidence. For the structure formed by digging about 10 meters from the ground
level, however, ground improvement will be required to ensure safety during the work.

3-90
In the foundation of the major structures in the power plant, concrete-made piles will be driven to a depth of about
40 meters. In the foundation of the structures having relatively light weight, concrete-made piles will be driven
to a depth of about 20 meters.
iii) Cooling water intake and discharge system
The site for power plant program is about 100 meters away from the ocean. This is a straight coast. If a
structure such as water intake and discharge facility is built on this coast, the coastline may undergo a change.
To prevent this coastline from being changed, deep water intake will be performed from about 8-meter deep
position, and the water intake pipe will be embedded underground up to the premises of the power plant, so that
the coastline will be kept under the present conditions. Both the water discharge pipe and water intake pipe will
be embedded in the similar manner and deep water intake will be performed from about 5-meter deep position.
Use of this system without any structure being installed on the coastline permits the natural coastline to be
maintained under the present condition.
The depth of 8 meters for water intake is located about 1.0 km from the boundary of the power plant site. The
5-meter depth of the discharge point is considered to be located about 400 meters. The planned outline of this
water intake and discharge facilities is shown in Attached Data - 1 Outline of deep water intake and discharge
facilities.
b) Kapar Site
(i) Topographic and geographical features
i) Topographic features
This site of the power plant is flat and has an elevation of MSDL + 2.0 meters. Palm trees and sugar canes are
planted on the site, which is an arable land. On the west outside the power plant site, there is a water channel
for irrigation. Mangroves grow in the area from this water channel to coastline. On the east of the planned
site, there is an about 4-meter wide farm road.
Adjacent to the coat-fired thermal power plant on the south of this site, there is a river used for irrigation. This
small river provides a boundary for the site to be added. On the north of the site, there is an arable land for
palm and others, similarly to the case of the area inside the site. A raised footpath between rice fields provides
a boundary for the site.
ii) Geographical features
The geographical features in this area are characterized by soft ground.
As viewed from the performances of the existing coal-fired thermal power plant, the soft layer having an N
value = 0 (standard penetration test value) is 20 meters deep from the ground surface, and has a distance of
about 60 meters to reach the bearing layer.
(ii) Front sea area

3-91
i) Ocean floor of topographic features
The front sea area of the planned power plant site consists of a gently shelving shallow coast with an ocean
floor gradient of about 1/300. On the north of the site, this gradient is gentler.
This coast is characterized by great amounts of heaped earth and sand carried from the river. The coal landing
berth of the existing power plant and cooling water intake require large costs to get the water depth.
ii) Geographical features of ocean floor
The surface layer is considered to consist of a silt-mixed soft layer. The bearing layer will be about 60 meters,
as in the case of the land. In the phase of feasibility study, this must be checked by marine boring or the like.
(iii) Civil engineering facilities
i) Ground improvement work
When the power plant is built, an embankment having a thickness of about 3 meters will be provided on his soft
ground in site renovation. This will generate a long-term consolidation settlement. In the existing coal-fired
thermal power plant premises and substation in the planned site, consolidation settlement has occurred. The
amount of this subsidence measures 25 cm through 30 cm. (When the soft layer is 20 meters thick and the
embankment is 2 m through 3 m high, the amount of consolidation settlement is about 25 cm when the power
plant has a life time of 30 years. The amount of final subsidence is estimated at about 90 cm and the time
period is assumed to be 90 years.) This is considered to be the same in this planned site, but ground
improvement work will be required in order to remove the long-term consolidation settlement. This ground
improvement work can be performed by various forms of improvement methods. In the phase of feasibility
study, geographical features will be surveyed. Based on this result, the optimum method for ground
improvement will be determined.
ii) Foundation work
For major structures, the steel pipe piles will be driven about 60 meters up to the bearing ground layer. For the
structures of relatively light weight, concrete-made piles will be driven about 30 meters deep.
For the structures inside the power plant, foundation piles will be driven, so there is no problem. However, the
screen/pump chamber of the circulating water (cooling water) facilities, water intake and discharge canal, water
discharge pipe connection pit and others will be counted as underground structures. To construct these
underground structures, about 8- through 10-meter deep excavation will be essential. This requires ground
improvement work to be executed so that the excavation safety will be ensured.
iii) Cooling water intake and discharge system
Cooling water will be taken from the front sea area. Coastal water intake is accompanied by difficulties on a
gently shelving shallow beach because of drift sands. A deep water intake system will be used for this water
intake. A water intake tower will be installed at a depth of 8 meters and the piping on the ocean floor will be
used to connect with the pump chamber provided in the premises. The distance from the water intake tower to

3-92
the pump chamber is about 2.5 km. Since mangroves grown along the coastline on the gently shelving
shallow beach, surface discharge in the shoreline will not be used to prevent an adverse impact from being
given to the ecosystem. Instead, a deep discharge system (close to a 3-meter discharge speed) where water is
discharged from the water depth of about 5 meters will be adopted. This will minimize the scope of diffusion
of the warm effluent, thereby preventing an adverse impact from being given to the coastline and the existing
thermal power plant water intake.
The location of deep water intake from a depth of 8 meters is about 2.5 km from the boundary of the power
plant premises. The water depth of 5 meters at the discharge point is considered to be about 1.5 km. A
planned outline of this water intake and discharge facilities is illustrated in Attached Data(Attachment-1, the
end of this chapter), Outline of deep water intake and discharge facilities.
(e) Layout plan
Figure 3-34 is an detailed layout plan of Kuantan and Figure 3-35 is an detailed layout plan of Kapar.

3-93
3-93
Figure 3-34 Plant layout of Kuantan Site
(Source: Survey Team)

3-94
3-94
Figure 3-35 Plant Layout of Kapar Site
(Source: Survey Team)

3-95
3) Description of proposed project
This project is intended to build two single-shaft type combined cycle power generation facilities (1000 MW through 1400 MW) based on a state-of-the-art highly efficient gas turbine in Kuantan on the east coast of the Malay Peninsula or Kapar on the west.
Table 3-30 shows the estimated overall project cost.
Table 3-30 Estimated overall project cost
Item Unit Amount
Kuantan Kapar
Power generation facilities and common facilities (civil engineering, water intake and discharge canal, power transmission and transformation facilities, etc.)
Million yen 108,405.0 118,477.8
Reserve fund Million yen 10,840.5 11,847.8
Overall cost Million yen 121,953.7 133,170.5
Unit construction cost Yen/kW 99,165 108,308
US$/kW 839 916
Note: US$1=JP¥118.16 (as of January 15, 2016)
(Source: Survey Team)
4) Problems and solutions in the adoption of proposed technology and system
Use of a combined cycle power generation technology based on the state-of-the-art gas turbine has a great advantage of increasing the plant efficiency. In the meantime, some of these gas turbines have not yet registered numerous operation records by the very nature of being state-of-the-art products, and are not sufficient in terms of equipment reliability.
In the EPC turnkey contract, the party having implemented the project conducts examination to make sure that the warranted performance items specified in the contract have been satisfied and the facilities are free from defect, in the phase of the facility installation and test operation.
After that, the facilities are formally accepted. An advanced level of technological information and experiences on power generation facilities is required to ensure reliable execution of this examination and to implement adequate technological negotiation with the EPC contractors. Further, various forms of technological problems will often occur even after commencement of commercial operation. It is preferred to get technological assistance by experts of power generation facilities in order to ensure adequate solution of the related technological problems and to implement adequate technological negotiation with the EPC contractors.


Chapter 4 Environmental and Social Consideration


4-1
The purpose of this study is to be conducted environmental and social consideration of thermal power plant about
two candidate sites, Kuantan Pahang, Kapar Selangor.
The results are as follows.
(1) Confirmation of the environmental and social status of the project site
1) Natural environment
(a) Meteorology
According to the report by the Malaysian Meteorological Department, the meteorology in Malaysia is
characterized with small variation in temperature throughout the year and high humidity with high rainfall.
The wind direction/speed in Malays ia shows seasonal variation. From mid-May to late September, south-west
monsoon with the wind speed lower than 8m/s is dominant. North-west monsoon is dominant from November to
March, with the wind speed of 5-10m/s. In the coastal area along the western Peninsular Malaysia, cold northern
wind of 15m/s or higher occasionally occurs. Short-term monsoon occurs between the seasons.
The period from October to November and from April to May is rainy season, and the period from June to July is
dry season, except in the southeast coastal area of Peninsular Malaysia.
As the candidate project sites are scattered in a wide area, the area is divided into the following 2 sections using
the meteorological model (MM5(The Mesoscale Model))to manage the meteorological data of 2014 in each
proposed site(Table 4-1, Figure 4-1).
① Kuantan, Pahang State
② Kapar, Selangor State
In Kuantan, Pahang State, north-east wind from the sea is dominant, with the annual average wind speed of 3.2m/s.
At Selangor State, north-west wind from the sea is dominant, with the annual average wind speed of 3.2m/s. The
average temperature at the three proposed sites is 26〜28°C.

4-2
Table 4-1 (1) Analysis result by meteorological model [Pahang State]
Parameter Unit Jan Feb Mar Apr May Jun Jul Aug Sep Oct Nov Dec Annual
Wind Speed m/average 4.6 4.2 3.7 3.0 2.6 2.8 3.1 2.8 2.8 2.6 2.7 3.1 3.2
Wind Direction Mode NE NE ENE ENE ESE SE SE SE SE ENE ENE NE NE
Temperature oC 24.0 24.6 25.6 26.0 27.1 27.1 26.8 26.4 26.4 26.2 25.9 25.6 26.0
Relative Humidity
%;average 85.3 83.7 83.1 86.1 81.4 84.7 84.7 84.2 83.4 85.8 87.4 89.9 85.0
Surface Pressure mb;average 1008 1007 1007 1006 1005 1004 1005 1006 1006 1006 1006 1006 1006
Cloud Cover average 4 3 3 3 4 4 4 4 4 4 4 5 4
Table 4-1 (2) Analysis result by meteorological model [Selangor State]
Parameter Unit Jan Feb Mar Apr May Jun Jul Aug Sep Oct Nov Dec Annual
Wind Speed m/average 3.3 3.5 3.0 3.8 3.6 2.9 2.5 3.0 3.1 3.1 3.3 3.4 3.2
Wind Direction Mode ENE E E NNW NNW NW NNW NNW NNW NW WNW NW NNW
Temperature oC 25.7 25.9 26.7 27.5 27.9 27.8 27.5 27.3 27.2 27.2 26.8 26.6 27.0
Relative Humidity
%;average 77.2 76.6 79.0 76.5 74.9 77.4 78.2 76.4 77.8 78.8 81.7 83.7 78.2
Surface Pressure mb;average 1010 1008 1009 1008 1008 1007 1008 1009 1009 1009 1009 1009 1008
Cloud Cover average 5 4 3 5 4 3 3 4 4 4 5 6 4
(Source: developed by the Survey Team)

4-3
Figure 4-1 Wind rose of the candidate site
(Source: developed by the Survey Team/Google Earth)
Data SIO,NOAA,U.S.Navy,NGA,GEBCO Ⓒ 2016 Google
U.S.Dept of State Geographer Image Landsat

4-4
(b) Land situation
Land situation of each candidate site is following table.
[Reference Photo]
-Kuantan Pahang-
The candidate site adjoins Gebeng where is industrial area consisting of small and medium scale industries such as wood processing industries, metal works factories and concrete ducting company. Jetty of Kuantan port is seen from beach along candidate site to the southeast
[Source: Google Earth]
The candidate site is a flat area located between Federal Route 3 and the coast line.
[Source: Google Earth]
Federal Route3 is a two-lane road with large traffic of vehicles carrying soil excavated from bauxite mine.
[Source: Photo by Survey team]
The ocean side of the candidate site is a strech of beach, with trees growing within the site.
[Source: Photo by Survey team]
Data SIO,NOAA,U.S.Navy,NGA,GEBCO Ⓒ 2016 Google
Image Ⓒ 2016 TerraMetrics Image Ⓒ 2016 DigtalGlobe
Image Ⓒ 2016 CNES/Astrium Ⓒ 2016 Google
Image Ⓒ 2016 TerraMetrics Image Ⓒ 2016 DigtalGlobe

4-5
[Reference Photo]
-Kapar Selangor-
A coal-ash disposal s ite for the existing thermal power plant is located in the south side of the candidate site.
[Source: Google Earth]
The candidate site is almost cultivated land, and some residential areas are scattered around the site.
[Source: Google Earth]
The land acquisition of the candidate site has already been completed, but the local people are growing palm and sugar cane under the permit of the project owner.
[Source: Photo by Survey team]
Mangrove grows in the ocean side of the candidate site.
[Source: Photo by Survey team]
There is KAPAR ENERGY VENTURES (KEV) on the south side of the candidate site. KEV is generating Total 2420MW, and that is contributing 15% of the country’s energy demand in Malaysia.
[Source: Photo by Survey team]
As the candidate site is situated on a weak ground, a ground subsidence is seen at the basis of the transmission/distribution facility adjacent to the candidate site.
[Source: Photo by Survey team]
Ⓒ 2016 Google Image Ⓒ 2016 DigtalGlobe
Ⓒ 2016 Google Image Ⓒ 2016 TerraMetrics Image Ⓒ 2016 DigtalGlobe
4-6
(c) National park and protected area
According to the ANNUAL REPORT 2013 (Department of Wildlife And National Parks(DWNP)), Malaysia is
inhabited by elephants, wild boars and other precious large mammals. The government of Malaysia has
established a fund and promotes protective measures in cooperation with the Ministry of Natural Resources and
Environment. No natural parks or natural reserves exist around the candidate site in Kuantan, Pahang State and
Kapar, Selangor State. The beach area in Kuantan, Pahang State is used for resort for 3km in the north. The
coastal area in Kapar, Selangor State is widely inhabited by mangrove.
2) Environmental status
(a) Air quality
According to Malaysia Environmental Quality Report 2014, DOE monitors ambient air quality throughout the
country for particulate matter (PM10 ), ozone (O3 ) which is the secondary product of NOx and VOC, sulfur
dioxide (SO2 ), and nitrogen dioxide (NO2 ).
In the west coast of Malay Peninsula, the air quality in the Klang Valley (located 60km south of Kapar, 20km
south of Port Dickson) was “good” 61% of the time, “moderate” 36%, 2% at an “unhealthy” level in terms of
“AIR QUALITY STATUS” in Air Pollutant Index (API).
In the east coast of Malay Peninsula, the air quality is reported to be overall in a good status. However, the result
of the on-site survey indicates that there is a problem of sand cloud thrown up by the vehicles on the federal route
near the project site in Kuantan, since Kuantan is located near an industrial zone and the road is a transportation
route between bauxite mine and the port.
PM level in Malaysia is mainly related to transboundary impact from the neighboring countries and forest and
peat land fires. SO2 is in a decreasing tendency in recent years. The main generation source is incineration of
fossil fuel in the industrial sector.
NO2 is significantly increasing in the urban and suburban area, mainly due to vehicle traffic.
(b) Water quality
a) River water quality
DOE is continuously conducting the river water quality monitoring programme.
According to Malays ia Environmental Quality Report 2014, the water quality in a total of 891 monitoring stations
covering 477 rivers was categorized as “clean” in 244 rivers, “slightly polluted” in 189 rivers, and “polluted” in
43 rivers in terms of “WATER QUALITY STATUS” in Water Quality Index (WQI).
Water turbidity in the river is mainly attributed to inadequate treatment of sewage or effluent from agro-based and
manufacturing industries, while the sources for SS (suspended solids) were mainly due to improper earthworks,
etc. Figure 4-2 describes the river water quality trend in 2005-2014.
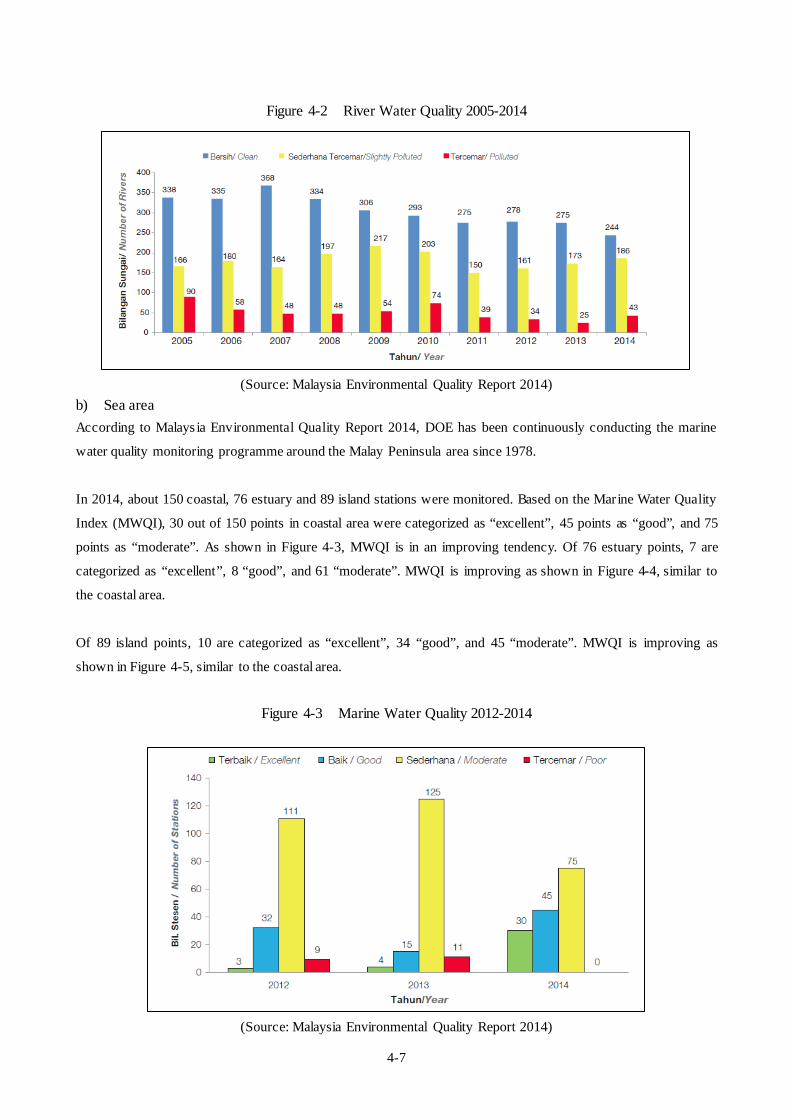
4-7
Figure 4-2 River Water Quality 2005-2014
(Source: Malaysia Environmental Quality Report 2014)
b) Sea area
According to Malays ia Environmental Quality Report 2014, DOE has been continuously conducting the marine
water quality monitoring programme around the Malay Peninsula area since 1978.
In 2014, about 150 coastal, 76 estuary and 89 island stations were monitored. Based on the Marine Water Quality
Index (MWQI), 30 out of 150 points in coastal area were categorized as “excellent”, 45 points as “good”, and 75
points as “moderate”. As shown in Figure 4-3, MWQI is in an improving tendency. Of 76 estuary points, 7 are
categorized as “excellent”, 8 “good”, and 61 “moderate”. MWQI is improving as shown in Figure 4-4, similar to
the coastal area.
Of 89 island points, 10 are categorized as “excellent”, 34 “good”, and 45 “moderate”. MWQI is improving as
shown in Figure 4-5, similar to the coastal area.
Figure 4-3 Marine Water Quality 2012-2014
(Source: Malaysia Environmental Quality Report 2014)
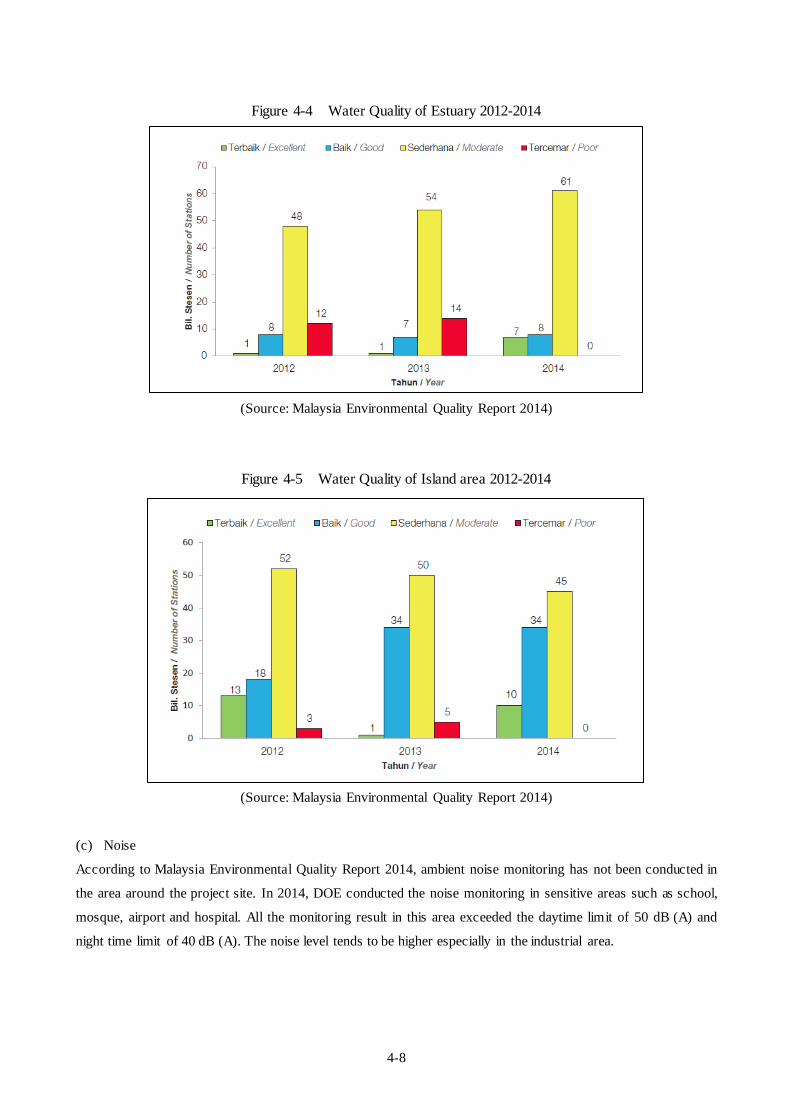
4-8
Figure 4-4 Water Quality of Estuary 2012-2014
(Source: Malaysia Environmental Quality Report 2014)
Figure 4-5 Water Quality of Island area 2012-2014
(Source: Malaysia Environmental Quality Report 2014)
(c) Noise
According to Malaysia Environmental Quality Report 2014, ambient noise monitoring has not been conducted in
the area around the project site. In 2014, DOE conducted the noise monitoring in sensitive areas such as school,
mosque, airport and hospital. All the monitoring result in this area exceeded the daytime limit of 50 dB (A) and
night time limit of 40 dB (A). The noise level tends to be higher especially in the industrial area.

4-9
3) Social enviroment
(a) Economic and social indicators
Fundamenetal economic and social indicators of Malaysia are shown in Table 4-2
Table 4-2 Economic and social indicators
Item Unit Value(duration)
Economic indicators
Gross domestic product million current US$ 6,475(2014)
GDP per capita current US$ 1,182.8(2010)
Unemployment % 8.4(2010)
Employment in industrial sector % 20.6(2010)
Employment in agricultural sector % 34.0(2010)
Labor force participation, adult female pop.
% 55.7(2014)
Labor force participation, adult male pop % 79.0(2014)
Social indicators
Population growth rate Average annual % 1.6(2010-2015)
Urban population growth rate Average annual % 2.5(2010-2015)
Rural population growth rate Average annual % -1.0(2010-2015)
Urban population % 74.2(2013)
Population aged 0-14 years % 26.1(2013)
Population aged 15-59 years % 65.4(2013)
Population aged 60+ years Average % (females and
males, % of total) 8.5(8.3/8.7) (2013)
Sex ratio males per 100 females 94.3(2013)
Life expectancy at birth females and males,
77.3/72.7(2010-2015)
Infant mortality rate per 1 000 live births 4.1(2010-2015)
Fertility rate, total live births per woman 2.0(2010-2015)
Primary-secondary gross enrolment ratio f/m per 100 83.2/84.7(2010-2015)
Education: Female third-level students % of total 56.5(2006-2012)
(Source: World Statistics pocketbook 2014(United Nation))
(b) Social infrastructure
a) Transportation
The main roads and ports located around the candidate site are shown in Table 4-3.
Kuantan is connected to Federal Route 3 and an access road is not necessary, whereas the site in Kapar is located
5km from Federal Route 5. Both routes are two-lane highway.
Kuantan Port is located approximately 3km south of Kuantan, Pahang State and used for shipping regarding
bauxite mine.
Kapar in Selangor State has Klang Port situated 15km south, one of the main ports in Malaysia.

4-10
Table 4-3 Traffic situation
Item Kuantan Pahang Kapar Selangor
Main road Federal Route 3 Federal Route 5
Main port Port Kuantan Port Klang
(Source: developed by the Survey Team)
b) Transmission line
A construction of a new transmission line and a switchyard will be necessary in Kuantan, Pahang State in order to
connect to the existing transmission line network.
Kapar in Selangor State has an existing substation (the figure below) within the candidate site, and new necessary
facilities will be installed within the substation site.
[Reference Photo]
[Source: Photo by Survey team]
c) School and Hospital
The locations of school and hospital near the candidate sites is shown in Figure 4-6(1),(2). The distance of the
nearest school is approximately 5km from Kuantan Pahang, and the distance of the nearest hospital is
approximately 3km. The distance of the nearest school is approximately 1km from Kapar Selangor, and the
distance of the nearest hospital is approximately 3km.

4-11
Figure 4-6 (1) The locations of schools and hospitals near the site(Kuantan Pahang)
School Hospital
SK Balok Baru (Primary school) Klinik Kesihatan Sg Ular SK Pelabuhan (Primary school)
Red circle; school, Yellow circle; hospital
SK Balok Makmur (Primary school) SK Balok (Primary school) SK Lembah Jabor (Primary school) SMK Pelabuhan (Secondary school)
(Source: developed by the Survey Team/ Google Earth)
Figure4-6 (2) The locations of schools and hospitals near the site(Kapar Selangor)
School Hospital Sekolah Rendah Agama Tok Muda (Primary school)) Klinik Kesihatan Tok Muda Sekolah Rendah Kebangsaan Tok Muda (Primary school)) Klinik Kesihatan Kapar Sekolah Rendah Kebangsaan Sg Serdang (Primary school)) Red circle; school,
Yellow circle; hospital
(Source: developed by the Survey Team/ Google Earth)
0 2.5 5km
Ⓒ 2016 Google Image Ⓒ 2016 TerraMetrics Image Ⓒ 2016 DigtalGlobe
Ⓒ 2016 Google Image Ⓒ 2016 TerraMetrics Image Ⓒ 2016 DigtalGlobe

4-12
(c) Minority, Indigeous people
Thre is no communities that minority or indigeous people lives around each candidate site.
(d) Land acquiestion and Ressettlement
The situation of land acquisition and resettlement in the respective candidate site is described in Table 4-4.
Land acquisition is not conducted yet in Kuantan, Pahang State. Land should be acquired from the land owner,
Pahang State Development Company.
The candidate site in Kapar, Selangor State is the land owned by the project owner and is currently rented to the
local people free of charge for cultivation of palm and sugar cane. The start of construction shall be notified by the
project owner 6 months prior to the start.
Table 4-4 Situation of land acquisition and resettlement for thermal power plant
Item Kuantan Pahang Kapar Selangor
Land acquisition Land acquisition from Pahang State
Development Corporation
Completion
Resettlement N/A N/A
(Source: developed by the Survey Team)
Besides the power plant, land acquisition occurs for constructing transmission line and the switchyard in Kuantan,
Pahang State.
The transmission line route is still in the consideration stage. The candidate site for the switchyard is planned in
the land which has been already developed
[Reference Photo]
[Source: Photo by Survey team]
Since the existing road between the site in Kapar and national road is narrow, expansion/ improvement of the
existing road or development of new access road will be needed. And in case of a new access road, the specific

4-13
route is the matter to be discussed in the future. New access road will be 1-2 km long and the land acquis ition will
be necessary.
Figure 4-7 The distance from federal road till the site (Kapar Selangor)
(Source: developed by the Survey Team,/Google Earth)
1~2㎞
Ⓒ 2016 Google Image Ⓒ 2016 TerraMetrics Image Ⓒ 2016 DigtalGlobe
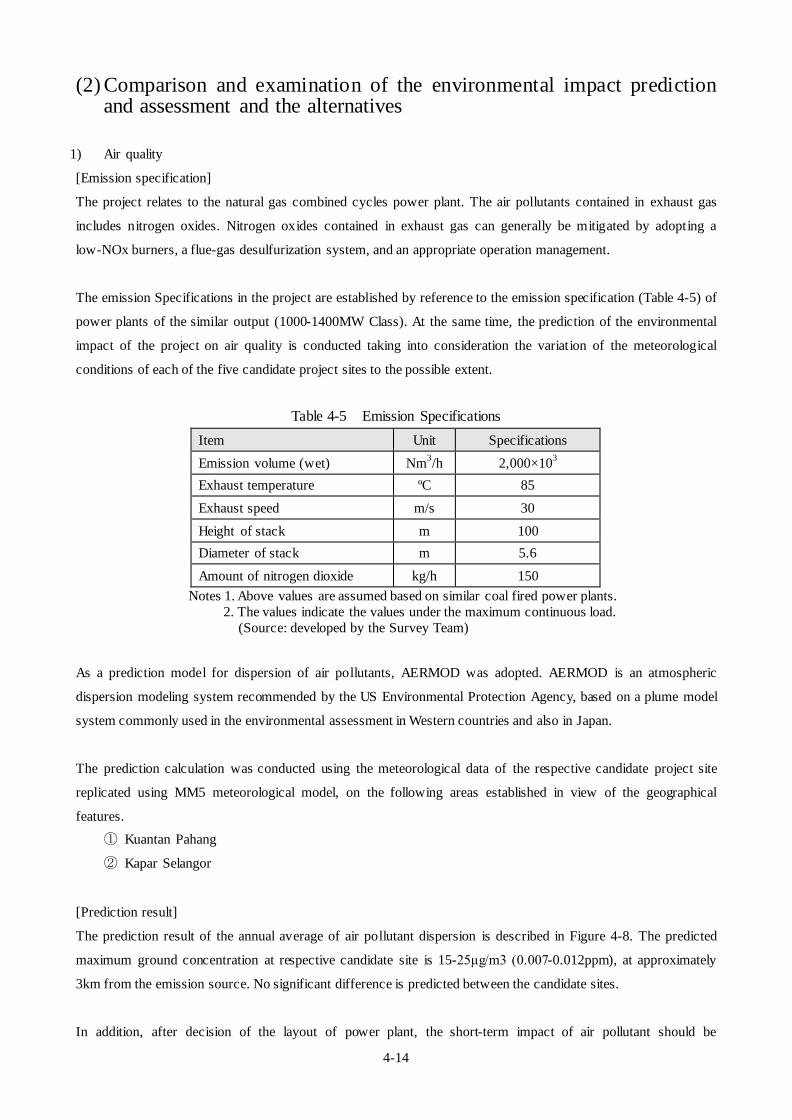
4-14
(2) Comparison and examination of the environmental impact prediction and assessment and the alternatives
1) Air quality
[Emission specification]
The project relates to the natural gas combined cycles power plant. The air pollutants contained in exhaust gas
includes nitrogen oxides. Nitrogen oxides contained in exhaust gas can generally be mitigated by adopting a
low-NOx burners, a flue-gas desulfurization system, and an appropriate operation management.
The emission Specifications in the project are established by reference to the emission specification (Table 4-5) of
power plants of the similar output (1000-1400MW Class). At the same time, the prediction of the environmental
impact of the project on air quality is conducted taking into consideration the variation of the meteorological
conditions of each of the five candidate project sites to the possible extent.
Table 4-5 Emission Specifications
Item Unit Specifications
Emission volume (wet) Nm3/h 2,000×103
Exhaust temperature ºC 85
Exhaust speed m/s 30
Height of stack m 100
Diameter of stack m 5.6
Amount of nitrogen dioxide kg/h 150
Notes 1. Above values are assumed based on similar coal fired power plants. 2. The values indicate the values under the maximum continuous load.
(Source: developed by the Survey Team)
As a prediction model for dispersion of air pollutants, AERMOD was adopted. AERMOD is an atmospheric
dispersion modeling system recommended by the US Environmental Protection Agency, based on a plume model
system commonly used in the environmental assessment in Western countries and also in Japan.
The prediction calculation was conducted using the meteorological data of the respective candidate project site
replicated using MM5 meteorological model, on the following areas established in view of the geographical
features.
① Kuantan Pahang
② Kapar Selangor
[Prediction result]
The prediction result of the annual average of air pollutant dispersion is described in Figure 4-8. The predicted
maximum ground concentration at respective candidate site is 15-25μg/m3 (0.007-0.012ppm), at approximately
3km from the emission source. No significant difference is predicted between the candidate sites.
In addition, after decision of the layout of power plant, the short-term impact of air pollutant should be

4-15
investigated in detail taking into consideration the conditions of the surrounding buildings and land use (existence
of residential area, etc).
Figure 4-8 Dispersion concentration of air pollutant
【Kuantan Pahang】
【Kapar Selangor】
(Source: developed by the Survey Team/ Google Earth)
Data SIO,NOAA,U.S.Navy,NGA,GEBCO Ⓒ 2016 Google
Image Ⓒ 2016 TerraMetrics Image Ⓒ 2016 DigtalGlobe
Ⓒ 2016 Google Image Ⓒ 2016 TerraMetrics Image Ⓒ 2016 DigtalGlobe

4-16
2) Water quality (Thermal effluent)
According to Guideline on Environmental impact assessment for thermal power plant (Ministry of Economy,
Trade and Industry, July 2015), the extension of thermal effluent discharged from thermal power plant is described
in Figure 4-9.
Dispersion extension of thermal effluent discharged by this project is estimated based on the relation described
above
In case of thermal power plant project of 1000-1400 MW class, extension of 1 and 3 celsius degree raised of
surface water temperature is estimated 5-8 square kilometers(3 celsius degree rise) and 10-20 square kilometers(1
celsius degree rise).

4-17
Figure 4-9 Extension of thermal effluent discharged from thermal power plant
(Source: Guidline of enviromental impact assessment for thermal power plant (Minisitry of Economy, Trade and
Industry, July 2015 ))
According to the result of the estimation of the dispersion extension of thermal effluent, on the assumption that
thermal effluent is dispersed concentrically from the water outlet, extension of the area (semicircle) of raised
surface water temperature of 3 celsius degree is estimated 2 kilometers radius from the water outlet, and the area
(semicircle) of raised surface water temperature of 1 celsius degree is estimated 3 kilometers radius from the
outlet.

4-18
Figure 4-10 describes roughly the estimated dispersion extension of thermal effluent.
It should be noted that the candidate project sites in Kapar Selangor is adjacent to the existing power plant, and
the cumulative impact of thermal effluent from the existing power plant shall be taken in consideration.
In addition, the possibility of circulation of thermal effluent and cooling water should be taken into account.
Figure 4-10 The estimated dispersion extension of thermal effluent
【Kuantan Pahang】
(yellow color:3 celsius degree rise,faint yellow:1
celsius degree rise)
【Kapar Selangor】
(yellow color:3 celsius degree rise,faint yellow:1
celsius degree rise)
(Source: developed by the Survey Team/ Google Map)
3) Noise
The layout of the power plant will be discussed later in detail. General noise sources in a power plant are shown
inTable 4-6.
Table 4-6 Noise intensity of power plant (Unit: dBA)
Item Noise intensity
Main power house 60
Boiler 80
Main transformer 50
Pump 90
Stack 70 Note; Above values are assumed based on similar coal
fired power plants.
(Source: developed by the Survey Team)
Ⓒ 2016 Google Image Ⓒ 2016 TerraMetrics Image Ⓒ 2016 DigtalGlobe
Data SIO,NOAA,U.S.Navy,NGA,GEBCO Ⓒ 2016 Google
Image Ⓒ 2016 TerraMetrics Image Ⓒ 2016 DigtalGlobe

4-19
It is known that noise level generated from a noise source attenuates with distance from the noise source,
according to ISO9613-2 Acoustics- Attenuation of sound during propagation outdoors.
In consequence, it is important to determine the distance and position of the houses, hospital, school and other
environmentally sensitive facilities in relation to the power plant in terms of appropriately assessing the
environmental impact.
According to the result of the on-site survey and the interview with the project owner, hospitals and schools do
not exist near the candidate site, but there is a residential area scattered around the site.
In Kapar, Selangor State, the area of 1,000m radius around site boundary of the existing coal power plant is
established as a buffer zone*1 with restriction of residency, and the impact of noise from the power plant will be
insignificant.
In the site in Kuantan, Pahang State, there are houses along the federal route. Consideration should be taken for
countermeasures against noise impact to the surrounding area including the layout of the power plant.
1 In case of coal fired power plant, 1,000m from site boundary is established, and in case of gas fired power plant, 500m from site boundary is established.
Within buffer zone, construction of new residential house, school and hospital is prohibited (except commercial facilities such as store, warehouse and so on). As for the existing residential house within buffer zone, it needs to achieve the agreement (including negotiation of compensation) between local residents and project proponent through public consultation in EIA procedure.
Source: GUIDELINES FOR SITING AND ZONING OF INDUSTRY AND RESIDENTIAL AREAS (DOE, October
2012)

4-20
(3) Consideration of mitigation measures (including avoidance, minimization and substitute)
1) Atmosphere
(a) Exhaust gas
a) Mitigation measures for emission source
In order to mitigate emission of nitrogen oxides (NOx), a high-efficiency combined cycle power generation
system using natural gas for fuel will be adopted.
A low-NOx combustor shall be adopted for gas turbine. NOx Removal System using Dry Selective Catalytic
Reduction System with Ammonia is installed to minimize emission concentration and amount of nitrogen oxides.
b) Stack height
Effective height of stack shall be set high to enhance diffusion effect of pollutants.
c) Noise and vibration
The power generation facility will be constructed in a location as distant as possible from the site boundary to
minimize noise and vibration leaking outside the project site.
2) Water quality
(a) Domestic waste water
In order to minimize water pollution caused by domestic waste water from the power plant, a waste water
treatment system will be installed to reduce chemical oxygen demand (COD), T-N (total nitrogen), T-P(Total
phosphorus) and so on contained in waste water.
(b) Thermal effluent
The water discharge system will be designed in consideration of change in f low direction and flow rate caused by
thermal effluent discharge.
A high-efficiency combined cycle power generation system will be adopted to minimize the amount of cooling
water per output used in the condenser
3) Transportation of materials
The smoothing of operation of the project vehicles and enhancement of transportation efficiency of materials shall
be considered. Safety training and instructions for the drivers and installation of traffic signs as necessary shall
also be conducted.
4) Flora and fauna
In order to minimize as much as possible the impact of the project to the habitat of the flora and fauna, land
preparation will be conducted to the minimum extent possible. Additionally, a vegetation plan of the project site
shall be developed.

4-21
5) Waste management
Natural gas is used for fuel in the power plant, and no soot and combustion residue will be generated. Industrial
waste generated within the power plant will be collected separately to maximize recycle and reuse, so as to reduce
the amount of waste to be treated.
6) Greenhouse gas (CO2)- facility operation (exhaust gas)
A high-efficiency combined cycle power generation system will be adopted to minimize CO2 emission per
generation output.
The appropriate maintenance and management of the facility and operation of the power plant will ensure stable
and high power generation efficiency.

4-22
(4) Screening for environmental aspect of candidate sites and considerations by Survey Team
Screening result is shown in Table 4-7, based on results that are taken in consideration about the described (1) -
(3) and considerations by Survey Team.
Moreover, according to reason of screening result, please refer to (5) Development of the environmental checklist
(draft).
Table 4-7 Screening result
Item Candidate sites
Kuantan Pahang Kapar Selangor _ Environmental and social
Consideration △ △
Pollution Prevention Measures
Air quality △ △ Water quality △ △ Waste ○ ○ Soil Contamination ○ ○ Noise and
Vibration △ △
Subsidence ○ △ Odor ○ ○ Natural
Environment Protected Areas ◎ ◎
Ecosystem and biota
△ △
Topography and Geology
○ △ Social
Environment Resettlement and Land acquisition
△ △
Living and Livelihood
○ ○
Heritage ◎ ◎ Landscape △ ◎ Ethnic Minorities
and Indigenous Peoples
◎ ◎
Working conditions(including working safety)
○ ○
Others Impacts during construction
△ △
Accident prevention
○ ○
Monitoring ○ ○ Note: ◎; Highly Adequate; This item is no factor that been assessed about environmental impact.
○; Moderately Adequate; This item is able to avoid environmental impact by implementation of mitigation measures based on investigation by survey team.
△; Adequate with consideration; This item needs to take into consideration of environmental impact.
(Source: developed by the Survey Team)

4-23
(5) Development of the environmental checklist (Draft)
1) JICA Guidelines/ JBIC Guidelines
JAPAN INTERNATIONAL COOPERATION AGENCY (JICA) has developed and publicized new “JICA
GUIDELINES FOR ENVIRONMENTAL AND SOCIAL CONSIDERATIONS” (hereinafter referred to as “JICA
Guidelines”) on April 1st, 2010. And JAPAN BANK FOR INTERNATIONAL COOPERATION (JBIC) has
developed and public ized new “JBIC GUIDELINES FOR CONFIRMATION OF ENVIRONMENTAL AND
SOCIAL CONSIDERATIONS” (hereinafter referred to as “JBIC Guidelines”) on April 1st, 2015.
The objectives of both guidelines are to encourage Project proponents etc. to have appropriate consideration for
environmental and social impacts, as well as to ensure that a support for and examination of environmental and
social considerations are conducted accordingly. The guidelines outline responsibilities and procedures, along
with its requirements for project proponents etc., in order to facilitate the achievement of these objectives.
Also, the guideline requests “Project proponents fill in the screening form; the information in this form will be a
reference for the categorization of proposed projects”, and “conducts an environmental review in accordance with
the project category, and refers to the corresponding environmental checklists for each sector when conducting
that review as appropriate”.
2) Result of the review of the environmental and social consideration in the project
The project relates to the consideration of the construction of the 1000-1400MW natural gas combined cycles
power plant in Peninsular Malaysia.
First of all, survey team conducted to narrow down the appropriate sites from several sites by a preliminary study.
Moreover, as a result of consideration between project proponent and Survey Team, Kuantan Pahang, Kapar
Selangor as appropriate site were narrowed down.
The environmental and social consideration survey items needed for the next stage of the survey were clarif ied
using JICA Environmental Checklist “2. Thermal power plant” and JBIC Environmental Checklist “11. Thermal
power plant” The result of the review of the Environmental Checklist (Draft) in Table 4-8 describes the result of
the survey result at present.
The description corresponding to both Kuantan, Pahang State and Kapar, Selangor State is marked “common”, the
one corresponding to either Kapar, Selangor State or Kapar, Selangor State is marked “Kuantan” or “Kapar”,
respectively.

4-24
Table 4-8 Environmental Checklist (Draft)
Category
Environmental Item
Main Check Items Major Impact
Impact Level (○: significant, ×: insignificant)
Mitigation Measure to be Conducted and Necessary Consideration JICA Guidelines JBIC Guidelines
1 Perm
its and Explanation
(1) EIA and Environmental Permits
(a) Have environmental assessment report (EIA reports) been officially completed?
① Have ESIA reports been officially completed? Have ESIA reports been written in the official language or a language widely used in the host country?
- - [Common] The project relates to the construction plan of the 1000-1400MW thermal power plant. The development of the environmental impact assessment report and an approval by DOE is required in accordance with the EIA law. (b) Have EIA
reports been approved by authorities of the host country’s government?
② Have ESIA reports been approved by the government of the host country?
- -
(c) Have EIA reports been unconditionally approved? If conditions are imposed on the approval of EIA reports, are the conditions satisfied?
③ Have ESIA reports been unconditionally approved? If conditions are imposed on the approval of ESIA reports, are the conditions satisfied?
- -
(d) In addition to the above approvals, have other required environmental permits been obtained from the appropriate regulatory authorities of the host country’s government?
④ In addition to the above approvals, have other required environmental permits been obtained from the appropriate regulatory authorities of the host country ’ s government?
- -
(2) Explanation to the local stakeholders
(a) Are contents of the project and the potential impacts adequately explained to the public based on appropriate procedures, including information disclosure? Is understanding obtained from the public?
① Is the project accepted in a manner that is socially appropriate to the country and locality throughout the preparation and implementation stages of the project based on sufficient consultations with stakeholders, such as local residents, conducted via disclosure of project
- - [Common] Explanation to the local people shall be conducted in accordance with the EIA law.

4-25
Category
Environmental Item
Main Check Items Major Impact
Impact Level (○: significant, ×: insignificant)
Mitigation Measure to be Conducted and Necessary Consideration JICA Guidelines JBIC Guidelines
information and potential impacts?
(b) Are proper responses made to comments from the public and regulatory authorities?
② Are the records of such consultations with the stakeholders, such as local residents, prepared? ③ Are the written materials for the disclosure prepared in a language and form understandable to the local residents? ④ Are ESIA reports available at all times for perusal by stakeholder such as local residents, and copying of the reports permitted? ⑤ Are proper responses made to comments from the public and regulatory authorities?
- - [Common] The comments from the local people concerning the project should be appropriately responded.
(3) Consideration of the alternatives
(a) Are plural alternatives of the project plan considered (including the environmental social issues)?
- - - [Common] The project relates to the selection of the project site from candidate sites, initially five and later narrowed down two candidate sites as a result of the discussion by the survey team and TNB.
2 Pollution P
revention Measures
(1) Air quality
(a) Do air pollutants, such as sulfur oxides (SOx), nitrogen oxides (NOx), and soot and dust emitted by power plant operations comply with the country’s emission standards? Is there a possibility that air pollutants emitted from the project will cause areas that do not comply with the country’s ambient air quality standards?
① Do air pollutants, such as sulfur oxides (SOx), nitrogen oxides (NOx), and soot and dust emitted by the power plant operations comply with the host country ’s emission standards? ③ Is there a possibility that air pollutants emitted from the project will cause areas that do not comply with the host country ’s ambient air quality standards?
・SOx, dust are not generated from the gas-fired power plant ・Cumulative impact of the existing units
○ [Common] The exhaust gas emitted from the power plant shall meet IFC/WB EHS guidelines as well as the environmental standard of the host country. [Kapar] The cumulative impact from the existing power plant shall be reviewed.
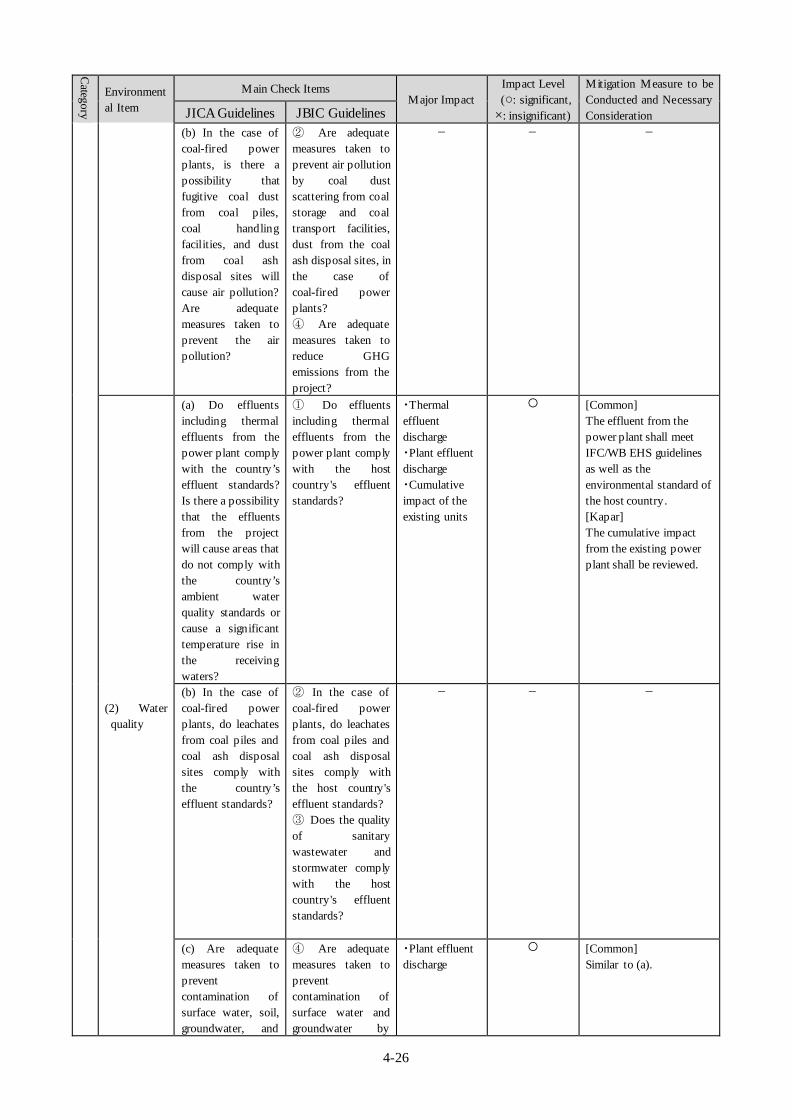
4-26
Category
Environmental Item
Main Check Items Major Impact
Impact Level (○: significant, ×: insignificant)
Mitigation Measure to be Conducted and Necessary Consideration JICA Guidelines JBIC Guidelines
(b) In the case of coal-fired power plants, is there a possibility that fugitive coal dust from coal piles, coal handling facilities, and dust from coal ash disposal sites will cause air pollution? Are adequate measures taken to prevent the air pollution?
② Are adequate measures taken to prevent air pollution by coal dust scattering from coal storage and coal transport facilities, dust from the coal ash disposal sites, in the case of coal-fired power plants? ④ Are adequate measures taken to reduce GHG emissions from the project?
- - -
(2) Water quality
(a) Do effluents including thermal effluents from the power plant comply with the country’s effluent standards? Is there a possibility that the effluents from the project will cause areas that do not comply with the country’s ambient water quality standards or cause a significant temperature rise in the receiving waters?
① Do effluents including thermal effluents from the power plant comply with the host country's effluent standards?
・Thermal effluent discharge ・Plant effluent discharge ・Cumulative impact of the existing units
○ [Common] The effluent from the power plant shall meet IFC/WB EHS guidelines as well as the environmental standard of the host country. [Kapar] The cumulative impact from the existing power plant shall be reviewed.
(b) In the case of coal-fired power plants, do leachates from coal piles and coal ash disposal sites comply with the country’s effluent standards?
② In the case of coal-fired power plants, do leachates from coal piles and coal ash disposal sites comply with the host country's effluent standards? ③ Does the quality of sanitary wastewater and stormwater comply with the host country's effluent standards?
- - -
(c) Are adequate measures taken to prevent contamination of surface water, soil, groundwater, and
④ Are adequate measures taken to prevent contamination of surface water and groundwater by
・Plant effluent discharge
○ [Common] Similar to (a).

4-27
Category
Environmental Item
Main Check Items Major Impact
Impact Level (○: significant, ×: insignificant)
Mitigation Measure to be Conducted and Necessary Consideration JICA Guidelines JBIC Guidelines
seawater by the effluents?
these effluents? Is there a possibility that the effluents from the project will cause areas that do not comply with the host country ’s ambient water quality standards?
(3) Waste
(a) Are wastes (such as waste oils, and waste chemical agents), coal ash, and by-product gypsum from flue gas desulfurization generated by the power plant operations properly treated and disposed of in accordance with the country’s standards?
① Are wastes, (such as waste oil, and waste chemical agents), coal ash, and by-product gypsum from flue gas desulfurization generated by the power plant operations properly treated and disposed of in accordance with the laws and regulations of the host country?
・Generation of waste oil and so on
○ [Common] The treatment and disposal of waste generated from the power plant shall be considered.
(4) Soil Contamination
- ① Has the soil at the project site been contaminated in the past, and are adequate measures taken to prevent soil contamination?
・ Leakage of waste/ waste water and so on
○ [Common] The treatment and disposal of waste/ waste water generated from the power plant shall be considered.
(5) Noise and Vibration
(a) Do noise and vibrations generated by the power plant operations comply with the country’s ambient standards, and occupational health and safety standards?
① Do noise and vibrations from the operation comply with the country’s standards? ② Is there a possibility that noise generated by large vehicle traffic for transportation of materials, such as raw materials and products will cause impacts?
・ Noise from the machines and equipment ・ Cumulative impact of the existing units
○ [Common] The noise and vibration from the power plant shall meet IFC/WB EHS guidelines as well as the environmental standard of the host country. The impact to the surrounding residential area shall be examined. [Kapar] The cumulative impact from the existing power plant shall be reviewed.
(6) Subsidence
(a) In the case of extraction of a large volume of groundwater, is there a possibility that the extraction of groundwater will cause subsidence?
① In the case of withdrawal of a large volume of groundwater, is there a possibility that it will cause subsidence?
- ○ [Common] The project does not involve ground water intake and subsidence due to ground water intake is not predicted. [Kapar] The weak ground causes subsidence in the existing substation within the site and an appropriate preventive measure is

4-28
Category
Environmental Item
Main Check Items Major Impact
Impact Level (○: significant, ×: insignificant)
Mitigation Measure to be Conducted and Necessary Consideration JICA Guidelines JBIC Guidelines
needed.
(7) Odor
(a) Are there any odor sources? Are adequate odor control measures taken?
① Are there any odor sources? Are adequate odor control measures taken?
Generation of residual ammonia
○ [Common] If ammonia is used for the flue-gas desulfurization system, an appropriate management will be required.
3 Natural E
nvironment
(1) Protected Areas
(a) Is the project site located in protected areas designated by the country’s laws or international treaties and conventions? Is there a possibility that the project will affect the protected areas?
① Is the project site located in protected areas designated by the host country’s laws or international treaties etc.? Is there a possibility that the project will significantly affect the protected areas?
Power generation equipment
× [Common] No natural reserves exist within and around the site.
(2) Ecosystem and biota
(a) Does the project site encompass primeval forests, tropical rain forests, ecologically valuable habitats (e.g., coral reefs, mangroves, or tidal flats)?
① Does the project cause significant conversion or significant degradation of forests with important ecologically value (including primary forests and natural forests in tropical areas) and habitats with important ecological value (including coral reefs, mangrove wetlands and tidal flats)? ② In case the projects involve the significant conversion or degradation of natural habitats including natural forests, is the avoidance of impacted considered preferentially? If the impacts are unavoidable, will the appropriate
Power generation equipment
○ [Kapar] Mangrove grows on the coastal area near the project site. The impact of construction of the water discharge/intake facility and the mitigation measures shall be considered.

4-29
Category
Environmental Item
Main Check Items Major Impact
Impact Level (○: significant, ×: insignificant)
Mitigation Measure to be Conducted and Necessary Consideration JICA Guidelines JBIC Guidelines
mitigation measures be taken?
(b) Does the project site encompass the protected habitats of endangered species designated by the country’s laws or international treaties and conventions?
⑤ Does the project site encompass the protected habitats of endangered species designated by the host country's laws or international treaties etc.?
Power generation equipment
× [Common] The site does not include habitat of precious species of flora and fauna.
(c) If significant ecological impacts are anticipated, are adequate environmental protection measures taken to reduce the impacts on ecosystem?
③ Will the evaluation of the impacts on natural habitats by the project and consideration for the offset measures be carried out based on expert opinion? ④ Is the illegal logging of the forest avoided?
Power generation equipment
○ [Common] Palm and sugar cane are grown in [Kapar], and forest area is established in [Kuantan]. On-site survey and document research should be conducted and mitigation measures should be considered as necessary.
(d) Is there a possibility that the amount of water (e.g., surface water, groundwater) used by the project will adversely affect aquatic environments, such as rivers? Are adequate measures taken to reduce the impacts on aquatic environments, such as aquatic organisms?
⑥ Is there a possibility that the amount of water (e.g. surface water, groundwater) used by the project will adversely affect aquatic environments such as rivers, in the case of development in the land area? Are adequate measures taken to reduce the impacts on aquatic environments, such as aquatic organisms?
Acquisition of cooling water and plant water
○ [Common] On-site survey and document research of organisms in the rivers should be conducted around the project site and necessary mitigation measures should be considered.
(e) Is there a possibility that discharge of thermal effluents, intake of a large volume of
⑦ Is there a possibility that discharge of thermal effluents, intake of a large volume of cooling water or discharge
・ Thermal effluent discharge ・Discharge of wastewater from the plant ・ Cumulative
○ The effluent from the power plant shall meet IFC/WB EHS guidelines as well as the environmental standard of the host country. [Kapar]

4-30
Category
Environmental Item
Main Check Items Major Impact
Impact Level (○: significant, ×: insignificant)
Mitigation Measure to be Conducted and Necessary Consideration JICA Guidelines JBIC Guidelines
cooling water or discharge of leachates will adversely affect the ecosystem of surrounding water areas?
of leachateswill adversely affect the ecosystem of surrounding water areas? ⑧ If any adverse impacts on ecosystem are predicted, are adequate measures taken to reduce the impacts on ecosystem?
impact of the existing units
The cumulative impact from the existing power plant shall be reviewed.
(3) Topography and Geology
- ① Is there a possibility that the installation of structures will cause a large-scale alteration of topographic features and geological structures in and around the project site?
- ○ Reference; [2.(6)Subsidence]
4 Social E
nvironment
(1) Resettlement
(a) Is involuntary resettlement caused by project implementation? If involuntary resettlement is caused, are efforts made to minimize the impacts caused by the resettlement?
① Are involuntary resettlement and loss of means of livelihoods avoidable by project implementation? If unavoidable, are efforts made to minimize the impacts caused by the resettlement and loss of means of livelihoods?
Land acquisition
○ [Kuantan] The land is owned by the land developer, and resettlement is not predicted although land acquisition is needed. The construction of transmission line and substation is necessary and potential land acquisition and resettlement related to the associated facility should be taken in consideration. [Kapar] The land is owned by the project owner and land acquisition and resettlement do not occur. The construction of access road is necessary and potential land acquisition and resettlement related to the associated facility should be taken in consideration.
(b) Is adequate explanation on relocation and compensation given to affected persons prior to
② Are the people affected by the project provided with adequate compensation and supports to improve
- - -

4-31
Category
Environmental Item
Main Check Items Major Impact
Impact Level (○: significant, ×: insignificant)
Mitigation Measure to be Conducted and Necessary Consideration JICA Guidelines JBIC Guidelines
resettlement? their standard of living, income opportunities, and production levels or at least to restore them to pre-project levels? Also, is prior compensation at full replacement cost provided as much as possible?
(c) Is the resettlement plan, including proper compensation, restoration of livelihoods and living standards developed based on socioeconomic studies on resettlement?
④ Is the resettlement action plan (including livelihood restoration plan as needed) prepared and disclosed to the public for the project which will results in a large-scale resettlement or large-scale loss of means of livelihood? Does the resettlement action plan include elements required in the standard of the international financial institution benchmarked in its environmental reviews?
- - -
(d) Will compensation paid before resettlement?
⑤ In preparing a resettlement action plan, is consultation made with the affected people and their communities based on sufficient information made available to them in advance and is explanations given in a form, manner, and language that are understandable to the affected people?
- - -
(e) Is the compensation policy established in a document?
- - - -
(f) Does the resettlement
⑥ Has appropriate consideration been
- - -

4-32
Category
Environmental Item
Main Check Items Major Impact
Impact Level (○: significant, ×: insignificant)
Mitigation Measure to be Conducted and Necessary Consideration JICA Guidelines JBIC Guidelines
plan pay particular attention to vulnerable groups or persons, including women, children, the elderly, people below the poverty line, ethnic minorities, and indigenous peoples?
given to vulnerable social groups, such as women, children, the elderly, the poor, and ethnic minorities in the resettlement action plan?
(g) Are agreements with the affected persons obtained prior to resettlement?
⑦ Are agreements with the affected people obtained prior to the resettlement?
- - -
(h) Is the organizational framework established to properly implement resettlement? Are the capacity and budget secured to implement the plan?
⑧ Is the organizational framework established to properly implement resettlement? Are the capacity and budget secured to implement the resettlement action plan?
- - -
(i) Is a plan developed to monitor the impacts of resettlement?
⑨ Is a plan developed to monitor the impacts of resettlement?
- - -
(j) Is a grievance system developed?
③ Is the participation of the people affected and their communities promoted in planning, implementation, and monitoring of involuntary resettlement action plans and measures against the loss of their means of livelihood? In addition, will appropriate and accessible grievance mechanisms be established for the
- - -

4-33
Category
Environmental Item
Main Check Items Major Impact
Impact Level (○: significant, ×: insignificant)
Mitigation Measure to be Conducted and Necessary Consideration JICA Guidelines JBIC Guidelines
people affected and their communities?
(2) Living and Livelihood
(a) Is there a possibility that the project will adversely affect the living conditions of inhabitants? Are adequate measures considered to reduce the impacts, if necessary?
① Is there a possibility that the project will adversely affect the living conditions of inhabitants? Are adequate measures considered to reduce the impacts, if necessary? ⑤ Has appropriate consideration been given to vulnerable social groups, such as women, children, the elderly, the poor, ethnic minorities and indigenous peoples?
Inflow of workers and increased economic activity
○ [Common] Enhanced employment of local people and utilization of local industries will lead to the activation of local economy.
(b) Is sufficient infrastructure (e.g., hospitals, schools, roads) available for the project implementation? If existing infrastructure is insufficient, is a plan developed to construct new infrastructure or improve existing infrastructure?
② Are sufficient infrastructures (e.g. hospitals, schools, roads) available for project implementation? If existing infrastructure is insufficient, are plans developed to construct new infrastructures or improve existing infrastructures?
Inflow of workers and development of infrastructure
○ [Common] Development of social infrastructures including schools and hospitals should be specifically discussed in the project plan.
(c) Is there a possibility that large vehicle traffic associated with the project will affect road traffic in the surrounding areas? Are adequate measures considered to reduce the impacts on traffic, if necessary?
③ Is there a possibility that large vehicle traffic associated with the project will cause impacts on road traffic in the surrounding areas? Are adequate measures considered to reduce the impacts on traffic, if necessary?
Increased traffic caused by construction vehicles
○ [Common] After the specific construction plan is developed, the notification to the local people and traffic accident prevention measures should be discussed.
(d) Is there a possibility that diseases (including communicable diseases, such as HIV) will be introduced due to immigration of
[(6) working conditions] ① Is there a possibility that diseases, including communicable diseases, such as HIV will be
Increased traffic caused by relative vehicles
○ [Common] Measures to protect working environment and working health of the workers shall be discussed based on the relevant laws and regulations.

4-34
Category
Environmental Item
Main Check Items Major Impact
Impact Level (○: significant, ×: insignificant)
Mitigation Measure to be Conducted and Necessary Consideration JICA Guidelines JBIC Guidelines
workers associated with the project? Are adequate considerations given to public health, if necessary?
introduced to immigration due of workers associated with the project? Are adequate considerations given to public health, if necessary?
(e) Is there a possibility that the amount of water used (e.g., surface water, groundwater) and discharge of thermal effluents by the project will adversely affect existing water uses and uses of water areas (especially fishing)?
④ Is there a possibility that the amount of water used (including surface water, groundwater) and discharge of thermal effluents by the project will adversely affect existing water uses and uses of water areas (especially fishing)?
・ Water intake for cooling water and plant water ・ Thermal effluent discharge ・ Discharge of wastewater from the plant
○ [Common] Consideration of the necessary amount of water intake (cooling water, process water, etc.) Confirmation of the current status of fishery.
(3) Heritage
(a) Is there a possibility that the project will damage the local archeological, historical, cultural, and religious heritage sites? Are adequate measures considered to protect these sites in accordance with the country’s laws?
① Is there a possibility that the project will damage the local archeological, historical, cultural, and religious heritage sites? Are adequate measures considered to protect these sites in accordance with the host country’s laws?
Installation of power generation facility
× [Common] There are no archaeological, historical, cultural, religious heritage sites within the project site.
(4) Landscape
(a) Is there a possibility that the project will adversely affect the local landscape? Are necessary measures taken?
① Is there a possibility that the project will adversely affect the local landscape? Are necessary measures taken?
Installation of power generation facility
○ [kuantan] A resort site exists 3km north of the site, and the impact on the landscape should be considered.
(5) Ethnic Minorities and Indigenous Peoples
(a) Are considerations given to reduce the impacts on culture and lifestyle of ethnic minorities and indigenous peoples?
① Are the impacts to ethnic minorities and indigenous peoples avoidable by project implementation? If unavoidable, are efforts made to minimize the impacts and to compensate for their losses? ③ Is the
Land acquisition
× [Common] There are no ethnic minorities and indigenous people living within and around the project site.

4-35
Category
Environmental Item
Main Check Items Major Impact
Impact Level (○: significant, ×: insignificant)
Mitigation Measure to be Conducted and Necessary Consideration JICA Guidelines JBIC Guidelines
indigenous peoples plan prepared and made public? Does the indigenous peoples plan include elements required in the standard of the international financial institution benchmarked in its environmental reviews? ④ In preparing the indigenous peoples plan, is consultation made with the affected ethnic minorities and indigenous peoples based on sufficient information made available to them in advance and are explanations given in a form, manner, and language that are understandable to them? ⑤ Are the free, prior, and informed consents of the indigenous peoples obtained?
(b) Does the project comply with the country’s laws for rights of ethnic minorities and indigenous peoples?
② If the project has adverse impacts on indigenous peoples' various rights in relation to land and resources, is such rights respected?
- - -
(6) working conditions(including working safety)
(a) Is the project proponent not violating any laws and ordinances associated with the working conditions of the country which the project proponent should observe in the project?
① Is the project proponent not violating any laws and regulations associated with the working conditions of the host country which the project proponent should observe in the project?
Employment of workers
○ [Common] Measures to protect working environment of the workers shall be discussed based on the relevant laws and regulations.
(b) Are tangible safety considerations in place for
② Are tangible safety considerations in place for
Employment of workers
○ [Common] Installation of fire preventive equipment and safety gear should be

4-36
Category
Environmental Item
Main Check Items Major Impact
Impact Level (○: significant, ×: insignificant)
Mitigation Measure to be Conducted and Necessary Consideration JICA Guidelines JBIC Guidelines
individuals involved in the project, such as the installation of safety equipment which prevents industrial accidents, and management of hazardous materials?
individuals involved in the project, such as the installation of safety equipment which prevents industrial accidents, and management of hazardous materials?
considered based on the relevant laws and regulations.
(c) Are intangible measures being planned and implemented for individuals involved in the project, such as the establishment of a safety and health program, and safety training (including traffic safety and public sanitation) for workers etc.?
③ Are intangible measures being planned and implemented for individuals involved in the project, such as the establishment of a safety and health program, and safety training (including traffic safety and public sanitation) for workers etc.?
Employment of workers
○ [Common] The development of the implementation plan concerning safety management, public health, and emergency actions shall be considered.
(d) Are appropriate measures being taken to ensure that security guards involved in the project do not violate safety of other individuals involved, or local residents?
④ Are appropriate measures being taken to ensure that security guards involved in the project do not violate safety of other individuals involved, or local residents?
Employment of security personnel
○ [Common] The development of the implementation plan concerning security system, training, etc. of the security guards shall be considered.
5 Others
(1) Impacts during construction
(a) Are adequate measures considered to reduce impacts during construction (e.g., noise, vibrations, turbid water, dust, exhaust gases, and wastes)?
① Are adequate measures considered to reduce impacts during construction (e.g. noise, vibrations, turbid water, dust, exhaust gases, and wastes)?
・ Generation of dust ・ Generation of noise ・ Generation of turbid water ・ Generation of waste
○ [Common] The following countermeasures shall be developed for construction phase. ⋅ Use of covering for
the soil-transporting vehicles. Watering of the roads and construction site.
⋅ Maintenance of vehicles transporting construction materials.
⋅ Piling activity should be conducted in daytime to the possible extent.
⋅ Drainage fitted to the landscape and necessary capacity shall be installed

4-37
Category
Environmental Item
Main Check Items Major Impact
Impact Level (○: significant, ×: insignificant)
Mitigation Measure to be Conducted and Necessary Consideration JICA Guidelines JBIC Guidelines
prior to the construction activity.
(b) If construction activities adversely affect the natural environment (ecosystem), are adequate measures considered to reduce impacts?
② If construction activities adversely affect the natural environment (ecosystem), are adequate measures considered to reduce impacts?
Land development
○ [Common] Appropriate protective measures will be discussed as necessary based on the survey result of flora and fauna.
(c) If construction activities adversely affect the social environment, are adequate measures considered to reduce impacts?
③ If construction activities adversely affect the social environment, are adequate measures considered to reduce impacts?
・ Inflow of workers and increased economic activity ・ Increased traffic caused by construction vehicles
○ [Common] The following measures shall be considered prior to construction activity. ⋅ Enhancement of
employment of local people and utilization of local industries to activate local economy.
⋅ The notification of the construction plan and traffic accident prevention measures.
(2) Accident prevention
(a) In the case of coal-fired power plants, are adequate measures planned to prevent spontaneous combustion at the coal piles? (e.g., sprinkler systems).
① Are adequate accident prevention plans and mitigation measures developed to cover both the soft and hard aspects of the project, such as establishment of safety rules, installation of prevention facilities and equipment, and safety education for workers? Are adequate measures for emergency response to accidental events considered? ② Are adequate accident prevention measures (e.g. installation of prevention facilities and equipment and establishment of prevention management framework) taken
- - -

4-38
Category
Environmental Item
Main Check Items Major Impact
Impact Level (○: significant, ×: insignificant)
Mitigation Measure to be Conducted and Necessary Consideration JICA Guidelines JBIC Guidelines
for storage, loading/unloading, and transportation of hazardous and dangerous materials?
(3) Monitoring
(a) Does the proponent develop and implement monitoring program for the environmental items described above that are considered to have potential impacts?
① Are the monitoring programs and environmental management plans of the project prepared?
- - [Common] According to the monitoring plan developed during the EIA process, regular monitoring of exhaust gas, effluent, ambient air quality, water quality, and noise should be done.
(b) Are the items, methods and frequencies included in the monitoring program judged to be appropriate?
② Are the items, methods and frequencies included in the monitoring program judged to be appropriate?
- - [Common] According to the monitoring plan developed during the EIA process, implementation of appropriate monitoring items, method and frequency in cooperation with the regulatory authority should be decided.
(c) Does the proponent establish an adequate monitoring framework (organization, personnel, equipment, and adequate budget to sustain the monitoring framework)?
③ Does the proponent establish an adequate monitoring framework (organization, personnel, equipment, and adequate budget to sustain the monitoring framework)?
- - [Common] According to the environmental management plan, development of monitoring organization should be done.
(d) Are any regulatory requirements pertaining to the monitoring report system identified, such as the format and frequency of reports from the proponent to the regulatory authorities?
④ Are any regulatory requirements pertaining to the monitoring report system identified, such as the format and frequency of reports from the proponent to the regulatory authorities? ⑤ Are the results of monitoring planned to be disclosed to the stakeholders of the project?
- - [Common] Project proponent should report the monitoring results to the regulatory authority (DOE).
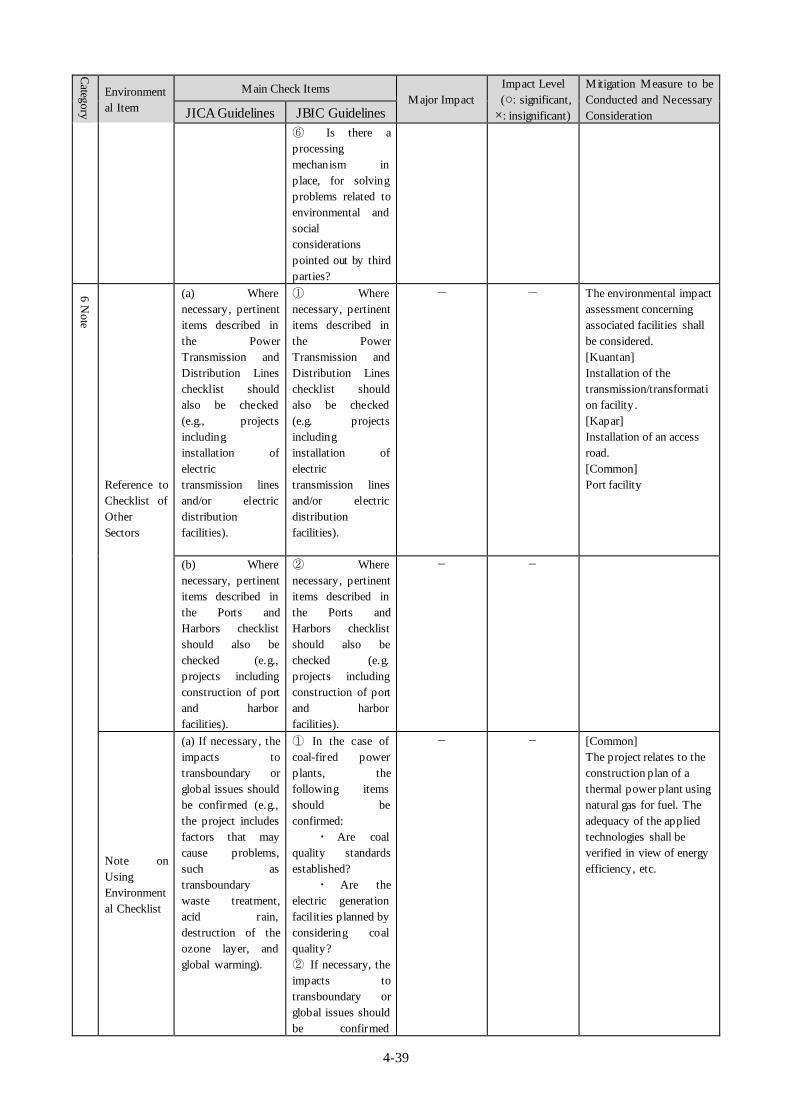
4-39
Category
Environmental Item
Main Check Items Major Impact
Impact Level (○: significant, ×: insignificant)
Mitigation Measure to be Conducted and Necessary Consideration JICA Guidelines JBIC Guidelines
⑥ Is there a processing mechanism in place, for solving problems related to environmental and social considerations pointed out by third parties?
6 Note
Reference to Checklist of Other Sectors
(a) Where necessary, pertinent items described in the Power Transmission and Distribution Lines checklist should also be checked (e.g., projects including installation of electric transmission lines and/or electric distribution facilities).
① Where necessary, pertinent items described in the Power Transmission and Distribution Lines checklist should also be checked (e.g. projects including installation of electric transmission lines and/or electric distribution facilities).
- - The environmental impact assessment concerning associated facilities shall be considered. [Kuantan] Installation of the transmission/transformation facility. [Kapar] Installation of an access road. [Common] Port facility
(b) Where necessary, pertinent items described in the Ports and Harbors checklist should also be checked (e.g., projects including construction of port and harbor facilities).
② Where necessary, pertinent items described in the Ports and Harbors checklist should also be checked (e.g. projects including construction of port and harbor facilities).
- -
Note on Using Environmental Checklist
(a) If necessary, the impacts to transboundary or global issues should be confirmed (e.g., the project includes factors that may cause problems, such as transboundary waste treatment, acid rain, destruction of the ozone layer, and global warming).
① In the case of coal-fired power plants, the following items should be confirmed: ・ Are coal quality standards established? ・ Are the electric generation facilities planned by considering coal quality? ② If necessary, the impacts to transboundary or global issues should be confirmed
- - [Common] The project relates to the construction plan of a thermal power plant using natural gas for fuel. The adequacy of the applied technologies shall be verified in view of energy efficiency, etc.

4-40
Category
Environmental Item
Main Check Items Major Impact
Impact Level (○: significant, ×: insignificant)
Mitigation Measure to be Conducted and Necessary Consideration JICA Guidelines JBIC Guidelines
(including the project includes factors that may cause problems, such as transboundary waste treatment, acid rain, destruction of the ozone layer, and global warming).
(Source: developed by the Survey Team)

4-41
(6) Development of the monitoring plan (implementation system and method, etc)
1) Outline of the monitoring plan
It is essential to conduct an appropriate monitoring during construction and operation period with consideration
for the characteristics of the project and the locality. Table 4-9(1)(2) describes the monitoring plan.
It is necessary to conduct sampling and the analys is of the monitoring result according to the relevant laws and
regulations and international standards. In order to ensure the reliability of the monitoring result, it is
recommended to implement regular investigation of the analysis of the monitoring result by the relevant
organization or the expert.
Table 4-9 (1) Environmental monitoring (Construction phase)
Parameter Location Air quality _Nitrogen Oxide, PM10(Particle Size<10μm)
Surrounding residence
Noise and Vibration _ Noise level, Vibration level
Boundary of the site and Surrounding residence
Waste water _ pH、TSS
Outlet of sedimentation basin
Water quality _ pH, Temperature, DO, COD(or BOD), TSS, Oil and grease, chloride, NH4 -N, NO3 -N etc.
Sea/river around construction area
Fauna and Flora _ Terrestrial organism _ Marine organisms (Macro benthos, Plankton, Nekton)
In and around the site
Note; Frequency of monitoring will be decided based on EIA approval condition.
Table4-9 (2) Environmental monitoring (Operation phase)
Parameter Location Exhaust gas _Nitrogen Oxide
Stack
Noise _ Noise level
Boundary of the site and Surrounding residence
Thermal effluent _ Temperature, Residual Chlorine
Outlet
Discharge water _ pH, Temperature, COD, TSS, Oil and grease, Residual Chlorine, NH4 -N, NO3 -N etc.
Outlet of waste water treatment facility
Ambient water quality _ pH, Temperature, DO, COD(or BOD), TSS, Oil and grease, chloride, NH4 -N, NO3 -N etc.
Sea/River around the site
Fauna and Flora _ Terrestrial organism _ Marine organisms (Macro benthos, Plankton, Nekton)
In and around the site
Note; Frequency of monitoring will be decided based on EIA approval condition.
(Source: developed by the Survey Team)
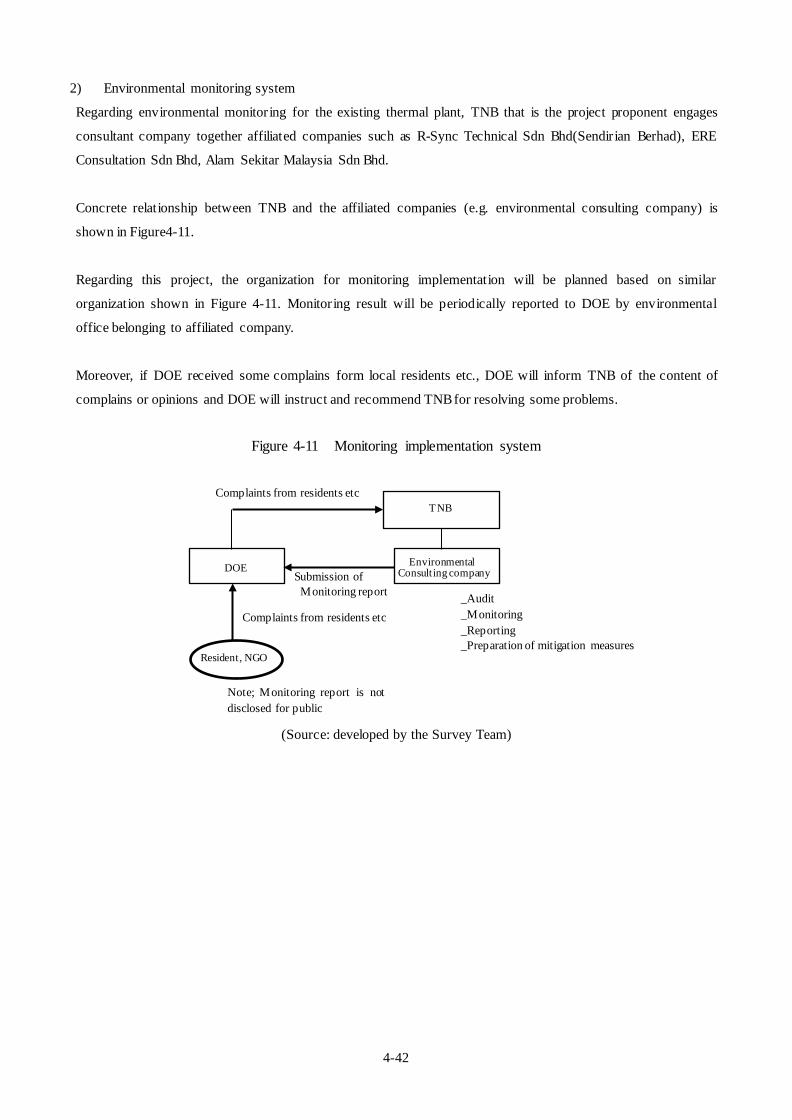
4-42
2) Environmental monitoring system
Regarding environmental monitoring for the existing thermal plant, TNB that is the project proponent engages
consultant company together affiliated companies such as R-Sync Technical Sdn Bhd(Sendirian Berhad), ERE
Consultation Sdn Bhd, Alam Sekitar Malaysia Sdn Bhd.
Concrete relationship between TNB and the affiliated companies (e.g. environmental consulting company) is
shown in Figure4-11.
Regarding this project, the organization for monitoring implementation will be planned based on similar
organization shown in Figure 4-11. Monitoring result will be periodically reported to DOE by environmental
office belonging to affiliated company.
Moreover, if DOE received some complains form local residents etc., DOE will inform TNB of the content of
complains or opinions and DOE will instruct and recommend TNB for resolving some problems.
Figure 4-11 Monitoring implementation system
(Source: developed by the Survey Team)
Resident, NGO
Environmental Consulting company
TNB
_Audit _Monitoring _Reporting _Preparation of mitigation measures
Submission of Monitoring report
Complaints from residents etc
Note; Monitoring report is not disclosed for public
Complaints from residents etc
DOE

4-43
(7) Confirmation of the environmental social consideration system and organization of the host country
1) Environmental administration of Malaysia2
Environmental Quality Act was enacted in 1974, and the DOE was established in 1975.
In 2004 Ministry of Natural Resources and Environment was established in parallel with cross-ministry
restructuring of the organization: Department of Director General of Lands and Mines, Forestry Department
Peninsular Malaysia, Forest Research Institute Malaysia and Minerals and Geosciences Department Malaysia,
Department of Environment, and Department of Wildlife & National Parks Peninsular Malaysia entered into the
subsidiary organizations of the Ministry of Natural Resources and Environment.
DOE developed the state offices and the local offices throughout the country to take responsibility in
environmental administration such as supervision of the exhaust gas and waste water from factories, monitoring of
the atmosphere and water quality, and environmental impact assessment.
2) Outline of the environmental laws and regulations in Malaysia
(a) Conservation of environment
Environmental Quality Act was enacted in 1974.
It determines the function of DOE to administer the general environmental regulations, including environmental
regulations, environmental conservation, and mitigation measures. Later, the Act was revised in the context of
emerging environmental problems, and constitutes the basis for developing specif ic environmental regulations for
environmental pollution control policy such as air pollution and water pollution, and environmental impact
assessment.
(b) Air quality
Emission standard is established by the regulations and decree based on the Environmental Quality Act. The
following tables indicate the emission standard for fixed emission sources and the guideline value for ambient air
quality.
2 (ⅰ)Official Portal Ministry of Natural Resources and Environment -Frequency Asked Question- (ⅱ)URL: http://www.nre.gov.my/en-my/Pages/faq.aspx (ⅲ)November 16 2015 (Confirmation date)

4-44
Table 4-10 Emission standards
Parameter Unit CLEAN AIR* IFC guideline
Thermal power plant**
SO2 mg/Nm3 200(SO2 ) --- NOx (NO+
NO ) mg/Nm3 200 51(25ppm) at O2
15% TSP mg/Nm3 400 --- Cl mg/Nm3 200 ---
HCl mg/Nm3 200 --- H2 S ppm 5 ---
Mercury mg/Nm3 10 --- Cadmium mg/Nm3 15 ---
Lead mg/Nm3 25 --- Antimony mg/Nm3 25 --- Arsenic mg/Nm3 25 ---
Zinc mg/Nm3 100 --- Copper mg/Nm3 100 ---
Note: all values were verified by the latest EQA on 5th Feb 2015. * In case of combustion processes of new facility **Combustion Turbine (Fuel; natural gas)
(Source: ENVIRONMENTAL QUALITY (CLEAN AIR) REGULATIONS, 1978 PU(A) 280/1978 Environmental Requirements: A Guide for Investors (October 2010))
Table 4-11 Ambient Air Quality standards
Parameter
MAAQG IFC General EHS Guidelines ppm μg/m3(mg/m3)* μg/m3
Ozone 0.10(1hr) 0.06(8hr)
200(1hr) 120
---
CO 30(1hr) 9(8hr)
35(1hr) * -
---
NO2 0.17(1hr)
0.04(24hr) 320(1hr) 10(24hr)
200 (1hr) 40 (1year)
SO2 0.19(10min)
0.13(1hr) 0.04(24hr)
500(10min) 350(1hr)
105(24hr)
500(10min) 125(Interim target-1)(24hrs)
PM10 --- 150(24hr) 50(1year)
150(Interim target-1)(1hr) 70(Interim target-1) (1year)
TSP --- 260(24hr) 90(1year)
---
Lead --- 1.5(3month) ---
Note: 25°C,101.13kPa (Source: Malaysia ambient air quality guideline; MAAQG
Environmental Requirements: A Guide for Investors (October 2010))
[Relative laws and regulations]
Malaysia ambient air quality guideline; MAAQG ENVIRONMENTAL QUALITY (CLEAN AIR) REGULATIONS, 1978 PU(A) 280/1978

4-45
(c) Water quality
The effluent discharge standard and water quality standard for rivers and oceans are set as follows based on the
Environmental Quality Act.
Table 4-12 (1) Sewage Discharge Standards
Parameter Unit
ENVIRONMENTAL QUALITY ACT
IFC General EHS Guidelines
A B Values for Treated Sanitary Sewage Discharges
Temperature °C 40 40 ---
pH --- 6.0 - 9.0 5.5 - 9.0 6-9 BOD mg/l 20 50 30
COD mg/l 120 200 125 Suspended Solids mg/l 50 100 50
Oil and Grease mg/l 5 10 10 Ammonia Nitrogen _ enclosed water body _ river
mg/l 5
10 5
20 ---
Nitrate Nitrogen _ enclosed water body _ river
mg/l 10 20
10 50
10(Total nitrogen)
Phosphorous (Total) _ enclosed water body
mg/l 5 10 2
Note: Standard A is applicable to discharges into any inland waters within catchment areas listed in the Third Schedule, while Standard B is applicable to any other inland waters or Malaysian waters.

4-46
Table4-12 (2) Industrial Effluent Discharge Standards
Parameter Unit ENVIRONMENTAL
QUALITY ACT IFC guideline
A B Thermal power plant Temperature °C 40 40 --- pH --- 6.0 - 9.0 5.5 - 9.0 6-9
BOD at 20℃ mg/l 20 50 ---
Suspended Solids mg/l 50 100 50 Mercury mg/l 0.005 0.05 0.005
Cadmium mg/l 0.01 0.02 0.1 Chromium, Hexavalent
mg/l 0.05 0.05 ---
Chromium, Trivalent mg/l 0.2 1 0.5(Total Chromium)
Arsenic mg/l 0.05 0.1 0.5 Cyanide mg/l 0.05 0.1 ---
Lead mg/l 0.1 0.5 0.5 Copper mg/l 0.2 1 0.5
Manganese mg/l 0.2 1 ---
Nickel mg/l 0.2 1 --- Tin mg/l 0.2 1 ---
Zinc mg/l 2 2 --- Boron mg/l 1 4 1.0
Iron mg/l 1 5 1.0 Silver mg/l 0.1 1 --- Aluminum mg/l 10 15 ---
Selenium mg/l 0.02 0.5 ---
Barium mg/l 1 2 ---
Fluoride mg/l 2 5 ---
Formaldehyde mg/l 1 2 ---
Phenol mg/l 0.001 1 ---
Free Chlorine mg/l 1 2 0.2
(Total residual chloride)
Sulphide mg/l 0.5 0.5 --- Oil and Grease mg/l 1 10 ---
Ammonia Nitrogen mg/l 10 20 --- Color ADMI 100 200 ---
Note: Standard A is applicable to discharges into any inland waters within catchment areas listed in the Third Schedule, while Standard B is applicable to any other inland waters or Malaysian waters.
*American Dye Manufactures Institute (Source: ENVIRONMENTAL QUALITY ACT, 1974, the Malaysia Environmental Quality
(Sewage and Industrial Effluents) Regulations, 1979, 1999, 2000
Environmental Requirements: A Guide for Investors (October 2010))

4-47
Table 4-13 National Water Quality Standards
Parameter Unit I IIA IIB III IV V Ammonia nitrogen
mg/l 0.1 0.3 0.3 0.9 2.7 >2.7
BOD mg/l 1 3 3 6 12 >12 COD mg/l 10 25 25 50 100 >100 DO mg/l 7 5.0-7.0 5.0-7.0 3.0-5.0 <3.0 <1.0 pH - 6.5-8.5 6.0-9.0 6.0-9.0 5.0-9.0 5.0-9.0 --- Color TCU 15 150 150 --- --- --- Electrical Conductivity
umhos/cm 1,000 1,000 --- --- 6,000 ---
Floatables --- n n n --- --- --- Odor --- n n n --- --- --- Salinity % 0.5 1 --- --- 2 --- Taste --- n n n --- --- --- Total Dissolved Solid
mg/l 500 1,000 --- --- 4,000 ---
Total Suspended Solid
mg/l 25 50 50 150 300 300
Temperature °C --- Normal +2°C
--- Normal +2°C
--- ---
Turbidity NTU 5 50 50 --- --- ---
Faecal Coliform
counts/100 mL
10 100 400 5,000
(20,000)a 5,000
(20,000)a ---
Total Coliform
counts/100 mL
100 5,000 5,000 50,000 50,000 >50,000
Iron mg/l Natural
levels or absent
1 1 1 1 (Leaf)
5(Others) Levels
above IV
Manganese mg/l Natural
levels or absent
0.1 0.1 0.1 0.2 Levels
above IV
Nitrate mg/l Natural
levels or absent
7 7 --- 5 Levels
above IV
Phosphorous mg/l Natural
levels or absent
0.2 0.2 0.1 --- Levels
above IV
Oil & Grease mg/l Natural
levels or absent
0.04; N 0.04; N N --- Levels
above IV
Notes: n : No visible floatable materials or debris or No objectionable odor, or No objectionable taste. a : maximum not to be exceeded. N : Free from visible sheen, discoloration and deposits.
Class Uses Class I : Conservation of natural environment.
Water Supply 1 – practically no treatment necessary. Fishery 1 – very sensitive aquatic species. Class IIA : Water Supply II – conventional treatment required. Fishery II – sensitive aquatic species. Class IIB : Recreational use with body contact. Class III : Water Supply III – extensive treatment required.
Fishery III – common, of economic value and tolerant species; livestock drinking. Class IV : Irrigation. Class V : None of the above.
(Source: ENVIRONMENTAL QUALITY ACT, 1974, the Malaysia Environmental Quality (Sewage and Industrial Effluents) Regulations, 1979, 1999, 2000 Environmental Requirements: A Guide for Investors (October 2010))

4-48
Table 4-14 Marine Water Quality Criteria and Standards
Parameter Unit 1 2 3 E
Temperature °C Ambient
2°C Ambient
2°C Ambient+2°
C Ambient+2°
C
DO mg/l >80saturatio
n 5 3 4
Total Suspended Solid
mg/l 25
(10%)* 50
(10%) 100
(10%) 100
(30%) Oil & Grease mg/l 0.01 0.14 5 0.14 Mercury μg/l 0.04 0.16 50 0.5 Cadmium μg/l 0.5 2 10 2 Chromium, Hexavalent
μg/l 5 10 48 10
Copper μg/l 1.3 2.9 10 2.9 Arsenic μg/l 3 20(3) ** 50 20(3) Lead μg/l 4.4 8.5 50 20 Zinc μg/l 15 50 100 50 Cyanide μg/l 2 7 20 7 Ammonia μg/l 35 70 320 70 Nitrite μg/l 10 55 1,000 55 Nitrate μg/l 10 60 1,000 60 Phosphate μg/l 5 75 670 75 Phenol μg/l 1 10 100 10 Tri butyl tin μg/l 0.001 0.01 0.05 0.01
Faecal Coliform counts/100 mL
70 100 200 100
Polycyclic Aromatic Hydrocarbon(PAHs)
mg/l 100 200 1000 1000
Notes: Class 1 : Preservation, Marine, Protected areas, Marine park Class 2 Marine life, Fisheries, Coral Reefs, Recreational and Mari culture Class 3 Port, Oil & Gas Field, Fisheries Class E Mangroves Estuarine & River-mouth Water
* If it is within value (proportion) that is shown in parentheses as compared with seasonal average, it is classified that the value is low.
** The value that is shown in parentheses is for coastal and marine water areas where seafood for human
consumption is applicable. (Source: ENVIRONMENTAL QUALITY ACT, 1974, the Malaysia Environmental Quality
(Sewage and Industrial Effluents) Regulations, 1979, 1999, 2000 Environmental Requirements: A Guide for Investors (October 2010))
[Relative laws and regulations]
Malaysia Environmental Quality (Sewage and Industrial Effluents) Regulations, 1979, 1999, 2000、2009
Marine Water Quality Criteria and Standard; NWQSM
(d) Noise and Vibration
According to “Planning Guidelines for Environmental Noise Limits and Control”(DOE) and “Vibration Limits
and Control in the Environment”(DOE), noise level is set based on the land use of the surrounding area, and
vibration level is set based on the type of structure, as described in the following tables.

4-49
Table 4-15 Noise Level
Receiving Land Use
Schedule1 DOE Noise guideline (Industry) Unit dBA
IFC General EHS Guidelines
Unit dBA
Day time 7:00-22:00
Night time 22:00-7:00
Day time 7:00-22:00
Night time 22:00-7:00
Noise Sensitive Areas, Low Density Residential, Institutional (School, Hospital), Worship Areas
50 40
55(Residential, Institutional, educational)
45(Residential, Institutional, educational)
Suburban Residential, Areas, Public Spaces, Parks, Recreational Areas
55 45
Urban Residential Areas, Designated Mixed Development Areas (Residential - Commercial)
60 50
Commercial Business Zones
65 55 70(Industrial, commercial)
70(Industrial, commercial) Designated Industrial
Zones 70 60
Note: the existing noise climate (LAeq ) is higher than the planning values. When the noise limits (LAeq = L90 + 10(In case of Noise Sensitive Areas at Night time LAeq = L90 + 5))
(Source: Environmental Noise Limits and control (DOE))
Table 4-16 Vibration Level
Type of Structure Vertical Vibration Peak Velocity [mm/s] at
foundation [as defined by respective curves] [SCHEDULE 1] Recommended Limits For Damage Risk In Buildings From Steady State Vibration Safe Less Than 3(10 - 100 Hz) Caution Level (Damage Not Necessary Inevitable)
3 to 5 (10 - 100 Hz)
Minor Damage 5 to 30 (10 - 100 Hz) Major Damage More Than 30 (10 - 100 Hz) [SCHEDULE 2] Recommended Limits For Damage Risk In Buildings From Short Term Vibration Industrial buildings and buildings of similar design
40 (all frequencies)
Commercial building dwelling and buildings of similar design and/or use
15 (all frequencies)
Structures that, because of their particular sensitivity to vibration, do not correspond to those listed above, or of great intrinsic value (e.g. residential house, or building under preservation order)
8 (all frequencies)
[SCHEDULE 3] Recommended Limits For Damage Risk IN Buildings From Single Event Impulsive Excitation Industrial buildings and buildings of similar design
40 (< 40 Hz) 50 (> 40 Hz)
Commercial building dwelling and buildings of similar design and/or use
20 (< 40 Hz) 50 (> 40 Hz)
Structures that, because of their particular sensitivity to vibration, do not correspond to those listed above, or of great intrinsic value
12 (< 40 Hz) 50 (> 40 Hz)
(Source: Vibration Limits and Control in the Environment Environmental (DOE))

4-50
[Relative laws and regulations]
Planning Guidelines for Environmental Noise Limits and Control (DOE)
Vibration Limits and Control in the Environment (DOE)
(e) Conservation of nature
In Malaysia, Wildlife Conservation Act 2010 (WCA) , International Trade in Endangered Species Act 2008
stipulate regulations, special exemptions and penalties for the purpose of protection and conservation of wild
animals, and National Heritage Act 2005 stipulates regulations for conservation and protection of cultural
heritages and historical sites.
[Relative laws and regulations]
Wildlife Conservation Act 2010(WCA)
International Trade in Endangered Species Act 2008
National Heritage Act 2005
(f) Hazardous materials and waste management
Environmental Quality (Scheduled Wastes) Regulations 2005 was enacted under the Environmental Quality Act to
stipulate waste management and disposal administration.
An action plan is developed to promote generation control, reuse and recycle of waste based on “Solid Waste and
Public Cleansing Management Cooperation Act 2007” under the responsibility of the Ministry of Housing and
Local Government.
[Relative laws and regulations]
Environmental Quality (Scheduled Wastes) Regulations 2005
Solid Waste and Public Cleansing Management Cooperation Act 2007
(g) Labor Environment (Occupational safety and health)
Employment Act, 1955 was developed as a comprehensive labor act, with the following related laws.
[Relative laws and regulations]
Workman’s Compensation Act, 1952
Employment Act, 1955
Trade Union Act, 1959
Industrial Relation Act, 1967
Factories and Machineries Act, 1967
Employees Social Security Act, 1969
Occupational, Safety and Health Act, 1994

4-51
3) Outline of the EIA (Environmental impact assessment) of the host country required for the project
implementation and the strategy
(a) Outline of the EIA (Environmental impact assessment) in Malaysia
The environmental impact assessment (EIA) in Malaysia is regulated by Environmental Quality (Prescribed
Activities) (Environmental Impact Assessment) Order 2015 based on the Environmental Quality Act 1974.
This order requires that EIA (First Schedule) is developed for 21 industries including POWER GENERATION
AND TRANSMISSION3and submitted to the Department of Environment of the Ministry of Natural Resources
and Environment.
First Schedule is reviwed by Technical Committee of DOE. Members of Technical Committee are composed by
EIA panel, other authorities, NGO as member of Technical Committee. Term for review is needed 4-5 weeks at
the earliest. The industry** determined as having significant environmental impact is required to develop a
Detailed Environmental Impact Assessment Report (DEIA) to receive approval from the DOE(as EIA (Second
Schedule).
** Applied to the following electricity industries:
- Construction of coal fired power station and having the capacity of 10 megawatts or more with or
without transmission line
- Construction of nuclear-fuel power station with or without transmission line
The DEIA is reviewed by special technical committee chaired by the director of DOE.
The committee recommends advises for DEIA, collateral condition concerning the project. Term for review is
needed 8-12 weeks at the earliest.
As a part of EIA procedure, the project proponent needs to get the public participation and the interest of the local
group to gain the acceptance of the project. The project proponent has to explain the impacts associated to the
project to the public and produce mitigation action which is accepted by the public.
A period of validity is set at the time of DEIA report approval, and if the project is not able to be initiated during
that period(Two years), the approval is annulled.
Regarding the document disclosed by DOE on Octorber 2015, in case the plan of project was modified during a
procedure of preliminary assessment, revision of the EIA is required. The project proponent needs to update the
revised modification to DOE. Moreover, in case the plan of project was modified after approval of DEIA, the
project proponent has to reapply approval of DEIA or accorded reapproval including modification of plan, as
result, it depending on the case.
Figure 4-12 indicates the flowchart of EIA procedure.
3 Applied to the following electricity industries:
- Construction of steam generated power station using fossil fuels (other than coal) and having the capacity of 10 megawatts or more, with or without transmission line.
- Construction of combined cycle power station, with or without transmission line. - Construction of transmission line in environmentally sensitive area

4-52
Project proponent shall periodically submit DOE the monitoring report during construction and operating. When
DOE accepts any complains of local residents, DOE will instruct Project proponent to solve any problems
Figure 4-12 Flow of EIA procedure
The procedure for preliminary EIA The procedure for detailed EIA
(Source: Environmental guideline Handbook)
[Relative laws and regulations]
Environmental Quality Act, 1974
Environmental Quality (Prescribed Activities) (Environmental Impact Assessment) Order 2015
(b) EIA strategy
As the EIA procedure is conducted following the relevant laws in Malaysia, the EIA of the project should also be
implemented following the procedure.
The EIA procedure should be conducted in accordance with the relevant environmental social consideration
guidelines such as JICA guidelines. It is also essential to collect the opinions of the stakeholders and the local
residents through information disclosure and public consultation from the early stage of the project and reflect the
result to the design, construction and operation policy of the project.

Chapter 5. Financial and Economic Evaluation


5-1
(1) Project Cost Estimation
1) Construction Cost (Engineering, Procurement and Construction: EPC)
Construction cost of the 1000MW to 1,400MW gas combined cycle power plant is estimated base on the
computer software called “SOAPP” made by EPRI of USA and other actual EPC costs. Table 5-1 shows the EPC
cost at Kuantan site, and Table 5-2 shows EPC cost at Kapar site.
Table 5-1 Total Cost of Project (before taxes)
Project Site: Kuantan
Component Total Cost (JPY million)
Foreign Currency
(JPY million)
Local Currency (JPY million)
A. Construction Work Power Plant 92,204.1 64,543.1 27,661.0
Civil Work 4,222.4 3,854.4 368.0
Gas supply system 250.0 200.0 50.0
Substation 4,727.0 4,253.0 474.0
Transmission Line 1,630.0 165.0 1,465.0
Land acquisition 5,371.5 - 5,371.5
Sub-total 108,405.0 73,015.5 35,389.5
B. Consulting Services 1,970.3 1,577.2 393.1
C. Contingency(Physical)*1 10,840.5 7,301.5 3,539.0 D. Interest during construction*2 737.9 737.9 - E. Total 121,953.7 82,632.1 39,321.6
(Source: Prepared by the Survey Team) Note *1. Contingency (Physical) is estimated at a 10% of total construction costs excluding land acquisition *2. Interest during construction is estimated based on funding by JICA Yen Loan

5-2
Table 5-2 Total Cost of Project (before taxes)
Project Site: Kapar Component Total Cost
(JPY million) Foreign
Currency (JPY million)
Local Currency
(JPY million) A. Construction Cost Power Plan 92,204.1 64,543.1 27,661.0
Civil Work 16,041.0 14,184.0 1,857.0
Gas supply system 490.0 392.0 98.0
Substation 5,289.0 4,760.0 529.0
Transmission Line 123.0 13.0 110.0
Land acquisition and reclamation*1
4,330.7 - 4,330.7
Sub-total 118,477.8 83,892.1 34,585.7
B. Consulting Services 1,970.3 1,577.2 393.1
C. Contingency (Physical)*2 11,847.8 8,389.2 3,458.6 D. Interest during construction*3 874.6 874.6 - E. Total 133,170.5 94,733.1 38,437.4
(Source: Prepared by the Survey Team) Note *1. While a land for a scheduled construction site in Kapar has been already owned by TNB, for the purpose of the
financial analysis, its cost is estimated as newly acquired land at the unit price (RM15.6/ft2, Land area 50 acre) at which the land for a scheduled construction site in Kuantan will be acquired. In addition, RM130 million is estimated for land reclamation.
*2. Contingency (Physical) is estimated at a 10% of total construction costs excluding land acquisition
*3. Interest during construction is estimated based on funding by JICA Yen Loan

5-3
(2) Preliminary Financial and Economic Analysis
1) Framework of the Analysis
The financial and economic viability of the project in the final candidate project sites, Kuantan and Kapar, are
analyzed and evaluated. The project cost in each candidate site, the basic framework of the project, and the
summary of basic assumption of financial and economic analysis are summarized in Table 5-1 and Table 5-2
above, and Table 5-3 and Table 5-4 below.
Table 5-3 Basic Framework of the Project (common in both sites) Power Output 1229.8MW*1 Plant Capacity Factor 50%*2 Construction to Start January 2018 Commercial Operation to Start January 2021 Project Period(from commercial operation starts) 21 years
(Source: prepare by the Survey Team) (Note) *1. Power Output excludes the amount of auxiliary power *2.TNB asks to apply a 50% of plant capacity factor with a consideration of the plant characteristics which is superior to load fluctuation. A gas fired combined cycle power plant is usually required to be operated at middle load level according to electricity demand.
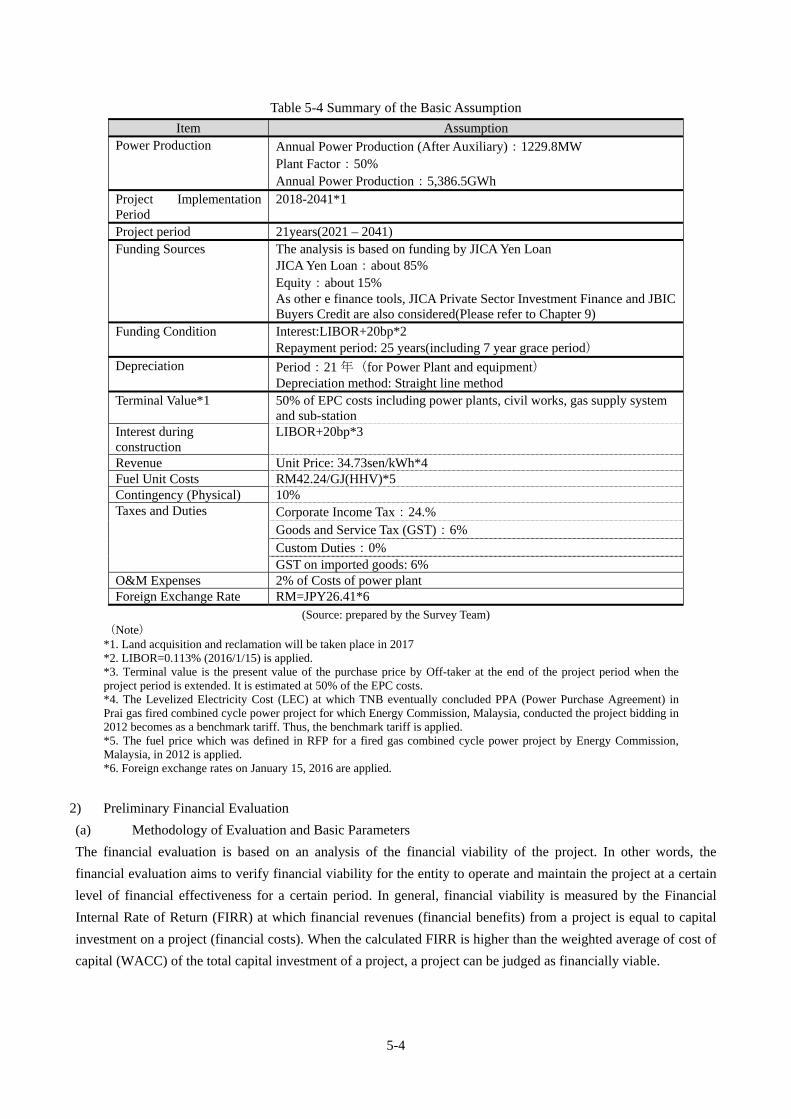
5-4
Table 5-4 Summary of the Basic Assumption
Item Assumption Power Production Annual Power Production (After Auxiliary):1229.8MW
Plant Factor:50% Annual Power Production:5,386.5GWh
Project Implementation Period
2018-2041*1
Project period 21years(2021 – 2041) Funding Sources The analysis is based on funding by JICA Yen Loan
JICA Yen Loan:about 85% Equity:about 15% As other e finance tools, JICA Private Sector Investment Finance and JBIC Buyers Credit are also considered(Please refer to Chapter 9)
Funding Condition Interest:LIBOR+20bp*2 Repayment period: 25 years(including 7 year grace period)
Depreciation Period:21 年(for Power Plant and equipment) Depreciation method: Straight line method
Terminal Value*1 50% of EPC costs including power plants, civil works, gas supply system and sub-station
Interest during construction
LIBOR+20bp*3
Revenue Unit Price: 34.73sen/kWh*4 Fuel Unit Costs RM42.24/GJ(HHV)*5 Contingency (Physical) 10% Taxes and Duties Corporate Income Tax:24.%
Goods and Service Tax (GST):6% Custom Duties:0% GST on imported goods: 6%
O&M Expenses 2% of Costs of power plant Foreign Exchange Rate RM=JPY26.41*6
(Source: prepared by the Survey Team) (Note) *1. Land acquisition and reclamation will be taken place in 2017 *2. LIBOR=0.113% (2016/1/15) is applied. *3. Terminal value is the present value of the purchase price by Off-taker at the end of the project period when the project period is extended. It is estimated at 50% of the EPC costs. *4. The Levelized Electricity Cost (LEC) at which TNB eventually concluded PPA (Power Purchase Agreement) in Prai gas fired combined cycle power project for which Energy Commission, Malaysia, conducted the project bidding in 2012 becomes as a benchmark tariff. Thus, the benchmark tariff is applied. *5. The fuel price which was defined in RFP for a fired gas combined cycle power project by Energy Commission, Malaysia, in 2012 is applied. *6. Foreign exchange rates on January 15, 2016 are applied.
2) Preliminary Financial Evaluation
(a) Methodology of Evaluation and Basic Parameters
The financial evaluation is based on an analysis of the financial viability of the project. In other words, the
financial evaluation aims to verify financial viability for the entity to operate and maintain the project at a certain
level of financial effectiveness for a certain period. In general, financial viability is measured by the Financial
Internal Rate of Return (FIRR) at which financial revenues (financial benefits) from a project is equal to capital
investment on a project (financial costs). When the calculated FIRR is higher than the weighted average of cost of
capital (WACC) of the total capital investment of a project, a project can be judged as financially viable.
5-5
(b) Financial Costs
a) Fuel Cost
The gas price of 42.24RM/GJ which was defined in RFP for a fired gas combined cycle power project by Energy
Commission, Malaysia in 2012 is applied for the financial analysis in this Study. The annual fuel consumption
corresponding to the net annual power generation is 32,364,400 GJ.
b) Operations and Maintenance Cost
The operations and maintenance cost of this project is estimated to a 2% of the power plant cost for the financial
analysis in this study.
c) Taxes and Duties
Goods and Service Tax (GST) is counted as a part of the project cost for the financial analysis. The import duties
on power plant equipment are exempted.
(c) Financial Benefits
The financial benefits of the project are revenues from electricity sales. The Levelized Electricity Cost (LEC) at
which TNB eventually concluded PPA (Power Purchase Agreement) in Prai gas fired combined cycle power
project for which Energy Commission, Malaysia conducted the project bidding in 2012, which was 34.73
sen/kWh, is applied. The Levelized Electricity Cost is a unit price of electricity which is derived from the lifecycle
costs including EPC costs, fuel costs and O& M expenses which TNB pays through the project period. Also, a
half of the EPC costs including the cost of power plant, civil works, gas supply system and substation are included
as a terminal value at year 21st for the financial analysis in this Study.
(d) Weighted Average Cost of Capital (WACC)
The WACC of the project is calculated using the following formula.
WACC = [rE x E/ (D + E)] + [rD for ODA x (1-T) x D for ODA/ (D + E)]
rE: Cost of Equity = 15.1% p.a*1.
rD for ODA: ODA Loan interest rate = 0.31% p.a
E/ (D + E): equity ratio*2 = about 15%
D for ODA / (D + E): ODA loan ratio*2 = about 85%
Corporate income tax = 24%
Note:
*1. TNB’s ROE before taxes in 2015 is applied to the cost of equity
*2 The loan ratio and equity ratio is slightly different depending on the project site (Kuantan: Debt
84.6%, Equity 15.4%, and Kapar: Debt 84.9%, Equity 15.1%).
The estimated WACC of this project in each project candidate site is shown in Table 5-5 below.
Table 5-5 WACC in project candidate site
WACC Kuantan 2.52% Kapar 2.48%
(Source: prepared by the Survey Team)

5-6
(e) FIRR
The FIRR of the project is calculated based on the assumption mentioned before. The FIRRs of the project in 2
candidate sites of the project are shown in Table 5-6. The FIRRs of the project in both project candidate sites are
more than WACCs. Thus the project in both project sites has a financial viability.
Table5-6 FIRRs of 2 candidate sites
FIRR Kuantan 3.54% Kapar 2.99%
(Source: prepared by the Survey Team)
Financial Internal Rate of Return (FIRR) (Kuantan)
(JYP million)
Capital O&M & Fuel Total Cost2017 5,694 0 5,694 0 -5,6942018 41,130 0 41,130 0 -41,1302019 58,688 0 58,688 0 -58,6882020 22,947 0 22,947 0 -22,9472021 0 41,921 41,921 49,407 7,4862022 0 41,921 41,921 49,407 7,4862023 0 41,921 41,921 49,407 7,4862024 0 41,921 41,921 49,407 7,4862025 0 41,921 41,921 49,407 7,4862026 0 41,921 41,921 49,407 7,4862027 0 41,921 41,921 49,407 7,4862028 0 41,921 41,921 49,407 7,4862029 0 41,921 41,921 49,407 7,4862030 0 41,921 41,921 49,407 7,4862031 0 41,921 41,921 49,407 7,4862032 0 41,921 41,921 49,407 7,4862033 0 41,921 41,921 49,407 7,4862034 0 41,921 41,921 49,407 7,4862035 0 41,921 41,921 49,407 7,4862036 0 41,921 41,921 49,407 7,4862037 0 41,921 41,921 49,407 7,4862038 0 41,921 41,921 49,407 7,4862039 0 41,921 41,921 49,407 7,4862040 0 41,921 41,921 49,407 7,4862041 0 41,921 41,921 100,109 58,188Total 122,764 880,335 1,003,099 1,088,253 85,153FIRR 3.535%
Fiscal YearFinancial Cost (A) Financial
Benefit (B)(B) - (A)
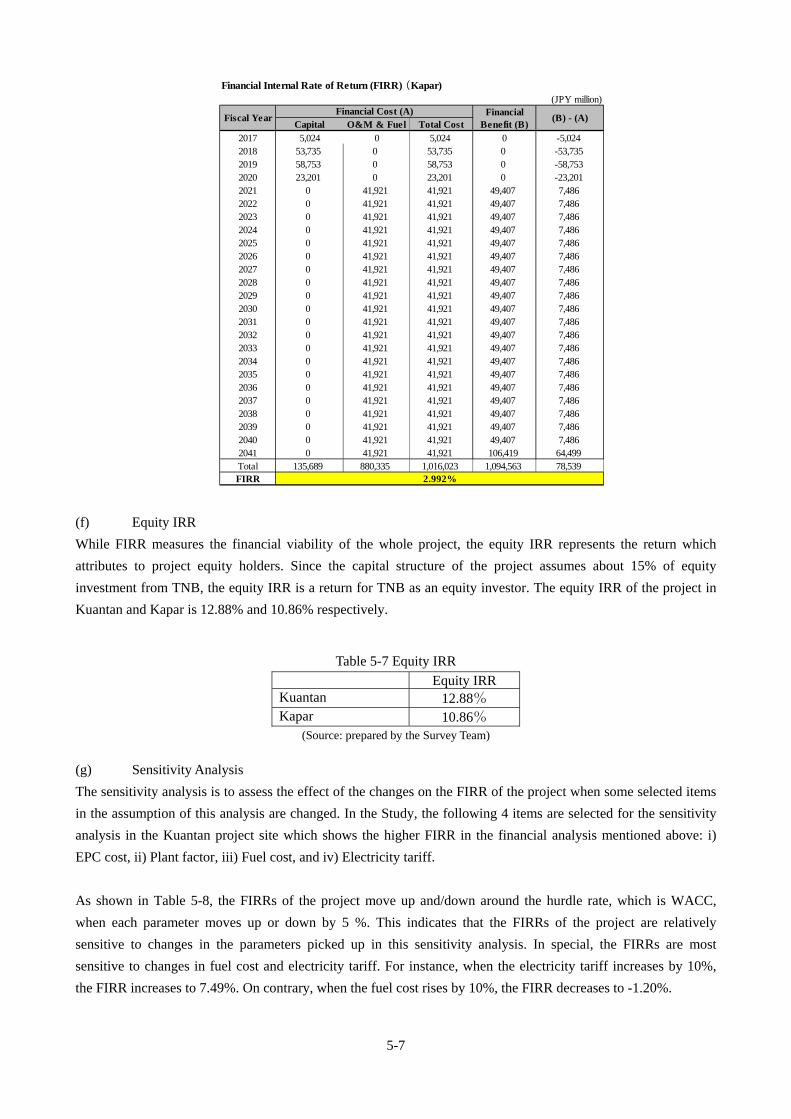
5-7
Financial Internal Rate of Return (FIRR) (Kapar)(JPY million)
Capital O&M & Fuel Total Cost2017 5,024 0 5,024 0 -5,0242018 53,735 0 53,735 0 -53,7352019 58,753 0 58,753 0 -58,7532020 23,201 0 23,201 0 -23,2012021 0 41,921 41,921 49,407 7,4862022 0 41,921 41,921 49,407 7,4862023 0 41,921 41,921 49,407 7,4862024 0 41,921 41,921 49,407 7,4862025 0 41,921 41,921 49,407 7,4862026 0 41,921 41,921 49,407 7,4862027 0 41,921 41,921 49,407 7,4862028 0 41,921 41,921 49,407 7,4862029 0 41,921 41,921 49,407 7,4862030 0 41,921 41,921 49,407 7,4862031 0 41,921 41,921 49,407 7,4862032 0 41,921 41,921 49,407 7,4862033 0 41,921 41,921 49,407 7,4862034 0 41,921 41,921 49,407 7,4862035 0 41,921 41,921 49,407 7,4862036 0 41,921 41,921 49,407 7,4862037 0 41,921 41,921 49,407 7,4862038 0 41,921 41,921 49,407 7,4862039 0 41,921 41,921 49,407 7,4862040 0 41,921 41,921 49,407 7,4862041 0 41,921 41,921 106,419 64,499Total 135,689 880,335 1,016,023 1,094,563 78,539FIRR
Fiscal YearFinancial Cost (A) Financial
Benefit (B)(B) - (A)
2.992%
(f) Equity IRR
While FIRR measures the financial viability of the whole project, the equity IRR represents the return which
attributes to project equity holders. Since the capital structure of the project assumes about 15% of equity
investment from TNB, the equity IRR is a return for TNB as an equity investor. The equity IRR of the project in
Kuantan and Kapar is 12.88% and 10.86% respectively.
Table 5-7 Equity IRR
Equity IRR Kuantan 12.88% Kapar 10.86%
(Source: prepared by the Survey Team)
(g) Sensitivity Analysis
The sensitivity analysis is to assess the effect of the changes on the FIRR of the project when some selected items
in the assumption of this analysis are changed. In the Study, the following 4 items are selected for the sensitivity
analysis in the Kuantan project site which shows the higher FIRR in the financial analysis mentioned above: i)
EPC cost, ii) Plant factor, iii) Fuel cost, and iv) Electricity tariff.
As shown in Table 5-8, the FIRRs of the project move up and/down around the hurdle rate, which is WACC,
when each parameter moves up or down by 5 %. This indicates that the FIRRs of the project are relatively
sensitive to changes in the parameters picked up in this sensitivity analysis. In special, the FIRRs are most
sensitive to changes in fuel cost and electricity tariff. For instance, when the electricity tariff increases by 10%,
the FIRR increases to 7.49%. On contrary, when the fuel cost rises by 10%, the FIRR decreases to -1.20%.

5-8
Table 5-8 Results of Sensitivity Analysis (Kuantan)
Parameter Variance FIRR (%)
Difference with the base case in
FIRR
Equity IRR (%)
Base Case 3.54% 12.88%
EPC Costs +10% 2.84% △0.69 points 10.63%
+5% 3.18% △0.35 points 11.74%
-5% 3.92% 0.38 points 14.04%
- 10% 4.34% 1.00 points 15.23%
Plant Factor 50%⇒60% 5.10% 1.57 points 18.15%
50%⇒55% 4.33% 0.80 points 15.63%
50%⇒45% 2.71% △0.82 points 9.89%
50%⇒40% 1.85% △1.68 points 6.73%
Fuel Cost + 10% △0.23% △3.76 points △1.75%
+5% 1.73% △1.8 points 6.26%
-5% 5.21% 1.68 points 18.50%
-10% 6.79% 3.25 points 23.17%
Electricity Tariff +10% 7.49% 3.95 points 25.09%
+5% 5.59% 2.05 points 19.66%
-5% 1.29% △2.25 points 4.64%
-10% △1.20% △4.74 points △5.15%
(Source: prepared by the Survey Team)
3) Preliminary Economic Evaluation
(a) Methodology of Evaluation and Basic Parameters
The economic analysis also appraises the benefits of an investment, but the concept of the economic benefits is
different from that of the financial analysis. The economic analysis measures the effects on the national economy,
whereas the financial analysis assesses the financial profitability of the project operating entity. The effect of the
project on the national economy is indicated by the Economic Internal Rate of Return (EIRR). Thus, the economic
analysis assesses a real economic benefit of a project by comparing a with-project case and without-project case.
In that case, with the conversion of the financial values into the economic values, the economic value of a project
is evaluated by an EIRR. When the EIRR of a project is higher than the cost of social capital (indicated by a yield
of long-term government bonds), the project is economically viable.
(b) Conversion of financial benefits/costs into economic benefits/costs
For the purpose of the economic analysis of the project, following financial costs and benefits were converted into
economic costs and benefits.
a) Economic costs
As for the economic costs, the economic analysis is based on the project costs which are used for the financial
analysis excluding the costs of land acquisition and taxes.
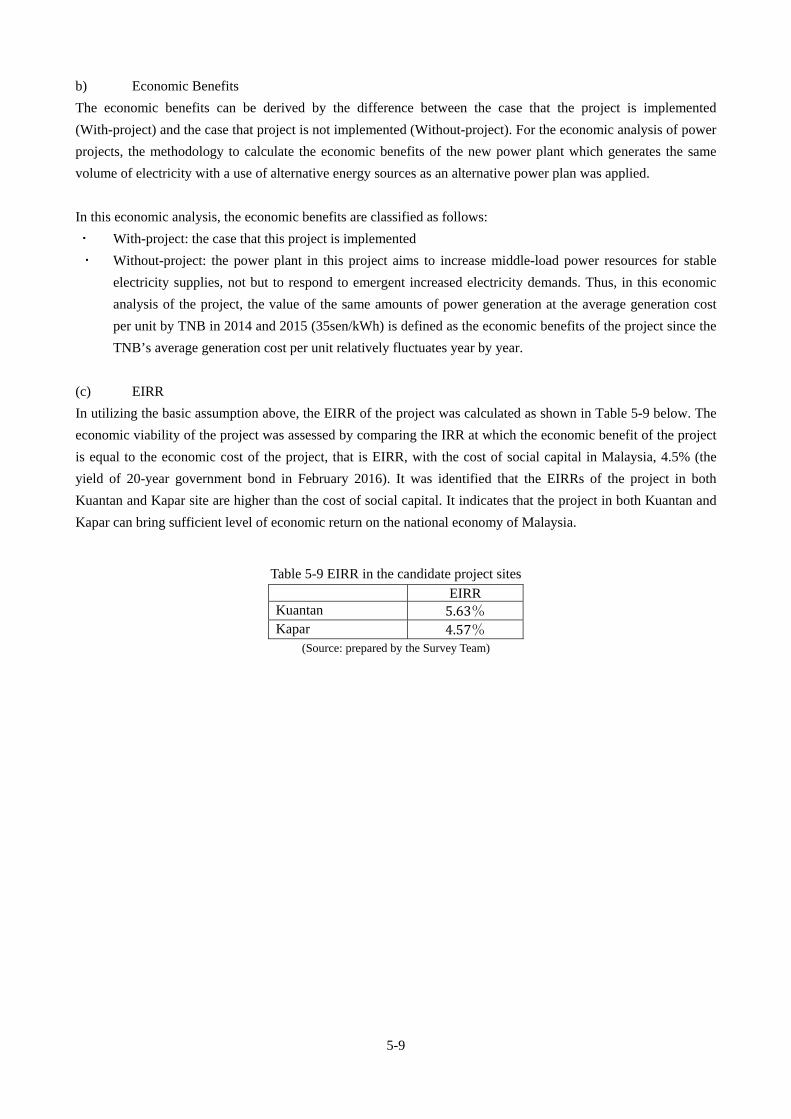
5-9
b) Economic Benefits
The economic benefits can be derived by the difference between the case that the project is implemented
(With-project) and the case that project is not implemented (Without-project). For the economic analysis of power
projects, the methodology to calculate the economic benefits of the new power plant which generates the same
volume of electricity with a use of alternative energy sources as an alternative power plan was applied.
In this economic analysis, the economic benefits are classified as follows:
With-project: the case that this project is implemented
Without-project: the power plant in this project aims to increase middle-load power resources for stable
electricity supplies, not but to respond to emergent increased electricity demands. Thus, in this economic
analysis of the project, the value of the same amounts of power generation at the average generation cost
per unit by TNB in 2014 and 2015 (35sen/kWh) is defined as the economic benefits of the project since the
TNB’s average generation cost per unit relatively fluctuates year by year.
(c) EIRR
In utilizing the basic assumption above, the EIRR of the project was calculated as shown in Table 5-9 below. The
economic viability of the project was assessed by comparing the IRR at which the economic benefit of the project
is equal to the economic cost of the project, that is EIRR, with the cost of social capital in Malaysia, 4.5% (the
yield of 20-year government bond in February 2016). It was identified that the EIRRs of the project in both
Kuantan and Kapar site are higher than the cost of social capital. It indicates that the project in both Kuantan and
Kapar can bring sufficient level of economic return on the national economy of Malaysia.
Table 5-9 EIRR in the candidate project sites
EIRR Kuantan 5.63% Kapar 4.57%
(Source: prepared by the Survey Team)

5-10
Economic Rate of Return(Kuantan)(JPY million)
Capital O&M& Fuel Total Cost2017 0 0 0 0 02018 38,853 0 38,853 0 -38,8532019 55,478 0 55,478 0 -55,4782020 21,763 0 21,763 0 -21,7632021 0 41,921 41,921 50,787 8,8662022 0 41,921 41,921 50,787 8,8662023 0 41,921 41,921 50,787 8,8662024 0 41,921 41,921 50,787 8,8662025 0 41,921 41,921 50,787 8,8662026 0 41,921 41,921 50,787 8,8662027 0 41,921 41,921 50,787 8,8662028 0 41,921 41,921 50,787 8,8662029 0 41,921 41,921 50,787 8,8662030 0 41,921 41,921 50,787 8,8662031 0 41,921 41,921 50,787 8,8662032 0 41,921 41,921 50,787 8,8662033 0 41,921 41,921 50,787 8,8662034 0 41,921 41,921 50,787 8,8662035 0 41,921 41,921 50,787 8,8662036 0 41,921 41,921 50,787 8,8662037 0 41,921 41,921 50,787 8,8662038 0 41,921 41,921 50,787 8,8662039 0 41,921 41,921 50,787 8,8662040 0 41,921 41,921 50,787 8,8662041 0 41,921 41,921 101,489 59,568Total 116,094 880,335 996,429 1,117,231 120,802
EIRR
Fiscal YearEconomic Cost (A) Economic
Benefit (B)(B) - (A)
5.627%
Economic Rate of Return(Kapar)
(JPY million)
Capital O&M& Fuel Total Cost2017 3,777 0 3,777 0 -3,7772018 50,894 0 50,894 0 -50,8942019 55,779 0 55,779 0 -55,7792020 22,076 0 22,076 0 -22,0762021 0 41,921 41,921 50,787 8,8662022 0 41,921 41,921 50,787 8,8662023 0 41,921 41,921 50,787 8,8662024 0 41,921 41,921 50,787 8,8662025 0 41,921 41,921 50,787 8,8662026 0 41,921 41,921 50,787 8,8662027 0 41,921 41,921 50,787 8,8662028 0 41,921 41,921 50,787 8,8662029 0 41,921 41,921 50,787 8,8662030 0 41,921 41,921 50,787 8,8662031 0 41,921 41,921 50,787 8,8662032 0 41,921 41,921 50,787 8,8662033 0 41,921 41,921 50,787 8,8662034 0 41,921 41,921 50,787 8,8662035 0 41,921 41,921 50,787 8,8662036 0 41,921 41,921 50,787 8,8662037 0 41,921 41,921 50,787 8,8662038 0 41,921 41,921 50,787 8,8662039 0 41,921 41,921 50,787 8,8662040 0 41,921 41,921 50,787 8,8662041 0 41,921 41,921 107,799 65,878Total 128,750 880,335 1,009,084 1,123,541 114,457
EIRR
Fiscal YearEconomic Cost (A) Economic
Benefit (B)(B) - (A)
4.572%

5-11
(d) Sensitivity Analysis
The sensitivity analysis is to assess the effect of the changes on the EIRR of the project when some selected items
in the assumption of this analysis are changed. In the Study, the following 4 parameters were selected for the
sensitivity analysis in the Kuantan project site which shows the higher FIRR in the financial analysis mentioned
above: i) EPC costs, ii) Plant factor, and iii) Fuel cost.
The increase in the fuel costs most significantly affects the EIRR. When the fuel cost increases by 10%, the EIRR
decrease to 1.84%. On contrary, the fuel cost decreases by 10%, the EIRR increases to 8.96%. Also, the changes
in the plant factor can considerably affect the EIRR. When the plant factor increases from 50% to 60%, the EIRR
increases to 7.46%. Since the power plant that will be built in this project is expected to be operated at
middle-load level according to changes in electricity demand considering with the plant characteristics, the plant
factor in this analysis is set at 50%. However, the electricity demand is expected to grow in tandem with the
projected economic growth, the real plant factor may be higher than 50%.
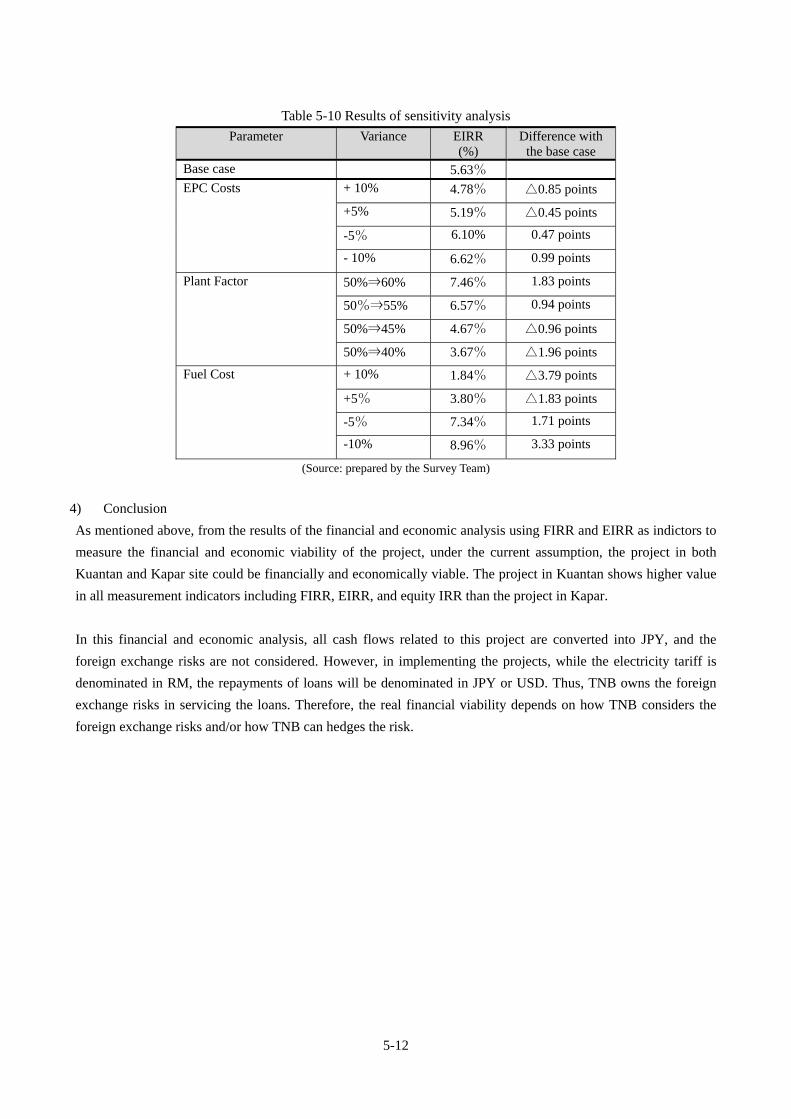
5-12
Table 5-10 Results of sensitivity analysis
Parameter Variance EIRR (%)
Difference with the base case
Base case 5.63%
EPC Costs + 10% 4.78% △0.85 points
+5% 5.19% △0.45 points
-5% 6.10% 0.47 points
- 10% 6.62% 0.99 points
Plant Factor 50%⇒60% 7.46% 1.83 points
50%⇒55% 6.57% 0.94 points
50%⇒45% 4.67% △0.96 points
50%⇒40% 3.67% △1.96 points
Fuel Cost + 10% 1.84% △3.79 points
+5% 3.80% △1.83 points
-5% 7.34% 1.71 points
-10% 8.96% 3.33 points
(Source: prepared by the Survey Team)
4) Conclusion
As mentioned above, from the results of the financial and economic analysis using FIRR and EIRR as indictors to
measure the financial and economic viability of the project, under the current assumption, the project in both
Kuantan and Kapar site could be financially and economically viable. The project in Kuantan shows higher value
in all measurement indicators including FIRR, EIRR, and equity IRR than the project in Kapar.
In this financial and economic analysis, all cash flows related to this project are converted into JPY, and the
foreign exchange risks are not considered. However, in implementing the projects, while the electricity tariff is
denominated in RM, the repayments of loans will be denominated in JPY or USD. Thus, TNB owns the foreign
exchange risks in servicing the loans. Therefore, the real financial viability depends on how TNB considers the
foreign exchange risks and/or how TNB can hedges the risk.

Chapter 6 Project Implementation Schedule


6-1
Our assuming overall project schedule is shown in the diagram below.
Figure 6-1 Project Schedule
(Source: prepared by the Study Team)
1) Feasibility Study (F/S) In case that Japanese ODA loan is applied to the Project, a preparatory survey will be executed by JICA in general.
During around a half year, an optimization of power plant facilities, re-estimation of total plant cost, economical
and financial re-evaluation and environmental and social consideration will be examined.
2) Environmental Impact Assessment (EIA) It is expected that this project will be realized by Japanese ODA loan. The international financial bodies including
JICA establish guidelines for environmental and social consideration and require implementation of ESIA in line
with the guidelines. It takes about a half year to conduct EIA.
3) From Preparation of Bidding Document to Selection of the Contracture and Contracts’ Award After the L/A (Loan Agreement) will be made, the contractor will be selected by the International Competitive Bid.
Usually, it takes about 22 months that the Consultant makes basic design, bidding document, evaluation report and
contract document. This works will be executed by TNB’s own finance in order to reduce a duration of this
works..
4) From Notice to Proceed (NTP) of EPC to Commercial Operation Start In general, the construction period of large capacity combined cycle power plant depends on the delivery period of
steam turbine. The standard construction period of such plant is three (3) years.
Duration(month)
METI Pre-F/S 5
Request for Yen Loan from EPU (GoM)to EoJ (GoJ)
Study in GOJ and Confirmation withNGO
5
F/S by JICA 6
EIA 12
Appraisal 2
Pledge
E/N and L/A
Selection of Consultant 3
Detailed Design (under TNB funding) 10
Selection of Contractor 6
Construction of Combined Cycle PowerPlant
36
2015 2016 2017 2018 2019 2020


Chapter 7. Implementing Organization


7-1
(1) Overview of the Implementing Agency
1) Financial overview
TNB was established as the sole power company that operates from power generation to distribution in Malaysia
in 1949 and it is the state-run monopoly of power transmission and distribution network. The state government
holds approx. 68.9% of shares directly or indirectly as of August 2015. Its power generation capacity is 10,818
MW, which is approx. 68.9% of the capacity of Malay Peninsula as of August 2015. Sabah Electricity that
supplies power in Sabah State is a subsidiary of TNB. The total assets are 4.74 billion ringgits as of the end of
August 2015 and gross income and net income of FY2015 are 43.3 billion ringgits and 6.1 billion ringgits,
respectively. The regulation system of Malaysian electricity committee changed from the
traditional Rate-of-Return base (RORB) to Incentive-Based-Regulation (IBR) in January 2014. In response, the
Imbalance Cost Pass-Through (ICPT) in which power cost can be passed on to consumers as such variable costs
as fuel and power purchase costs change every six months was introduced. Power charge used to change on an
ad hoc base before it. This enables TNB to partially hedge risks of fuel cost changes and cash flow is expected
to be standardized. On the other hand, power charge is not necessarily reviewed all the time in line with cost
changes. When a new power plant is constructed, the power charge cannot exceed the benchmark tariff (power
charge approved in the case adopted in 2012 (34.74 RM/1000 kW) and thus new power plant projects are
requested to be planned at the lowest cost possible. Diversification of fuel mix for power generation has been
encouraged since the huge price rise due to the shortage of natural gas in 2011. Efforts have been made to lower
the percentage of high-price natural gas, LNG and petroleum fuel and increase that of coal to reduce fuel cost.

7-2
Table 7-1 TNB’s Financial Overview
(Unit: one million RM)
Balance sheet summary (consolidated) 2012 2013 2014 2015
Current assets 16,579.0 17,512.4 20,007.9 18,795.0
Fixed assets 72,828.1 82,486.9 90,657.5 98,340.0
Current liabilities 9,517.3 10,814.3 13,463.9 15,592.2
Short-term loans 1,593.3 1,148.8 2,480.4 1,985.8
Fixed liabilities 42,604.8 51.214.3 53,742.3 54,075.9
Borrowing 21,168.6 21,739.6 22,975.6 22,713.1
Total capital 36,985.0 37,970.7 43,459.2 47,466.9
P/L statement summary (consolidated)
Gross income 35,848.4 37,130.7 42,792.4 43,286.3
Business expenses (before depreciation) 27,040.1 31,847.2 31,392.6 30,189.2
Fuel cost + power purchase cost 20,758.0 19,957.7 23,540.6 21,836.4
Business income 462.0 623.4 653.7 824.2
Earnings before interest, taxes, depreciation and amortization (EBITDA)
9,270.3 10,446.4 12,053.5 13,921.8
Depreciation cost 4,268.1 4,539.5 4,872.5 5,294.2
Earnings before interest and tax, exchange gain and loss (EBIT)
5,002.2 5,906.9 6,669.4 7,953.0
Financial charge 823.0 894.2 874.6 944.9
Exchange gain (loss) -230.8 493.6 445.3 -819.3
Profit before taxes 4,604.1 5,925.1 7,114.7 7,133.7
Profit after taxes 3,151.6 5,382.8 6,467.0 6,118.4
Main indicators
Power generation cost per unit (sen/kwh) 31.9 31.0 35.0 35.1
Return on asset (ROA) (%) 5.2 5.9 6.4 6.1
EBITDA margin (%) 25.9 28.1 28.2 32.2
(Source: TNB Annual Report 2012 - 2015)

7-3
(2) Organization of the Recpieient Country for Project Implementation
TNB organization is shown Figure 7-1 below. There are three core business divisions (power generation,
transmission and distribution) and six non-core business divisions (finance, planning, personnel, information and
communications, procurement and investment management) under the President. The Energy Venture Division
that is the contact point of the survey is independent from the core business and it is supposed to aim at domestic
and overseas market expansion, efficient and timely power supply, and growth of profitable non-regulatory
power-generated businesses.
Figure 7-1 TNB Organization
(Source: TNB Annual Report 2014)


Chapter 8 Technical Advantage of Japanese Company


8-1
(1) Assumed participating form from Japan(Financing、Supply of Equipment and Facilities and Operation and Management)
1) Financing
In this survey, TNB is presumed as the developer of the new CCPP, who is materially considered to be
a governmental institution, and application of JICA Yen loan is considered as one option of a potent
financial source of this CCPP construction project. As this CCPP construction project requires a huge
amount of investment in various stages, ranging from the feasibility study and detailed designing to
construction of the plant, Japanese ODA loan with low interest rate, long grace period and long term debt
amortization period will benefit Malaysia, which will ease TNB of burden of huge amount of initial
investment cost and lower power generation tariff. For that, Malaysian government and TNB would
strongly requested to apply Japanese ODA loan to this CCPP construction project. By applying Japanese
ODA loan, Japanese companies can participate in this project and Japanese companies’ state-of-the art
technologies of combined cycle power generation system for design, manufacture, construction,
operation, and maintenance and their abundant experiences in this field will assist Malaysia to contribute
the development of infrastructure of power generation system.
In case that Japanese companies invest in this project, JICA private sector investment finance (loan) is
considered to apply. However, as mentioned in Chapter 5, it does not seem to be practicable from the
viewpoint of profitability of the project. Expected return (FIRR, Equity IRR) of TNB, who is materially
considered to be a governmental institution, is presumed to be lower than those of Japanese companies
who are private firms, and it would make it difficult for Japanese companies to invest in this project
together with TNB. Therefore, to apply JICA private sector investment finance (loan), in which
investment of Japanese companies is prerequisite, is considered to be difficult from the viewpoint of
Japanese companies’ investment.
2) Supply of Equipment and Facilities
The equipment and material estimated to be procured from Japan for this project includes the major
facilities/equipment of CCPP of gas turbine, steam turbine, generator, HRSG, turbine auxiliaries,
generator auxiliaries, as the main unit of the combined cycle power plant, and gas turbine turbine/steam
turbine auxiliaries, generator auxiliaries, HRSG auxiliaries, electrical system, control system and
instruments, and balance of plant such as compressed air system, fire fighting system and water/waste
water treatment system. Power generation systems of utilities are large scale public infrastructures, and
high efficiency and high reliability are required for their economy and stable supply of electrical power.
Power generation systems are accumulation of technologies of every field including mechanical,
electrical and control. Especially, CCPP utilizing state-of-the-art gas turbine requires technologies based
on long term experiences and abundant track records. Japanese manufacturer who has such experiences
and track records can supply gas turbines with high efficiency, reduce environmental burdens such as

8-2
NOx and SOx, reduce lifecycle cost by applying equipment with lower fuel cost and state-of the-art gas
turbine based on long term experiences and abundant track records, benefit Malaysian economy and
society by transferring know-how of management and maintenance of CCPP, keep consistency with
Malaysian power development plan and transfer culture of keeping delivery and construction schedules,
which can contribute to provide high quality infrastructures in Malaysia.
3) Operation and Management
TNB operates and manages the CCPP, and Japan can assist TNB in operation and management of
CCPP based on experiences of Japanese utility companies who have introduced CCPP with most
advanced gas turbines, through Japanese consultant who is subsidiary of Japanese utility. Not only
operation and maintenance, Japan can assist TNB in management of whole power plant and grid system
including fuel management and grid system management through knowledge and experiences of
Japanese utilities. Japanese manufacturer can provide guidance of operation and maintenance of CCPP to
TNB based on his knowledge and technologies through project construction and long term maintenance
services. These will greatly contribute TNB’s efficient and smooth operation and management of CCPP.

8-3
(2) Japanese company’s competitive advantage (Technical and
Economical Point of View)
Japanese manufacturers of power generation system have continuously paid effort to improve
efficiency and reliability of the system, competing with manufacturers of the US and Europe, and they
also continuously paid effort for cost reduction to win severe international bidding of power plant
construction projects.
As a result of these efforts, they keep technological and price competitiveness in the world market and
they have competitive advantages over manufacturers of the US and Europe from the viewpoint of its
capacity, efficiency, lowering environmental burden and operating experiences in the field of J class gas
turbine applied to this project.
From operation, maintenance and management aspect of CCPP, technical knowledge and experiences
of Japanese manufacturers and Japanese utilities will significantly contribute to assist TNB in his
operation, maintenance and management of CCPP , as mentioned on (1)-3) above.


Chapter 9. Prospects of Funding for This Project


9-1
(1) Prospects of funding for this project
1) Funding Sources and Funding Plan of the Project
a) Assumed Funding Sources
In the financial and economic analysis conducted in Chapter 5, the funding source for the gas fired
combined cycle power project proposed in this project assumed JICA Yen Loan as well as funding from
TNB partly. Other alternative financing tools including financing by all TNB funding by itself as well as
JICA Private Sector Investment Finance, and JBIC Buyer’s credit can be also considered other than JICA
Yen Loan. Thus, the followings conduct the comparative analysis of theses alternative financing tools from
Japan as well as financing by all TNB funding by itself.
b) Financing the project by all TNB funding
TNB has had experiences in financing more than JPY 100 billion for the cost of power plant constructions
from domestic or international markets. Also, as seen in Chapter 9, TNB has obtained credit ratings which
are same level as Malaysia’s sovereign rating and has enough financing capacity as well as capability to
service additional debts. However, with a consideration of domestic funding rates (the yield of long-term
government bonds is around middle of 4% in February 2016), the financial and economic viability of the
project can be low if TNB finances all project costs by itself. TNB explores funding opportunities with
lowest costs since it hopes that the project funded at as low cost as possible brings about lowering the
generation cost, thus lowering the electricity tariff to consumers, and thereby increasing social welfare.
c) Comparative analysis for financing tools from Japan
The following Table 9-1 examines the challenges/conditions needed to be solved and the responses to these
challenges/conditions when using these financing tools.
Table 9-1 Challenge and responses for alternative financing tools Challenges Responses
(i) JICA Yen Loan Since Malaysia is classified as an upper-most middle income country, it is necessary that providing JICA Yen Loan has strategic meanings for Japan
Malaysia’s government debt outstanding remains close to legal celling level
Since the power sector has already financed its necessary funds by itself, there may not be significant incentives for the government to obtains funds for or provide its guarantee to the power sector.
The strategic meaning for this project can be justified.
Since the government is required to be quite
selective to choose projects that the government supports thorough government loan and guarantee under the current fiscal consolidation, the government hopes that the power sector which has already obtained funding without government guarantee obtains Yen Loan without government guarantee.
(ii) JICA Private Sector Investment Finance
In terms of project profitability, it is necessary that the project is expected to be completed, but the project is not profitable when it is financed by loans and/or investment from existing financial institutions
TNB’s debt servicing capability
As seen in the financial and economic analysis below, under the current assumption, the project financed by loans with higher interest rates from commercial banks is unlikely to be financially viable.
As mentioned in this Chapter, TNB has an ability to serve debts
(iii) JBIC Buyer’s Credit
Goods and service exported from Japan
TNB’s debt servicing capability
Plan to export the state of arts gas turbines manufactured by a Japanese heavy electronical maker
As mentioned in this Chapter, TNB has ability to serve debts
(Source: prepared by the Study Team)

9-2
Next, the followings comparatively examined the financial and economic viability of the project by FIRRs
and EIRRs when the project will be financed by these three financing tools. Table 9-2 shows the terms and
conditions assumed of these funding sources.
Table 9-2 Assumed terms and conditions of loans Conditions of loans Conditions applied in this Study JICA Yen Loan Interest rate: LIBOR+20bp
Amortization period: 25years Grace period: 7 years
Interest rate: 0.313% Amortization period: 25years Grace period: 7 years
JICA Private Sector Investment Finance (Loan)
Interest rate: setting up a lending rate based on the lending rate of Fiscal Investment Loan Program and the credit risk of borrower. Lending condition including repayment period should meet a requirement for ODA, in which the grant element should be more than 25%. Repayment period: less than 20 years in principle (maximum 25years) Grace period: less than 5 years (maximum 10 years) Coverage: up to 70% of total costs in principle
Interest rate: lending rate of Fiscal Investment and Loan Program (0.8%)+Spread(0.851%)*1=1.651% Repayment period: 20years Grace period: 5years
JBIC Buyer’s Credit
Interest rate: determined based on the credit arrangement. In principle, CIRR + risk premium at the time of commitment Repayment period: depending on importing countries, goods and services and contract values. Loan amounts: within the value of an export contract and technical service contract Coverage: up to 50-60 % of goods and services exported
Interest rate: CIRR(1.09%)+risk premium(2.8%)*2=3.89% Repayment period: 10 years Grace period: 3 years
(Source: prepared by the Study Team) Note) *1. Spread between JGB and JPY denominated corporate bond issued by a Malaysian company with same credit rating as TNB (A) is applied. *2. Risk premium in OECD country risk classification is applied as risk premium
Based on the assumption for the financial and economic analysis in Chapter 5 and the assumed terms and
conditions of these loans above, the FIRRs and EIRRs of the project in Kuantan and Kapar site, financed
by these funding sources, were calculated. The results are shown in Table 9-3 below.
Table 9-3 FIRR and EIRR for alternative funding sources FIRR EIRR WACC*1 Social Discount
Rate Kuantan
JICA Yen Loan 3.54% 5.63% 2.52% 4.5% JICA Private Sector Investment Finance (Loan) 3.38% 5.44% 5.44% 4.5% JBIC Buyer’s Credit 3.22% 5.24% 8.01% 4.5%
Kapar JICA Yen Loan 2.99% 4.57% 2.48% 4.5% JICA Private Sector Investment Finance (Loan) 2.84% 4.40% 5.58% 4.5% JBIC Buyer’s Credit 2.59% 4.24% 8.06% 4.5%
(Source: prepared by the Study Team)
Note) *1. WACC in each funding source is different due to the differences in interest rate, debt and equity ratio.
Out of three alternative financing tools analyzed in this study, when the projects in Kuantan and Kapar are
financed by JICA Yen Loan, the project could be financially and economically viable with higher FIRR
and EIRR than the hurdle rates (WACC) and the social cost of capital. When the project is financed by
other two funding sources, while the EIRRs of the project in Kuantan site is more than the social discount

9-3
rate, the FIRRs of the project in Kuantan site is lower than WACC. Thus, the project is economically viable
but financially less viable when the project in Kuantan is financed by other two funding sources. In Kapar
site, the FIRRs and EIRRs of the project are lower than each hurdle rate and social discount rate, which
indicates that when the project is financed by both funding sources, the project could not be financially and
economically viable.
Also, in the cash flow analysis conducted by this study, when the project is financed by JICA Yen Loan,
the project will be able to make the repayment of interest and principle from cash flows from the operating
activities due to its low interest rates, long maturity and grace period. On the other hand, when the project
is financed by JBIC Buyer’s Credit, there may be little possibilities to service the debt repayment by the
project since the project will not be able to generate enough cash flows from the operating activities to
cover the repayment amounts of the loan. The main factor is that the annual amount of annual loan
repayment is bigger than the annual operating income (revenue from selling electricity minus fuel costs)
due to higher amount of annual repayment resulting from the shorter loan maturity. In case of the JICA
Private Sector Investment Finance, while there may be periods in which cash flows from operating
activities can not cover the amount of loan and interest payment just when the loan repayment starts due to
high interest payment (debt-service ratio is less than 1%), with cash accumulation during the loan grace
period and lower interest payments corresponding to the loan repayments, the project will be able to repay
loan and interest in total. From the above, it is considered as desirable for the project to be financed by
JICA Yen Loan with long-term maturity and low interest rate as well as long grace period.
In order that this project is financed by JICA Yen Loan, this project is required to prove a strategic meaning
of the project for Japan since Malaysia is classified as an upper most middle income country. In addition, it
is necessary to confirm the intention of the Government of Malaysia including Ministry of Finance
regarding borrowing the JICA Yen Loan or providing guarantee to TNB for this project since the level of
government debt outstanding is close to the legal limit. Since the study team thinks that the project has a
strategic meaning for Japan, it is necessary to continue exchanges of opinions with relevant ministries and
agencies regarding the use of JICA Yen Loan. Similarly, in case that this project can not be financed by
JICA Yen Loan, while clearing the challenges and issues mentioned above in using alternative financing
tools, it is necessary to continue consultations with the Malaysian government so that this project can be
financially and economically viable when the project is financed by these funding tools.
2) Examination of TNB funding
As for the TNB funding part, it is also necessary to further consult with TNB on the project profitability as
well as the rate of returns from equity. The followings examined the Malaysia’s country risk as well as
TNB’s debt servicing capability in case that TNB utilizes the financing tools from Japan,
a) Country Risk of Malaysia
As mentioned in Chapter 1, the Malaysian economy is expected to continue resilient economic growth
mainly driven by exports including industrial products, while the growth rate is slightly lower than
expected, affected by the economic slowdown of China which is a main export destination of Malaysia and

9-4
declines in the prices of commodities. However, there exists risk factors which bring the vulnerability to
changes in global economic environment, such as narrowing current account surplus, portfolio investment
outflows, depreciation in the currency, and the corresponding declines in the foreign reserves. Also, on the
fiscal side, in order to reduce the expanded budget deficit, from 2013, the government has promoted fiscal
consolidation including the abolishment of fuel subsidies and the introduction of GST, aiming at achieving
the fiscal balance in 2020, though the ratio of government debt outstanding to GDP has still kept at more
than 50%, which is close to the legal limit.
The Malaysia’s sovereign ratings are shown in Table 9-4. Relatively safer ratings are assigned to Malaysia.
In January 2016, Moody’s revised Malaysia’s sovereign rating outlook from A3/positive to A3/stable. Also,
in the recent OECD country risk classification (October 2015), Malaysia is continuously classified as [2],
which is the second lowest risk category, other than OECD countries.
Table 9-4 Malaysia’s Sovereign Ratings Rating Agency Rating/Outlook
Standard & Poor’s A-/Stable (December 2015) Moody’s A3/Stable (January 2016) Fitch A-/Stable (July 2015) Rating and Investment Center A/Stable (April 2015)
(Source)Each rating agency
b) TNB’s Debt Servicing Capability
As mentioned in Chapter 7, TNB recorded the net profit after tax of RM 6.1 billion (JPY 150 billion) with
the total revenue of RM 43.3 billion (about JPY 1.7 trillion) in FY2015. The retained earnings were RM
41.6 billion (about JPY 1.03 trillion) at the end of FY2015. In FY2015, the total revenue only grew by
1.2 % from the previous year due to the changes in the calculation method of electricity tariff and weak
electricity demand growth affected by the slowdown of the Malaysian economy caused by the slowdown of
the global economy, and the net profit after tax recorded a 5.7% decline from the previous year due to RM
depreciation which resulted in forex transaction losses. However, it is expected that TNB will continuously
record resilient profits with an expected increasing electricity demand in tandem with the projected
economic growth of between 4% and 5% since 2016. TNB is the largest power supplier with a
near-monopoly on the transmission and distribution of electricity across Peninsular Malaysia. Also, the
Malaysia government directly and indirectly owns about 60% of stakes in TNB. Thus, the implied support
from the government is expected.
In examining the debt service capability of a corporation, the following items are usually examined; i)
profitability, ii) leverages, iii) short-term solvency, iv) capacity to pay interest, and v) long-term solvency.
Indicators to measure these items were developed from the financial statements of TNB as shown in
Table9-5. All indicators to measure the profitability of TNB has improved with the declines in generation
costs reflected by the declines in coal prices and the transfer of the power generation sources from
petroleum related fuels to ones with lower prices. Thus, the profitability of TNB has shown improvement.
Also, the implementation of new regulatory framework for electricity tariff will contribute to level its profit

9-5
out.
The leverage level of TNB was measured by the capital to asset ratio and the net debt to equity ratio. The
capital to asset ratio has shown improvements and the level is more than 40% in 2015, which is considered
well capitalized. On the other hand, the net debt to equity ratio which is calculated by the ratio of equity to
the interest bearing debts was 0.61 times and has increased recently. While the level of the debt to equity
ratio is not necessary at a high level since the ratio of less than 1.0 times is usually considered as financially
stable, this implies that the portion of the interest bearing debt in its liability has increased with a
consideration of the increasing capital to asset ratio.
In the liquidity ratio which is an indicator to measure the ability to serve short-term debts, TNB owns the
short-term assets more than 1.7 times of the short-term liability and the ratio has improved. Thus, it can be
said that TNB has an enough capacity to serve its short-term debt with a little likelihood that TNB has a
shortage of cash. As for the TNB’s capacity to pay interest, the interest coverage ratio (ratio of profits to
interest payment) is 14.7 and has increased. Thus, it can be considered that TNB has a capability to pay
interest for the existing debts.
The long-term solvency was examined by indictors such as the capital to asset ratio, net debt to equity ratio
mentioned above, interest bearing debts to EBITDA ratio (ratio of interest bearing debts to profits before
interest, taxes and depreciation and amortization) and the ratio of interest bearing debt to cash flow from
operating activities. As mentioned above, any issues in the capital to asset ratio and net debt to equity ratio
can not been seen at this moment, while the interest bearing debt has increased. The ratio of interest bearing
debt to EBITDA has decreased since the EBITDA grew by an average of 14.5% for the past 3 years. The
ratio of interest bearing debt to cash flow from operating activities is an indicator to measure how many
years are required to repay interest bearing debts by annual cash flows from operating activities. The
indicator has maintained less than 3 years though it once increased to more than 3 years in 2014. Thus,
there are not any issues at this moment in the indicators to measure the long term solvency, though the
interest bearing debts has increased. Therefore, TNB has a capability to serve its long term debts.
Table 9-5 Indicators to measure long-term solvency
(Unit:RM million) 2012 2013 2014 2015 Return on Total Assets (ROA) (%) 4.5 5.6 6.2 6.6
Return on shareholders’ equity (ROE)(%) 11.4 14.7 15.8 16.3 EBITDA margin 25.9 28.1 28.2 32.2 Cash flow from operating activities 8,475.6 9,687.1 10,437.9 11,439.4 Liquidity Ratio (times) 1.7 1.6 1.5 1.2 Interest Coverage Ratio (times) 11.3 11.7 13.8 14.7 Capital to asset ratio (%) 41.1 37.7 39.1 40.3 Net debt-equity ratio (times) 0.41 0.52 0.56 0.61 Interest bearing debt/EBITDA ratio (times) 2.54 2.73 2.68 2.25 Interest bearing debt/cash flow from operating activities(years)
2.73 2.94 3.09 2.75
(Source)TNB, Study Team

9-6
As mentioned above, at the end of FY2015, any issues are not identified in the TNB’s debt servicing
capability. As a next step, it is necessary to examine the impact of financing for this project on the TNB’s
debt servicing capability. In the assumption of the financial and economic analysis in Chapter 5, the project
expects that out of JPY 128.6 billion of the total project cost, JPY 108.8 billion, which is equivalent to
about 85% of the total project cost, is expected to be financed by JICA Yen loan and the rest portion, JPY
19.8 billion, is expected to be financed by the TNB’s equity. Thus, the impact of the borrowing of JPY
108.8 billion on the TNB’s debt servicing capability was examined. This analysis examined the changes in
the capital to asset ratio, net debt to equity ratio, and the ratio of interest bearing debt to cash flow from
operating activities when the borrowings for this project was added to the financial statement in FY2015.
As an assumption for this analysis, profits and cash flows related to these indicators in FY2015 are applied.
The result of the analysis is shown in Table 9-6.
Table 9-6 Impact of this project on TNB’s debt servicing capability 2015 After
adding borrowings
In case that retained earnings for a year are
added to the equity Net debt-equity ratio(times) 0.61 0.70 0.64
Capital to asset ratio(%) 40.3 38.9 42.2
Interest bearing debt/EBITDA ratio(times) 2.25 2.55 ―
Interest bearing debt/operating cash flow(years) 2.75 3.22 ―
(Source)prepared by the Study Team
While each indicator is deteriorated after the borrowings, the changes are not significantly large comparing
to the ratio in FY 2015. Also, if the retained earnings for a year are added to the equity, the impact is largely
alleviated. Thus, it can be said that the likelihood that the TNB’s debt servicing capability is deteriorated
after TNB borrows the loans for this project is limited.
c) TNB’s Credit Rating
TNB has obtained credit ratings from international rating agencies such as Standard &Poors and Moody’s,
as well as Malaysia’s local rating agencies including RAM and MARC. TNB’s credit ratings are shown in
Table 9-7. In the local ratings, TNB has obtained the highest rating, AAA. In the international rating, TNB
has obtained A3 (equivalent to A-) which is the same level of Malaysia’s sovereign rating from Moody’s.
Thus, any significant issues in the TNB’s debt servicing capability are not found from the perspective of the
credit ratings.
Table 9-7 TNB’s credit ratings Rating Outlook International Rating S&P BBB+ Stable Moody’s A3 Positive Local Rating RAM AAA Stable MARC AAA Stable
(Source)TNB

9-7
3) Japanese government’s attitude to Malaysia
The Japanese government has provided the economic supports including ODA loans, grant assistances and
technical assistances to the Malaysian government. JBIC also supports environment related projects
including a renewable energy project in Malaysia and critical infrastructure development projects including
electric power infrastructure such as gas fired combined cycle power projects in surrounding Asian
countries.
In Japan-Malaysia Summit Meeting in November 2015 when Prime Minister Mr. Abe visited Malaysia, Mr.
Abe stated that Japan is promoting infrastructure cooperation based on the “Partnership for Quality
Infrastructure,” and on the occasion of the ASEAN Business & Investment Summit in November 2015, Mr.
Abe also stated that while massive infrastructure demands is expected, in order to fully respond to diverse
infrastructure needs, Japan would make Japan’s ODA loans even easier to use by making ODA loans
quicker to process and introducing ODA loans without government guarantees on repayments. “Partnership
for Quality Infrastructure” is an initiative to fully mobilize public and private resources, in collaboration
with other countries and international organizations to address the immense demand for infrastructure
development in Asia and will provides approximately US$110 billion for quality infrastructure investment
in Asia over the next five years. The essence of quality infrastructure mentioned in this Partnership
includes: Economic efficiency, Safety, Resilience against natural disaster, Consideration on environmental
and social impact, and Contribution to the local society and economy.
The J-type gas turbine combined cycle power plant that this project plans to construct uses natural gas,
which emits less CO2, and achieves a highly efficient power production because it generates power by a
gas turbine as well as by the use of the resultant exhaust heat. Thus, this project has the high economic
efficiency as well as environmentally friendly and social consideration by the reduction of greenhouse gas
emission. In addition, with its cutting edge technology and high reliability resulting from accumulating
operation experiences in Japan and foreign countries, coupled with the highly efficient power production
which is the characteristic of gas turbine combined cycle, the project is expected to reduce the life cycle
cost, which will contribute to achieving economic efficiency. Further, the provision of inspection and repair
under a long-term service agreement with EPC contractor is expected to develop human resources in TNB
in terms of operation and maintenance of gas turbine, and the creation of employment opportunity for
construction works of the power plant as well as operations of the power plant after the completion of the
power plant is expected, which will result in contributing to the local society and economy. Therefore, this
project falls with the quality infrastructure, and can contribute to the Japanese government’s initiative
“Partnership of quality infrastructure”.

9-8
(2) Feasibility of Financing the Project
1) Feasibility to obtain funding from Japan
In the comparative analysis of alternative financing tools for this project conducted in (1) above, there are
some high hurdles to be cleared to use the JICA Yen Loan for this project, such as clarifying the strategic
meanings of this project as well as the intention of the Malaysian government in using JICA Yen Loan.
Meanwhile, the financial and economic analysis conducted in (1) above revealed that the project is
financially and economically viable under the current assumption only when the project is financed by
JICA Yen Loan.
As mentioned (1) above, this project is well aligned with “Partnership for Quality Infrastructure” that the
Japanese government has promoted. Also, the study team thinks that this project has enough strategic
meanings for Japan. Thus, the study team has concluded that the project can be considered as a candidate of
JICA Yen Loan project. Financing the project by JICA Yen Loan can lower the electricity tariff than the
benchmark tariff used in the financial analysis in this study, thereby lowering the electricity tariff to
consumers, and increasing social welfare. Therefore, it is necessary to explore the possibility of the use of
JICA Yen Loan with closely consulting with Government of Malaysia. In the same manner, it is necessary
to continue to consult with the relevant ministries and agencies about the possibility of the uses of
alternative financing tools.
2) TNB’s possibility of borrowing and equity participation
As mentioned earlier, TNB has enough funding capacity as well as debt servicing capability. TNB explores
funding opportunities with lowest costs, hoping to lower the generation cost, thereby lowering the
electricity tariff to consumers. Thus, if TNB obtains JICA Yen Loan with low interest rate and long-term
nature, it is highly likely that TNB participates in this project. Therefore, if exploring to obtain JICA Yen
Loan for project, it is necessary to raise the importance of the project among the Government of Malaysia,
while continuing close consultations with Government of Malaysia and TNB.