Embed Size (px)
Citation preview
Study of Vitamin D Deficiency among the Elderly; Insights from QatarDr. Navas Nadukkandiyil, M.DDr. Navas Nadukkandiyil, M.D
InvestigatorsHanadi Khamis Al hamad, MD, NavasNadukkandiyil, MD, Ayman El-Menyar , MSc, FRCP, FACC, Luay Abdel Wahab, MD, MRCP, Anoop Sankaranarayanan, MD, FRANZCP, Essa Mubarak Al Sulaiti, MD

Background: Vitamin D (VitD)
An important role in normal physiological function and is essential for bone mineralization[1-3].
Vit D deficiency Its association with cardiovascular
disease,cancer and mortality [4-6]. Poor muscular, physical and cognitive physical
performance as well as falls and fractures [7]. The present study was designed to assess the prevalence
of Vit D deficiency and the associated risk factors among a geriatric population in Qatar.
Objective:
To determine the prevalence of Vitamin D deficiency among the elderly Qatar population.
To elucidate whether low serum levels of 25-hydroxyvitamin D [25(OH)D] were association with an increased risk on advanced age and age related disorders.
To assess the effect on HbA1c and Lipids.
Study setting:
All patients seen in geriatrics facilities including
Rumailah hospital (out- and in-patients) Skilled nursing facility (SNF), and Home healthcare services (HHCS) under Hamad
Medical Corporation
Inclusion criteria: who provided their serum total 25-hydroxyvitamin D [25(OH)D] levels was measured.
Participants: A total of 889 patients were enrolled in the study from April
2010 to April 2012
Design: We conducted retrospective study for elderly patients (≥65
years).
Measures: We developed a data-extraction tool that included information
pertaining to demographics, body mass index, routine blood investigations, calcium, phosphorus, parathyroid hormone and thyroid stimulating hormone (TSH), comorbidities identified at admission, medications, serum 25(OH)D level, Vit D supplementation and outcome.
Patients were followed up after 6 months for re-evaluation of Vit D levels and all-cause mortality.
Statistical Methods: The continuous variables were analyzed using student
t test or one-way ANOVA wherever applicable.
For skewed continuous data, a non-parametric Mann-Whitney test was used.
Categorical variables between groups were compared using the chi-square test.
We evaluated the associations between VitD
deficiency and socio-demographic and clinical indicators.

Cont.. We also studied correlation between Age,
Glycoselated Haemoglobin (HbA1c), High density lipoprotein-cholesterol and VitD levels using Pearson’s correlation method.
A 2-tailed P <0.05 was considered significant.
All data analyses were carried out using the Statistical Package for Social Sciences version 18 (SPSS Inc. USA).
The Medical Research Center at Hamad Medical Corporation, Qatar provided the ethics approval to conduct the study (IRB# 12122).
7
Results: A total of 889 patients were enrolled in the study with a
mean age of 74.9 ± 8.7 years.
The majority of patients were females (66%) and 77% were Qataris.
Patients were mainly diagnosed with
hypertension (76.5%), diabetes mellitus (63.2%),
dyslipidemia, (47.5%), dementia (26.25%),
coronary artery disease (23.65%) and
cerebrovascular accident(24.4%) (Table 1).

Cont..
At baseline, the mean serum Vit D level was 24.4±13.5 ng/ml.
Majority of patients (72%) had Vit D deficiency [mild (31.4%), moderate (29.6%), and severe (10.8%)] (Table 1).
Oral Vit D supplementation was prescribed for 33.5% patients.
Follow-up Vit D level (after 6 months) was available in 325 cases; the serum VitD changed to 28.5±13.4; (P value is 0.001).
9
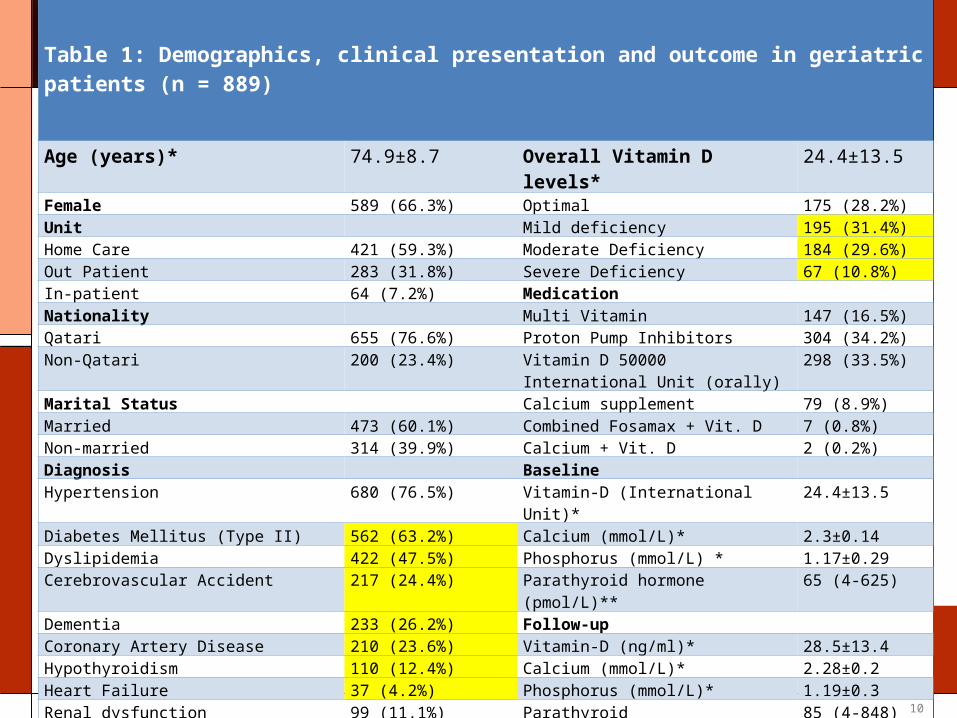
Table 1: Demographics, clinical presentation and outcome in geriatric patients (n = 889)
Age (years)* 74.9±8.7 Overall Vitamin D levels* 24.4±13.5
Female 589 (66.3%) Optimal 175 (28.2%)Unit Mild deficiency 195 (31.4%)Home Care 421 (59.3%) Moderate Deficiency 184 (29.6%)Out Patient 283 (31.8%) Severe Deficiency 67 (10.8%)In-patient 64 (7.2%) Medication Nationality Multi Vitamin 147 (16.5%)Qatari 655 (76.6%) Proton Pump Inhibitors 304 (34.2%)Non-Qatari 200 (23.4%) Vitamin D 50000 International Unit
(orally)298 (33.5%)
Marital Status Calcium supplement 79 (8.9%)Married 473 (60.1%) Combined Fosamax + Vit. D 7 (0.8%)Non-married 314 (39.9%) Calcium + Vit. D 2 (0.2%)Diagnosis Baseline Hypertension 680 (76.5%) Vitamin-D (International Unit)* 24.4±13.5
Diabetes Mellitus (Type II) 562 (63.2%) Calcium (mmol/L)* 2.3±0.14Dyslipidemia 422 (47.5%) Phosphorus (mmol/L) * 1.17±0.29Cerebrovascular Accident 217 (24.4%) Parathyroid hormone (pmol/L)** 65 (4-625)
Dementia 233 (26.2%) Follow-up Coronary Artery Disease 210 (23.6%) Vitamin-D (ng/ml)* 28.5±13.4Hypothyroidism 110 (12.4%) Calcium (mmol/L)* 2.28±0.2Heart Failure 37 (4.2%) Phosphorus (mmol/L)* 1.19±0.3Renal dysfunction 99 (11.1%) Parathyroid hormone(pmol/L)** 85 (4-848)
Fracture 32 (3.6%) Mortality 11 (1.2%)
Traumatic injury 21 (2.4%) Aspiration Pneumonia 24 (2.7%)
Urinary tract infection 12 (1.3%) * mean ± SD; ** median (range)
10
Cont…
The mean blood glucose level was significantly higher in the severe VitD deficiency group compared with the optimal group (9.5±5 vs. 7.2±3.2 ng/ml; P = 0.005). (Table 3).
Similarly, more patients in the severe group had increased HbA1c level compared with patients with optimal VitD levels (8.0±1.9 vs. 7.0±1.5 ; P= 0.03).
Patients with severe VitD deficiency also had lower mean HDL-C level than those with optimal VitD levels (1.1±0.4 vs. 1.4±0.9 ng/ml; P = 0.04).
11

Table 2: Comparison of qualitative variables according to vitamin D levels (VDL)
Vitamin D DeficiencyP
Optimal VDL (n = 175)
Mild (n = 195) Moderate (n = 184)
Severe (n = 67)
Gender
Female 126 (72.0%) 137 (70.3%) 126 (68.5%) 47 (70%) 0.912
Male 49 (28%) 58 (29.7%) 58 (31.5%) 20 (30%)
Unit
HHS 66 (42.0%) 91 (54.2%) 102 (68.0%) 49 (87.5%) 0.001
Out Patient 67 (42.7%) 55 (32.7%) 34 (22.7%) 5 (9.4%)
In-patient 24 (15.3%) 22 (13.1%) 14 (9.3%) 2 (3.6%)
Nationality
Qatari 135 (79.4%) 146 (77.2%) 133 (75.6%) 49 (76.6%) 0.354
Non-Qatari 35 (20.6%) 43 (22.8%) 43 (24.4%) 15 (23.4%)
Marital Status
Married 104 (69.8%) 88 (52.0%) 89 (54.0%) 28 (43.8%) 0.008
Non-married 45 (30.2%) 81 (48.0%) 76 (46.0%) 36 (56.2%)
Diagnosis (on-admission)
Diabetes Mellitus 107 (61.1%) 128 (65.6%) 124 (67.4%) 46 (68.7%) 0.566
Hypertension 135 (77.1%) 159 (81.5%) 148 (80.4%) 47 (70.1%) 0.217
Dementia 43 (24.6%) 60 (30.8%) 44 (23.9%) 16 (23.9%) 0.388
Coronary Artery Disease 37 (21.1%) 36 (18.6%) 49 (26.6%) 22 (32.8%) 0.055
Heart Failure 7 (4.0%) 7 (3.6%) 11 (6.0%) 3 (4.5%) 0.703
Dyslipidemia 85 (48.6%) 97 (49.7%) 95 (51.6%) 31 (46.3%) 0.879
Renal Dysfunction 24 (13.7%) 15 (2.4%) 31 (5%) 10 (1.6%) 0.055
Cerebrevascular Accident 46 (26.3%) 50 (25.6%) 47 (25.5%) 18 (26.9%) 0.996
Hypothyroidism 26 (14.9%) 33 (16.98%) 25 (13.6%) 11 (16.4%) 0.824
Fracture 6 (1%) 5 (7.7%) 9 (16.8%) 5 (14.9%) 0.302
Traumatic 2 (1.1%) 3 (1.5%) 9 (4.9%) 2 (3.0%) 0.100
Social Admission 1 (0.6%) 2 (1.0%) 2 (1.1%) 3 (4.5%) 0.101
Aspiration Pneumonia 5 (2.9%) 3 (1.5%) 4 (2.2%) 3 (4.5%) 0.565
Urinary tract infection 1 (0.6%) 4 (2.1%) 4 (2.2%) 0 (0.0%) 0.376
Infected bedsore 1 (0.6%) 2 (1.0%) 2 (1.1%) 2 (3.0%) 0.461
Medication
Multi vitamins 34 (19.4%) 41 (21.0%) 25 (13.6%) 15 (22.4%) 0.209
Proton Pump Inhibitors 52 (29.7%) 79 (40.5%) 76 (41.3%) 34 (50.7%) 0.038
Vitamin D 50000 IU (Orally) 65 (37.1%) 81(41.5%) 96 (52.2%) 39 (58.2%) 0.003
Calcium supplement 22 (12.6%) 21 (10.8%) 19 (10.3%) 8 (11.9%) 0.910
Fosamax + Vitamin D 1 (0.6%) 1 (0.5%) 1 (0.5%) 0 (0%) 0.946
Calcium + Vitamin D 0 (0%) 1 (0.5%) 0 (0%) 1 (1.5%) 0.237
Mortality 2 (1.1%) 1 (0.5%) 1 (0.5%) 0 (0%) 0.755
HHS: Home Healthcare services
12

Table 3: Comparison of quantitative variables according to vitamin D levels (VDL)
Vitamin D Deficiency P
Baseline Optimal VDL (n=175)
Mild (n=195) Moderate (n=184)
Severe (n=67)
Age (years) 74±8.4 75.3±8.3 74.8±7.6 75.5±9.8 0.462Body Mass Index 24.7±5.7 23.1±5.2 26.7±6.5 27.2±7.4 0.263Vitamin-D (ng/ml) 41.2±11.5 24.6±2.9 14.9±2.9 6.5±1.9 0.001Calcium (mmol/L) 2.3±0.14 2.28±0.12 2.29±0.15 2.26±0.13 0.307Cholesterol (mmol/L) 4.3±0.9 4.4±0.96 4.5±1.2 4.5±1 0.464Triglycerides (mmol/L) 1.28±0.65 1.38±1.1 1.45±0.7 1.53±0.9 0.304TSH (mIU/L) 2.2±1.6 3.9±8.9 3.8±10.2 7.1±17.8 0.081
ALP (IU/L) 82.4±45.1 89.6±57.8 99.3±63.4 105±84 0.049Glucose (mmol/L) 7.2±3.2 7.7±3.7 8.2±5.1 9.5±5 0.005HbA1c (%) 7.05±1.5 7.3±1.4 7.2±1.8 8±1.9 0.034
LDL (mmol/L) 2.5±0.73 2.6±0.8 2.7±1 2.8±0.8 0.133eGFR (ml/minute) 55.3±8.5 47.9±18.1 56.1±6.7 50±17.3 0.432T4 (ng/L) 18±17.5 16±6.8 13.6±2 12.9±2.8 0.381Phosphorus (mmol/L) 1.17±0.2 1.2±0.4 1.15±0.3 1.05±0.27 0.118Parathormone (pmol/L) 96.8±124.3 108.5±105.3 161±164 130.2±104.7 0.212Hemoglobin (g/dl) 12.1±1.6 12±1.8 12.1±1.9 12.07±1.7 0.959HDL-C (mmol/L) 1.4±0.9 1.3±0.3 1.2±0.4 1.1±0.4 0.040Ejection Fraction (%) 51.9±11.4 54.4±5.5 53.4±9.6 52.8±8.2 0.916Albumin (mmol/L) 38.4±6.1 38.5±4.5 38.2±9.9 36.7±5.2 0.344Follow-up Vitamin-D(ng/ml) (2) International Unit)
38.2±15.9 26.9±9.4 25.6±11.5 22.3±13.8 0.001
Parathyroid hormone (pmol/L)
104±81.8 122.2±111.4 154.2±171.9 151.7±185.9 0.807
Calcium (mmol/L) 2.28±0.13 2.32±0.37 2.25±0.15 2.27±0.12 0.516Phosphorus (mmol/L) 1.1±0.25 1.2±0.29 1.2±0.23 1.2±0.26 0.693TSH: Thyroid stimulating hormone; ALP: Alkaline Phosphatase; LDL-C: low density lipoprotein cholesterol; HDL-C: High Density lipoprotein cholesterol;T4: Thyroxin hormone; eGFR: estimated Glomerular filtration rate all variable are expressed as mean ± standard deviation
13

14
Figure 1: Correlation between HDL-C and vitamin D levels in geriatric patients
Vitamin D levels (ng/ml)
HDL -
Cholesterol

Figure 2: Correlation between HbA1c and vitamin D levels in geriatric patients
15
HbA1c
Vitamin D levels (ng/ml)
Discussion
A high prevalence of VitD deficiency has been reported among the young in Qatar, which could be related to lifestyle and socio-cultural practices [10].
This is a unique study from our region that addresses the influence of age, diabetic status, and hyperlipidaemia on Vit D among a geriatric population.
The present study shows a high prevalence of Vit D deficiency (71.8%) among the elderly in Qatar, which might be explained by limited sunlight exposure with increasing age, usually due to sedentary lifestyle, clothing, extreme summers and minimal outdoor activity.
Cont…
In the present study, markers of T2DM (high fasting blood glucose levels and raised HbA1c) had a negative correlation with levels of circulating vitamin D3.
It has been observed that significantly higher levels of blood glucose (P = 0.005) and HbA1c (P = 0.03) were associated with severe VitD deficiency.
Fraser et al [16]; found a positive association between HDL-C and 25(OH)D levels.
In this study, HDL-C level and Vit D deficiency had significant inverse relationship, as patients with lower level of HDL-C had severe Vit D deficiency.
LDL-C and triglyceride were non-significantly higher in patients with severe Vit D deficiency compared with those with optimal levels.

Dementia and Vitamin D: This study contributes to the mounting data suggesting a
relationship between 25(OH)D levels and advanced vascular dementia
Out of 889 patients, 233(26.2%) patients with advanced vascular dementia enrolled in this study didn’t show any relationship with severe Vit D deficiency; P value = 0.39 (Figure 3).
However it has been retrospectively difficult to evaluate the relationship between Vascular Dementia related cognitive change and vit D deficiency because of many potential confounders, different tests used for measuring cognition by various neurologist and improper documentation of modified mini mental examination(MMSE)in the file.
19
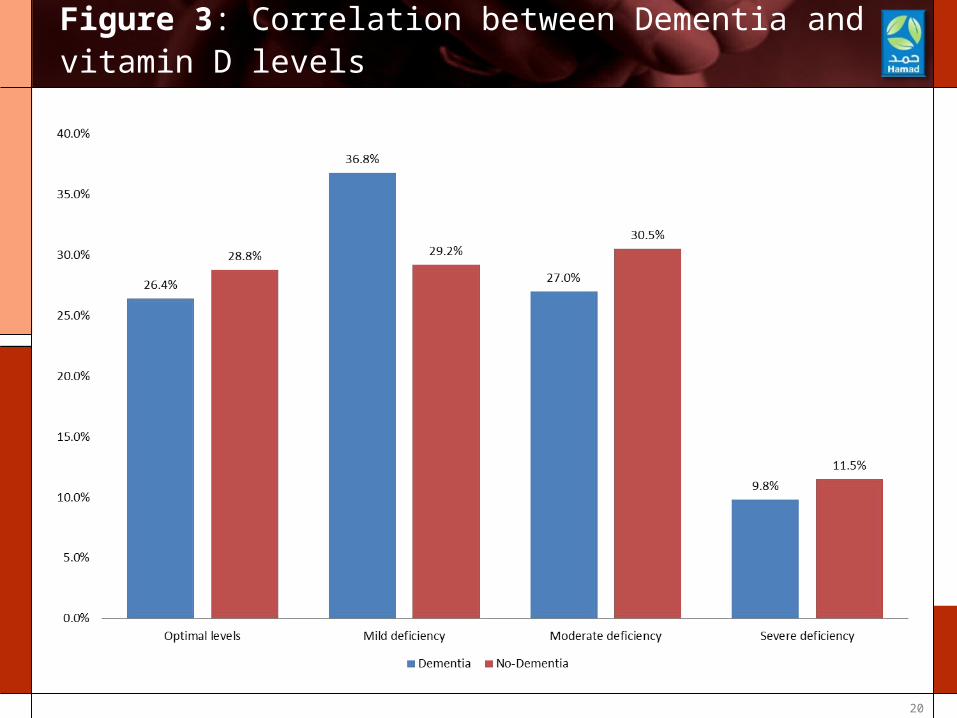
Figure 3: Correlation between Dementia and vitamin D levels
20

Limitation of our study:
Cause-specific mortality as well as on Vit D supplementation during follow-up were not available.
We have not taken into consideration the influence of seasons in our analyses.
The retrospective nature of the study is another limitation.
Despite these limitations, our study with a large sample size represents the geriatric population of our region. The present study gives an insight into the prevalence of VitD deficiency and its associated factors among the elderly in Qatar.
21

Conclusion:
A high incidence of Vit D deficiency was observed in the elderly.
Lower serum Vit D level were inversely correlated with HbA1c and HDL-C levels.
The follow-up showed significant improvement in Vit D level after Vit D supplementation. Therefore, further intervention studies are warranted to evaluate whether Vit D supplementation improves low HDL-C levels and/or glycaemic control in T2DM .
Prospective study is require to evaluate the relationship between Dementia related cognitive changes and vit D deficiency.
22

References1. Burleigh E, Potter J. Vitamin D deficiency in outpatients: a Scottish perspective. Scott Med J 2006; 51: 27–31
2. Boucher BJ, Mannan N, Noonan K, Hales CN, Evans SJ. Glucose intolerance and impairment of insulin secretion in relation to vitamin D deficiency in east London Asians. 1995;38(10):1239-45.
3. Mahdy S, Al-Emadi SA, Khanjar IA, Hammoudeh MM, Sarakbi HA, Siam AM, Abdelrahman MO. Vitamin D status in health care professionals in Qatar. Saudi Med J. 2010; 31(1):74-7.
4. Dobnig H, Pilz S, Scharnagl H, Renner W,Seelhorst U, Wellnitz B, Kinkeldei J, Boehm BO,Weihrauch G, Maerz W. Independent associationof low serum 25-hydroxyvitamin d and 1,25-dihydroxyvitamin d levels with all-cause and cardiovascular mortality. ArchIntern Med2008;168:1340–1349.
5. Holick MF. Vitamin D deficiency. N Engl J Med 2007;357:266–8
6. Pilz S, Tomaschitz A, Obermayer-Pietsch B,Dobnig H, Pieber TR. Epidemiology of vitamin D insufficiency and cancer mortality. Anticancer Res 2009; 29:3699– 3704.
7. Houston D K, Cesari M, Ferrucci L, et al. Association between Vitamin D status and physical performance: The InCHIANTI Study. J Gerontol A Biol Sci Med Sci, 2007;62: 440-446.
23
Cont.. 8. Atli T, Gullu S, Uysal AR, Erdogan G. The prevalence of Vitamin D deficiency and effects of ultraviolet light on Vitamin D levels in elderly Turkish population. Arch Gerontol Geriatr. 2005 ;40(1):53-60.
9. Peterlik M, Cross HS. Vitamin D and calcium deficits predispose for multiple chronic diseases. Eur J Clin Invest. 2005;35(5):290-304.
10. Bener A, Al-Ali M, Hoffmann GF. High prevalence of vitamin D deficiency in young children in a highly sunny humid country: a global health problem. Minerva Pediatr. 2009;61(1):15-22.
11. Lau,K-HW, Baylink DJ. Vitamin D therapy of osteoporosis: plain vitamin D therapy versus active vitamin D analog (D-hormone) therapy. Calcified Tissue Int 1999; 65, 295–306.
12. De Pergola G, Armmiriti A, Caccavo D, Bavaro S, Barone G. Vitamin D, Obesity, and risk of Diabetes 2012;30(2):59-66.
24

Cont..
13. Mitri J, Muraru MD, Pittas AG. Vitamin D and type 2 diabetes: a systematic review. Eur J Clin Nutr. 2011;65(9):1005-15.
14. Mathieu C, Gysemans C, Giulietti A, Bouillon R: Vitamin D and diabetes. Diabetologia 2005, 48:1247-1257.
15. Hidayat R, Setiati S, Soewondo P. The association between vitamin D deficiency and type 2 diabetes mellitus in elderly patients. Acta Med Indones. 2010;42(3): 123-9.
16. Fraser A, Williams D, Lawlor DA. Associations of serum 25-hydroxyvitamin D, parathyroid hormone and calcium with cardiovascular risk factors: analysis of 3 NHANES cycles (2001-2006). PLoS One 2010;5:e13882
25

THANK YOU
26