Embed Size (px)
Citation preview

Study of the Impacts of Implements of Husbandry on BridgesVolume II: Rating and Posting RecommendationsAugust 2017
Sponsored byIowa Highway Research Board (IHRB Project TR-613)Iowa Department of Transportation (InTrans Projects 9-364 and 11-399) Federal Highway Administration Transportation Pooled Fund TPF-5(232)

About the Bridge Engineering CenterThe mission of the Bridge Engineering Center (BEC) is to conduct research on bridge technologies to help bridge designers/owners design, build, and maintain long-lasting bridges.
About the Institute for Transportation The mission of the Institute for Transportation (InTrans) at Iowa State University is to develop and implement innovative methods, materials, and technologies for improving transportation efficiency, safety, reliability, and sustainability while improving the learning environment of stu-dents, faculty, and staff in transportation-related fields.
Disclaimer NoticeThe contents of this report reflect the views of the authors, who are responsible for the facts and the accuracy of the information presented herein. The opinions, findings and conclusions expressed in this publication are those of the authors and not necessarily those of the sponsors.
The sponsors assume no liability for the contents or use of the information contained in this document. This report does not constitute a standard, specification, or regulation.
The sponsors do not endorse products or manufacturers. Trademarks or manufacturers’ names appear in this report only because they are considered essential to the objective of the document.
Iowa State University Non-Discrimination Statement Iowa State University does not discriminate on the basis of race, color, age, ethnicity, religion, national origin, pregnancy, sexual orientation, gender identity, genetic information, sex, marital status, disability, or status as a U.S. veteran. Inquiries regarding non-discrimination policies may be directed to Office of Equal Opportunity, 3410 Beardshear Hall, 515 Morrill Road, Ames, Iowa 50011, Tel. 515-294-7612, Hotline: 515-294-1222, email [email protected].
Iowa Department of Transportation Statements Federal and state laws prohibit employment and/or public accommodation discrimination on the basis of age, color, creed, disability, gender identity, national origin, pregnancy, race, religion, sex, sexual orientation or veteran’s status. If you believe you have been discriminated against, please contact the Iowa Civil Rights Commission at 800-457-4416 or Iowa Department of Transportation’s affirmative action officer. If you need accommodations because of a disability to access the Iowa Department of Transportation’s services, contact the agency’s affirmative action officer at 800-262-0003.
The preparation of this report was financed in part through funds provided by the Iowa Department of Transportation through its “Second Revised Agreement for the Management of Research Conducted by Iowa State University for the Iowa Department of Transportation” and its amendments.
The opinions, findings, and conclusions expressed in this publication are those of the authors and not necessarily those of the Iowa Department of Transportation or the U.S. Department of Transportation Federal Highway Administration.

Technical Report Documentation Page
2. Government Accession No. 3. Recipient’s Catalog No.1. Report No.
IHRB Project TR-613
and TPF-5(232)
4. Title and Subtitle 5. Report Date
Study of the Impacts of Implements of Husbandry on Bridges
Volume II: Rating and Posting Recommendations
August 2017
6. Performing Organization Code
7. Author(s) 8. Performing Organization Report No.
Lowell Greimann (orcid.org/0000-0003-2488-6865), Brent Phares
(orcid.org/0000-0001-5894-4774), Ping Lu (orcid.org/0000-0002-9427-2415),
and Katelyn Freeseman (orcid.org/0000-0003-0546-3760)
InTrans Projects 9-364 and 11-399
9. Performing Organization Name and Address 10. Work Unit No. (TRAIS)
Bridge Engineering Center
Iowa State University
2711 South Loop Drive, Suite 4700
Ames, IA 50010-8664
11. Contract or Grant No.
12. Sponsoring Organization Name and Address 13. Type of Report and Period Covered
Iowa Highway Research Board
Iowa Department of Transportation
800 Lincoln Way
Ames, IA 50010
Federal Highway Administration
Transportation Pooled Fund
1200 New Jersey Avenue SE
Washington, DC 20590
Volume II: Final Report
14. Sponsoring Agency Code
IHRB Project TR-613 and TPF-5(232)
15. Supplementary Notes
Visit www.intrans.iastate.edu for color pdfs of this and other research reports.
16. Abstract
The objectives of this study were to develop guidance for engineers on how implements of husbandry loads are resisted by
traditional bridges, with a specific focus on bridges commonly found on the secondary road system; provide recommendations for
accurately analyzing bridges for these loading effects; and make suggestions for the rating and posting of these bridges.
To achieve the objectives, the distribution of live load and dynamic impact effects for different types of farm vehicles on three
general bridge types—steel-concrete, steel-timber, and timber-timber—were investigated through load testing and analytical
modeling. The types of vehicles studied included, but were not limited to, grain wagons/grain carts, manure tank wagons,
agriculture fertilizer applicators, and tractors.
Once the effects of these vehicles had been determined, a parametric study was carried out to develop live load distribution factor
(LLDF) equations that account for the effect of husbandry vehicle loads. Similarly, recommendations for dynamic effects were
also developed. The live load distribution factors and dynamic load allowances are covered in the first volume of the report.
Finally, suggestions on the analysis, rating, and posting of bridges for husbandry implements were developed. Those suggestions
are covered in this volume of the report.
The third volume of the report contains six appendices that include the 19 mini-reports for field tested and analytically modeled
steel-concrete, steel-timber, and timber-timber bridges, the farm implement and bridge inventories for the project, and survey
responses.
17. Key Words 18. Distribution Statement
bridge loads—bridge posting—bridge rating—dynamic load allowance—
husbandry implements—live load testing
No restrictions.
19. Security Classification (of this
report)
20. Security Classification (of this
page)
21. No. of Pages 22. Price
Unclassified. Unclassified. 73 NA
Form DOT F 1700.7 (8-72) Reproduction of completed page authorized


STUDY OF THE IMPACTS OF IMPLEMENTS OF
HUSBANDRY ON BRIDGES
Volume II: Rating and Posting Recommendations
August 2017
Principal Investigator
Brent Phares, Director
Bridge Engineering Center, Iowa State University
Co-Principal Investigator
Terry Wipf, Professor and Chair
Civil, Construction, and Environmental Engineering, Iowa State University
Authors
Lowell Greimann, Brent Phares, Ping Lu, and Katelyn Freesman
Sponsored by
Iowa Highway Research Board,
(IHRB Project TR-613),
Iowa Department of Transportation, and
Federal Highway Administration
Transportation Pooled Fund (TPF-5(232))
Preparation of this report was financed in part
through funds provided by the Iowa Department of Transportation
through its Research Management Agreement
with the Institute for Transportation
(InTrans Projects 9-364 and 11-399)
A report from
Bridge Engineering Center and
Institute for Transportation
Iowa State University
2711 South Loop Drive, Suite 4700
Ames, IA 50010-8664
Phone: 515-294-8103 / Fax: 515-294-0467
www.intrans.iastate.edu


v
TABLE OF CONTENTS
ACKNOWLEDGMENTS ............................................................................................................. ix
THREE-VOLUME EXECUTIVE SUMMARY ........................................................................... xi
1. INTRODUCTION ...............................................................................................................1
1.1 Problem Statement .........................................................................................................1
1.2 Research Objectives and Scope .....................................................................................2
1.3 Research Methodology ..................................................................................................2
1.4 Three-Volume Report Organization ..............................................................................2
1.5 Methodology for Rating and Posting Recommendations (Volume II) ..........................3
1.6 Volume II Organization .................................................................................................3
2. GENERIC AGRICULTURAL RATING VEHICLE AND SIGNAGE ..............................4
2.1 Vehicle Descriptions ......................................................................................................4
2.2 Moment Envelopes ........................................................................................................6
2.3 Controlling Husbandry Vehicles..................................................................................10
2.4 Generic Agricultural Rating Vehicles ..........................................................................13
2.5 Moment Ratios .............................................................................................................14
2.5.1 Generic Agricultural versus Husbandry Vehicle Comparison Results .............. 15
2.5.2 Rating and Posting Vehicles versus Husbandry Vehicle Comparison
Results ............................................................................................................... 20
3. OPERATING RATINGS, OPERATING RATING RATIOS, AND LEGAL
AGRICULTURAL VEHICLE MODELS .........................................................................25
3.1 Operating Ratings and Operating Rating Ratios ..........................................................25
3.2 Legal Agricultural Vehicles .........................................................................................43
4. SUMMARY OF SURVEY RESPONSES ........................................................................46
5. RATING EXAMPLES ......................................................................................................47
5.1 Example 1. Short-Span Bridge ....................................................................................47
5.1.1 Load Factor Rating ............................................................................................ 47
5.1.2 Interior Girder Non-Composite Moment Capacity ............................................ 48
5.1.3 Moments in Interior Girder ................................................................................ 48
5.1.4 Dynamic Load Allowance, IM .......................................................................... 49
5.1.5 Live Load Plus Impact ....................................................................................... 49
5.1.6 Rating Factors .................................................................................................... 49
5.1.7 Operating Ratings .............................................................................................. 49

vi
5.2 Example 2. Long-Span Bridge .....................................................................................51
5.2.1 Load Factor Rating ............................................................................................ 51
5.2.2 Interior Girder Non-Composite Moment Capacity ............................................ 51
5.2.3 Moments in Interior Girder ................................................................................ 52
5.2.4 Dynamic Load Allowance, IM: ......................................................................... 52
5.2.5 Live Load Plus Impact ....................................................................................... 53
5.2.6 Rating Factors .................................................................................................... 53
5.2.7 Operating Rating ................................................................................................ 53
6. POSTING SIGNAGE ........................................................................................................55
6.1 MUTCD Requirement for Post Signs ..........................................................................55
6.2 Posting or Speed Limit Signs for Agricultural (Farm) Vehicles .................................56
7. SUMMARY AND CONCLUSIONS FOR RATING AND POSTING
RECOMMENDATIONS (VOLUME II) ..........................................................................58
REFERENCES ..............................................................................................................................61
vii
LIST OF FIGURES
Figure 1. HL-93 – AASHTO design vehicle .................................................................................. 4 Figure 2. HS20 and NRL - rating vehicles ..................................................................................... 5 Figure 3. SHVs and Type 4 Truck - posting vehicles ..................................................................... 6
Figure 4. Single-span bridge, Bridge1_1, moment envelopes and critical locations for 121
husbandry vehicles .............................................................................................................. 7 Figure 5. Two-span bridge, Bridge2_1, moment envelopes and critical locations for 121
husbandry vehicles .............................................................................................................. 8 Figure 6. Three-span bridge, Bridge3_1, moment envelopes and critical locations for 121
husbandry vehicles .............................................................................................................. 9 Figure 7. Four-span bridge, Bridge4_1, moment envelopes and critical locations for 121
husbandry vehicles .............................................................................................................. 9
Figure 8. Three-axle husbandry vehicle ........................................................................................ 10 Figure 9. Four-axle husbandry vehicle ......................................................................................... 11 Figure 10. Five-axle husbandry vehicle ........................................................................................ 12
Figure 11. Three-axle controlling vehicles ................................................................................... 13 Figure 12. Four-axle controlling vehicle ...................................................................................... 13
Figure 13. Five-axle controlling vehicles ..................................................................................... 13 Figure 14. Three-axle generic agricultural rating vehicles, AV3 ................................................. 14 Figure 15. Four-axle generic agricultural rating vehicle, AV4 ..................................................... 14
Figure 16. Five-axle generic agricultural rating vehicles, AV5 .................................................... 14 Figure 17. Moment ratio plot for AV/husbandry for single-span bridges .................................... 16
Figure 18. Moment ratio plot for AV/husbandry for two-span bridges ........................................ 17 Figure 19. Moment ratio plot for AV/husbandry for three-span bridges ...................................... 18
Figure 20. Moment ratio plot for AV/husbandry for four-span bridges ....................................... 19 Figure 21. Bridge3_16 moment envelopes for AV3 and V3-26 ................................................... 20
Figure 22. Moment ratios for rating and posting husbandry vehicles for single-span bridges ..... 21 Figure 23. Moment ratios for rating and posting husbandry vehicles for two-span bridges ........ 22 Figure 24. Moment ratios for rating and posting husbandry vehicles for three-span bridges ...... 23
Figure 25. Moment ratios for rating and posting husbandry vehicles for four-span bridges........ 24 Figure 26. AV3 ratios for one-span bridges .................................................................................. 26
Figure 27. AV4 ratios for one-span bridges .................................................................................. 27 Figure 28. AV5 ratios for one-span bridges .................................................................................. 28
Figure 29. AV3 ratios for two-span bridges ................................................................................. 29 Figure 30. AV4 ratios for two-span bridges ................................................................................. 30 Figure 31. AV5 ratios for two-span bridges ................................................................................. 31 Figure 32. AV3 ratios for three-span bridges ............................................................................... 32
Figure 33. AV4 ratios for three-span bridges ............................................................................... 33 Figure 34. AV5 ratios for three-span bridges ............................................................................... 34 Figure 35. AV3 ratios for four-span bridges ................................................................................. 35
Figure 36. AV4 ratios for four-span bridges ................................................................................. 36 Figure 37. AV5 ratios for four-span bridges ................................................................................. 37 Figure 38. AV3 ratio versus minimum span length ...................................................................... 38 Figure 39. AV4 ratio versus minimum span length ...................................................................... 39 Figure 40. AV5 ratio versus minimum span length ...................................................................... 40

viii
Figure 41. Minimum AV OR ratio versus minimum span length – rating vehicles ..................... 41 Figure 42. Minimum AV OR ratio versus minimum span length – posting vehicles .................. 42 Figure 43. Effects of short span on OR ratio ................................................................................ 43 Figure 44. Posting AV vehicles, AV3a and AV3b ....................................................................... 43
Figure 45. Posting AV vehicles, AV4a and AV4b ....................................................................... 43 Figure 46. Posting AV vehicles, AV5a, AV5b, and AV5c........................................................... 44 Figure 47. Posting sign for a shorter bridge .................................................................................. 50 Figure 48. Posting sign for a longer bridge................................................................................... 54 Figure 49. Bridge posting signage options provided by the MUTCD .......................................... 55
Figure 50. Farm vehicle speed limit sign ...................................................................................... 56 Figure 51. Farm vehicle posting signs .......................................................................................... 57
LIST OF TABLES
Table 1. Vehicle weights............................................................................................................... 45
Table 2. Girder geometry for Example 1 short-span bridge ......................................................... 47 Table 3. Girder geometry for the example long-span bridge ........................................................ 51

ix
ACKNOWLEDGMENTS
The research team would like to acknowledge the Iowa Highway Research Board, the Iowa
Department of Transportation (DOT), and the Federal Highway Administration for sponsoring
this research with support from the following Transportation Pooled Fund TPF-5(232) partners:
Illinois
Iowa (lead state)
Kansas
Minnesota
Nebraska
Oklahoma
Wisconsin
Wisconsin
The authors would like to express their gratitude to the Iowa DOT and the other pooled fund
state partners for their financial support and technical assistance and also thank the USDA Forest
Products Laboratory for their support of this project. In addition, the authors would like to
acknowledge the support of the Iowa DOT Office of Bridges and Structures staff members, who
continually provide great insight, guidance, and motivation for practical and implementable
research.


xi
THREE-VOLUME EXECUTIVE SUMMARY
The deterioration of bridges is a prevalent issue in the US. A portion of that deterioration comes
from the frequent subjection of bridges to oversized loads. Of those oversized loads, implements
of husbandry are of particular interest. Although states differ in their definition, an implement of
husbandry can generally be thought of as a vehicle used to carry out agricultural activities. These
vehicles often carry heavy loads, and little is known on how husbandry implements affect
today’s bridges.
The behavior of bridges with these vehicles, particularly regarding live load distribution and
impact, is not explicitly enveloped within the design, rating, and posting vehicles presented in
current American Association of State Highway and Transportation Officials (AASHTO)
specifications. Because of the large axle loads and varying axle spacings, the current AASHTO
vehicles, such as the HL-93 design truck and the HS20 rating truck, may not accurately represent
husbandry implements.
The objectives of this research, presented in a three-volume report series, were to develop
guidance for engineers on how implements of husbandry loads are resisted by traditional bridges,
with a specific focus on bridges commonly found on the secondary road system; provide
recommendations for accurately analyzing bridges for these loading effects; and make
suggestions for the rating and posting of these bridges
Volume I focuses on the impacts of husbandry implements on actual bridges by way of field
testing as well as analytical finite element models. With these data, the objective was to develop
equations and limits for dynamic load allowances and live load distribution factors that apply
directly to husbandry vehicles.
Included in the testing were bridges with steel girders with both concrete and timber decks as
well as bridges with timber girders and timber decks. Field testing was conducted on 19 of the
bridges in this collection. Brief reports for each of the 19 bridges are in Volume III: Appendices.
The data collected from field tests were used to determine a reasonable bound for impact factors
for husbandry implements as well as to get a base understanding of how live load moments
created by husbandry vehicles are distributed among girders. In addition to the field tests, finite
element models were created for the 19 bridges and calibrated with the field test results. Using
these models as guidelines, finite element modes were created for 151 bridges included in the
inventory (also included in Volume III: Appendices). The finite element models were subjected
to the loads of 121 typical husbandry vehicles inventoried (also included in Volume III:
Appendices) and modeled using finite element analysis.
Results show that the impact factors currently presented in the AASHTO specifications are too
low for husbandry vehicles. Similarly, provisions provided by AASHTO for live load
distribution are, in some cases, drastically different from live load distribution factors determined
from loading the 151 bridges with the 121 husbandry vehicles. Volume I provides

xii
recommendations on upper limits for dynamic load allowances as well as several equations for
determining live load distribution specifically for husbandry implements.
The purpose of the work covered in Volume II was to determine whether current AASHTO
rating and posting vehicles can be used to accurately represent husbandry implements. Using
software generated by the Bridge Engineering Center at Iowa State University’s Institute for
Transportation, AASHTO vehicles and the same 121 husbandry vehicles inventoried and used in
the Volume I work were theoretically driven across 174 bridges (several of which were also
included in the study in Volume I).
With the moments produced by both the AASHTO and husbandry vehicles on these bridges,
comparisons were made between moment envelopes for both vehicle types as well as for
theoretical operating ratings for both vehicle types. Results showed that the vehicles provided in
AASHTO specifications do not accurately represent the effects caused by husbandry vehicles. In
addition, on shorter span bridges, husbandry vehicles tend to produce lower operating ratings
than the AASHTO vehicles. On longer span bridges, husbandry vehicles seem to lead to higher
operating ratings than AASHTO vehicles.
Volume II presents the development of an overarching husbandry vehicle, recommendations on
signage and posting for husbandry vehicles, as well as bridge rating examples, for both short and
long span bridges, using updated distribution and impact factors as presented in Volume I.
Finally, Volume III is a collection of appendices referenced in Volumes I and II. Appendices A,
B, and C are a series of mini reports for the 19 field tested bridges from Volume I. Appendix D
includes detailed information of the 121 farm vehicles used for the study. Appendix E is a
detailed inventory of the 151 bridges from Volume I and 174 bridges used in Volume II.
Appendix F includes the survey sent to the state departments of transportation and responses to
questions about their rules and regulations for husbandry implements on bridges.

1
1. INTRODUCTION
In the US, bridges are typically designed and load rated based on the specifications provided by
the American Association of State Highway and Transportation Officials (AASHTO). These
specifications were developed to ensure the safety of bridges for traditional highway vehicles. As
a part of both the design and rating process, live loads in the form of a typical highway truck are
distributed across the various structural elements to determine the shear and moments in those
elements. Although the process to determine these shear and moments can be quite intensive, the
process has been simplified to a degree through the use of the live load distribution factors
(LLDFs) and the dynamic load allowance (IM) specified by the AASHTO standards and LRFD
specifications (AASHTO 1996, AASHTO 2010).
LLDFs can be broadly defined as the ratio of the maximum live-load effect in a component to
the maximum live-load effect in a system when using beam-line model techniques (Barker and
Puckett 2013). LLDFs were developed to examine the bridge’s capability to resist traditional
highway-type vehicles (e.g., trucks, which tend to have relatively consistent widths and other
characteristics) (AASHTO 1996, AASHTO 2010). AASHTO defines the dynamic load
allowance, IM, as an increase in the applied static force effects to account for the dynamic
interaction between the bridge and moving loads.
While the AASHTO specifications are generally thought to be conservative when used to predict
the response of bridges to highway-type vehicles, concerns have been raised about their
applicability to non-highway vehicles such as husbandry implements, which often have large
axle loads and varying axle spacings.
1.1 Problem Statement
As of 2013, there were 607,380 bridges in the US (ASCE 2013), with the majority of these
bridges found on secondary roadways and generally thought of as “rural” bridges. Statistics show
that 13 percent of the rural bridges are structurally deficient and 10 percent are functionally
obsolete (Orr 2012). Combining these statistics indicates that there are a large number of bridges
in rural settings that do not meet current design standards, although this does not necessarily
mean they are unsafe.
At the same time, changing technology in farming has led to heavier farm vehicles in a variety of
configurations. While these vehicles are developed for use on a farm, they commonly travel on
the roadway system as well. These vehicles tend to have different wheel spacing, gauge widths,
wheel footprints, and dynamic coupling characteristics than traditional highway vehicles, which
means they are likely resisted differently than the vehicles addressed by AASHTO specifications
(Wood and Wipf 1999, Phares et al. 2005, Seo et al. 2013).
Currently, an engineer who wants to assess a bridge’s ability to resist implements of husbandry
must make many assumptions and use best judgement. Therefore, there is a need to provide
engineers with the tools to accurately assess how highway bridges resist these atypical vehicles.

2
1.2 Research Objectives and Scope
The objectives of this study were to develop guidance for engineers on how implements of
husbandry loads are resisted by traditional bridges, with a specific focus on bridges commonly
found on the secondary road system; provide recommendations for accurately analyzing bridges
for these loading effects; and make suggestions for the rating and posting of these bridges.
1.3 Research Methodology
To achieve the objectives, the distribution of live load and dynamic impact effects for different
types of farm vehicles on three general bridge types—steel-concrete, steel-timber, and timber-
timber—were investigated by load testing and analytical modeling. The types of vehicles studied
included, but were not limited to, grain wagons/grain carts, manure tank wagons, agriculture
fertilizer applicators, and tractors.
Once the effects of these vehicles had been determined, a parametric study was carried out to
develop live load distribution factor (LLDF) equations that account for the effect of husbandry
vehicle loads. Similarly, recommendations for dynamic effects were also developed. Finally,
suggestions on the analysis, rating, and posting of bridges for husbandry implements were
developed.
1.4 Three-Volume Report Organization
This final report is presented in three volumes and summarizes the results of this project as
follows.
Volume I: Live Load Distribution Factors and Dynamic Load Allowances
Volume II: Rating and Posting Recommendations
Volume III: Appendices
The appendices in Volume III are referenced in Volumes I and II. Volume III includes the
following:
Appendix A. Field Tested Steel-Concrete Bridges
Appendix B. Field Tested Steel-Timber Bridges
Appendix C. Field Tested Timber-Timber Bridges
Appendix D. Farm Implement Inventory
Appendix E. Bridge Inventory
Appendix F. Survey Responses

3
1.5 Methodology for Rating and Posting Recommendations (Volume II)
Tools that can be used for rating and posting of bridges for implements of husbandry were
studied. Generic agricultural vehicle models were created that encompass the moments produced
by the 121 husbandry vehicles traveling over the 174 bridges (some of which were identified in
Volume I). Ratings and specification-type parameters can be generated from these generic
vehicles, which lead to recommendations on the analysis, rating, and posting of bridges for
implements of husbandry.
Survey responses regarding current weight limits on bridges from several state departments of
transportation (DOTs) were collected to gain an understanding of how these husbandry and
generic agricultural vehicles compare to vehicles of legal weight. The gross-vehicle weight limit
and axle weight limit, which have been enforced by many states, were used to create a legal
version of agricultural vehicles, which can be used for posting vehicles. The bridge restriction
signs were also studied for this project.
1.6 Volume II Organization
This report is organized into seven chapters. Following this introduction in Chapter 1, Chapter 2
outlines the development of the generic agricultural vehicles. The chapter’s first section lays out
the terminology used in this report, the second section presents the moment effects produced by
the 121 husbandry vehicles on the 174 bridges, the third and fourth sections describe how three
generic agricultural vehicles were developed to encompass the effects of the existing 121
husbandry vehicles, and the fifth section of this chapter compares the 121 husbandry vehicles
with (1) the three generic agricultural vehicles and (2) the current rating and posting vehicles.
Chapter 3 explores operating ratings of existing rating and posting vehicles as well as the generic
agricultural vehicles. Operating rating ratios are also reported in this chapter as a way to
determine which vehicles have the lowest rating on a given bridge. By considering the gross-
vehicle weight and axle weight limits that have been enforced in many states, legal version
agricultural vehicle models were created, which can potentially be used as posting vehicles.
Chapter 4 provides a brief summary of survey responses regarding current legal weight limits.
The complete survey responses are presented in Volume III – Appendix F. Survey Responses.
Chapter 5 provides two examples of rating bridges for husbandry vehicles. Chapter 6 includes
suggestions as to how signs should be adapted to best accommodate husbandry vehicles. Finally,
Chapter 7 presents a summary of the results and offers conclusions on analysis, rating, and
posting for implements of husbandry.

4
2. GENERIC AGRICULTURAL RATING VEHICLE AND SIGNAGE
In this chapter, three generic agricultural rating vehicles are developed such that the structural
response of all the bridges listed in Appendix E of Volume III due to these generic vehicles is an
upper bound to the response of the bridges due to the 121 vehicles listed in Appendix D in
Volume III.
2.1 Vehicle Descriptions
A variety of vehicles are used this study, so several terms have been defined to assist in
discussing these vehicles. The term “husbandry vehicle” refers to the 121 real farm vehicles
introduced in Volume I of this report and further discussed in this Volume II. Vehicle
information can be found in Appendix D of Volume III. The term “generic agricultural rating
vehicle” describes the representative vehicles developed in this study to serve as a bound for all
husbandry vehicles. The generic agricultural rating vehicles are sometimes referred to as AV
vehicles in this report. “Design vehicle” corresponds to those vehicles used to determine design
loads on a bridge (vehicles such as AASHTO HL-93). This vehicle is presented in Figure 1.
Truck drawing ©2010 National Precast Concrete Association
Figure 1. HL-93 – AASHTO design vehicle
“Rating vehicles,” as shown in Figure 2, are those vehicles used to conduct load rating screening
on a bridge.

5
V = Variable drive axle spacing = 6 ft 0 in. to 14 ft 0 in., and use spacing that produces maximum load effects.
Neglected axles that do not contribute to the maximum load effect under consideration.
Maximum GVW = 80 kips. Axle gage width = 6 ft 0 in.
Truck drawing (left) ©2010 National Precast Concrete Association; diagram (right) ©2007 National Cooperative
Highway Research Program
Figure 2. HS20 and NRL - rating vehicles
These vehicles include AASHTO HS20, NRL6, and NRL14. NRL refers to “notional rating
load,” and the values of 6 ft and 14 ft represent the minimum and maximum drive axle spacings,
respectively (Sivakumar et al. 2007). NRL is a rating vehicle model that envelopes all special
hauling vehicles (SHVs). “Posting vehicles,” as found in Figure 3, are vehicles that are used on
posting signs if a bridge does not have a rating deemed sufficient. Single unit posting vehicles
include SHVs (i.e., SU4, SU5, SU6, SU7) and Type 4 trucks. A single unit truck is referred to as
an SU, and the values 4, 5, 6, and 7 reference the number of axles on each vehicle (Sivakumar et
al. 2007). These vehicles can be seen in Figure 3.

6
©2007 National Cooperative Highway Research Program
Iowa DOT Attachment E to I.M. 2.120 July 18, 2013
Figure 3. SHVs and Type 4 Truck - posting vehicles
2.2 Moment Envelopes
Through the use of a computational/analytical model called BEC analysis, each of the 121
husbandry vehicles made simulated crossings over each of the 174 bridges from left-to-right and
right-to-left. BEC analysis is beam line analysis software that was developed by the Bridge
Engineering Center. It is capable of analyzing a bridge beam or girder with various boundary
conditions and member geometries. It also allows the structural response of a beam to be
analyzed under moving loads, and the software generates envelopes of maximum moments and
strains. The software was configured to output the analysis results at 200 points along the bridge
as the husbandry vehicles were driven across them. The analytical model calculated the moment
values for each vehicle at the 200 analysis points along the bridge. The moment values were used

7
to create a plot of all the husbandry vehicle moment envelopes for every bridge. Figures 4
through 7 show example moment envelopes for sample one-span, two-span, three-span and four-
span bridges, respectively, along with the critical locations marked in each span. Note that the
figures shown only portray the vehicles driven left-to-right.
Figure 4. Single-span bridge, Bridge1_1, moment envelopes and critical locations for 121
husbandry vehicles
0
50
100
150
200
250
300
350
400
450
0 1 2 3 4 5 6 7 8 9 10 11 13 14 15 16 17 18 19
Mo
men
t V
alue
(kip
-ft)
Distance from the left exterior support (ft)
0.5L

8
Figure 5. Two-span bridge, Bridge2_1, moment envelopes and critical locations for 121
husbandry vehicles
-150
-100
-50
0
50
100
150
200
250
300
0 1 2 3 3 4 5 6 7 8 8 9 10 11 12 12 13 14 15 16 17 17 18 19 20 21 21 22 23 24 25 26 26 27 28 29 30
Mo
men
t V
alues
(kip
-ft)
Distance from the left exterior support (ft)
0.4L Support 0.6L

9
Figure 6. Three-span bridge, Bridge3_1, moment envelopes and critical locations for 121
husbandry vehicles
Figure 7. Four-span bridge, Bridge4_1, moment envelopes and critical locations for 121
husbandry vehicles
-150
-100
-50
0
50
100
150
200
250
300
0 2 3 5 6 8 9 11 12 14 16 17 18 20 21 23 24 26 27 29 30 32 34 35 37 38 40 42 43 45 46
Mo
men
t V
alue
(kip
-ft)
Distance from the left exterior support (ft)
0.4L Support 0.5L Support 0.6L
-200
-100
0
100
200
300
400
0 2 4 6 9 11 13 15 17 20 23 26 28 31 34 37 40 43 46 48 51 54 57 60 63 65 67 69 71 73 75 78 80
Mo
men
t V
alue
(kip
-ft)
Distance from the left exterior support (ft)
0.4L Support 0.5L Support 0.5L Support 0.6L

10
2.3 Controlling Husbandry Vehicles
From these envelopes, the husbandry vehicles that bounded the response of the other vehicles
were determined for each bridge. These bounding vehicles were found by determining which
vehicle produced the maximum positive and negative moment values at each of the 200 analysis
points. This was done for all bridges. The resulting controlling vehicles are listed in Tables 1
through 3 for three-, four-, and five-axle vehicles, respectively. Axle weights and spacings are
listed in each table, with a drawing under each (Figures 8 through 10) to define the columns of
values in Tables 1 through 3 (respectively).
Table 1. Three-axle controlling vehicles for all bridges
Vehicle Axles
A01WT
(kips)
A02WT
(kips)
A03WT
(kips)
A01SPC
(ft)
A02SPC
(ft)
V3-1 3 20.17 20.17 68.70 11.48 19.53
V3-2 3 20.17 20.17 73.38 11.48 24.62
V3-4 3 11.53 11.53 68.70 9.87 18.83
V3-5 3 11.53 11.53 73.38 9.87 23.92
V3-8 3 18.84 18.66 73.38 11.25 24.00
V3-11 3 11.80 15.90 73.38 10.67 24.00
V3-14 3 20.24 16.06 73.38 12.92 24.62
V3-18 3 20.24 20.24 15.66 12.92 23.92
V3-20 3 8.07 8.07 68.70 7.65 19.53
V3-21 3 8.07 8.07 73.38 7.65 24.62
V3-23 3 31.61 16.16 16.16 13.67 6.83
V3-25 3 6.72 6.72 68.70 7.17 19.53
V3-26 3 6.72 6.72 73.38 7.17 24.62
V3-29 3 23.00 23.00 68.70 12.83 19.53
V3-30 3 23.00 23.00 73.38 12.83 24.62
V3-34 3 22.50 22.50 73.38 12.83 24.62
Max 31.61 23.00 73.38 13.67 24.62
Min 6.72 6.72 15.66 7.17 6.83
Avg 16.51 15.53 64.73 10.77 21.71
Yellow highlighting indicates the bounding vehicles
Figure 8. Three-axle husbandry vehicle

11
Table 2. Four-axle controlling vehicle for all bridges
Vehicle Axles
A01WT
(kips)
A02WT
(kips)
A03WT
(kips)
A04WT
(kips)
A01SPC
(ft)
A02SPC
(ft)
A03SPC
(ft)
V4-1 4 17.30 17.46 16.60 16.72 4.00 4.00 4.00
V4-2 4 20.17 20.17 43.51 43.51 11.48 21.87 6.50
V4-3 4 11.53 11.53 43.51 43.51 9.87 21.17 6.50
V4-4 4 18.84 18.66 43.51 43.51 11.25 21.50 6.50
V4-5 4 11.80 15.90 43.51 43.51 10.67 21.50 6.50
V4-8 4 20.17 20.17 36.18 36.18 11.48 24.99 5.58
V4-26 4 20.24 16.06 43.51 43.51 12.92 21.87 6.50
V4-31 4 8.07 8.07 43.51 43.51 7.65 21.87 6.50
V4-36 4 6.72 6.72 43.51 43.51 7.17 21.87 6.50
V4-41 4 23.00 23.00 43.51 43.51 12.83 21.87 6.50
Max 23.00 23.00 43.51 43.51 12.92 24.99 6.50
Min 6.72 6.72 16.60 16.72 4.00 4.00 4.00
Avg 15.78 15.77 40.09 40.10 9.93 20.25 6.16
Yellow highlighting indicates the bounding vehicle
Figure 9. Four-axle husbandry vehicle

12
Table 3. Five-axle controlling vehicles for all bridges
Vehicle Axles
A01WT
(kips)
A02WT
(kips)
A03WT
(kips)
A04WT
(kips)
A05WT
(kips)
A01SPC
(ft)
A02SPC
(ft)
A03SPC
(ft)
A04SPC
(ft)
V5-1 5 20.17 20.17 34.44 34.44 34.44 11.48 18.62 6.50 6.50
V5-2 5 11.53 11.53 34.44 34.44 34.44 9.87 17.92 6.50 6.50
V5-3 5 18.84 18.66 34.44 34.44 34.44 11.25 18.00 6.50 6.50
V5-4 5 11.80 15.90 34.44 34.44 34.44 10.67 18.00 6.50 6.50
V5-5 5 20.17 20.17 24.83 24.83 24.83 11.48 24.28 5.17 5.17
V5-13 5 20.24 16.06 24.83 24.83 24.83 12.92 24.00 5.17 5.17
V5-15 5 20.24 16.06 34.44 34.44 34.44 12.92 18.62 6.50 6.50
V5-18 5 8.07 8.07 34.44 34.44 34.44 7.65 18.62 6.50 6.50
V5-19 5 6.72 6.72 24.83 24.83 24.83 7.17 24.00 5.17 5.17
V5-21 5 6.72 6.72 34.44 34.44 34.44 7.17 18.62 6.50 6.50
V5-22 5 23.00 23.00 24.83 24.83 24.83 12.83 24.00 5.17 5.17
V5-24 5 23.00 23.00 34.44 34.44 34.44 12.83 18.62 6.50 6.50
V5-27 5 22.50 22.50 34.44 34.44 34.44 12.83 18.62 6.50 6.50
Max 23.00 23.00 34.44 34.44 34.44 12.92 24.28 6.50 6.50
Min 6.72 6.72 24.83 24.83 24.83 7.17 17.92 5.17 5.17
Avg 16.39 16.04 31.48 31.48 31.48 10.85 20.15 6.09 6.09
Yellow highlighting indicates the bounding vehicles
Figure 10. Five-axle husbandry vehicle
Note that all 121 husbandry vehicles were labeled according to the number of axles they had. In
Tables 1 through 3, the first number denotes the number of axles and the second number
represents the vehicle’s number. For example, the notation V5-1 refers to the first five-axle
vehicle (listed in Table 3). Note that only three-, four-, and five-axle farm vehicles were found to
be control vehicles.
By critically evaluating the characteristics of these controlling vehicles, test vehicles were
developed based upon similarities and trends. A few of the husbandry vehicles controlled in most
locations on most bridges, and these vehicles are highlighted in the tables above. The test
vehicles shown in Figures 11 through 13 were then generally modeled after these controlling
husbandry vehicles. Variable spacing was incorporated into the test vehicles to account for the
varied spacing in the original husbandry vehicles.

13
Figure 11. Three-axle controlling vehicles
Figure 12. Four-axle controlling vehicle
Figure 13. Five-axle controlling vehicles
2.4 Generic Agricultural Rating Vehicles
The test vehicles were slightly modified to create generic agricultural rating vehicles that would
envelope the original 121 husbandry vehicles, identified as AV3, AV4, and AV5, as shown in
Figures 14 through 16, respectively.

14
Figure 14. Three-axle generic agricultural rating vehicles, AV3
Figure 15. Four-axle generic agricultural rating vehicle, AV4
Figure 16. Five-axle generic agricultural rating vehicles, AV5
The generic vehicles were analyzed as previously described to assess whether they would bound
the moment envelopes of the 121 husbandry vehicles. Existing rating and posting vehicles were
also analyzed for comparison with the husbandry vehicles and the generic agricultural vehicles.
Again, all vehicles were run from left-to-right and from right-to-left.
2.5 Moment Ratios
The comparisons for all the vehicles were evaluated using moment ratios at critical locations
along the bridge spans. This methodology for evaluating notional vehicles was adopted from a
similar study, conducted by John Kulicki and Dennis Mertz (Kulicki and Mertz 1991), which
altered the AASHTO loading specifications into their present form, that is, HL-93. Only simply

15
supported and two-span bridges were considered in Kulicki’s study, with the critical location for
the simply supported bridge selected at midspan (0.5L), and for the two-span bridge at four-
tenths of the span length from each end of the bridge (0.4L) and at the interior support. Those
same locations were used for this study, as shown in Figures 4 and 5. For the three-span bridges
utilized in this study, the critical locations were four-tenths the span length from each end of the
bridge (0.4L), the interior supports, and half of the middle span (0.5L), as shown in Figure 6. The
locations used for four-span bridges were four-tenths the span length from each end of the bridge
(0.4L), the interior supports, and midspan for the center spans (0.5L), as shown in Figure 7. It
should be pointed out that the dynamic impact factor and live load distribution factor are not
included in the moment ratio calculation. In other words, the IM and LLDF are taken as being
the same for all types of vehicles.
2.5.1 Generic Agricultural versus Husbandry Vehicle Comparison Results
As with Kulicki’s study, the moment ratio between the proposed generic agricultural vehicle
moment and maximum moment of the 121 existing husbandry vehicles at each location was
calculated using Equation 1. The three-axle generic agricultural vehicles (AV3) were compared
only to the three-axle vehicles included in the 121 existing husbandry vehicles, the AV4 only to
the four-axle husbandry vehicles, and the AV5 only to the five-axle husbandry vehicles.
𝑀𝑅𝐴𝑉3 =𝑀 𝐴𝑉3
𝑀3−𝑎𝑥𝑙𝑒 (1)
Where MAV3 is the maximum moment from the AV3 vehicle at the critical location and M3-
axle is the maximum moment for the three-axle husbandry vehicles at the critical location.
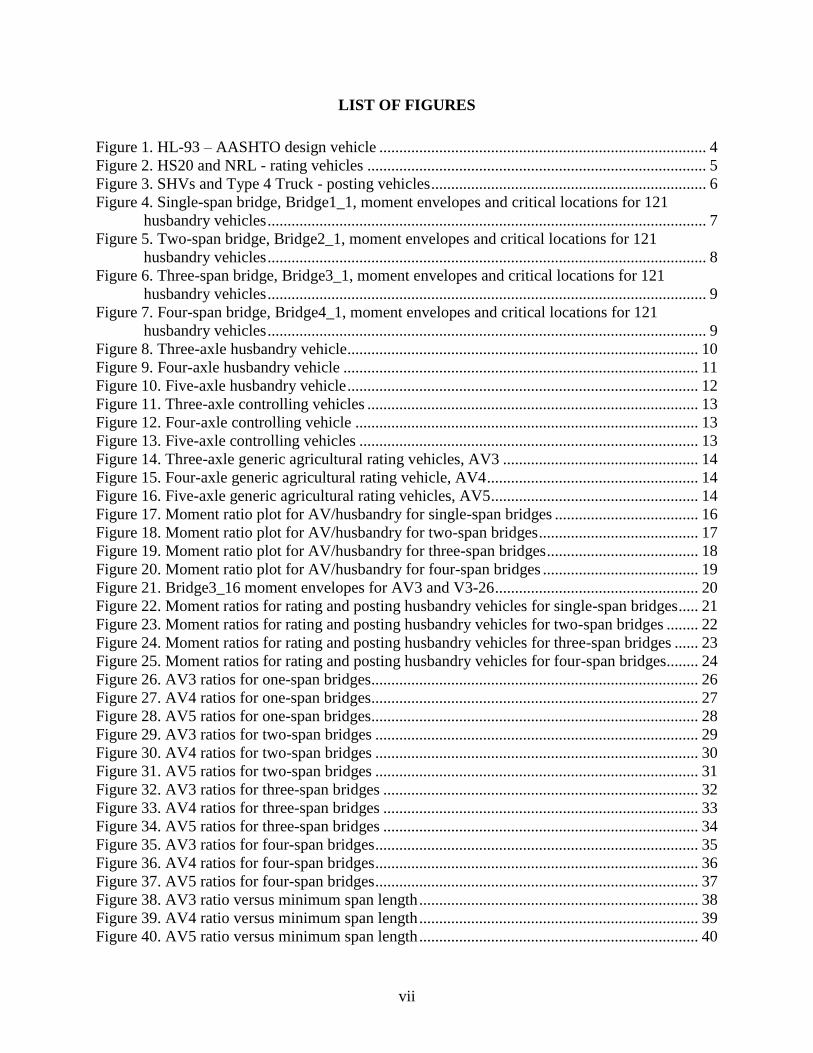
Moment ratios were calculated at the critical locations for all bridges. To display how the
vehicles compare, the highest and lowest moment ratios of all AV vehicles at all critical
locations were plotted for each bridge for one-, two-, three-, and four-span bridges, respectively,
as shown in Figures 17 through 20. These figures indicate that the AV vehicles bound the
husbandry vehicles, as both the minimum and maximum ratios are above or very near one in all
cases.

16
Figure 17. Moment ratio plot for AV/husbandry for single-span bridges
0.00
0.10
0.20
0.30
0.40
0.50
0.60
0.70
0.80
0.90
1.00
1.10
1.20
Br1
_1
aB
r1_2
Br1
_3
Br1
_4
Br1
_5
aB
r1_6
Br1
_7
aB
r1_8
aB
r1_9
Br1
_1
0a
Br1
_1
1B
r1_1
2a
Br1
_1
3a
Br1
_1
4a
Br1
_1
5B
r1_1
6a
Br1
_1
7a
Br1
_1
8a
Br1
_1
9B
r1_2
0B
r1_2
1B
r1_2
2a
Br1
_2
3a
Br1
_2
4B
r1_2
5B
r1_2
6B
r1_2
7B
r1_2
8a
Br1
_2
9a
Br1
_3
0a
Br1
_3
1B
r1_3
2a
Br1
_3
3B
r1_3
4a
Br1
_3
5B
r1_3
6a
Br1
_3
7B
r1_3
8B
r1_3
9
Mo
men
t R
atio
s
Single Span Bridges
Maximum AV/Husbandry Minimum AV/Husbandry
17
Figure 18. Moment ratio plot for AV/husbandry for two-span bridges
0.00
0.10
0.20
0.30
0.40
0.50
0.60
0.70
0.80
0.90
1.00
1.10
1.20
Br2
_1
Br2
_2
Br2
_3
Br2
_4
Br2
_5
Br2
_6
Br2
_7
Br2
_8
Br2
_9
Br2
_1
0
Br2
_1
1
Mo
men
t R
atio
s
Two Span Bridges
Maximum AV/Husbandry Minimum AV/Husbandry

18
Figure 19. Moment ratio plot for AV/husbandry for three-span bridges
0.00
0.10
0.20
0.30
0.40
0.50
0.60
0.70
0.80
0.90
1.00
1.10
1.20
1.30
1.40
1.50
Br3
_1
Br3
_2
Br3
_3
a
Br3
_4
Br3
_5
Br3
_6
Br3
_7
Br3
_8
a
Br3
_9
Br3
_1
0
Br3
_1
1
Br3
_1
2
Br3
_1
3
Br3
_1
4a
Br3
_1
5
Br3
_1
6
Br3
_1
7
Br3
_1
8
Br3
_1
9
Br3
_2
0
Br3
_2
1
Br3
_2
2
Br3
_2
3
Br3
_2
4
Br3
_2
5
Br3
_2
6
Br3
_2
7
Thre
e-sp
an
Three Span Bridges
Maximum AV/Husbandry Minimum AV/Husbandry

19
Figure 20. Moment ratio plot for AV/husbandry for four-span bridges
In a few locations on the three- and four-span bridges, the moment ratio values for the AV
vehicles fell below 1.0. The lowest moment ratio value of 0.91 is for Bridge3_16 in Figure 19.
The moment value is produced by the negative moment of the 25 foot AV3 vehicle (Figure 14),
and vehicle V3-26 (Figure 11), at 0.4L on the first span. Figure 18 illustrates the moment
envelope for only these two vehicles and shows that the 0.4L point of the first span is more
critical for positive moment.
0.00
0.10
0.20
0.30
0.40
0.50
0.60
0.70
0.80
0.90
1.00
1.10
1.20
1.30
1.40
Br4
_1
Br4
_2
Br4
_3
aB
r4_3
bB
r4_4
aB
r4_4
bB
r4_5
Br4
_6
Br4
_7
Br4
_8
Br4
_9
Br4
_1
0B
r4_1
1B
r4_1
2B
r4_1
3B
r4_1
4a
Br4
_1
4b
Br4
_1
5B
r4_1
6B
r4_1
7B
r4_1
8B
r4_1
9B
r4_2
0B
r4_2
1B
r4_2
2B
r4_2
3B
r4_2
4B
r4_2
5B
r4_2
6B
r4_2
7B
r4_2
8B
r4_2
9B
r4_3
0B
r4_3
1B
r4_3
2B
r4_3
3B
r4_3
4B
r4_3
5B
r4_3
6B
r4_3
7B
r4_3
8B
r4_3
9
Fo
ur-
span
Four Span Bridges
Maximum AV/Husbandry Minimum AV/Husbandry

20
`
Figure 21. Bridge3_16 moment envelopes for AV3 and V3-26
The other three-span bridge moment ratios that fell below 1.0 were also for the negative moment
at 0.4L of the first span and are connected to the same two vehicles. This 0.4L location is usually
more critical for positive moments and the negative moment is usually less critical, so this non-
conservativeness seems acceptable. Therefore, the AV vehicles serve as an acceptable bound for
the husbandry vehicles.
2.5.2 Rating and Posting Vehicles versus Husbandry Vehicle Comparison Results
Very similar to the way moment ratios were calculated for the AV vehicles, moment ratios for
existing rating and posting vehicles were also calculated. The only difference in the calculations
was that the moments at the critical locations for the rating or posting vehicle were compared to
the moments of all husbandry vehicles combined and were not separated into three-, four-, and
five-axle vehicles. Equation 2 shows the formula for the moment ratio of the HS20 truck. All
other rating and posting vehicles were calculated in a similar fashion.
𝑀𝑅𝐻𝑆20 =𝑀𝐻𝑆20
𝑀𝐴𝑙𝑙 (2)

21
Where MHS20 is the maximum moment of the HS20 at the critical location and MAll is the
maximum moment of all the husbandry vehicles at the critical location.
Figures 22 through 25 provide the moment ratios for the rating and posting vehicles shown in
Figures 2 and 3 for one-, two-, three-, and four-span bridges. Only the maximum ratios for each
vehicle are shown.
Figure 22. Moment ratios for rating and posting husbandry vehicles for single-span bridges
Maximum
HS20/Husbandry
Maximum Type
4/Husbandry
Maximum
SU4/Husbandry
Maximum
SU5/Husbandry
Maximum
SU6/Husbandry
Maximum
SU7/Husbandry Maximum
NRL6/Husbandry
Maximum
NRL14/Husbandry
0.00
0.10
0.20
0.30
0.40
0.50
0.60
0.70
0.80
0.90
1.00
1.10
1.20
Br1
_1
a
Br1
_3
Br1
_5
a
Br1
_7
a
Br1
_7
e
Br1
_7
g
Br1
_7
i
Br1
_7
k
Br1
_7
m
Br1
_7
o
Br1
_8
b
Br1
_8
d
Br1
_1
0a
Br1
_1
0c
Br1
_1
2a
Br1
_1
3a
Br1
_1
3c
Br1
_1
4b
Br1
_1
6a
Br1
_1
6c
Br1
_1
6e
Br1
_1
7b
Br1
_1
8a
Br1
_1
9
Br1
_2
1
Br1
_2
2b
Br1
_2
3b
Br1
_2
4
Br1
_2
6
Br1
_2
8a
Br1
_2
9a
Br1
_3
0a
Br1
_3
1
Br1
_3
2a
Br1
_3
3
Br1
_3
4b
Br1
_3
4e
Br1
_3
6a
Br1
_3
6c
Br1
_3
7
Br1
_3
9
Mo
men
t R
atio
s
Single -span Bridges

22
Figure 23. Moment ratios for rating and posting husbandry vehicles for two-span bridges
Maximum
HS20/Husbandry
Maximum Type
4/Husbandry
Maximum
SU4/Husbandry
Maximum
SU5/Husbandry Maximum
SU6/Husbandry
Maximum
SU7/Husbandry
Maximum
NRL6/Husbandry Maximum
NRL14/Husbandry
0.00
0.10
0.20
0.30
0.40
0.50
0.60
0.70
0.80
0.90
1.00
1.10
1.20
Br2
_1
Br2
_2
Br2
_3
Br2
_4
Br2
_5
Br2
_6
Br2
_7
Br2
_8
Br2
_9
Br2
_1
0
Br2
_1
1
Mo
men
t R
atio
s
Two Span Bridges

23
Figure 24. Moment ratios for rating and posting husbandry vehicles for three-span bridges
Maximum
HS20/Husbandry
Maximum Type
4/Husbandry
Maximum
SU4/Husbandry
Maximum
SU5/Husbandry
Maximum
SU6/Husbandry
Maximum
SU7/Husbandry
Maximum
NRL6/Husbandry Maximum
NRL14/Husbandry
0.00
0.10
0.20
0.30
0.40
0.50
0.60
0.70
0.80
Br3
_1
Br3
_2
Br3
_3
a
Br3
_3
b
Br3
_3
c
Br3
_4
Br3
_5
Br3
_6
Br3
_7
Br3
_8
a
Br3
_8
b
Br3
_8
c
Br3
_8
d
Br3
_9
Br3
_1
0
Br3
_1
1
Br3
_1
2
Br3
_1
3
Br3
_1
4a
Br3
_1
4b
Br3
_1
4c
Br3
_1
4d
Br3
_1
5
Br3
_1
6
Br3
_1
7
Br3
_1
8
Br3
_1
9
Br3
_2
0
Br3
_2
1
Br3
_2
2
Br3
_2
3
Br3
_2
4
Br3
_2
5
Br3
_2
6
Br3
_2
7
Thre
e-sp
an
Three Span Bridges

24
Figure 25. Moment ratios for rating and posting husbandry vehicles for four-span bridges
Unlike with the AV vehicles, the rating and posting vehicles have moment ratios significantly
less than one. This indicates that current vehicles used to determine bridge ratings and postings
do not always capture the effects of implements of husbandry (when neglecting differences in
distribution factor and/or dynamic impact factor).
Maximum
HS20/Husbandry
Maximum Type
4/Husbandry Maximum
SU4/Husbandry
Maximum
SU5/Husbandry
Maximum
SU6/Husbandry
Maximum
SU7/Husbandry Maximum
NRL6/Husbandry Four-span
0.00
0.10
0.20
0.30
0.40
0.50
0.60
0.70
0.80
Br4
_1
Br4
_3
a
Br4
_4
a
Br4
_5
Br4
_7
Br4
_9
Br4
_1
1
Br4
_1
3
Br4
_1
4b
Br4
_1
6
Br4
_1
8
Br4
_2
0
Br4
_2
2
Br4
_2
4
Br4
_2
6
Br4
_2
8
Br4
_3
0
Br4
_3
2
Br4
_3
4
Br4
_3
6
Br4
_3
8
Mo
men
t R
atio
s
Four Span Bridges

25
3. OPERATING RATINGS, OPERATING RATING RATIOS, AND LEGAL
AGRICULTURAL VEHICLE MODELS
3.1 Operating Ratings and Operating Rating Ratios
Operating level load ratings generally describe the maximum permissible live load which a
bridge may carry. This is known as the bridge’s operating rating (OR) and is determined by
Equation 3. It comes from multiplying the bridge rating factor (RF) by the rating vehicle weight.
For example, the operating rating for an HS20 is given as follows:
ORHS20 = (RFHS20)(WHS20) (3)
Where the RFHS20 is the rating factor for an HS20 truck and WHS20 is the weight of the HS20
truck. The rating factor for a bridge for an HS20 truck is provided in Equation 4:
RFHS20= (φMn-γDLMDL)
(γLL)(MHS20) (4)
Where φMn is the bridge moment capacity at the critical section, γDL is an adjustment factor for
dead load moment capacity, MDL is the bridge dead load moment at the critical section, γLL is
an adjustment factor for live load moment capacity, and MHS20 is the moment produced by the
HS20 truck at the critical section.
Because the HS20 truck is not a real truck that operates on these bridges, it is helpful to know the
operating ratings for other types of vehicles. If it is assumed that the critical section for the
vehicle for which the operating rating is desired occurs at the same location as the HS20, then a
relationship between the operating rating for the HS20 and the operating rating for the vehicle of
interest can be generated, as detailed in Equation 5. With this assumption and the assumption
that the two vehicles have the same live load distribution factor and/or impact factor, the
estimated operating ratings for other vehicles, V, are given as follows:
ORV=(ORHS20)(MHS20)(WV)
(WHS20)(MV) (5)
Where ORV is the operating rating for the vehicle of interest, ORHS20 is the operating rating for
the HS20 truck, MHS20 is the moment at the critical section produced by the HS20 truck, WV is
the weight of the vehicle of interest, WHS20 is the weight of an HS20 truck, and MV is the
moment at the critical section produced by the vehicle of interest. The operating rating for the
HS20 is known for 158 of the 174 bridges from the bridge inventory in Appendix E of Volume
III.
If two operating ratings were calculated for a bridge, the vehicle that produced the lower
operating rating would control the rating and/or posting. One way to compare operating ratings is
to define operating rating ratios (OR ratios):

26
OR Ratio=ORAV
ORRating or Posting Vehicle (6)
In this calculation, the dynamic impact factor and LLDF are assumed to be the same for all
vehicles.
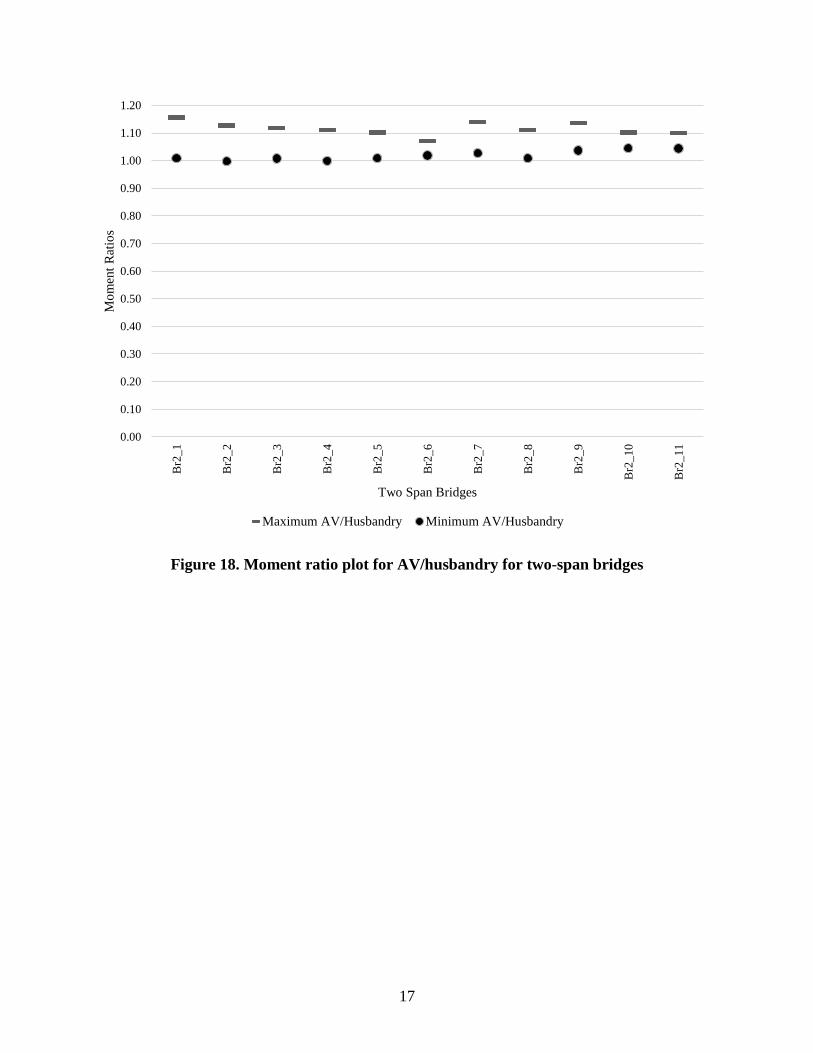
Because the goal is to determine if AV vehicles need to be used for posting, OR ratios of interest
are the operating ratings of the AV3, AV4, and AV5 vehicles divided by the operating ratings of
the rating and posting vehicles. If an OR ratio is less than one, the AV vehicle would control the
rating/posting; likewise, if the OR ratio is greater than one, then the current posting or rating
vehicle would control the rating/posting. Figures 26 through 28 depict the OR ratios for AV3,
AV4, and AV5, respectively, for the one-span bridges.
Figure 26. AV3 ratios for one-span bridges
[SERIES NAME]
AV3/SU4
AV3/SU5 AV3/SU6
AV3/SU7
AV3/NRL6
AV3/NRL14
AV3/TYPE 4
0.00
0.20
0.40
0.60
0.80
1.00
1.20
1.40
Br1
_1
aB
r1_2
Br1
_4
Br1
_5
bB
r1_7
aB
r1_7
cB
r1_7
eB
r1_7
gB
r1_7
iB
r1_7
kB
r1_7
mB
r1_8
aB
r1_8
cB
r1_1
0a
Br1
_1
0c
Br1
_1
2B
r1_1
3b
Br1
_1
4a
Br1
_1
5B
r1_1
6b
Br1
_1
6d
Br1
_1
7a
Br1
_1
7c
Br1
_1
8b
Br1
_2
0B
r1_2
2a
Br1
_2
3a
Br1
_2
3c
Br1
_2
5B
r1_2
8a
Br1
_2
9B
r1_3
0b
Br1
_3
2a
Br1
_3
3B
r1_3
4b
Br1
_3
4d
Br1
_3
5B
r1_3
6b
Br1
_3
6d
Br1
_3
8
OR
Rat
io
One-Span Bridges

27
Figure 27. AV4 ratios for one-span bridges
AV4/HS20
AV4/SU4 AV4/SU5 AV4/SU6
AV4/SU7
AV4/NRL6
AV4/NRL14
AV4/TYPE 4
0.00
0.20
0.40
0.60
0.80
1.00
1.20
1.40
1.60
Br1
_1
a
Br1
_2
Br1
_4
Br1
_5
b
Br1
_7
a
Br1
_7
c
Br1
_7
e
Br1
_7
g
Br1
_7
i
Br1
_7
k
Br1
_7
m
Br1
_8
a
Br1
_8
c
Br1
_1
0a
Br1
_1
0c
Br1
_1
2
Br1
_1
3b
Br1
_1
4a
Br1
_1
5
Br1
_1
6b
Br1
_1
6d
Br1
_1
7a
Br1
_1
7c
Br1
_1
8b
Br1
_2
0
Br1
_2
2a
Br1
_2
3a
Br1
_2
3c
Br1
_2
5
Br1
_2
8a
Br1
_2
9
Br1
_3
0b
Br1
_3
2a
Br1
_3
3
Br1
_3
4b
Br1
_3
4d
Br1
_3
5
Br1
_3
6b
Br1
_3
6d
Br1
_3
8
OR
Rat
io
One-Span Bridges

28
Figure 28. AV5 ratios for one-span bridges
For all one-span bridges, several of the AV ratios are less than one; however, for those ratios that
are less than one, AV3 is the minimum. For example AV3/HS20, AV4/HS20, and AV5/HS20
are all less than 1 for bridge Br1_12 (0.74, 0.88, and 0.92, respectively), but the AV3 ratio is the
smallest; therefore, AV3 would control the rating for this bridge. Although HS20 is a rating
vehicle, the same explanation holds true for posting vehicles (SU4, SU5, SU6, SU7, and Type 4)
as well; however, rather than having a value less than one controlling the rating, a value less than
one would instead indicate that the AV3 controls the bridge posting, if the bridge needs to be
posted for all these vehicles (i.e., all AVs and all rating and posting vehicles). With regard to
posting for this bridge, the OR ratios of AV3/SU4, AV4/SU4, and AV5/SU4 are generally
greater than one, so none of the AV vehicles would control the posting (if this bridge has been
posted for SU4). For two-span and three-span bridges (Figures 29 through 31 and Figures 32
through 34, respectively), where this phenomenon occurs, the result is the same as with the one-
span bridges; that is, the AV3 controls the posting or rating over AV4 and AV5.
AV5/HS20
AV5/SU4 AV5/SU5 AV5/SU6
AV5/SU7
AV5/NRL6
AV5/NRL14
ONE-SPAN
0.00
0.20
0.40
0.60
0.80
1.00
1.20
1.40
1.60
Br1
_1
a
Br1
_2
Br1
_4
Br1
_5
b
Br1
_7
a
Br1
_7
c
Br1
_7
e
Br1
_7
g
Br1
_7
i
Br1
_7
k
Br1
_7
m
Br1
_8
a
Br1
_8
c
Br1
_1
0a
Br1
_1
0c
Br1
_1
2
Br1
_1
3b
Br1
_1
4a
Br1
_1
5
Br1
_1
6b
Br1
_1
6d
Br1
_1
7a
Br1
_1
7c
Br1
_1
8b
Br1
_2
0
Br1
_2
2a
Br1
_2
3a
Br1
_2
3c
Br1
_2
5
Br1
_2
8a
Br1
_2
9
Br1
_3
0b
Br1
_3
2a
Br1
_3
3
Br1
_3
4b
Br1
_3
4d
Br1
_3
5
Br1
_3
6b
Br1
_3
6d
Br1
_3
8
OR
Rat
io
One-Span Bridges
29
Figure 29. AV3 ratios for two-span bridges
AV3/HS20
AV3/SU4 AV3/SU5 AV3/SU6
AV3/SU7
AV3/NRL6
AV3/NRL14
AV3/TYPE 4
0.00
0.20
0.40
0.60
0.80
1.00
1.20
Br2
_1
Br2
_2
Br2
_3
Br2
_4
Br2
_7
Br2
_1
0
Br2
_1
1
OR
Rat
io
Two-Span Bridges

30
Figure 30. AV4 ratios for two-span bridges
AV4/HS20
AV4/SU4 AV4/SU5
AV4/SU6 AV4/SU7
AV4/NRL6
AV4/NRL14
AV4/TYPE 4
0.00
0.20
0.40
0.60
0.80
1.00
1.20
1.40
Br2
_1
Br2
_2
Br2
_3
Br2
_4
Br2
_7
Br2
_1
0
Br2
_1
1
OR
Rat
io
Two-Span Bridges

31
Figure 31. AV5 ratios for two-span bridges
AV5/HS20
AV5/SU4
AV5/SU5 AV5/SU6
AV5/SU7
AV5/NRL6
AV5/NRL14
AV5/TYPE 4
0.00
0.20
0.40
0.60
0.80
1.00
1.20
1.40
1.60
1.80
2.00
Br2
_1
Br2
_2
Br2
_3
Br2
_4
Br2
_7
Br2
_1
0
Br2
_1
1
OR
Rat
io
Two-Span Bridges

32
Figure 32. AV3 ratios for three-span bridges
AV3/HS20
AV3/SU4 AV3/SU5 AV3/SU6
AV3/SU7
AV3/NRL6
AV3/NRL14
THREE-SPAN
0.00
0.20
0.40
0.60
0.80
1.00
1.20
1.40
Br3
_2
Br3
_3a
Br3
_3b
Br3
_3c
Br3
_4
Br3
_5
Br3
_6
Br3
_7
Br3
_8a
Br3
_8b
Br3
_8c
Br3
_8d
Br3
_9
Br3
_10
Br3
_11
Br3
_12
Br3
_13
Br3
_14
a
Br3
_14
b
Br3
_14
c
Br3
_14
d
Br3
_15
Br3
_18
Br3
_19
Br3
_20
Br3
_21
Br3
_22
Br3
_24
Br3
_25
Br3
_27
OR
Rat
io
Three-Span Bridges

33
Figure 33. AV4 ratios for three-span bridges
AV4/HS20
AV4/SU4 AV4/SU5 AV4/SU6
AV4/SU7
AV4/NRL6
AV4/NRL14
AV4/TYPE 4
0.00
0.20
0.40
0.60
0.80
1.00
1.20
1.40
1.60
Br3
_2
Br3
_3
a
Br3
_3
b
Br3
_3
c
Br3
_4
Br3
_5
Br3
_6
Br3
_7
Br3
_8
a
Br3
_8
b
Br3
_8
c
Br3
_8
d
Br3
_9
Br3
_1
0
Br3
_1
1
Br3
_1
2
Br3
_1
3
Br3
_1
4a
Br3
_1
4b
Br3
_1
4c
Br3
_1
4d
Br3
_1
5
Br3
_1
8
Br3
_1
9
Br3
_2
0
Br3
_2
1
Br3
_2
2
Br3
_2
4
Br3
_2
5
Br3
_2
7
OR
Rat
io
Three-Span Bridges

34
Figure 34. AV5 ratios for three-span bridges
In several of these cases, the AV3/SU4 OR ratio is less than one and the AV3 vehicle would
control the posting. The AV3 controls the AV rating for the four-span bridges in all but two
instances (Figures 35 through 37).
AV5/HS20
AV5/SU4 AV5/SU5 AV5/SU6
AV5/SU7
AV5/NRL6
AV5/NRL14
AV5/TYPE 4
0.00
0.20
0.40
0.60
0.80
1.00
1.20
1.40
1.60
1.80
Br3
_2
Br3
_3
a
Br3
_3
b
Br3
_3
c
Br3
_4
Br3
_5
Br3
_6
Br3
_7
Br3
_8
a
Br3
_8
b
Br3
_8
c
Br3
_8
d
Br3
_9
Br3
_1
0
Br3
_1
1
Br3
_1
2
Br3
_1
3
Br3
_1
4a
Br3
_1
4b
Br3
_1
4c
Br3
_1
4d
Br3
_1
5
Br3
_1
8
Br3
_1
9
Br3
_2
0
Br3
_2
1
Br3
_2
2
Br3
_2
4
Br3
_2
5
Br3
_2
7
OR
Rat
io
Three-Span Bridges

35
Figure 35. AV3 ratios for four-span bridges
AV3/HS20
AV3/SU4 AV3/SU5 AV3/SU6
AV3/SU7
AV3/NRL6
AV3/NRL14
AV3/TYPE 4
0.00
0.20
0.40
0.60
0.80
1.00
1.20
1.40
Br4
_1
Br4
_3
a
Br4
_3
b
Br4
_4
a
Br4
_4
b
Br4
_5
Br4
_6
Br4
_7
Br4
_8
Br4
_9
Br4
_1
0
Br4
_1
1
Br4
_1
2
Br4
_1
3
Br4
_1
4a
Br4
_1
4b
Br4
_1
5
Br4
_1
6
Br4
_1
7
Br4
_1
8
Br4
_1
9
Br4
_2
0
Br4
_2
1
Br4
_2
2
Br4
_2
3
Br4
_2
4
Br4
_2
5
Br4
_2
6
Br4
_2
7
Br4
_2
8
Br4
_2
9
Br4
_3
0
Br4
_3
1
Br4
_3
2
Br4
_3
3
Br4
_3
4
Br4
_3
5
Br4
_3
6
Br4
_3
7
Br4
_3
8
Br4
_3
9
OR
Rat
io
Four-span Bridges

36
Figure 36. AV4 ratios for four-span bridges
AV4/HS20
AV4/SU4 AV4/SU5 AV4/SU6
AV4/SU7 AV4/NRL6 AV4/NRL14
FOUR-SPAN
0.00
0.20
0.40
0.60
0.80
1.00
1.20
1.40
1.60
Br4
_1
Br4
_3
a
Br4
_3
b
Br4
_4
a
Br4
_4
b
Br4
_5
Br4
_6
Br4
_7
Br4
_8
Br4
_9
Br4
_1
0
Br4
_1
1
Br4
_1
2
Br4
_1
3
Br4
_1
4a
Br4
_1
4b
Br4
_1
5
Br4
_1
6
Br4
_1
7
Br4
_1
8
Br4
_1
9
Br4
_2
0
Br4
_2
1
Br4
_2
2
Br4
_2
3
Br4
_2
4
Br4
_2
5
Br4
_2
6
Br4
_2
7
Br4
_2
8
Br4
_2
9
Br4
_3
0
Br4
_3
1
Br4
_3
2
Br4
_3
3
Br4
_3
4
Br4
_3
5
Br4
_3
6
Br4
_3
7
Br4
_3
8
Br4
_3
9
OR
Rat
io
Four Span Bridges

37
Figure 37. AV5 ratios for four-span bridges
These two instances include the AV/HS20 for Bridges Br4_4a and Br4_4b. For these two cases,
the minimum AV ratio is controlled by AV5; however, the ratio for all four is equal to 0.99 –
very near one. The SU4 controls the posting for the four-span bridges, except for Br4_1.
Figures 38 through 40 show the AV3, AV4, and AV5 versus the minimum span length for one-,
two-, three-, and four-span bridges combined.
AV5/HS20
AV5/SU4
AV5/SU5 AV5/SU6
AV5/SU7 AV5/NRL6 AV5/NRL14
AV5/TYPE 4
0.00
0.20
0.40
0.60
0.80
1.00
1.20
1.40
1.60
Br4
_1
Br4
_3
a
Br4
_3
b
Br4
_4
a
Br4
_4
b
Br4
_5
Br4
_6
Br4
_7
Br4
_8
Br4
_9
Br4
_1
0
Br4
_1
1
Br4
_1
2
Br4
_1
3
Br4
_1
4a
Br4
_1
4b
Br4
_1
5
Br4
_1
6
Br4
_1
7
Br4
_1
8
Br4
_1
9
Br4
_2
0
Br4
_2
1
Br4
_2
2
Br4
_2
3
Br4
_2
4
Br4
_2
5
Br4
_2
6
Br4
_2
7
Br4
_2
8
Br4
_2
9
Br4
_3
0
Br4
_3
1
Br4
_3
2
Br4
_3
3
Br4
_3
4
Br4
_3
5
Br4
_3
6
Br4
_3
7
Br4
_3
8
Br4
_3
9
OR
Rat
io
Four-span Bridges

38
Figure 38. AV3 ratio versus minimum span length
AV3/HS20
AV3/SU4
AV3/SU5 AV3/SU6
AV3/SU7
AV3/NRL6
AV3/NRL14
AV3/TYPE 4
0.00
0.20
0.40
0.60
0.80
1.00
1.20
1.40
0 20 40 60 80 100 120 140
OR
Rat
io
Minimum Span Length (ft)

39
Figure 39. AV4 ratio versus minimum span length
AV4/HS20
AV4/SU4
AV4/SU5
AV4/SU6
AV4/SU7
AV4/NRL6
AV4/NRL14
AV4/TYPE 4
0.00
0.20
0.40
0.60
0.80
1.00
1.20
1.40
1.60
0 20 40 60 80 100 120 140
OR
Rat
io
Minimum Span Length (ft)
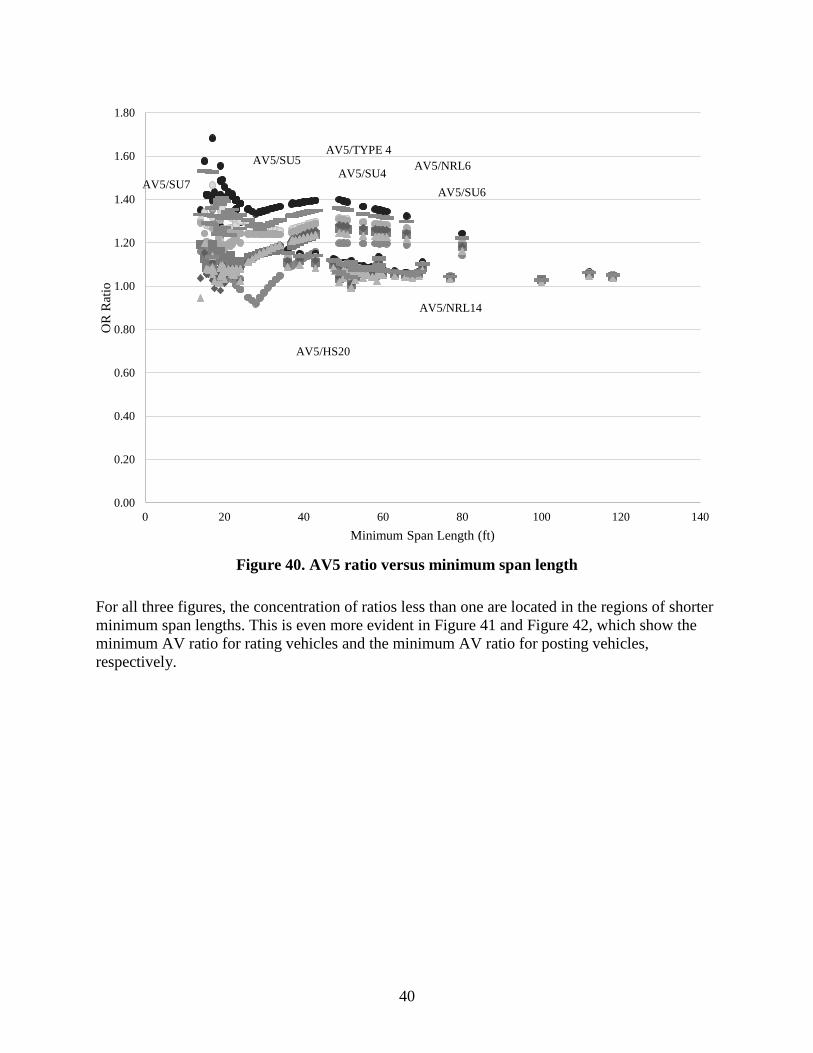
40
Figure 40. AV5 ratio versus minimum span length
For all three figures, the concentration of ratios less than one are located in the regions of shorter
minimum span lengths. This is even more evident in Figure 41 and Figure 42, which show the
minimum AV ratio for rating vehicles and the minimum AV ratio for posting vehicles,
respectively.
AV5/HS20
AV5/SU4 AV5/SU5
AV5/SU6 AV5/SU7
AV5/NRL6
AV5/NRL14
AV5/TYPE 4
0.00
0.20
0.40
0.60
0.80
1.00
1.20
1.40
1.60
1.80
0 20 40 60 80 100 120 140
OR
Rat
io
Minimum Span Length (ft)

41
Figure 41. Minimum AV OR ratio versus minimum span length – rating vehicles
AV/HS20
AV/NRL6 AV/NRL14
0.00
0.20
0.40
0.60
0.80
1.00
1.20
1.40
0 20 40 60 80 100 120 140
Min
imum
OR
Rat
io f
or
Rat
ing V
ehic
les
Minimum Span Length (ft)
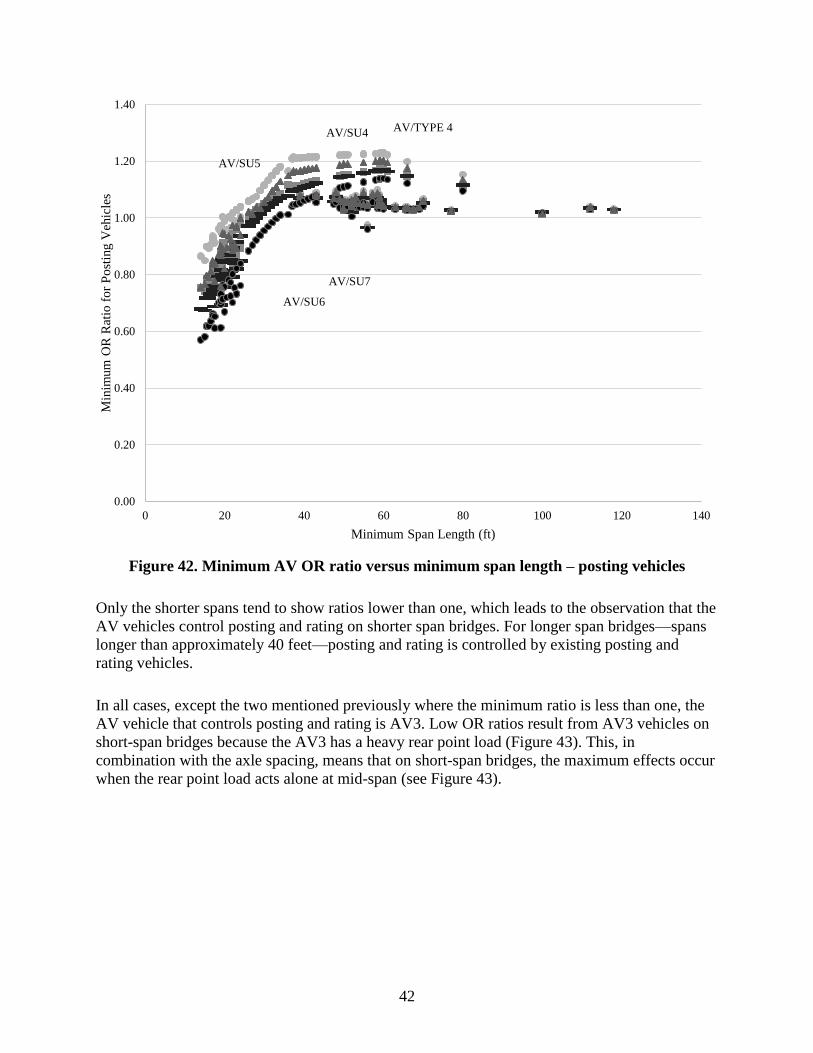
42
Figure 42. Minimum AV OR ratio versus minimum span length – posting vehicles
Only the shorter spans tend to show ratios lower than one, which leads to the observation that the
AV vehicles control posting and rating on shorter span bridges. For longer span bridges—spans
longer than approximately 40 feet—posting and rating is controlled by existing posting and
rating vehicles.
In all cases, except the two mentioned previously where the minimum ratio is less than one, the
AV vehicle that controls posting and rating is AV3. Low OR ratios result from AV3 vehicles on
short-span bridges because the AV3 has a heavy rear point load (Figure 43). This, in
combination with the axle spacing, means that on short-span bridges, the maximum effects occur
when the rear point load acts alone at mid-span (see Figure 43).
AV/SU4
AV/SU5
AV/SU6
AV/SU7
AV/TYPE 4
0.00
0.20
0.40
0.60
0.80
1.00
1.20
1.40
0 20 40 60 80 100 120 140
Min
imum
OR
Rat
io f
or
Po
stin
g V
ehic
les
Minimum Span Length (ft)

43
Figure 43. Effects of short span on OR ratio
3.2 Legal Agricultural Vehicles
National weight standards require that legal loads should meet the following limits: (1) a single-
axle limit of 20k, (2) a tandem axle limit of 34k, (3) a gross-vehicle limit of 80k, and (4) bridge
formula B. These apply to commercial vehicle operations on the Interstate Highway System. For
agricultural vehicles, only a very few states (e.g., Kansas) adopt the standards; instead, most
states enforce limits of (1) gross-vehicle weight (GVW ) ≤ 80k and (2) axle weight ≤ 20k (see
Chapter 4 for more details). By applying these GVW and axle weight limits, possible legal
agricultural vehicle models were created as shown in Figures 44 through 46.
Figure 44. Posting AV vehicles, AV3a and AV3b
Figure 45. Posting AV vehicles, AV4a and AV4b

44
Figure 46. Posting AV vehicles, AV5a, AV5b, and AV5c
In these figures, axle weights of AV3a, AV4a, and AV5a are proportional to those of AV3, AV4,
and AV5, respectively. The OR and OR ratios for Av3a, AV4a, and AV5a are the same as those
of each AV counterpart. Although AVb and AVc are not proportional, they also satisfy legal
truck limits for many states. Table 4 shows the AV, design, rating, and posting vehicle weights.
The legal AVs are potential candidates to be used as posting vehicles.

45
Table 1. Vehicle weights
Vehicle
Weight
(tons)
AV3 62.5
AV3a 16.7
AV3b 30
AV4 70
AV4a 31.1
AV4b 40
AV5 77.5
AV5a 40
AV5b 40
AV5c 40
HS20 36
SU4 27
SU5 31
SU6 34.75
SU7 38.75
NRL6 40
NRL14 40
TYPE 4 27.25

46
4. SUMMARY OF SURVEY RESPONSES
To obtain a better understanding of current state regulations governing legal bridge weight limits,
a survey was sent to each state DOT. The survey addressed the states’ definitions of implements
of husbandry as well as their single-axle and gross-vehicle weight restrictions on bridges. The
questionnaire and detailed responses provided can be found in Volume III – Appendix F. Survey
Responses. The responses were based off of a typical three-axle husbandry vehicle, a diagram of
which is provided in Figure F-1 in Volume III – Appendix F. Figure F-1 is similar to Figure 8
and Table 1.
Twenty-two states participated in the survey: Alabama, Alaska, Arizona, Arkansas, California,
Colorado, Florida, Hawaii, Illinois, Kansas, Minnesota, Missouri, Nevada, New York, Ohio,
Oklahoma, Pennsylvania, South Dakota, Vermont, Virginia, Washington, and West Virginia.
The survey responses show that there is much variation on rules and definitions from state to
state.
The responses regarding the definition of an implement of husbandry seem to follow a general
trend, in that most states regard an “implement of husbandry” as a vehicle used specifically for
agricultural purposes. However, some states do not have a legal definition at all; whereas, others
have criteria as specific as axle weight and tire configuration.
Where husbandry vehicle weight limits are concerned, these results are scattered as well, except
in the case of bridges with posted weight limits; all states except one (Virginia) require
implements of husbandry to comply with posted bridge weight limits. For gross-vehicle weight
on unposted bridges, several states follow the federal bridge formula—with the most common
weight limit being 80,000 pounds—while others consider implements of husbandry exempt from
these limits. Single-axle weight limits typically trend toward 20,000 pounds per axle, although
some states allow husbandry vehicles to be exempt from these regulations.
The survey revealed that there is no consistency among states regarding bridge weight limits for
implements of husbandry. In many cases, implements of husbandry and the generic agricultural
rating vehicles violate current bridge weight limit regulations.

47
5. RATING EXAMPLES
These rating examples have been included to demonstrate rating and posting on shorter span
bridges and longer span bridges. The conclusion from Chapter 3 was developed under the
assumption that distribution factors, dynamic load allowance, and the location of critical sections
were the same for all vehicle types. These examples implement the distribution and impact
factors generated in Volume I for husbandry vehicles as well as the correct live load moments
(generated by the BEC software used to calculate moments in Volume II) for each vehicle type.
Chapter 5 studied only operating ratings for strength requirements–excluding inventory ratings
and service requirements–so only those ratings will be shown here. Distribution factors for
flexure were developed in Volume I. Therefore, these examples focus on rating the bridges for
flexural effects. In addition, because of the limited information provided for each bridge, only
interior girders will be rated. It is unknown whether the deck acts compositely with the girders,
therefore, non-composite section properties are used. Load factor rating method is used for both
examples.
5.1 Example 1. Short-Span Bridge
FHWA No. 93091 (Bridge 1_12 from Volume II; Table 1c – Bridge 3 from Volume I)
Bridge Type: Steel girders-Concrete deck
Year built: 1995
Number of spans: 1
Minimum span length: 28 ft
Skew: 45°
Roadway width: 20.3 ft (multi-lane)
Number of girders and spacing: 9 steel girders @ 2.54 ft on center
Slab: 9.5 in concrete
Fy = 36 ksi (built after 1962 (Iowa DOT Bridge Rating Manual 5.7.1)
f’c = 3.0 ksi (built after 1959) (AASHTO MBE Table 6A.5.2.1-1)
Table 2. Girder geometry for Example 1 short-span bridge
Top
Flange
Depth
(in.)
Top
Flange
Width
(in.)
Web
Depth
(in.)
Web
Width
(in.)
Bottom
Flange
Depth
(in.)
Bottom
Flange
Width
(in.)
0.455 6.745 13.98 0.285 0.455 6.745
5.1.1 Load Factor Rating
Rating factor and operating rating 5equations can be found in Volume II, Chapter 4. Equation 3
refers to operating ratings, while Equation 4 calculates rating factors.

48
5.1.2 Interior Girder Non-Composite Moment Capacity
Non-composite section properties:
ȳ = 7.45 in from bottom of bottom flange
Ix = 385 in4
Sx = 51.7 in3
Kg = 9[385 in4 + ((2)(0.455 in x 6.745 in)+(0.285 in x 13.98 in))(7.45 in+(9.5 in/2))2]
Kg = 17,021 in4
Mn = My = FyS = (36 ksi)(51.7 in3)/12 in/ft = 155.1 ft-kips
5.1.3 Moments in Interior Girder
Dead load:
Wslab = (9.5 in/12 in/ft)(2.54 ft)(0.150 kcf) = 0.30 kips/ft
Wgirder = (1.06)[(13.98 in)(0.285 in)+(2)(0.455 in)(6.745 in)]/144 in2/ft2 (0.490 kcf) = 0.04
kips/ft - includes additional 6% weight for connections
Wtotal = 0.30 kips/ft + 0.04 kips/ft = 0.34 kips/ft
MDL = (0.34 kips/ft)(28 ft)2/8 = 33.1 ft-kips
Live load (using BEC software):
MHS20 = moment from HS20 truck = 252 ft-kips
MSU7 = moment from SU7 vehicle = 302 ft-kips
MAV3 = moment from AV3 vehicle = 525 ft-kips (because this is a short-span bridge, maximum
effects occur when the rear 75 kip axle acts alone at mid-span)
Distribution factor:
DFHS20 = DFSU7 = S/11
(AASHTO standard specifications Table 3.23.1. Note that the values presented in this table refer
to a single wheel line; to get a distribution per axle, multiple this value by 1/2.)
DFHS20 = DFSU7 = 2.54 ft/11 = 0.231
DFAV3 = (S
29.2)0.41
(S
L)0.12
(Kg
12Lts3 )
-0.01
(Volume I, Section 4.3.1.1.2, Equation 21)
DFAV3 = (2.54
29.2)0.41
(2.54
28)0.12
(17,021
12(28)(9.5)3 )-0.01
= 0.283

49
These values correspond to the values shown in Figure 25, Volume 1. This bridge is similar to
Bridge 4 in the figure.
The skew correction factor will be conservatively taken as 1 for all vehicles (Section 4.3.1.3,
Volume I).
The AV3 vehicle was not developed with the notion of changing gauge width, but rather, only
with the idea of changing axle spacing and axle weights. Because of this, the distribution factor
developed for the 121 husbandry vehicles will be used in place of the distribution factor for
varying gauge width.
5.1.4 Dynamic Load Allowance, IM
IMHS20 = IMSU7 = 50/(L + 125) ≤ 0.3 (AASHTO Standard Specifications Equation 3-1)
IMHS20 = IMSU7 = 50/(28 + 125) = 0.327 > 0.3, therefore, IM = 0.3
IMAV3 = 100/(L + 125) ≤ 0.6 (Section 4.2, Volume I)
IMAV3 = 100/(28 + 125) = 0.654 < 0.6, therefore, IM = 0.6
5.1.5 Live Load Plus Impact
MLL+IM = (M)(DF)(1 + IM)
MLL+IM_HS20 = (252 ft-kips)(0.231)(1+0.3) = 75.7 ft-kips
MLL+IM_SU7 = (302 ft-kips)(0.231)(1+0.3) = 90.7 ft-kips
MLL+IM_AV3 = (525 ft-kips)(0.283)(1+0.6) = 237.7 ft-kips
5.1.6 Rating Factors
Reduction factors, φ = 1.0 and γLL = γDL = 1.3
RFHS20 = 155.1 𝑓𝑡−𝑘𝑖𝑝−1.3(33.1 𝑓𝑡−𝑘𝑖𝑝)
1.3(75.7 𝑓𝑡−𝑘𝑖𝑝) = 1.14
RFSU7 = 155.1 𝑓𝑡−𝑘𝑖𝑝−1.3(33.1 𝑓𝑡−𝑘𝑖𝑝)
1.3(90.7 𝑓𝑡−𝑘𝑖𝑝) = 0.95
RFAV3 = 155.1 𝑓𝑡−𝑘𝑖𝑝−1.3(33.1 𝑓𝑡−𝑘𝑖𝑝)
1.3(237.7 𝑓𝑡−𝑘𝑖𝑝) = 0.36
5.1.7 Operating Ratings
WHS20 = 36 tons
WSU7 = 38.75 tons
WAV3 = 62.5 tons
ORHS20 = (1.14)(36 tons) = 41.0 tons

50
ORSU7 = (0.95)(38.75 tons) = 36.8 tons
ORAV3 = (0.36)(62.5 tons) = 22.5 tons
On this shorter span bridge, AV3 controls both rating and posting vehicles. For states that have
no weight limits for farm vehicles, a potential sign would look similar to the mock-up in Figure
47.
Figure 47. Posting sign for a shorter bridge
For states that have the total weight and axle weight limits enforced for farm vehicles, AV3a is a
possible posting vehicle. As the OR for AV3a is higher than the weight of the vehicle, which is
16.7 Tons, the bridge does not need to be posted for AV3a.
36 T
FARM
VEHICLES
22 T

51
5.2 Example 2. Long-Span Bridge
FHWA No. 60660 (Bridge 1_32b from Volume II; Table 1b – Bridge 21 from Volume I)
Bridge Type: Steel girder-Concrete deck
Year built: 1956
Number of spans: 1
Minimum span length: 55 ft
Skew: 0°
Roadway width: 20.0 ft (multi-lane)
Number of girders and spacing: 3 steel girders @ 9.5 ft on center
Slab: 7 in concrete
Fy = 33 ksi (built between 1936 and 1962) (Iowa DOT Bridge Rating Manual 5.7.1)
f’c = 2.5 ksi (built before 1959) (AASHTO MBE Table 6A.5.2.1-1)
Table 3. Girder geometry for the example long-span bridge
Top
Flange
Depth
(in.)
Top
Flange
Width
(in.)
Web
Depth
(in.)
Web
Width
(in.)
Bottom
Flange
Depth
(in.)
Bottom
Flange
Width
(in.)
0.688 10 28.63 0.548 0.688 10
5.2.1 Load Factor Rating
Rating factor and operating rating equations can be found in Volume II, Chapter 4. Equation 3
refers to operating ratings, while Equation 4 calculates rating factors.
5.2.2 Interior Girder Non-Composite Moment Capacity
Non-composite section properties:
ȳ = 15.00 in from bottom of bottom flange
Ix = 4,029 in4
Sx = 268.6 in3
Kg = 10[4,029 in4 + ((2)(0.688 in x10 in)+(0.548 in x28.63 in))(15.00 in +(7 in/2))2]
Kg = 141,113 in4
Mn = My = FyS = (33 ksi)(268.6 in3)/12 in/ft = 738.7 ft-kips
52
5.2.3 Moments in Interior Girder
Dead Load:
Wslab = (7 in/12 in/ft)(9.5)(0.150 kcf) = 0.83 kips/ft
Wgirder = (1.06)[(28.63 in)(0.548 in)+(2)(0.688 in)(10 in)]/144 in2/ft2 (0.490 kcf) = 0.11
kips/ft-includes additional 6% weight for connections
Wtotal = 0.83 kips/ft + 0.11 kips/ft = 0.94 kips/ft
MDL = (0.94 kips/ft)(55 ft)2/8 = 354.5 ft-kips
Live Load (using BEC software):
MHS20 = moment from HS20 truck = 710 ft-kips
MType_4 = moment from SU7 vehicle = 599 ft-kips
MAV3 = moment from AV3 vehicle = 1150 ft-kips
Distribution Factor, DF:
DFHS20 = DFType_4 = S/11
(AASHTO Standard Specifications Table 3.23.1; note that the values presented in this table refer
to a single wheel line; to get a distribution per axle, multiple this value by ½.)
DFHS20 = 𝐷𝐹𝑇𝑦𝑝𝑒_4 = 9.5 𝑓𝑡/11 = 0.864
DFAV3 = (S
29.2)0.41
(S
L)0.12
(Kg
12Lts3 )
-0.01
(Volume I, Section 4.3.1.1.2, Equation 21)
DFAV3 = (9.5
29.2)0.41
(9.5
55)0.12
(141,113
12(55)(7)3 )-0.01
= 0.514
These values correspond to the values shown in Figure 25, Volume 1, Bridge 21.
The AV3 vehicle was not developed with the idea of varying gauge width, but rather, only on
varying axle spacing and axle weights. Because of this, the distribution factor developed for the
121 husbandry vehicles will be used in place of the distribution factor for varying gauge width.
5.2.4 Dynamic Load Allowance, IM:
IMHS20 = IMType_4 = 50/(L + 125) ≤ 0.3 (AASHTO Standard Specifications Equation 3-1)
IMHS20 = IMType_4 = 50/(55 + 125) = 0.28 < 0.3, therefore, IM = 0.28
IMAV3 = 100/(L + 125) ≤ 0.6 (Section 4.2, Volume I)
IMAV3 = 100/(55 + 125) = 0.56 < 0.6, therefore, IM = 0.56

53
5.2.5 Live Load Plus Impact
MLL+IM = (M)(DF)(1 + IM)
MLL+IM_HS20 = (710 ft-kips)(0.864)(1+0.28) = 785.2 ft-kips
MLL+IM_Type_4 = (599 ft-kips)(0.864)(1+0.28) = 662.8 ft-kips
MLL+IM_AV3 = (1150 ft-kips)(0.514)(1+0.56) = 922.1 ft-kips
5.2.6 Rating Factors
Reduction factors, φ = 1.0 and γLL = γDL = 1.3
RFHS20 = 738.7 𝑓𝑡−𝑘𝑖𝑝−1.3(354.5 𝑓𝑡−𝑘𝑖𝑝)
1.3(785.2 𝑓𝑡−𝑘𝑖𝑝) = 0.27
RFType_4 = 738.7 𝑓𝑡−𝑘𝑖𝑝−1.3(354.5 𝑓𝑡−𝑘𝑖𝑝)
1.3(662.8 𝑓𝑡−𝑘𝑖𝑝) = 0.32
RFAV3 = 738.7 𝑓𝑡−𝑘𝑖𝑝−1.3(354.5 𝑓𝑡−𝑘𝑖𝑝)
1.3(922.1 𝑓𝑡−𝑘𝑖𝑝) = 0.23
5.2.7 Operating Rating
WHS20 = 36 tons
WType_4 = 27.25 tons
WAV3 = 62.5 tons
ORHS20 = (0.27)(36 tons) = 9.7 tons
ORType_4 = (0.32)(27.25 tons) = 8.7 tons
ORAV3 = (0.23)(62.5 tons) = 14.4 tons
On this longer span bridge, AV3 will not control over either rating or posting vehicles. A
potential sign would look as shown in Figure 48.

54
Figure 48. Posting sign for a longer bridge
Notice that the bridge will need to be posted no matter whether AV3 or AV3a is used as the
posting vehicle.
8 T
FARM
VEHICLES
14 T

55
6. POSTING SIGNAGE
According to the AASHTO Manual for Bridge Evaluation section 6A.8, “When the maximum
legal load under state law exceeds the safe load capacity of a bridge, restrictive load posting shall
be required” and “the posting signs shall conform to the Manual on Uniform Traffic Control
Devices (MUTCD).” It is also stated in the AASHTO MBE that “in some cases, lower speed
limits will reduce impact loads to the extent that lowering the weight limit may not be required”.
Following AASHTO MBE and MUTCD, possible speed limit and load posting signs for
agriculture vehicles are presented.
6.1 MUTCD Requirement for Post Signs
Five posting sign options are provided in the MUTCD as shown in Figure 49.
Figure 49. Bridge posting signage options provided by the MUTCD
The options are as follows:
1. “The Weight Limit (R12-1, Figure 49a) sign carrying the legend WEIGHT LIMIT XX
TONS may be used to indicate vehicle weight restrictions including load”
2. “Where the restriction applies to axle weight rather than gross load, the legend may be AXLE

56
WEIGHT LIMIT XX TONS or AXLE WEIGHT LIMIT XX LBS” (R12-2, Figure 49b)
3. “To restrict trucks of certain sizes by reference to empty weight in residential areas, the
legend may be NO TRUCKS OVER XX TONS EMPTY WT or NO TRUCKS OVER XX
LBS EMPTY WT” (R12-3, Figure 49c)
4. “In areas where multiple regulations of the type described in Paragraphs 1 through 3 are
applicable, a sign combining the necessary messages on a single sign may be used, such as
WEIGHT LIMIT XX TONS PER AXLE, XX TONS GROSS” (R12-4, Figure 49d)
“Posting of specific load limits may be accomplished by use of the Weight Limit symbol sign
(R12-5, Figure 49e). A sign containing the legend WEIGHT LIMIT on the top two lines, and
showing three different truck symbols and their respective weight limits for which restrictions
apply may be used, with the weight limits displayed to the right of each symbol as XX T. A
bottom line legend stating GROSS WT may be included if needed for enforcement purposes.”
6.2 Posting or Speed Limit Signs for Agricultural (Farm) Vehicles
Possible legal agricultural vehicle models are created and shown in Chapter 3, Figures 41 to 43.
They can potentially be used as posting vehicles. When the load rating of a bridge is lower than
the weight of the legal agricultural vehicle, according to AASHTO MBE, load restrictions or
speed restrictions should be applied. To avoid overly or less conservative postings and to avoid
confusion, it is recommended that a separate posting (or speed limit) sign be used for agricultural
vehicles. An example of a speed limit sign for farm vehicles is shown in Figure 50.
Figure 50. Farm vehicle speed limit sign
When speed limit is not sufficient to avoid the load posting of a bridge, a posting sign will be
needed. Multiple possible posting signs are depicted in Figure 51.
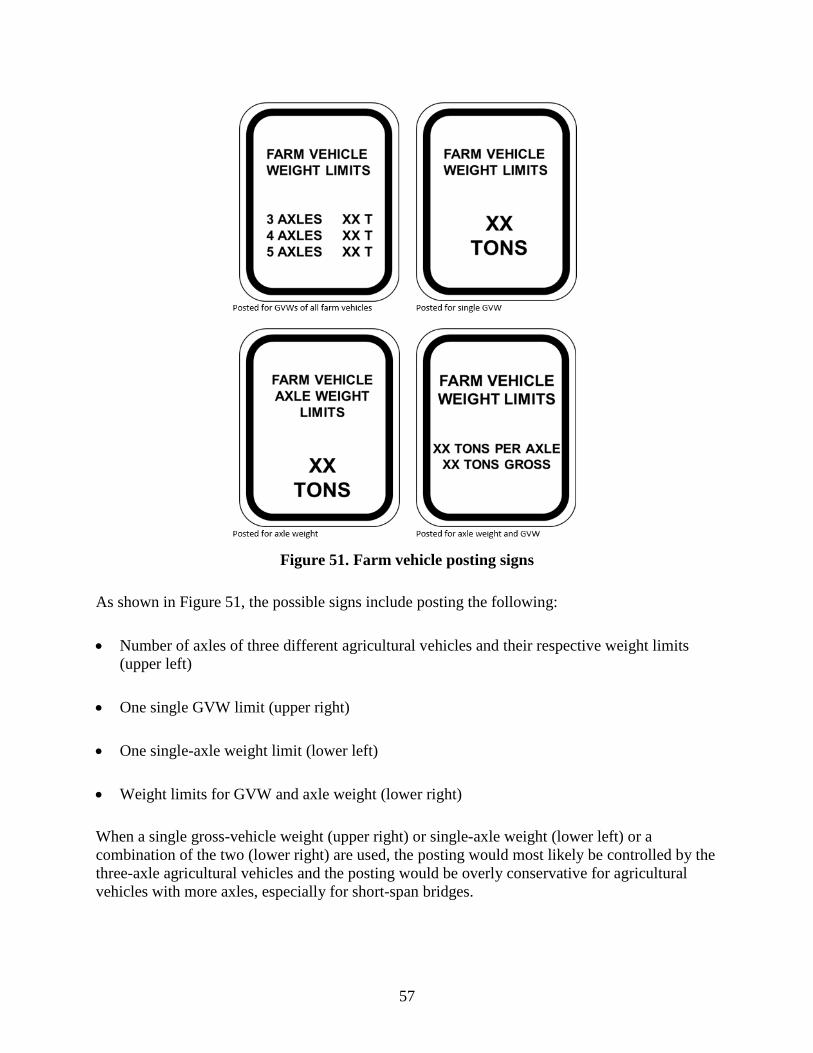
57
Figure 51. Farm vehicle posting signs
As shown in Figure 51, the possible signs include posting the following:
Number of axles of three different agricultural vehicles and their respective weight limits
(upper left)
One single GVW limit (upper right)
One single-axle weight limit (lower left)
Weight limits for GVW and axle weight (lower right)
When a single gross-vehicle weight (upper right) or single-axle weight (lower left) or a
combination of the two (lower right) are used, the posting would most likely be controlled by the
three-axle agricultural vehicles and the posting would be overly conservative for agricultural
vehicles with more axles, especially for short-span bridges.

58
7. SUMMARY AND CONCLUSIONS FOR RATING AND POSTING
RECOMMENDATIONS (VOLUME II)
The objective of this study was to develop guidance for engineers to help them understand how
implements of husbandry loads are resisted by traditional bridges—with a specific focus on
bridges commonly found on the secondary road system—to provide recommendations for
accurately analyzing bridges for their loading effects and to make recommendations for the
rating and posting of such bridges.
To achieve this objective, as Volume I focused on, the lateral distribution of live load and
dynamic impact effects for different types of farm vehicles on three general bridge types were
investigated by using load testing and analytical modeling. Volume II, which is presented here,
concentrated on providing recommendations for bridge rating tools.
This work was completed by conducting an analytical study on the effects produced by 121
husbandry vehicles on 174 bridges. From these studies, generic agricultural vehicle models (i.e.,
AV3, AV4, and AV5) were created. Ratings and codified-type parameters may be generated
from these generic vehicles, which will ultimately lead to recommendations on the analysis,
rating, and posting of bridges for implements of husbandry.
With the generic agricultural rating vehicles, moment ratios were calculated by comparing the
moments of the generic, rating, and posting vehicles to the moments of the 121 husbandry
vehicles. These ratios showed that current posting and rating vehicles do not always envelop the
effects of the implements of husbandry (i.e., moment ratios were less than 1.0); whereas, the
generic agricultural vehicles AV3, AV4, and AV5 do envelop the husbandry vehicles. As
mentioned before, in moment ratio calculations, the dynamic impact factor and LLDF are taken
as the same for all types of vehicles. In general, the IM of husbandry vehicles is larger than that
of other trucks, while the LLDF is smaller.
After determining that the AV vehicles sufficiently captured the behavior of husbandry vehicles,
studies were carried out to determine how they can be used for bridge rating and posting
practices. This was done through two major efforts: (1) calculating the operating rating ratio
between AVs and rating and posting vehicles and (2) creating legal version agricultural vehicle
models by including the gross-vehicle weight and axle weight limits that have been enforced by
many states.
From the operating ratios (and the assumption that all vehicles had the same distribution and
impact factors), the conclusion was drawn that on short-span bridges (less than approximately 40
ft) AV vehicles—and specifically AV3—might control rating and/or posting. Conversely, on
bridges with spans longer than approximately 40 ft, current rating and posting vehicles would
control the rating and/or posting. By creating legal version agricultural vehicle models, the legal
AVs can be used as potential posting vehicles. It is also worth noting that for some states, the
AV3 vehicle may be appropriate if implements of husbandry are not required to conform to the
Bridge Formula.

59
Following the AASHTO MBE and MUTCD, possible bridge restriction signs, including speed
limit signs and load posting signs, are proposed. Using a separate restriction sign for farm
vehicles is considered to be a practical way to ensure bridge safety while avoiding over-posting
for other types of vehicles when the bridge is subjected to husbandry implement loads.

61
REFERENCES
AASHTO. 2011. Manual for Bridge Evaluation, 2nd Edition, with 2011, 2013, 2014, and 2015
Interim Revisions. American Association of State Highway and Transportation Officials,
Washington, DC.
——. 2010. AASHTO LRFD Bridge Design Specifications. 5th Edition, American Association of
State Highway and Transportation Officials, Washington, DC.
——. 2002. Standard Specifications for Highway Bridges.17th Edition, American Association of
State Highway and Transportation Officials, Washington, DC.
——. 1996. Standard Specifications for Highway Bridges.16th Edition, American Association of
State Highway and Transportation Officials, Washington, DC.
ASCE. 2013. Report Card for America's Infrastructure, Reston, VA.
www.infrastructurereportcard.org/.
Barker, R. M., and J. A. Puckett. 2013. Design of Highway Bridges. 3rd Edition, John Wiley &
Sons, Inc., Hoboken, NJ.
FHWA. 2009. Manual on Uniform Traffic Control Devices, With 2012 Revisions 1 & 2. Federal
Highway Administration, Washington, DC.
HDR. 2013. Iowa DOT Office of Bridges and Structures: Bridge Rating Manual. Iowa
Department of Transportation, Ames, IA.
siims.iowadot.gov/IowaDOT_BridgeRatingManual.pdf.
Iowa DOT. 2013. Attachment E to I.M. 2.120: Iowa Legal Trucks Diagrams. July 18, 2013. Iowa
Department of Transportation, Office of Local Systems, Ames, IA.
www.iowadot.gov/local_systems/publications/im/2120e.pdf.
Kulicki, J. M. and D. R. Mertz. 1991. A New Live Load Model for Bridge Design. Proceedings
of 8th Annual International Bridge Conference, June 10–12. Pittsburgh, PA.
Munkelt, G. 2010. HL93 Truck Loads vs. HS20 Truck Loads. Precast Inc. Magazine, July 28,
2010. precast.org/2010/07/hl93-truck-loads-vs-hs20-truck-loads/.
Orr, C. 2012. Rural Areas on Road to Infrastucture Crisis. Stateline Midwest, Vol. 21, No. 1,
p. 7. www.csgmidwest.org/policyresearch/documents/ruralroads.pdf.
Phares, B. M., T. J. Wipf, and H. Ceylan. 2005. Impacts of Overweight Implements of Husbandry
on Minnesota Roads and Bridges. Minnesota Department of Transportation, St. Paul,
MN.
Seo, J., B. Phares, and T. Wipf. 2013. Lateral Live-Load Distribution Characteristics of Simply
Supported Steel Girder Bridges Loaded with Implements of Husbandry. Journal of
Bridge Engineering,Vol. 19, No. 4.
Sivakumar, B., F. Moses, G. Fu, and M. Ghosn. 2007. NCHRP REPORT 575: Legal Truck
Loads and AASHTO Legal Loads for Posting. National Cooperative Highway Research
Program, Washington, DC.
Wood, D. L. and T. J. Wipf. 1999. Heavy Agricultural Loads on Pavements and Bridges.
Engineering Research Institute, Iowa State University, Ames, IA.


![Implements of Husbandry - ilfb.orgImplements of husbandry are generally not subject to the axle weight limits that apply to trucks and trailers. [15-101(b)] Despite this exemption,](https://img.dokumen.tips/doc/110x75/5f112775cf66a20d203faaa7/implements-of-husbandry-ilfb-implements-of-husbandry-are-generally-not-subject.jpg)