Embed Size (px)
Citation preview

Ss
ND
a
ARR3A
KTBMTR
1
Mtawocebwapfpraeccdii
0d
Materials Science and Engineering A 504 (2009) 24–35
Contents lists available at ScienceDirect
Materials Science and Engineering A
journa l homepage: www.e lsev ier .com/ locate /msea
tudy of texture evolution in metastable �-Ti alloy as a function oftrain path and its effect on � transformation texture
ilesh P. Gurao, Ashkar Ali A, Satyam Suwas ∗
epartment of Materials Engineering, Indian Institute of Science, Bangalore 560012, India
r t i c l e i n f o
rticle history:eceived 2 July 2008eceived in revised form0 September 2008
a b s t r a c t
Texture evolution in a low cost beta titanium alloy was studied for different modes of rolling and heattreatments. The alloy was cold rolled by unidirectional and multi-step cross rolling. The cold rolled mate-rial was either aged directly or recrystallized and then aged. The evolution of texture in � and � phaseswere studied. The rolling texture of � phase that is characterized by the gamma fiber is stronger for MSCR
ccepted 21 November 2008
eywords:extureeta titanium alloysode of rolling
than UDR; while the trend is reversed on recrystallization. The mode of rolling affects � transformationtexture on aging with smaller � lath size and stronger � texture in UDR than in MSCR. The defect structurein � phase influences the evolution of � texture on aging. A stronger defect structure in � phase leads tovariant selection with the rolled samples showing fewer variants than the recrystallized samples.
© 2008 Elsevier B.V. All rights reserved.
ransformation textureecrystallization texture. Introduction
It is well known that alloying titanium with elements like Nb,o, Ta, V, Hf etc leads to stabilizing the � phase at room tempera-
ure, and hence the so-called metastable �-Ti alloy. Upto a certainmount of � stabilizer content, the � phase remains metastable,hich upon aging at a suitable temperature leads to the formation
f � phase. These metastable �-Ti alloys, characterized by high spe-ific strength, sufficient ductility and fracture toughness along withxcellent corrosion resistance, find extensive use in structural andiomedical applications. The most important feature of these alloyshich makes them suitable for various applications is that a bal-
nce of various properties can be achieved by subjecting them toroper thermomechanical treatments. However, these alloys suf-
er from a serious limitation of high cost [1], due to titanium itselflus alloying elements like vanadium to stabilize the � phase atoom temperature that renders them unsuitable for non-aerospacepplications. The full potential of these alloys has not yet beingxploited, particularly in the automobile industry, due to their highost and hence there has been a motivation for developing low
ost � titanium alloys. One such � alloy TIMETAL LCB® has beeneveloped by replacing the costly vanadium with cheap and eas-ly available Fe–Mo and Fe–V masteralloys which are widely usedn steel industry. Processing of metastable �-Ti alloys as needed to
∗ Corresponding author.E-mail address: [email protected] (S. Suwas).
921-5093/$ – see front matter © 2008 Elsevier B.V. All rights reserved.oi:10.1016/j.msea.2008.11.053
fabricate components, involves deformation plus thermal process-ing. Both these processes lead to modification in crystallographictexture.
It is well known that the � phase of metastable �-Ti alloys trans-form to (� + �) structure. During phase transformation from � to �phase, Burger’s orientation relationship [2] is generally followed,
i.e. {0 0 0 1}˛
∥∥∥⟨
1 0 1⟩
ˇand {1 1 2̄ 0}˛
∥∥⟨1 1 1
⟩ˇ
, however due to
symmetry of the crystal, a single � orientation gives rise to 12equivalent � orientations with equal probability [3]. Under cer-tain thermal and thermomechanical treatments, it is possible toget higher probability for certain � orientation, rather than all ori-entations being equally probable. This phenomenon is known asVariant selection. This effect which comes into play at the crys-tallographic scale, also affects the morphology of the transformed� phase. Since texture plays an important role in determiningmechanical properties of HCP structured (�) Ti and Ti alloys dueto the inherent anisotropy of HCP crystal lattice, the knowledge of� to � transformation is essential for processing property optimiza-tion.
A number of comprehensive studies have been carried out onthe evolution of texture during hot deformation or heat treatmentin � phase of (� + �) [4–13] or (�2 + �) [14–18] titanium alloys andthe evolution of corresponding � transformation texture. However,
in (� + �) Ti alloy, the high temperature � phase cannot be retainedat room temperature; therefore, the experimental techniques arenot free from limitations. In the (�2 + �) alloys although, the hightemperature � phase can be retained, there is a limited scopein changing the texture of high temperature � phase. Therefore,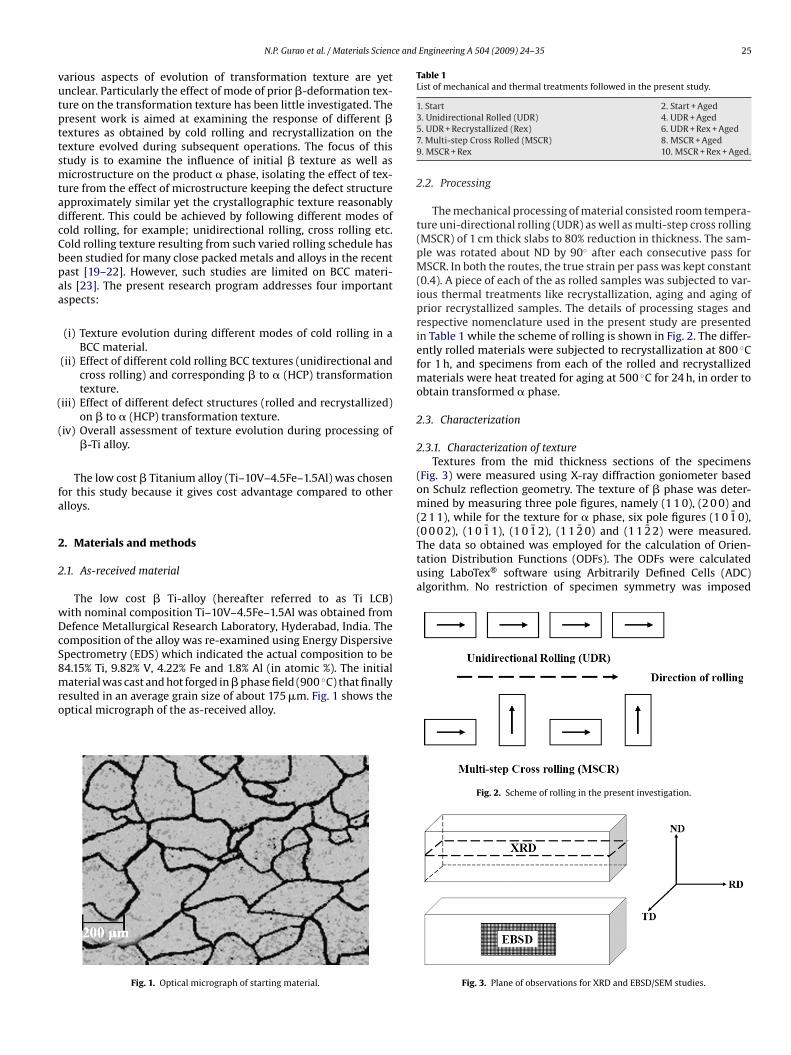
e and Engineering A 504 (2009) 24–35 25
vutpttsmtadcCbpaa
(
(
fa
2
2
wDcS8mro
Table 1List of mechanical and thermal treatments followed in the present study.
1. Start 2. Start + Aged
(0 0 0 2), (1 0 1̄ 1), (1 0 1̄ 2), (1 1 2̄ 0) and (1 1 2̄ 2) were measured.The data so obtained was employed for the calculation of Orien-tation Distribution Functions (ODFs). The ODFs were calculatedusing LaboTex® software using Arbitrarily Defined Cells (ADC)algorithm. No restriction of specimen symmetry was imposed
N.P. Gurao et al. / Materials Scienc
arious aspects of evolution of transformation texture are yetnclear. Particularly the effect of mode of prior �-deformation tex-ure on the transformation texture has been little investigated. Theresent work is aimed at examining the response of different �extures as obtained by cold rolling and recrystallization on theexture evolved during subsequent operations. The focus of thistudy is to examine the influence of initial � texture as well asicrostructure on the product � phase, isolating the effect of tex-
ure from the effect of microstructure keeping the defect structurepproximately similar yet the crystallographic texture reasonablyifferent. This could be achieved by following different modes ofold rolling, for example; unidirectional rolling, cross rolling etc.old rolling texture resulting from such varied rolling schedule haseen studied for many close packed metals and alloys in the recentast [19–22]. However, such studies are limited on BCC materi-ls [23]. The present research program addresses four importantspects:
(i) Texture evolution during different modes of cold rolling in aBCC material.
(ii) Effect of different cold rolling BCC textures (unidirectional andcross rolling) and corresponding � to � (HCP) transformationtexture.
iii) Effect of different defect structures (rolled and recrystallized)on � to � (HCP) transformation texture.
iv) Overall assessment of texture evolution during processing of�-Ti alloy.
The low cost � Titanium alloy (Ti–10V–4.5Fe–1.5Al) was chosenor this study because it gives cost advantage compared to otherlloys.
. Materials and methods
.1. As-received material
The low cost � Ti-alloy (hereafter referred to as Ti LCB)ith nominal composition Ti–10V–4.5Fe–1.5Al was obtained fromefence Metallurgical Research Laboratory, Hyderabad, India. Theomposition of the alloy was re-examined using Energy Dispersivepectrometry (EDS) which indicated the actual composition to be
4.15% Ti, 9.82% V, 4.22% Fe and 1.8% Al (in atomic %). The initialaterial was cast and hot forged in � phase field (900 ◦C) that finallyesulted in an average grain size of about 175 �m. Fig. 1 shows theptical micrograph of the as-received alloy.
Fig. 1. Optical micrograph of starting material.
3. Unidirectional Rolled (UDR) 4. UDR + Aged5. UDR + Recrystallized (Rex) 6. UDR + Rex + Aged7. Multi-step Cross Rolled (MSCR) 8. MSCR + Aged9. MSCR + Rex 10. MSCR + Rex + Aged.
2.2. Processing
The mechanical processing of material consisted room tempera-ture uni-directional rolling (UDR) as well as multi-step cross rolling(MSCR) of 1 cm thick slabs to 80% reduction in thickness. The sam-ple was rotated about ND by 90◦ after each consecutive pass forMSCR. In both the routes, the true strain per pass was kept constant(0.4). A piece of each of the as rolled samples was subjected to var-ious thermal treatments like recrystallization, aging and aging ofprior recrystallized samples. The details of processing stages andrespective nomenclature used in the present study are presentedin Table 1 while the scheme of rolling is shown in Fig. 2. The differ-ently rolled materials were subjected to recrystallization at 800 ◦Cfor 1 h, and specimens from each of the rolled and recrystallizedmaterials were heat treated for aging at 500 ◦C for 24 h, in order toobtain transformed � phase.
2.3. Characterization
2.3.1. Characterization of textureTextures from the mid thickness sections of the specimens
(Fig. 3) were measured using X-ray diffraction goniometer basedon Schulz reflection geometry. The texture of � phase was deter-mined by measuring three pole figures, namely (1 1 0), (2 0 0) and(2 1 1), while for the texture for � phase, six pole figures (1 0 1̄ 0),
Fig. 2. Scheme of rolling in the present investigation.
Fig. 3. Plane of observations for XRD and EBSD/SEM studies.
2 e and
wb
2
evaoaeAtwsw
MMDsessocl
3
3
33(s⟨
(
3ir
6 N.P. Gurao et al. / Materials Scienc
hile calculating the ODFs. The strength of texture was estimatedy using Texture Index obtained from Labotex software.
.3.2. Microstructural characterizationMicrostructures were characterized by optical and scanning
lectron microscopy. The samples were prepared following con-entional metallographic methods followed by etching for opticalnd scanning electron microscopy. Microstructures were recordedn transverse plane of the samples using an optical microscopettached with an image analysis system. A few samples were alsoxamined under Scanning Electron Microscope (SEM) JEOL JSM-840. For material with single � phase (starting �, rolled � and recrys-
allized �), grain boundary etchant (2% HF, 5% H2O2 and distilledater) was used for about 30–40 s while for two phase (� + �) aged
amples Kroll’s reagent (2% HF, 4% HNO3 and 94% distilled water)as used for about 5–8 s.
A few samples were subjected to Orientation Imagingicroscopy using a Field Emission Gun Scanning Electronicroscope (FEG-SEM) FEI-SIRION® with Electron BackScatterediffraction EBSD facility. In this case the transverse plane of the
ample (Fig. 3) was electropolished using Struers® standard A3lectrolyte for EBSD analysis. Small regions were analyzed with atep size of 200 nm. It is reported that these alloys may undergotress-induced martensitic transformation as well as formation ofxygen rich � casing is likely during heat treatment; therefore, suffi-ient care was taken so as to remove external mechanically affectedayer in all the specimen preparation.
. Results
.1. Texture
.1.1. Texture of ˇ phase
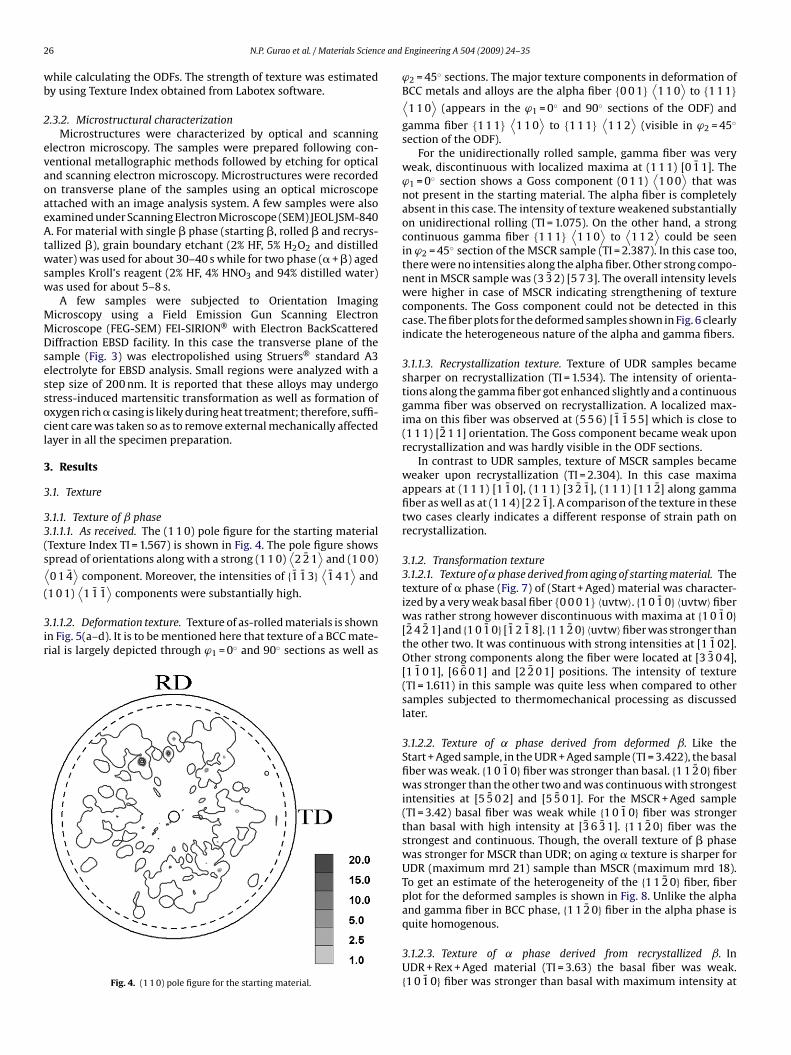
.1.1.1. As received. The (1 1 0) pole figure for the starting materialTexture Index TI = 1.567) is shown in Fig. 4. The pole figure showspread of orientations along with a strong (1 1 0)
⟨2 2̄ 1
⟩and (1 0 0)
0 1 4̄⟩
component. Moreover, the intensities of {1̄ 1̄ 3}⟨
1̄ 4 1⟩
and⟨¯ ¯
⟩
1 0 1) 1 1 1 components were substantially high..1.1.2. Deformation texture. Texture of as-rolled materials is shownn Fig. 5(a–d). It is to be mentioned here that texture of a BCC mate-ial is largely depicted through ϕ1 = 0◦ and 90◦ sections as well as
Fig. 4. (1 1 0) pole figure for the starting material.
Engineering A 504 (2009) 24–35
ϕ2 = 45◦ sections. The major texture components in deformation ofBCC metals and alloys are the alpha fiber {0 0 1}
⟨1 1 0
⟩to {1 1 1}⟨
1 1 0⟩
(appears in the ϕ1 = 0◦ and 90◦ sections of the ODF) and
gamma fiber {1 1 1}⟨
1 1 0⟩
to {1 1 1}⟨
1 1 2⟩
(visible in ϕ2 = 45◦
section of the ODF).For the unidirectionally rolled sample, gamma fiber was very
weak, discontinuous with localized maxima at (1 1 1) [0 1̄ 1]. Theϕ1 = 0◦ section shows a Goss component (0 1 1)
⟨1 0 0
⟩that was
not present in the starting material. The alpha fiber is completelyabsent in this case. The intensity of texture weakened substantiallyon unidirectional rolling (TI = 1.075). On the other hand, a strongcontinuous gamma fiber {1 1 1}
⟨1 1 0
⟩to
⟨1 1 2
⟩could be seen
in ϕ2 = 45◦ section of the MSCR sample (TI = 2.387). In this case too,there were no intensities along the alpha fiber. Other strong compo-nent in MSCR sample was (3 3̄ 2) [5 7 3]. The overall intensity levelswere higher in case of MSCR indicating strengthening of texturecomponents. The Goss component could not be detected in thiscase. The fiber plots for the deformed samples shown in Fig. 6 clearlyindicate the heterogeneous nature of the alpha and gamma fibers.
3.1.1.3. Recrystallization texture. Texture of UDR samples becamesharper on recrystallization (TI = 1.534). The intensity of orienta-tions along the gamma fiber got enhanced slightly and a continuousgamma fiber was observed on recrystallization. A localized max-ima on this fiber was observed at (5 5 6) [1̄ 1̄ 5 5] which is close to(1 1 1) [2̄ 1 1] orientation. The Goss component became weak uponrecrystallization and was hardly visible in the ODF sections.
In contrast to UDR samples, texture of MSCR samples becameweaker upon recrystallization (TI = 2.304). In this case maximaappears at (1 1 1) [1 1̄ 0], (1 1 1) [3 2̄ 1̄], (1 1 1) [1 1 2̄] along gammafiber as well as at (1 1 4) [2 2 1̄]. A comparison of the texture in thesetwo cases clearly indicates a different response of strain path onrecrystallization.
3.1.2. Transformation texture3.1.2.1. Texture of ˛ phase derived from aging of starting material. Thetexture of � phase (Fig. 7) of (Start + Aged) material was character-ized by a very weak basal fiber {0 0 0 1} 〈uvtw〉. {1 0 1̄ 0} 〈uvtw〉 fiberwas rather strong however discontinuous with maxima at {1 0 1̄ 0}[2̄ 4 2̄ 1] and {1 0 1̄ 0} [1̄ 2 1̄ 8]. {1 1 2̄ 0} 〈uvtw〉 fiber was stronger thanthe other two. It was continuous with strong intensities at [1 1̄ 02].Other strong components along the fiber were located at [3 3̄ 0 4],[1 1̄ 0 1], [6 6̄ 0 1] and [2 2̄ 0 1] positions. The intensity of texture(TI = 1.611) in this sample was quite less when compared to othersamples subjected to thermomechanical processing as discussedlater.
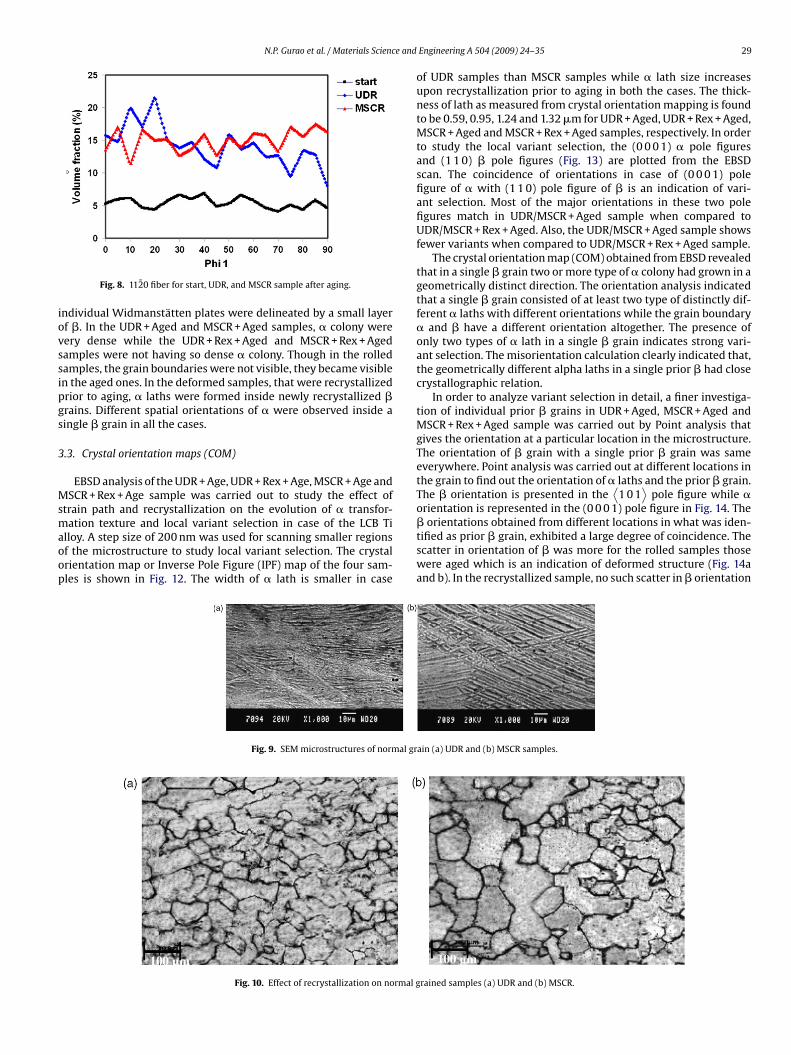
3.1.2.2. Texture of ˛ phase derived from deformed ˇ. Like theStart + Aged sample, in the UDR + Aged sample (TI = 3.422), the basalfiber was weak. {1 0 1̄ 0} fiber was stronger than basal. {1 1 2̄ 0} fiberwas stronger than the other two and was continuous with strongestintensities at [5 5̄ 0 2] and [5 5̄ 0 1]. For the MSCR + Aged sample(TI = 3.42) basal fiber was weak while {1 0 1̄ 0} fiber was strongerthan basal with high intensity at [3̄ 6 3̄ 1]. {1 1 2̄ 0} fiber was thestrongest and continuous. Though, the overall texture of � phasewas stronger for MSCR than UDR; on aging � texture is sharper forUDR (maximum mrd 21) sample than MSCR (maximum mrd 18).To get an estimate of the heterogeneity of the {1 1 2̄ 0} fiber, fiberplot for the deformed samples is shown in Fig. 8. Unlike the alphaand gamma fiber in BCC phase, {1 1 2̄ 0} fiber in the alpha phase is
quite homogenous.3.1.2.3. Texture of ˛ phase derived from recrystallized ˇ. InUDR + Rex + Aged material (TI = 3.63) the basal fiber was weak.{1 0 1̄ 0} fiber was stronger than basal with maximum intensity at

N.P. Gurao et al. / Materials Science and Engineering A 504 (2009) 24–35 27
, (b) M
[[sws
Fig. 5. ODF section for � phase of (a) UDR
2̄ 4 2̄ 5]. {1 1 2̄ 0} fiber was the strongest with highest intensities at5 5̄ 0 2], [1 2 12 0 1], [1 1̄ 0 4] and [1 1̄ 0 1]. For the MSCR + Rex + Agedample (TI = 3.26), the basal fiber was weak and the {1 0 1̄ 0} fiberas stronger than basal with maximum intensity at [10 0 10 1]. A
trong continuous {1 1 2̄0} fiber was also present with maxima at
SCR, (c) UDR + Rex, and (d) MSCR + Rex.
[4 4̄ 0 5] and [1 1̄ 0 1 2]. Samples subjected to recrystallization afterrolling show a similar trend on aging as the samples aged directlyafter rolling. UDR + Rex + Aged sample shows a higher intensity(maximum mrd 27) when compared to MSCR + Rex + Aged (max-imum mrd 19).

28 N.P. Gurao et al. / Materials Science and Engineering A 504 (2009) 24–35
er for
3
3
wgsawrado
Fig. 6. (a) Alpha and (b) Gamma fib
.2. Microstructures
.2.1. Rolled samplesStarting material had equiaxed single phase � grains (Fig. 1)
ith average grain size of 175 �m. Fig. 9 shows the SEM micro-raphs of the UDR and MSCR samples. Microstructures of both theamples were characterized by flow-lines with the grain bound-ries smeared completely, therefore hardly visible and hence it
as difficult to measure grain dimensions (grain diameter, aspectatio etc.) in the as rolled alloys. The flow-lines in UDR werelmost parallel to the direction of rolling while in MSCR twoistinct sets of flow-lines crossing each other at an angle werebserved.
Fig. 7. ODF section for � phase on aging of (a) starting materia
the start, UDR and MSCR samples.
3.2.2. Recrystallized samplesRecrystallization of both the UDR and MSCR samples led to dis-
appearance of flow-lines and the elongated features of the grainstructure. New grains appeared with smaller size for both UDR andMSCR samples (Fig. 10). The average grain size of normal UDR + Rexsample is around 60 �m while for MSCR + Rex sample the grain sizewas 65 �m.
3.2.3. Microstructure after agingIn the rolled samples, the prior � grains were easily identified
by the continuous film of � formed on prior � grain boundariesupon aging (Fig. 11). The microstructures were dominated bylarge colonies of Widmanstätten �. SEM images showed that the
l, (b) UDR, (c) MSCR, (d) UDR + Rex, and (e) MSCR + Rex.
N.P. Gurao et al. / Materials Science and
iovssipgs
3
Msmaoop
Fig. 8. 112̄0 fiber for start, UDR, and MSCR sample after aging.
ndividual Widmanstätten plates were delineated by a small layerf �. In the UDR + Aged and MSCR + Aged samples, � colony wereery dense while the UDR + Rex + Aged and MSCR + Rex + Agedamples were not having so dense � colony. Though in the rolledamples, the grain boundaries were not visible, they became visiblen the aged ones. In the deformed samples, that were recrystallizedrior to aging, � laths were formed inside newly recrystallized �rains. Different spatial orientations of � were observed inside aingle � grain in all the cases.
.3. Crystal orientation maps (COM)
EBSD analysis of the UDR + Age, UDR + Rex + Age, MSCR + Age andSCR + Rex + Age sample was carried out to study the effect of
train path and recrystallization on the evolution of � transfor-
ation texture and local variant selection in case of the LCB Tilloy. A step size of 200 nm was used for scanning smaller regionsf the microstructure to study local variant selection. The crystalrientation map or Inverse Pole Figure (IPF) map of the four sam-les is shown in Fig. 12. The width of � lath is smaller in case
Fig. 9. SEM microstructures of normal gr
Fig. 10. Effect of recrystallization on normal g
Engineering A 504 (2009) 24–35 29
of UDR samples than MSCR samples while � lath size increasesupon recrystallization prior to aging in both the cases. The thick-ness of lath as measured from crystal orientation mapping is foundto be 0.59, 0.95, 1.24 and 1.32 �m for UDR + Aged, UDR + Rex + Aged,MSCR + Aged and MSCR + Rex + Aged samples, respectively. In orderto study the local variant selection, the (0 0 0 1) � pole figuresand (1 1 0) � pole figures (Fig. 13) are plotted from the EBSDscan. The coincidence of orientations in case of (0 0 0 1) polefigure of � with (1 1 0) pole figure of � is an indication of vari-ant selection. Most of the major orientations in these two polefigures match in UDR/MSCR + Aged sample when compared toUDR/MSCR + Rex + Aged. Also, the UDR/MSCR + Aged sample showsfewer variants when compared to UDR/MSCR + Rex + Aged sample.
The crystal orientation map (COM) obtained from EBSD revealedthat in a single � grain two or more type of � colony had grown in ageometrically distinct direction. The orientation analysis indicatedthat a single � grain consisted of at least two type of distinctly dif-ferent � laths with different orientations while the grain boundary� and � have a different orientation altogether. The presence ofonly two types of � lath in a single � grain indicates strong vari-ant selection. The misorientation calculation clearly indicated that,the geometrically different alpha laths in a single prior � had closecrystallographic relation.
In order to analyze variant selection in detail, a finer investiga-tion of individual prior � grains in UDR + Aged, MSCR + Aged andMSCR + Rex + Aged sample was carried out by Point analysis thatgives the orientation at a particular location in the microstructure.The orientation of � grain with a single prior � grain was sameeverywhere. Point analysis was carried out at different locations inthe grain to find out the orientation of � laths and the prior � grain.The � orientation is presented in the
⟨1 0 1
⟩pole figure while �
orientation is represented in the (0 0 0 1) pole figure in Fig. 14. The
� orientations obtained from different locations in what was iden-tified as prior � grain, exhibited a large degree of coincidence. Thescatter in orientation of � was more for the rolled samples thosewere aged which is an indication of deformed structure (Fig. 14aand b). In the recrystallized sample, no such scatter in � orientationain (a) UDR and (b) MSCR samples.
rained samples (a) UDR and (b) MSCR.

30 N.P. Gurao et al. / Materials Science and Engineering A 504 (2009) 24–35
cessin
colbfosalh
gtamthdMtwspMtat
4
toi
Fig. 11. Effect of aging of normal samples on different pro
ould be detected (Fig. 14c). It was found that � laths parallel to eachther had similar orientation and even the non-parallel � laths haveittle misorientation. The orientation of the � grain as representedy the (1 0 1) pole figure shows the six
⟨1 0 1
⟩poles. It can be seen
rom the figure that different � laths coincide with one of the sixrientations of the � poles in accordance with the Burger’s relation-hip. The UDR + Aged sample shows 5 overlapping poles (10 vari-nts) in a single prior � grain while MSCR + Aged shows only 4 over-apping poles (8 variants). In MSCR + Rex + Aged sample, all 6 � polesave � counterpart indicating absence of any variant selection.
Local variant selection of � phase from the same parent �rain was also analyzed using COM. In absence of variant selec-ion, one beta orientation can give rise to 12 alpha variants thatre characterized by specific misorientation between them. Theseisorientation between the variants can be described by a rota-
ion axis ‘n’ and a rotation angle ‘�’ for the alpha phase and canave values 10◦, 60–63◦, and 90◦ only [6]. The misorientation angleistribution maps for � phase of UDR + Age and UDR + Rex + Aged,SCR + Aged and MSCR + Rex + Aged are shown in Fig. 15. The frac-
ion of misorientation near 10◦ is quite less in case of UDR sampleshen compared to MSCR ones. Misorientation near 63◦ and 90◦are
ubstantial in all the four cases with the MSCR + Rex + Aged sam-le showing the maximum amount of misorientation near 63◦. InSCR + Rex + Aged all the three type of misorientation are present
o some extent. Volume fraction of boundaries corresponding to thebove three misorientation are less in samples recrystallized prioro aging when compared to rolled and aged samples.
. Discussion
Results of the present investigation show that prior deformationhrough different strain path has a profound effect on the evolutionf texture in the � phase. The microstructure (substructure) hasmportant consequence on recrystallization as well as on the sub-
g routes (a) UDR (b) UDR + Rex (c) MSCR (d) MSCR + Rex.
sequent transformation texture in � phase. Each of these aspectshas been discussed in details in the following sub-sections.
4.1. Evolution of texture in ˇ phase during rolling and subsequentrecrystallization
Texture of � phase in MSCR sample is stronger than that in UDRsamples. The presence of Goss component (0 1 1) [1 0 0] in UDRmay be attributed to inhomogeneous deformation due to the pres-ence of shear bands that are absent in MSCR. The stronger texturedeveloped in MSCR samples validate this proposition, as the for-mation of shear bands contribute to weakening of texture in UDRsample. Materials with BCC crystal structure like iron [24–26] areknown to show two major spreads of orientations on unidirectionalrolling. The first being a limited
⟨1 1 0
⟩fiber texture with
⟨1 1 0
⟩
fiber axis parallel to the RD with spread of orientations between(0 0 1)
⟨1 1 0
⟩and (1 1 2)
⟨1 1 0
⟩. In Fe, the second main compo-
nent is orientation fiber ranging between {1 1 2}⟨
1 1 0⟩
and {1 1 1}⟨1 1 2
⟩that forms the complete
⟨1 1 1
⟩parallel to ND fiber. Thus,
in unidirectional rolling, the spread in the⟨
1 1 0⟩
fiber parallel toRD continues to increase with the increase in number of passes. Onthe contrary, in MSCR, the spread induced by preceding pass is cor-rected by the subsequent pass thereby leading to higher intensity ofgamma fiber. In this case (0 0 1)
⟨1 1 0
⟩is a stable end orientation.
The difference in rolling texture is reflected in further processinglike recrystallization, aging and recrystallization + aging.
The deformation texture does not change substantially afterrecrystallization for UDR as well as MSCR samples. The weak
texture observed in UDR sample qualitatively remains similarbut strengthens with very strong (5 5 6) [1̄ 1̄ 5 5] component afterrecrystallization; while in the case of MSCR there is a substantialdecrease in intensity. Thus, the trend of showing stronger texture inMSCR than UDR is reversed after recrystallization. The strong (5 5 6)
N.P. Gurao et al. / Materials Science and Engineering A 504 (2009) 24–35 31
b) UD
[icaSuattbd
aesisgrt
fapt
o
Fig. 12. Inverse Pole Figure (IPF) map of (a) UDR + Age, (
5 1̄ 1̄ 5] component in UDR and (1 1 1) [1 1 2̄] component observedn MSCR on recrystallization are very close to the (5 5 4)
⟨2̄ 2̄ 5
⟩
omponent that is reported to be present in Ti–15V–3Cr–3Sn–3Allloy annealed in � phase field at 800 and 1050 ◦C by Inoue [23].ingh et al. [26] reported significantly different texture for 60%ni-directionally rolled LCB Ti alloy sample on recrystallizationt 800 and 860 ◦C. The results obtained in the present investiga-ion are similar to those observed after recrystallization at 860 ◦C,hough the recrystallization was carried out at 800 ◦C. This coulde explained on the basis of reduced recrystallization temperatureue to higher amount of deformation (80%) in the present case.
Another important aspect that needs to be considered is themount of stored energy for various texture components that gov-rn nucleation of recrystallization. During plastic deformation, amall fraction of the total energy expended in plastic deformations stored in the crystal in the form of elastic energy associated withtrain field of dislocations. Depending on the orientation, differentrains have different amount of stored energy. Various analysis car-ied out on rolled BCC metals with various techniques have shownhe hierarchy of stored energy in the following order {1 1 1}
⟨1 1 2
⟩
ollowed with {1 1 1}⟨
1 1 0⟩
and {0 0 1}⟨
1 1 0⟩
[27]. The first two
re gamma fiber components while the latter is an alpha fiber com-onent. The volume fraction of these components calculated fromhe experimental bulk texture data are shown in Table 2.The component analysis shows that the volume fraction of vari-us texture components increases on recrystallization for the UDR
R + Rex + Age, (c) MSCR + Age, and (d) MSCR + Rex + Age.
sample. For the MSCR sample, there is a decrease in volume frac-tion for {1 1 1}
⟨1 1 2
⟩and {1 1 1}
⟨1 1 0
⟩with a slight increase in
volume fraction of {0 0 1}⟨
1 1 0⟩
component. Depending on thestored energy criterion, the grains with orientation correspondingto higher stored energy are the first one to recrystallize. They thusplay a very important role in the recrystallization behavior of amaterial. In case of BCC materials, the recrystallization texture issimilar to the deformation texture and hence, increase in volumefraction of the above three components in UDR lead to a strongtexture of � phase on recrystallization. UDR sample shows maxi-mum intensity for (5 5 6) [5 1̄ 1̄ 5] component that is very close to{1 1 1}
⟨1 1 2
⟩component that has the maximum amount of stored
energy on recrystallization, thereby emphasizing the role of storedenergy during recrystallization of � phase after rolling. This furthersubstantiates that higher defect accumulation of defects in UDRsample leads to a stronger recrystallization texture when comparedto MSCR.
4.2. Evolution of transformation texture
The effect of various mechanical, thermal and thermomechani-
cal treatment on variant selection in (� + �) as well as metastable �alloys has been studied extensively in literature [4–17]. It is foundthat prior deformation of � phase leads to variant selection onaging, however, the role of strain path in term of different type ofrolling and that of recrystallization after rolling that alters the defect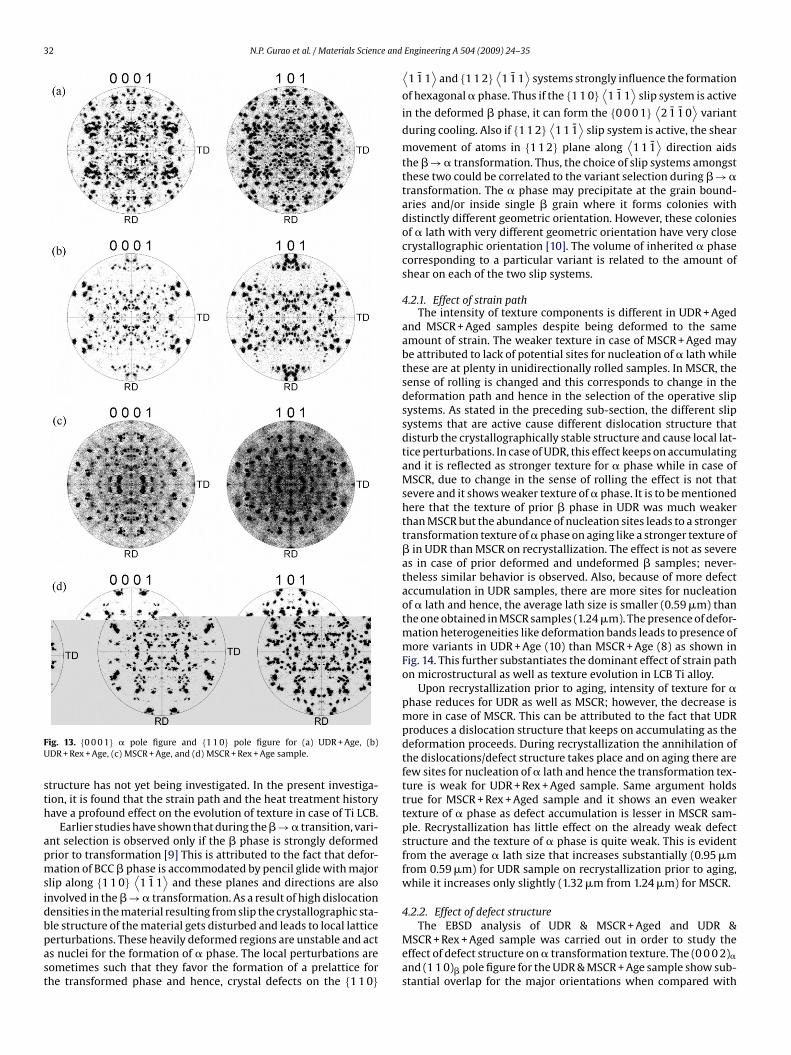
32 N.P. Gurao et al. / Materials Science and
FU
sth
apmsidbpast
ig. 13. {0 0 0 1} � pole figure and {1 1 0} pole figure for (a) UDR + Age, (b)DR + Rex + Age, (c) MSCR + Age, and (d) MSCR + Rex + Age sample.
tructure has not yet being investigated. In the present investiga-ion, it is found that the strain path and the heat treatment historyave a profound effect on the evolution of texture in case of Ti LCB.
Earlier studies have shown that during the � → � transition, vari-nt selection is observed only if the � phase is strongly deformedrior to transformation [9] This is attributed to the fact that defor-ation of BCC � phase is accommodated by pencil glide with major
lip along {1 1 0}⟨
1 1̄ 1⟩
and these planes and directions are alsonvolved in the � → � transformation. As a result of high dislocationensities in the material resulting from slip the crystallographic sta-
le structure of the material gets disturbed and leads to local latticeerturbations. These heavily deformed regions are unstable and acts nuclei for the formation of � phase. The local perturbations areometimes such that they favor the formation of a prelattice forhe transformed phase and hence, crystal defects on the {1 1 0}Engineering A 504 (2009) 24–35
⟨1 1̄ 1
⟩and {1 1 2}
⟨1 1̄ 1
⟩systems strongly influence the formation
of hexagonal � phase. Thus if the {1 1 0}⟨
1 1̄ 1⟩
slip system is active
in the deformed � phase, it can form the {0 0 0 1}⟨
2 1̄ 1̄ 0⟩
variant
during cooling. Also if {1 1 2}⟨
1 1 1̄⟩
slip system is active, the shear
movement of atoms in {1 1 2} plane along⟨
1 1 1̄⟩
direction aidsthe � → � transformation. Thus, the choice of slip systems amongstthese two could be correlated to the variant selection during � → �transformation. The � phase may precipitate at the grain bound-aries and/or inside single � grain where it forms colonies withdistinctly different geometric orientation. However, these coloniesof � lath with very different geometric orientation have very closecrystallographic orientation [10]. The volume of inherited � phasecorresponding to a particular variant is related to the amount ofshear on each of the two slip systems.
4.2.1. Effect of strain pathThe intensity of texture components is different in UDR + Aged
and MSCR + Aged samples despite being deformed to the sameamount of strain. The weaker texture in case of MSCR + Aged maybe attributed to lack of potential sites for nucleation of � lath whilethese are at plenty in unidirectionally rolled samples. In MSCR, thesense of rolling is changed and this corresponds to change in thedeformation path and hence in the selection of the operative slipsystems. As stated in the preceding sub-section, the different slipsystems that are active cause different dislocation structure thatdisturb the crystallographically stable structure and cause local lat-tice perturbations. In case of UDR, this effect keeps on accumulatingand it is reflected as stronger texture for � phase while in case ofMSCR, due to change in the sense of rolling the effect is not thatsevere and it shows weaker texture of � phase. It is to be mentionedhere that the texture of prior � phase in UDR was much weakerthan MSCR but the abundance of nucleation sites leads to a strongertransformation texture of � phase on aging like a stronger texture of� in UDR than MSCR on recrystallization. The effect is not as severeas in case of prior deformed and undeformed � samples; never-theless similar behavior is observed. Also, because of more defectaccumulation in UDR samples, there are more sites for nucleationof � lath and hence, the average lath size is smaller (0.59 �m) thanthe one obtained in MSCR samples (1.24 �m). The presence of defor-mation heterogeneities like deformation bands leads to presence ofmore variants in UDR + Age (10) than MSCR + Age (8) as shown inFig. 14. This further substantiates the dominant effect of strain pathon microstructural as well as texture evolution in LCB Ti alloy.
Upon recrystallization prior to aging, intensity of texture for �phase reduces for UDR as well as MSCR; however, the decrease ismore in case of MSCR. This can be attributed to the fact that UDRproduces a dislocation structure that keeps on accumulating as thedeformation proceeds. During recrystallization the annihilation ofthe dislocations/defect structure takes place and on aging there arefew sites for nucleation of � lath and hence the transformation tex-ture is weak for UDR + Rex + Aged sample. Same argument holdstrue for MSCR + Rex + Aged sample and it shows an even weakertexture of � phase as defect accumulation is lesser in MSCR sam-ple. Recrystallization has little effect on the already weak defectstructure and the texture of � phase is quite weak. This is evidentfrom the average � lath size that increases substantially (0.95 �mfrom 0.59 �m) for UDR sample on recrystallization prior to aging,while it increases only slightly (1.32 �m from 1.24 �m) for MSCR.
4.2.2. Effect of defect structure
The EBSD analysis of UDR & MSCR + Aged and UDR &MSCR + Rex + Aged sample was carried out in order to study theeffect of defect structure on � transformation texture. The (0 0 0 2)�
and (1 1 0)� pole figure for the UDR & MSCR + Age sample show sub-stantial overlap for the major orientations when compared with

N.P. Gurao et al. / Materials Science and Engineering A 504 (2009) 24–35 33
DR + A
boMvwi
Fig. 14. Different alpha laths in a single grain for (a) U
oth UDR & MSCR + Rex + Age samples (Fig. 14). This is an indication
f dominant variant selection in UDR & MSCR + Aged than UDR &SCR + Rex + Aged. It has been reported by Gey et al. [5], that strongariant selection occurred in prior rolled � but no variant selectionas observed in undeformed � sample. The results of the present
nvestigation corroborate the above observation. During recrystal-
ge, (b) MSCR + Age sample, and (c) MSCR + Rex + Age.
lization of the prior rolled sample, the strain gets relieved and the
formation of new grains abates the effect of earlier slip on the {1 1 0}⟨1 1 1⟩
and {1 1 2}⟨
1 1 1⟩
that aids in variant selection. Microstruc-tural features like shear band that could act as site for nucleationof alpha laths during aging, disappear during recrystallization.The local texture analysis carried out on individual prior � grains

34 N.P. Gurao et al. / Materials Science and Engineering A 504 (2009) 24–35
+ Age
(ucninw�tMoem
tsmdotdpr
TV
S
UUMM
Fig. 15. Misorientation distribution chart in alpha phase for (a) UDR
several of them), indicates that the number of � variants observedpon aging, in a single � grain is less in case of rolled samples whenompared to recrystallized samples. This is due to the fact that theumber of potential sites for the nucleation of � phase in � grains
s reduced after recrystallization. The only potential sites for theucleation of � laths in recrystallized samples are grain boundarieshile in rolled samples, various defects that are present inside thegrain provide nucleation sites for � laths during aging. The bulk
exture results of the UDR + Aged and UDR + Rex + Aged as well asSCR + Aged and MSCR + Rex + Aged are quite similar and the effect
f defect structure cannot be appreciated on the bulk scale. How-ver, this effect can be appreciated at the local level that is at theicrostructural level.In the present investigation, it has been consistently observed
hat � phase precipitates at the grain boundaries and/or insideingle � grain where it forms colonies with distinctly different geo-etric orientation. However, these colonies of � lath with very
ifferent geometric orientation have very close crystallographicrientation as reported by Bhattacharyya et al. [10]. The proposi-
ion that activating slip systems that could lead to high dislocationensities and thereby generate local lattice perturbations [9] is sup-orted by the presence relatively larger width of � laths in theecrystallized samples than rolled samples on aging. The directable 2olume fraction of various texture components in rolled and recrystallized samples.
ample {1 1 1}⟨
1 1 2⟩
{1 1 1}⟨
1 1 0⟩
{0 0 1}⟨
1 1 0⟩
DR 0.99 0.98 1.12DR + Rex 1.37 1.11 1.62SCR 3.88 3.09 1.52SCR + Rex 3.24 2.84 1.58
d, (b) UDR + Rex + Aged, (c) MSCR + Aged, and (d) MSCR + Rex + Aged.
evidence of variant selection is provided by point analysis of thatfurther substantiates the effect of defect structure on variant selec-tion. The relatively stronger defect structure in rolled samples thanthe recrystallized sample is the main cause for such a behavior onaging. Hence, though the bulk texture is qualitatively similar for thetwo samples, microstructural evolution is different in case of UDR& MSCR and UDR & MSCR + Rex sample on aging.
5. Conclusions
1. Cold rolling texture of � titanium alloy is characterized by thepresence of a strong gamma fiber ranging from {1 1 1}
⟨1 1 0
⟩to
{1 1 1}⟨
1 1 2⟩
. Texture is stronger in MSCR when compared toUDR and this is attributed to the inhomogeneous deformationtaking place in the latter that contributes to weakening of thetexture.
2. The texture of recrystallized � phase qualitatively remains thesame and in fact strengthens on recrystallization for UDR andMSCR sample. The strengthening is more in UDR and it showsmaximum intensity at (5 5 6) [5 1̄ 1̄ 5] that is close to (1 1 1) [1 2̄ 1]component that shows maximum intensity in MSCR.
3. The strain path during rolling of � phase has a profound effecton the evolution of texture and microstructure of � phase. TheUDR + Age sample has a stronger texture than MSCR + Age sam-ple. The smaller � lath size in UDR sample when compared toMSCR contributes to a stronger texture in the former case. Thetrend is reversed when the samples are subjected to recrystal-
lization prior to aging; with MSCR + Rex + Aged sample showingstronger texture of � phase than UDR + Rex + Aged. The � lathsize increases substantially (0.95 �m from 0.59 �m) in UDR onrecrystallization while in MSCR, it increases slightly (1.32 �mfrom 1.24 �m)