Embed Size (px)
Citation preview

8/12/2019 Study of Steam Condensation on a Single Vertical Tube
http://slidepdf.com/reader/full/study-of-steam-condensation-on-a-single-vertical-tube 1/27
ChE 304
Chemical engineering laboratory - III
Experiment No. 2 Group No. 03 (A2)
Name of the experiment:
Study of steam condensation on a single
vertical tube
Submitted by:
Md. Hasib Al Mahbub
Student Id: 0902045
Level: 3; Term: 2
Section: A2
Date of performance: 11/03/2014
Date of submission: 18/03/2014
Partners’ Student Id. 0902041
0902042
0902043
0902044
Department of Chemical Engineering.
Bangladesh University of engineering and technology, Dhaka.

8/12/2019 Study of Steam Condensation on a Single Vertical Tube
http://slidepdf.com/reader/full/study-of-steam-condensation-on-a-single-vertical-tube 2/27
1
Summary
The objective was to demonstrate the phenomenon of film type condensation on a vertical tube,
to obtain condensation coefficient value with those of the literature values, to determine the
effect of velocity of water on the overall heat transfer coefficient, to observe the variation ofheat load and mass flow with temperature and finally to estimate the heat loss to the
surrounding. To carry out the experiment, water was flown through the inner pipe while the
steam was supplied to the annulus. After the steady state had reached, the temperature was
recorded. The same procedure was done for different flow rates of water at different steam
pressure of 5, 10 and 15 psig. The water flow rate and steam pressure was controlled by valve.
Then by measuring flow rates of water and condensate and by mathematical manipulation the
condensation coefficient was calculated. In this experiment, the condensation coefficient were
found out to be varied from 4713.383 W/m2.oC to 5246.116 W/m2.oC. Graphs of overall heat
transfer coefficient vs. velocity of water, film thickness vs. distance from top, local heat transfer
coefficient vs. distance from top, heat load vs. wall temperature and mass flow rate vs. wall
temperature has been plot. Possible discrepancies are discussed at the end of the report.

8/12/2019 Study of Steam Condensation on a Single Vertical Tube
http://slidepdf.com/reader/full/study-of-steam-condensation-on-a-single-vertical-tube 3/27
2
Experimental Setup
Cold water
inlet
Condensate
produced at
glass tube
Cold water outlet
Glass tubecondensing surface
Saturated
steam
Condensate
Steam trap
Steam trap
Condensate
Saturated
steam
Separated
condensate
Figure 1: Experimental setup for the vertical tube condensation
Gauge
Pressure
Thermometer

8/12/2019 Study of Steam Condensation on a Single Vertical Tube
http://slidepdf.com/reader/full/study-of-steam-condensation-on-a-single-vertical-tube 4/27
3
Observed data
Table 1: Observed data for the condensation on a single vertical tube
SteamPressure
P
(psig)
No of
Obs.
Water
Temperature Water Condensate
Inlet
T1
(°C)
Outlet
T2
(°C)
Volume
V
(L)
Time
(s)
Weight
(kg)
Time
(s)
5
1 29 48 1 54 0.0269 30
2 29 41 1 17 0.045 30
3 29 37 1 10.25 0.0593 30
4 29 35 1 6.35 0.0678 30
10
5 29 84 1 44.06 0.0724 30
6 29 51 1 8.65 0.1109 30
7 29 48 1 7.25 0.1429 30
8 29 45 1 6.31 0.1714 30
15
9 29 91 1 77.1 0.0571 30
10 29 53 1 10.06 0.1382 30
11 29 51 1 9.15 0.144 30
12 29 47 1 6.22 0.155 30

8/12/2019 Study of Steam Condensation on a Single Vertical Tube
http://slidepdf.com/reader/full/study-of-steam-condensation-on-a-single-vertical-tube 5/27
4
Calculated data
Length of vertical tube = 1.6256 m
Table 2: Properties of water at mean temperature
Steam
pressur
e
(psig)
Mean
temperature
of water,
Tm (°C)
Density of
Water
ρ
(kg/m3)
Weight of
Water
(kg)
Mass flow
rate of water,
Mw (kg/sec)
Velocity,
v
(m/s)
5
38.5 970.429 0.970429 0.017970907 0.139518116
35 971.257 0.971257 0.057132765 0.443175191
33 971.726 0.971726 0.094802537 0.735022267
32 971.959 0.971959 0.153064409 1.186453266
10
56.5 963.157 0.963157 0.021860123 0.170993605
40 967.318 0.967318 0.111828671 0.870980144
38.5 967.687 0.967687 0.133474069 1.039169413
37 968.055 0.968055 0.153416006 1.193974365
15
60 959.726 0.959726 0.012447808 0.097716968
41 964.668 0.964668 0.095891451 0.748904398
40 964.919 0.964919 0.105455628 0.8233856
38 965.426 0.965426 0.155213183 1.211250521

8/12/2019 Study of Steam Condensation on a Single Vertical Tube
http://slidepdf.com/reader/full/study-of-steam-condensation-on-a-single-vertical-tube 6/27
5
Table 3: Calculation for condensate flow rate and saturation, wall and film temperature
Stea
m
press
ure
(psig)
Observ
ation
No
Mass flow
rate of
condensat
e, Mc
(kg/sec)
Saturation
temperatur
e of steamTs (°C)
Heat of
vaporizatio
nλ s (J/Kg)
Wall
temperature
,
Tw (°C)
Film
temperatur
e,Tf (°C)
5
10.0008966 108.392
2234.06
73.446 82.1825
20.0015 108.392 71.696 80.87
30.0019766 108.392 70.696 80.12
40.00226 108.392 70.196 79.745
10
60.0024133 115.199
2215.48
85.8495 93.186875
70.0036966 115.199 77.5995 86.999375
80.0047633 115.199 76.8495 86.436875
90.0057133 115.199 76.0995 85.874375
15
110.0019033 120.955
2199.47
90.4775 98.096875
120.0046066 120.955 80.9775 90.971875
130.0048 120.955 80.4775 90.596875
140.0051666 120.955 79.4775 89.846875

8/12/2019 Study of Steam Condensation on a Single Vertical Tube
http://slidepdf.com/reader/full/study-of-steam-condensation-on-a-single-vertical-tube 7/27
6
Table 4: Properties of condensate at film temperature
Stea
m
press
ure
(psig)
Observ
ation
No
Density
(kg/m3)
Viscosity
(kg/m.s)
Thermal
conductivity
(W.m-1.K -1)
Reynolds’
NoPrandtl No.
5
1992.784 0.0003368 0.67145 213.527744 2.04031227
2994.035 0.00034229 0.6706 351.473362 2.07640280
3994.706 0.00034547 0.6701 458.900433 2.09782417
4995.03 0.00034707 0.6699 522.259961 2.10832461
10
6984.965 0.0002961 0.6777 653.693660 1.77638154
7992.22 0.00031795 0.6744 932.495685 1.91755343
8992.784 0.00032005 0.6741 1193.68163 1.93121996
9993.332 0.00032222 0.6737 1422.10753 1.94561190
15
11983.202 0.00028048 0.68 544.262389 1.67702291
12991.833 0.00030365 0.6766 1216.77106 1.82468248
13992.218 0.00030494 0.6764 1262.47332 1.83365236
14992.968 0.00030758 0.676 1347.24853 1.8508035

8/12/2019 Study of Steam Condensation on a Single Vertical Tube
http://slidepdf.com/reader/full/study-of-steam-condensation-on-a-single-vertical-tube 8/27
7
Table 5: Calculated data for heat flow rates and overall heat transfer co-efficient
SteamPress
ure
(psig)
Rate of
heat
taken
by
water,
Qw
(kJ/s)
Rate of
heat
given
up by
steam,
Qc
(KJ/s)
Mean
rate ofheat
flow,
Qm
(KJ/s)
Heat
Loss
(KJ/s)
Perce
nt loss
of
heat,
%
Steam
Side
Heat
transfer
co-
efficient
ho
(W/m2.°
C)
LMTD
∆Tm
(°C)
Overall
heat
transfer
co-
efficient
U
(W/m2.
°C)
5
1.38887 2.003207 1.696038 0.6143363 30.667 4858.601 69.4594 301.17890
2.78899 3.35109 3.070041 0.5620969 16.773 4778.716 73.2282 517.11344
3.08608 4.415991 3.751039 1.3299039 30.115 4734.691 75.3212 614.26303
3.73728 5.04897 4.393128 1.3116937 25.979 4713.383 76.3527 709.69117
10
4.88821 5.346691 5.117455 0.4584732 8.5748 5246.116 54.1193 1166.3301
10.0064 8.189891 9.098193 -1.816605 -22.181 4844.134 74.6595 1503.1065
10.3154 10.55306 10.43426 0.2376063 2.2515 4812.109 76.3051 1686.6617
9.98529 12.65777 11.32153 2.6724801 21.113 4779.972 77.9254 1792.0334
15
3.13783 4.124567 3.662081 1.0484860 25.045 5266.893 55.2780 817.13809
9.35701 10.13222 9.744618 0.7752140 7.6509 4827.728 79.3510 1514.7197
9.43623 10.55745 9.996844 1.1212230 10.620 4807.519 80.4543 1532.6168
11.3644 11.36392 11.36421 -0.000563 -0.0049 4767.676 82.6284 1696.4043

8/12/2019 Study of Steam Condensation on a Single Vertical Tube
http://slidepdf.com/reader/full/study-of-steam-condensation-on-a-single-vertical-tube 9/27
8
Table 6: Calculated data for average thickness of the condensate film & average local
heat transfer co-efficient for z1=0.5m
Steam
Pressure
(psig)
Distance
from the
top of the
tube,
z1 (m)
Thickness of
thecondensate
film,
yf
(m)
Average,
yf
(m)
Local heat
transfer co-
efficient,
hlocal
(W/m2.°C)
Average
hlocal
(W/m2.°C)
5
0.5
0.000164469
0.000167264
4082.523709
4009.2080.000167007 4015.399184
0.000168434 3978.406366
0.000169145 3960.5025
10
0.000153738
0.000163468
4408.140683
4134.6050.000165685 4070.367727
0.000166714 4043.458192
0.000167735 4016.455049
15
0.000153652
0.000164157
4425.59854
4131.9760.000166791 4056.582439
0.000167442 4039.601215
0.000168742 4006.122691

8/12/2019 Study of Steam Condensation on a Single Vertical Tube
http://slidepdf.com/reader/full/study-of-steam-condensation-on-a-single-vertical-tube 10/27
9
Table 7: Calculated data for average thickness of the condensate film & average local
heat transfer co-efficient for z2=1.0m
Steam
Pressure
(psig)
Distance
from the
top of the
tube,
Z2(m)
Thickness of
thecondensate
film,
yf
(m)
Average,
yf
(m)
Local heat
transfer co-
efficient,
hlocal
(W/m2.°C)
Average
hlocal
(W/m2.°C)
5
1.0
0.000195588
0.000198912
3432.979552
3371.3290.000198606 3376.53478
0.000200303 3345.427652
0.000201149 3330.372355
10
0.000182827
0.000194397
3706.789698
3476.7750.000197034 3422.757631
0.000198257 3400.129499
0.000199472 3377.422653
15
0.000182723
0.000195216
3721.469947
3474.5640.000198349 3411.165632
0.000199124 3396.886181
0.000200669 3368.73421

8/12/2019 Study of Steam Condensation on a Single Vertical Tube
http://slidepdf.com/reader/full/study-of-steam-condensation-on-a-single-vertical-tube 11/27
10
Table 8: Calculated data for average thickness of the condensate film & average local
heat transfer co-efficient for z3=1.5m
Steam
Pressure
(psig)
Distance
from the
top of the
tube,
Z3(m)
Thickness of
the
condensate
film,
yf
(m)
Average,
yf
(m)
Local heat
transfer co-
efficient,
hlocal
(W/m2.°C)
Average
hlocal
(W/m2.°C)
5
1.5
0.000216454
0.000220132
3102.047202
3046.3390.000219794 3051.043592
0.000221672 3022.935129
0.000222608 3009.331133
10
0.000202331
0.000215136
3349.462598
3141.6210.000218054 3092.810653
0.000219408 3072.363828
0.000220752 3051.845876
15
0.000202217
0.000216042
3362.727701
3139.6230.000219509 3082.336099
0.000220366 3069.433159
0.000222077 3043.994982

8/12/2019 Study of Steam Condensation on a Single Vertical Tube
http://slidepdf.com/reader/full/study-of-steam-condensation-on-a-single-vertical-tube 12/27
11
Graphs
1. U as a function of velocity of water at different pressures:
a. For 5 psig steam pressure
Figure 2: Overall Heat Transfer Coefficient vs Velocity of Water for 5 psig steam pressure
280
330
380
430
480
530
580
630
680
0.1 0.3 0.5 0.7 0.9 1.1 1.3
O v e r a l l H e a t T r
a n s f e r C o e f f i c i e n t U ( W / m 2 .
° C
)
Velocity of Water (m/sec)
Overall Heat Transfer Coefficient vs Velocity of Water for 5 psig
steam pressure

8/12/2019 Study of Steam Condensation on a Single Vertical Tube
http://slidepdf.com/reader/full/study-of-steam-condensation-on-a-single-vertical-tube 13/27
12
b. For 10 psig steam pressure
Figure 3: Overall Heat Transfer Coefficient vs Velocity of Water for 10 psig steam pressure
1000
1100
1200
1300
1400
1500
1600
1700
1800
0 0.2 0.4 0.6 0.8 1 1.2 1.4
O v e r a l l H e a t T r a n s f e r C o e f f i c i e n t U ( W / m 2 .
° C )
Velocity of Water (m/sec)
Overall Heat Transfer Coefficient vs Velocity of Water for 10 psig
steam pressure

8/12/2019 Study of Steam Condensation on a Single Vertical Tube
http://slidepdf.com/reader/full/study-of-steam-condensation-on-a-single-vertical-tube 14/27
13
c. For 15 psig steam pressure
Figure 4: Overall Heat Transfer Coefficient vs Velocity of Water for 15 psig steam pressure
600
800
1000
1200
1400
1600
1800
0 0.2 0.4 0.6 0.8 1 1.2 1.4
O v e r a l l H e a t T r a n s f e r C o
e f f i c i e n t U ( W / m 2 .
° C )
Velocity of water (m/sec)
Overall Heat Transfer Coefficient vs Velocity of Water for 15 psig
steam pressure

8/12/2019 Study of Steam Condensation on a Single Vertical Tube
http://slidepdf.com/reader/full/study-of-steam-condensation-on-a-single-vertical-tube 15/27
14
2. Film Thickness as a function of distance from top at different pressures:
a. For 5 psig steam pressure
Figure 5: Film Thickness vs Distance from Top for 5 psig steam Pressure
b. For 10 psig steam pressure
Figure 6: Film Thickness vs Distance from Top for 10 psig steam Pressure
0.00015
0.00016
0.00017
0.00018
0.00019
0.0002
0.00021
0.00022
0.00023
0.4 0.6 0.8 1 1.2 1.4 1.6
F i l m T h i c k n e s s , ( m )
Distance from top (m)
Film Thickness vs Distance from Top for 5 psig steam Pressure
0.00015
0.00016
0.00017
0.00018
0.00019
0.0002
0.00021
0.00022
0.00023
0.4 0.6 0.8 1 1.2 1.4 1.6
F i l m T h i c k n e s
s ( m )
Distance from Top (m)
Film Thickness vs Distance from Top for 10 psig steam
Pressure

8/12/2019 Study of Steam Condensation on a Single Vertical Tube
http://slidepdf.com/reader/full/study-of-steam-condensation-on-a-single-vertical-tube 16/27
15
c. For 15 psig steam pressure
Figure 7: Film Thickness vs Distance from Top for 15 psig steam Pressure
3. Local heat transfer coefficient as a function of distance from top at different
pressures
a. For 5 psig steam pressure
Figure 8: Local heat transfer coefficient vs distance from top for 5 psig steam pressure
2500
2700
2900
3100
3300
3500
3700
3900
4100
0.4 0.6 0.8 1 1.2 1.4 1.6
L o c a l h e a t t r a n s f e
r c o e f f i c i e n t
( W / m 2 . 0
C )
Distance from Top (m)
Local heat transfer coefficient vs distace from top for 5 psig
steam pressure
0.00015
0.00016
0.00017
0.00018
0.00019
0.0002
0.00021
0.00022
0.00023
0.4 0.6 0.8 1 1.2 1.4 1.6
F i l m T h i c k n e s s ( m )
Distance from Top (m)
Film Thickness vs Distance from Top for 15 psig steam Pressure

8/12/2019 Study of Steam Condensation on a Single Vertical Tube
http://slidepdf.com/reader/full/study-of-steam-condensation-on-a-single-vertical-tube 17/27
16
b. For 10 psig steam pressure
Figure 9: Local heat transfer coefficient vs distance from top for 10 psig steam pressure
c. For 15 psig steam pressure
Figure 10: Local heat transfer coefficient vs distance from top for 15 psig steam pressure
2500
2700
2900
3100
3300
3500
3700
3900
4100
4300
0.4 0.6 0.8 1 1.2 1.4 1.6 L o c a l h e a t t r a n s f e r c o e f f i c i e n t ( W / m 2 . 0 C )
Distance from top (m)
Local heat transfer coefficient vs distace from top for 10 psig
steam pressure
2500
2700
2900
3100
3300
3500
3700
3900
4100
4300
0.4 0.6 0.8 1 1.2 1.4 1.6
L o c a l h e a t t r a n s f e r c o e f f i c i e n t ( W / m 2 . 0
C )
Distance from top (m)
Local heat transfer coefficient vs distace from top for 15 psig
steam pressure

8/12/2019 Study of Steam Condensation on a Single Vertical Tube
http://slidepdf.com/reader/full/study-of-steam-condensation-on-a-single-vertical-tube 18/27
17
4. Heat load of water as a function of wall temperature at different pressure:
a. For 5 psig steam pressure
Figure 11: Heat load of water vs wall temperature at 5 psig steam pressure
b. For 10 psig steam pressure
Figure 12: Heat load of water vs wall temperature at 10 psig steam pressure
0
0.5
1
1.5
2
2.5
3
3.5
4
70 70.5 71 71.5 72 72.5 73 73.5 74
H e a t
l o a d o f w a t e r , Q w ( k W )
Wall Temperature (oC)
Heat load of water vs wall temperature at 5 psig steam
pressure
4
5
6
7
8
9
10
11
75.4 77.4 79.4 81.4 83.4 85.4
H e a t l o a d o f w a t e r , Q w ( k W )
Wall Temperature (oC)
Heat load of water vs wall temperature at 10 psig steam
pressure

8/12/2019 Study of Steam Condensation on a Single Vertical Tube
http://slidepdf.com/reader/full/study-of-steam-condensation-on-a-single-vertical-tube 19/27
18
c. For 15 psig steam pressure
Figure 13: Heat load of water vs wall temperature at 15 psig steam pressure
5. Mass flow rate of water as a function of wall temperature at different pressure
a. For 5 psig steam pressure
Figure 14: Mass Flow rate of water vs wall temperature at 5 psig steam pressure
3
4
5
6
7
8
9
10
11
12
78 80 82 84 86 88 90
H e a t l o a d o f w a t e r , Q w ( k W )
Wall Temperature (oC)
Heat load of water vs wall temperature at 15 psig steam
pressure
0.01
0.03
0.05
0.07
0.09
0.11
0.13
0.15
0.17
70 70.5 71 71.5 72 72.5 73 73.5 74 M a s s F l o w R a t e o f W a
t e r ( k g / s e c )
Wall Temperature (oC)
Mass Flow rate of water vs wall temperature at 5 psig steam
pressure

8/12/2019 Study of Steam Condensation on a Single Vertical Tube
http://slidepdf.com/reader/full/study-of-steam-condensation-on-a-single-vertical-tube 20/27
19
b. For 10 psig steam pressure
Figure 15: Mass Flow rate of water vs wall temperature at 10 psig steam pressure
c. For 15 psig steam pressure
Figure 16: Mass Flow rate of water vs wall temperature at 15 psig steam pressure
0.02
0.04
0.06
0.08
0.1
0.12
0.14
0.16
75.4 77.4 79.4 81.4 83.4 85.4 M a s s F l o w R a t e o f W a t e r ( k g / s e c )
Wall Temperature (oC)
Mass Flow rate of water vs wall temperature at 10 psig
steam pressure
0.012
0.032
0.052
0.072
0.092
0.112
0.132
0.152
78.8 80.8 82.8 84.8 86.8 88.8 90.8
M a s s F l o w R a t e o f W a t e r ( k g / s e c )
Wall Temperature (oC)
Mass Flow rate of water vs wall temperature at 15 psig steam pressure

8/12/2019 Study of Steam Condensation on a Single Vertical Tube
http://slidepdf.com/reader/full/study-of-steam-condensation-on-a-single-vertical-tube 21/27
20
Sample calculation
For observation no. 5, at 10 psig steam pressure:
Volume of water collected, V= 1.0x10⁻³ m3
Time, tw= 44.06 sec
Inlet water temperature, T1 =29°C
Outlet water temperature, T2 = 84°C
Weight of condensate collected, Wc = 0.0724 kg
Condensate collection time tc= 30 sec
Mean Temperature, Tm=2
T+T21
=56.5°C
Density at 56.5°C, ρ = 963.157 kg/m3 [From J. P. Holman, Heat Transfer, McGraw - Hill,
10th Ed, 1997, Page-605, Table A-5]
Mass of water=0.9632 kg
Mass flow rate, Mw =wt
water of Mass
= (0.9632/44.06)kg/s
= 0.02186 kg/s
Mass flow rate of condensate, Mc =
ct
Wc
= (0.0724/30) kg/s
= 0.002413 kg/s
*Saturation temperature of steam at 10 psig pressure, Ts = 115.199°C
*Heat of vaporization at 10 psig pressure, λ s = 2215.48 kJ/Kg
8/12/2019 Study of Steam Condensation on a Single Vertical Tube
http://slidepdf.com/reader/full/study-of-steam-condensation-on-a-single-vertical-tube 22/27
21
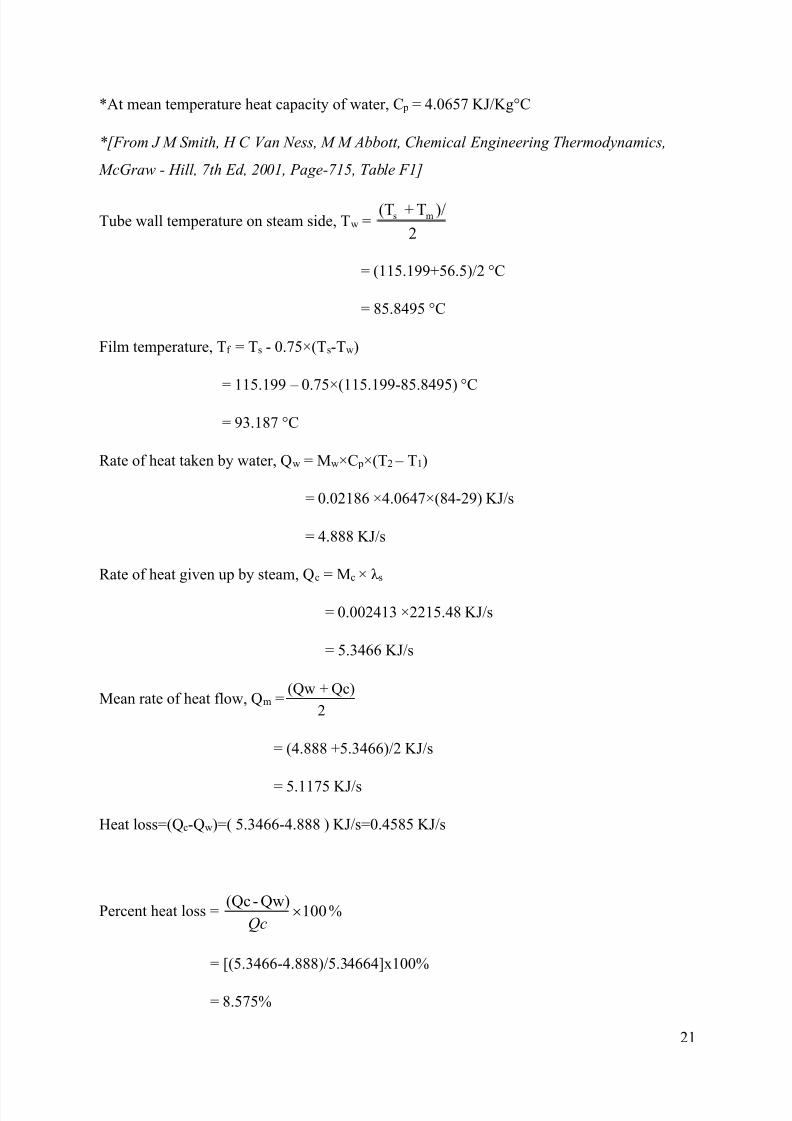
*At mean temperature heat capacity of water, C p = 4.0657 KJ/Kg°C
*[From J M Smith, H C Van Ness, M M Abbott, Chemical Engineering Thermodynamics,
McGraw - Hill, 7th Ed, 2001, Page-715, Table F1]
Tube wall temperature on steam side, Tw =2
)/T+(T ms
= (115.199+56.5)/2 °C
= 85.8495 °C
Film temperature, Tf = Ts - 0.75×(Ts-Tw)
= 115.199 – 0.75×(115.199-85.8495) °C
= 93.187 °C
Rate of heat taken by water, Qw = Mw×C p×(T2 – T1)
= 0.02186 ×4.0647×(84-29) KJ/s
= 4.888 KJ/s
Rate of heat given up by steam, Qc = Mc × λ s
= 0.002413 ×2215.48 KJ/s
= 5.3466 KJ/s
Mean rate of heat flow, Qm =2
Qc)+(Qw
= (4.888 +5.3466)/2 KJ/s
= 5.1175 KJ/s
Heat loss=(Qc-Qw)=( 5.3466-4.888 ) KJ/s=0.4585 KJ/s
Percent heat loss = 100Qw)-(Qc
Qc%
= [(5.3466-4.888)/5.34664]x100%
= 8.575%
8/12/2019 Study of Steam Condensation on a Single Vertical Tube
http://slidepdf.com/reader/full/study-of-steam-condensation-on-a-single-vertical-tube 23/27
22
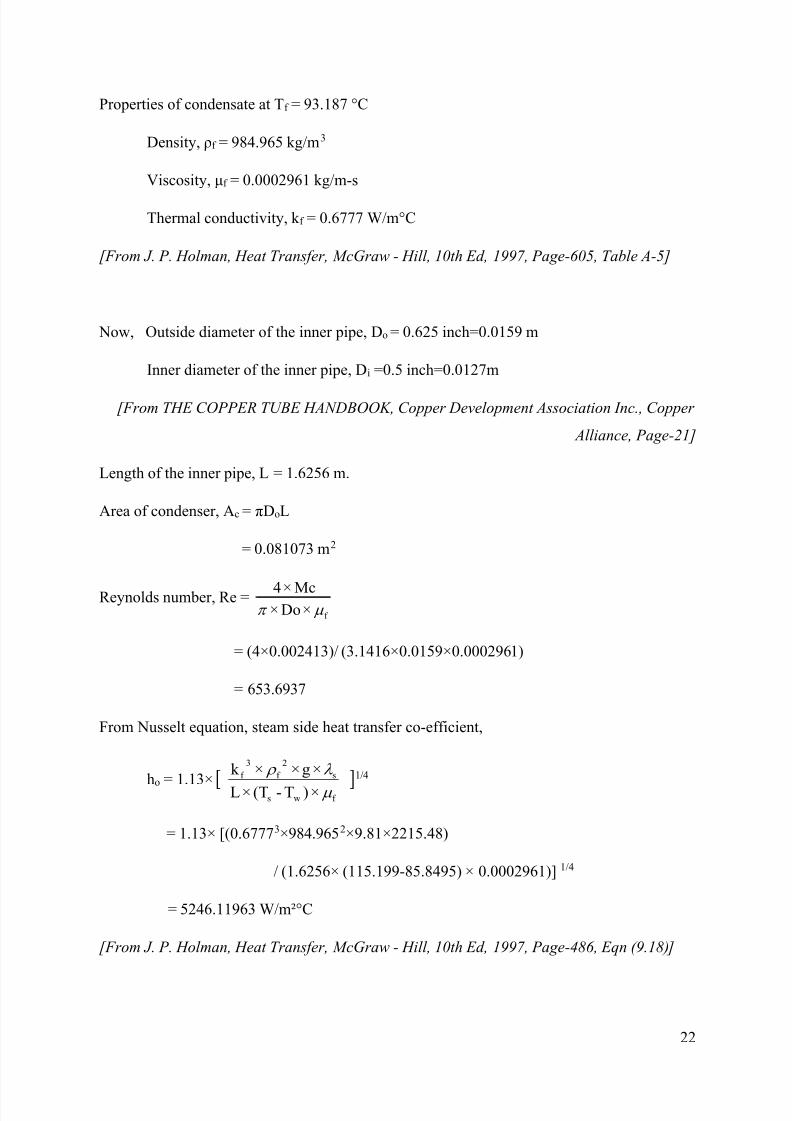
Properties of condensate at Tf = 93.187 °C
Density, ρf = 984.965 kg/m3
Viscosity, μf = 0.0002961 kg/m-s
Thermal conductivity, k f = 0.6777 W/m°C
[From J. P. Holman, Heat Transfer, McGraw - Hill, 10th Ed, 1997, Page-605, Table A-5]
Now, Outside diameter of the inner pipe, Do = 0.625 inch=0.0159 m
Inner diameter of the inner pipe, Di =0.5 inch=0.0127m
[From THE COPPER TUBE HANDBOOK, Copper Development Association Inc., Copper
Alliance, Page-21]
Length of the inner pipe, L = 1.6256 m.
Area of condenser, Ac = πDoL
= 0.081073 m2
Reynolds number, Re =f
×Do×
Mc×4
= (4×0.002413)/ (3.1416×0.0159×0.0002961)
= 653.6937
From Nusselt equation, steam side heat transfer co-efficient,
ho = 1.13× f ws
s
2
f
3
f
×)T-(T×L
×g××k
1/4
= 1.13× [(0.67773×984.9652×9.81×2215.48)
/ (1.6256× (115.199-85.8495) × 0.0002961)] 1/4
= 5246.11963 W/m²°C
[From J. P. Holman, Heat Transfer, McGraw - Hill, 10th Ed, 1997, Page-486, Eqn (9.18)]

8/12/2019 Study of Steam Condensation on a Single Vertical Tube
http://slidepdf.com/reader/full/study-of-steam-condensation-on-a-single-vertical-tube 24/27
23
LMTD =)}]T-(T-)T-[ln{(T
)]T-(T-)T-[(T
2s1s
2s1s
= [(115.199-29)-(115.199-84)]/[ln{(115.199-29)- (115.199-84)}]
= 54.1193 °C
Mean Rate of heat flow, Qm =2
)( QcQw
= 5.1175 KJ/s
= 5.1175 J/s
Overall heat transfer co-efficient, U= LMTD Ac
Qm
= 5.1175/ (0.081073 × 54.1193) W/m2. °C
= 1166.330 W/m2. °C
For distance from top of copper tube, z1=0.5m
Thickness of the condensate film, yf = [
g.hg.
Tw).z-(Tsk .4.2
f
1f f
f
] 1/4
= [{4x 0.0002961 x 0.6777 x (115.199-85.8495) x0.5}/ (9.81x 963.1572x2215480)] 1/4
= 0.0001537 m
[From J. P. Holman, Heat Transfer, McGraw - Hill, 10th Ed, 1997, Page-484, eqn (9.6)]
Local heat transfer co-efficient, hlocal = [1
32
)(4 z TwTs
k h g
f
f fg f
] 1/4
= [(9.81x963.1572x2215480x0.67773)/ {4x0.0002961 x (115.199-85.8495) x0.5}] 1/4
= 4408.1407 W/m2. °C
[From J. P. Holman, Heat Transfer, McGraw - Hill, 10th Ed, 1997, Page-484, eqn (9.7)]

8/12/2019 Study of Steam Condensation on a Single Vertical Tube
http://slidepdf.com/reader/full/study-of-steam-condensation-on-a-single-vertical-tube 25/27
24
For distance from top of copper tube, z2=1.0m
Thickness of the condensate film, yf = [
g.hg.
Tw).z-(Tsk .4.2
f
2f f
f
] 1/4
= [{4x 0.0002961 x 0.6777 x (115.199-85.8495) x1}/ (9.81x 963.1572x2215480)] 1/4
= 0.001828 m
[From J. P. Holman, Heat Transfer, McGraw - Hill, 10th Ed, 1997, Page-484, eqn (9.6)]
Local heat transfer co-efficient, hlocal = [2
32
)(4 z TwTs
k h g
f
f fg f
] 1/4
= [(9.81x963.1572x2215480x0.67773)/ {4x0.0002961 x (115.199-85.8495) x1}] 1/4
= 3706.7897 W/m2. °C
[From J. P. Holman, Heat Transfer, McGraw - Hill, 10th Ed, 1997, Page-484, eqn (9.7)]
For distance from top of copper tube, z3=1.5m
Thickness of the condensate film, yf = [
g.hg.
Tw).z-(Tsk .4.2
f
3f f
f
] 1/4
= [{4x 0.0002961 x 0.6777 x (115.199-85.8495) x1.5}/ (9.81x 963.1572x2215480)] 1/4
= 0.0002023 m
[From J. P. Holman, Heat Transfer, McGraw - Hill, 10th Ed, 1997, Page-484, eqn (9.6)]
Local heat transfer co-efficient, hlocal = [3
32
)(4 z TwTs
k h g
f
f fg f
] 1/4
= [(9.81x963.1572x2215480x0.67773)/ {4x0.0002961 x (115.199-85.8495) x1.5}] 1/4
= 3349.4626 W/m2. °C
[From J. P. Holman, Heat Transfer, McGraw - Hill, 10th Ed, 1997, Page-484, eqn (9.7)]

8/12/2019 Study of Steam Condensation on a Single Vertical Tube
http://slidepdf.com/reader/full/study-of-steam-condensation-on-a-single-vertical-tube 26/27
25
Results and discussions
From the calculated data, the experiment come to end with some findings and observations.
They are cited below:
(a) Overall heat transfer coefficients = 301.1789-1793.033 W/m2.°C
(b) Steam side heat transfer coefficient = 4713.383-5266.893 W/m2.°C.
Moreover, in this experiment we got that the Reynolds no varied from 213.527 to 1422.107.
The prandtl no range was between 1.677 and 2.108.
5 types of graphs for each 3 different steam pressures were plotted. From 1st type of plot, overall
heat transfer coefficient vs velocity of water it was seen that overall heat transfer coefficient
increased with increasing velocity.
From 2nd type of plot, film thickness vs distance from top it was seen that film thickness
increased with distance from the top of the vertical tube and from 3 rd type of plot, local heat
transfer coefficient vs distance from top, local heat transfer coefficient decreased for increasing
distance from top. Because film thickness is higher from top to bottom, and as a result heat
transfer coefficient decreased.
From 4th type of plot, heat load of water vs wall temperature it was seen that heat load decreased
in increasing order of wall temperature for 5 and 15 psig steam pressure and in 15 psig steam
pressure one data showed deviation.
For 5th type of plot, mass flow rate of water vs wall temperature. Mass flow rate of water
decreased with increasing wall temperature.
The provable reasons behind these deviations are discussed below:
One of the elementary need in this experiment was to set the steam pressure at constant. But it
was very difficult to set the steam pressure at constant as the pressure gauge oscillated all over
the experiment.
In the experiment the water flow rate was so not high enough. So it was difficult to take 5
different flow rates. More over the water flow situation was not steady. So the outlet
temperature which was taken might not be the correct one.
Also, there were heat losses due to conduction & radiation to the atmosphere and it affectedheat transfer calculation.
8/12/2019 Study of Steam Condensation on a Single Vertical Tube
http://slidepdf.com/reader/full/study-of-steam-condensation-on-a-single-vertical-tube 27/27
So from the above discussion we can say that our experiment was good enough to study the
vertical tube condensation and we could achieve a good result if a wide range of variation for
the steam and for the water flow were used.