Embed Size (px)
Citation preview

STUDY OF STATE‐SPONSORED SUBSIDIES FOR THE NEW JERSEY INDIVIDUAL MARKET Prepared for the New Jersey Department of Banking and Insurance
October 14, 2020
Tammy Tomczyk, FSA, MAAA, FCA Corryn Brown, FSA, MAAA Ryan Schultz, FSA, MAAA

Study of State‐Sponsored Subsidies for the New Jersey Individual Market
© Oliver Wyman
CONTENTS
1. Executive Summary ............................................................................................. 1
2. Introduction ......................................................................................................... 8
3. Data Sources and Oliver Wyman’s Healthcare Reform Microsimulation Model ... 9
4. Background and Key Modeling Considerations .................................................. 13
4.1. Federal Premium and Cost Sharing Subsidies ...................................................................... 13
4.2. Baseline 2021 Projections .................................................................................................... 15
4.3. Subsidy Scenarios Selected for Modeling ............................................................................ 16
4.4. Currently Uninsured Population .......................................................................................... 18
4.5. Key Modeling Assumptions .................................................................................................. 19
5. Modeling Results ............................................................................................... 21
5.1. Subsidy Structures That Provide a Fixed Dollar Per Member Per Month Subsidy .............. 21
5.2. Subsidy Structures That Reduce or Introduce an Applicable Percentage ........................... 23
5.3. Expected Impact on the State’s Reinsurance Program Cost ................................................ 26
5.4. Expected Additional Cost if Enrollment is Above Best Estimate Levels ............................... 29
5.5. Summary of Results ............................................................................................................. 31
6. Coverage Affordability ....................................................................................... 34
7. Final State Decision ............................................................................................ 40
8. Acknowledgement of Qualifications .................................................................. 42
9. Caveats and Limiting Conditions ........................................................................ 44
Appendix A. Fixed Dollar PMPM Subsidy Scenarios .................................................. 45
Appendix B. Applicable Percentage Subsidy Scenarios ............................................. 51
Appendix C. Reinsurance Sensitivity Testing Scenarios ............................................ 57
Appendix D. Comparison Premiums After State‐Sponsored Subsidies ...................... 58

Study of State‐Sponsored Subsidies for the New Jersey Individual Market
© Oliver Wyman
CONFIDENTIALITY
Our clients’ industries are extremely competitive, and the maintenance of confidentiality with respect to our clients’ plans and data is critical. Oliver Wyman rigorously applies internal confidentiality practices to protect the confidentiality of all client information.
Similarly, our industry is very competitive. We view our approaches and insights as proprietary and therefore look to our clients to protect our interests in our proposals, presentations, methodologies and analytical techniques. Under no circumstances should this material be shared with any third party without the prior written consent of Oliver Wyman.
© Oliver Wyman

Study of State‐Sponsored Subsidies for the New Jersey Individual Market
Executive Summary
© Oliver Wyman 1
1. EXECUTIVE SUMMARY Access to affordable health insurance coverage is a vital component to attracting a broad base of individuals and maintaining the stability of the New Jersey health insurance markets. The Affordable Care Act (ACA) currently makes advance premium tax credits (APTC) and cost sharing reduction (CSR) subsidies available to individuals and families with household incomes between 138% and 400% of the federal poverty level (FPL); however, many of those individuals still struggle to afford the resulting premiums in some cases. For individuals and families with household incomes equal to 400% FPL or greater, the ACA does not offer any financial assistance. Given one of the policy objectives associated with introducing a State‐sponsored subsidy program is to reduce the number of uninsured through making coverage more affordable, we reviewed and summarized the make‐up of the current uninsured population in New Jersey. This analysis showed that almost half of the non‐elderly uninsured population with household incomes greater than 138% FPL is comprised of individuals with household incomes between 200% and 399% FPL. Further, roughly 25% of that same uninsured population is comprised of individuals with household incomes between 138% and 199% FPL, which is a segment that represents individuals who may struggle to afford coverage as their household incomes rise above the level at which they qualify for Medicaid. Ultimately, the State of New Jersey (the State) is exploring various policy options aimed at increasing the affordability of health coverage in the Individual ACA market for both consumers who are currently eligible for federal financial assistance and those who are not. This report presents the results of a study focused on the possibility of New Jersey providing additional financial relief for consumers through State‐sponsored premium subsidies that would be provided in addition to and coordinate with the premium and cost‐sharing subsidies currently provided under the ACA. These State‐sponsored subsidies would be provided to individuals and families that enroll in coverage through the State‐based Exchange, Get Covered New Jersey. Get Covered New Jersey is New Jersey’s official health insurance Marketplace created pursuant to P.L.2019, c141, where individuals and families can easily shop for and buy coverage.
To perform our analyses, we utilized Oliver Wyman’s Healthcare Reform Microsimulation Model (HRM Model), a leading‐edge tool for analyzing the impact of various policy changes on health insurance markets. The HRM Model uses economic modeling that captures the flow of individuals across various markets based on their economic purchasing decisions and is integrated with actuarial modeling designed to assess the impact various reforms are anticipated to have on the health insurance markets. To complete our analyses we relied on a number of data sources that are described in detail in the report, including a data call issued to health insurance carriers offering coverage in New Jersey’s Individual ACA market for 2018, 2019 and 2020. This data allowed us to calibrate the HRM Model such that it replicates the purchasing behavior of New Jerseyans and replicates the number of individuals that are known to have enrolled in each market in the recent past, including at granular levels that represent key characteristics (e.g., by age range, household income range, etc.).
In order to assess the expected cost and projected increase in enrollment if State‐sponsored subsidies were introduced in the Individual ACA market, a baseline projection for 2021 absent any State‐sponsored subsidies was required. Using the calibrated version of Oliver Wyman’s HRM Model we modeled the expected enrollment by assuming 2021 premium levels which were projected using 2020 premium levels, information from carrier rate filings, and other known changes (e.g., changes in Exchange assessments between 2020 and 2021). In developing the projected 2021 baseline membership, we assumed that the requirement that New Jerseyans maintain minimum essential coverage or pay a financial penalty as required by New Jersey law remains in place, CSRs continue to not

Study of State‐Sponsored Subsidies for the New Jersey Individual Market
Executive Summary
© Oliver Wyman 2
be funded by the federal government, and that carriers continue to include a load in the premium rates for silver plans offered through the Exchange as a result.
In order to meet the State’s policy objectives for a State‐sponsored subsidy program twelve State‐sponsored subsidy scenarios were identified by Oliver Wyman to model. All of the scenarios chosen include subsidies that reduce premiums for certain cohorts of individuals and families. While we discussed the potential of modeling additional State‐sponsored cost sharing subsidies, several considerations were identified which led to the conclusion that State‐sponsored cost sharing subsidies were less likely to lead to an optimal solution for the State than premium subsidies would. These considerations included the value of a premium subsidy vs. a cost sharing subsidy to consumers, administrative expenses, technological constraints, and the corresponding risk to the State.
Table 1.1 below summarizes the general structure for each of the twelve subsidy scenarios that were modeled. Six of the scenarios provide a flat dollar PMPM subsidy while the other six place a limit on the maximum percentage of household income that an individual or family must pay for the second lowest cost silver premium plan available to them. The specific details for each scenario are presented within the report.
Table 1.1 State‐Sponsored Subsidy Scenarios Modeled
Subsidy Scenario Subsidy Structure Eligible Populations
2021 Target State Spending
FD400‐50 Fixed dollar subsidy per premium paying member per month
Individuals and families with household incomes up to 400% FPL
$50 Million
FD400‐100 Fixed dollar subsidy per premium paying member per month
Individuals and families with household incomes up to 400% FPL
$100 Million
FD400‐150 Fixed dollar subsidy per premium paying member per month
Individuals and families with household incomes up to 400% FPL
$150 Million
FD600‐50 Fixed dollar subsidy per premium paying member per month
Individuals and families with household incomes up to 600% FPL
$50 Million
FD600‐100 Fixed dollar subsidy per premium paying member per month
Individuals and families with household incomes up to 600% FPL
$100 Million
FD600‐150 Fixed dollar subsidy per premium paying member per month
Individuals and families with household incomes up to 600% FPL
$150 Million
FD400‐50 Reduces the Applicable Percentages Individuals and families with household incomes up to 400% FPL
$50 Million
AP400‐100 Reduces the Applicable Percentages Individuals and families with household incomes up to 400% FPL
$100 Million
AP400‐150 Reduces the Applicable Percentages Individuals and families with household incomes up to 400% FPL
$150 Million
AP600‐50 Reduces or introduces an Applicable Percentage
Individuals and families with household incomes up to 600% FPL
$50 Million
AP600‐100 Reduces or introduces an Applicable Percentage
Individuals and families with household incomes up to 600% FPL
$100 Million
AP600‐150 Reduces or introduces an Applicable Percentage
Individuals and families with household incomes up to 600% FPL
$150 Million
Study of State‐Sponsored Subsidies for the New Jersey Individual Market
Executive Summary
© Oliver Wyman 3
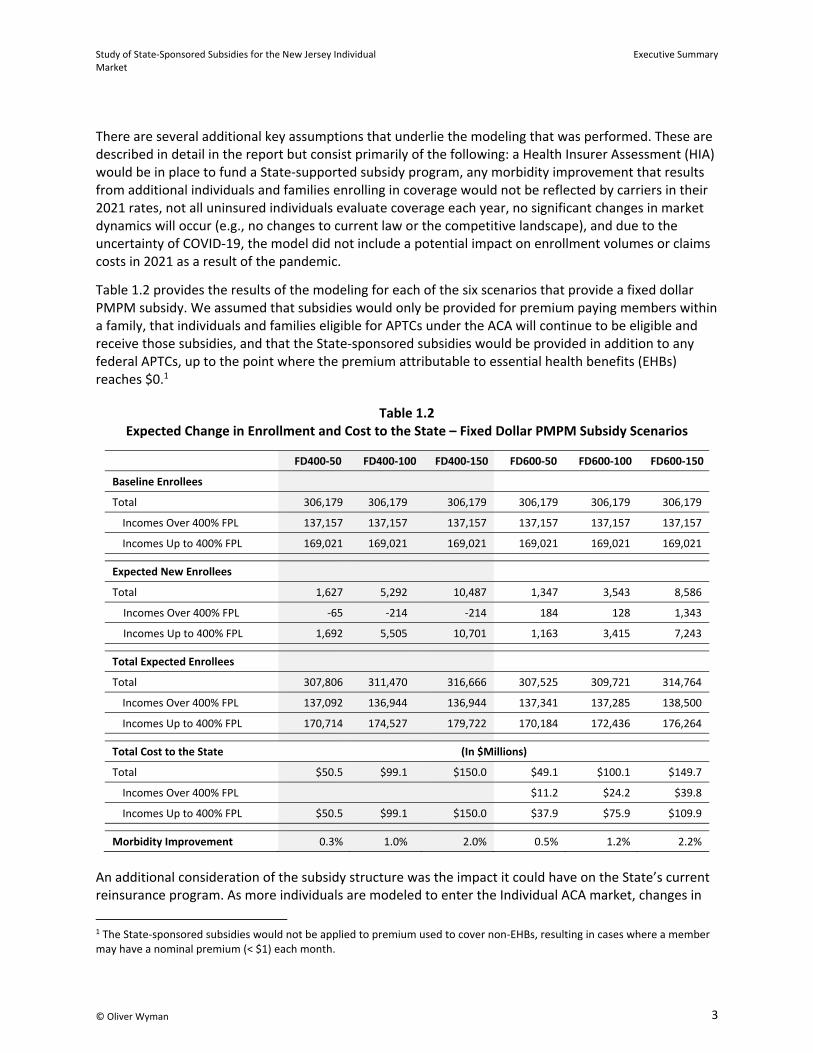
There are several additional key assumptions that underlie the modeling that was performed. These are described in detail in the report but consist primarily of the following: a Health Insurer Assessment (HIA) would be in place to fund a State‐supported subsidy program, any morbidity improvement that results from additional individuals and families enrolling in coverage would not be reflected by carriers in their 2021 rates, not all uninsured individuals evaluate coverage each year, no significant changes in market dynamics will occur (e.g., no changes to current law or the competitive landscape), and due to the uncertainty of COVID‐19, the model did not include a potential impact on enrollment volumes or claims costs in 2021 as a result of the pandemic.
Table 1.2 provides the results of the modeling for each of the six scenarios that provide a fixed dollar PMPM subsidy. We assumed that subsidies would only be provided for premium paying members within a family, that individuals and families eligible for APTCs under the ACA will continue to be eligible and receive those subsidies, and that the State‐sponsored subsidies would be provided in addition to any federal APTCs, up to the point where the premium attributable to essential health benefits (EHBs) reaches $0.1
Table 1.2 Expected Change in Enrollment and Cost to the State – Fixed Dollar PMPM Subsidy Scenarios
FD400‐50 FD400‐100 FD400‐150 FD600‐50 FD600‐100 FD600‐150
Baseline Enrollees
Total 306,179 306,179 306,179 306,179 306,179 306,179
Incomes Over 400% FPL 137,157 137,157 137,157 137,157 137,157 137,157
Incomes Up to 400% FPL 169,021 169,021 169,021 169,021 169,021 169,021
Expected New Enrollees
Total 1,627 5,292 10,487 1,347 3,543 8,586
Incomes Over 400% FPL ‐65 ‐214 ‐214 184 128 1,343
Incomes Up to 400% FPL 1,692 5,505 10,701 1,163 3,415 7,243
Total Expected Enrollees
Total 307,806 311,470 316,666 307,525 309,721 314,764
Incomes Over 400% FPL 137,092 136,944 136,944 137,341 137,285 138,500
Incomes Up to 400% FPL 170,714 174,527 179,722 170,184 172,436 176,264
Total Cost to the State (In $Millions)
Total $50.5 $99.1 $150.0 $49.1 $100.1 $149.7
Incomes Over 400% FPL $11.2 $24.2 $39.8
Incomes Up to 400% FPL $50.5 $99.1 $150.0 $37.9 $75.9 $109.9
Morbidity Improvement 0.3% 1.0% 2.0% 0.5% 1.2% 2.2%
An additional consideration of the subsidy structure was the impact it could have on the State’s current reinsurance program. As more individuals are modeled to enter the Individual ACA market, changes in
1 The State‐sponsored subsidies would not be applied to premium used to cover non‐EHBs, resulting in cases where a member may have a nominal premium (< $1) each month.

Study of State‐Sponsored Subsidies for the New Jersey Individual Market
Executive Summary
© Oliver Wyman 4
total membership volumes, the make‐up of that membership by income, and premium levels with a State‐sponsored subsidy program in place will all impact the pass‐through funding the State is expected to receive from the federal government. In particular, it should be noted that the increase in premium due to the HIA actually leads to an expected net decrease in the State’s cost for its reinsurance program. This result is explained in greater detail in the report.
Table 1.3 provides the results of the modeling for each of the six scenarios that either reduce or introduce an Applicable Percentage. The APTCs provided by the federal government to individuals and families with household incomes up to 400% FPL are determined using an Applicable Percentage and place a limit on the maximum percentage of household income that an individual or family must pay for the second lowest cost silver premium plan available to them. All six of the scenarios modeled reduce the Applicable Percentage assigned under the ACA to household income levels at or below 400% FPL, while three also introduce an Applicable Percentage for household income levels between 401% and 600% FPL.
Table 1.3 Expected Change in Enrollment and Cost to the State – Applicable Percentage Subsidy Scenarios
AP400‐50 AP400‐100 AP400‐150 AP600‐50 AP600‐100 AP600‐150
Baseline Enrollees
Total 306,179 306,179 306,179 306,179 306,179 306,179
Incomes Over 400% FPL 137,157 137,157 137,157 137,157 137,157 137,157
Incomes Up to 400% FPL 169,021 169,021 169,021 169,021 169,021 169,021
Expected New Enrollees
Total 1,986 6,249 12,221 2,249 4,856 8,796
Incomes Over 400% FPL ‐65 ‐214 ‐214 1,298 3,242 4,893
Incomes Up to 400% FPL 2,051 6,463 12,435 950 1,614 3,903
Total Expected Enrollees
Total 308,165 312,428 318,400 308,427 311,034 314,974
Incomes Over 400% FPL 137,092 136,944 136,944 138,456 140,399 142,050
Incomes Up to 400% FPL 171,072 175,484 181,456 169,972 170,635 172,924
Total Cost to the State (In $Millions)
Total $49.5 $99.2 $149.5 $49.7 $99.8 $150.0
Incomes Over 400% FPL $21.8 $54.5 $79.6
Incomes Up to 400% FPL $49.5 $99.2 $149.5 $27.9 $45.3 $70.4
Morbidity Improvement 0.3% 0.9% 1.8% 0.5% 1.2% 1.8%
Ultimately, the State will need to select a single subsidy structure should it move forward with providing State‐sponsored subsidies to members enrolling through Get Covered New Jersey. Each subsidy structure comes with a different level of expected enrollment and corresponding net cost to the State. Not only will the State need to determine which State‐sponsored scenarios under consideration it can afford, various scenarios with relatively the same cost to the State result in different levels of expected enrollment, as well as differences in level of financial support provided by age, household income and

Study of State‐Sponsored Subsidies for the New Jersey Individual Market
Executive Summary
© Oliver Wyman 5
family structure. It is likely that a single scenario may not meet all of the State’s policy objectives, and the competing interests of some scenarios will need to be weighed against each other.
The following conclusions can be drawn from Tables 1.2 and 1.3:
Scenarios that provide State‐sponsored subsidies to only individuals and families with household incomes at or below 400% FPL are expected to result in a net cost to the State that is less than the corresponding scenarios that extend State‐sponsored subsidies to individuals and families with household incomes at or below 600% FPL, when considering the reduction in reinsurance costs
The Applicable Percentage subsidy structures are expected to result in slightly higher total enrollment relative to the corresponding fixed dollar PMPM subsidy structure
If carriers were to reflect expected morbidity improvement in their 2021 rates, it would lead to rates that are approximately 0.3% to 2.2% lower than if morbidity improvement were not reflected, all else equal, with fixed dollar PMPM subsidy structures leading to larger expected improvement in morbidity than the corresponding subsidy structures providing a new/reduced Applicable Percentage benefit
Overall, the introduction of State‐sponsored premium subsidies will make health insurance coverage that is purchased through Get Covered New Jersey more affordable, for those individuals who are eligible. In addition to making the purchase of health insurance coverage more affordable for eligible individuals who are currently uninsured, the State‐sponsored premium subsidies are expected to make health insurance coverage more affordable for thousands of existing market enrollees. The subsidy structures were developed to ensure the post‐subsidized premiums align intuitively to the household income of enrollees; the post‐subsidized premium for households with lower incomes will typically be lower than households with higher incomes even though households with higher incomes may receive larger State‐sponsored subsidies. This is due to lower income households receiving federal subsidies in addition to the State‐sponsored subsidies, as discussed in this report. Table 1.5 provides the average projected monthly dollar value (on a per member basis) of the State‐sponsored premium subsidies for each scenario being considered:
Table 1.5 Average Projected State‐Sponsored Premium Subsidy PMPM
(For Individuals and Families Receiving State‐Sponsored Subsidies)
Subsidy Scenario Up to 400% FPL 401%‐600% FPL
FD400–50 $25 $0
FD400–100 $47 $0
FD400–150 $70 $0
FD600–50 $19 $39
FD600–100 $37 $65
FD600–150 $52 $90
AP400–50 $24 $0
AP400–100 $47 $0
AP400–150 $69 $0
AP600–50 $14 $221
AP600–100 $22 $256
AP600–150 $34 $280

Study of State‐Sponsored Subsidies for the New Jersey Individual Market
Executive Summary
© Oliver Wyman 6
An additional example of how the State‐sponsored premium subsidies will make health insurance coverage more affordable for eligible enrollees is demonstrated in Table 1.6 which shows the percentage of enrollees who are expected to have the ability to access coverage through a plan with a $02 premium for both the “Baseline” as well as for the various State‐sponsored premium subsidy structures which are being considered. As shown in each of the first four columns, all of the proposed State‐sponsored premium subsidy structures are projected to result in a larger percentage of current Individual ACA market enrollees having access to coverage through a plan with $02 premium than would otherwise be projected if there were no State‐sponsored subsidies. Among the scenarios being considered, Scenario FD400‐150 produces the highest overall of current Individual ACA market enrollees having access to coverage through a plan with $03 premium with approximately 43% of total enrollees, 95% of enrollees with household incomes between 0‐200% FPL, and 59% of enrollees with household incomes between 201‐400% FPL, having access to coverage through a plan with a $03 premium.
Table 1.6 Percentage of Current Enrollees with the Opportunity to Enroll in a Plan with $03 Premium
Subsidy Scenario 0%‐200% FPL 201%‐400% FPL Over 400% FPL Total
% of Total enrollees who can Access Coverage in a Plan with $03 Premium
without Losing Significant CSR Benefits4
Baseline 70% 15% 0% 23% 4%
FD400–50 84% 24% 0% 29% 7%
FD400–100 91% 42% 0% 36% 13%
FD400–150 95% 59% 0% 43% 20%
FD600–50 77% 22% 0% 27% 6%
FD600–100 86% 34% 0% 33% 10%
FD600–150 90% 48% 0% 38% 15%
AP400–50 87% 22% 0% 29% 6%
AP400–100 95% 34% 0% 35% 10%
AP400–150 99% 46% 0% 40% 16%
AP600–50 77% 19% 0% 26% 5%
AP600–100 82% 21% 0% 28% 6%
AP600–150 87% 29% 0% 31% 8%
Lastly, while each of the State‐sponsored subsidy structures being considered will make health insurance coverage more affordable for those individuals and families who are eligible to receive them,
2 $0 Premium refers to the portion of premium attributable to EHBs; enrollees may still be required to pay a nominal premium (< $1) for benefits beyond EHBs. 3 $0 Premium refers to the portion of premium attributable to EHBs; enrollees may still be required to pay a nominal premium (< $1) for benefits beyond EHBs. 4 While a relatively substantial percentage of enrollees will have access to a plan with $0 premium under the State‐sponsored
subsidy scenarios, individuals and families with household incomes below 200% FPL are eligible to receive significant cost sharing subsidies in addition to their federal premium subsidies which are only available if those individuals and families enroll in a silver metal plan, and in many cases the plan available to them with a $0 premium is a bronze plan.

Study of State‐Sponsored Subsidies for the New Jersey Individual Market
Executive Summary
© Oliver Wyman 7
additional consideration should also be made with respect to how the various structures could improve the affordability of coverage for eligible enrollees who have certain characteristics more than others. These dynamics are discussed in greater detail within the report.

Study of State‐Sponsored Subsidies for the New Jersey Individual Market
Introduction
© Oliver Wyman 8
2. INTRODUCTION Access to affordable health insurance coverage is a vital component to attracting a broad base of individuals and maintaining the stability of the New Jersey health insurance markets. The Affordable Care Act (ACA) provides advance premium tax credits (APTC) for individuals and families with household incomes at or below 400% of the federal poverty level (FPL) and requires carriers to reduce cost sharing and out‐of‐pocket maximums for individuals and families with household incomes at or below 250% FPL (down to the Medicaid income threshold, or 100% FPL if not eligible for Medicaid). Even so, many of those individuals and families still struggle to afford the resulting premiums. This is evidenced by the fact that nearly 70% of the non‐elderly uninsured individuals with household incomes above 138% of FPL in New Jersey also have household incomes below 400% FPL. Additionally, the ACA does not provide any financial relief to households with incomes above 400% FPL. Further, even though households with incomes below 400% FPL are technically eligible for APTCs, not all individuals actually receive one, in particular those at younger ages and incomes closer to 400% FPL; those who do receive one still struggle to afford the resulting premiums in some cases.
As a result, the State of New Jersey (the State) engaged Oliver Wyman Actuarial Consulting, Inc. (Oliver Wyman) to assist the Department of Banking and Insurance (DOBI) in exploring various policy options aimed at increasing the affordability of health coverage in the Individual ACA market for both consumers who are currently eligible for federal financial assistance and those who are not, and to reduce disruptions in coverage for consumers who become ineligible for Medicaid or federal subsidies due to changes in household income, or for other reasons.
This report presents the results of the first of these studies, focused on the possibility of New Jersey providing additional financial relief for consumers by providing State‐sponsored premium and/or cost sharing subsidies that are in addition to and coordinate with those provided under the ACA.5 These subsidies would be provided to individuals and families that enroll in Individual ACA coverage through Get Covered New Jersey, New Jersey’s official health insurance Marketplace created pursuant to P.L.2019, c141, where individuals and families can easily shop for and buy coverage. In addition, this report includes:
Sensitivity testing around the State’s cost for the provided subsidies should a substantial increase in outreach, as well as other advertising and promotional activities, lead to an additional segment of currently uninsured individuals evaluating for coverage in 2021 and
A discussion of increased affordability provided to individuals currently enrolled in New Jersey’s Individual ACA market as a result of the State‐sponsored subsidies being considered.
It is important to note that Oliver Wyman is not engaged in the practice of law and this report, which may include commentary on legal issues and regulations, does not constitute, nor is it a substitute for, legal advice. Accordingly, Oliver Wyman recommends that DOBI secure the advice of competent legal counsel with respect to any legal matters related to this report or otherwise.
This report is intended to be read and used as a whole and not in parts. Separation or alteration of any section or page from the main body of this report is expressly forbidden and invalidates this report.
5 Funding of cost sharing reductions through payments to carriers were discontinued after October 2017, however carriers are still required to offer these reduced levels of cost sharing to consumers.

Study of State‐Sponsored Subsidies for the New Jersey Individual Market
Data Sources and Oliver Wyman’s Healthcare ReformMicrosimulation Model
© Oliver Wyman 9
3. DATA SOURCES AND OLIVER WYMAN’S HEALTHCARE REFORM MICROSIMULATION MODEL
In this section we provide an overview of Oliver Wyman’s Healthcare Reform Microsimulation Model (HRM Model) and a discussion of the various data sources that we relied on for our analyses. The HRM Model is a leading‐edge tool for analyzing the impact of various healthcare reforms and proposed legislation. Economic modeling that captures the flow of individuals across various markets based on their economic purchasing decisions is integrated with actuarial modeling designed to assess the impact various reforms are anticipated to have on the health insurance markets.
The utility functions that underlie the HRM Model can be calibrated to a particular geography and set of rules such that the model replicates the number of individuals that are known to have enrolled in each market in the recent past. The various parameters of the HRM Model’s utility functions can then be further adjusted until the model also projects enrollment that is consistent with key characteristics of the actual market enrollment for each year (e.g., by age range, household income range, etc.). A description of twelve subsidy scenarios that were modeled using the HRM Model, and a summary of the results, are presented in subsequent sections of this report. The results reflect point estimates of the expected cost and enrollment associated with State‐sponsored subsidies in 2021, and the point estimates represent our best estimate based on the information made available for the analysis. There is significant uncertainty with respect to future enrollment and premiums in the health insurance markets, and actual experience will likely differ from that which is being modeled in this analysis. This is particularly important to note since the timeframe for completing the modeling did not allow for, nor do our results consider, the potential impact that the COVID‐19 pandemic may have on the various insurance markets in 2021.
In completing our analysis, we reviewed information from a variety of sources. The primary basis for developing the New Jersey population that underlies the HRM Model is data from the American Community Survey (ACS). The ACS data provides detailed information for each individual in a surveyed household unit, including demographic, socioeconomic, geographic, and employment information. The data also provides information regarding health insurance coverage type(s) held by each individual within the household unit. The ACS data was supplemented and synthesized with several other data sources, including but not limited to information from a carrier data call.
In February of 2020, the New Jersey Department of Banking and Insurance issued a data call to health insurance carriers offering coverage in New Jersey’s Individual ACA market for the 2018, 2019 and 2020 plan years in order to collect detailed information for that market that could aid in calibrating the HRM Model to the New Jersey Individual ACA market. The data that was requested included detailed premium, claims, and enrollment information from January 2018 through January 2020. This data call was conducted to support work completed by Oliver Wyman in March of this year to assist the State in establishing parameters for its reinsurance program in 2021. Due to the timeline under which this project needed to be completed, it did not allow for updated data to be collected. Since it was determined that the data previously collected in February of 2020 was valid for this project, we relied on the previously collected data. To further validate the use of this data, we received updated membership information from DOBI for the Individual ACA market as of March 2020; that information resulted in updated calendar year 2020 membership projections that aligned very closely with those previously developed.

Study of State‐Sponsored Subsidies for the New Jersey Individual Market
Data Sources and Oliver Wyman’s Healthcare ReformMicrosimulation Model
© Oliver Wyman 10
The carrier provided data was further augmented with information from a number of other sources, including but not limited to:
2018 and 2019 statutory financial statements submitted by carriers in New Jersey’s health insurance markets
2018 medical loss ratio (MLR) data
2018 and 2019 Marketplace enrollment public use files and effectuated enrollment reports
2019 and 2020 Open Enrollment snapshot reports
U.S. Census Bureau data
2018 final and 2019 interim summary reports on risk adjustment transfers
Characteristics of the uninsured population in New Jersey from the Kaiser Family Foundation
National CPI and CMS Personal Health Care Price Index projections
2018, 2019, and 2020 rate filing information (e.g., Unified Rate Review Template data)
2018, 2019, and 2020 Marketplace premium rates These additional data sources were utilized to determine the overall average annual enrollment volumes in the Individual ACA market for each of 2018, 2019, and 2020 to validate the carrier data which was provided (e.g., average premiums PMPM), and to gather additional information utilized in our modeling but not captured through the carrier data call (e.g., the distribution of individuals enrolling through the FFM, including by household income range). Health status was assigned to various sub‐populations within the HRM Model based on a statistical analysis of self‐reported health status data by coverage type, obtained from the Current Population Survey (CPS). The CPS data provides the starting assumptions for the population morbidity, because the data includes a self‐reported health status indicator as well as fields classifying income, age, gender, geography, coverage type, and other categories. Respondents to the survey classify their health into one of five categories: excellent, very good, good, fair and poor. The model reflects these classifications numerically by assigning a morbidity load to each category. Information from the Agency for Health Care Research and Quality’s Medical Expenditure Panel Survey (MEPS) data was used to simulate the New Jersey employer‐based market. MEPS identifies key statistics for the employer‐based market for every state by group size, including employer offer rates, employee take‐up rates, and self‐funding rates among employers. Individuals in the ACS data identified as working for private employers were categorized into employer group size segments (e.g., small employer groups) based on the distribution of employees by group size according to MEPS. Additionally, the MEPS data was used to determine the number of individuals enrolled in self‐funded plans to estimate the total size of the employer‐based market. MEPS data was further used to inform our estimates of employer offer rates and self‐funding rates. The HRM Model assumes a “steady” state population beyond 2020. This means the overall distribution by income, health status, employer size, and family composition of the population being modeled is not expected to change significantly. This also means the HRM Model output assumes there will be no significant carrier entries or exits, and there will be no significant legislative changes at the State or federal level that would impact the insurance markets. Additional adjustments were applied to the model results to reflect anticipated population growth within the State of New Jersey. The population

Study of State‐Sponsored Subsidies for the New Jersey Individual Market
Data Sources and Oliver Wyman’s Healthcare ReformMicrosimulation Model
© Oliver Wyman 11
growth adjustments were developed based on recent historical population growth data provided by the U.S. Census Bureau. Average claim costs were calibrated and adjusted on an overall basis using information provided in the carrier data call, statutory financial statements, and from other public data sources. For 2020 and 2021, claim costs within the HRM Model were trended forward assuming an average annual claims trend rate equal to 8.5%. This assumption was informed by our review of information from carrier rate filings for 2020. Actual lowest‐cost premium rates for New Jersey’s Individual ACA market in 2018, 2019, and 2020 were utilized within the HRM Model. Premium rates for 2021 were projected6 by making the following adjustments to the 2020 premium rates:
Increased premiums 8.5% to reflect application of medical trend
Removal of the ACA Health Insurer Fee by making carrier specific adjustments based on the amount each carrier included in their 2020 premium rates7
Carrier specific adjustments to reflect a change in exchange user fees between 2020 and 2021 which represents:
o No change for policies issued through the Exchange as carriers are assessed a 3.5% fee in 2020 and will be assessed a 3.5% fee in 2021 for those policies
o An increase in the assessment for policies issued outside of the Exchange from 1.0% in 2020 to 3.5% in 2021
If the final approved 2021 premium rates are lower than projected in the modeling, the flat dollar subsidy scenarios would be expected to result in even lower costs to enrollees and, consequently, potential increases in enrollment. Alternatively, if the final approved 2021 premium rates are higher than projected in the modeling, the flat dollar subsidy scenarios would be expected to result in higher costs to enrollees than are currently projected and potentially lower membership. Under the Applicable Percentage subsidy scenarios, the subsidy amounts are calculated such that the resulting net premium amount an eligible individual or family is responsible for is no more than a specified percentage of their household income; therefore, subsidies under the Applicable Percentage scenarios would fluctuate to the extent the final approved 2021 premium rates vary from projections (i.e., higher premiums result in higher than projected subsidies) and differences between the final approved 2021 premium rates and those being projected in the modeling would be expected to be less impactful on overall enrollee costs than under the flat dollar subsidy scenarios.
Member cost sharing and incurred claims were calculated by the HRM Model, with the assumed annual limitation on cost sharing indexed for inflation each year according to federal regulations using the most recent projections based on National Health Expenditure Data (NHED), as published by the Centers for Medicare and Medicaid Services (CMS).
Federal premium tax credits for eligible Individual ACA market enrollees were assumed to change each year based on premium changes associated with the second lowest cost silver plan available in each
6 At the time of modeling, final 2021 rates were not known. The final average rate change for the individual market is 3.3% in 2021. 7 The Tax Cuts and Jobs Act eliminated the Health Insurer Fee for calendar years beginning after December 31, 2020.

Study of State‐Sponsored Subsidies for the New Jersey Individual Market
Data Sources and Oliver Wyman’s Healthcare Reform Microsimulation Model
© Oliver Wyman 12
county and changes in the Applicable Percentage Tables. The Applicable Percentage Tables, while known for 2018 through 2020, were estimated for 2021 according to the methodology outlined by the Internal Revenue Service (IRS).8 Premium and income growth rates utilized in developing the Adjustment Ratio that was applied to the projected Applicable Percentage Tables were based on the most recent projections based on National Health Expenditures. Additional key assumptions which were incorporated into the HRM Model include the following: cost sharing reduction (CSR) subsidies will continue to be unfunded by the federal government and carriers will continue to load premiums for their silver plans by an amount equal to the lost CSR payments, carrier plan and network offerings will be similar to those available to consumers in 2020, carrier pricing assumptions such as for trend will be similar to those used in 2020, there will be no significant carrier entries or exits, and there will be no additional significant legislative changes at either the State or federal level.
As previously noted, at this time, it is too early to know with certainty how the COVID‐19 pandemic will impact the health insurance markets. Given the significant economic contraction that has occurred, significant changes are likely to occur in the health insurance markets, and if a significant portion of individuals and families lose access to employer sponsored coverage, enrollment in the Individual ACA market may increase significantly relative to our projections. If this were to occur, our estimates of the State’s cost for the subsidies being considered would likely be understated, and potentially significantly.
8 https://www.irs.gov/pub/irs‐drop/rp‐19‐29.pdf and https://www.irs.gov/pub/irs‐drop/rp‐14‐37.pdf

Study of State‐Sponsored Subsidies for the New Jersey Individual Market
Background and Key Modeling Considerations
© Oliver Wyman 13
4. BACKGROUND AND KEY MODELING CONSIDERATIONS
4.1. Federal Premium and Cost Sharing Subsidies As previously noted, the ACA provides APTCs to individuals and families with household incomes at or below 400% FPL and requires health carriers to reduce cost sharing and out‐of‐pocket maximums for individuals and families with household incomes at or below 250% FPL, down to the Medicaid income threshold (or 100% FPL for individuals that are not eligible for Medicaid). In order for eligible individuals and families to access these subsidies, they must enroll in a plan through the Exchange (federal or state‐based); further, they must enroll in silver level coverage in order to receive the benefit of CSR subsidies.
The level of APTC that an eligible individual or family receives is based on a sliding scale, with greater amounts available to those with lower household incomes. In determining the APTC that an eligible individual or family will receive, household incomes at or below 400% FPL are first assigned an Applicable Percentage of household income which, when multiplied times the annual household income ,represents the Maximum Annual Premium the household is required to pay if enrolled in the silver level plan with the second lowest cost premium among all silver level plans available to the household, commonly referred to as the second lowest cost silver premium (SLCSP) plan. Within a given state, note that the Maximum Annual Premium does not vary based on the age(s) of the individual or family members, only household income and family size.
The APTC is then calculated as the difference between the premium attributable to EHBs associated with the SLCSP plan specific to the age(s) of the individual or family members, and the Maximum Annual Premium, capped such that the resulting premium rate can be no less than $0. If an individual or family that is eligible for APTCs wishes to enroll in a plan other than the SLCSP plan, they may apply their APTC toward reducing the premium of the plan they enroll in. Therefore, while older individuals and families will have the same Maximum Annual Premium as a younger family with the same household income, the older family will be eligible for a larger APTC due to having a higher premium associated with the SLCSP plan.
Chart 4.1 demonstrates graphically the published Applicable Percentages for calendar year 2020.
Chart 4.1 2020 Applicable Percentages
0%
2%
4%
6%
8%
10%
12%
0% 100% 200% 300% 400%
Applicable Percentage
Household Income as a Percent of FPL

Study of State‐Sponsored Subsidies for the New Jersey Individual Market
Background and Key Modeling Considerations
© Oliver Wyman 14
The Applicable Percentages are updated and published by the IRS each year but have not yet been published for 2021 yet. Therefore, as previously noted, we estimated the 2021 Applicable Percentages according to the methodology outlined by the IRS.
To provide an understanding of the maximum premium that individuals and families at different household income levels must pay for the SLCSP plan, Table 4.1 presents the household income that would be earned by an individual or a family at different family sizes and FPL levels in 2020, Table 4.2 presents Oliver Wyman’s estimate of the Applicable Percentages for 2021, and Table 4.3 presents the maximum monthly premium those individuals or families would be required to pay for the SLCSP plan. 9
Table 4.1 Household Income by 2020 FPL Levels and Family Size
Family Size 138% 150% 200% 250% 300% 350% 400%
1 $17,609 $19,140 $25,520 $31,900 $38,280 $44,660 $51,040
2 $23,791 $25,860 $34,480 $43,100 $51,720 $60,340 $68,960
3 $29,974 $32,580 $43,440 $54,300 $65,160 $76,020 $86,880
4 $36,156 $39,300 $52,400 $65,500 $78,600 $91,700 $104,800
Table 4.2 Estimated 2021 Applicable Percentages
138% 150% 200% 250% 300% 350% 400%
3.09% 4.13% 6.50% 8.30% 9.79% 9.79% 9.79%
Table 4.3 Estimated 2021 Maximum Monthly Premium for SLCSP Plan
Family Size 138% 150% 200% 250% 300% 350% 400%
1 $45 $66 $138 $221 $312 $364 $417
2 $61 $89 $187 $298 $422 $492 $563
3 $77 $112 $235 $376 $532 $620 $709
4 $93 $135 $284 $453 $641 $748 $855
Under the current federal premium subsidy structure, there may be significant differences in the premium rate paid by an individual or family with a household income at or slightly below 400% FPL versus a household with an income just above 400% FPL. This phenomenon is commonly referred to as the “subsidy cliff.” For example, a family of four with an annual household income of $104,500 (which is equal to approximately 399% FPL) would pay a maximum monthly premium rate of $855 for the SLCSP plan in the example above. However, if the monthly gross premium rate for the SLCSP for a similar
9 Per statute, prior year FPL guidelines are used to determine premium subsidies for a given benefit year since FPL guidelines for a given benefit year are not made available until after the open enrollment period. Therefore, 2020 FPL guidelines will be used to determine eligibility for APTCs and CSRs for the 2021 plan year.

Study of State‐Sponsored Subsidies for the New Jersey Individual Market
Background and Key Modeling Considerations
© Oliver Wyman 15
family of four with an annual household income of $105,000 (approximately 401% FPL) was $1,600, that family would pay a monthly premium significantly more than $855 as they would not be eligible for APTCs.
In addition to APTCs, individuals or families with household incomes at or below 250% FPL, down to the Medicaid income threshold (or 100% FPL for individuals that are not eligible for Medicaid), are also eligible for CSR subsidies, as long as they enroll in a silver plan through the Exchange. The cost sharing subsidies work to reduce the level of deductibles, coinsurance and/or copayments relative to the levels underlying the silver plan they enroll in; maximum out‐of‐pocket limits are also reduced.
The level to which cost sharing is reduced depends on the individual’s or family’s household income. Silver level coverage is defined as coverage with an actuarial value of 0.70.10 This means that, on average, the plan will cover 70% of a member’s medical expenses with the member covering the remaining 30% through deductibles, coinsurance, and copayments. The actual split between the portion covered by the plan and the member for a given individual will vary based on the level of an individual’s actual claims. Individuals and families that qualify for CSRs are provided reduced cost sharing through plans with an actuarial value that varies by household income as shown in Table 4.4.
Table 4.4 Actuarial Value of Reduced Cost Sharing Plans
Household Income
Actuarial
Value
Average Member
Cost Share
100 – 150% FPL 0.94 6%
151 – 200% FPL 0.87 13%
200 – 250% FPL 0.73 27%
4.2. Baseline 2021 Projections In order to assess the expected cost and projected increase in enrollment if State‐sponsored subsidies were introduced in the Individual ACA market, a baseline projection for 2021 absent any State‐sponsored subsidies was required. Using the calibrated version of Oliver Wyman’s HRM Model as described in Section 3, we modeled the expected enrollment in 2021 assuming the premium levels calculated as previously described.
In developing the projected 2021 baseline membership, we assumed that the requirement that New Jerseyans maintain minimum essential coverage or pay a financial penalty as required by New Jersey law remains in place. In addition, we assumed that CSRs continue to not be funded by the federal government, and that carriers continue to include a load in the premium rates for silver plans offered through the Exchange as a result. Chart 4.2 presents actual enrollment in New Jersey’s Individual ACA market in 2017 through 2019, and the projected baseline enrollment in 2020 and 2021, split between members with household incomes at or below 400% FPL and members with household incomes of 401% FPL or greater.
10 Through federal regulation, a de minimis range has been established such that a plan with an actuarial value falling in the range of 0.66 – 0.72 is considered to meet the requirements of silver level coverage.

Study of State‐Sponsored Subsidies for the New Jersey Individual Market
Background and Key Modeling Considerations
© Oliver Wyman 16
Chart 4.2 Baseline Enrollment by Year
4.3. Subsidy Scenarios Selected for Modeling In order to meet the State’s policy objectives for a State‐sponsored subsidy program twelve State‐sponsored subsidy scenarios were identified to model. All of the scenarios chosen include subsidies that reduce premiums for certain cohorts of individuals and families. Consideration was given to modeling additional State‐sponsored cost sharing subsidies for individuals and families at lower household income levels that supplement those already provided by the federal government or introducing subsidies that reduce cost sharing for certain individuals and families with household incomes above 250% FPL. However, several items were identified which led to the conclusion that State‐sponsored cost sharing subsidies were less likely to lead to an optimal solution for the State than premium subsidies would. These items included but are not limited to:
Subsidies that reduce premiums are generally attractive and provide a benefit to all individuals and families that have household incomes at levels that make them eligible, whereas subsidies that reduce cost sharing are typically viewed as most valuable to those individuals with health conditions that could lead to claims but less valuable to individuals in good health with low or no expected claims
Providing State‐sponsored cost sharing subsidies has the potential to result in significant administrative costs relative to the cost of administering premium subsidies, such as needing to determine and reconcile cost sharing payments owed to carriers as well as performing audits of the information submitted to the State to support such payments
Cost sharing subsidies introduce more financial risk to the State than premium subsidies as the level of cost sharing subsidy for a given insured individual of family will vary with actual incurred claim amounts while a premium subsidy for the individual or family is established at the beginning of each plan year and would not be expected to change throughout the year for most individuals.
151 133 137 137 137
191180 166 168 169
0
50
100
150
200
250
300
350
400
2017 Actual 2018 Actual 2019 Actual 2020Modeled
2021Modeled
Enrollm
ent (in thousands)
401%+ FPL At or Below 400% FPL

Study of State‐Sponsored Subsidies for the New Jersey Individual Market
Background and Key Modeling Considerations
© Oliver Wyman 17
Premium subsidies give individuals and families that find more value in reducing their cost sharing the option to use the subsidy to fund the cost of any additional premium associated with moving to a richer benefit plan (i.e., one with lower cost sharing) in lieu of reducing the premium for the plan they are currently enrolled in. This flexibility empowers the consumer in that they can choose between lower premium or lower cost sharing as best fits their own personal needs.
Table 4.5 below summarizes the general structure for each of the twelve subsidy scenarios that were modeled. The specific details for each scenario are presented in Section 5, along with the modeling results.
Table 4.5 State‐Sponsored Subsidy Scenarios Modeled
Subsidy Scenario Subsidy Structure Eligible Populations
2021 Target State Spending
FD400‐50 Fixed dollar subsidy per premium paying member per month
Individuals and families with household incomes up to 400% FPL
$50 Million
FD400‐100 Fixed dollar subsidy per premium paying member per month
Individuals and families with household incomes up to 400% FPL
$100 Million
FD400‐150 Fixed dollar subsidy per premium paying member per month
Individuals and families with household incomes up to 400% FPL
$150 Million
FD600‐50 Fixed dollar subsidy per premium paying member per month
Individuals and families with household incomes up to 600% FPL
$50 Million
FD600‐100 Fixed dollar subsidy per premium paying member per month
Individuals and families with household incomes up to 600% FPL
$100 Million
FD600‐150 Fixed dollar subsidy per premium paying member per month
Individuals and families with household incomes up to 600% FPL
$150 Million
FD400‐50 Reduces the Applicable Percentages
Individuals and families with household incomes up to 400% FPL
$50 Million
AP400‐100 Reduces the Applicable Percentages
Individuals and families with household incomes up to 400% FPL
$100 Million
AP400‐150 Reduces the Applicable Percentages
Individuals and families with household incomes up to 400% FPL
$150 Million
AP600‐50 Reduces or introduces an Applicable Percentage
Individuals and families with household incomes up to 600% FPL
$50 Million
AP600‐100 Reduces or introduces an Applicable Percentage
Individuals and families with household incomes up to 600% FPL
$100 Million
AP600‐150 Reduces or introduces an Applicable Percentage
Individuals and families with household incomes up to 600% FPL
$150 Million

Study of State‐Sponsored Subsidies for the New Jersey Individual Market
Background and Key Modeling Considerations
© Oliver Wyman 18
4.4. Currently Uninsured Population Given one of the policy objectives associated with introducing a State‐sponsored subsidy program is to reduce the number of uninsured through making coverage more affordable, we reviewed and summarized the make‐up of the current uninsured population in New Jersey. Charts 4.3 and 4.4 present distributions by household income and age for New Jersey residents that are under the age of 65, currently uninsured, and with household incomes that are above the limit that makes them eligible for Medicaid. Chart 4.3 shows that almost half of the non‐elderly uninsured population with household incomes greater than 138% FPL is comprised of individuals with household incomes between 200% and 399% FPL. Further, roughly 25% of that same uninsured population is comprised of individuals with household incomes between 138% and 199% FPL, which represents individuals that may struggle to afford coverage as their household incomes rise above the level at which they qualify for Medicaid. Please note that, in reviewing Chart 4.4, the age ranges shown are not consistent (i.e., the number of ages included within each range shown can vary).
Chart 4.3 New Jersey Non‐Elderly Uninsured Population by Household Income
0%
5%
10%
15%
20%
25%
30%
35%
40%
45%
50%
138% ‐ 199% 200% ‐ 399% 400% ‐ 599% 600% +
Percent of Uninsured Individuals
Household Income as a Percent of FPL

Study of State‐Sponsored Subsidies for the New Jersey Individual Market
Background and Key Modeling Considerations
© Oliver Wyman 19
Chart 4.4 New Jersey Non‐Elderly Uninsured Population by Age
4.5. Key Modeling Assumptions In addition to those assumptions already noted, there are several additional key assumptions that underlie the modeling of the various subsidy structures. These include the following:
• Morbidity Improvement ‐ No morbidity improvement was assumed to be reflected by the carriers in the development of their 2021 premium rates as a result of an increase in enrollment and improved morbidity in the single risk pool due to the presence of new state subsidies.
• Implementation of New Jersey Health Insurer Assessment – Under each scenario targeting $150M in subsidy costs to the State, the Health Insurer Assessment (HIA) was assumed to be 2.75%; under each scenario targeting $100M in subsidy costs to the State the HIA was assumed to be 2.50%; and under each scenario targeting $50M in subsidy costs to the State, the HIA was assumed to be 2.00%.11
• Uninsured Propensity to Evaluate for Coverage – Through the process of calibrating Oliver Wyman’s HRM Model, it was estimated that roughly 15% of the uninsured population in New Jersey evaluates for coverage each year and some portion of those individuals and families may take up insurance coverage through the Individual ACA market. That is, on a year‐to‐year basis, only a portion of the uninsured population will even assess whether purchasing health insurance coverage results in a better economic value for them than remaining uninsured.
• Estimated State Cost Excludes Potential Change in Cost to Reinsurance Program – The estimated State cost that is shown for each scenario reflects only the cost related to providing the specified State‐sponsored premium subsidies, and does not incorporate any impact the presence of State‐sponsored subsidies may have on the cost of the State’s reinsurance program (e.g., due to changing enrollment) that was established under the Section 1332 Waiver; an estimate of the impact that the
11 As the HIA is a continuation of the recently repealed federal Health Insurer Fee (HIF), similar to the historical impact of the HIF, the modeled premiums incorporate the applicable HIA percentage under each scenario.
0%
5%
10%
15%
20%
25%
30%
35%
< 26 27‐29 30‐34 35‐39 40‐44 45‐49 50‐54 55‐59 60‐64
Percent of Uninsured Individuals
Age
Study of State‐Sponsored Subsidies for the New Jersey Individual Market
Background and Key Modeling Considerations
© Oliver Wyman 20
presence of state subsidies may have on the State’s cost of its reinsurance program is provided separately for each scenario.
• COVID‐19 Assumptions for 2021 – No explicit assumptions were made related to the impact that COVID‐19 may have on enrollment volumes or claim costs in 2021.
• Current Law – Results have been developed assuming current law will remain in force.
• No Significant Changes in Market Dynamics are Assumed – For example, it was assumed that there will be no changes in the competitive landscape, CSR funding, or to the State’s reinsurance program’s objective under its approved Section 1332 Waiver.
• Fixed Dollar PMPM Subsidies – In the scenarios that utilize fixed dollar PMPM subsidies, it was assumed that subsidies will only be provided to individuals and family members for which a premium is required to be paid.
• On‐Exchange Enrollment – It was assumed that if an individual has the opportunity to enroll in a plan through the Exchange at a lower premium rate than could otherwise be purchased outside of the Exchange (e.g., due to State‐sponsored subsidies which are available), they will do so.

Study of State‐Sponsored Subsidies for the New Jersey Individual Market
Modeling Results
© Oliver Wyman 21
5. MODELING RESULTS In this section we provide the results of the various modeling performed for the twelve different scenarios requested by DOBI. We introduce the detail related to the subsidies that would be provided to individuals and families enrolling through Get Covered New Jersey, first under the set of subsidy structures that would be administered on a fixed dollar PMPM subsidy basis and then the set of subsidy structures that reduce or introduce an Applicable Percentage of household income that serve to cap on the amount of premium an individual or family would be required to pay for the SLCSP plan available to them.
For each scenario, we provide the modeled change in membership, the expected cost to the State, and the expected improvement in morbidity of the single risk pool. Given the introduction of State‐sponsored subsidies would be expected to have an impact on the cost of the State’s reinsurance program, we then provide results of modeling performed for each scenario to estimate the expected change in the State’s cost for that program. Finally, we provide the results of additional modeling to help gauge the potential additional cost to the State for providing subsidies if enhanced outreach and advertising efforts lead to higher enrollment than initially modeled.
5.1. Subsidy Structures That Provide a Fixed Dollar Per Member Per Month Subsidy
The first set of scenarios modeled were those that provide a fixed dollar PMPM subsidy. We modeled six scenarios, three where subsidies are provided only to individuals and families with household incomes at or below 400% FPL (targeting State spending of either $50M, $100M or $150M) and three where subsidies are provided only to individuals and families with household incomes at or below 600% FPL (also targeting State spending of either $50M, $100M or $150M). In all six scenarios, it was assumed that subsidies are only provided for premium paying members within a family.12
It was assumed that Individuals and families eligible for APTCs under the ACA will continue to be eligible and receive those subsidies and that the State‐sponsored subsidies would be provided in addition to any federal APTCs, reducing the subsidized premium they are required to pay even further. However, should the application of the State‐sponsored subsidies result in a premium less than $0, State‐sponsored subsidies would only be provided up to the point where the premium reaches $0.13
Table 5.1 provides the fixed dollar PMPM that would be provided to each premium paying member under the six scenarios. As can be seen, the level of the subsidy provided varies based on the individual’s or family’s household income. In all scenarios, for individuals and families with household incomes at or below 400% FPL, the level of subsidy increases as household income increases. Under the federal APTC structure, individuals and families with the lowest household incomes receive the highest subsidies today, resulting in lower post‐subsidy premium rates for those members relative to others. The State‐sponsored subsidy structure is intended to provide slightly higher incremental relief to individuals and families in the household income ranges that are paying higher premiums today. Individuals and families
12 Families enrolling in coverage through the Individual ACA market are only required to pay premium for the first three children under the age of 21. 13 The State‐sponsored subsidies would not be applied to premium used to cover non‐EHBs, resulting in cases where a member may have a nominal premium (< $1) each month.

Study of State‐Sponsored Subsidies for the New Jersey Individual Market
Modeling Results
© Oliver Wyman 22
with household incomes above 250% and at or below 400% FPL are not eligible for federal cost‐sharing reduction plans and, in some cases, may receive very low APTCs or no APTCs at all if the SLCSP plan premium is close to or lower than the applicable percentage of their income. For these reasons, the State‐sponsored subsidies have been structured to be higher for individuals and families in this income range to provide additional assistance to this cohort. It should be noted that the post‐subsidized premium, after considering both federal subsidies and State sponsored subsidies, is expected to remain lower for individuals with lower household incomes than for individuals with higher household incomes, all else equal.
Table 5.1 State‐Sponsored Subsidies – Fixed Dollar PMPM Subsidy Scenarios
Household Income as a % of FPL FD400‐50 FD400‐100 FD400‐150 FD600‐50 FD600‐100 FD600‐150
551% ‐ 600% $0 $0 $0 $39 $65 $90
501% ‐ 550% $0 $0 $0 $39 $65 $90
451% ‐ 500% $0 $0 $0 $39 $65 $90
401% ‐ 450% $0 $0 $0 $39 $65 $90
351% ‐ 400% $45 $95 $143 $39 $65 $90
301% ‐ 350% $45 $95 $143 $39 $65 $90
251% ‐ 300% $45 $95 $143 $39 $65 $90
201% ‐ 250% $20 $40 $60 $15 $50 $75
151% ‐ 200% $20 $30 $40 $10 $22 $28
138% ‐ 150% $10 $20 $30 $10 $10 $15
Table 5.2 provides the results of the modeling for each of these six scenarios. The results for each scenario represent a point estimate based on our best estimate assumptions. Actual results will vary from these estimates, and the variance could be significant, particularly if changes are made to State and/or federal laws that impact the insurance markets, or if there are significant changes in economic conditions, including but not limited to the impact of COVID‐19.
For each scenario, the baseline enrollment expected in 2021 is presented, broken down between members with household incomes up to or greater than 400% FPL. The number of new individuals expected to enroll in coverage in 2021 due to the introduction of the State‐sponsored subsidies is then presented, along with the total expected enrollment in 2021 with the State‐sponsored subsidies in place.
Next the expected cost to the State for the direct cost of providing the State‐sponsored subsidies is presented, in total along with the portion that is attributed to members in households with incomes up to 400% FPL and the portion that is attributed to members in households with incomes greater than 400% FPL.
Finally, the expected improvement in the average claim cost attributable to improved morbidity that was modeled is presented for each scenario. In general, individuals that are currently uninsured and not

Study of State‐Sponsored Subsidies for the New Jersey Individual Market
Modeling Results
© Oliver Wyman 23
eligible for Medicaid are, on average, in better health than those currently enrolled in the Individual ACA market in New Jersey. Therefore, when currently uninsured members enter the market, they have a positive impact on the average morbidity of the single risk pool. To the extent that carriers reflect this assumed morbidity improvement in their 2021 premium rates, the premium rates would be expected to decrease by roughly the amounts shown, in addition to any other changes which would have otherwise been implemented.
In addition to Table 5.2, further detailed modeling results for each of the six scenarios can be found in Appendix A, including a breakdown of the premium by funding sources (i.e., APTC, State‐sponsored subsidy, and member paid) for various cohorts, as well as distributions of current and new members by age and household income.
Table 5.2 Expected Change in Enrollment and Cost to the State – Fixed Dollar PMPM Subsidy Scenarios
FD400‐50 FD400‐100 FD400‐150 FD600‐50 FD600‐100 FD600‐150
Baseline Enrollees
Total 306,179 306,179 306,179 306,179 306,179 306,179
Incomes Over 400% FPL 137,157 137,157 137,157 137,157 137,157 137,157
Incomes Up to 400% FPL 169,021 169,021 169,021 169,021 169,021 169,021
Expected New Enrollees
Total 1,627 5,292 10,487 1,347 3,543 8,586
Incomes Over 400% FPL ‐65 ‐214 ‐214 184 128 1,343
Incomes Up to 400% FPL 1,692 5,505 10,701 1,163 3,415 7,243
Total Expected Enrollees
Total 307,806 311,470 316,666 307,525 309,721 314,764
Incomes Over 400% FPL 137,092 136,944 136,944 137,341 137,285 138,500
Incomes Up to 400% FPL 170,714 174,527 179,722 170,184 172,436 176,264
Total Cost to the State (In $Millions)
Total $50.5 $99.1 $150.0 $49.1 $100.1 $149.7
Incomes Over 400% FPL $11.2 $24.2 $39.8
Incomes Up to 400% FPL $50.5 $99.1 $150.0 $37.9 $75.9 $109.9
Morbidity Improvement 0.3% 1.0% 2.0% 0.5% 1.2% 2.2%
5.2. Subsidy Structures That Reduce or Introduce an Applicable Percentage
The second set of scenarios that were modeled are those that either reduce or introduce an Applicable Percentage. As previously discussed, the APTCs provided by the federal government to individuals and families with household incomes up to 400% FPL are determined using an Applicable Percentage
Study of State‐Sponsored Subsidies for the New Jersey Individual Market
Modeling Results
© Oliver Wyman 24
approach whereby an Applicable Percentage is assigned to each FPL, which when multiplied times the annual household income, produces the Maximum Annual Premium the household is required to pay to enroll in the SLCSP plan available to them.
We modeled six scenarios that reduce the Applicable Percentage assigned to household income levels at or below 400% FPL, three of which also introduce an Applicable Percentage for household income levels between 401% and 600% FPL. As previously noted, individuals and families eligible for APTCs under the ACA are assumed to continue to be eligible for and receive those subsidies. In each scenario, the cost to the State would be the difference between the gross annual premium and the Maximum Annual Premium determined from the new or reduced Applicable Percentage, less any APTCs provided by the federal government. Similar to the fixed dollar PMPM subsidy scenarios modeled, scenarios were modeled to target State spending of either $50M, $100M or $150M.
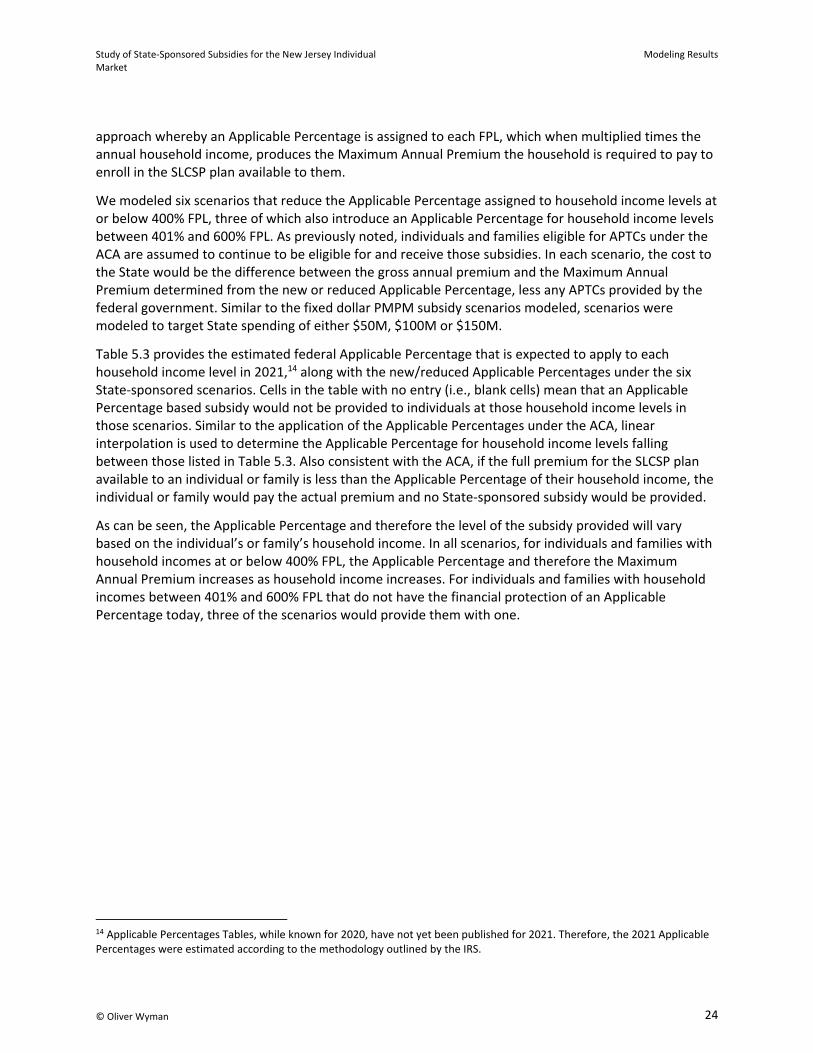
Table 5.3 provides the estimated federal Applicable Percentage that is expected to apply to each household income level in 2021,14 along with the new/reduced Applicable Percentages under the six State‐sponsored scenarios. Cells in the table with no entry (i.e., blank cells) mean that an Applicable Percentage based subsidy would not be provided to individuals at those household income levels in those scenarios. Similar to the application of the Applicable Percentages under the ACA, linear interpolation is used to determine the Applicable Percentage for household income levels falling between those listed in Table 5.3. Also consistent with the ACA, if the full premium for the SLCSP plan available to an individual or family is less than the Applicable Percentage of their household income, the individual or family would pay the actual premium and no State‐sponsored subsidy would be provided.
As can be seen, the Applicable Percentage and therefore the level of the subsidy provided will vary based on the individual’s or family’s household income. In all scenarios, for individuals and families with household incomes at or below 400% FPL, the Applicable Percentage and therefore the Maximum Annual Premium increases as household income increases. For individuals and families with household incomes between 401% and 600% FPL that do not have the financial protection of an Applicable Percentage today, three of the scenarios would provide them with one.
14 Applicable Percentages Tables, while known for 2020, have not yet been published for 2021. Therefore, the 2021 Applicable Percentages were estimated according to the methodology outlined by the IRS.

Study of State‐Sponsored Subsidies for the New Jersey Individual Market
Modeling Results
© Oliver Wyman 25
Table 5.3 State‐Sponsored Subsidies – Applicable Percentage Subsidy Scenarios
Household Income as a % of FPL*
Federal Applicable Percentage AP400‐50 AP400‐100 AP400‐150 AP600‐50 AP600‐100 AP600‐150
600% 20.0% 15.0% 12.5%
550% 20.0% 15.0% 12.5%
500% 20.0% 12.5% 10.0%
450% 20.0% 12.5% 10.0%
400% 9.8% 8.3% 6.8% 5.8% 8.9% 8.2% 7.3%
350% 9.8% 8.3% 6.8% 5.8% 8.9% 8.2% 7.3%
300% 9.8% 8.3% 6.8% 5.8% 8.9% 8.2% 7.3%
250% 8.3% 7.3% 6.3% 5.1% 7.6% 7.3% 6.3%
200% 6.5% 5.5% 4.5% 3.3% 6.0% 5.7% 5.5%
150% 4.1% 3.1% 2.4% 1.6% 3.6% 3.4% 3.1%
138% 3.1% 2.1% 1.6% 1.1% 2.6% 2.3% 2.1%
*Linear interpolation is used to determine Applicable Percentages for household income levels falling between those listed above
Table 5.4 provides the results of the modeling for each of these six scenarios. As with the fixed dollar PMPM subsidy scenarios, the results for each scenario below represent a point estimate based on our best estimate assumptions; actual results will vary from these estimates, and the variance could be significant.
Similar to the fixed dollar PMPM subsidy scenarios, Table 5.4 presents the baseline enrollment expected in 2021, the number of new individuals expected to enroll in coverage in 2021 due to the introduction of the State‐sponsored subsidies, and the total expected enrollment in 2021 with the State‐sponsored subsidies in place, separately for households with incomes up to 400% FPL and households with incomes greater than 400% FPL. In addition, the expected cost to the State for the direct cost of the State‐sponsored subsidies and the expected improvement in the average claim cost attributable to improved morbidity are presented for each scenario.
In addition to Table 5.4, additional detailed modeling results for each of the six scenarios can be found in Appendix B, including a breakdown of the premium by funding sources (i.e., APTC, State‐sponsored subsidy, and member paid) for various cohorts, as well as distributions of current and new members by age and household income.

Study of State‐Sponsored Subsidies for the New Jersey Individual Market
Modeling Results
© Oliver Wyman 26
Table 5.4 Expected Change in Enrollment and Cost to the State – Applicable Percentage Subsidy Scenarios
AP400‐50 AP400‐100 AP400‐150 AP600‐50 AP600‐100 AP600‐150
Baseline Enrollees
Total 306,179 306,179 306,179 306,179 306,179 306,179
Incomes Over 400% FPL 137,157 137,157 137,157 137,157 137,157 137,157
Incomes Up to 400% FPL 169,021 169,021 169,021 169,021 169,021 169,021
Expected New Enrollees
Total 1,986 6,249 12,221 2,249 4,856 8,796
Incomes Over 400% FPL ‐65 ‐214 ‐214 1,298 3,242 4,893
Incomes Up to 400% FPL 2,051 6,463 12,435 950 1,614 3,903
Total Expected Enrollees
Total 308,165 312,428 318,400 308,427 311,034 314,974
Incomes Over 400% FPL 137,092 136,944 136,944 138,456 140,399 142,050
Incomes Up to 400% FPL 171,072 175,484 181,456 169,972 170,635 172,924
Total Cost to the State (In $Millions)
Total $49.5 $99.2 $149.5 $49.7 $99.8 $150.0
Incomes Over 400% FPL $21.8 $54.5 $79.6
Incomes Up to 400% FPL $49.5 $99.2 $149.5 $27.9 $45.3 $70.4
Morbidity Improvement 0.3% 0.9% 1.8% 0.5% 1.2% 1.8%
5.3. Expected Impact on the State’s Reinsurance Program Cost
In 2019, New Jersey implemented a state‐based reinsurance program under a Section 1332 Waiver in an effort to increase the affordability of coverage to consumers by reducing gross premium rates in the Individual ACA market by approximately 15%. This program will continue to be in place in 2021, with a significant portion of the cost of the program expected to be funded by federal pass‐through payments to the State. As previously noted, should New Jersey move forward with introducing State‐sponsored subsidies to individuals and families that enroll in coverage through Get Covered New Jersey it is expected that a state‐based HIA of either 2.0%, 2.5% or 2.75% of premium will be assessed against all fully insured health plans, including those sold in the Individual ACA market, for the scenarios that have an approximate State cost of $50M, $100M or $150M, respectively. Additionally, with the introduction of State‐sponsored premium subsidies, the level and make‐up of enrollment in New Jersey’s Individual ACA market is expected to be different than would otherwise occur if there were no State‐sponsored premium subsidies. Therefore, the implementation of State‐sponsored subsidies is expected to impact the State’s cost for its reinsurance program.

Study of State‐Sponsored Subsidies for the New Jersey Individual Market
Modeling Results
© Oliver Wyman 27
To help the State understand the potential impact on the cost of its reinsurance program under each scenario, we modeled the total cost of the program, the expected federal pass‐through funding to the State, and the net cost to the State using the reinsurance parameters that were recently established for plan year 2021, reflecting both the expected increase in premium as a result of the HIA and the expected increase in enrollment due to the presence of the State‐sponsored subsidies, including the characteristics of the new enrollment (e.g., age, household income, morbidity). We performed this modeling for each of the twelve scenarios being considered and compared the resulting expected net cost to the State for each scenario to the expected net cost to the State that was modeled as part of recent analysis performed to help the State establish the reinsurance parameters for plan year 2021 where State‐sponsored subsidies were not considered.
We performed sensitivity testing around our best estimate of the change in net cost to the State for each scenario to provide the State with an understanding of the potential volatility of the projected change in net cost to the State of New Jersey. For each assumption that represents a key driver of the net cost to the State, we established a plausible range of variation that could occur for that assumption and calculated the revised change in the expected net cost to the State, in each case again relative to the expected net cost to the State when altering that same assumption but where State‐sponsored subsidies are not provided.
Tables 5.5 and 5.6 below present our expected best estimate of the change in the net cost to the State for its reinsurance program in 2021 under each of the twelve subsidy scenarios being considered, and the expected change in the State’s cost under each of the alternate reinsurance scenarios tested. When performing the sensitivity testing, it is important to note that only the underlying assumption listed was changed, even though changes in other assumptions may be expected. If multiple assumptions are different relative to expectations, the expected change in the net cost to the State could be compounded, and the impact of changes in individual assumptions is not necessarily additive. A description of each sensitivity test performed may be found in Appendix C.
Table 5.5 Expected Impact on the State’s Reinsurance Program Cost – Fixed Dollar PMPM Subsidy Scenarios
(In $Millions)
FD400‐50 FD400‐100 FD400‐150 FD600‐50 FD600‐100 FD600‐150
Best Estimate Assumptions ($7.5) ($9.9) ($11.7) ($6.1) ($7.7) ($7.2)
Total Enrollment +10% ($8.2) ($10.9) ($12.9) ($6.7) ($8.5) ($8.0)
Total Enrollment ‐10% ($6.7) ($8.9) ($10.5) ($5.4) ($6.9) ($6.5)
Non‐APTC Enrollment +10% ($7.7) ($10.2) ($12.0) ($6.2) ($7.8) ($7.2)
Non‐ APTC Enrollment ‐10% ($7.2) ($9.6) ($11.4) ($5.9) ($7.6) ($7.3)
Morbidity Improvement Reduced 50% ($6.7) ($9.1) ($10.8) ($5.3) ($6.9) ($6.4)
No Morbidity Improvement in Rates ($5.9) ($8.3) ($10.0) ($4.5) ($6.1) ($5.6)
SLCSP 0.5% Higher Than Projected ($7.2) ($9.5) ($11.1) ($5.8) ($7.3) ($6.8)
SLCSP 1.0% Higher Than Projected ($6.9) ($9.1) ($10.6) ($5.5) ($6.9) ($6.3)
1% Lower PTC/APTC Ratio ($7.4) ($9.7) ($11.4) ($6.0) ($7.5) ($7.0)
1% Higher PTC/APTC Ratio ($7.6) ($10.1) ($12.0) ($6.2) ($7.8) ($7.5)
SLCSP w/Reins. 3% Lower Than Projected ($7.2) ($9.4) ($10.9) ($5.8) ($7.3) ($6.6)
SLCSP w/Reins. 3% Higher Than Projected ($7.8) ($10.4) ($12.4) ($6.3) ($8.1) ($7.9)

Study of State‐Sponsored Subsidies for the New Jersey Individual Market
Modeling Results
© Oliver Wyman 28
Table 5.6 Expected Impact on the State’s Reinsurance Program Cost – Applicable Percentage Subsidy Scenarios
(In $Millions)
AP400‐50 AP400‐100 AP400‐150 AP600‐50 AP600‐100 AP600‐150
Best Estimate Assumptions ($6.8) ($9.6) ($11.6) ($3.9) ($3.2) ($2.3)
Total Enrollment +10% ($7.5) ($10.6) ($12.8) ($4.3) ($3.6) ($2.5)
Total Enrollment ‐10% ($6.1) ($8.6) ($10.5) ($3.5) ($2.9) ($2.0)
Non‐APTC Enrollment +10% ($7.0) ($9.9) ($11.9) ($3.8) ($3.0) ($1.8)
Non‐ APTC Enrollment ‐10% ($6.6) ($9.3) ($11.3) ($4.0) ($3.5) ($2.7)
Morbidity Improvement Reduced 50% ($6.1) ($8.8) ($10.7) ($3.1) ($2.4) ($1.4)
No Morbidity Improvement in Rates ($5.3) ($7.9) ($9.9) ($2.4) ($1.7) ($0.6)
SLCSP 0.5% Higher Than Projected ($6.5) ($9.2) ($11.0) ($3.6) ($2.9) ($1.9)
SLCSP 1.0% Higher Than Projected ($6.2) ($8.7) ($10.5) ($3.4) ($2.6) ($1.5)
1% Lower PTC/APTC Ratio ($6.7) ($9.4) ($11.3) ($3.8) ($3.1) ($2.1)
1% Higher PTC/APTC Ratio ($6.9) ($9.8) ($11.9) ($4.0) ($3.3) ($2.4)
SLCSP w/Reins. 3% Lower Than Projected ($6.5) ($9.1) ($10.8) ($3.7) ($2.9) ($1.8)
SLCSP w/Reins. 3% Higher Than Projected ($7.1) ($10.1) ($12.4) ($4.1) ($3.5) ($2.7)
Tables 5.5 and 5.6 above show that for all twelve of the State‐sponsored subsidy scenarios being considered, the introduction of State‐sponsored subsidies at the level modeled are expected to decrease the net cost to the State for its reinsurance program in 2021, all else equal. While the State would have to cover the cost of reducing premiums under the reinsurance program for the additional individuals who enroll that do not receive APTCs provided by the federal government, this increased cost is generally offset by additional pass‐through funding the State is expected to receive as a result of higher premiums due to the presence of the state‐based HIA that would apply should State‐sponsored subsidies be made available. The higher starting premium leads to larger reductions in APTCs when premium rates are reduced by 15% due to the reinsurance program and, in turn, larger APTC savings that can be passed to the State under its Section 1332 Waiver. Since the presence of a state‐based HIA would not have any impact on the expected claims under the reinsurance program, all else equal, the additional pass‐through funding translates directly into reduced costs for the State.
It is critical to note that the estimates above are based on the expectation that when CMS and The U.S. Treasury calculate the State of New Jersey’s pass‐through funding for plan year 2021 they are aware of and consider the presence of the State‐sponsored subsidies that were not in place in 2020 but will be in place in 2021. If their baseline projections rely on membership for the first part of 2020 as might be expected based on pass‐through funding calculations in recent years, the additional enrollment that would be expected as a result of the State‐sponsored subsidies may not be considered. In turn, the lower projected baseline membership would result in lower pass through funding, all else equal, and a higher cost to the State than is being projected in the Tables 5.5 and 5.6.

Study of State‐Sponsored Subsidies for the New Jersey Individual Market
Modeling Results
© Oliver Wyman 29
5.4. Expected Additional Cost if Enrollment is Above Best Estimate Levels
Our best estimate for each scenario under consideration reflects an assumption that not all uninsured individuals and families evaluate insurance coverage each year. Through the process of calibrating our HRM Model to the New Jersey Individual ACA market over the past few years it was determined that, historically, roughly 15% of uninsured individuals would have needed to evaluate coverage each year in order to produce the observed changes in enrollment, taking into consideration the actual changes in premium. Our understanding is that the State intends to significantly increase the level of outreach and advertising for the plan year 2021 open enrollment period.
While final details and budgets for these efforts have not yet been determined, it is difficult to estimate the impact that these efforts may have on the number of individuals and families that enroll in coverage through Get Covered New Jersey in 2021. However, it is assumed that they will lead to an increase in the percentage of the uninsured population that will evaluate coverage during the plan year 2021 open enrollment period later this fall, and that some of these individuals may ultimately enroll in coverage.
To provide the State with a sense of the potential impact that additional uninsured individuals and families evaluating coverage could have on the expected cost to the State, we modeled an alternate set of the twelve scenarios under consideration where an additional 5% of uninsured individuals and families evaluate coverage during the plan year 2021 open enrollment period. The modeling assumes that the increased outreach and advertising is broad based and does not skew heavily toward any particular group of uninsured individuals (e.g., by age, household income, family status). Among the additional 5% of uninsured individuals and families modeled to newly evaluate coverage for plan year 2021, where the economic utility of enrolling in coverage is greater than the economic utility of remaining uninsured, those individuals and families are assumed to enroll. Tables 5.7 and 5.8 below present the expected enrollment, expected total cost to the State for providing State‐sponsored subsidies, and the expected incremental cost to the State for providing State‐sponsored subsidies under these alternate sets of scenarios.
Table 5.7 Expected Change in Enrollment and Cost to the State – Fixed Dollar PMPM Subsidy Scenarios
Additional 5% of the Uninsured Evaluate Coverage
FD400‐50 FD400‐100 FD400‐150 FD600‐50 FD600‐100 FD600‐150
Additional New Enrollees 3,839 5,485 6,743 3,783 4,956 6,717
Revised Total Expected Enrollees
Total 311,645 316,955 323,409 311,308 314,677 321,481
Incomes Over 400% FPL 138,360 138,212 138,212 138,757 138,999 140,604
Incomes Up to 400% FPL 173,285 178,744 185,197 172,551 175,678 180,877
Cost to the State (In $Millions)
Total Cost to the State $51.7 $102.4 $157.1 $50.5 $103.3 $155.5
Marginal Cost to the State * $1.2 $3.3 $7.1 $1.5 $3.2 $5.8
* Represents the additional cost to the State for the additional new enrollees

Study of State‐Sponsored Subsidies for the New Jersey Individual Market
Modeling Results
© Oliver Wyman 30
Table 5.8 Expected Change in Enrollment and Cost to the State – Applicable Percentage Subsidy Scenarios
Additional 5% of the Uninsured Evaluate Coverage
AP400‐50 AP400‐100 AP400‐150 AP600‐50 AP600‐100 AP600‐150
Additional New Enrollees 4,032 5,968 7,579 3,226 5,170 7,563
Revised Total Expected Enrollees
Total 312,196 318,396 325,978 311,653 316,204 322,537
Incomes Over 400% FPL 138,360 138,212 138,212 140,063 142,971 146,011
Incomes Up to 400% FPL 173,836 180,185 187,767 171,591 173,233 176,526
Cost to the State (In $Millions)
Total Cost to the State $50.6 $103.1 $157.1 $51.9 $106.0 $162.9
Marginal Cost to the State * $1.1 $3.8 $7.6 $2.2 $6.2 $12.9
* Represents the additional cost to the State for the additional new enrollees
Tables 5.7 and 5.8 above show that incremental enrollment ranging from slightly less than the level of new enrollment expected under the corresponding best estimate scenario (for the scenarios that target $150M in State spending) to roughly double the level of new enrollment expected under the best estimate scenario (for the scenarios that target $50M in State spending) is expected if the State’s outreach and advertising efforts result in an additional 5% of the uninsured population evaluating coverage for the 2021 plan year. Since they represent individuals that through the model calibration process have been modeled not to have evaluated for coverage over the past few years in the baseline, they have not yet considered the economic utility of taking coverage when presented with the reduced premium levels first resulting from the implementation of the State’s reinsurance program in 2019 and are therefore, for the first time evaluating premium rates which reflect the impact of both the reinsurance program and the availability of State‐sponsored subsidies. As a result, their resulting take‐up rate is higher than for the initial segment of uninsured individuals who were modeled to evaluate coverage options in 2021.
Tables 5.7 and 5.8 also show that the expected incremental cost to the State for these additional enrollees is small, relative to the total expenditures that are expected under the best estimate scenarios. This is because the single risk pool requirements of the ACA require that all individuals and families of the same age, household income and geographic location pay the same premium rates and, therefore, a large majority of the State spending in the best estimate scenarios is used to provide State‐sponsored subsidies to individuals and families that are already enrolled in the Individual ACA market in the baseline.
As will be discussed further in Section 6, the presence of State‐sponsored subsidies provided to current enrollees results in coverage being more affordable, in some cases significantly, and empowers them with the flexibility to reduce their monthly premiums or alternately reduce their cost sharing by purchasing a different plan with lower cost sharing. Once the substantial cost associated with providing State‐sponsored subsidies to existing enrollees has been covered, only the marginal cost of each additional new enrollee needs to be covered.

Study of State‐Sponsored Subsidies for the New Jersey Individual Market
Modeling Results
© Oliver Wyman 31
5.5. Summary of Results Ultimately, the State will need to select a single subsidy structure should it move forward with providing State‐sponsored subsidies to members enrolling through Get Covered New Jersey. Each subsidy structure comes with a different level of expected enrollment and corresponding net cost to the State. Not only will the State need to determine which State‐sponsored scenarios under consideration it can afford, various scenarios with relatively the same cost to the State result in different levels of expected enrollment, as well as differences in level of financial support provided by age, household income and family structure. It is likely that a single scenario may not meet all of the State’s policy objectives, and the competing interests of some scenarios will need to be weighed against each other. To aid in this evaluation, we provide the following tables that summarize the twelve scenarios being considered. Table 5.9 compares the State costs, enrollment and morbidity improvement expected under each scenario.
Table 5.9 Expected State Cost, Enrollment and Morbidity Improvement – All Subsidy Scenarios
(In $Millions)
Subsidy Scenario
State‐Sponsored Subsidies
Change in Reinsurance Program Costs
Net Cost to the State
Total Enrollment
Morbidity Improvement
Incremental Enrollment*
FD400‐50 $50.5 ($7.5) $43.0 307,806 0.30% 3,839
FD400‐100 $99.1 ($9.9) $89.2 311,470 1.00% 5,485
FD400‐150 $150.0 ($11.7) $138.3 316,666 2.00% 6,743
FD600‐50 $49.1 ($6.1) $43.0 307,525 0.50% 3,783
FD600‐100 $100.1 ($7.7) $92.4 309,721 1.20% 4,956
FD600‐150 $149.7 ($7.2) $142.5 314,764 2.20% 6,717
AP400‐50 $49.5 ($6.8) $42.7 308,165 0.30% 4,032
AP400‐100 $99.2 ($9.6) $89.6 312,428 0.90% 5,968
AP400‐150 $149.5 ($11.6) $137.9 318,400 1.80% 7,579
AP600‐50 $49.7 ($3.9) $45.8 308,427 0.50% 3,226
AP600‐100 $99.8 ($3.2) $96.6 311,034 1.20% 5,170
AP600‐150 $150.0 ($2.3) $147.7 314,974 1.80% 7,563
* Represents the incremental number of new enrollees expected if an additional 5% of the currently uninsured population evaluates for coverage during the plan year 2021 open enrollment period
The following conclusions can be drawn from Table 5.9:
Scenarios that provide State‐sponsored subsidies to only individuals and families with household incomes at or below 400% FPL are expected to result in a net cost to the State, after consideration of changes in reinsurance program costs, that is further below the target spending on subsidies alone than the corresponding scenarios that extend State‐sponsored subsidies to individuals and families with household incomes at or below 600% FPL (i.e., comparing those that have the same

Study of State‐Sponsored Subsidies for the New Jersey Individual Market
Modeling Results
© Oliver Wyman 32
subsidy structure in terms of providing either a fixed dollar PMPM subsidy or a new/reduced Applicable Percentage)
The Applicable Percentage subsidy structures are expected to result in slightly higher total enrollment relative to the corresponding fixed dollar PMPM subsidy structure (i.e., when comparing those scenarios which target the same State spend on subsidies and extend subsidies to individuals and families up to the same household income thresholds)
The incremental number of members expected to take up coverage if an additional 5% of the currently uninsured population evaluates coverage during the plan year 2021 open enrollment period is slightly greater in subsidy structures that provide State‐sponsored subsidies only to individuals and families with household incomes up to 400% FPL, relative to the corresponding scenario where State‐sponsored subsidies are provided to individuals and families with household incomes up to 600% FPL
If carriers were to reflect expected morbidity improvement in their 2021 rates, it would lead to rates that are approximately 0.3% to 2.2% lower than if morbidity improvement were not reflected, all else equal, with fixed dollar PMPM subsidy structures leading to larger expected improvement in morbidity than the corresponding subsidy structures providing a new/reduced Applicable Percentage benefit
Table 5.10 compares the distribution of new members expected to take up coverage as a result of the State‐sponsored subsidies by age. Please note that the size of each age cohort in the table is not the same. Specifically, the first cohort contains 27 ages, the second contains eight ages, and all others contain ten ages.
Table 5.10 Age Distribution of Expected New Members – All Subsidy Scenarios
Subsidy Scenario <= 26 27 – 34 35 – 44 45 – 54 55 – 64
FD400‐50 16% 10% 17% 39% 19%
FD400‐100 20% 20% 16% 33% 12%
FD400‐150 17% 25% 18% 25% 14%
FD600‐50 19% 6% 18% 30% 28%
FD600‐100 22% 15% 19% 25% 18%
FD600‐150 22% 19% 17% 30% 11%
AP400‐50 19% 16% 13% 35% 19%
AP400‐100 15% 16% 16% 34% 19%
AP400‐150 18% 19% 23% 25% 14%
AP600‐50 30% 2% 9% 18% 41%
AP600‐100 28% 3% 11% 27% 33%
AP600‐150 26% 7% 11% 26% 29%
From Table 5.10 it can be seen that scenarios that provide State‐sponsored subsidies to individuals and families with household incomes at or below 600% FPL generally attract a higher proportion of individuals age 26 and below and over age 55 than those that extend State‐sponsored subsidies only to

Study of State‐Sponsored Subsidies for the New Jersey Individual Market
Modeling Results
© Oliver Wyman 33
individuals and families with household incomes at or below 400% FPL. Further, the increase in these two segments is much greater for scenarios that implement new or reduced Applicable Percentages than those that provide fixed dollar PMPM subsidies.

Study of State‐Sponsored Subsidies for the New Jersey Individual Market
Coverage Affordability
© Oliver Wyman 34
6. COVERAGE AFFORDABILITY Overall, the introduction of State‐sponsored premium subsidies will make health insurance coverage that is purchased through Get Covered New Jersey more affordable for those individuals who are eligible by reducing their anticipated overall net out‐of‐pocket expenses (i.e., total premium contribution plus plan‐level cost sharing that is the responsibility of the individual). In addition to making the purchase of health insurance coverage (through Get Covered New Jersey) more affordable for eligible individuals who are currently uninsured, the State‐sponsored premium subsidies are expected to make health insurance coverage more affordable for thousands of existing market enrollees.
With State‐sponsored premium subsidies in place, it is expected that eligible individuals will have the flexibility to either (1) enroll in the same plan they would otherwise enroll in, but at a lower premium rate or (2) make the decision to utilize their State‐sponsored premium subsidy to “buy up” to a plan for which their expected plan‐level cost sharing would be less (e.g., “buy‐up” from a plan with a $5,000 deductible to one with a $2,000 deductible).
To demonstrate the improved affordability created by the State‐sponsored premium subsidies, Table 6.1 provides the average projected monthly dollar value (on a per member basis) of the State‐sponsored premium subsidies, split by those individuals and families with household incomes up to 400% FPL and those with household incomes between 401% and 600% FPL. It is important to highlight that the PMPM averages provided in Table 6.1 are only for those individuals and families who would be projected to receive State‐sponsored premium subsidies. For the “AP” scenarios, some individuals and families within the specified household income ranges would not be expected to receive State‐sponsored premium subsidies due to the gross premium rates for their SCLSP plan being lower than the Applicable Percentage of household income (e.g., 12.5%) which would be set for them.
Table 6.1 Average Projected State‐Sponsored Premium Subsidy PMPM
(For Individuals and Families Receiving State‐Sponsored Subsidies)
Subsidy Scenario Up to 400% FPL 401%‐600% FPL
FD400–50 $25 $0
FD400–100 $47 $0
FD400–150 $70 $0
FD600–50 $19 $39
FD600–100 $37 $65
FD600–150 $52 $90
AP400–50 $24 $0
AP400–100 $47 $0
AP400–150 $69 $0
AP600–50 $14 $221
AP600–100 $22 $256
AP600–150 $34 $280
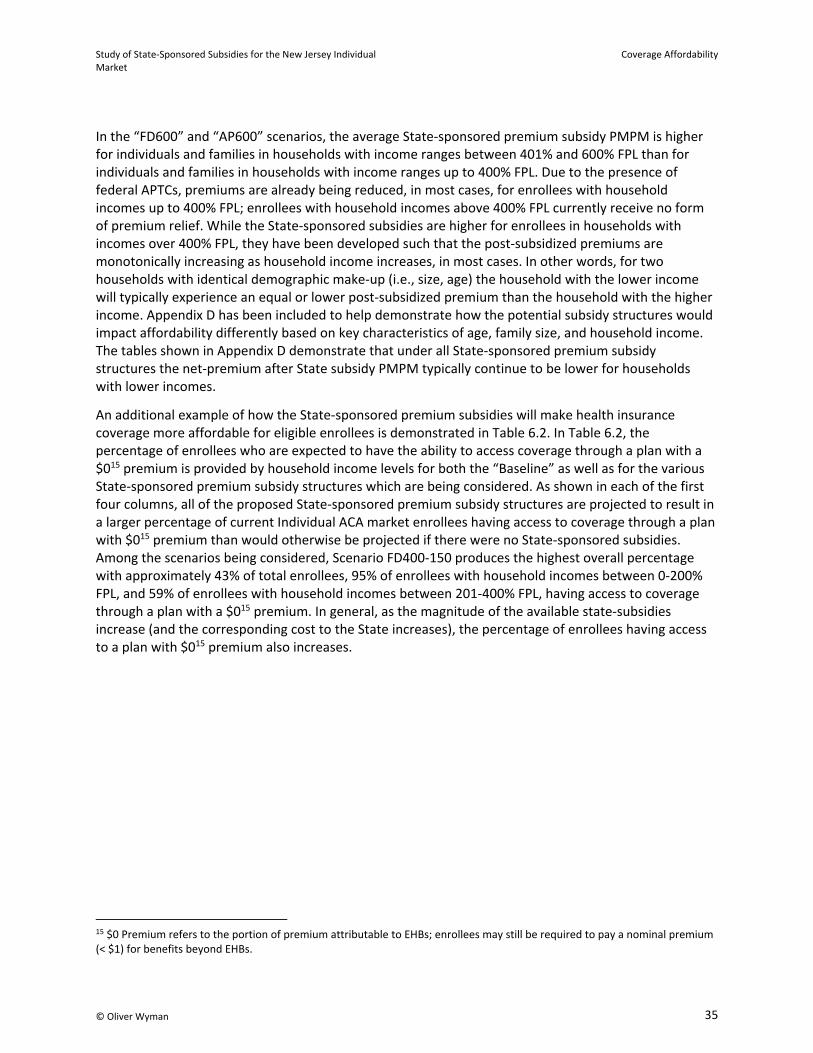
Study of State‐Sponsored Subsidies for the New Jersey Individual Market
Coverage Affordability
© Oliver Wyman 35
In the “FD600” and “AP600” scenarios, the average State‐sponsored premium subsidy PMPM is higher for individuals and families in households with income ranges between 401% and 600% FPL than for individuals and families in households with income ranges up to 400% FPL. Due to the presence of federal APTCs, premiums are already being reduced, in most cases, for enrollees with household incomes up to 400% FPL; enrollees with household incomes above 400% FPL currently receive no form of premium relief. While the State‐sponsored subsidies are higher for enrollees in households with incomes over 400% FPL, they have been developed such that the post‐subsidized premiums are monotonically increasing as household income increases, in most cases. In other words, for two households with identical demographic make‐up (i.e., size, age) the household with the lower income will typically experience an equal or lower post‐subsidized premium than the household with the higher income. Appendix D has been included to help demonstrate how the potential subsidy structures would impact affordability differently based on key characteristics of age, family size, and household income. The tables shown in Appendix D demonstrate that under all State‐sponsored premium subsidy structures the net‐premium after State subsidy PMPM typically continue to be lower for households with lower incomes.
An additional example of how the State‐sponsored premium subsidies will make health insurance coverage more affordable for eligible enrollees is demonstrated in Table 6.2. In Table 6.2, the percentage of enrollees who are expected to have the ability to access coverage through a plan with a $015 premium is provided by household income levels for both the “Baseline” as well as for the various State‐sponsored premium subsidy structures which are being considered. As shown in each of the first four columns, all of the proposed State‐sponsored premium subsidy structures are projected to result in a larger percentage of current Individual ACA market enrollees having access to coverage through a plan with $015 premium than would otherwise be projected if there were no State‐sponsored subsidies. Among the scenarios being considered, Scenario FD400‐150 produces the highest overall percentage with approximately 43% of total enrollees, 95% of enrollees with household incomes between 0‐200% FPL, and 59% of enrollees with household incomes between 201‐400% FPL, having access to coverage through a plan with a $015 premium. In general, as the magnitude of the available state‐subsidies increase (and the corresponding cost to the State increases), the percentage of enrollees having access to a plan with $015 premium also increases.
15 $0 Premium refers to the portion of premium attributable to EHBs; enrollees may still be required to pay a nominal premium (< $1) for benefits beyond EHBs.

Study of State‐Sponsored Subsidies for the New Jersey Individual Market
Coverage Affordability
© Oliver Wyman 36
Table 6.2 Percentage of Current Enrollees with the Opportunity to Enroll in a Plan with $016 Premium
Subsidy Scenario 0%‐200% FPL 201%‐400% FPL Over 400% FPL Total
% of Total enrollees who can Access Coverage in a Plan with $016 Premium without Losing Significant CSR Benefits
Baseline 70% 15% 0% 23% 4%
FD400–50 84% 24% 0% 29% 7%
FD400–100 91% 42% 0% 36% 13%
FD400–150 95% 59% 0% 43% 20%
FD600–50 77% 22% 0% 27% 6%
FD600–100 86% 34% 0% 33% 10%
FD600–150 90% 48% 0% 38% 15%
AP400–50 87% 22% 0% 29% 6%
AP400–100 95% 34% 0% 35% 10%
AP400–150 99% 46% 0% 40% 16%
AP600–50 77% 19% 0% 26% 5%
AP600–100 82% 21% 0% 28% 6%
AP600–150 87% 29% 0% 31% 8%
One item to note in reviewing the results provided in Table 6.2 is that, while a relatively substantial percentage of enrollees will have access to a plan with $016 premium under the State‐sponsored subsidy scenarios, a large volume of those enrollees would not be able to access the $016 premium plan without foregoing significant CSR subsidies. That is because, in many cases, the $016 premium plans which would become available to enrollees would be at the bronze metal level. As previously noted, individuals and families with household incomes below 200% FPL are eligible to receive significant cost sharing subsidies in addition to their federal premium subsidies; however, those CSR subsidies are only available if those individuals and families enroll in a silver metal plan. Therefore, if those individuals and families were to “buy‐down” to a bronze plan, they could potentially access a $016 premium plan but would forego their CSR subsidies. The total percentage of enrollees that could access a plan with $016 premium without foregoing significant cost sharing subsidies is provided in the right‐most column of Table 6.2.
While each of the State‐sponsored subsidy structures being considered will make health insurance coverage more affordable for those individuals and families who are eligible to receive them, additional consideration should be made with respect to how the various structures could improve the affordability of coverage for eligible enrollees who have certain characteristics more than others. In particular, key characteristics that will impact how the affordability for specific enrollees is impacted by the various potential subsidy structures include age, family size, and household income. As noted above, Appendix D has been included to help demonstrate how the potential subsidy structures would impact affordability differently based on these key characteristics. Additionally, below we provide a summary highlighting some of the key takeaways from Appendix D.
16 $0 Premium refers to the portion of premium attributable to EHBs; enrollees may still be required to pay a nominal premium (< $1) for benefits beyond EHBs.

Study of State‐Sponsored Subsidies for the New Jersey Individual Market
Coverage Affordability
© Oliver Wyman 37
Age – For individuals and families with household incomes at or below 400% FPL, the percentage impact of the State‐sponsored premium subsidies on their net premium rates would not be expected to vary significantly by age, if at all. This is because, for the individuals and families with the same household income, regardless of age, the premium rates for those individuals are currently capped at the same percentage of their household income. Therefore, to the extent a uniform flat‐dollar State‐sponsored premium subsidy (e.g., FD400‐100) or Applicable Percentage State‐sponsored premium subsidy (e.g., AP400‐100) is applied to that net amount, the impact by age is similar.
% Change in Net Premium Rates by Age for Household Incomes at or Below 400% FPL
Subsidy Structure AP400 AP600 FD400 FD600
Relative Impact Similar by age Similar by age Similar by age Similar by age
On the other hand, for individuals and families with household incomes greater than 400% FPL, the percentage impact of the State‐sponsored premium subsidies on their net premium rates would be expected to vary significantly by age. In general, assuming all else equal, the flat‐dollar State‐sponsored premium subsidies (e.g., FD600‐100) would reduce premium rates for younger individuals and families by a higher percentage than for older individuals and families, while the Applicable Percentage State‐sponsored premium subsidies (e.g., AP600‐100) would reduce premium rates for older individuals and families by a higher percentage.
This outcome is driven by the federally prescribed age curve under the ACA which, for individuals and families with household incomes greater than 400% FPL, results in premium rates for older individuals and families that are higher than for younger individuals and families, sometimes by as much as 300%. Since the flat‐dollar State‐sponsored premium subsidies reduce all premium rates for a particular household income level by a uniform dollar amount, regardless of age, those subsidy structures will reduce the premium rates for younger individuals and families by a greater percentage than for older individuals and families.
Conversely, since the Applicable Percentage State‐sponsored premium subsidies set the Maximum Annual Premium rate owed by all eligible individuals and families with the same household income to the same level (e.g., 12.5% of household income), regardless of age, those subsidy structures will reduce the premium rates for older individuals and families by a greater percentage than for younger individuals and families.
% Change in Net Premium Rates by Age for Household Incomes at 401%‐600% FPL
Subsidy Structure AP400 AP600 FD400 FD600
Relative Impact N/A Greater for older individuals
N/A Greater for younger individuals
Household Income – For individuals and families with household incomes at or below 400% FPL, the percentage impact of the State‐sponsored premium structures which focus only on the 400% FPL or below population (i.e., the AP400 and FD400 structures) will be most impactful on their net premium rates. That is because, given that the full cost of the State‐sponsored
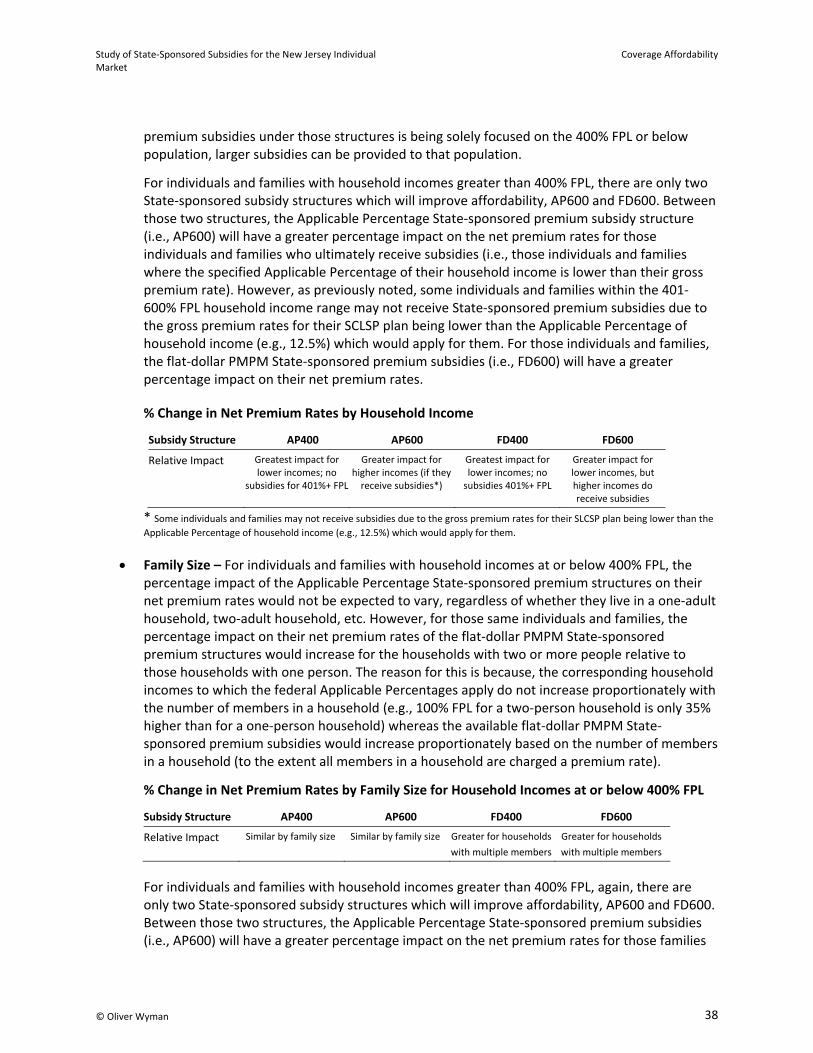
Study of State‐Sponsored Subsidies for the New Jersey Individual Market
Coverage Affordability
© Oliver Wyman 38
premium subsidies under those structures is being solely focused on the 400% FPL or below population, larger subsidies can be provided to that population.
For individuals and families with household incomes greater than 400% FPL, there are only two State‐sponsored subsidy structures which will improve affordability, AP600 and FD600. Between those two structures, the Applicable Percentage State‐sponsored premium subsidy structure (i.e., AP600) will have a greater percentage impact on the net premium rates for those individuals and families who ultimately receive subsidies (i.e., those individuals and families where the specified Applicable Percentage of their household income is lower than their gross premium rate). However, as previously noted, some individuals and families within the 401‐600% FPL household income range may not receive State‐sponsored premium subsidies due to the gross premium rates for their SCLSP plan being lower than the Applicable Percentage of household income (e.g., 12.5%) which would apply for them. For those individuals and families, the flat‐dollar PMPM State‐sponsored premium subsidies (i.e., FD600) will have a greater percentage impact on their net premium rates.
% Change in Net Premium Rates by Household Income
Subsidy Structure AP400 AP600 FD400 FD600
Relative Impact Greatest impact for lower incomes; no
subsidies for 401%+ FPL
Greater impact for higher incomes (if they receive subsidies*)
Greatest impact for lower incomes; no subsidies 401%+ FPL
Greater impact for lower incomes, but higher incomes do receive subsidies
* Some individuals and families may not receive subsidies due to the gross premium rates for their SLCSP plan being lower than the
Applicable Percentage of household income (e.g., 12.5%) which would apply for them.
Family Size – For individuals and families with household incomes at or below 400% FPL, the percentage impact of the Applicable Percentage State‐sponsored premium structures on their net premium rates would not be expected to vary, regardless of whether they live in a one‐adult household, two‐adult household, etc. However, for those same individuals and families, the percentage impact on their net premium rates of the flat‐dollar PMPM State‐sponsored premium structures would increase for the households with two or more people relative to those households with one person. The reason for this is because, the corresponding household incomes to which the federal Applicable Percentages apply do not increase proportionately with the number of members in a household (e.g., 100% FPL for a two‐person household is only 35% higher than for a one‐person household) whereas the available flat‐dollar PMPM State‐sponsored premium subsidies would increase proportionately based on the number of members in a household (to the extent all members in a household are charged a premium rate).
% Change in Net Premium Rates by Family Size for Household Incomes at or below 400% FPL
Subsidy Structure AP400 AP600 FD400 FD600
Relative Impact Similar by family size Similar by family size Greater for households
with multiple members
Greater for households
with multiple members
For individuals and families with household incomes greater than 400% FPL, again, there are only two State‐sponsored subsidy structures which will improve affordability, AP600 and FD600. Between those two structures, the Applicable Percentage State‐sponsored premium subsidies (i.e., AP600) will have a greater percentage impact on the net premium rates for those families

Study of State‐Sponsored Subsidies for the New Jersey Individual Market
Coverage Affordability
© Oliver Wyman 39
with two or more household members than for single adult households. This is because, for those families, their premium rates currently increase more proportionately to the size of the household than their premium rates would if they are tied to an Applicable Percentage of household income. The flat‐dollar PMPM State‐sponsored premium subsidies increase proportionately to the number of members in the household and, therefore, would have a similar percentage impact on net premium rates regardless of household size (with the exception that the flat‐dollar PMPM subsidies would be expected to represent a higher percentage of a dependent’s premium rate than an adult’s premium rate).
% Change in Net Premium Rates by Age for Household Incomes at 401%‐600% FPL
Subsidy Structure AP400 AP600 FD400 FD600
Relative Impact N/A Greater for households
with multiple members
N/A Similar by household size

Study of State‐Sponsored Subsidies for the New Jersey Individual Market
Final State Decision
© Oliver Wyman 40
7. FINAL STATE DECISION Following the passage of P.L. 2020, C. 61, which provides for the creation of additional State‐sponsored subsidies and after reviewing the results of the modeling that was performed, the State of New Jersey decided to move forward with a subsidy structure for plan year 2021 that provides a flat dollar premium subsidy to individuals and families with household incomes at or below 400% who enroll for coverage via Get Covered New Jersey.
Therefore, state residents shopping for health insurance on GetCovered.NJ.gov this Open Enrollment Period will have access to the new State‐sponsored subsidies, called New Jersey Health Plan Savings, on top of premium tax credits and cost‐sharing reductions available to lower the cost of their health insurance. Based on prior enrollment results, approximately 8 in 10 consumers purchasing coverage on Get Covered New Jersey are expected to qualify for assistance.
The estimated average State‐sponsored subsidy for an individual with an annual income up to 400% FPL ($51,040) is projected to be $578 per year, and the average State‐sponsored subsidy for a family of four with an annual income up to 400% FPL ($104,800) is projected to be $2,313 per year. The maximum reduction in premiums an individual could see in a year from State‐sponsored subsidies is $1,140, while the maximum reduction in premiums a family of four could see in a year from State‐sponsored subsidies is $4,560.
Due to the availability of the State‐sponsored subsidies, the net premium in 2021 for individuals with incomes under 400% FPL (who are eligible for both the subsidy and premium tax credits) will be the lowest in New Jersey since the implementation of Healthcare.gov and availability of federal tax credits. The average net premium for 2021, for those eligible for financial help, is expected to be $117 per member per month, compared to $164 per member per month in 2020, and $148 per member per month in 2014.
The subsidies will help reduce health insurance premiums for individuals and families with incomes at or below 400% FPL, whether they are new enrollees or have an existing health plan purchased through Healthcare.gov. The State‐sponsored subsidies will be applied to premiums for coverage that is effective January 1, 2021, or after. Residents currently enrolled in a health plan through Healthcare.gov will be automatically transitioned to Get Covered New Jersey.
The subsidy structure selected aligns with scenario FD400‐100 as described in the preceding sections of this report.
Table 7.1 State‐Sponsored Subsidies – FD400‐100
Household Income as a % of FPL FD400‐100
351% ‐ 400% $95
301% ‐ 350% $95
251% ‐ 300% $95
201% ‐ 250% $40
151% ‐ 200% $30
138% ‐ 150% $20

Study of State‐Sponsored Subsidies for the New Jersey Individual Market
Final State Decision
© Oliver Wyman 41
Table 7.1 above shows the final premium subsidy amounts that will be applied per member per month to qualifying individuals.
Many factors were considered when selecting the subsidy structure described, including the following:
1. Income levels of the current uninsured population ‐ Nearly 70% of the non‐elderly uninsured individuals in New Jersey with household incomes above 138% FPL have household incomes below 400% FPL. The selected subsidy structure focuses on this population by providing subsidies to those individuals and families with household incomes between 138% FPL and 400% FPL. By limiting the availability of subsidies to this range of household incomes, the subsidies are larger and expected to be more impactful than if they were spread to a broader range of household incomes. Additionally, P.L. 2020, C. 61, states that the funding collected through the assessment “shall be used only for the purposes of increasing affordability in the individual market and providing greater access to health insurance to the uninsured, including minors, with a primary focus on households with an income below 400 percent of the federal poverty level.”
2. Magnitude of federal APTCs currently available by household income level ‐ Although federal APTCs are available to individuals and families with household incomes between 138% FPL and 400% FPL, there are some individuals and families within that income range that receive smaller APTCs than others. In particular, the magnitudes of available federal APTCs decreases significantly for individuals and families with household income levels between 250% FPL and 400% FPL relative to those with household income levels below 250% FPL. Additionally, for younger individuals with household incomes close to 400% FPL, their monthly premiums are sometimes below the applicable percentage of household income used to determine APTCs; therefore, a number of those individuals may receive little or no federal APTCs. The State‐sponsored subsidies will provide additional financial aid for these segments of the population by supplementing the federal APTCs which are currently available to them.
3. Funding ‐ The selected subsidy structure was developed to target $100 Million in expected state spending for 2021. This cost was targeted after taking into consideration the magnitude of funding which is expected to be available for the program and balancing the desire to provide as much cost relief as possible to enrollees while also wanting to ensure that the State is in a position to cover its financial commitments to the extent actual enrollment results in 2021 are different than currently projected (e.g., if enrollment is significantly higher than is being projected).

Study of State‐Sponsored Subsidies for the New Jersey Individual Market
Acknowledgement of Qualifications
© Oliver Wyman 42
8. ACKNOWLEDGEMENT OF QUALIFICATIONS The State of New Jersey engaged Oliver Wyman Actuarial Consulting, Inc. to perform actuarial and economic analyses to explore the possibility of the State providing premium relief in addition to the federal subsidies currently provided under the ACA. The services provided consisted of microsimulation modeling and other analyses to determine various subsidy structures and corresponding expected enrollment that would result in targeted levels of State spending, the expected impact on the State’s reinsurance program, and the impact on affordability of coverage. Tammy Tomczyk, Ryan Schultz, and Corryn Brown, all Fellows of the Society of Actuaries, are responsible for this actuarial communication. They are all Members of the American Academy of Actuaries and meet the requirements to issue this report. For our modeling and analysis, we relied on a wide range of data and information as described throughout this report. This includes information received from carriers currently offering coverage in the Individual ACA market in New Jersey. Though we have reviewed the data for reasonableness and consistency, we have not independently audited or otherwise verified this data. Our review of the data may not reveal errors or imperfections. We have assumed the data provided is both accurate and complete. The results of our analysis are dependent on this assumption. If this data or information are inaccurate or incomplete, our findings and conclusions may need to be revised. All projections are based on data and information available as of June 15, 2020, and the projections are not a guarantee of results which might be achieved. The estimates included within are based on federal law, regulations issued by the United States Department of Health and Human Services and the Internal Revenue Service, and applicable laws and regulations of the State of New Jersey. Further, our estimates assume that current law as it relates to the Affordable Care Act, and other statutes and regulations that impact the health insurance markets, will continue in the future years without material change that would impact the results included in this report. In addition, the projections we show in this report are dependent upon a number of assumptions regarding the future economic environment, medical trend rates, carrier behavior, the behavior of individuals and employers in light of incentives and penalties, and a number of other factors. These assumptions are disclosed within the report and have been discussed with representatives from the State of New Jersey. While this analysis complies with the applicable Actuarial Standards of Practice, in particular ASOP No. 23, Data Quality and ASOP No 41, Actuarial Communication, users of this analysis should recognize that our projections involve estimates of future events, and are subject to economic, statistical and other unforeseen variations from projected values. We have not anticipated any extraordinary changes to the legal, social, or economic environment that might affect our projections. In particular, no explicit adjustments have been made regarding the potential impact that COVID‐19 may have in terms of the economic environment or other impact on premiums in 2021, relative to the experience relied upon to calibrate our models in which COVID‐19 was not present. For these reasons, no assurance can be given that the emerging experience will correspond to the projections in this analysis. To the extent future conditions are at variance with the assumptions we have made in developing these projections, actual results will vary from our projections, and the variance may be substantial.

Study of State‐Sponsored Subsidies for the New Jersey Individual Market
Acknowledgement of Qualifications
© Oliver Wyman 43
Oliver Wyman is not engaged in the practice of law and this report, which may include commentary on legal issues and regulations, does not constitute, nor is it a substitute for, legal advice. Accordingly, Oliver Wyman recommends that the State of New Jersey secure the advice of competent legal counsel with respect to any legal matters related to this report or otherwise. This report is intended to be read and used as a whole and not in parts. Separation or alteration of any section or page from the main body of this report is expressly forbidden and invalidates this report.

Study of State‐Sponsored Subsidies for the New Jersey Individual Market
Caveats and Limiting Conditions
© Oliver Wyman 44
9. CAVEATS AND LIMITING CONDITIONS This report is for the exclusive use of the State of New Jersey. This report is not intended for general circulation or publication, nor is it to be reproduced, quoted or distributed for any purpose without the prior written permission of Oliver Wyman. There are no third‐party beneficiaries with respect to this report, and Oliver Wyman does not accept any liability to any third party.
Information furnished by others, upon which all or portions of this report are based, is believed to be reliable but has not been independently verified, unless otherwise expressly indicated. Public information and industry and statistical data are from sources we deem to be reliable; however, we make no representation as to the accuracy or completeness of such information. The findings contained in this report may contain predictions based on current data and historical trends. Any such predictions are subject to inherent risks and uncertainties. Oliver Wyman accepts no responsibility for actual results or future events.
The opinions expressed in this report are valid only for the purpose stated herein and as of the date of this report. No obligation is assumed to revise this report to reflect changes, events or conditions, which occur subsequent to the date hereof.
All decisions in connection with the implementation or use of advice or recommendations contained in this report are the sole responsibility of the State of New Jersey. This report does not represent investment advice, nor does it provide an opinion regarding the fairness of any transaction to any and all parties.

Study of State‐Sponsored Subsidies for the New Jersey Individual Market
Appendix A
© Oliver Wyman 45
APPENDIX A. FIXED DOLLAR PMPM SUBSIDY SCENARIOS
Subsidy Scenario FD400‐50
Age Baseline Newly Insured
<= 26 61,748 20% 248 16%
27‐29 18,453 6% 0 0%
30‐34 28,997 9% 162 10%
35‐39 16,849 6% 0 0%
40‐44 19,881 6% 268 17%
45‐49 27,834 9% 202 13%
50‐54 30,444 10% 419 26%
55‐59 46,203 15% 95 6%
60‐64 55,770 18% 200 13%
Total 306,179 100% 1,595 100%
FPL Baseline Newly Insured
<= 200% 80,891 26% 401 25%
201% – 400% 88,131 29% 1,194 75%
401% + 137,157 45% 0 0%
Total 306,179 100% 1,595 100%
$151
$314
$222
$466
$86
$315
$24
$39
$39
$0 $100 $200 $300 $400 $500 $600 $700
Previously Subsidized (168,607)
Newly Subsidized (472)
Newly Insured (1,595)
Premium by Source for State‐Subsidized ACA Enrollees < 400% FPL
Member APTC State

Study of State‐Sponsored Subsidies for the New Jersey Individual Market
Appendix A
© Oliver Wyman 46
Subsidy Scenario FD400‐100
Age Baseline Newly Insured
<= 26 61,748 20% 1,062 20%
27‐29 18,453 6% 352 7%
30‐34 28,997 9% 691 13%
35‐39 16,849 6% 399 8%
40‐44 19,881 6% 425 8%
45‐49 27,834 9% 636 12%
50‐54 30,444 10% 1,096 21%
55‐59 46,203 15% 241 5%
60‐64 55,770 18% 376 7%
Total 306,179 100% 5,278 100%
FPL Baseline Newly Insured
<= 200% 80,891 26% 686 13%
201% – 400% 88,131 29% 4,592 87%
401% + 137,157 45% 0 0%
Total 306,179 100% 5,278 100%
$135
$237
$180
$470
$169
$252
$46
$83
$82
$0 $100 $200 $300 $400 $500 $600 $700
Previously Subsidized (168,646)
Newly Subsidized (603)
Newly Insured (5,278)
Premium by Source for State‐Subsidized ACA Enrollees < 400% FPL
Member APTC State

Study of State‐Sponsored Subsidies for the New Jersey Individual Market
Appendix A
© Oliver Wyman 47
Subsidy Scenario FD400‐150
Age Baseline Newly Insured
<= 26 61,748 20% 1,741 17%
27‐29 18,453 6% 915 9%
30‐34 28,997 9% 1,619 16%
35‐39 16,849 6% 934 9%
40‐44 19,881 6% 951 9%
45‐49 27,834 9% 1,280 12%
50‐54 30,444 10% 1,386 13%
55‐59 46,203 15% 916 9%
60‐64 55,770 18% 539 5%
Total 306,179 100% 10,280 100%
FPL Baseline Newly Insured
<= 200% 80,891 26% 1,023 10%
201% – 400% 88,131 29% 9,258 90%
401% + 137,157 45% 0 0%
Total 306,179 100% 10,280 100%
$122
$174
$164
$472
$168
$238
$66
$124
$119
$0 $100 $200 $300 $400 $500 $600 $700
Previously Subsidized (168,614)
Newly Subsidized (828)
Newly Insured (10,280)
Premium by Source for State‐Subsidized ACA Enrollees < 400% FPL
Member APTC State

Study of State‐Sponsored Subsidies for the New Jersey Individual Market
Appendix A
© Oliver Wyman 48
Subsidy Scenario FD600‐50
Age Baseline Newly Insured
<= 26 61,748 20% 275 19%
27‐29 18,453 6% 0 0%
30‐34 28,997 9% 83 6%
35‐39 16,849 6% 0 0%
40‐44 19,881 6% 256 18%
45‐49 27,834 9% 223 16%
50‐54 30,444 10% 192 14%
55‐59 46,203 15% 194 14%
60‐64 55,770 18% 201 14%
Total 306,179 100% 1,424 100%
FPL Baseline Newly Insured
<= 200% 80,891 26% 78 5%
201% – 400% 88,131 29% 1,097 77%
401% + 137,157 45% 249 17%
Total 306,179 100% 1,424 100%
$473
$557
$156
$379
$238
$467
$275
$39
$39
$18
$39
$37
$0 $100 $200 $300 $400 $500 $600 $700
Newly Subsidized (23,741)
Newly Insured (249)
Previously Subsidized (168,254)
Newly Subsidized (359)
Newly Insured (1,175)
Premium by Source for State‐Subsidized ACA Enrollees
Member APTC State
Over
400% FPL
Under
400% FPL

Study of State‐Sponsored Subsidies for the New Jersey Individual Market
Appendix A
© Oliver Wyman 49
Subsidy Scenario FD600‐100
Age Baseline Newly Insured
<= 26 61,748 20% 819 22%
27‐29 18,453 6% 33 1%
30‐34 28,997 9% 522 14%
35‐39 16,849 6% 418 11%
40‐44 19,881 6% 288 8%
45‐49 27,834 9% 399 11%
50‐54 30,444 10% 511 14%
55‐59 46,203 15% 405 11%
60‐64 55,770 18% 264 7%
Total 306,179 100% 3,659 100%
FPL Baseline Newly Insured
<= 200% 80,891 26% 517 14%
201% – 400% 88,131 29% 2,801 77%
401% + 137,157 45% 341 9%
Total 306,179 100% 3,659 100%
$493
$473
$144
$298
$183
$470
$88
$287
$65
$65
$36
$55
$55
$0 $100 $200 $300 $400 $500 $600 $700
Newly Subsidized (30,763)
Newly Insured (341)
Previously Subsidized (168,646)
Newly Subsidized (472)
Newly Insured (3,318)
Premium by Source for State‐Subsidized ACA Enrollees
Member APTC State
Over
400% FPL
Under
400% FPL

Study of State‐Sponsored Subsidies for the New Jersey Individual Market
Appendix A
© Oliver Wyman 50
Subsidy Scenario FD600‐150
Age Baseline Newly Insured
<= 26 61,748 20% 1,901 22%
27‐29 18,453 6% 697 8%
30‐34 28,997 9% 971 11%
35‐39 16,849 6% 806 9%
40‐44 19,881 6% 648 8%
45‐49 27,834 9% 1,414 16%
50‐54 30,444 10% 1,195 14%
55‐59 46,203 15% 563 7%
60‐64 55,770 18% 376 4%
Total 306,179 100% 8,572 100%
FPL Baseline Newly Insured
<= 200% 80,891 26% 686 8%
201% – 400% 88,131 29% 6,329 74%
401% + 137,157 45% 1,557 18%
Total 306,179 100% 8,572 100%
$537
$402
$136
$244
$171
$472
$161
$262
$90
$90
$51
$79
$79
$0 $100 $200 $300 $400 $500 $600 $700
Newly Subsidized (35,358)
Newly Insured (1,557)
Previously Subsidized (168,614)
Newly Subsidized (635)
Newly Insured (7,015)
Premium by Source for State‐Subsidized ACA Enrollees
Member APTC State
Over
400% FPL
Under
400% FPL

Study of State‐Sponsored Subsidies for the New Jersey Individual Market
Appendix B
© Oliver Wyman 51
APPENDIX B. APPLICABLE PERCENTAGE SUBSIDY SCENARIOS
Subsidy Scenario AP400‐50
Age Baseline Newly Insured
<= 26 61,748 20% 392 19%
27‐29 18,453 6% 0 0%
30‐34 28,997 9% 321 16%
35‐39 16,849 6% 0 0%
40‐44 19,881 6% 265 13%
45‐49 27,834 9% 196 10%
50‐54 30,444 10% 511 25%
55‐59 46,203 15% 95 5%
60‐64 55,770 18% 280 14%
Total 306,179 100% 2,059 100%
FPL Baseline Newly Insured
<= 200% 80,891 26% 721 35%
201% – 400% 88,131 29% 1,338 65%
401% + 137,157 45% 0 0%
Total 306,179 100% 2,059 100%
$150
$358
$213
$468
$8
$316
$24
$60
$41
$0 $100 $200 $300 $400 $500 $600 $700
Previously Subsidized (167,799)
Newly Subsidized (359)
Newly Insured (2,059)
Premium by Source for State‐Subsidized ACA Enrollees < 400% FPL
Member APTC State

Study of State‐Sponsored Subsidies for the New Jersey Individual Market
Appendix B
© Oliver Wyman 52
Subsidy Scenario AP400‐100
Age Baseline Newly Insured
<= 26 61,748 20% 935 15%
27‐29 18,453 6% 135 2%
30‐34 28,997 9% 904 14%
35‐39 16,849 6% 667 10%
40‐44 19,881 6% 391 6%
45‐49 27,834 9% 975 15%
50‐54 30,444 10% 1,183 19%
55‐59 46,203 15% 687 11%
60‐64 55,770 18% 484 8%
Total 306,179 100% 6,362 100%
FPL Baseline Newly Insured
<= 200% 80,891 26% 1,465 23%
201% – 400% 88,131 29% 4,897 77%
401% + 137,157 45% 0 0%
Total 306,179 100% 6,362 100%
$132
$254
$195
$471
$88
$280
$46
$99
$84
$0 $100 $200 $300 $400 $500 $600 $700
Previously Subsidized (168,197)
Newly Subsidized (472)
Newly Insured (6,362)
Premium by Source for State‐Subsidized ACA Enrollees < 400% FPL
Member APTC State

Study of State‐Sponsored Subsidies for the New Jersey Individual Market
Appendix B
© Oliver Wyman 53
Subsidy Scenario AP400‐150
Age Baseline Newly Insured
<= 26 61,748 20% 2,206 18%
27‐29 18,453 6% 657 5%
30‐34 28,997 9% 1,785 14%
35‐39 16,849 6% 1,405 11%
40‐44 19,881 6% 1,494 12%
45‐49 27,834 9% 1,571 13%
50‐54 30,444 10% 1,484 12%
55‐59 46,203 15% 1,045 8%
60‐64 55,770 18% 689 6%
Total 306,179 100% 12,336 100%
FPL Baseline Newly Insured
<= 200% 80,891 26% 2,448 20%
201% – 400% 88,131 29% 9,889 80%
401% + 137,157 45% 0 0%
Total 306,179 100% 12,336 100%
$118
$219
$170
$472
$83
$247
$65
$135
$112
$0 $100 $200 $300 $400 $500 $600 $700
Previously Subsidized (168,465)
Newly Subsidized (504)
Newly Insured (12,336)
Premium by Source for State‐Subsidized ACA Enrollees < 400% FPL
Member APTC State

Study of State‐Sponsored Subsidies for the New Jersey Individual Market
Appendix B
© Oliver Wyman 54
Subsidy Scenario AP600‐50
Age Baseline Newly Insured
<= 26 61,748 20% 688 30%
27‐29 18,453 6% 0 0%
30‐34 28,997 9% 53 2%
35‐39 16,849 6% 0 0%
40‐44 19,881 6% 215 9%
45‐49 27,834 9% 258 11%
50‐54 30,444 10% 165 7%
55‐59 46,203 15% 296 13%
60‐64 55,770 18% 643 28%
Total 306,179 100% 2,317 100%
FPL Baseline Newly Insured
<= 200% 80,891 26% 78 3%
201% – 400% 88,131 29% 876 38%
401% + 137,157 45% 1,363 59%
Total 306,179 100% 2,317 100%
$623
$513
$159
$377
$263
$469
$275
$210
$273
$14
$36
$29
$0 $100 $200 $300 $400 $500 $600 $700 $800 $900
Newly Subsidized (6,883)
Newly Insured (1,363)
Previously Subsidized (167,360)
Newly Subsidized (286)
Newly Insured (954)
Premium by Source for State‐Subsidized ACA Enrollees
Member APTC State
Over
400% FPL
Under
400% FPL

Study of State‐Sponsored Subsidies for the New Jersey Individual Market
Appendix B
© Oliver Wyman 55
Subsidy Scenario AP600‐100
Age Baseline Newly Insured
<= 26 61,748 20% 1,417 28%
27‐29 18,453 6% 0 0%
30‐34 28,997 9% 133 3%
35‐39 16,849 6% 76 2%
40‐44 19,881 6% 440 9%
45‐49 27,834 9% 355 7%
50‐54 30,444 10% 1,003 20%
55‐59 46,203 15% 637 13%
60‐64 55,770 18% 1,017 20%
Total 306,179 100% 5,078 100%
FPL Baseline Newly Insured
<= 200% 80,891 26% 385 8%
201% – 400% 88,131 29% 1,237 24%
401% + 137,157 45% 3,455 68%
Total 306,179 100% 5,078 100%
$586
$444
$152
$354
$230
$471
$10
$338
$249
$284
$22
$64
$45
$0 $200 $400 $600 $800 $1,000
Newly Subsidized (14,300)
Newly Insured (3,455)
Previously Subsidized (167,843)
Newly Subsidized (359)
Newly Insured (1,622)
Premium by Source for State‐Subsidized ACA Enrollees
Member APTC State
Over
400% FPL
Under
400% FPL

Study of State‐Sponsored Subsidies for the New Jersey Individual Market
Appendix B
© Oliver Wyman 56
Subsidy Scenario AP600‐150
Age Baseline Newly Insured
<= 26 61,748 20% 2,388 26%
27‐29 18,453 6% 0 0%
30‐34 28,997 9% 613 7%
35‐39 16,849 6% 373 4%
40‐44 19,881 6% 664 7%
45‐49 27,834 9% 897 10%
50‐54 30,444 10% 1,414 16%
55‐59 46,203 15% 1,111 12%
60‐64 55,770 18% 1,562 17%
Total 306,179 100% 9,021 100%
FPL Baseline Newly Insured
<= 200% 80,891 26% 721 8%
201% – 400% 88,131 29% 3,194 35%
401% + 137,157 45% 5,106 57%
Total 306,179 100% 9,021 100%
$514
$434
$143
$314
$207
$472
$295
$275
$297
$33
$100
$68
$0 $100 $200 $300 $400 $500 $600 $700 $800
Newly Subsidized (18,599)
Newly Insured (5,106)
Previously Subsidized (168,125)
Newly Subsidized (392)
Newly Insured (3,915)
Premium by Source for State‐Subsidized ACA Enrollees
Member APTC State
Over
400% FPL
Under
400% FPL

Study of State‐Sponsored Subsidies for the New Jersey Individual Market
Appendix C
© Oliver Wyman 57
APPENDIX C. REINSURANCE SENSITIVITY TESTING SCENARIOS
Sensitivity testing around our best estimate assumptions was performed to provide DOBI with an understanding of the volatility of the projected net cost to the State of New Jersey. When performing sensitivity testing, only the underlying assumption listed was changed, even though changes in other assumptions may be expected. If multiple assumptions are changed relative to the baseline scenario, the differences in the net cost to the State of New Jersey relative to the baseline scenario could be compounded and would not be expected to be additive.
Assumption Change Description of the Assumption Change
Total Enrollment +/‐ 10% Total Individual ACA enrollment was assumed to be 10% lower or higher in both the baseline and reinsurance scenarios relative to the best estimate assumptions. As an example, these scenarios could occur as a result of changes in economic conditions (e.g., an increase in unemployment could result in a reduction in employer‐sponsored coverage and an increase in enrollment in the Individual ACA market).
Non‐APTC Enrollment +/‐ 10% Non‐subsidized Individual ACA enrollment was assumed to be 10% lower or higher in both the baseline and reinsurance scenarios relative to the best estimate assumptions. Subsidized Individual ACA enrollment was assumed to be equal to best estimate assumptions.
Reduction in Morbidity Improvement
The morbidity improvement assumed in the development of carriers’ 2021 premium rates was reduced by 50% and 100% (e.g., if the original assumption is 0.4%, the morbidity improvement assumption was tested at levels equal to 0.2% and 0.0%)
SLCSP Higher Than Expected The 2021 SLCSP rates were assumed to be either 0.5% less or 1.0% less than the best estimate assumption (i.e., the SLCSP rates under the reinsurance scenario were higher than expected, resulting in less pass‐through funding) with no change to the average premium rates for any other plans, and no change to morbidity or member plan selection
PTC/APTC Ratio +/‐ 1% The PTC/APTC ratio which gets applied by Treasury in the calculation of pass‐through savings was assumed to be 1% lower or higher than projected under the best estimate scenario.
SLCSP with Reinsurance +/‐ 3% Relative to Projected
The 2021 SLCSP rates were assumed to change 3% less or more than projected with no change to the average premium rates for any other plan.
Claims +5% Claim costs within the specified reinsurance parameters were assumed to increase 5% relative to the best estimate assumptions.
Claims +5% and premium +5%
Claim costs within the specified reinsurance parameters were assumed to increase 5% relative to the best estimate assumptions and premium rates were assumed to be 5% higher than currently projected.
Premium +5%, no change to claims
Claim costs within the specified reinsurance parameters were assumed to remain equal to the best estimate assumptions but premium rates were assumed to be 5% higher than currently projected.

Study of State‐Sponsored Subsidies for the New Jersey Individual Market Appendix D
© Oliver Wyman 58
APPENDIX D. COMPARISON PREMIUMS AFTER STATE‐SPONSORED SUBSIDIES
Summary of Estimated State Subsidy Impact to Net SLCSP Rate (Essex County) by Household Income, Family Type, and Subsidy Structure ‐ Age 27, $50M Scenarios
Single ‐ Age 27
Household Members 1 Applicable % State Net Premium Change in Net Applicable % State Net Premium Change in Net State Net Premium Change in Net State Net Premium Change in Net
Annual Gross SLCS Current Subsidized with State Subsidy After State Premium with State Subsidy After State Premium Subsidy After State Premium Subsidy After State Premium
Household Income Premium PMPM Applicable % Premium PMPM Subsidy PMPM Subsidy PMPM PMPM Subsidy PMPM Subsidy PMPM PMPM PMPM Subsidy PMPM PMPM PMPM Subsidy PMPM PMPM
650% FPL $82,940 $351 N/A $351 N/A $0 $351 0% N/A $0 $351 0% $0 $351 0% $0 $351 0%
600% FPL $76,560 $351 N/A $351 N/A $0 $351 0% 20.0% $0 $351 0% $0 $351 0% $39 $312 ‐11%
550% FPL $70,180 $351 N/A $351 N/A $0 $351 0% 20.0% $0 $351 0% $0 $351 0% $39 $312 ‐11%
500% FPL $63,800 $351 N/A $351 N/A $0 $351 0% 20.0% $0 $351 0% $0 $351 0% $39 $312 ‐11%
450% FPL $57,420 $351 N/A $351 N/A $0 $351 0% 20.0% $0 $351 0% $0 $351 0% $39 $312 ‐11%
400% FPL $51,040 $351 9.79% $351 8.3% $0 $351 0% 8.9% $0 $351 0% $45 $306 ‐13% $39 $312 ‐11%
300% FPL $38,280 $351 9.79% $312 8.3% $48 $265 ‐15% 8.9% $29 $284 ‐9% $45 $267 ‐14% $39 $273 ‐12%
250% FPL $31,900 $351 8.30% $221 7.3% $27 $194 ‐12% 7.6% $20 $201 ‐9% $20 $201 ‐9% $15 $206 ‐7%
200% FPL $25,520 $351 6.50% $138 5.5% $21 $117 ‐15% 6.0% $11 $128 ‐8% $20 $118 ‐14% $10 $128 ‐7%
150% FPL $19,140 $351 4.13% $66 3.1% $16 $50 ‐24% 3.6% $8 $58 ‐12% $10 $56 ‐15% $10 $56 ‐15%
138% FPL $17,609 $351 3.09% $45 2.1% $15 $31 ‐32% 2.6% $7 $38 ‐16% $10 $35 ‐22% $10 $35 ‐22%
Couple ‐ Age 27
Household Members 2 Applicable % State Net Premium Change in Net Applicable % State Net Premium Change in Net State Net Premium Change in Net State Net Premium Change in Net
Annual Gross SLCS Current Subsidized with State Subsidy After State Premium with State Subsidy After State Premium Subsidy After State Premium Subsidy After State Premium
Household Income Premium PMPM Applicable % Premium PMPM Subsidy PMPM Subsidy PMPM PMPM Subsidy PMPM Subsidy PMPM PMPM PMPM Subsidy PMPM PMPM PMPM Subsidy PMPM PMPM650% FPL $112,060 $701 N/A $701 N/A $0 $701 0% N/A $0 $701 0% $0 $701 0% $0 $701 0%
600% FPL $103,440 $701 N/A $701 N/A $0 $701 0% 20.0% $0 $701 0% $0 $701 0% $78 $623 ‐11%
550% FPL $94,820 $701 N/A $701 N/A $0 $701 0% 20.0% $0 $701 0% $0 $701 0% $78 $623 ‐11%
500% FPL $86,200 $701 N/A $701 N/A $0 $701 0% 20.0% $0 $701 0% $0 $701 0% $78 $623 ‐11%
450% FPL $77,580 $701 N/A $701 N/A $0 $701 0% 20.0% $0 $701 0% $0 $701 0% $78 $623 ‐11%
400% FPL $68,960 $701 9.79% $563 8.3% $86 $477 ‐15% 8.9% $52 $511 ‐9% $90 $473 ‐16% $78 $485 ‐14%
300% FPL $51,720 $701 9.79% $422 8.3% $65 $357 ‐15% 8.9% $39 $383 ‐9% $90 $332 ‐21% $78 $344 ‐18%
250% FPL $43,100 $701 8.30% $298 7.3% $36 $262 ‐12% 7.6% $27 $271 ‐9% $40 $258 ‐13% $30 $268 ‐10%
200% FPL $34,480 $701 6.50% $187 5.5% $29 $158 ‐15% 6.0% $14 $172 ‐8% $40 $147 ‐21% $20 $167 ‐11%
150% FPL $25,860 $701 4.13% $89 3.1% $22 $67 ‐24% 3.6% $11 $78 ‐12% $20 $69 ‐22% $20 $69 ‐22%
138% FPL $23,791 $701 3.09% $61 2.1% $20 $42 ‐32% 2.6% $10 $51 ‐16% $20 $41 ‐33% $20 $41 ‐33%
Couple (Age 27) + 1 Child (Under age 14)
Household Members 3 Applicable % State Net Premium Change in Net Applicable % State Net Premium Change in Net State Net Premium Change in Net State Net Premium Change in Net
Annual Gross SLCS Current Subsidized with State Subsidy After State Premium with State Subsidy After State Premium Subsidy After State Premium Subsidy After State Premium
Household Income Premium PMPM Applicable % Premium PMPM Subsidy PMPM Subsidy PMPM PMPM Subsidy PMPM Subsidy PMPM PMPM PMPM Subsidy PMPM PMPM PMPM Subsidy PMPM PMPM
650% FPL $141,180 $957 N/A $957 N/A $0 $957 0% N/A $0 $957 0% $0 $957 0% $0 $957 0%
600% FPL $130,320 $957 N/A $957 N/A $0 $957 0% 20.0% $0 $957 0% $0 $957 0% $117 $840 ‐12%
550% FPL $119,460 $957 N/A $957 N/A $0 $957 0% 20.0% $0 $957 0% $0 $957 0% $117 $840 ‐12%
500% FPL $108,600 $957 N/A $957 N/A $0 $957 0% 20.0% $0 $957 0% $0 $957 0% $117 $840 ‐12%
450% FPL $97,740 $957 N/A $957 N/A $0 $957 0% 20.0% $0 $957 0% $0 $957 0% $117 $840 ‐12%
400% FPL $86,880 $957 9.79% $709 8.3% $109 $600 ‐15% 8.9% $65 $644 ‐9% $135 $574 ‐19% $117 $592 ‐17%
300% FPL $65,160 $957 9.79% $532 8.3% $81 $450 ‐15% 8.9% $49 $483 ‐9% $135 $397 ‐25% $117 $415 ‐22%
250% FPL $54,300 $957 8.30% $376 7.3% $45 $330 ‐12% 7.6% $34 $342 ‐9% $60 $316 ‐16% $45 $331 ‐12%
200% FPL $43,440 $957 6.50% $235 5.5% $36 $199 ‐15% 6.0% $18 $217 ‐8% $60 $175 ‐26% $30 $205 ‐13%
150% FPL $32,580 $957 4.13% $112 3.1% $27 $85 ‐24% 3.6% $14 $98 ‐12% $30 $82 ‐27% $30 $82 ‐27%
138% FPL $29,974 $957 3.09% $77 2.1% $25 $52 ‐32% 2.6% $12 $65 ‐16% $30 $47 ‐39% $30 $47 ‐39%
Couple (Age 27) + 2 Children (Under age 14)
Household Members 4 Applicable % State Net Premium Change in Net Applicable % State Net Premium Change in Net State Net Premium Change in Net State Net Premium Change in Net
Annual Gross SLCS Current Subsidized with State Subsidy After State Premium with State Subsidy After State Premium Subsidy After State Premium Subsidy After State Premium
Household Income Premium PMPM Applicable % Premium PMPM Subsidy PMPM Subsidy PMPM PMPM Subsidy PMPM Subsidy PMPM PMPM PMPM Subsidy PMPM PMPM PMPM Subsidy PMPM PMPM
650% FPL $170,300 $1,213 N/A $1,213 N/A $0 $1,213 0% N/A $0 $1,213 0% $0 $1,213 0% $0 $1,213 0%
600% FPL $157,200 $1,213 N/A $1,213 N/A $0 $1,213 0% 20.0% $0 $1,213 0% $0 $1,213 0% $156 $1,057 ‐13%
550% FPL $144,100 $1,213 N/A $1,213 N/A $0 $1,213 0% 20.0% $0 $1,213 0% $0 $1,213 0% $156 $1,057 ‐13%
500% FPL $131,000 $1,213 N/A $1,213 N/A $0 $1,213 0% 20.0% $0 $1,213 0% $0 $1,213 0% $156 $1,057 ‐13%
450% FPL $117,900 $1,213 N/A $1,213 N/A $0 $1,213 0% 20.0% $0 $1,213 0% $0 $1,213 0% $156 $1,057 ‐13%
400% FPL $104,800 $1,213 9.79% $855 8.3% $131 $724 ‐15% 8.9% $79 $777 ‐9% $180 $675 ‐21% $156 $699 ‐18%
300% FPL $78,600 $1,213 9.79% $641 8.3% $98 $543 ‐15% 8.9% $59 $582 ‐9% $180 $461 ‐28% $156 $485 ‐24%
250% FPL $65,500 $1,213 8.30% $453 7.3% $55 $399 ‐12% 7.6% $41 $412 ‐9% $80 $373 ‐18% $60 $393 ‐13%
200% FPL $52,400 $1,213 6.50% $284 5.5% $44 $240 ‐15% 6.0% $22 $262 ‐8% $80 $204 ‐28% $40 $244 ‐14%
150% FPL $39,300 $1,213 4.13% $135 3.1% $33 $102 ‐24% 3.6% $16 $119 ‐12% $40 $95 ‐30% $40 $95 ‐30%
138% FPL $36,156 $1,213 3.09% $93 2.1% $30 $63 ‐32% 2.6% $15 $78 ‐16% $40 $53 ‐43% $40 $53 ‐43%
AP400‐50 AP600‐50 FD400‐50 FD600‐50
AP400‐50 AP600‐50 FD400‐50 FD600‐50
AP400‐50 AP600‐50 FD400‐50 FD600‐50
AP400‐50 AP600‐50 FD400‐50 FD600‐50

Study of State‐Sponsored Subsidies for the New Jersey Individual Market Appendix D
© Oliver Wyman 59
Summary of Estimated State Subsidy Impact to Net SLCSP Rate (Essex County) by Household Income, Family Type, and Subsidy Structure ‐ Age 40, $50M Scenarios
Single ‐ Age 40
Household Members 1 Applicable % State Net Premium Change in Net Applicable % State Net Premium Change in Net State Net Premium Change in Net State Net Premium Change in Net
Annual Gross SLCS Current Subsidized with State Subsidy After State Premium with State Subsidy After State Premium Subsidy After State Premium Subsidy After State Premium
Household Income Premium PMPM Applicable % Premium PMPM Subsidy PMPM Subsidy PMPM PMPM Subsidy PMPM Subsidy PMPM PMPM PMPM Subsidy PMPM PMPM PMPM Subsidy PMPM PMPM
650% FPL $82,940 $428 N/A $428 N/A $0 $428 0% N/A $0 $428 0% $0 $428 0% $0 $428 0%
600% FPL $76,560 $428 N/A $428 N/A $0 $428 0% 20.0% $0 $428 0% $0 $428 0% $39 $389 ‐9%
550% FPL $70,180 $428 N/A $428 N/A $0 $428 0% 20.0% $0 $428 0% $0 $428 0% $39 $389 ‐9%
500% FPL $63,800 $428 N/A $428 N/A $0 $428 0% 20.0% $0 $428 0% $0 $428 0% $39 $389 ‐9%
450% FPL $57,420 $428 N/A $428 N/A $0 $428 0% 20.0% $0 $428 0% $0 $428 0% $39 $389 ‐9%
400% FPL $51,040 $428 9.79% $417 8.3% $64 $353 ‐15% 8.9% $38 $378 ‐9% $45 $372 ‐11% $39 $378 ‐9%
300% FPL $38,280 $428 9.79% $312 8.3% $48 $265 ‐15% 8.9% $29 $284 ‐9% $45 $267 ‐14% $39 $273 ‐12%
250% FPL $31,900 $428 8.30% $221 7.3% $27 $194 ‐12% 7.6% $20 $201 ‐9% $20 $201 ‐9% $15 $206 ‐7%
200% FPL $25,520 $428 6.50% $138 5.5% $21 $117 ‐15% 6.0% $11 $128 ‐8% $20 $118 ‐14% $10 $128 ‐7%
150% FPL $19,140 $428 4.13% $66 3.1% $16 $50 ‐24% 3.6% $8 $58 ‐12% $10 $56 ‐15% $10 $56 ‐15%
138% FPL $17,609 $428 3.09% $45 2.1% $15 $31 ‐32% 2.6% $7 $38 ‐16% $10 $35 ‐22% $10 $35 ‐22%
Couple ‐ Age 40
Household Members 2 Applicable % State Net Premium Change in Net Applicable % State Net Premium Change in Net State Net Premium Change in Net State Net Premium Change in Net
Annual Gross SLCS Current Subsidized with State Subsidy After State Premium with State Subsidy After State Premium Subsidy After State Premium Subsidy After State Premium
Household Income Premium PMPM Applicable % Premium PMPM Subsidy PMPM Subsidy PMPM PMPM Subsidy PMPM Subsidy PMPM PMPM PMPM Subsidy PMPM PMPM PMPM Subsidy PMPM PMPM650% FPL $112,060 $855 N/A $855 N/A $0 $855 0% N/A $0 $855 0% $0 $855 0% $0 $855 0%
600% FPL $103,440 $855 N/A $855 N/A $0 $855 0% 20.0% $0 $855 0% $0 $855 0% $78 $777 ‐9%
550% FPL $94,820 $855 N/A $855 N/A $0 $855 0% 20.0% $0 $855 0% $0 $855 0% $78 $777 ‐9%
500% FPL $86,200 $855 N/A $855 N/A $0 $855 0% 20.0% $0 $855 0% $0 $855 0% $78 $777 ‐9%
450% FPL $77,580 $855 N/A $855 N/A $0 $855 0% 20.0% $0 $855 0% $0 $855 0% $78 $777 ‐9%
400% FPL $68,960 $855 9.79% $563 8.3% $86 $477 ‐15% 8.9% $52 $511 ‐9% $90 $473 ‐16% $78 $485 ‐14%
300% FPL $51,720 $855 9.79% $422 8.3% $65 $357 ‐15% 8.9% $39 $383 ‐9% $90 $332 ‐21% $78 $344 ‐18%
250% FPL $43,100 $855 8.30% $298 7.3% $36 $262 ‐12% 7.6% $27 $271 ‐9% $40 $258 ‐13% $30 $268 ‐10%
200% FPL $34,480 $855 6.50% $187 5.5% $29 $158 ‐15% 6.0% $14 $172 ‐8% $40 $147 ‐21% $20 $167 ‐11%
150% FPL $25,860 $855 4.13% $89 3.1% $22 $67 ‐24% 3.6% $11 $78 ‐12% $20 $69 ‐22% $20 $69 ‐22%
138% FPL $23,791 $855 3.09% $61 2.1% $20 $42 ‐32% 2.6% $10 $51 ‐16% $20 $41 ‐33% $20 $41 ‐33%
Couple (Age 40) + 1 Child (Under age 14)
Household Members 3 Applicable % State Net Premium Change in Net Applicable % State Net Premium Change in Net State Net Premium Change in Net State Net Premium Change in Net
Annual Gross SLCS Current Subsidized with State Subsidy After State Premium with State Subsidy After State Premium Subsidy After State Premium Subsidy After State Premium
Household Income Premium PMPM Applicable % Premium PMPM Subsidy PMPM Subsidy PMPM PMPM Subsidy PMPM Subsidy PMPM PMPM PMPM Subsidy PMPM PMPM PMPM Subsidy PMPM PMPM
650% FPL $141,180 $1,111 N/A $1,111 N/A $0 $1,111 0% N/A $0 $1,111 0% $0 $1,111 0% $0 $1,111 0%
600% FPL $130,320 $1,111 N/A $1,111 N/A $0 $1,111 0% 20.0% $0 $1,111 0% $0 $1,111 0% $117 $994 ‐11%
550% FPL $119,460 $1,111 N/A $1,111 N/A $0 $1,111 0% 20.0% $0 $1,111 0% $0 $1,111 0% $117 $994 ‐11%
500% FPL $108,600 $1,111 N/A $1,111 N/A $0 $1,111 0% 20.0% $0 $1,111 0% $0 $1,111 0% $117 $994 ‐11%
450% FPL $97,740 $1,111 N/A $1,111 N/A $0 $1,111 0% 20.0% $0 $1,111 0% $0 $1,111 0% $117 $994 ‐11%
400% FPL $86,880 $1,111 9.79% $709 8.3% $109 $600 ‐15% 8.9% $65 $644 ‐9% $135 $574 ‐19% $117 $592 ‐17%
300% FPL $65,160 $1,111 9.79% $532 8.3% $81 $450 ‐15% 8.9% $49 $483 ‐9% $135 $397 ‐25% $117 $415 ‐22%
250% FPL $54,300 $1,111 8.30% $376 7.3% $45 $330 ‐12% 7.6% $34 $342 ‐9% $60 $316 ‐16% $45 $331 ‐12%
200% FPL $43,440 $1,111 6.50% $235 5.5% $36 $199 ‐15% 6.0% $18 $217 ‐8% $60 $175 ‐26% $30 $205 ‐13%
150% FPL $32,580 $1,111 4.13% $112 3.1% $27 $85 ‐24% 3.6% $14 $98 ‐12% $30 $82 ‐27% $30 $82 ‐27%
138% FPL $29,974 $1,111 3.09% $77 2.1% $25 $52 ‐32% 2.6% $12 $65 ‐16% $30 $47 ‐39% $30 $47 ‐39%
Couple (Age 40) + 2 Children (Under age 14)
Household Members 4 Applicable % State Net Premium Change in Net Applicable % State Net Premium Change in Net State Net Premium Change in Net State Net Premium Change in Net
Annual Gross SLCS Current Subsidized with State Subsidy After State Premium with State Subsidy After State Premium Subsidy After State Premium Subsidy After State Premium
Household Income Premium PMPM Applicable % Premium PMPM Subsidy PMPM Subsidy PMPM PMPM Subsidy PMPM Subsidy PMPM PMPM PMPM Subsidy PMPM PMPM PMPM Subsidy PMPM PMPM
650% FPL $170,300 $1,367 N/A $1,367 N/A $0 $1,367 0% N/A $0 $1,367 0% $0 $1,367 0% $0 $1,367 0%
600% FPL $157,200 $1,367 N/A $1,367 N/A $0 $1,367 0% 20.0% $0 $1,367 0% $0 $1,367 0% $156 $1,211 ‐11%
550% FPL $144,100 $1,367 N/A $1,367 N/A $0 $1,367 0% 20.0% $0 $1,367 0% $0 $1,367 0% $156 $1,211 ‐11%
500% FPL $131,000 $1,367 N/A $1,367 N/A $0 $1,367 0% 20.0% $0 $1,367 0% $0 $1,367 0% $156 $1,211 ‐11%
450% FPL $117,900 $1,367 N/A $1,367 N/A $0 $1,367 0% 20.0% $0 $1,367 0% $0 $1,367 0% $156 $1,211 ‐11%
400% FPL $104,800 $1,367 9.79% $855 8.3% $131 $724 ‐15% 8.9% $79 $777 ‐9% $180 $675 ‐21% $156 $699 ‐18%
300% FPL $78,600 $1,367 9.79% $641 8.3% $98 $543 ‐15% 8.9% $59 $582 ‐9% $180 $461 ‐28% $156 $485 ‐24%
250% FPL $65,500 $1,367 8.30% $453 7.3% $55 $399 ‐12% 7.6% $41 $412 ‐9% $80 $373 ‐18% $60 $393 ‐13%
200% FPL $52,400 $1,367 6.50% $284 5.5% $44 $240 ‐15% 6.0% $22 $262 ‐8% $80 $204 ‐28% $40 $244 ‐14%
150% FPL $39,300 $1,367 4.13% $135 3.1% $33 $102 ‐24% 3.6% $16 $119 ‐12% $40 $95 ‐30% $40 $95 ‐30%
138% FPL $36,156 $1,367 3.09% $93 2.1% $30 $63 ‐32% 2.6% $15 $78 ‐16% $40 $53 ‐43% $40 $53 ‐43%
AP400‐50 AP600‐50 FD400‐50 FD600‐50
AP400‐50 AP600‐50 FD400‐50 FD600‐50
AP400‐50 AP600‐50 FD400‐50 FD600‐50
AP400‐50 AP600‐50 FD400‐50 FD600‐50

Study of State‐Sponsored Subsidies for the New Jersey Individual Market Appendix D
© Oliver Wyman 60
Summary of Estimated State Subsidy Impact to Net SLCSP Rate (Essex County) by Household Income, Family Type, and Subsidy Structure ‐ Age 60, $50M Scenarios
Single ‐ Age 60
Household Members 1 Applicable % State Net Premium Change in Net Applicable % State Net Premium Change in Net State Net Premium Change in Net State Net Premium Change in Net
Annual Gross SLCS Current Subsidized with State Subsidy After State Premium with State Subsidy After State Premium Subsidy After State Premium Subsidy After State Premium
Household Income Premium PMPM Applicable % Premium PMPM Subsidy PMPM Subsidy PMPM PMPM Subsidy PMPM Subsidy PMPM PMPM PMPM Subsidy PMPM PMPM PMPM Subsidy PMPM PMPM
650% FPL $82,940 $908 N/A $908 N/A $0 $908 0% N/A $0 $908 0% $0 $908 0% $0 $908 0%
600% FPL $76,560 $908 N/A $908 N/A $0 $908 0% 20.0% $0 $908 0% $0 $908 0% $39 $869 ‐4%
550% FPL $70,180 $908 N/A $908 N/A $0 $908 0% 20.0% $0 $908 0% $0 $908 0% $39 $869 ‐4%
500% FPL $63,800 $908 N/A $908 N/A $0 $908 0% 20.0% $0 $908 0% $0 $908 0% $39 $869 ‐4%
450% FPL $57,420 $908 N/A $908 N/A $0 $908 0% 20.0% $0 $908 0% $0 $908 0% $39 $869 ‐4%
400% FPL $51,040 $908 9.79% $417 8.3% $64 $353 ‐15% 8.9% $38 $378 ‐9% $45 $372 ‐11% $39 $378 ‐9%
300% FPL $38,280 $908 9.79% $312 8.3% $48 $265 ‐15% 8.9% $29 $284 ‐9% $45 $267 ‐14% $39 $273 ‐12%
250% FPL $31,900 $908 8.30% $221 7.3% $27 $194 ‐12% 7.6% $20 $201 ‐9% $20 $201 ‐9% $15 $206 ‐7%
200% FPL $25,520 $908 6.50% $138 5.5% $21 $117 ‐15% 6.0% $11 $128 ‐8% $20 $118 ‐14% $10 $128 ‐7%
150% FPL $19,140 $908 4.13% $66 3.1% $16 $50 ‐24% 3.6% $8 $58 ‐12% $10 $56 ‐15% $10 $56 ‐15%
138% FPL $17,609 $908 3.09% $45 2.1% $15 $31 ‐32% 2.6% $7 $38 ‐16% $10 $35 ‐22% $10 $35 ‐22%
Couple ‐ Age 60
Household Members 2 Applicable % State Net Premium Change in Net Applicable % State Net Premium Change in Net State Net Premium Change in Net State Net Premium Change in Net
Annual Gross SLCS Current Subsidized with State Subsidy After State Premium with State Subsidy After State Premium Subsidy After State Premium Subsidy After State Premium
Household Income Premium PMPM Applicable % Premium PMPM Subsidy PMPM Subsidy PMPM PMPM Subsidy PMPM Subsidy PMPM PMPM PMPM Subsidy PMPM PMPM PMPM Subsidy PMPM PMPM650% FPL $112,060 $1,816 N/A $1,816 N/A $0 $1,816 0% N/A $0 $1,816 0% $0 $1,816 0% $0 $1,816 0%
600% FPL $103,440 $1,816 N/A $1,816 N/A $0 $1,816 0% 20.0% $92 $1,724 ‐5% $0 $1,816 0% $78 $1,738 ‐4%
550% FPL $94,820 $1,816 N/A $1,816 N/A $0 $1,816 0% 20.0% $236 $1,580 ‐13% $0 $1,816 0% $78 $1,738 ‐4%
500% FPL $86,200 $1,816 N/A $1,816 N/A $0 $1,816 0% 20.0% $380 $1,437 ‐21% $0 $1,816 0% $78 $1,738 ‐4%
450% FPL $77,580 $1,816 N/A $1,816 N/A $0 $1,816 0% 20.0% $523 $1,293 ‐29% $0 $1,816 0% $78 $1,738 ‐4%
400% FPL $68,960 $1,816 9.79% $563 8.3% $86 $477 ‐15% 8.9% $52 $511 ‐9% $90 $473 ‐16% $78 $485 ‐14%
300% FPL $51,720 $1,816 9.79% $422 8.3% $65 $357 ‐15% 8.9% $39 $383 ‐9% $90 $332 ‐21% $78 $344 ‐18%
250% FPL $43,100 $1,816 8.30% $298 7.3% $36 $262 ‐12% 7.6% $27 $271 ‐9% $40 $258 ‐13% $30 $268 ‐10%
200% FPL $34,480 $1,816 6.50% $187 5.5% $29 $158 ‐15% 6.0% $14 $172 ‐8% $40 $147 ‐21% $20 $167 ‐11%
150% FPL $25,860 $1,816 4.13% $89 3.1% $22 $67 ‐24% 3.6% $11 $78 ‐12% $20 $69 ‐22% $20 $69 ‐22%
138% FPL $23,791 $1,816 3.09% $61 2.1% $20 $42 ‐32% 2.6% $10 $51 ‐16% $20 $41 ‐33% $20 $41 ‐33%
Couple (Age 60) + 1 Child (Under age 14)
Household Members 3 Applicable % State Net Premium Change in Net Applicable % State Net Premium Change in Net State Net Premium Change in Net State Net Premium Change in Net
Annual Gross SLCS Current Subsidized with State Subsidy After State Premium with State Subsidy After State Premium Subsidy After State Premium Subsidy After State Premium
Household Income Premium PMPM Applicable % Premium PMPM Subsidy PMPM Subsidy PMPM PMPM Subsidy PMPM Subsidy PMPM PMPM PMPM Subsidy PMPM PMPM PMPM Subsidy PMPM PMPM
650% FPL $141,180 $2,072 N/A $2,072 N/A $0 $2,072 0% N/A $0 $2,072 0% $0 $2,072 0% $0 $2,072 0%
600% FPL $130,320 $2,072 N/A $2,072 N/A $0 $2,072 0% 20.0% $0 $2,072 0% $0 $2,072 0% $117 $1,955 ‐6%
550% FPL $119,460 $2,072 N/A $2,072 N/A $0 $2,072 0% 20.0% $81 $1,991 ‐4% $0 $2,072 0% $117 $1,955 ‐6%
500% FPL $108,600 $2,072 N/A $2,072 N/A $0 $2,072 0% 20.0% $262 $1,810 ‐13% $0 $2,072 0% $117 $1,955 ‐6%
450% FPL $97,740 $2,072 N/A $2,072 N/A $0 $2,072 0% 20.0% $443 $1,629 ‐21% $0 $2,072 0% $117 $1,955 ‐6%
400% FPL $86,880 $2,072 9.79% $709 8.3% $109 $600 ‐15% 8.9% $65 $644 ‐9% $135 $574 ‐19% $117 $592 ‐17%
300% FPL $65,160 $2,072 9.79% $532 8.3% $81 $450 ‐15% 8.9% $49 $483 ‐9% $135 $397 ‐25% $117 $415 ‐22%
250% FPL $54,300 $2,072 8.30% $376 7.3% $45 $330 ‐12% 7.6% $34 $342 ‐9% $60 $316 ‐16% $45 $331 ‐12%
200% FPL $43,440 $2,072 6.50% $235 5.5% $36 $199 ‐15% 6.0% $18 $217 ‐8% $60 $175 ‐26% $30 $205 ‐13%
150% FPL $32,580 $2,072 4.13% $112 3.1% $27 $85 ‐24% 3.6% $14 $98 ‐12% $30 $82 ‐27% $30 $82 ‐27%
138% FPL $29,974 $2,072 3.09% $77 2.1% $25 $52 ‐32% 2.6% $12 $65 ‐16% $30 $47 ‐39% $30 $47 ‐39%
Couple (Age 60) + 2 Children (Under age 14)
Household Members 4 Applicable % State Net Premium Change in Net Applicable % State Net Premium Change in Net State Net Premium Change in Net State Net Premium Change in Net
Annual Gross SLCS Current Subsidized with State Subsidy After State Premium with State Subsidy After State Premium Subsidy After State Premium Subsidy After State Premium
Household Income Premium PMPM Applicable % Premium PMPM Subsidy PMPM Subsidy PMPM PMPM Subsidy PMPM Subsidy PMPM PMPM PMPM Subsidy PMPM PMPM PMPM Subsidy PMPM PMPM
650% FPL $170,300 $2,328 N/A $2,328 N/A $0 $2,328 0% N/A $0 $2,328 0% $0 $2,328 0% $0 $2,328 0%
600% FPL $157,200 $2,328 N/A $2,328 N/A $0 $2,328 0% 20.0% $0 $2,328 0% $0 $2,328 0% $156 $2,172 ‐7%
550% FPL $144,100 $2,328 N/A $2,328 N/A $0 $2,328 0% 20.0% $0 $2,328 0% $0 $2,328 0% $156 $2,172 ‐7%
500% FPL $131,000 $2,328 N/A $2,328 N/A $0 $2,328 0% 20.0% $145 $2,183 ‐6% $0 $2,328 0% $156 $2,172 ‐7%
450% FPL $117,900 $2,328 N/A $2,328 N/A $0 $2,328 0% 20.0% $363 $1,965 ‐16% $0 $2,328 0% $156 $2,172 ‐7%
400% FPL $104,800 $2,328 9.79% $855 8.3% $131 $724 ‐15% 8.9% $79 $777 ‐9% $180 $675 ‐21% $156 $699 ‐18%
300% FPL $78,600 $2,328 9.79% $641 8.3% $98 $543 ‐15% 8.9% $59 $582 ‐9% $180 $461 ‐28% $156 $485 ‐24%
250% FPL $65,500 $2,328 8.30% $453 7.3% $55 $399 ‐12% 7.6% $41 $412 ‐9% $80 $373 ‐18% $60 $393 ‐13%
200% FPL $52,400 $2,328 6.50% $284 5.5% $44 $240 ‐15% 6.0% $22 $262 ‐8% $80 $204 ‐28% $40 $244 ‐14%
150% FPL $39,300 $2,328 4.13% $135 3.1% $33 $102 ‐24% 3.6% $16 $119 ‐12% $40 $95 ‐30% $40 $95 ‐30%
138% FPL $36,156 $2,328 3.09% $93 2.1% $30 $63 ‐32% 2.6% $15 $78 ‐16% $40 $53 ‐43% $40 $53 ‐43%
AP400‐50 AP600‐50 FD400‐50 FD600‐50
AP400‐50 AP600‐50 FD400‐50 FD600‐50
AP400‐50 AP600‐50 FD400‐50 FD600‐50
AP400‐50 AP600‐50 FD400‐50 FD600‐50

Study of State‐Sponsored Subsidies for the New Jersey Individual Market Appendix D
© Oliver Wyman 61
Summary of Estimated State Subsidy Impact to Net SLCSP Rate (Essex County) by Household Income, Family Type, and Subsidy Structure ‐ Age 27, $100M Scenarios
Single ‐ Age 27
Household Members 1 Applicable % State Net Premium Change in Net Applicable % State Net Premium Change in Net State Net Premium Change in Net State Net Premium Change in Net
Annual Gross SLCS Current Subsidized with State Subsidy After State Premium with State Subsidy After State Premium Subsidy After State Premium Subsidy After State Premium
Household Income Premium PMPM Applicable % Premium PMPM Subsidy PMPM Subsidy PMPM PMPM Subsidy PMPM Subsidy PMPM PMPM PMPM Subsidy PMPM PMPM PMPM Subsidy PMPM PMPM
650% FPL $82,940 $351 N/A $351 N/A $0 $351 0% N/A $0 $351 0% $0 $351 0% $0 $351 0%
600% FPL $76,560 $351 N/A $351 N/A $0 $351 0% 15.0% $0 $351 0% $0 $351 0% $65 $286 ‐19%
550% FPL $70,180 $351 N/A $351 N/A $0 $351 0% 15.0% $0 $351 0% $0 $351 0% $65 $286 ‐19%
500% FPL $63,800 $351 N/A $351 N/A $0 $351 0% 12.5% $0 $351 0% $0 $351 0% $65 $286 ‐19%
450% FPL $57,420 $351 N/A $351 N/A $0 $351 0% 12.5% $0 $351 0% $0 $351 0% $65 $286 ‐19%
400% FPL $51,040 $351 9.79% $351 6.8% $62 $289 ‐18% 8.2% $2 $348 ‐1% $95 $256 ‐27% $65 $286 ‐19%
300% FPL $38,280 $351 9.79% $312 6.8% $96 $217 ‐31% 8.2% $51 $261 ‐16% $95 $217 ‐30% $65 $247 ‐21%
250% FPL $31,900 $351 8.30% $221 6.3% $53 $168 ‐24% 7.3% $27 $194 ‐12% $40 $181 ‐18% $50 $171 ‐23%
200% FPL $25,520 $351 6.50% $138 4.5% $43 $96 ‐31% 5.7% $16 $122 ‐12% $30 $108 ‐22% $22 $116 ‐16%
150% FPL $19,140 $351 4.13% $66 2.4% $28 $38 ‐42% 3.4% $12 $54 ‐18% $20 $46 ‐30% $10 $56 ‐15%
138% FPL $17,609 $351 3.09% $45 1.6% $22 $23 ‐48% 2.3% $11 $34 ‐24% $20 $25 ‐44% $10 $35 ‐22%
Couple ‐ Age 27
Household Members 2 Applicable % State Net Premium Change in Net Applicable % State Net Premium Change in Net State Net Premium Change in Net State Net Premium Change in Net
Annual Gross SLCS Current Subsidized with State Subsidy After State Premium with State Subsidy After State Premium Subsidy After State Premium Subsidy After State Premium
Household Income Premium PMPM Applicable % Premium PMPM Subsidy PMPM Subsidy PMPM PMPM Subsidy PMPM Subsidy PMPM PMPM PMPM Subsidy PMPM PMPM PMPM Subsidy PMPM PMPM650% FPL $112,060 $701 N/A $701 N/A $0 $701 0% N/A $0 $701 0% $0 $701 0% $0 $701 0%
600% FPL $103,440 $701 N/A $701 N/A $0 $701 0% 15.0% $0 $701 0% $0 $701 0% $130 $571 ‐19%
550% FPL $94,820 $701 N/A $701 N/A $0 $701 0% 15.0% $0 $701 0% $0 $701 0% $130 $571 ‐19%
500% FPL $86,200 $701 N/A $701 N/A $0 $701 0% 12.5% $0 $701 0% $0 $701 0% $130 $571 ‐19%
450% FPL $77,580 $701 N/A $701 N/A $0 $701 0% 12.5% $0 $701 0% $0 $701 0% $130 $571 ‐19%
400% FPL $68,960 $701 9.79% $563 6.8% $172 $390 ‐31% 8.2% $92 $471 ‐16% $190 $373 ‐34% $130 $433 ‐23%
300% FPL $51,720 $701 9.79% $422 6.8% $129 $293 ‐31% 8.2% $69 $353 ‐16% $190 $232 ‐45% $130 $292 ‐31%
250% FPL $43,100 $701 8.30% $298 6.3% $72 $226 ‐24% 7.3% $36 $262 ‐12% $80 $218 ‐27% $100 $198 ‐34%
200% FPL $34,480 $701 6.50% $187 4.5% $57 $129 ‐31% 5.7% $22 $165 ‐12% $60 $127 ‐32% $44 $143 ‐24%
150% FPL $25,860 $701 4.13% $89 2.4% $38 $51 ‐42% 3.4% $16 $73 ‐18% $40 $49 ‐45% $20 $69 ‐22%
138% FPL $23,791 $701 3.09% $61 1.6% $30 $32 ‐48% 2.3% $15 $46 ‐24% $40 $21 ‐65% $20 $41 ‐33%
Couple (Age 27) + 1 Child (Under age 14)
Household Members 3 Applicable % State Net Premium Change in Net Applicable % State Net Premium Change in Net State Net Premium Change in Net State Net Premium Change in Net
Annual Gross SLCS Current Subsidized with State Subsidy After State Premium with State Subsidy After State Premium Subsidy After State Premium Subsidy After State Premium
Household Income Premium PMPM Applicable % Premium PMPM Subsidy PMPM Subsidy PMPM PMPM Subsidy PMPM Subsidy PMPM PMPM PMPM Subsidy PMPM PMPM PMPM Subsidy PMPM PMPM
650% FPL $141,180 $957 N/A $957 N/A $0 $957 0% N/A $0 $957 0% $0 $957 0% $0 $957 0%
600% FPL $130,320 $957 N/A $957 N/A $0 $957 0% 15.0% $0 $957 0% $0 $957 0% $195 $762 ‐20%
550% FPL $119,460 $957 N/A $957 N/A $0 $957 0% 15.0% $0 $957 0% $0 $957 0% $195 $762 ‐20%
500% FPL $108,600 $957 N/A $957 N/A $0 $957 0% 12.5% $0 $957 0% $0 $957 0% $195 $762 ‐20%
450% FPL $97,740 $957 N/A $957 N/A $0 $957 0% 12.5% $0 $957 0% $0 $957 0% $195 $762 ‐20%
400% FPL $86,880 $957 9.79% $709 6.8% $217 $492 ‐31% 8.2% $116 $593 ‐16% $285 $424 ‐40% $195 $514 ‐28%
300% FPL $65,160 $957 9.79% $532 6.8% $163 $369 ‐31% 8.2% $87 $445 ‐16% $285 $247 ‐54% $195 $337 ‐37%
250% FPL $54,300 $957 8.30% $376 6.3% $91 $285 ‐24% 7.3% $45 $330 ‐12% $120 $256 ‐32% $150 $226 ‐40%
200% FPL $43,440 $957 6.50% $235 4.5% $72 $163 ‐31% 5.7% $27 $208 ‐12% $90 $145 ‐38% $66 $169 ‐28%
150% FPL $32,580 $957 4.13% $112 2.4% $48 $64 ‐42% 3.4% $20 $92 ‐18% $60 $52 ‐54% $30 $82 ‐27%
138% FPL $29,974 $957 3.09% $77 1.6% $37 $40 ‐48% 2.3% $19 $59 ‐24% $60 $17 ‐78% $30 $47 ‐39%
Couple (Age 27) + 2 Children (Under age 14)
Household Members 4 Applicable % State Net Premium Change in Net Applicable % State Net Premium Change in Net State Net Premium Change in Net State Net Premium Change in Net
Annual Gross SLCS Current Subsidized with State Subsidy After State Premium with State Subsidy After State Premium Subsidy After State Premium Subsidy After State Premium
Household Income Premium PMPM Applicable % Premium PMPM Subsidy PMPM Subsidy PMPM PMPM Subsidy PMPM Subsidy PMPM PMPM PMPM Subsidy PMPM PMPM PMPM Subsidy PMPM PMPM
650% FPL $170,300 $1,213 N/A $1,213 N/A $0 $1,213 0% N/A $0 $1,213 0% $0 $1,213 0% $0 $1,213 0%
600% FPL $157,200 $1,213 N/A $1,213 N/A $0 $1,213 0% 15.0% $0 $1,213 0% $0 $1,213 0% $260 $953 ‐21%
550% FPL $144,100 $1,213 N/A $1,213 N/A $0 $1,213 0% 15.0% $0 $1,213 0% $0 $1,213 0% $260 $953 ‐21%
500% FPL $131,000 $1,213 N/A $1,213 N/A $0 $1,213 0% 12.5% $0 $1,213 0% $0 $1,213 0% $260 $953 ‐21%
450% FPL $117,900 $1,213 N/A $1,213 N/A $0 $1,213 0% 12.5% $0 $1,213 0% $0 $1,213 0% $260 $953 ‐21%
400% FPL $104,800 $1,213 9.79% $855 6.8% $262 $593 ‐31% 8.2% $140 $716 ‐16% $380 $475 ‐44% $260 $595 ‐30%
300% FPL $78,600 $1,213 9.79% $641 6.8% $197 $445 ‐31% 8.2% $105 $537 ‐16% $380 $261 ‐59% $260 $381 ‐41%
250% FPL $65,500 $1,213 8.30% $453 6.3% $109 $344 ‐24% 7.3% $55 $399 ‐12% $160 $293 ‐35% $200 $253 ‐44%
200% FPL $52,400 $1,213 6.50% $284 4.5% $87 $196 ‐31% 5.7% $33 $251 ‐12% $120 $164 ‐42% $88 $196 ‐31%
150% FPL $39,300 $1,213 4.13% $135 2.4% $57 $78 ‐42% 3.4% $25 $111 ‐18% $80 $55 ‐59% $40 $95 ‐30%
138% FPL $36,156 $1,213 3.09% $93 1.6% $45 $48 ‐48% 2.3% $23 $71 ‐24% $80 $13 ‐86% $40 $53 ‐43%
AP400‐100 AP600‐100 FD400‐100 FD600‐100
AP400‐100 AP600‐100 FD400‐100 FD600‐100
AP400‐100 AP600‐100 FD400‐100 FD600‐100
AP400‐100 AP600‐100 FD400‐100 FD600‐100

Study of State‐Sponsored Subsidies for the New Jersey Individual Market Appendix D
© Oliver Wyman 62
Summary of Estimated State Subsidy Impact to Net SLCSP Rate (Essex County) by Household Income, Family Type, and Subsidy Structure ‐ Age 40, $100M Scenarios
Single ‐ Age 40
Household Members 1 Applicable % State Net Premium Change in Net Applicable % State Net Premium Change in Net State Net Premium Change in Net State Net Premium Change in Net
Annual Gross SLCS Current Subsidized with State Subsidy After State Premium with State Subsidy After State Premium Subsidy After State Premium Subsidy After State Premium
Household Income Premium PMPM Applicable % Premium PMPM Subsidy PMPM Subsidy PMPM PMPM Subsidy PMPM Subsidy PMPM PMPM PMPM Subsidy PMPM PMPM PMPM Subsidy PMPM PMPM
650% FPL $82,940 $428 N/A $428 N/A $0 $428 0% N/A $0 $428 0% $0 $428 0% $0 $428 0%
600% FPL $76,560 $428 N/A $428 N/A $0 $428 0% 15.0% $0 $428 0% $0 $428 0% $65 $363 ‐15%
550% FPL $70,180 $428 N/A $428 N/A $0 $428 0% 15.0% $0 $428 0% $0 $428 0% $65 $363 ‐15%
500% FPL $63,800 $428 N/A $428 N/A $0 $428 0% 12.5% $0 $428 0% $0 $428 0% $65 $363 ‐15%
450% FPL $57,420 $428 N/A $428 N/A $0 $428 0% 12.5% $0 $428 0% $0 $428 0% $65 $363 ‐15%
400% FPL $51,040 $428 9.79% $417 6.8% $128 $289 ‐31% 8.2% $68 $348 ‐16% $95 $322 ‐23% $65 $352 ‐16%
300% FPL $38,280 $428 9.79% $312 6.8% $96 $217 ‐31% 8.2% $51 $261 ‐16% $95 $217 ‐30% $65 $247 ‐21%
250% FPL $31,900 $428 8.30% $221 6.3% $53 $168 ‐24% 7.3% $27 $194 ‐12% $40 $181 ‐18% $50 $171 ‐23%
200% FPL $25,520 $428 6.50% $138 4.5% $43 $96 ‐31% 5.7% $16 $122 ‐12% $30 $108 ‐22% $22 $116 ‐16%
150% FPL $19,140 $428 4.13% $66 2.4% $28 $38 ‐42% 3.4% $12 $54 ‐18% $20 $46 ‐30% $10 $56 ‐15%
138% FPL $17,609 $428 3.09% $45 1.6% $22 $23 ‐48% 2.3% $11 $34 ‐24% $20 $25 ‐44% $10 $35 ‐22%
Couple ‐ Age 40
Household Members 2 Applicable % State Net Premium Change in Net Applicable % State Net Premium Change in Net State Net Premium Change in Net State Net Premium Change in Net
Annual Gross SLCS Current Subsidized with State Subsidy After State Premium with State Subsidy After State Premium Subsidy After State Premium Subsidy After State Premium
Household Income Premium PMPM Applicable % Premium PMPM Subsidy PMPM Subsidy PMPM PMPM Subsidy PMPM Subsidy PMPM PMPM PMPM Subsidy PMPM PMPM PMPM Subsidy PMPM PMPM650% FPL $112,060 $855 N/A $855 N/A $0 $855 0% N/A $0 $855 0% $0 $855 0% $0 $855 0%
600% FPL $103,440 $855 N/A $855 N/A $0 $855 0% 15.0% $0 $855 0% $0 $855 0% $130 $725 ‐15%
550% FPL $94,820 $855 N/A $855 N/A $0 $855 0% 15.0% $0 $855 0% $0 $855 0% $130 $725 ‐15%
500% FPL $86,200 $855 N/A $855 N/A $0 $855 0% 12.5% $0 $855 0% $0 $855 0% $130 $725 ‐15%
450% FPL $77,580 $855 N/A $855 N/A $0 $855 0% 12.5% $47 $808 ‐6% $0 $855 0% $130 $725 ‐15%
400% FPL $68,960 $855 9.79% $563 6.8% $172 $390 ‐31% 8.2% $92 $471 ‐16% $190 $373 ‐34% $130 $433 ‐23%
300% FPL $51,720 $855 9.79% $422 6.8% $129 $293 ‐31% 8.2% $69 $353 ‐16% $190 $232 ‐45% $130 $292 ‐31%
250% FPL $43,100 $855 8.30% $298 6.3% $72 $226 ‐24% 7.3% $36 $262 ‐12% $80 $218 ‐27% $100 $198 ‐34%
200% FPL $34,480 $855 6.50% $187 4.5% $57 $129 ‐31% 5.7% $22 $165 ‐12% $60 $127 ‐32% $44 $143 ‐24%
150% FPL $25,860 $855 4.13% $89 2.4% $38 $51 ‐42% 3.4% $16 $73 ‐18% $40 $49 ‐45% $20 $69 ‐22%
138% FPL $23,791 $855 3.09% $61 1.6% $30 $32 ‐48% 2.3% $15 $46 ‐24% $40 $21 ‐65% $20 $41 ‐33%
Couple (Age 40) + 1 Child (Under age 14)
Household Members 3 Applicable % State Net Premium Change in Net Applicable % State Net Premium Change in Net State Net Premium Change in Net State Net Premium Change in Net
Annual Gross SLCS Current Subsidized with State Subsidy After State Premium with State Subsidy After State Premium Subsidy After State Premium Subsidy After State Premium
Household Income Premium PMPM Applicable % Premium PMPM Subsidy PMPM Subsidy PMPM PMPM Subsidy PMPM Subsidy PMPM PMPM PMPM Subsidy PMPM PMPM PMPM Subsidy PMPM PMPM
650% FPL $141,180 $1,111 N/A $1,111 N/A $0 $1,111 0% N/A $0 $1,111 0% $0 $1,111 0% $0 $1,111 0%
600% FPL $130,320 $1,111 N/A $1,111 N/A $0 $1,111 0% 15.0% $0 $1,111 0% $0 $1,111 0% $195 $916 ‐18%
550% FPL $119,460 $1,111 N/A $1,111 N/A $0 $1,111 0% 15.0% $0 $1,111 0% $0 $1,111 0% $195 $916 ‐18%
500% FPL $108,600 $1,111 N/A $1,111 N/A $0 $1,111 0% 12.5% $0 $1,111 0% $0 $1,111 0% $195 $916 ‐18%
450% FPL $97,740 $1,111 N/A $1,111 N/A $0 $1,111 0% 12.5% $93 $1,018 ‐8% $0 $1,111 0% $195 $916 ‐18%
400% FPL $86,880 $1,111 9.79% $709 6.8% $217 $492 ‐31% 8.2% $116 $593 ‐16% $285 $424 ‐40% $195 $514 ‐28%
300% FPL $65,160 $1,111 9.79% $532 6.8% $163 $369 ‐31% 8.2% $87 $445 ‐16% $285 $247 ‐54% $195 $337 ‐37%
250% FPL $54,300 $1,111 8.30% $376 6.3% $91 $285 ‐24% 7.3% $45 $330 ‐12% $120 $256 ‐32% $150 $226 ‐40%
200% FPL $43,440 $1,111 6.50% $235 4.5% $72 $163 ‐31% 5.7% $27 $208 ‐12% $90 $145 ‐38% $66 $169 ‐28%
150% FPL $32,580 $1,111 4.13% $112 2.4% $48 $64 ‐42% 3.4% $20 $92 ‐18% $60 $52 ‐54% $30 $82 ‐27%
138% FPL $29,974 $1,111 3.09% $77 1.6% $37 $40 ‐48% 2.3% $19 $59 ‐24% $60 $17 ‐78% $30 $47 ‐39%
Couple (Age 40) + 2 Children (Under age 14)
Household Members 4 Applicable % State Net Premium Change in Net Applicable % State Net Premium Change in Net State Net Premium Change in Net State Net Premium Change in Net
Annual Gross SLCS Current Subsidized with State Subsidy After State Premium with State Subsidy After State Premium Subsidy After State Premium Subsidy After State Premium
Household Income Premium PMPM Applicable % Premium PMPM Subsidy PMPM Subsidy PMPM PMPM Subsidy PMPM Subsidy PMPM PMPM PMPM Subsidy PMPM PMPM PMPM Subsidy PMPM PMPM
650% FPL $170,300 $1,367 N/A $1,367 N/A $0 $1,367 0% N/A $0 $1,367 0% $0 $1,367 0% $0 $1,367 0%
600% FPL $157,200 $1,367 N/A $1,367 N/A $0 $1,367 0% 15.0% $0 $1,367 0% $0 $1,367 0% $260 $1,107 ‐19%
550% FPL $144,100 $1,367 N/A $1,367 N/A $0 $1,367 0% 15.0% $0 $1,367 0% $0 $1,367 0% $260 $1,107 ‐19%
500% FPL $131,000 $1,367 N/A $1,367 N/A $0 $1,367 0% 12.5% $3 $1,365 0% $0 $1,367 0% $260 $1,107 ‐19%
450% FPL $117,900 $1,367 N/A $1,367 N/A $0 $1,367 0% 12.5% $139 $1,228 ‐10% $0 $1,367 0% $260 $1,107 ‐19%
400% FPL $104,800 $1,367 9.79% $855 6.8% $262 $593 ‐31% 8.2% $140 $716 ‐16% $380 $475 ‐44% $260 $595 ‐30%
300% FPL $78,600 $1,367 9.79% $641 6.8% $197 $445 ‐31% 8.2% $105 $537 ‐16% $380 $261 ‐59% $260 $381 ‐41%
250% FPL $65,500 $1,367 8.30% $453 6.3% $109 $344 ‐24% 7.3% $55 $399 ‐12% $160 $293 ‐35% $200 $253 ‐44%
200% FPL $52,400 $1,367 6.50% $284 4.5% $87 $196 ‐31% 5.7% $33 $251 ‐12% $120 $164 ‐42% $88 $196 ‐31%
150% FPL $39,300 $1,367 4.13% $135 2.4% $57 $78 ‐42% 3.4% $25 $111 ‐18% $80 $55 ‐59% $40 $95 ‐30%
138% FPL $36,156 $1,367 3.09% $93 1.6% $45 $48 ‐48% 2.3% $23 $71 ‐24% $80 $13 ‐86% $40 $53 ‐43%
AP400‐100 AP600‐100 FD400‐100 FD600‐100
AP400‐100 AP600‐100 FD400‐100 FD600‐100
AP400‐100 AP600‐100 FD400‐100 FD600‐100
AP400‐100 AP600‐100 FD400‐100 FD600‐100

Study of State‐Sponsored Subsidies for the New Jersey Individual Market Appendix D
© Oliver Wyman 63
Summary of Estimated State Subsidy Impact to Net SLCSP Rate (Essex County) by Household Income, Family Type, and Subsidy Structure ‐ Age 60, $100M Scenarios
Single ‐ Age 60
Household Members 1 Applicable % State Net Premium Change in Net Applicable % State Net Premium Change in Net State Net Premium Change in Net State Net Premium Change in Net
Annual Gross SLCS Current Subsidized with State Subsidy After State Premium with State Subsidy After State Premium Subsidy After State Premium Subsidy After State Premium
Household Income Premium PMPM Applicable % Premium PMPM Subsidy PMPM Subsidy PMPM PMPM Subsidy PMPM Subsidy PMPM PMPM PMPM Subsidy PMPM PMPM PMPM Subsidy PMPM PMPM
650% FPL $82,940 $908 N/A $908 N/A $0 $908 0% N/A $0 $908 0% $0 $908 0% $0 $908 0%
600% FPL $76,560 $908 N/A $908 N/A $0 $908 0% 15.0% $0 $908 0% $0 $908 0% $65 $843 ‐7%
550% FPL $70,180 $908 N/A $908 N/A $0 $908 0% 15.0% $31 $877 ‐3% $0 $908 0% $65 $843 ‐7%
500% FPL $63,800 $908 N/A $908 N/A $0 $908 0% 12.5% $244 $665 ‐27% $0 $908 0% $65 $843 ‐7%
450% FPL $57,420 $908 N/A $908 N/A $0 $908 0% 12.5% $310 $598 ‐34% $0 $908 0% $65 $843 ‐7%
400% FPL $51,040 $908 9.79% $417 6.8% $128 $289 ‐31% 8.2% $68 $348 ‐16% $95 $322 ‐23% $65 $352 ‐16%
300% FPL $38,280 $908 9.79% $312 6.8% $96 $217 ‐31% 8.2% $51 $261 ‐16% $95 $217 ‐30% $65 $247 ‐21%
250% FPL $31,900 $908 8.30% $221 6.3% $53 $168 ‐24% 7.3% $27 $194 ‐12% $40 $181 ‐18% $50 $171 ‐23%
200% FPL $25,520 $908 6.50% $138 4.5% $43 $96 ‐31% 5.7% $16 $122 ‐12% $30 $108 ‐22% $22 $116 ‐16%
150% FPL $19,140 $908 4.13% $66 2.4% $28 $38 ‐42% 3.4% $12 $54 ‐18% $20 $46 ‐30% $10 $56 ‐15%
138% FPL $17,609 $908 3.09% $45 1.6% $22 $23 ‐48% 2.3% $11 $34 ‐24% $20 $25 ‐44% $10 $35 ‐22%
Couple ‐ Age 60
Household Members 2 Applicable % State Net Premium Change in Net Applicable % State Net Premium Change in Net State Net Premium Change in Net State Net Premium Change in Net
Annual Gross SLCS Current Subsidized with State Subsidy After State Premium with State Subsidy After State Premium Subsidy After State Premium Subsidy After State Premium
Household Income Premium PMPM Applicable % Premium PMPM Subsidy PMPM Subsidy PMPM PMPM Subsidy PMPM Subsidy PMPM PMPM PMPM Subsidy PMPM PMPM PMPM Subsidy PMPM PMPM650% FPL $112,060 $1,816 N/A $1,816 N/A $0 $1,816 0% N/A $0 $1,816 0% $0 $1,816 0% $0 $1,816 0%
600% FPL $103,440 $1,816 N/A $1,816 N/A $0 $1,816 0% 15.0% $523 $1,293 ‐29% $0 $1,816 0% $130 $1,686 ‐7%
550% FPL $94,820 $1,816 N/A $1,816 N/A $0 $1,816 0% 15.0% $631 $1,185 ‐35% $0 $1,816 0% $130 $1,686 ‐7%
500% FPL $86,200 $1,816 N/A $1,816 N/A $0 $1,816 0% 12.5% $919 $898 ‐51% $0 $1,816 0% $130 $1,686 ‐7%
450% FPL $77,580 $1,816 N/A $1,816 N/A $0 $1,816 0% 12.5% $1,008 $808 ‐56% $0 $1,816 0% $130 $1,686 ‐7%
400% FPL $68,960 $1,816 9.79% $563 6.8% $172 $390 ‐31% 8.2% $92 $471 ‐16% $190 $373 ‐34% $130 $433 ‐23%
300% FPL $51,720 $1,816 9.79% $422 6.8% $129 $293 ‐31% 8.2% $69 $353 ‐16% $190 $232 ‐45% $130 $292 ‐31%
250% FPL $43,100 $1,816 8.30% $298 6.3% $72 $226 ‐24% 7.3% $36 $262 ‐12% $80 $218 ‐27% $100 $198 ‐34%
200% FPL $34,480 $1,816 6.50% $187 4.5% $57 $129 ‐31% 5.7% $22 $165 ‐12% $60 $127 ‐32% $44 $143 ‐24%
150% FPL $25,860 $1,816 4.13% $89 2.4% $38 $51 ‐42% 3.4% $16 $73 ‐18% $40 $49 ‐45% $20 $69 ‐22%
138% FPL $23,791 $1,816 3.09% $61 1.6% $30 $32 ‐48% 2.3% $15 $46 ‐24% $40 $21 ‐65% $20 $41 ‐33%
Couple (Age 60) + 1 Child (Under age 14)
Household Members 3 Applicable % State Net Premium Change in Net Applicable % State Net Premium Change in Net State Net Premium Change in Net State Net Premium Change in Net
Annual Gross SLCS Current Subsidized with State Subsidy After State Premium with State Subsidy After State Premium Subsidy After State Premium Subsidy After State Premium
Household Income Premium PMPM Applicable % Premium PMPM Subsidy PMPM Subsidy PMPM PMPM Subsidy PMPM Subsidy PMPM PMPM PMPM Subsidy PMPM PMPM PMPM Subsidy PMPM PMPM
650% FPL $141,180 $2,072 N/A $2,072 N/A $0 $2,072 0% N/A $0 $2,072 0% $0 $2,072 0% $0 $2,072 0%
600% FPL $130,320 $2,072 N/A $2,072 N/A $0 $2,072 0% 15.0% $443 $1,629 ‐21% $0 $2,072 0% $195 $1,877 ‐9%
550% FPL $119,460 $2,072 N/A $2,072 N/A $0 $2,072 0% 15.0% $579 $1,493 ‐28% $0 $2,072 0% $195 $1,877 ‐9%
500% FPL $108,600 $2,072 N/A $2,072 N/A $0 $2,072 0% 12.5% $941 $1,131 ‐45% $0 $2,072 0% $195 $1,877 ‐9%
450% FPL $97,740 $2,072 N/A $2,072 N/A $0 $2,072 0% 12.5% $1,054 $1,018 ‐51% $0 $2,072 0% $195 $1,877 ‐9%
400% FPL $86,880 $2,072 9.79% $709 6.8% $217 $492 ‐31% 8.2% $116 $593 ‐16% $285 $424 ‐40% $195 $514 ‐28%
300% FPL $65,160 $2,072 9.79% $532 6.8% $163 $369 ‐31% 8.2% $87 $445 ‐16% $285 $247 ‐54% $195 $337 ‐37%
250% FPL $54,300 $2,072 8.30% $376 6.3% $91 $285 ‐24% 7.3% $45 $330 ‐12% $120 $256 ‐32% $150 $226 ‐40%
200% FPL $43,440 $2,072 6.50% $235 4.5% $72 $163 ‐31% 5.7% $27 $208 ‐12% $90 $145 ‐38% $66 $169 ‐28%
150% FPL $32,580 $2,072 4.13% $112 2.4% $48 $64 ‐42% 3.4% $20 $92 ‐18% $60 $52 ‐54% $30 $82 ‐27%
138% FPL $29,974 $2,072 3.09% $77 1.6% $37 $40 ‐48% 2.3% $19 $59 ‐24% $60 $17 ‐78% $30 $47 ‐39%
Couple (Age 60) + 2 Children (Under age 14)
Household Members 4 Applicable % State Net Premium Change in Net Applicable % State Net Premium Change in Net State Net Premium Change in Net State Net Premium Change in Net
Annual Gross SLCS Current Subsidized with State Subsidy After State Premium with State Subsidy After State Premium Subsidy After State Premium Subsidy After State Premium
Household Income Premium PMPM Applicable % Premium PMPM Subsidy PMPM Subsidy PMPM PMPM Subsidy PMPM Subsidy PMPM PMPM PMPM Subsidy PMPM PMPM PMPM Subsidy PMPM PMPM
650% FPL $170,300 $2,328 N/A $2,328 N/A $0 $2,328 0% N/A $0 $2,328 0% $0 $2,328 0% $0 $2,328 0%
600% FPL $157,200 $2,328 N/A $2,328 N/A $0 $2,328 0% 15.0% $363 $1,965 ‐16% $0 $2,328 0% $260 $2,068 ‐11%
550% FPL $144,100 $2,328 N/A $2,328 N/A $0 $2,328 0% 15.0% $527 $1,801 ‐23% $0 $2,328 0% $260 $2,068 ‐11%
500% FPL $131,000 $2,328 N/A $2,328 N/A $0 $2,328 0% 12.5% $964 $1,365 ‐41% $0 $2,328 0% $260 $2,068 ‐11%
450% FPL $117,900 $2,328 N/A $2,328 N/A $0 $2,328 0% 12.5% $1,100 $1,228 ‐47% $0 $2,328 0% $260 $2,068 ‐11%
400% FPL $104,800 $2,328 9.79% $855 6.8% $262 $593 ‐31% 8.2% $140 $716 ‐16% $380 $475 ‐44% $260 $595 ‐30%
300% FPL $78,600 $2,328 9.79% $641 6.8% $197 $445 ‐31% 8.2% $105 $537 ‐16% $380 $261 ‐59% $260 $381 ‐41%
250% FPL $65,500 $2,328 8.30% $453 6.3% $109 $344 ‐24% 7.3% $55 $399 ‐12% $160 $293 ‐35% $200 $253 ‐44%
200% FPL $52,400 $2,328 6.50% $284 4.5% $87 $196 ‐31% 5.7% $33 $251 ‐12% $120 $164 ‐42% $88 $196 ‐31%
150% FPL $39,300 $2,328 4.13% $135 2.4% $57 $78 ‐42% 3.4% $25 $111 ‐18% $80 $55 ‐59% $40 $95 ‐30%
138% FPL $36,156 $2,328 3.09% $93 1.6% $45 $48 ‐48% 2.3% $23 $71 ‐24% $80 $13 ‐86% $40 $53 ‐43%
AP400‐100 AP600‐100 FD400‐100 FD600‐100
AP400‐100 AP600‐100 FD400‐100 FD600‐100
AP400‐100 AP600‐100 FD400‐100 FD600‐100
AP400‐100 AP600‐100 FD400‐100 FD600‐100

Study of State‐Sponsored Subsidies for the New Jersey Individual Market Appendix D
© Oliver Wyman 64
Summary of Estimated State Subsidy Impact to Net SLCSP Rate (Essex County) by Household Income, Family Type, and Subsidy Structure ‐ Age 27, $150M Scenarios
Single ‐ Age 27
Household Members 1 Applicable % State Net Premium Change in Net Applicable % State Net Premium Change in Net State Net Premium Change in Net State Net Premium Change in Net
Annual Gross SLCS Current Subsidized with State Subsidy After State Premium with State Subsidy After State Premium Subsidy After State Premium Subsidy After State Premium
Household Income Premium PMPM Applicable % Premium PMPM Subsidy PMPM Subsidy PMPM PMPM Subsidy PMPM Subsidy PMPM PMPM PMPM Subsidy PMPM PMPM PMPM Subsidy PMPM PMPM
650% FPL $82,940 $351 N/A $351 N/A $0 $351 0% N/A $0 $351 0% $0 $351 0% $0 $351 0%
600% FPL $76,560 $351 N/A $351 N/A $0 $351 0% 12.5% $0 $351 0% $0 $351 0% $90 $261 ‐26%
550% FPL $70,180 $351 N/A $351 N/A $0 $351 0% 12.5% $0 $351 0% $0 $351 0% $90 $261 ‐26%
500% FPL $63,800 $351 N/A $351 N/A $0 $351 0% 10.0% $0 $351 0% $0 $351 0% $90 $261 ‐26%
450% FPL $57,420 $351 N/A $351 N/A $0 $351 0% 10.0% $0 $351 0% $0 $351 0% $90 $261 ‐26%
400% FPL $51,040 $351 9.79% $351 5.8% $104 $246 ‐30% 7.3% $41 $310 ‐12% $143 $208 ‐41% $90 $261 ‐26%
300% FPL $38,280 $351 9.79% $312 5.8% $128 $185 ‐41% 7.3% $80 $233 ‐26% $143 $169 ‐46% $90 $222 ‐29%
250% FPL $31,900 $351 8.30% $221 5.1% $85 $136 ‐39% 6.3% $53 $168 ‐24% $60 $161 ‐27% $75 $146 ‐34%
200% FPL $25,520 $351 6.50% $138 3.3% $68 $70 ‐49% 5.5% $21 $117 ‐15% $40 $98 ‐29% $28 $110 ‐20%
150% FPL $19,140 $351 4.13% $66 1.6% $40 $26 ‐61% 3.1% $16 $50 ‐24% $30 $36 ‐46% $15 $51 ‐23%
138% FPL $17,609 $351 3.09% $45 1.1% $29 $16 ‐65% 2.1% $15 $31 ‐32% $30 $15 ‐66% $15 $30 ‐33%
Couple ‐ Age 27
Household Members 2 Applicable % State Net Premium Change in Net Applicable % State Net Premium Change in Net State Net Premium Change in Net State Net Premium Change in Net
Annual Gross SLCS Current Subsidized with State Subsidy After State Premium with State Subsidy After State Premium Subsidy After State Premium Subsidy After State Premium
Household Income Premium PMPM Applicable % Premium PMPM Subsidy PMPM Subsidy PMPM PMPM Subsidy PMPM Subsidy PMPM PMPM PMPM Subsidy PMPM PMPM PMPM Subsidy PMPM PMPM650% FPL $112,060 $701 N/A $701 N/A $0 $701 0% N/A $0 $701 0% $0 $701 0% $0 $701 0%
600% FPL $103,440 $701 N/A $701 N/A $0 $701 0% 12.5% $0 $701 0% $0 $701 0% $180 $521 ‐26%
550% FPL $94,820 $701 N/A $701 N/A $0 $701 0% 12.5% $0 $701 0% $0 $701 0% $180 $521 ‐26%
500% FPL $86,200 $701 N/A $701 N/A $0 $701 0% 10.0% $0 $701 0% $0 $701 0% $180 $521 ‐26%
450% FPL $77,580 $701 N/A $701 N/A $0 $701 0% 10.0% $55 $647 ‐8% $0 $701 0% $180 $521 ‐26%
400% FPL $68,960 $701 9.79% $563 5.8% $230 $333 ‐41% 7.3% $144 $419 ‐26% $286 $277 ‐51% $180 $383 ‐32%
300% FPL $51,720 $701 9.79% $422 5.8% $172 $250 ‐41% 7.3% $108 $314 ‐26% $286 $136 ‐68% $180 $242 ‐43%
250% FPL $43,100 $701 8.30% $298 5.1% $115 $183 ‐39% 6.3% $72 $226 ‐24% $120 $178 ‐40% $150 $148 ‐50%
200% FPL $34,480 $701 6.50% $187 3.3% $92 $95 ‐49% 5.5% $29 $158 ‐15% $80 $107 ‐43% $56 $131 ‐30%
150% FPL $25,860 $701 4.13% $89 1.6% $54 $35 ‐61% 3.1% $22 $67 ‐24% $60 $29 ‐67% $30 $59 ‐34%
138% FPL $23,791 $701 3.09% $61 1.1% $40 $22 ‐65% 2.1% $20 $42 ‐32% $60 $1 ‐98% $30 $31 ‐49%
Couple (Age 27) + 1 Child (Under age 14)
Household Members 3 Applicable % State Net Premium Change in Net Applicable % State Net Premium Change in Net State Net Premium Change in Net State Net Premium Change in Net
Annual Gross SLCS Current Subsidized with State Subsidy After State Premium with State Subsidy After State Premium Subsidy After State Premium Subsidy After State Premium
Household Income Premium PMPM Applicable % Premium PMPM Subsidy PMPM Subsidy PMPM PMPM Subsidy PMPM Subsidy PMPM PMPM PMPM Subsidy PMPM PMPM PMPM Subsidy PMPM PMPM
650% FPL $141,180 $957 N/A $957 N/A $0 $957 0% N/A $0 $957 0% $0 $957 0% $0 $957 0%
600% FPL $130,320 $957 N/A $957 N/A $0 $957 0% 12.5% $0 $957 0% $0 $957 0% $270 $687 ‐28%
550% FPL $119,460 $957 N/A $957 N/A $0 $957 0% 12.5% $0 $957 0% $0 $957 0% $270 $687 ‐28%
500% FPL $108,600 $957 N/A $957 N/A $0 $957 0% 10.0% $52 $905 ‐5% $0 $957 0% $270 $687 ‐28%
450% FPL $97,740 $957 N/A $957 N/A $0 $957 0% 10.0% $143 $815 ‐15% $0 $957 0% $270 $687 ‐28%
400% FPL $86,880 $957 9.79% $709 5.8% $290 $419 ‐41% 7.3% $181 $528 ‐26% $429 $280 ‐61% $270 $439 ‐38%
300% FPL $65,160 $957 9.79% $532 5.8% $217 $315 ‐41% 7.3% $136 $396 ‐26% $429 $103 ‐81% $270 $262 ‐51%
250% FPL $54,300 $957 8.30% $376 5.1% $145 $231 ‐39% 6.3% $91 $285 ‐24% $180 $196 ‐48% $225 $151 ‐60%
200% FPL $43,440 $957 6.50% $235 3.3% $116 $119 ‐49% 5.5% $36 $199 ‐15% $120 $115 ‐51% $84 $151 ‐36%
150% FPL $32,580 $957 4.13% $112 1.6% $68 $44 ‐61% 3.1% $27 $85 ‐24% $90 $22 ‐80% $45 $67 ‐40%
138% FPL $29,974 $957 3.09% $77 1.1% $50 $27 ‐65% 2.1% $25 $52 ‐32% $77 $0 ‐100% $45 $32 ‐58%
Couple (Age 27) + 2 Children (Under age 14)
Household Members 4 Applicable % State Net Premium Change in Net Applicable % State Net Premium Change in Net State Net Premium Change in Net State Net Premium Change in Net
Annual Gross SLCS Current Subsidized with State Subsidy After State Premium with State Subsidy After State Premium Subsidy After State Premium Subsidy After State Premium
Household Income Premium PMPM Applicable % Premium PMPM Subsidy PMPM Subsidy PMPM PMPM Subsidy PMPM Subsidy PMPM PMPM PMPM Subsidy PMPM PMPM PMPM Subsidy PMPM PMPM
650% FPL $170,300 $1,213 N/A $1,213 N/A $0 $1,213 0% N/A $0 $1,213 0% $0 $1,213 0% $0 $1,213 0%
600% FPL $157,200 $1,213 N/A $1,213 N/A $0 $1,213 0% 12.5% $0 $1,213 0% $0 $1,213 0% $360 $853 ‐30%
550% FPL $144,100 $1,213 N/A $1,213 N/A $0 $1,213 0% 12.5% $0 $1,213 0% $0 $1,213 0% $360 $853 ‐30%
500% FPL $131,000 $1,213 N/A $1,213 N/A $0 $1,213 0% 10.0% $122 $1,092 ‐10% $0 $1,213 0% $360 $853 ‐30%
450% FPL $117,900 $1,213 N/A $1,213 N/A $0 $1,213 0% 10.0% $231 $983 ‐19% $0 $1,213 0% $360 $853 ‐30%
400% FPL $104,800 $1,213 9.79% $855 5.8% $349 $506 ‐41% 7.3% $218 $637 ‐26% $572 $283 ‐67% $360 $495 ‐42%
300% FPL $78,600 $1,213 9.79% $641 5.8% $262 $379 ‐41% 7.3% $164 $478 ‐26% $572 $69 ‐89% $360 $281 ‐56%
250% FPL $65,500 $1,213 8.30% $453 5.1% $175 $278 ‐39% 6.3% $109 $344 ‐24% $240 $213 ‐53% $300 $153 ‐66%
200% FPL $52,400 $1,213 6.50% $284 3.3% $140 $144 ‐49% 5.5% $44 $240 ‐15% $160 $124 ‐56% $112 $172 ‐39%
150% FPL $39,300 $1,213 4.13% $135 1.6% $82 $53 ‐61% 3.1% $33 $102 ‐24% $120 $15 ‐89% $60 $75 ‐44%
138% FPL $36,156 $1,213 3.09% $93 1.1% $60 $33 ‐65% 2.1% $30 $63 ‐32% $93 $0 ‐100% $60 $33 ‐64%
AP400‐150 AP600‐150 FD400‐150 FD600‐150
AP400‐150 AP600‐150 FD400‐150 FD600‐150
AP400‐150 AP600‐150 FD400‐150 FD600‐150
AP400‐150 AP600‐150 FD400‐150 FD600‐150

Study of State‐Sponsored Subsidies for the New Jersey Individual Market Appendix D
© Oliver Wyman 65
Summary of Estimated State Subsidy Impact to Net SLCSP Rate (Essex County) by Household Income, Family Type, and Subsidy Structure ‐ Age 40, $150M Scenarios
Single ‐ Age 40
Household Members 1 Applicable % State Net Premium Change in Net Applicable % State Net Premium Change in Net State Net Premium Change in Net State Net Premium Change in Net
Annual Gross SLCS Current Subsidized with State Subsidy After State Premium with State Subsidy After State Premium Subsidy After State Premium Subsidy After State Premium
Household Income Premium PMPM Applicable % Premium PMPM Subsidy PMPM Subsidy PMPM PMPM Subsidy PMPM Subsidy PMPM PMPM PMPM Subsidy PMPM PMPM PMPM Subsidy PMPM PMPM
650% FPL $82,940 $428 N/A $428 N/A $0 $428 0% N/A $0 $428 0% $0 $428 0% $0 $428 0%
600% FPL $76,560 $428 N/A $428 N/A $0 $428 0% 12.5% $0 $428 0% $0 $428 0% $90 $338 ‐21%
550% FPL $70,180 $428 N/A $428 N/A $0 $428 0% 12.5% $0 $428 0% $0 $428 0% $90 $338 ‐21%
500% FPL $63,800 $428 N/A $428 N/A $0 $428 0% 10.0% $0 $428 0% $0 $428 0% $90 $338 ‐21%
450% FPL $57,420 $428 N/A $428 N/A $0 $428 0% 10.0% $0 $428 0% $0 $428 0% $90 $338 ‐21%
400% FPL $51,040 $428 9.79% $417 5.8% $170 $246 ‐41% 7.3% $106 $310 ‐26% $143 $274 ‐34% $90 $327 ‐22%
300% FPL $38,280 $428 9.79% $312 5.8% $128 $185 ‐41% 7.3% $80 $233 ‐26% $143 $169 ‐46% $90 $222 ‐29%
250% FPL $31,900 $428 8.30% $221 5.1% $85 $136 ‐39% 6.3% $53 $168 ‐24% $60 $161 ‐27% $75 $146 ‐34%
200% FPL $25,520 $428 6.50% $138 3.3% $68 $70 ‐49% 5.5% $21 $117 ‐15% $40 $98 ‐29% $28 $110 ‐20%
150% FPL $19,140 $428 4.13% $66 1.6% $40 $26 ‐61% 3.1% $16 $50 ‐24% $30 $36 ‐46% $15 $51 ‐23%
138% FPL $17,609 $428 3.09% $45 1.1% $29 $16 ‐65% 2.1% $15 $31 ‐32% $30 $15 ‐66% $15 $30 ‐33%
Couple ‐ Age 40
Household Members 2 Applicable % State Net Premium Change in Net Applicable % State Net Premium Change in Net State Net Premium Change in Net State Net Premium Change in Net
Annual Gross SLCS Current Subsidized with State Subsidy After State Premium with State Subsidy After State Premium Subsidy After State Premium Subsidy After State Premium
Household Income Premium PMPM Applicable % Premium PMPM Subsidy PMPM Subsidy PMPM PMPM Subsidy PMPM Subsidy PMPM PMPM PMPM Subsidy PMPM PMPM PMPM Subsidy PMPM PMPM650% FPL $112,060 $855 N/A $855 N/A $0 $855 0% N/A $0 $855 0% $0 $855 0% $0 $855 0%
600% FPL $103,440 $855 N/A $855 N/A $0 $855 0% 12.5% $0 $855 0% $0 $855 0% $180 $675 ‐21%
550% FPL $94,820 $855 N/A $855 N/A $0 $855 0% 12.5% $0 $855 0% $0 $855 0% $180 $675 ‐21%
500% FPL $86,200 $855 N/A $855 N/A $0 $855 0% 10.0% $137 $718 ‐16% $0 $855 0% $180 $675 ‐21%
450% FPL $77,580 $855 N/A $855 N/A $0 $855 0% 10.0% $209 $647 ‐24% $0 $855 0% $180 $675 ‐21%
400% FPL $68,960 $855 9.79% $563 5.8% $230 $333 ‐41% 7.3% $144 $419 ‐26% $286 $277 ‐51% $180 $383 ‐32%
300% FPL $51,720 $855 9.79% $422 5.8% $172 $250 ‐41% 7.3% $108 $314 ‐26% $286 $136 ‐68% $180 $242 ‐43%
250% FPL $43,100 $855 8.30% $298 5.1% $115 $183 ‐39% 6.3% $72 $226 ‐24% $120 $178 ‐40% $150 $148 ‐50%
200% FPL $34,480 $855 6.50% $187 3.3% $92 $95 ‐49% 5.5% $29 $158 ‐15% $80 $107 ‐43% $56 $131 ‐30%
150% FPL $25,860 $855 4.13% $89 1.6% $54 $35 ‐61% 3.1% $22 $67 ‐24% $60 $29 ‐67% $30 $59 ‐34%
138% FPL $23,791 $855 3.09% $61 1.1% $40 $22 ‐65% 2.1% $20 $42 ‐32% $60 $1 ‐98% $30 $31 ‐49%
Couple (Age 40) + 1 Child (Under age 14)
Household Members 3 Applicable % State Net Premium Change in Net Applicable % State Net Premium Change in Net State Net Premium Change in Net State Net Premium Change in Net
Annual Gross SLCS Current Subsidized with State Subsidy After State Premium with State Subsidy After State Premium Subsidy After State Premium Subsidy After State Premium
Household Income Premium PMPM Applicable % Premium PMPM Subsidy PMPM Subsidy PMPM PMPM Subsidy PMPM Subsidy PMPM PMPM PMPM Subsidy PMPM PMPM PMPM Subsidy PMPM PMPM
650% FPL $141,180 $1,111 N/A $1,111 N/A $0 $1,111 0% N/A $0 $1,111 0% $0 $1,111 0% $0 $1,111 0%
600% FPL $130,320 $1,111 N/A $1,111 N/A $0 $1,111 0% 12.5% $0 $1,111 0% $0 $1,111 0% $270 $841 ‐24%
550% FPL $119,460 $1,111 N/A $1,111 N/A $0 $1,111 0% 12.5% $0 $1,111 0% $0 $1,111 0% $270 $841 ‐24%
500% FPL $108,600 $1,111 N/A $1,111 N/A $0 $1,111 0% 10.0% $206 $905 ‐19% $0 $1,111 0% $270 $841 ‐24%
450% FPL $97,740 $1,111 N/A $1,111 N/A $0 $1,111 0% 10.0% $297 $815 ‐27% $0 $1,111 0% $270 $841 ‐24%
400% FPL $86,880 $1,111 9.79% $709 5.8% $290 $419 ‐41% 7.3% $181 $528 ‐26% $429 $280 ‐61% $270 $439 ‐38%
300% FPL $65,160 $1,111 9.79% $532 5.8% $217 $315 ‐41% 7.3% $136 $396 ‐26% $429 $103 ‐81% $270 $262 ‐51%
250% FPL $54,300 $1,111 8.30% $376 5.1% $145 $231 ‐39% 6.3% $91 $285 ‐24% $180 $196 ‐48% $225 $151 ‐60%
200% FPL $43,440 $1,111 6.50% $235 3.3% $116 $119 ‐49% 5.5% $36 $199 ‐15% $120 $115 ‐51% $84 $151 ‐36%
150% FPL $32,580 $1,111 4.13% $112 1.6% $68 $44 ‐61% 3.1% $27 $85 ‐24% $90 $22 ‐80% $45 $67 ‐40%
138% FPL $29,974 $1,111 3.09% $77 1.1% $50 $27 ‐65% 2.1% $25 $52 ‐32% $77 $0 ‐100% $45 $32 ‐58%
Couple (Age 40) + 2 Children (Under age 14)
Household Members 4 Applicable % State Net Premium Change in Net Applicable % State Net Premium Change in Net State Net Premium Change in Net State Net Premium Change in Net
Annual Gross SLCS Current Subsidized with State Subsidy After State Premium with State Subsidy After State Premium Subsidy After State Premium Subsidy After State Premium
Household Income Premium PMPM Applicable % Premium PMPM Subsidy PMPM Subsidy PMPM PMPM Subsidy PMPM Subsidy PMPM PMPM PMPM Subsidy PMPM PMPM PMPM Subsidy PMPM PMPM
650% FPL $170,300 $1,367 N/A $1,367 N/A $0 $1,367 0% N/A $0 $1,367 0% $0 $1,367 0% $0 $1,367 0%
600% FPL $157,200 $1,367 N/A $1,367 N/A $0 $1,367 0% 12.5% $0 $1,367 0% $0 $1,367 0% $360 $1,007 ‐26%
550% FPL $144,100 $1,367 N/A $1,367 N/A $0 $1,367 0% 12.5% $0 $1,367 0% $0 $1,367 0% $360 $1,007 ‐26%
500% FPL $131,000 $1,367 N/A $1,367 N/A $0 $1,367 0% 10.0% $276 $1,092 ‐20% $0 $1,367 0% $360 $1,007 ‐26%
450% FPL $117,900 $1,367 N/A $1,367 N/A $0 $1,367 0% 10.0% $385 $983 ‐28% $0 $1,367 0% $360 $1,007 ‐26%
400% FPL $104,800 $1,367 9.79% $855 5.8% $349 $506 ‐41% 7.3% $218 $637 ‐26% $572 $283 ‐67% $360 $495 ‐42%
300% FPL $78,600 $1,367 9.79% $641 5.8% $262 $379 ‐41% 7.3% $164 $478 ‐26% $572 $69 ‐89% $360 $281 ‐56%
250% FPL $65,500 $1,367 8.30% $453 5.1% $175 $278 ‐39% 6.3% $109 $344 ‐24% $240 $213 ‐53% $300 $153 ‐66%
200% FPL $52,400 $1,367 6.50% $284 3.3% $140 $144 ‐49% 5.5% $44 $240 ‐15% $160 $124 ‐56% $112 $172 ‐39%
150% FPL $39,300 $1,367 4.13% $135 1.6% $82 $53 ‐61% 3.1% $33 $102 ‐24% $120 $15 ‐89% $60 $75 ‐44%
138% FPL $36,156 $1,367 3.09% $93 1.1% $60 $33 ‐65% 2.1% $30 $63 ‐32% $93 $0 ‐100% $60 $33 ‐64%
AP400‐150 AP600‐150 FD400‐150 FD600‐150
AP400‐150 AP600‐150 FD400‐150 FD600‐150
AP400‐150 AP600‐150 FD400‐150 FD600‐150
AP400‐150 AP600‐150 FD400‐150 FD600‐150

Study of State‐Sponsored Subsidies for the New Jersey Individual Market Appendix D
© Oliver Wyman 66
Summary of Estimated State Subsidy Impact to Net SLCSP Rate (Essex County) by Household Income, Family Type, and Subsidy Structure ‐ Age 60, $150M Scenarios
Single ‐ Age 60
Household Members 1 Applicable % State Net Premium Change in Net Applicable % State Net Premium Change in Net State Net Premium Change in Net State Net Premium Change in Net
Annual Gross SLCS Current Subsidized with State Subsidy After State Premium with State Subsidy After State Premium Subsidy After State Premium Subsidy After State Premium
Household Income Premium PMPM Applicable % Premium PMPM Subsidy PMPM Subsidy PMPM PMPM Subsidy PMPM Subsidy PMPM PMPM PMPM Subsidy PMPM PMPM PMPM Subsidy PMPM PMPM
650% FPL $82,940 $908 N/A $908 N/A $0 $908 0% N/A $0 $908 0% $0 $908 0% $0 $908 0%
600% FPL $76,560 $908 N/A $908 N/A $0 $908 0% 12.5% $111 $798 ‐12% $0 $908 0% $90 $818 ‐10%
550% FPL $70,180 $908 N/A $908 N/A $0 $908 0% 12.5% $177 $731 ‐20% $0 $908 0% $90 $818 ‐10%
500% FPL $63,800 $908 N/A $908 N/A $0 $908 0% 10.0% $377 $532 ‐41% $0 $908 0% $90 $818 ‐10%
450% FPL $57,420 $908 N/A $908 N/A $0 $908 0% 10.0% $430 $479 ‐47% $0 $908 0% $90 $818 ‐10%
400% FPL $51,040 $908 9.79% $417 5.8% $170 $246 ‐41% 7.3% $106 $310 ‐26% $143 $274 ‐34% $90 $327 ‐22%
300% FPL $38,280 $908 9.79% $312 5.8% $128 $185 ‐41% 7.3% $80 $233 ‐26% $143 $169 ‐46% $90 $222 ‐29%
250% FPL $31,900 $908 8.30% $221 5.1% $85 $136 ‐39% 6.3% $53 $168 ‐24% $60 $161 ‐27% $75 $146 ‐34%
200% FPL $25,520 $908 6.50% $138 3.3% $68 $70 ‐49% 5.5% $21 $117 ‐15% $40 $98 ‐29% $28 $110 ‐20%
150% FPL $19,140 $908 4.13% $66 1.6% $40 $26 ‐61% 3.1% $16 $50 ‐24% $30 $36 ‐46% $15 $51 ‐23%
138% FPL $17,609 $908 3.09% $45 1.1% $29 $16 ‐65% 2.1% $15 $31 ‐32% $30 $15 ‐66% $15 $30 ‐33%
Couple ‐ Age 60
Household Members 2 Applicable % State Net Premium Change in Net Applicable % State Net Premium Change in Net State Net Premium Change in Net State Net Premium Change in Net
Annual Gross SLCS Current Subsidized with State Subsidy After State Premium with State Subsidy After State Premium Subsidy After State Premium Subsidy After State Premium
Household Income Premium PMPM Applicable % Premium PMPM Subsidy PMPM Subsidy PMPM PMPM Subsidy PMPM Subsidy PMPM PMPM PMPM Subsidy PMPM PMPM PMPM Subsidy PMPM PMPM650% FPL $112,060 $1,816 N/A $1,816 N/A $0 $1,816 0% N/A $0 $1,816 0% $0 $1,816 0% $0 $1,816 0%
600% FPL $103,440 $1,816 N/A $1,816 N/A $0 $1,816 0% 12.5% $739 $1,078 ‐41% $0 $1,816 0% $180 $1,636 ‐10%
550% FPL $94,820 $1,816 N/A $1,816 N/A $0 $1,816 0% 12.5% $829 $988 ‐46% $0 $1,816 0% $180 $1,636 ‐10%
500% FPL $86,200 $1,816 N/A $1,816 N/A $0 $1,816 0% 10.0% $1,098 $718 ‐60% $0 $1,816 0% $180 $1,636 ‐10%
450% FPL $77,580 $1,816 N/A $1,816 N/A $0 $1,816 0% 10.0% $1,170 $647 ‐64% $0 $1,816 0% $180 $1,636 ‐10%
400% FPL $68,960 $1,816 9.79% $563 5.8% $230 $333 ‐41% 7.3% $144 $419 ‐26% $286 $277 ‐51% $180 $383 ‐32%
300% FPL $51,720 $1,816 9.79% $422 5.8% $172 $250 ‐41% 7.3% $108 $314 ‐26% $286 $136 ‐68% $180 $242 ‐43%
250% FPL $43,100 $1,816 8.30% $298 5.1% $115 $183 ‐39% 6.3% $72 $226 ‐24% $120 $178 ‐40% $150 $148 ‐50%
200% FPL $34,480 $1,816 6.50% $187 3.3% $92 $95 ‐49% 5.5% $29 $158 ‐15% $80 $107 ‐43% $56 $131 ‐30%
150% FPL $25,860 $1,816 4.13% $89 1.6% $54 $35 ‐61% 3.1% $22 $67 ‐24% $60 $29 ‐67% $30 $59 ‐34%
138% FPL $23,791 $1,816 3.09% $61 1.1% $40 $22 ‐65% 2.1% $20 $42 ‐32% $60 $1 ‐98% $30 $31 ‐49%
Couple (Age 60) + 1 Child (Under age 14)
Household Members 3 Applicable % State Net Premium Change in Net Applicable % State Net Premium Change in Net State Net Premium Change in Net State Net Premium Change in Net
Annual Gross SLCS Current Subsidized with State Subsidy After State Premium with State Subsidy After State Premium Subsidy After State Premium Subsidy After State Premium
Household Income Premium PMPM Applicable % Premium PMPM Subsidy PMPM Subsidy PMPM PMPM Subsidy PMPM Subsidy PMPM PMPM PMPM Subsidy PMPM PMPM PMPM Subsidy PMPM PMPM
650% FPL $141,180 $2,072 N/A $2,072 N/A $0 $2,072 0% N/A $0 $2,072 0% $0 $2,072 0% $0 $2,072 0%
600% FPL $130,320 $2,072 N/A $2,072 N/A $0 $2,072 0% 12.5% $715 $1,358 ‐34% $0 $2,072 0% $270 $1,802 ‐13%
550% FPL $119,460 $2,072 N/A $2,072 N/A $0 $2,072 0% 12.5% $828 $1,244 ‐40% $0 $2,072 0% $270 $1,802 ‐13%
500% FPL $108,600 $2,072 N/A $2,072 N/A $0 $2,072 0% 10.0% $1,167 $905 ‐56% $0 $2,072 0% $270 $1,802 ‐13%
450% FPL $97,740 $2,072 N/A $2,072 N/A $0 $2,072 0% 10.0% $1,258 $815 ‐61% $0 $2,072 0% $270 $1,802 ‐13%
400% FPL $86,880 $2,072 9.79% $709 5.8% $290 $419 ‐41% 7.3% $181 $528 ‐26% $429 $280 ‐61% $270 $439 ‐38%
300% FPL $65,160 $2,072 9.79% $532 5.8% $217 $315 ‐41% 7.3% $136 $396 ‐26% $429 $103 ‐81% $270 $262 ‐51%
250% FPL $54,300 $2,072 8.30% $376 5.1% $145 $231 ‐39% 6.3% $91 $285 ‐24% $180 $196 ‐48% $225 $151 ‐60%
200% FPL $43,440 $2,072 6.50% $235 3.3% $116 $119 ‐49% 5.5% $36 $199 ‐15% $120 $115 ‐51% $84 $151 ‐36%
150% FPL $32,580 $2,072 4.13% $112 1.6% $68 $44 ‐61% 3.1% $27 $85 ‐24% $90 $22 ‐80% $45 $67 ‐40%
138% FPL $29,974 $2,072 3.09% $77 1.1% $50 $27 ‐65% 2.1% $25 $52 ‐32% $77 $0 ‐100% $45 $32 ‐58%
Couple (Age 60) + 2 Children (Under age 14)
Household Members 4 Applicable % State Net Premium Change in Net Applicable % State Net Premium Change in Net State Net Premium Change in Net State Net Premium Change in Net
Annual Gross SLCS Current Subsidized with State Subsidy After State Premium with State Subsidy After State Premium Subsidy After State Premium Subsidy After State Premium
Household Income Premium PMPM Applicable % Premium PMPM Subsidy PMPM Subsidy PMPM PMPM Subsidy PMPM Subsidy PMPM PMPM PMPM Subsidy PMPM PMPM PMPM Subsidy PMPM PMPM
650% FPL $170,300 $2,328 N/A $2,328 N/A $0 $2,328 0% N/A $0 $2,328 0% $0 $2,328 0% $0 $2,328 0%
600% FPL $157,200 $2,328 N/A $2,328 N/A $0 $2,328 0% 12.5% $691 $1,638 ‐30% $0 $2,328 0% $360 $1,968 ‐15%
550% FPL $144,100 $2,328 N/A $2,328 N/A $0 $2,328 0% 12.5% $827 $1,501 ‐36% $0 $2,328 0% $360 $1,968 ‐15%
500% FPL $131,000 $2,328 N/A $2,328 N/A $0 $2,328 0% 10.0% $1,237 $1,092 ‐53% $0 $2,328 0% $360 $1,968 ‐15%
450% FPL $117,900 $2,328 N/A $2,328 N/A $0 $2,328 0% 10.0% $1,346 $983 ‐58% $0 $2,328 0% $360 $1,968 ‐15%
400% FPL $104,800 $2,328 9.79% $855 5.8% $349 $506 ‐41% 7.3% $218 $637 ‐26% $572 $283 ‐67% $360 $495 ‐42%
300% FPL $78,600 $2,328 9.79% $641 5.8% $262 $379 ‐41% 7.3% $164 $478 ‐26% $572 $69 ‐89% $360 $281 ‐56%
250% FPL $65,500 $2,328 8.30% $453 5.1% $175 $278 ‐39% 6.3% $109 $344 ‐24% $240 $213 ‐53% $300 $153 ‐66%
200% FPL $52,400 $2,328 6.50% $284 3.3% $140 $144 ‐49% 5.5% $44 $240 ‐15% $160 $124 ‐56% $112 $172 ‐39%
150% FPL $39,300 $2,328 4.13% $135 1.6% $82 $53 ‐61% 3.1% $33 $102 ‐24% $120 $15 ‐89% $60 $75 ‐44%
138% FPL $36,156 $2,328 3.09% $93 1.1% $60 $33 ‐65% 2.1% $30 $63 ‐32% $93 $0 ‐100% $60 $33 ‐64%
AP400‐150 AP600‐150 FD400‐150 FD600‐150
AP400‐150 AP600‐150 FD400‐150 FD600‐150
AP400‐150 AP600‐150 FD400‐150 FD600‐150
AP400‐150 AP600‐150 FD400‐150 FD600‐150

Oliver Wyman Actuarial Consulting, Inc. (DE)
Oliver Wyman 411 East Wisconsin Avenue, Suite 1300 Milwaukee, WI 53202‐4412