Embed Size (px)
Citation preview

Study of solar neutrino energy spectrum above 4.5 MeV in Super-Kamiokande-I
1, Solar Neutrino Oscillation
2, Super-Kamiokande detector
3, Data set for 4.5 MeV analysis
4, Results and Energy spectrum above 4.5MeV
5, Conclusions and Future prospect
6, Most current SK result
16, Feb. 2004 in ICEPP symposiumNiigata Univ. C.Mitsuda
for Super-Kamiokande collaboration

1, Solar Neutrino OscillationSolar Neutrino
4 p He4 2e e
Standard Solar Model(SSM)
Solar Neutrino Expriments Target Homestake Cl(1968, USA)Kamiokande Water(1987, Japan)GALLEX,GNO Ga(1991, Italy,Germany)SAGE Ga(1990, Russia)
Super-K Water(1996, Japan)SNO D2O(1999, Canada)

Solar Neutrino Problem : Data/SSMObserved solar neutrino flux/Expected flux from solar < 1.0
Homestake
SK
GALLEX,SAGE SNO
CC NC
SNO
http://www.sns.ias.edu/~jnb

Flux( neutrino another flavor) = Flux(SK,ES) -Flux(SNO,CC) = 0.73±0.17 106cm 2s 1
The evidence of solar neutrino oscillation

Oscillation parameters based on flux from Ga,Cl,SK,SNO(CC)
Oscillation solution 1, Vacuum solution 2, MSW effects (3 solutions) (Sun,Earth Matter effect)
Large Mixing(LMA)
Small Mixing(SMA)
LOW
Just-so(Vacuum Oscillation)
QuasiVacuum Oscillation

2,Super-Kamiokande detector
Inner Detector 11146 of 20 inch PMTsOuter Detector1867 of 8 inch PMTs
1000m (2700m w.e)
41.4m
39.3m
F.V 22.5kton
Photo coverage 40%

The overview of SK detector

Typical low energy event
10 MeV~ about 60 hits
1,Timing information ~vertex position
2,Ring pattern ~ direction information
3,Number of hit PMTs ~ energy information
OD
ID
x e x e

Results from Super-Kamiokande-I
Best fit
No-flat B.G
22385±226 eventsExp. 48173 events
Flux 2.35±0.02(sta.)±0.08(sys.)
Data/SSM 0.465±0.005(sta.)±0.016(sys.)
1.0 106cm 2s 1
SSM:BP2000 Spectrum Ortiz et al.
Fiducial volume 22.5 ktonEnergy region 5.0~20.0 MeV
1996/5/31 ~2001/7/15 1496 days (D: 733,N:763 days)
5.05 106cm 2s 1

Flux(SSM) independent analysis
1,For SMA,LOW,Vacuum Energy Spectrum distortion
2,For LMA Day/Night flux difference3,For Vacuum Seasonal variation

Energy spectrum analysis
Is there distortion ?
2 for flat 17.4/19-1 d.o.f 50% C.L
Energy corrlated error with spectrumError : √stat.² + syst.²

Physical Motivation for 4.5 MeV
Analysis threshold of low energy is 5.0 MeV in SK-I.
This energy threshold is limited by Rn background ,external gamma rays and mis-fitting events.
We want to look energy spectrum of lower energy bin to inspect the energy distortion widely.
1, Can we see energy spectrum distortion by matter effect in low energy region?2, How much does 4.5 MeV energy bin have constrain for solar neutrino oscillation analysis?3, How much power does SK detector have for energy spectrum analysis?

SK-I data overview
5.0-5.5 MeV
5.5-6.0 MeV
cossun
Solar direction distribution
cossun
Some signals(but 4.8-5.0 effect)
4.5-5.0 MeV
B.G
SN = MC/Data(cossun>0.8)
5.0-5.5 MeV
SN = 0.30
SN=0.08
5.5-6.0 MeV
events/day/kton events/day/kton

The main source of the Background in low energy
The main source of the background is Radon...... In the mine, there is no another candidate. 1, Rn from the mine air dissolves into water 2, Rn from Ra in the mine water 3, Rn emanated from material used in SK tank
Bi214 Po214 e Q 3.26MeV
Tl208 Pb208 e Q 5.00MeV

Radon reduction approach I
We need to obtain the absolute value of radon in water.The super-high sensitivity radon detector was developed. Nucl. Instr.&Meth A497 (2003) 414-428
PIN photo diode andElectrostatic collection Volume 700L
Rn separated from water by membrane degasifier module
Detection limit 0.7 mBq/m³/day in real-timeSK supply water ~6.5 mBq/m³ in 1999

mBq/m³
IEX
VD
10
100
Place in water system
CP
1
Thus, radon in supply water < 0.7 mBq/m³ expected e.r = 1.2×10^-4 e/d 以下
Radon reduction approach II
2.New radon reduction system Membrane degasifier module can reduce radon which already dgasified by -90%.
1.Radon source search (right fig.) Radon source point was foundthen, improved, The radon in waterreduced down to 1.0mBq/m³
To reduce radon in water physically,the water system was improved. In 1999, supply water : 6.5 mBq/m³

As a results, we succeeded in observing the neutrino fluxfrom 4.5 to 5.0 MeV in this time.
Data set : Trigger efficiency in 4.5 MeV > 95% 566 days Sep. 17 1999 ~ Jul. 15 2001 Radon high rate run rejection 511 days * SK-I full data is 1496 days
With the approach of physically radon reduction, We tried to analysis 4.5 MeV from the aspect of soft-ware in SK ー I data(1996.5.31-2001.7.15)
Approach to the lower energy threshold of 4.5 MeV
To observe the 4.5 MeV bin, Remove Radon high rate run Improve the reduction method Develop the new event-reconstruction tool We applied various reduction optimized to 4.5 MeV data by blind analysis.

R2 Z distribution for 4.5-5.0 MeV (SK-I final sample)
3, The data set for 4.5 MeV analysis
Rn Rn
Mis-fitting events
R2 dis.Z dis.
It is possible to reduce gamma and mis-fitting events further!
Rn
Events Events
R2 and Z Vertex distribution after new reduction
Mis-fit events !
External Gamma reduced !
PVC event reduced !
0
12000
4.5-5.0MeV F.V 20.5 kton
0
F.V was changed 22.5 -> 20.5 ton
0
7000
If we assume mirror B.G of top, remaining Rn is little !
-16.1m 16.1m
Run#7859-10417 after tight cut
SK-I full data
EventsEvents

Energy spectrum of SN ration in each reduction step
4.5MeV 6.5 MeV
Energy
1.0
3.0
Reduction have effecton low energy only!
SN ratio = B8MC(aft/bef) / Data(aft/bef)
Almost 20% improve!
1.0
-1.0
3.0
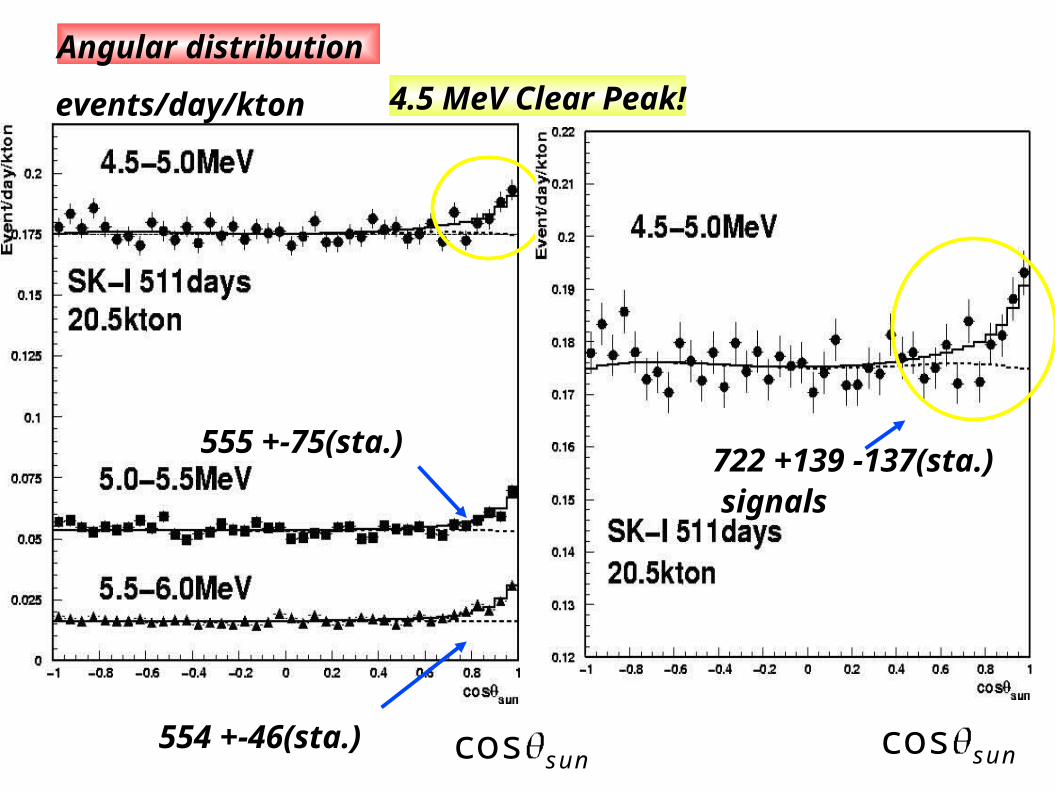
Angular distribution
4.5 MeV Clear Peak!
cos suncos sun
722 +139 -137(sta.) signals
555 +-75(sta.)
554 +-46(sta.)
events/day/kton

Flux results
1,511 days 20.5 kton F.V energy 4.5-20.0 MeV
2,566 days 22.5 kton F.V w/o tight cut energy 5.0-20.0 MeV
3,1496 days 22.5 kton F.V 5.0-20.0 MeV
B8 flux(4.5) = 3.28+0.63-0.62 Data/SSM(4.5) = 0.649 + 0.125-0.124
1.0 106 cm2 s
Signal = 8920 +146-145(stat.) B8 flux (all) = 2.33 +0.04-0.04(stat.) Data/SSM(all) = 0.462 + 0.008-0.008(stat.)
Same periodbut w/o tight cut !
4.5 MeV bin 5.9% syst. error
Signal = 5823 +120-119(stat.) eventsB8 flux (all) = 2.41 +0.05-0.05(stat.) Data/SSM(all) = 0.477 + 0.01-0.01(stat.)
1.0 106 cm2 sNew data
+5.8-5.3% syst. error
Signal = 22297+226-225(stat.) B8 flux (all) = 2.34 +0.02-0.02(stat.) Data/SSM(all) = 0.463 + 0.005-0.005(stat.)
Full data+3.5-3.2% syst. error

Energy spectrum
SK-I full data w/o 4.5 MeV New data w/ 4.5 MeV
Energy Energy
Data/SSM
4.5 MeV bin
Diff for full data < 1.3 sigma Diff for 566d data < 1.2 sigma
566 d Chi² for flat : 27.2 C.L 0.07%New chi² for flat : 20.1 C.L 38.8%
With √stat.² + syst.² With √stat.² + syst.²

Energy spectrum distortion-I
New data w/ 4.5 MeV
Energy Energy
Data/SSM
VO:chi² = 28.2(C.L. 8.1%) Quasi VO = 19.4(C.L. 43.3%) SMA = 24.4(C.L. 18.1%)LMA = 19.8(C.L. 40.8%) Low = 19.6(C.L. 41.8%)
For VO,Quasi VO For matter effect
With √stat.² + syst.² Active two-neutrino oscillation

Energy spectrum distortion-II
For solar best fit For solar best fit
New data w/ 4.5 MeVSK-I full data w/o 4.5 MeV
Energy EnergySKI full data: chi² = 14.7 (C.L 68.3%) d.o.f 19-1 New data : = 19.7 (C.L 41.1%) d.o.f 20-1
With √stat.² + syst.²

5, Summary and Future Plan1. We installed various reduction which is optimized to 4.5-5.0 MeV analysis in this time, and S/N ration of 4.5 MeV bin was improved by about 20%!
2. We can see clear solar peak in 4.5-5.0 MeV!3. After solar fitting, we obtained 722 +139 -137(sta.) solar signals in 4.5-5.0 MeV by 5 sigma level . Then, we observed the Solar Flux of 3.28 +0.63-0.62(sta.) 1.0 106cm3 sec
4. The Data/SSM of new results is consistent with full data results within 1.3 sigma. Therefore, new data gives a strong credit to oscillation phenomenon and SK-I full data results.
5. In the oscillation analysis, the 4.5 MeV bin have a some power for energy spectrum distortion in spite of low statistics.6. When the statistics will be integrated, the constraint will be more powerful.

Day/ Night spectrum analysis
Day flux 2.32 ± 0.03 (sta.)+0.08 -0.07(sys.)Night flux 2.37 ±0.03(sta.) ±0.08(sya.) 1.0 106cm 2s 1
Day Night
Day Night 2= -0.021 ± 0.020 (sta.)+0.013-0.012(sys.) no significant day/night asymmetry

Zenith spectrum analysis
It is most powerful analysis,excludes large area.

Solution is defined by the SK zenith spectrum results and SNO CC/NC results!Next step is the precise determination of the oscillation parameter!
m2 6.0 10 5
tan2 0.42

6,Most current result!New analysis method shrink the allowed region using SK-I full data!(w/o 4.5 MeV data)
m2 6.3 10 5
tan2 0.55
m2 6.0 10 5
tan2 0.42
Old
New
Day Night
Day Night 2= -0.018± 0.016(stat.)+0.013-0.012(syst.) statical error is improved by 25%!
= -0.021 ± 0.020(stat.) +0.013-0.012(syst.)
Active two-neutrino oscillation

m2 7.1 0.50.6 10 5
tan2 0.44 0.08
Solar neutrino observation is going to new phase ! Is solar neutrino oscillated? Which oscillation solution is correct?
Now, the determination of oscillation paramater
KamLAND results from reactor-neutrino are combined!
KamLAND also indicates LMA solution.
m2 6.9 10 5
tan2 0.0
Old
Old
New results from Solar + KamLAND

Snow Town Kamioka
The end

SK-II is taking data
● Rebuilt in summer 2002● Has 47% of original ID 20inch PMTs (~5200)● 20inch PMTs in acrylic shells to prevent
future chain implosions● Has full OD 8inch PMTs (1885)
● Started data taking at Dec. 2002
SK-II partially-contained sample
20inch PMT with Acrylic + FRP vessel

SKII resolution in low energy region
Vertex res. 85 cm -> ~160 cmEnergy res. 16% -> ~26%
SKII detector resolutionis not so bad !

We can expect the lower energy analysis in SK-III after full recovered detector (now, SK-II half-recover)
0, SK water is less than 0.75 mBq/m². 1, The all PMT are covered with the acrylic case. 2, Installed convection controller is going well in SK-II