Embed Size (px)
Citation preview

File No: 47-833/09(WRO) dt 02/09/2009
STUDY OF NOVEL SCHIFF BASE LIGAND
WITH RESPECT TO ITS ANALYTICAL
APPLICATIONS
A PROJECT REPORT SUBMITTED TO THE
UNIVERSITY GRANTS COMMISSION
BY
DR. (MRS.) SEEMA RAJENDRA SAPALE
DEPARTMENT OF CHEMISTRY
KIRTI M. DOONGURSEE COLLEGE
DADAR, MUMBAI- 400 028
DECEMBER, 2011

PROJECT REPORT 2
PROJECT REPORT
TOPIC INDEX
Sr.No. CONTENT Page No.
1 INTRODUCTION 4
2 AIMS & OBJECTIVES 8
3 EXPERIMENTAL 10
4 CHARACTERIZATION 14
5 APPLICATIONS 18
6 RESULTS &
DISCUSSION 27
7 REFERENCES 46

PROJECT REPORT 3
ABSTRACT
Novel Schiff bases were synthesized from substituted 2-hydroxy benzaldehydes and
dihydrazide. These Schiff bases were used to prepare metal complexes. The complexes were
distinctly coloured and stable to atmospheric conditions. All newly synthesized compounds were
characterized by TLC, Melting/Decomposition point, solubility, Spectroscopic
Techniques (Mass, IR , NMR)and XRD (for complexes). The Schiff bases were shown to
behave as a tetadentate ligand. The metal complexes were proposed to square planar geometry
and 1:1 metals to ligands ratio was suggested, Some of these Schiff bases and their metal
complexes were screened for their biological activities (Antibacterial and antifungal)
One of the ligand was studied for spectrophotometric determination of Cu (II)
(Extractive spectrophotometry), The stability constants of their complexes with
Copper (II) ions and Nickel (II) ions, have been studied. Ion-selective electrode for
Ni was developed.

PROJECT REPORT 4
INTRODUCTION
SCHIFF BASES
The Schiff base ligands and their metal complexes have special importance in the
field of coordination chemistry. As the present work deals with the complexes of
schiff base ligands, it is appropriate to include a brief general discussion on the
chemistry of Schiff bases and their metal complexes.
Hugo Schiff, a German chemist, isolated1 the first condensed product of amines with
carbonyl compounds, which he referred to as Schiff base. Thus the Schiff bases are
the organic compounds containing azomethine –R-C=N- group and are usually
formed by the condensation of a primary amine with an active carbonyl compound.
In general a Schiff base can be prepared as follows:
R O
R'
NH2 R" R N
R'
R"C + C + H2O
The above reaction is acid catalyzed and is generally carried out by refluxing the
carbonyl compound and amine with an azeotroping agent if necessary and
separating the water formed in the reaction. The kinetics and formation of Schiff
bases in aqueous solution have been extensively studied2,3. It has been found that
the above reaction is 2nd order. This reaction proceeds by a two step mechanism
involving a carbinolamine intermediate as shown below.
R O
R'
NH2 R" R N
R'
R"R NH
R'
R"
OH
C + C + H2OC
Carbinolamine

PROJECT REPORT 5
This mechanism was first observed in the case of aniline and benzaldehyde in 1850
by Laurent and Gerhart4. Schiff bases are also known as anils, azomethines or imines
In the polydentate Schiff base ligands, along with main functional group
azomethine, the other donor sites contain various electronegative atoms such as
oxygen, nitrogen and sulphur. The Schiff bases have been effectively used as
analytical reagents5-7 for extractive spectrophotometric determination of metal ions,
as they possess excellent ligational properties.
A considerable interest has been focused on the complexing property of bi, tri and
tetradentate Schiff base ligands having oxygen-nitrogen, oxygen-sulphur, nitrogen-
sulphur and oxygen-nitrogen-sulphur as potential donor sites.
The Schiff base metal complexes have an old history, in the beginning of the 18th
century preceding the work of S. M. Jorgensen and Werner, Etting8 in 1840 isolated a
dark green crystalline product from the reaction of cupric acetate, Salicylaldehyde
and aqueous ammonia. This product was undoubtedly [bis(salicylaldiimino)Cu(II)].
In 1869 Schiff 9 established the 1:2 metal-ligand stoichiometry and later reported10 the
complexes of Schiff base of urea and salicyladehyde.
O
RN
Cu/2
The synthesis and properties of Schiff base complexes are very often related to the
associated metal and these aspects have been discussed in detail by Lindoy11 and
Layer12. Various aspects have been discussed by Mellor13 and Patel14. Metal
complexes with unusual stereochemistry and the coordination number can be

PROJECT REPORT 6
synthesized by choosing the Schiff base and carefully controlling the experimental
conditions15.
Generally, Schiff bases are insoluble in water. In contrast, McCarthy et. al.16 prepared
Schiff bases by condensation of ethylene diamine or triethylene-diamine with
acetylacetone which found to dissociate in water.Schiff bases are weak bases and are
readily hydrolyzed by dilute mineral acids, but not by aqueous alkalies.
The properties17 of the Schiff bases neither depend upon the substituent present on
the nucleus nor on their position but on the characterization of =C=N- unsaturated
grouping. By changing the nature and the position of the donor atoms and groups, it
is possible to control the size of the chelating ring formed and exploit the effect of
substitution.
The Schiff bases derived from aromatic aldehydes and primary aromatic amines are
found to be more stable and show little tendency to undergo polymerization and
other subsequent reactions. Schiff bases derived from lower aliphatic aldehydes and
primary aromatic amines are less stable than those derived from aromatic aldehydes.
The Schiff bases are considered as useful chelating agents when a suitable functional
groups like –OH, -SH, or-NO2 etc. are present sufficiently close to the azomethine
group so as to form five or six membered chelating ring upon reaction with the
metal ion. Most of the attention for the stability of the complexes has centered on the
ligand properties and not on those of the metal ion18. For wide variety of the ligands
and a series of divalent metal ions, there is a relatively invariant order of stability:
Co(II) < Cu(II) < Ni(II).

PROJECT REPORT 7
Uses of Schiff bases and their metal complexes
The Schiff base ligands and their metal complexes have special importance in the
field of coordination chemistry. A survey of the literature shows that, in recent times,
increasing number of studies has been devoted to the synthesis and structural
studies. However, the utility aspects of the Schiff bases and their metal complexes
have received their share of attention with an all round progress in the field of
coordination chemistry. The importance of Schiff bases and their metal complexes
with transition metals have been well emphasized by several researchers.
Analytical applications
The Schiff bases have remarkable property of forming complexes and serve as
excellent chelating ligands. Due to their ligational property they have been
extensively used as analytical reagents19. Schiff bases formed from salicylaldehyde
are used in gravimetric analysis and spectrophotometric determination. For
example, the Schiff bases derived from ethylenediamine forms an insoluble complex
with Ni (II), which has been used for its gravimetric determination. Also, the same
reagent has been used recently for the spectrophotometric determination of Ni (II) at
trace level by El-Shahawi20.
Biological Importance
The active functional group of Schiff bases is azomethine (-HC=N-) and its
importance has been studied in bio-chemistry. Its biological importance has been
studied in the fields of fungicides and insecticides21. Also, the intermediate of the
azomethine group shows biological importance in large number of enzymatic
reactions22. These compounds exhibit many physiological activities. They are found
to be useful as plant growth regulants and as an anti-coagulating materials23.

PROJECT REPORT 8
AIMS AND OBJECTIVES
Objectives and the scope of the present studies:
Schiff base and its complexes have a variety of application including biological,
chemical and analytical. Earlier work has shown that some drugs showed increase
activity when administrated as metal chalets rather than as organic compounds. But,
recently a particular attention has given to the synthesis and study of applications of
Schiff bases derived from dihydrazides and substituted aldehydes and their metal
complexes respectively.
General objective
• To synthesis and characterize schiff base and metal complexes derived from
dihydrazide & different substituted 2- hydroxy benzaldehydes.
Specific objectives
• To characterize the schiff base type chelating agent and its complexes with
some ions using spectroscopic techniques.
• To study the complexing ability and electro- analytical applications of the
ligand prepared.
• To study the applications of the ligand prepared with respect to solvent
extraction of some metal ions.
• To study the Biological applications of the ligand prepared and its complexes
with some metal ions.

PROJECT REPORT 9
Materials and methodology
Chemicals used for this work like substituted hydroxyl benzaldehyde , hydrazine
hydrate, diethyl malonate , metal salts , Ethanol, chloroform, methanol, distilled
water, Acetone cobalt standard, Nickel standard etc were of analytical grade.
Apparatus and instruments
The apparatus used in this project are melting point apparatus, condenser, heating
mantle, round bottom flask, rotary evaporator , beakers, measuring cylinder, ice
bath, desiccators, suction pump, funnel, filter paper ,stirrer etc.

PROJECT REPORT 10
EXPERIMENTAL
General procedures:
Step 1: Prepartion of compound A.
Diethyl malonate (0.1mol) & Hydrazine hydrate (0.2mol) were refluxed in a 3-
necked round bottom flask fitted with water condensor for 4-5 hrs. Hydrazine
hydrate was added in excess. White water soluble residue precipitated out with
exothermic reaction. The solid was filtered off. This is Compound A. It is
recrystallized with hot absolute Alcohol (99%).
Reaction:
(A)
STEP 2: Preparation of compound (I). (Schiff Base Ligand) (3 Schemes)
Compound A(0.1mol) was dissolved in glacial acetic acid. Substituted 2-hydroxy-1-
benzaldehyde (0.1mol) was added to it & refluxed for 3-4hrs. The reaction was
monitored by TLC On cooling the reaction mixture coloured solid compound

PROJECT REPORT 11
precipitated out .The residue was filtered off and recrystallized using absolute
alcohol. This is compound I. R= -H,-NO2, -Br. [I (a),(b),(c).]
Reaction:
(I-a,b,c)
STEP 3: Preparation of compound (II). (Metal Complexes)
Compound I(a) - (c) (0.1mol) was dissolved in DMF (Dimethyl formamide). Metal
salt was dissolved in DMF in test tube. Both the hot solutions were mixed in a round
bottom flask and refluxed for 8-10 hrs. The solution on cooling was then dumped in
cold water. Colored Solid compound precipitated out. It was then filtered off &
recrystallized using absolute alcohol. Here M= Cu, Ni, Co, Cd , Zn & Pb. compound
[I,II (a)- (f)]
N H
N H
O
O
N H 2
N H 2
H N
H N
O
O
N
O H
N
O H
G laci a l A c e ti c A cid
R e f lu x3 -4 H rs
R
R

PROJECT REPORT 12
Reaction:
Characterization of Schiff Bases & Metal complexes:
The compounds were characterized using the following parameters: TLC,
Spectroscopic Techniques (Mass, IR, NMR), XRD for complexes,
Melting/Decomposition point & solubility.
3.3.1 Thin layer chromatography
The completeness of the reaction was tested using thin layer chromatography
precoated with silica gel plates were used for stationary phase and Chlorofrom was
used as a mobile phase. The completeness of the reaction was determined by the
appearance of single spot on the TLC.
3.3.2 Solubility
The Solubility of the complexes was checked by various organic solvents: diethyl
ether, acetone, methanol, chloroform (CHCl3), Toluene, ethanol by stirring a small

PROJECT REPORT 13
amount of the complex in a test tubes. The ligands were found to be soluble in DMF
& DMSO respectively.
3.3.3 Melting /Decomposition point)
The melting point (decomposition point) was determined by placing a finely
powdered sample in a capillary tube and heating by melting point apparatus.
( Model : Labtronics make , Model No: LT 110 .)
PROJECT REPORT 14
CHARACTERIZATION
Various spectral, analytical and biological applications of the above Schiff bases &
their complexes were studied. The details are as under:
Spectral Analysis:
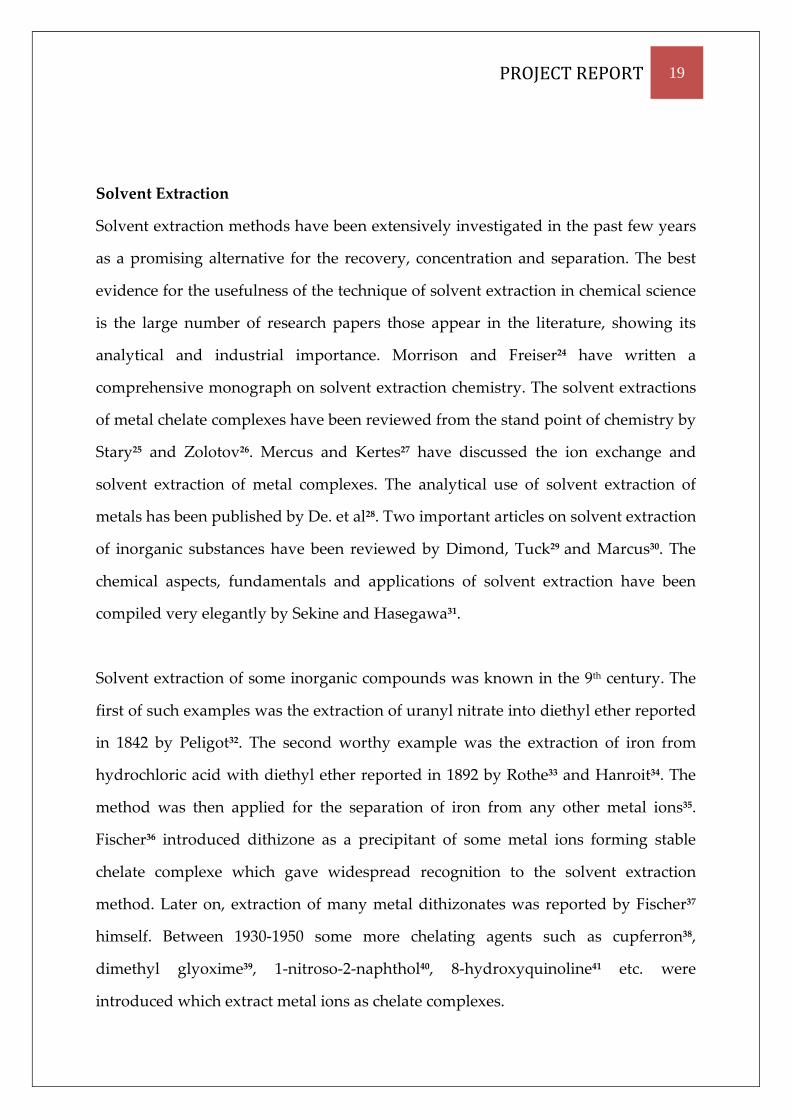
IR Spectra:
The IR spectra of the Schiff bases and their metal complexes were recorded on a
HITACHI-270 IR spectrophotometer in the 4000-4500 cm-1 region in KBr or CsI
pellets. In the IR spectra of ligands, all the absorption bands due to individual
components were present except the bands at 3325-3245cm-1 due to -NH2 in the
amine and at 2750-2830 cm-1 due to -HC=O group in the substituted salicylaldehyde
were absent.
The spectrum of ligand exhibited weak band at 3060 per cm, this could be attributed
to <(C-H) aromatic.A strong band at 1683 per cm which belongs to carbonyl and the
other strong bands belong to the <(C=N), <(C=C) and <(C-N) were found at 1585,
1572 and 1244 per cm respectively, while the infrared spectra of the prepared
complexes exhibited <(C =N) in the range of 1569-1577per cm which shows a
shifting to the lower frequencies, it is which indicated the coordination of (L1) with
metal ions through the nitrogen atoms in their structures. The ligand(L1) shows two
moderately strong bands at 3200 and 1621 per cm assigned as v O-H and v C=N
groups. On complexes formation the former band shifts to lower energy while the
phenolic O-H group disappears in the prepared complexes, this supports the
deprotonation and linkage ofO atom to the central metal ion (Erich et al., 1989). The
stretching frequency at 1573 per cm can be attributed to C=C bond. A strong band
appearing at 1681 per cm can be assigned to carbonyl group. A medium band at 1271
per cm may be assigned to C-N stretching vibrations. The absorption band in the

PROJECT REPORT 15
range (471-535) and (423-465) per cm were assigned to (M-N) and (M-O) bands. The
spectra bands of complexes at 1675-1679 per cm were characterized for the carbonyl
group which did not suffer a shift. Thus, it is suggested that the oxygen atom of the
carbonyl group is not coordinated to the metal ion.
FAB-Mass Spectral Studies
FAB mass spectra were recorded on a JEOL SX 102/DA-6000 mass spectrometer/data
system using Argon/Xenon (6 kV, 10 Am) as the FAB gas. The accelerating voltage
was 10 kV and the spectra were recorded at room temperature and m-nitro benzyl
alcohol was used as the matrix. The mass spectrometer was operated in the +ve ion
mode. The data thus obtained was found relevant as per projection.
The FAB mass spectrum of Schiff base (I) showed a molecular ion peak at m/z
340.117 of Schiff Base (II) at m/z 430.087 and that of Schiff Base (III) at m/z 479.936
which is equivalent to its molecular weight The fragments in the spectrum leads to
the formation of the species [L+H]+.
The data is as follows:
Schiff Base
Mass
SB 1 (I a) m/z: 340.117 (100%) , 341.121 (18.5%) , 342.124 (1.6%) , 341.114
(1.5%)
SB 2 (I b) m/z : 430.087 (100%) , 431.091 (18.4%) , 431.084 (2.2%) , 432.092
(1.6%) , 432.094 (1.6%).
SB 3(I C)
m/z : 497.936 (100%) , 495.938 (51.4%) , 499.934 (48.6%) , 498.939
(18.4%) , 496.942 (9.5%) , 500.937 (9.0%) , 499.943 (1.6%) , 498.933
(1.5%).

PROJECT REPORT 16
The FAB-mass spectrum of metal complexes showed a molecular ion peak M+
equivalent to their respective molecular weights [ML.2H2O]+. The molecular ion by
the loss of two water molecules gave a fragment ion peak . All these fragments
leading to the formation of the species [ML]+ which undergoes demetallation to
form the species. The data is as follows:
Metal
Complexes
(I)
M+ Ion peak Value
Metal Complexes
(II)
M+ Ion peak Value
I a 494.41 II a 528.41
I b 440.93 II b 474.93
I c 445.54 II c 479.54
I d 440.69 II d 474.69
I e 589.20 II e 623.20
I f 447.39 II f 481.39
The 1H NMR spectra Studies:
The 1H NMR spectra of ligands were recorded in CDCl3 on a BRUKER 300 MHz
spectrometer at room temperature using TMS as an internal reference. The 1H NMR
spectra of Schiff bases exhibit signals at 8.0, 5.35, 8.62 and 7.2-7.5 ppm due to -NH,
phenolic OH, -CH=N and aromatic protons, respectively. The signals around 3..34
ppm are due to methylene protons. In the case of Metal (II) complex, the signal of
azomethine protons of metal complexes was found at 9.12 ppm after complexations
to the metal ion inferring co-ordination through the azomethine nitrogen atom of the
ligands . Disappearance of -OH protons in the spectra of complexes support the
deprotonation of the above group.

PROJECT REPORT 17
XRD Analysis:
The X-ray diffractograms of the Cu(II), Ni (II) complexes were scanned in the range
5–100° at a wavelength of 1.543 Å. The diffractograms and associated data depict the
2θ value for each peak, the relative intensity and inter-planar spacing (d-values). The
X-ray diffraction pattern of these complexes with respect to major peaks of relative
intensity greater than 10 % were indexed using a computer programme. The data
shows that the ligand is tetra dented and the geometry of the complex being
distorted square planar in na

PROJECT REPORT 18
APPLICATIONS
Extractive Spectrophotometry
Spectrophotometry facilitates the determination of the concentration of coloured
substances in a solution and has been employed for the analysis of metals at the trace
levels. Spectrophotometry is based on the quantitative study of absorption of
radiation. Spectrophotometry can be classified into groups, namely UV
Spectrophotometry and Visible Spectrophotometry.
UV Spectrophotometric methods have been applied extensively for the identification
of aromatic hydrocarbons, vitamins, steroids, heterocyclic and conjugated aliphatic
compounds. In biochemical and pharmaceutical research, UV absorption spectra are
often used to identify degradation products and to test purity. The detection of
characteristic UV absorption bands of contaminant is used as a guide to check the
purity, while the constancy of molar absorptivity at a specific wavelength on
additional purification steps is indicative of purity.
Visible Spectrophotometry involves the determination of light absorptive capacity of
the chemical system, which are coloured and hence termed as colorimetric analysis
or colorimetry. This method is applied to such systems when the objective is to
determine the concentration of the constituent responsible for imparting colour. So
one develops a coloured system and measures its absorbing capacity, which is
directly proportional to the amount of desired constituent. Spectrophotometric
methods are found to be simple, rapid, sensitive and can be carried out in small
laboratories in the absence of the other costly and sophisticated instrumental
facilities.
PROJECT REPORT 19
Solvent Extraction
Solvent extraction methods have been extensively investigated in the past few years
as a promising alternative for the recovery, concentration and separation. The best
evidence for the usefulness of the technique of solvent extraction in chemical science
is the large number of research papers those appear in the literature, showing its
analytical and industrial importance. Morrison and Freiser24 have written a
comprehensive monograph on solvent extraction chemistry. The solvent extractions
of metal chelate complexes have been reviewed from the stand point of chemistry by
Stary25 and Zolotov26. Mercus and Kertes27 have discussed the ion exchange and
solvent extraction of metal complexes. The analytical use of solvent extraction of
metals has been published by De. et al28. Two important articles on solvent extraction
of inorganic substances have been reviewed by Dimond, Tuck29 and Marcus30. The
chemical aspects, fundamentals and applications of solvent extraction have been
compiled very elegantly by Sekine and Hasegawa31.
Solvent extraction of some inorganic compounds was known in the 9th century. The
first of such examples was the extraction of uranyl nitrate into diethyl ether reported
in 1842 by Peligot32. The second worthy example was the extraction of iron from
hydrochloric acid with diethyl ether reported in 1892 by Rothe33 and Hanroit34. The
method was then applied for the separation of iron from any other metal ions35.
Fischer36 introduced dithizone as a precipitant of some metal ions forming stable
chelate complexe which gave widespread recognition to the solvent extraction
method. Later on, extraction of many metal dithizonates was reported by Fischer37
himself. Between 1930-1950 some more chelating agents such as cupferron38,
dimethyl glyoxime39, 1-nitroso-2-naphthol40, 8-hydroxyquinoline41 etc. were
introduced which extract metal ions as chelate complexes.

PROJECT REPORT 20
Liquid-liquid extraction commonly known as solvent extraction, is a major process
step used for the separation of components of a solution by distribution between two
liquid phases and is used in many process industries like petroleum refining and
petrochemicals, hydrometallurgy, biotechnology and nuclear industry.
Solvent extraction has a great potential in the field of effluent treatment for economic
recovery of valuable materials as well as minimizing the water pollution hazards.
This method is utilized for the recovery of phenol, cresol, acetic acid and oil from the
wastewater. It has been applied for inorganic metal detection such as Cu2+ and Fe3+
from seawater 42 and recovery of pharmaceutically important products from waste
water43. Applications of solvent extraction in wastewater treatment have been
reported44-46.
A class of organic compounds, Schiff base, also known as anil, azomethine or imine,
has acquired a place of prime importance due to their varied applications when
utilized as a ligand in the formation of metal complexes. In the polydentate Schiff
base ligands, along with main functional group azomethine, the other donor sites
contain various electronegative atoms such as oxygen, nitrogen and sulphur. The
Schiff bases have been effectively used as an analytical reagent47-49 for extractive /
direct spectrophotometric determination of metal ions, as they possess excellent
ligational properties. Looking at the importance of the different classes of ligands,
we have tried to explore the property of Schiff base ligand as an analytical reagent
for extractive and / or direct spectrophotometric determination of heavy metal ions
in trace levels.
The utility of solvent extraction is enhanced when it is coupled with
spectrophotometric methods for separation and estimation of analyte at trace and

PROJECT REPORT 21
ultra trace level because of the associated sensitivity, selectivity, simplicity, rapidity
and moderate cost per analysis. The work presented here aims at developing simple,
sensitive and rapid method for extractive spectrophotometric determination of
industrially and / or environmentally important heavy metals like copper (II) at trace
level by using heterocylic schiff base ligand as an analytical reagent. The method is
based on instantaneous formation of stable colored complex with Cu (II) at room
temperature.
The respective reagent reacts with copper (II) to give colored complex, which is
extracted into organic solvent. Various experimental parameters like pH,
equilibrium time, reagent concentration, stability etc. have been studied and
optimized. The nature of extracted species has been determined by Job’s variation
method and mole ratio method, further confirmed by the slope ratio method. The
effect of foreign ions on the extraction has been studied and their tolerance limits
have been determined. The proposed method has also been employed for estimation
of copper in various synthetic.
Development of method
Determination of pH
To one ml of an aqueous solution containing 50 µg of copper (II), 1ml of 0.1 SB 2(Ib)
in ethanol was added and the pH of the solution was adjusted to the required value
by adding dilute ammonia and /or hydrochloric acid. The final volume was then
made to 10 ml by using double distilled water. This solution was equilibrated with
10 ml of chloroform for 60 seconds in separating funnel. The two phases were
allowed to separate, the aqueous and organic phases were collected separately and
metal ion contents in both the phases i.e. amount of copper extracted into organic
phase during the extraction of copper (II) with SB 2(Ib) reagent were determined

PROJECT REPORT 22
spectrophotometrically by known method50. The distribution ratio and percentage
extraction values were calculated from the concentration of metal ion in each phase.
Selection of solvents
For selection of the suitable solvent, extraction of copper (II)- SB 2(Ib) complex was
carried out at identical conditions with different solvents like toluene, carbon
tetrachloride, benzene, chloroform, ethyl acetate, amyl acetate, n-butyl acetate,
methyl iso-butyl ketone, iso amyl alcohol, xylene, and cyclohexanone. Distribution
(D) and percentage extraction (% E) were calculated in each solvent by the procedure
as mentioned above.
Absorption spectra
To determine the absorption maxima, 50 µg copper was used. The colored complex
was extracted in selected solvent i. e. Chloroform and its absorbance was measured
at different wavelength against reagent blank. The absorbance spectrum was
obtained by plotting absorbance against the wavelength.
Study of reagent concentration
The minimum amount of reagent SB 2(Ib) required for the quantitative extraction of
50 µg metal ion was studied by varying the reagent concentration. All other
parameters were kept constant. The graph of absorbance against the reagent
concentration in percent was plotted. Hence, the minimum concentration of regent
required for quantitative extraction of the metal ion was determined from the graph.
Effect of equilibration time
The effect of shaking time on the extraction of metal ion was studied. The shaking
time was varied from 10 to 240 seconds the graph of absorbance verses shaking time
was plotted, from which the optimum shaking time was computed.

PROJECT REPORT 23
Stability of the extracted species in organic phase
The stability of the coloured complex in organic phase was determined by
measuring the absorbance of the organic phase at λmax at definite intervals of time. A
graph of absorbance against the time in hours was plotted, from which the time for
which the complex was stable was observed.
Calibration curve
Calibration plot was prepared by treating known amounts of copper (II) as per the
method developed. Beer’s range was obtained by plotting the absorbance and the
concentration of the metal ions in ppm. The calibration plot thus obtained was
employed for determination of metal ion in unknown samples.
Precision and accuracy
The precision and accuracy of the developed method were determined by carrying
out ten replicate analysis of solution containing known amount of metal ion. The
average of these ten replicate analyses was used to calculate standard deviation,
relative standard deviation and mean at 95 % confidence limit.
Interference study
The effect of various cations and anions on the extraction and spectrophotometric
determination of metal ion was studied at optimized experimental conditions by
adding each time a definite aliquot of ion of interest to the copper solution before
adjusting the pH. The tolerance limit for the foreign ion was set at the amount
required to cause ± 2 % error in the recovery of metal ion under investigation.

PROJECT REPORT 24
Experimental procedure for extraction and spectrophotometric determination of
copper (II)
To an aliquot solution containing 0.1 to 9.0 ppm of copper (II), 1ml of 0.1 % in
ethanol was added. The pH of the solution was adjusted to 9.0 by adding 2 ml of
ammonium buffer and the volume was made to 10 ml using double distilled water.
This aqueous phase was then taken in separating funnel and equilibrated with 10 ml
of chloroform for 60 seconds. The organic extract was collected in a 10 ml flask and
made upto the mark with chloroform, if necessary. The absorbance of the extracted
copper (II)- SB(Ib) complex was measured at 440 nm against reagent blank. From the
calibration curve, the amount of copper (II) was computed.
Procedure for spectral curve
3.934 x 10⁻⁴ M solutions of copper (II) and SB (Ib) were taken in different proportions
and each solution mixture was treated as per the procedure mentioned earlier. The
complex was extracted in 10 ml chloroform and the absorbance was recorded at
different wavelengths. Thus, spectral curves were obtained by mixing the copper (II)
and SB(Ib)solutions in 1:1, 1:2, 1:3, and 1:4 proportions.
Procedure for Job’s continuous variation method
A series of solutions were prepared by mixing 0.5 to 4.5 ml of 3.934 x 10⁻⁴ M copper
(II) solution with 4.5 to 0.5 of 3.934 x 10⁻⁴ M SB2 (Ib) solution in such a way that the
final volume was 10 ml after additions of 2.0 ml buffer of pH 9.0. Each of the molar
proportion was treated as per the procedure developed and the absorbance of the
extracted species was measured at 440 nm. The absorbance was plotted against the
mole fraction, the ratio of concentration copper (II) to the total concentration of
copper (II)- SB2(Ib).

PROJECT REPORT 25
Procedure for Mole-ratio method
To a series of solution containing 1.0 ml of 3.934 x 10⁻⁴ M copper (II), increasing
amounts of 3.934 x 10⁻⁴ M SB2(Ib) volumes were added. After treating each
proportion mixture as per the developed method, the absorbance of chloroform
extract was measured against reagent blank at 440 nm. The absorbance values were
plotted against the mole ratio of copper (II) to
Procedure for Slope-ratio method
To a series of solutions containing 1.0 ml of 50 µg of copper (II), varying amounts of
the SB2(Ib), lesser than that the actually required for the complete extraction of
copper were added. Each mixture was treated as per the developed procedure, the
aqueous and organic layers were separated and concentration of copper from each
layer was determined. The distribution ratio of copper (II) for each extraction was
determined and a plot of log of distribution ratio Vs concentration of SB2(Ib) present
in organic phase. A straight-line graph, whose, slope gives number of ligands
involved in the coordination with copper (II).
Applications of extractive spectrophotometric method for determination of copper in
variety of samples. The validity of proposed method was tested by applying it for
the separation and determination of copper (II) in various synthetic mixtures. The
developed method is found to be quite selective for the determination of copper (II).
Procedure for determination of copper (II) in synthetic mixtures
The method developed was employed for determination of Cu (II) in various
synthetic mixtures containing other associated metal ions. Number of synthetic
mixtures for Cu(II) containing other associated metal ions were prepared and

PROJECT REPORT 26
analyzed according to the procedure recommended for the respective metal ion of
interest.
In a 10 ml beaker, 50 µg Cu (II) solution and known amounts of other corresponding
metal ions were taken. To this mixture, 1.0 ml of 0.1% SB2(Ib) solution was added
and the pH of the solution was adjusted to 9.0 using buffer solution. The final
aqueous volume of the mixture was made to 10.0 ml and equilibrated with 10.0 ml of
chloroform for 60 seconds. The absorbance of the organic phase was determined
using the calibration graph.

PROJECT REPORT 27
RESULTS AND DISCUSSION
Copper (II) Forms colored complex with BTPIMP, which was quantitatively
extracted in chloroform in the alkaline medium. The extraction of Cu (II)-BTPIMP
complex from the aqueous phase into organic phase was studied over wide range of
experimental conditions. The results obtained during various studies are discussed
below.
Effect of pH
The extraction of copper (II) was carried over the pH range of 1.0 to 11.0 [Table 5.1].
The results obtained from the pH studies indicate that the quantitative extraction
(99.6 %) of copper (II) as complex occurs in the pH range of 8.0 to 10.0 [Figure 5.1].
Above and below this pH range extraction was found to be incomplete.
0
20
40
60
80
100
120
1 2 3 4 5 6 7 8 9 10 11
% E
pH

PROJECT REPORT 28
Solvent study
A variety of solvents were tried to achieve maximum extraction of copper (II). From
the study, chloroform was found to be the most suitable solvent. The extraction of
Cu (II)- SB2(Ib) complex was found to vary from a minimum of 8.57 % to maximum
92.0S3 % for the solvents cyclohexane < xylene < benzene < Toluene < Carbon
tetrachloride < n-Butanol < Dichloromethane < Methyl isobutyl ketone < Isoamyl
alcohol < Ethyl acetate < Chloroform
Absorption spectra
The absorption spectra of the extracted species, i.e. copper (II)- complex into
chloroform Vs reagent blank shows absorption maxima at 440 nm, where absorption
due to reagent was found to be negligible
0
10
20
30
40
50
60
70
80
90
100
Percentage extraction of copper (II) SB2(Ib) with into
Various Solvents

PROJECT REPORT 29
Reagent concentration
The effect of variation of SB2(Ib) BTPIMP in the range of 0.01 % to 0.50 % was
studied for quantitative extraction of 50 µg of copper (II). 1 ml of 0.1 % was found to
be sufficient concentration for the maximum extraction and spectrophotometric
determination of 50 µg copper (II)
Equilibration time and stability
Extraction of copper (II) with SB2(Ib)BTPIMP as a function of equilibration time was
studied for the shaking time of 10 to 240 s. The study reveals that the time of 90
seconds was found to be sufficient for quantitative extraction of copper (II) and
prolong shaking had no adverse effect on extraction and spectrophotometric
determination of copper (II). For further studies, the equilibration time was fixed as
90 seconds.

PROJECT REPORT 30
To study the stability of the complex, immediately after extraction, absorbance of Cu
(II)- SB2(Ib)BTPIMP chloroform extract was measured against reagent blank at 440
nm and then after a definite interval of time, it was observed that the absorbance
remained constant for the period of 22 hours.
Calibration curve and Sandell’s sensitivity
The plot of absorbance against concentration of copper (II) gave a straight line graph,
indicating the Beer’s law is obeyed over the concentration range of 0.1 – 6.0 ppm of
copper (II) at 440 nm. Optimum working range for copper (II) was found to be 1.15-
7.2 ppm as evaluated by Ringbom’s plot. The Sandell’s sensitivity of the method was
found to be 0.0160 µg.cm-2 at 440 nm and the molar absoptivity was found to be
20620 lit.mol-1.cm-1
0.265
0.27
0.275
0.28
0.285
0.29
0.295
0.3
0.305
0.31
0 10 20 30 40
Ab
sorb
ance
Time in Hours

PROJECT REPORT 31
Composition of the extracted species
The composition of the extracted species was determined by the Job’s continuous
variation method and mole ratio method, which has further confirmed by using
slope ratio method.
Job’s continuous variation method shows a sharp maximum at 0.5 mole fraction of
copper (II), indicating 1:1 stoichiometry (copper (II): SB2(Ib) Also in mole ratio
method, the plot shows a break corresponding to the mole ratio 1:1. The nature of
the copper (II)- SB2(Ib) complex was further confirmed by slope ratio method, A
plot of logD Vs log SB2(Ib) in the organic phase, gives a straight line with slope ≈ 1,
supporting the composition of the extracted species as Cu[SB2(Ib).
Precision and accuracy
The precision and accuracy of the extractive spectrophotometric method for
determination of copper (II) was calculated by analyzing the solution containing 2.5
µg of copper (II) . The average for 10 determination was found to be 2.48 µg with the
standard deviation 0.072, the variance 0.0052 and the variation from the mean at 95%
confidence limit as 49.7 ± 0.443.
Effect of foreign ions
Under the optimum conditions, effect of various cations and anions on extraction of
2.5 µg of copper (II) in 10 ml solvent was studied and the tolerance limit of the
diverse ion was set as the amount required to cause an error not greater than ±2 % in
the percentage recovery of Cu (II). The tolerance limits for the diverse ions
investigated are Br-, Cl-, F-, ClO3-, BrO3-, SO42-, NO2-, IO3-, NO3-, S2O32-, SO32-, S2O82-
Acetate, Citrate, Tartarate, Oxalate, thiocyanate, thiourea (20000 µg each); Na+, K+,
Li+, Se4+, Ca2+, Urea, EDTA (10000 µg each); Ba2+, Al3+, V5+, (7500 µg each); S2O72-, Sb3+,
Mo6+, U6+ (5000 µg each); Pt4+, W4+, Pd2+, Fe3+, Mg2+, (1500 µg each); Cr3+, Hg2+, Mn2+,
Zn2+, Fe2+, Fe3+ (500 µg each); Bi3+, Sn2+, Sn4+, Mn2+, Ni2+, Ag+ (100 µg each); Cd2+, Hg2+,
Co2+ (interfering).

PROJECT REPORT 32
Applications
The proposed method was applied for separation and spectrophotometric
determination of copper (II) in synthetic mixtures. The recovery of Cu(II)was 99%
Conclusion
In conclusion, the highlights of the method developed for extractive
spectrophotometric determination of Cu (II) are as follows:
• The method is simple, rapid, and sensitive.
• The extraction of metal ion occurs in single step.
• For extraction of metal ions no salting out agents are required.
• The extraction of the copper metal was quantitative with the analytical
reagent used without the use of any synergetic agent.
• Quantitative extraction of metal ion could be achieved within very short time.
• No pre-equilibration of phases is required; also scrubbing or back washing is
not required.
• The method is relatively free from interference due to commonly associated
cations and anions.
• This method has also been satisfactorily applied for determination of copper
in synthetic mixtures.

PROJECT REPORT 33
Stability constant
Jannik Bjerrum developed the first general method for the determination of stability
constants of metal-ammine complexes in 1941.52 The reasons why this occurred at
such a late date, nearly 50 years after Alfred Werner had proposed the correct
structures for coordination complexes, have been summarised by Beck and
Nagypál53 The key to Bjerrum’s method was the use of the then recently developed
glass electrode and pH meter to determine the concentration of hydrogen ions in
solution. Bjerrum recognised that the formation of a metal complex with a ligand
was a kind of acid-base equilibrium: there is competition for the ligand, L, between
the metal ion, Mn+, and the hydrogen ion, H+. This means that there are two
simultaneous equilibria that have to be considered. In what follows electrical charges
are omitted for the sake of generality. The two equilibria are
H + L HL
M + L ML
Hence by following the hydrogen ion concentration during a titration of a mixture of
M and HL with base, and knowing the acid dissociation constant of HL, the stability
constant for the formation of ML could be determined. Bjerrum went on to
determine the stability constants for systems in which many complexes may be
formed.
M + qL MLq
The following twenty years saw a veritable explosion in the number of stability
constants that were determined. Relationships, such as the Irving-Williams series
were discovered. The calculations were done by hand using the so-called graphical
methods. The mathematics underlying the methods used in this period are
summarised by Rossotti and Rossotti54 The next key development was the use of a

PROJECT REPORT 34
computer program, LETAGROP55,56 to do the calculations. This permitted the
examination of systems too complicated to be evaluated by means of hand-
calculations. Subsequently computer programs capable of handling complex
equilibria in general, such as SCOGS57 and MINIQUAD58 were developed so that
today the determination of stability constants has almost become a “routine”
operation. Values of thousands of stability constants can be found in two commercial
databases59,60
Experimental Study of Stability Constant:
pH metric studies of Cu (II) & Ni (II) of substituted derivative of dihydrazide & substituted 2-
hydroxy benzaldehyde.
Procedure in Short:
Study of the complex formation of Copper (II) ions and Nickel (II) ions with the dihydrazide &
substituted 2-Hydroxy Benzaldehyde.
The stability constants of their complexes with Copper (II) ions and Nickel (II)
ions, have been studied by using Irving-Rossotti method at constant temperature
27 (± 0.5)0C and ionic strength = 0.1 M. (KCl) in 75: 25 (v/v) 1, 4-dioxne-water
medium. The titrations were carried out in an inert atmosphere of nitrogen.
i. 4.0 mL HCl (0.16 M) + 3.36 mL KCl (1.0 M) + 2.64 mL distilled water + 30.0 mL
1,4-dioxane.
ii. 4.0 mL HCl (0.16 M) + 3.36 mL KCl (1.0 M) + 2.64 mL distilled water + 4.0 mL
ligand (L1H) (0.04 M) + 26.0 mL 1,4-dioxane.
iii. 4.0 mL HCl (0.16 M) + requisite amount of KCl (1.0 M) solution + requisite
volume of metal(II) chloride solution to give 0.001 M metal(II) chloride
concentration in the final solution + requisite amount of distilled water + 4.0 mL
ligand (L1H) (0.04 M) + 26.0 mL 1,4-dioxane.

PROJECT REPORT 35
Proton ligand formation constants of the ligand and metal ligand formation constant
of binary system were determined pH metrically by the method of Bjerrum and
Calvin as modified by Irving and Rossotti titration technique. PH-metric titrations
were carried out with systolic- μ pH meter having combined glass electronic and
temperature probe maintained with readability + 0.1oC. The metal ligand ratio was
maintained at 1:2. The total volume was maintained at 40 ml. All the solutions were
titrated against standard carbonate free KOH (0.2 M) solution.
From the titration curves of solutions (i) and (ii), ñA values at various pH were
calculated. The proton ligand formation curve was obtained by plotting the values of
ñA vs. pH-meter readings. From the graph the values of log K1H and log K2H were
evaluated by half Integral method (A). The values of log K1H and log K2H were also
evaluated using graphical method (B) by plotting the graph of log [ñA / (1-ñA)]
against pH and log [(2- ñA) / (ñA-1)] against pH, respectively.
Observation:
The dissociation constant of the Schiff bases investigated in the present work show
that Schiff bases are basic in nature. The pK1H values are in the range of 12.0 – 12.8.
The binary systems of the metal complexes were also studied. In this binary systems
studied, the order of stability constants of mixed ligand complexes with respect to
the metal ions was found to be Cu(II) > Ni (II) which is same as in the
corresponding binary (M-Lsec) systems. This is in accordance with the Irving-
Williams series of stability constant61.62.
The values of log Kter are slightly lower than log K1 . log K1 is the metal-ligand
stability constant of binary complexes with corresponding secondary ligand. The
relative stability of binary complexes can be qualitatively expressed in many
different ways. We have expressed the relative stabilities in terms of Δ log KT, Δ log
KT = log KTer – log K1, and log K1 is the metal-ligand stability constant of binary

PROJECT REPORT 36
complexes with corresponding secondary ligand. The Δ log KT values for all the
metal (II) ions in the present study is negative. This indicates that binary 1:1 (M-Lsec)
complexes are stable. This behavior can be explained on the basis, that there is less
number of sites available on M-Lpri complex than on aquated metal ion.
The graphical representation of the above observations is as follows:
Titration curves for Metal-SB2 system Titration curves for Metal-SB3 system

PROJECT REPORT 37
Formation curve of proton-ligand system of Schiff base (SB2)
Half integral method Graphical method
Formation curves for Metal (cu) -SB2 system (Half Integral Method)

PROJECT REPORT 38
Formation curves for Metal (cu)-SB2 system (Graphical Method)
Formation curves for Metal (Ni) -SB2 system (Half Integral Method)

PROJECT REPORT 39
Formation curves for Metal (Ni)-SB2 system (Graphical Method)
PROJECT REPORT 40
ISE as an APPLICATION
Optimization of Electrode Membrane Composition
In order to prepare the electrode which has optimum response performance with
respect to the specific ion under study, the effect of variation in the nature and the
percentage composition of the membrane constituents on the potential response in
terms of slope of the ISE was studied. Results of the optimization studies carried out
for Ni(II) electrodes are given in table 3.1. The optimum membrane
composition (w/w) was found to be: Resin Araldite GY 257(60.8%), Hardner HY
837(21.9%), Plasticizers dibutyl phthalate (DBP), dioctyl phthalate (DOP) or diethyl
phthalate (DEP) (14.6%) and carrier / complex (2.7%). With this optimum membrane
composition, the maximum and steady potential response as measured in terms of
slope (mV/ decade change in concentration) for the ISE was found to be in the range
29-34mV.
Membrane preparation
The PVC-based membranes were prepared by prepared by the method of Craggs et
al. [1]. Resin Araldite GY 257(60.8%), Hardner HY 837(21.9%), Plasticizers dibutyl
phthalate (DBP), dioctyl phthalate (DOP) or diethyl phthalate (DEP) (14.6%) and
carrier / complex (2.7%) were prepared minimum quantity of THF. The solution thus
obtained, after complete dissolution of the various components, was poured into
acrylic rings placed on a smooth glass plate and allowed to evaporate at room
temperature. After 24h, transparent membranes of 0.5 mm thickness were obtained.
A 5 mm diameter piece was cut out and glued to one end of a Pyrex glass tube63-73.
The membranes prepared above were equilibrated in 1.0 M NiCl2.7H2O were
dissolved in 20 ml THF for two days and used further for potential measurement
studies.

PROJECT REPORT 41
Preparation of electrode
To prepare the electrode platinum wire was coated by dipping it several times in the
slurry until a bead was formed and was kept for drying in air for 24 h. Before using,
the electrode was dipped in distilled water for 10 min.
Effect of Activation Time and Concentration of Activating Solution
ISEs are generally activated before use by activating or conditioning the membranes.
The membranes were conditioned with Ni(II). Solutions of concentrations in the
range 0.1M to 2.0M for varying length of time from 12 hours to 48 hours. It was
observed that the maximum and steady response potential was obtained when the
membranes were activated in 1.0M solution of respective ions for 24 hours
Effect of Concentration of Internal Reference Solution
The optimum concentration of the internal reference solution was determined by
varying the concentration in the range of 10-3M to10-1M of the respective metal ions.
It was observed that the response of the electrode was better when 10-1M solution of
the respective metal ion was used as internal reference solution; when the solutions
of concentrations 10-2M and 10-3M were used, the response was unstable and the
results were non-reproducible.
Effect of Plasticizers
The selectivities of carrier – based ISEs are highly influenced1 by the membrane
solvent, i.e. the plasticizer. This influence is assumed to be due to the polarity of the
plasticizer. This correlation is, however, only qualitative. The plasticizer also
strongly influences the measuring range, i.e. the upper and the lower limits of the
ISEs, through no simple correlation with its polarity alone is expected.1.
it is therefore, necessary to investigate the effect of various plasticizers with a view

PROJECT REPORT 42
to make a choice of plasticizer which gives optimum results. The effect of plasticizers
on electrode performance was therefore studied. Various plasticizers like dibutyl
phthalate (DBP), dioctyl phthalate (DOP) or diethyl phthalate (DEP) were used in
varying proportions to examine the performance of the electrodes. It
was observed that while membranes with DBP and DEP gave satisfactory
performance, the results with other membranes in terms of observed slope were not
encouraging. Results of membrane performance using different plasticizers are
given in table 3.4 Membranes with plasticizers were found to have better elasticity in
comparison to the membranes without plasticizers which were found to be brittle
and gave a potential response with a lower slope per decadechange in metal ion
concentration. The observed slope was 30mV±2 for Nickel (II) electrode. The
plasticizers DBP or DEP were, therefore selected for the use in further work.
Response Time and Stability
After optimizing the parameters like membrane composition, activation time,
concentration of activating solution and concentration of internal reference solution,
the response time and stability of the electrodes were also determined, as these are
very important characteristics of ISEs. In earlier IUPAC recommendations, the
response time was defined as the length of time between the instant at which the ISE
and the reference electrode are brought in contact with a sample solution (or the
time at which the concentration of the ion of interest in a solution is changed on
contact with an ISE and a reference electrode) and the first instant at which the
potential of the cell becomes equal to its steady state value within 1mV2 or has
reached 90% of the final value3. More recently, it has been extended to be able to
treat the drifting systems as well. In this case, the second time instant is defined as
the time at which the slope, E/t, becomes equal to limiting value 4,5. The response
time was determined by dipping the electrodes into the solutions of respective metal
ion of concentration 10-5M to 10-1M and the potential response was recorded at
PROJECT REPORT 43
short intervals of 30 seconds each. The maximum time required to obtain a steady
potential response was found to be 60 seconds. The study of variation of the
electrode potential with the length of time of immersion of the electrode in solution
showed a stable and reproducible potential The life-span or stability of an ion
selective electrode with respect to time is an important factor in the use of any
electrode. The life-spans of the electrodes were determined by measuring the
response potential of the electrode at different time intervals. The electrodes
were found to be effective over a period of two months if stored properly by dipping
in 0.01M solution of the respective metal ion.
Effect of pH
The pH dependence of the response potential Ni(II) ISEs was investigated over the
pH range of 2 to 12 for 10-2M and 10-4M solutions of the respective ions. It was
observed that the potential response remains constant in the working pH range 3.0-
6.0 for Ni (II) electrode and Ni (II) electrode containing dibutyl phthalate and
diethyl phthalate as plasticizers. Above and below these pH ranges, a sharp change
in potential response was observed. The pH dependence of the potential response
can be expected as the complex formation between the metal ions and the
complexing ligands in the membrane matrix proceeds through the replacement of a
proton by the corresponding metal ion.
Conclusion
The proposed ion selective membrane electrodes for Nickel is easy to prepare and
can be used for the determination of Ni (II) ions in solution in the range 10-1M to 10-
5 M. The functional pH range lies between 3.0 - 6.0 for Ni (II) electrode. Various
experimental parameters have been optimized. The response time for all the
electrode is about 02 minutes and the electrodes are stable for about
two weeks, if stored properly. The presence of several other ions tested does not

PROJECT REPORT 44
significantly interfere with the sensitivity of the ISE. The electrodes have been
successfully employed for the determination of the respective ions in samples
including chemicals and sea water. The results obtained compare well with those
obtained by alternative methods.
Biological activity
Some of the metal complexes of the above synthesized Schiff bases were tested for
their antibacterial & antifungal activities only.
Procedure in short: The biological activities of synthesized Schiff base and its Cu (II), Ni
(II) metal complexes were studied for their antibacterial and antifungal activities.
Following bacterial and antifungal culture which were used for the experiments.
Bacterial Cultures
i) Escherchia Coli ATCC 8739 (Gram negative rod)
ii) Bacillus Subtilis ATCC6633 (Gram positive rod)
iii) Staphylococcus Aureus ATCC6538 (Gram positive cocci)
iv) Streptococcus Epidermidis ATCC12228 (Gram Positive cocci)
v) Nircococus Luteus ATCC 10240 (Gram Positive cocci)
vi) Psudomonas Aerogenosa ATCC 9027 (Gram Positive rods)
Fungal Cultures
i) Candida albocans ATCC 10231
ii) Aspergilus niger ATCC 16404
Above bacterial/fugal cultures were plated in agar plate and were incubated at
respective conditions with test solutions filled in the hole punctured in the agar plate

PROJECT REPORT 45
(for bacterial culture optimum conditions is 25°C for 24 hrs for Bacteria and 48°C for
fungus)
Observation
The distance between the edge of the hole and the edge of the inhibitory zone is
measured and used in evaluation. No zone of inhibition was observed. These
compounds don’t have any antibacterial or antifungal effect but may have other
properties like antiviral, anticancer etc which needs to be tested.

PROJECT REPORT 46
REFERENCES
1. H. Schiff, Ann. Chem., 131, 118, 1864.
2. H. Schiff, Ann., 150, 193, 1869.
3. G. Schiff, Ann., 151, 186, 1869.
4. Laurent and Gerhart, Annalen., 76, 304, 1850
5. H. Schiff, Ann. Chem., 131, 118, 1864.
6. H. Schiff, Ann., 150, 193, 1869.
7. G. Schiff, Ann., 151, 186, 1869.
8. C. Etting, Ann., 35, 241, 1840.
9. G. Schiff, Ann., 151, 186, 1869.
10. G. Schiff, Ann., 151, 186, 1869.
11. L. F. Lindoy, Quarst Rev., 25, 379, 1979.
12. R. W. Layer, Chem. Rev., 63, 489, 1963.
13. F. P. Dwyer and D. P. Mellor, Ed. Chelating Agents and Metal Chelates, Academic Press,
New York, 1964.
14. S. Patai, Chemistry of Carbon-Nitrogen Double Bonds, Interscience, Williams Clowes and
Sons, London, 1970.
15. H. Schiff, Ann., 150, 193, 1869.
16. P. J. McCarthy, R. J. Horey, K. Ueno and A. E. Martell, J. Chem. Soc., 77, 5820, 1955.
17. H. Schiff, Ann. Chem., 131, 118, 1864.
18. H. Irving and R. J. P. Willams, J. Chem. Soc., 3192, 1953.
19. P. Singh, R. L. Goel and B. P. Singh, J. Ind. Chem. Soc., 52, 958, 1975.
20. M. S. El-Shahawi, Anal. Sci., 7(3), 43, 1991.
21. G. Schiff, Ann., 151, 186, 1869.
22. G. Schiff, Ann., 151, 186, 1869.
23. G. Schiff, Ann., 151, 186, 1869.

PROJECT REPORT 47
24. Morrison, G. H. and Freiser, H., Solvent Extraction in Analytical Chemistry, Wiley,
New York, 1957.
25. Stary, J., Solvent Extraction of Metal Chelates, Pergamon, London, 1964.
26. Zolotov, Y.A., Extraction of Chelate Compounds, Original in Russian, Nauk.
Moscow, 1968. English translation: J. Schmorak, Ann. Arbor-Humphrey, London,
1970.
27. Mercus, Y. and Kertes, A. S., Ion Exchange and Solvent Extraction of Metal
Complexes, Wiley-Interscience, New York, 1969.
28. De, A. K., Khopkar, S. M. and Chalmers, R. A., Solvent Extraction of Metals, Van
Nostrand Reinhold, London, 1970.
29. Diamond, R. A. and Tuck, D. G., Progress in Inorganic Chemistry, Ed. By Cotton, F.
A., 2, 109, 1960.
30. Marcus, Y., Chem. Rev., 63, 139, 1963.
31. Sekine, T. and Hasegawa, Y., Solvent Extraction Chemistry: Fundamentals and
Applications, Marcel Dekkar Inc., New York, 1977.
32. Peligot, E., Ann. Chim. Phys., 5, 7, 1842.
33. Rothe, J. W., Chem. News, 66, 182, 1892.
34. Hanroit, M., Bull. Soc. Chim. Fr., 7, 171, 1892.
35. Langmur, A. C., J. Am. Chem. Soc., 22, 102, 1990.
36. Fischer, H. Wiss. Veroff. Siemens-Konz., 4, 158, 1925.
37. Fischer, H. Angew. Chem., 47, 685, 1934.
38. Meunier, P., Compt. Rend., 199, 1250, 1934.
39. Sandell E. B. and Perlich, R. W., Ind. Eng. Chem. Anal., 11, 309, 1939.
40. Vannosi, R., Anal. Soc. Cient. Argent., 131, 226, 1939.
41. Moeller, T. Ind. Eng. Chem. Anal. 15, 270, 1943.
42. Pharmaceutical Manufacturing, “Pollution Prevention and Abatement Handbook”,
World Bank Group, 1998, 382.

PROJECT REPORT 48
43. A. Monks, “A Report for the Rural Industries Research Develpoment Corporation,”
Nov. 2000.
44. R. L. Medes, B. P. Mobre, M. T. Cardoso and A. F. Palavra, Inorg. Chim. Acta., 356,
2003, 328.
45. N. O. Elbashir, S. M. Al-Zahrani M. I. A. Mutalib and Abasaeed, Chem. Eng. and
Porc., 41, 9, 2002.
46. I. Souchon, F. X. Pierre, S. Sambat, M. Bes and M. Marin, Desalination, 148, 2002, 346.
47. J. P. Clark, Food Tech., 58(7), 2004, 78.
48. W. Fiddler, J. W. Penabane, R. A. Gates and D. J. Donoghle, J. Agric. Food Chem.,
47(1), 1999, 206.
49. British Pat., 995 471 472 997 881 1,055, 532, 1964.
50. P. B. Barrera, A. Moreda and A. B. Barrera, Spectro. Chim. Acta. B. Atomic Spectro.,
57(12), 2002, 1951.
51. P. B. Barrera, A. Moreda and A. B. Barrera, Spectro. Chim. Acta. B. Atomic Spectro.,
57(12), 2002, 1951.
52. Bjerrum, J. Metal-ammine formation in aqueous solution. Copenhagen: Haase, 1941.
53. Beck, M.T.; Nagypál, I. Chemistry of Complex Equilibria. Horwood. ISBN
0853121435. Chapter 1, 1990.
54. Rossotti, F.J.C.; Rossotti, H. The Determination of Stability Constants. McGraw–Hill, 1961.
55. Dyrssen, D.; Ingri, N; Sillen, L.G. "Pit-mapping - A general approach to Computer
refinement of stability constants.". Acta Che. Scand. 15: 694–696.
doi:10.3891/acta.chem.scand.15-0694, 1961.
56. 5. Ingri, N; Sillen, L.G. "High-speed computers as a supplement to graphical
methods, IV. An ALGOL version of LETAGROP-VRID". Arkiv. Kemi 23: 97–121,
1964.
57. Sayce, I.G. "Computer calculations of equilibrium constants of species present in
mixtures of metal ions and complexing reagents". Talanta 22 (12): 1397–1421. PMID
18960446, 1968.

PROJECT REPORT 49
58. Sayce, I.G. "Computer calculations of equilibrium constants of species present in
mixtures of metal ions and complexing reagents". Talanta 22 (12): 1397–1421. PMID
18960446, 1968.
59. Rossotti, F.J.C.; Rossotti, H. The Determination of Stability Constants. McGraw–Hill,
1961.
60. Sayce, I.G. "Computer calculations of equilibrium constantsof species present in
mixtures of metal ions and complexing reagents". Talanta 22 (12): 1397–1421. PMID
18960446, 1968.
61. H. Irving and R. J. P. Willams, J. Chem. Soc., 3192, 1953.
62. H. Irving and R. J. P. Willams, J. Chem. Soc., 3192, 1953.
63. L.E. Maley and D.P. Mellor, Austrai. J. Sci. Res., 2A (92), 579, 1949.
64. H. Irving and Mrs. H.S. Rossotti, J. Chem. Soc., 3397, 1953.
65. F.J.C. Rossotti and H.S. Rossotti, Acta. Chem. Scand., 9, 1166, 1955.
66. A.E. Martell and M. Calvin, Chemistry of Metal Chelate Compounds, N. Y. Prentice
Hall Inc., 1956.
67. H.M. Irving and H. S. Rossotti, J. Chem. Soc., 2904, 1954.
68. L.G. Van Uitert., C.G. Haas, J. Am. Chem. Soc., 75,451, 1953.
69. L.G. Van Uitert., W.C. Fernelius. and B.E. Douglas, J. Am. Chem. Soc., 75, 451,1953.
70. H.S. Harned and B.B. Owen, The Physical Chemistry of Electrolytic Solutions, II
Edition, Reinhold Pub. Corp., N.Y., 548, 1950.
71. A.I .Vogel, A Text Book of Practical Organic Chemistry, 3rd Edition, Longmans, p.
177, 1984.
72. H. Irving and R.J.P. William, J. Chem. Soc., 3192, 1953.
73. H. Irving and R.J.P. William, Nature. 162, 746., 1948.