Embed Size (px)
Citation preview

Prepared for Vent 2006 Chicago, Illinois, USA
May 15, 2006
Prepared by:
Allan E. Prits, P.Eng. Manager, Engineering Services
Stantec Consulting Ltd.
7070 Mississauga Road, Suite 160 Mississauga, ON, Canada L5N 7G2
905-817-2072 [email protected]
Study of Nitrogen Leakage Impact on Operator Safety
Using CFD

Vent 2006 660-89300 Study of Nitrogen Leakage Impact on Operator Safety Using CFD
May 2006 i
Abstract Stantec Consulting Ltd. was retained by a client to evaluate the potential risk to the life safety of operators from an accidental release of a large volume of nitrogen being stored under high pressure. The objectives of the assignment were to: 1 Determine the expected distribution of the large scale nitrogen leak, and specifically consider the potential to displace the life sustaining oxygen atmosphere in the pit area where operators carry out their duties. 2. If a potential for displacing the life sustaining oxygen atmosphere in the pit area exists, determine recommended modifications to prevent such an occurrence. To meet these objectives, Stantec chose to use CFD modeling validated with field gathered data and observations of the operation. This presentation will summarize the analysis carried out, and the methods used in the application of CFD techniques. The major conclusion from the investigation was that a leak could result in an atmosphere with a reduced oxygen content. Another interesting conclusion was that the high pressure release could result in windstorm like conditions that would impact on any attempts by operators to leave the area via the available stairwells. The proposed action plan developed as a result of this investigation to ensure operator safety will be reviewed.
Vent 2006 660-89300 Study of Nitrogen Leakage Impact on Operator Safety Using CFD
May 2006 ii
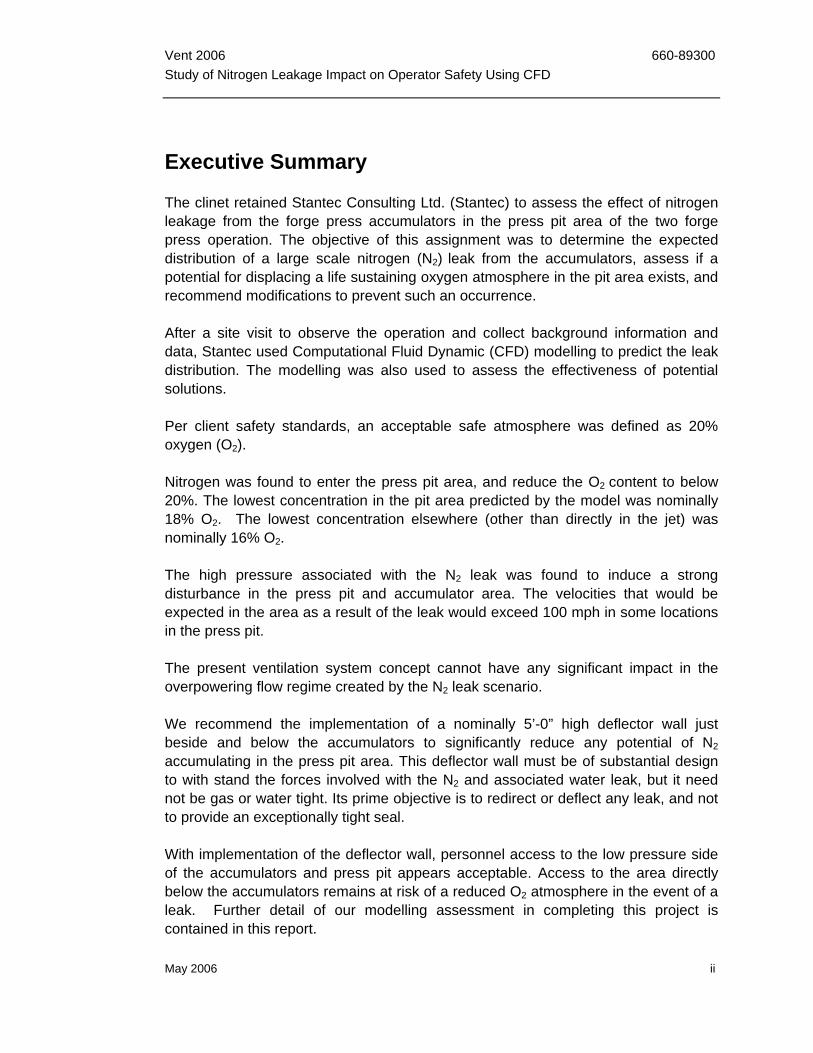
Executive Summary The clinet retained Stantec Consulting Ltd. (Stantec) to assess the effect of nitrogen leakage from the forge press accumulators in the press pit area of the two forge press operation. The objective of this assignment was to determine the expected distribution of a large scale nitrogen (N2) leak from the accumulators, assess if a potential for displacing a life sustaining oxygen atmosphere in the pit area exists, and recommend modifications to prevent such an occurrence. After a site visit to observe the operation and collect background information and data, Stantec used Computational Fluid Dynamic (CFD) modelling to predict the leak distribution. The modelling was also used to assess the effectiveness of potential solutions. Per client safety standards, an acceptable safe atmosphere was defined as 20% oxygen (O2). Nitrogen was found to enter the press pit area, and reduce the O2 content to below 20%. The lowest concentration in the pit area predicted by the model was nominally 18% O2. The lowest concentration elsewhere (other than directly in the jet) was nominally 16% O2. The high pressure associated with the N2 leak was found to induce a strong disturbance in the press pit and accumulator area. The velocities that would be expected in the area as a result of the leak would exceed 100 mph in some locations in the press pit. The present ventilation system concept cannot have any significant impact in the overpowering flow regime created by the N2 leak scenario. We recommend the implementation of a nominally 5’-0” high deflector wall just beside and below the accumulators to significantly reduce any potential of N2 accumulating in the press pit area. This deflector wall must be of substantial design to with stand the forces involved with the N2 and associated water leak, but it need not be gas or water tight. Its prime objective is to redirect or deflect any leak, and not to provide an exceptionally tight seal. With implementation of the deflector wall, personnel access to the low pressure side of the accumulators and press pit appears acceptable. Access to the area directly below the accumulators remains at risk of a reduced O2 atmosphere in the event of a leak. Further detail of our modelling assessment in completing this project is contained in this report.

May 2006 ae:\vent2006\vent2006_tpaper_ n2leakcfd_aep_final.doc
STUDY OF NITROGEN LEAKAGE IMPACT ON OPERATOR SAFETY USING CFD Table of Contents
Page
1.0 INTRODUCTION 1
2.0 DATA COLLECTION AND ANALYSIS 2 2.1 Field Data and Observations 2 2.2 Discussion of Model Set-Up and Validation 2 2.3 Interpreting the CFD output Plots 3
3.0 PREDICTIVE CFD RESULTS – RUNS AND ANALYSIS 7 3.1 Base Case – With Leak (Steady State) 7 3.2 Base Case – with Leak (Transient Case) 9 3.3 Scenario 1 – 5’ Deflector Wall – (Transient Case) 15 3.4 Other Scenarios 21
4.0 CONCLUSIONS 22
5.0 RECOMMENDATIONS 24 ATTACHMENT 1 Presentation Slides

Vent 2006 660-89300 Study of Nitrogen Leakage Impact on Operator Safety Using CFD
May 2006 1
1.0 INTRODUCTION The client retained Stantec Consulting Ltd. (Stantec) to assess the effect of nitrogen leakage from the forge press accumulators in the press pit area of the two forge press shop. The objective of this assignment is to investigate the impact of an unexpected nitrogen leak on the atmosphere in the press pit area. Should such a leak occur, no one anywhere in the press pit area is to be exposed to an oxygen deficient atmosphere. The client’s plant operates several large forge presses. The two press systems require the use of twelve large accumulators charged with nitrogen. Each accumulator vessel is nominally 3’-0” diameter and 80’-0” high with an internal pressure of 5,000 psi. The accumulators operate on a manifold system, and are interconnected. If there is a leak, the entire volume of contained nitrogen is potentially available for discharge. A “worst case” leak scenario involving a valve failure in the high pressure side of the system was selected as the leak orifice. A valve failure on the high pressure side of the one press system occurred recently. The entire accumulator charge was lost during an offshift. This event demonstrated that a system wide, nitrogen loss is possible. The objectives of this assignment were to:
1. Determine the expected distribution of a large scale nitrogen leak from the accumulators, specifically considering the displacement of a life sustaining oxygen atmosphere in the press pit area.
2. If a potential for displacing the life sustaining oxygen atmosphere in the press pit area exists, determine recommended modifications to prevent such an occurrence.
To meet these objectives, Stantec carried out the following steps:
observe the typical operation of the press system
establish a computational fluid dynamic (CFD) model of the press pit area
use the model to predict the impact of a leak
provide recommendations as to concepts to minimize the creation of any oxygen deficient atmosphere.
This report provides a concise summary of the work we carried out and our recommendations. It is not detailed documentation of all modelling runs, modelling output and assessments we have carried out in completing this assignment. A set of presentation slides is included in Attachment 1.

Vent 2006 660-89300 Study of Nitrogen Leakage Impact on Operator Safety Using CFD
May 2006 2
2.0 DATA COLLECTION AND ANALYSIS 2.1 FIELD DATA AND OBSERVATIONS During our field observations, Stantec recorded the airflow patterns in the press pit and accumulator area using video recording of smoke tracers, observation of smoke tracers, as well as air flow measurements. Two ventilation systems supply the press pit area. The operating conditions and parameters of the press pit ventilation are summarized below. Two man cooler style axial fans are continuously in operation below the accumulators (both these fans have the same performance characteristics).
Table 2.1 Local Ventilation Sources
Press Pit Total Air Movement (actual cfm)
Press 1 8,400 cfm Press 2 9,400 cfm Mancooler Fans 7,500 cfm each (Two (2) blowers)
While the press pits have separate make up air supply systems, they are connected by openings into the central access stairwell that serves both pits. Drawings of the press pit area construction and obstructions were obtained for dimensional data. Field measurements and observations were also used to include the major equipment “blockages” that were not shown on drawings. Temperatures of equipment surfaces and press equipment conditions were also field measured. 2.2 DISCUSSION OF MODEL SET-UP AND VALIDATION The leak parameters identified to be the worst case scenario was a severed 7.75” ID pipe, with release to the north west. The leak properties of the N2 gas were investigated. Discussions with the N2 supplier were confirmed with investigation of the properties of N2 gas. A leak temperature of 5°F based on 5000 psi accumulator pressure was used. Ambient air temperature was 70°F. Wall and equipment surface temperatures were measured during the field investigation. In carrying out the model set up and assessment, the objective is to assess correlation of the model with actual observations and measurements. Sensitivity

Vent 2006 660-89300 Study of Nitrogen Leakage Impact on Operator Safety Using CFD
May 2006 3
assessments of the modelling output to input parameters are also made. Many different underlying assumptions are reviewed and the impact on predicted results is assessed. This analysis of the model set up and predicted results gives us insight into the behaviour of the flow regime, and allows us to develop valid options for proposed solutions. These valid options receive more in depth predictive assessment. The validation focused model run was the base case no leak condition in steady state. The model showed good correlation with the smoke tracer release observations. Based on review of the modelling runs and observation data, it was concluded that the model was sufficiently robust and representative to enable assessment of the leak scenario outcome. The model geometry and set up can be generally seen in Figure 1, Model Geometry. The ventilation path lines shown by the model can be seen in Figure 2. These illustrate the typical distribution of the air supplied to the pits and circulated under the accumulators with the existing ventilation system. 2.3 INTERPRETING THE CFD OUTPUT PLOTS Attached in this report are several exhibits of CFD output. This section contains key information to successfully interpret the output results. Geometry plots – plot to familiarize reader with elements of geometry included in the modelling. Note that some detail must be switched off in 2-D plots to enable a view of the interior of model area. Colour is used to distinguish different model elements. Streamline or Pathline plots – these plots are intended to illustrate flow patterns within the model space. Colour of streamline trace lines is not significant in plots presented in this study. N2 Concentration plots – these plots present the isosurface and internal slices of N2 Concentration. The colour scale on the left of each plot represents N2 mass fraction. Note that the air atmosphere is assumed to be 21% O2 and 78% N2. The leak release is pure N2. Base on the N2 mass fraction, the O2 level can be determined from the table below.

Vent 2006 660-89300 Study of Nitrogen Leakage Impact on Operator Safety Using CFD
May 2006 4
Table 2.3
LEGEND: Contours of N2 Concentrations (or Mass Fraction) Colored
Scale Colored
Scale N2 levels
(from leak only) %
Air levels (21% O2;78%N2)
%
O2 levels %
RED 1.00 100% 0% 0.0% 0.90 90% 10% 2.1% 0.80 80% 20% 4.2% 0.70 70% 30% 6.3% 0.60 60% 40% 8.4% 0.50 50% 50% 10.5% 0.40 40% 60% 12.6% 0.30 30% 70% 14.7% 0.20 20% 80% 16.8% 0.10 10% 90% 18.9% 0.05 5% 95% 20.0% 0.04 4% 96% 20.2% 0.03 3% 97% 20.4% 0.02 2% 98% 20.6% 0.01 1% 99% 20.8%
BLUE 0.00 0% 100% 21.0%

Vent 2006 660-89300 Study of Nitrogen Leakage Impact on Operator Safety Using CFD
May 2006 5
Fig 1- Model Geometry

Vent 2006 660-89300 Study of Nitrogen Leakage Impact on Operator Safety Using CFD
May 2006 6
Fig 2-Base Case CFD pit ventilation system (fresh air) pathlines

Vent 2006 660-89300 Study of Nitrogen Leakage Impact on Operator Safety Using CFD
May 2006 7
3.0 PREDICTIVE CFD RESULTS – RUNS AND ANALYSIS In carrying out the predictive case runs, the overall objective was to develop insight into the flow pattern behaviour and N2 atmosphere distribution with the leak scenario. For discussion purposes, we have broken the major types of runs into the following classifications: Base case with leak (Steady State)
Base case with leak (Transient Case)
Modified geometry - 5’ deflector wall (Transient Case)
Modified geometry – 10’ deflector wall (Transient Case) After discussion with client personnel, it was agreed that when N2 reduces the atmosphere to less than 20 % oxygen, it should be considered a potentially hazardous atmosphere. During our assessment, we selected output with either 19 or 20 % oxygen makeup in the atmosphere and discuss the specifics involved with our criteria with each case. 3.1 BASE CASE – WITH LEAK (STEADY STATE) Review of this output demonstrated that in the event of the leak scenario, N2 will enter the pits below both the two presses. Figure 3 illustrates the typical steady state pathlines of N2 distribution into the pit area.

Vent 2006 660-89300 Study of Nitrogen Leakage Impact on Operator Safety Using CFD
May 2006 8
Fig 3- Steady State N2 pathlines

Vent 2006 660-89300 Study of Nitrogen Leakage Impact on Operator Safety Using CFD
May 2006 9
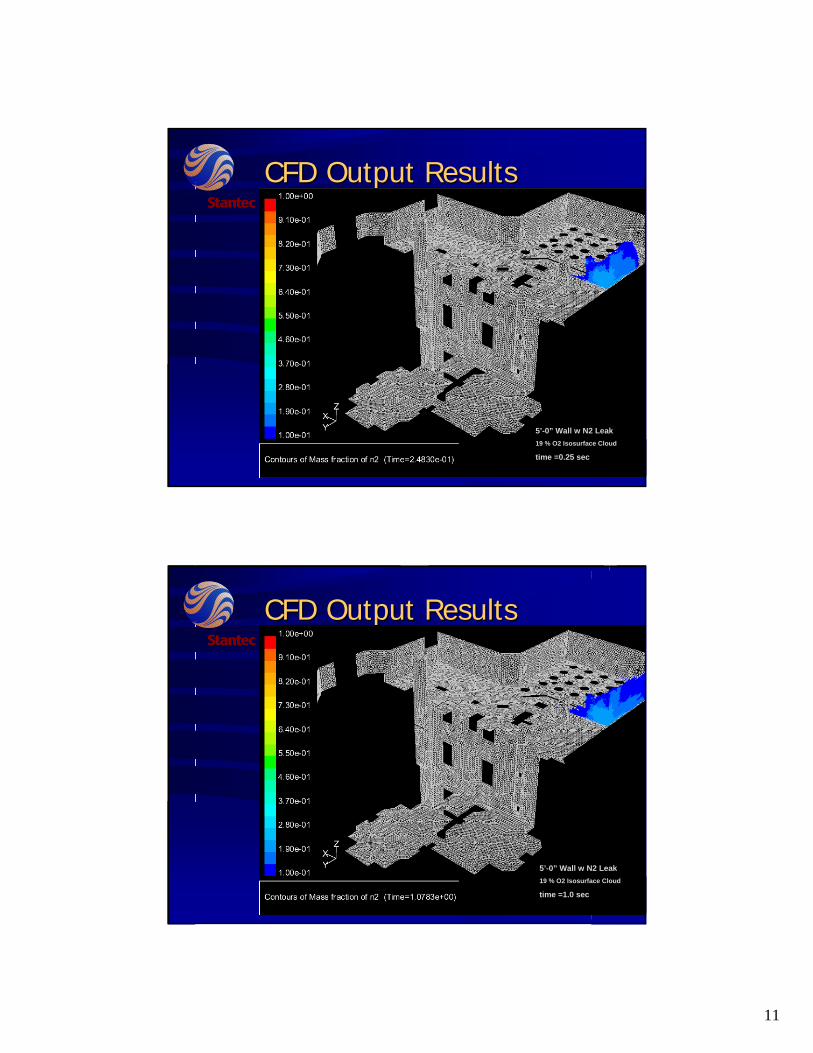
3.2 BASE CASE – WITH LEAK (TRANSIENT CASE) The use of transient analysis allows the prediction of the distribution and spread of a N2 “leak cloud” over time. The high pressure leak creates a high pressure zone in front (push zone), as well as a low pressure zone behind the leak front (suction zone). This results in a radical change to the ventilation and air movement patterns observed without a leak. The suction zone has a large impact because it draws the flow field in behind the leak front. The large pressure difference causes rapid air mixing and rapid depletion of the O2 levels in the pit basement area. The relatively enclosed geometry around the two press areas (this refers to the extensive checkerplate on top of grating used for equipment access purposes) prevents the upward escape of N2 that has entered the pit, effectively trapping the N2. For illustration of the N2 leak dispersion Figures 4, 5, 6, 7 were plotted. The leak “cloud” is represented by an isosurface of nominally 19% O2 concentration in the plots. The plots represent the cloud evolution at 0.25, 1.0, 10 and 60 second intervals after the start of the leak, respectively. The oxygen concentration in the cloud is less than the isosurface value (19% O2).

Vent 2006 660-89300 Study of Nitrogen Leakage Impact on Operator Safety Using CFD
May 2006 10
Fig 4 and 5

Vent 2006 660-89300 Study of Nitrogen Leakage Impact on Operator Safety Using CFD
May 2006 11
Fig 6 and 7

Vent 2006 660-89300 Study of Nitrogen Leakage Impact on Operator Safety Using CFD
May 2006 12
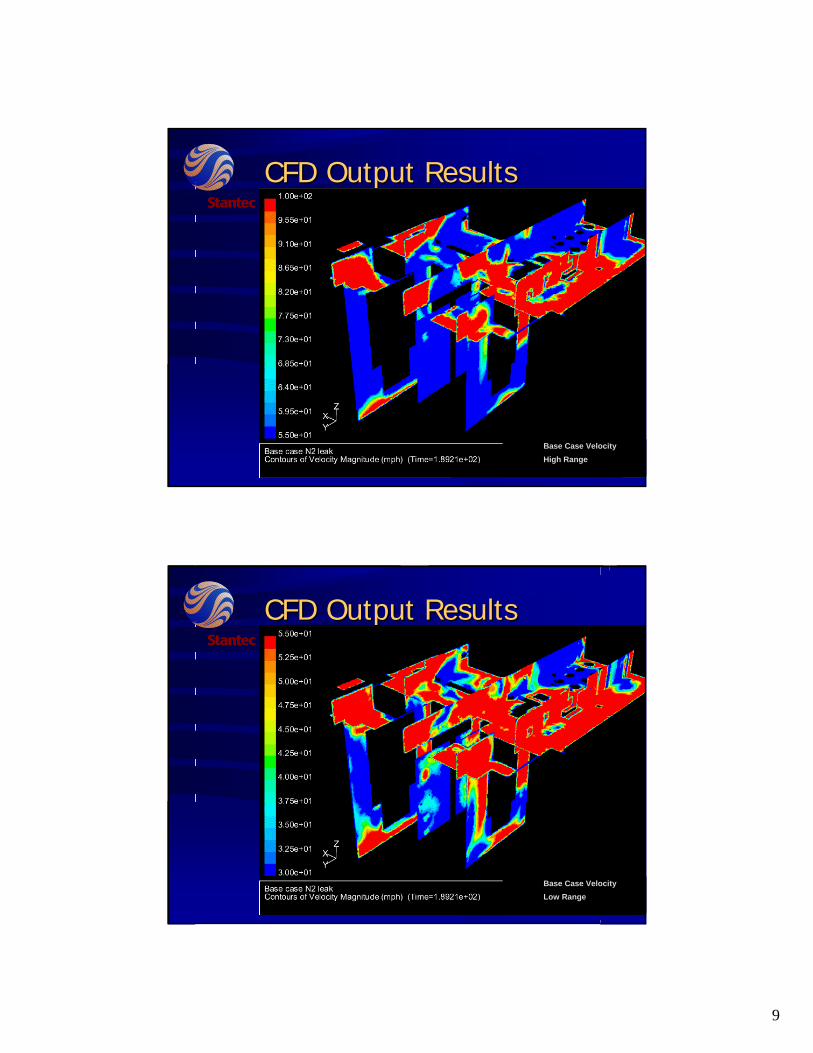
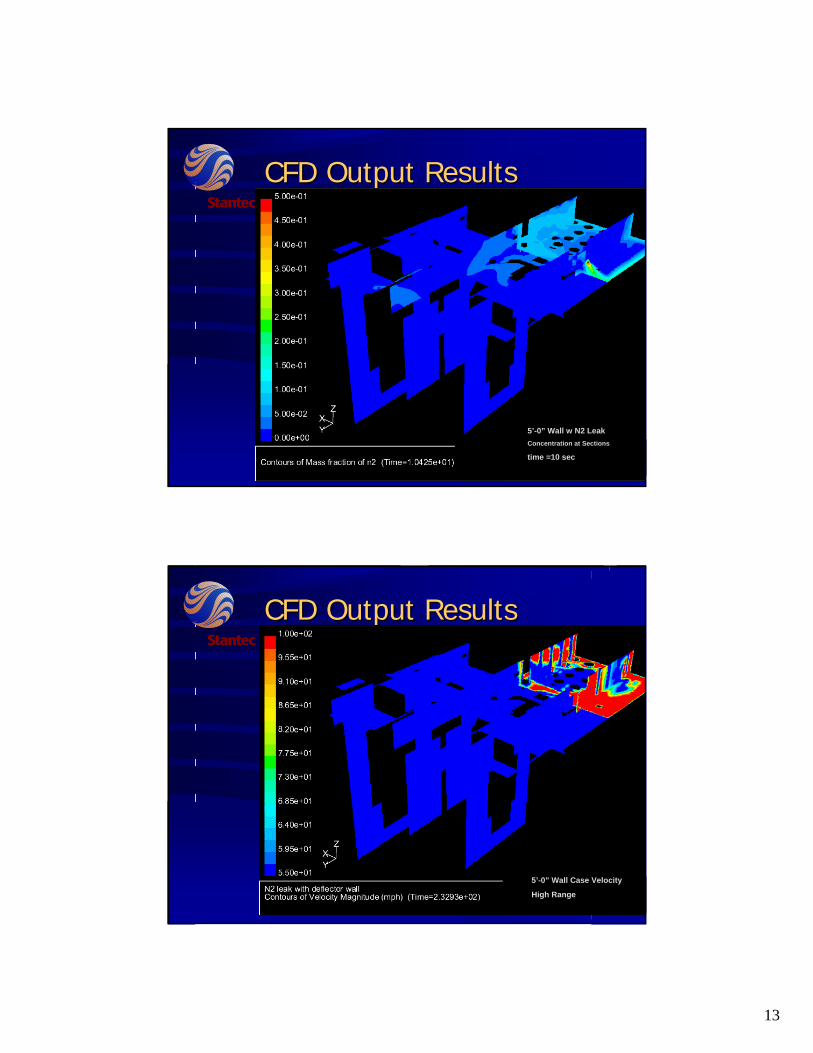
Note that in a three dimensional space, the “leak cloud” will not be of a fixed concentration. It will instead be a variation of concentrations depending on exact location. Figure 8 illustrates several sections of interest around the pit areas showing the range of concentrations that correspond with fig 6, 10 seconds after the start of leak. In addition to the concentration of N2 present, some appreciation of the conditions to be expected in the pit area can be developed with Figures 9a and 9b Base Case leak velocity profiles. The high pressure, catastrophic failure creates the velocity profiles shown. Note that the high velocities present (100 mph+) will create a windstorm like environment right down to the bottom of the press pits. The high velocities would be a secondary challenge to personnel in this area, the primary challenge is the deficient oxygen atmosphere.

Vent 2006 660-89300 Study of Nitrogen Leakage Impact on Operator Safety Using CFD
May 2006 13
Fig 8

Vent 2006 660-89300 Study of Nitrogen Leakage Impact on Operator Safety Using CFD
May 2006 14
Fig 9a, 9b

Vent 2006 660-89300 Study of Nitrogen Leakage Impact on Operator Safety Using CFD
May 2006 15
3.3 SCENARIO 1 – 5’ DEFLECTOR WALL – (TRANSIENT CASE) The use of a wall has been discussed as a potential solution to prevent the N2 release from the high pressure accumulator system side entering the press pit area. As any leak on the high pressure side will likely be preceded by a release of some amount of water, the wall will need to be substantial to withstand the associated force. Detail assessment of the forces and required wall designs were outside the scope of this project. The leak scenario chosen involves a leak located at the valve elevation which is nominally 2’ to 3’ above the accumulator basement level (elevation 134’ to 135’). For a preliminary assessment of the success of a physical wall barrier the height was chosen to be above the leak point. This is a nominal 5”-0” height (elevation 137’). The N2 leak , which should be considered to behave as a discharge jet, was effectively directed upward by the deflector wall. This height of deflector wall provided effective redirection of the N2 release. The redirection of the N2 flow field also resulted in a significantly altered flow pattern when compared with the non wall situation. Figures 10, 11, 12 and 13 that follow provide several snap shots of the distribution of the N2 leak cloud as time advances with the 5’ high wall in place. The isosurface concept illustrates the evolution of the leak over time. The time frame chosen is similar to the base case, at 0.25, 1.0, 10 and 60 second intervals after the start of the leak, respectively. Figures 10, 11 and 12 represent nominal 19% O2 concentrations isosurface plots. Figure 13 represents nominal 20% O2 concentrations isosurface plots.

Vent 2006 660-89300 Study of Nitrogen Leakage Impact on Operator Safety Using CFD
May 2006 16
Fig 10 and 11

Vent 2006 660-89300 Study of Nitrogen Leakage Impact on Operator Safety Using CFD
May 2006 17
Fig 12 and 13

Vent 2006 660-89300 Study of Nitrogen Leakage Impact on Operator Safety Using CFD
May 2006 18
Figure 14 illustrates sections of interest to assess the actual concentrations at specific points in the model. Figure 15a and 15b shows plots of the corresponding atmosphere velocities in the pit and access areas. Note that the high velocities and windstorm like atmosphere will not occur anywhere other than under the accumulators with the deflecting wall in place. Note that the area under the accumulators will continue to have an O2 deficient atmosphere with the deflecting wall in place.

Vent 2006 660-89300 Study of Nitrogen Leakage Impact on Operator Safety Using CFD
May 2006 19
Fig 14

Vent 2006 660-89300 Study of Nitrogen Leakage Impact on Operator Safety Using CFD
May 2006 20
Fig 15a and 15b

Vent 2006 660-89300 Study of Nitrogen Leakage Impact on Operator Safety Using CFD
May 2006 21
3.4 OTHER SCENARIOS We considered several other scenarios. Specific output from these has not been included for brevity. We have commented briefly on these approaches here. Modifications to the existing press ventilation system (involving additional volume, redesigned delivery louvres, etc) was not effective in overcoming the high energy level associated with the leak discharge “jet”. Note, however that the condition and poor state of repair (large holes in ductwork) and poor distribution of air leave room for improvement of these systems. Differing deflector wall heights (including up to 10’ high) were also examined. The objective of the wall is not to “seal” against leakage, but provide a deflection of the N2 “jet” to prevent the N2 becoming trapped in the pit area. The 5’ high deflector wall should be adequate for any high pressure leak scenarios we have discussed and envisaged. Note that this wall is really a deflector first, its objective is not to “seal” out the N2 or water that will accompany a leak. Any openings to allow penetration of pipes and other interferences will not be required to be tightly sealed. Detail design of the deflector wall will require robust construction to withstand the forces associated with an unexpected leak. Further assessment to predict the worst case atmosphere that would potentially exist with the present scenario were carried out. While such absolute predictions are “best guesses” with the qualitative modelling techniques used in our assessment, we predict that the lowest O2 level that will exist is in the order of 18% in the actual pit area. The lowest O2 level is estimated at 16% elsewhere (this is other than directly in the leak jet stream itself, which is approaching 0% O2).

Vent 2006 660-89300 Study of Nitrogen Leakage Impact on Operator Safety Using CFD
May 2006 22
4.0 CONCLUSIONS The following are the key conclusions from our assessment: Should a significant N2 leak occur at the clients facility, the pit and access areas
under the two presses will experience an atmosphere with oxygen content less than 20 %.
The main driving factor for N2 to enter the pit area is the strength of the N2 leak jet velocity toward the pit area. This is further compounded by the push-suction effect of the leak. The existing pit ventilation systems will be over powered by those impacts with the present geometry.
Other contributing, and important factors for N2 migration into the pit area is the “enclosure” of the pit (especially the checkerplate covered floor gratings) and the N2-Air temperature difference.
Any reasonable increase in pit ventilation volume alone cannot solve the atmosphere quality risk in the pit during the leak.
Should a leak occur with the existing geometry, a windstorm like environment would exist in the pit area, with air movement above 100 mph expected.
The main objective of any wall configuration is to deflect the energy of an unexpected release. A 5’ high deflection wall is sufficient to deflect the N2 leak jet we considered.
During assessment of the deflector wall effect, an N2 leak jet was deflected upward and back into the accumulator area. The accumulator area fills up quickly, mixes with air, warms and escapes upward. The push-suction pressure effect is now localized to the accumulator area with only a small effect on the pit atmosphere. With the deflector wall in place, we do not anticipate any large impact from N2 accumulation on the operating floor level surrounding the accumulators (i.e. floor elevation 142’) as the N2 quickly mixes and rises. Note however, that our model scope boundary did not extend a great distance past the pit area.
In the model of the 5’ high deflector wall impact, the N2 spilled to the basement area and towards the pits but quickly warmed and mixed with air without causing significant O2 depletion during the first few critical minutes and during steady state.
With the 5’ high deflector wall in place, the turbulent windstorm like atmosphere is not expected in the press pit itself or the access areas (stairwell).

Vent 2006 660-89300 Study of Nitrogen Leakage Impact on Operator Safety Using CFD
May 2006 23
With all modelled cases (including the recommended 5’ high deflector wall), the area under the accumulators themselves will have an oxygen deficient atmosphere.
In all modeled cases, after a few minutes into the N2 leak, once the path lines were established, the whole area can be looked at as steady state since no major changes in concentration occur. N2 was constantly warming, mixing with air and escaping upward.

Vent 2006 660-89300 Study of Nitrogen Leakage Impact on Operator Safety Using CFD
May 2006 24
5.0 RECOMMENDATIONS We recommend the construction of a deflection wall to channel any unexpected
N2 leaks away from the two presses in the press pit and access area. This will prevent the occurrence of an oxygen depleted, windstorm like atmosphere for any personnel who may be in this area at the time of the leak.
A nominal 5’ high emergency leak deflection wall (to elevation 137’) will be effective in allowing safe personnel escape from the pit/basement area for a leak located up to nominal 3’ (elev 135’) above the accumulator floor level. The objective is to deflect the leak away from the pit and access area. A higher leak elevation requires a correspondingly higher deflector wall height.
The basement area immediately below the accumulator vessels will have an oxygen depleted atmosphere, and should not be considered safe for personnel should an unexpected leak occur.

ATTACHMENT 1
Presentation Slides

1
Study of Nitrogen Leakage Study of Nitrogen Leakage Impact on Operator Safety Impact on Operator Safety
Using CFDUsing CFD
Allan E. Prits, P.EngMay 15, 2006May 15, 2006
Outline of PresentationOutline of Presentation
• Background and objective for project• Why use CFD?• Model set-up and validation• CFD output results• Conclusions for the project• Comments on the use of CFD for this
project
2
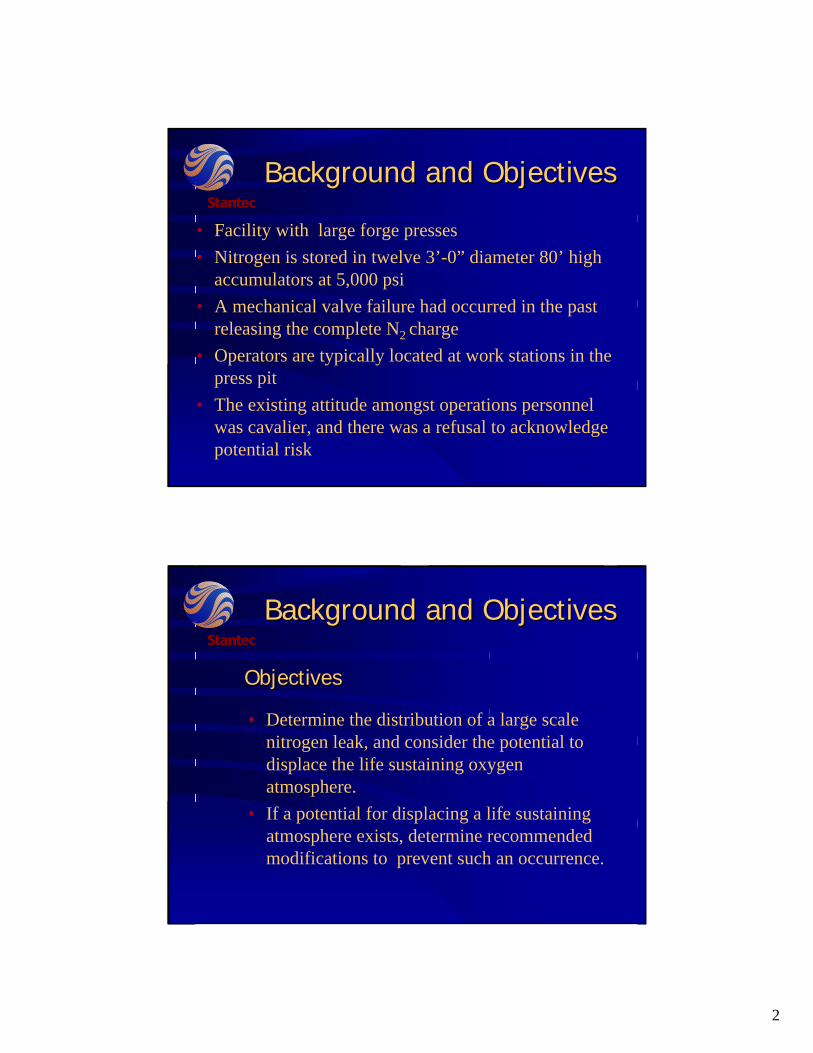
Background and Objectives Background and Objectives
• Facility with large forge presses• Nitrogen is stored in twelve 3’-0” diameter 80’ high
accumulators at 5,000 psi• A mechanical valve failure had occurred in the past
releasing the complete N2 charge• Operators are typically located at work stations in the
press pit • The existing attitude amongst operations personnel
was cavalier, and there was a refusal to acknowledge potential risk
Background and Objectives Background and Objectives
• Determine the distribution of a large scale nitrogen leak, and consider the potential to displace the life sustaining oxygen atmosphere.
• If a potential for displacing a life sustaining atmosphere exists, determine recommended modifications to prevent such an occurrence.
ObjectivesObjectives
3
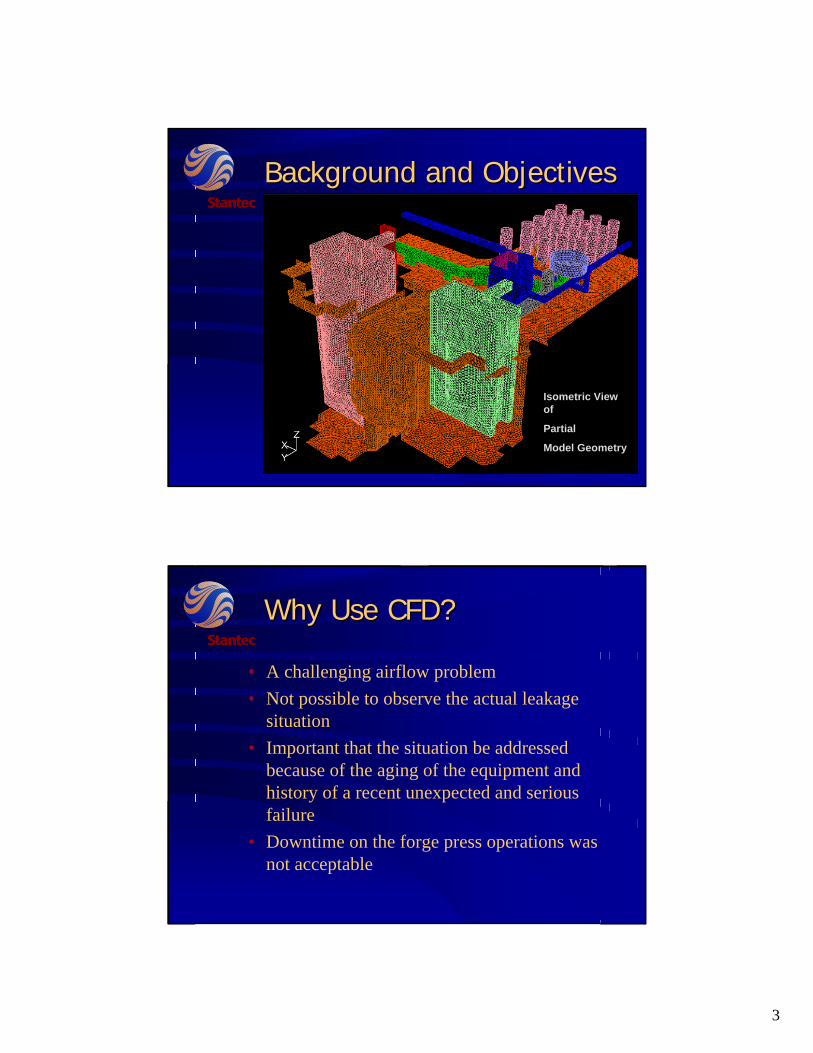
Background and Objectives Background and Objectives
Isometric View of
Partial
Model Geometry
Why Use CFD?Why Use CFD?
• A challenging airflow problem• Not possible to observe the actual leakage
situation• Important that the situation be addressed
because of the aging of the equipment and history of a recent unexpected and serious failure
• Downtime on the forge press operations was not acceptable

4
Model SetModel Set--Up and ValidationUp and Validation
– Local ventilation systems of 8,400 cfm and 9,400 cfm– Two (2) mancooler type fans, each 7,500 cfm– Observation of smoke tracers and general crossdrafts– Scale drawings of press pit and accumulator base were
obtained
• Field Data and Observations
Model SetModel Set--Up and ValidationUp and Validation
• Additional Input Information– Worst case leak parameter severed 7.75” ID pipe– Leak properties of N2 investigated. Leak
temperature 5 ºF based on 5000 psi accumulator pressure assumed.
– Ambient air temperature of 70 ºF

5
Model SetModel Set--Up and ValidationUp and Validation
– Validation focused model run was a base case no leak condition in steady state.
– Model showed good correlation with the smoke tracer release observations.
– Model convergence and performance were sufficiently robust to enable agreement that base case model was representative.
– The at risk atmosphere defined to be when the release of N2reduces O2 content to less than 20%.
•Validation
•Evaluation Criteria
CFD Output ResultsCFD Output Results
Total Ventilation Pathlines
Note: This is Plan View looking down on presses and accumulators

6
CFD Output ResultsCFD Output Results
Steady State N2 Leak
Pathlines
CFD Output ResultsCFD Output Results
Base Case N2 Leak19 % O2 Isosurface Cloud
time =0.25 sec

7
CFD Output ResultsCFD Output Results
Base Case N2 Leak19 % O2 Isosurface Cloud
time =1.0 sec
CFD Output ResultsCFD Output Results
Base Case N2 Leak19 % O2 Isosurface Cloud
time =10 sec

8
CFD Output ResultsCFD Output Results
Base Case N2 Leak19 % O2 Isosurface Cloud
time =60 sec
CFD Output ResultsCFD Output Results
Base Case N2 LeakConcentration at Sections
time =10 sec
9
CFD Output ResultsCFD Output Results
Base Case VelocityHigh Range
CFD Output ResultsCFD Output Results
Base Case VelocityLow Range

10
CFD Output ResultsCFD Output Results
•• Discussion of Base Case ResultsDiscussion of Base Case Results–– The “leak cloud” will not be of a fixed The “leak cloud” will not be of a fixed
concentration, but will be variation of concentration, but will be variation of concentrations based on exact location. concentrations based on exact location.
–– There is a potential for NThere is a potential for N22 to displace the to displace the minimum acceptable 20% Ominimum acceptable 20% O22 atmosphere.atmosphere.
–– The high pressure, catastrophic failure will result The high pressure, catastrophic failure will result in a windstorm like environment down to the in a windstorm like environment down to the bottom of the press pits. bottom of the press pits.
CFD Output ResultsCFD Output Results
•• Discussion of Options to ConsiderDiscussion of Options to Consider
––Modifications to Ventilation Supply SystemModifications to Ventilation Supply System––Barrier WallBarrier Wall––Eliminating Use of NEliminating Use of N22
11
CFD Output ResultsCFD Output Results
5’-0” Wall w N2 Leak19 % O2 Isosurface Cloud
time =0.25 sec
CFD Output ResultsCFD Output Results
5’-0” Wall w N2 Leak19 % O2 Isosurface Cloud
time =1.0 sec

12
CFD Output ResultsCFD Output Results
5’-0” Wall w N2 Leak19 % O2 Isosurface Cloud
time =10 sec
CFD Output ResultsCFD Output Results
5’-0” Wall w N2 Leak19 % O2 Isosurface Cloud
time =60 sec
13
CFD Output ResultsCFD Output Results
5’-0” Wall w N2 LeakConcentration at Sections
time =10 sec
CFD Output ResultsCFD Output Results
5’-0” Wall Case Velocity
High Range

14
CFD Output ResultsCFD Output Results
5’-0” Wall Case Velocity
Low Range
Conclusions on Project Conclusions on Project
• Should a significant N2 leak occur, the pit and operator access areas under the forge presses will have an atmosphere with oxygen content less than 20%
• Driving factor for N2 entry is the leak velocity toward the pit area. The relative velocity difference to the local ventilation system delivery will overpower its effect
• Other factors for N2 entry to the pit are enclosure ( by overhead walkway ) and the N2 – ambient air temperature differential

15
Conclusions on Project Conclusions on Project (Cont’d)(Cont’d)
• No reasonable increase in pit ventilation volume alone can eliminate the infiltration by N2
• A leak occurrence will create a windstorm like environment in the pit and access area, air movement above 100 mph is expected
• A deflector wall is a viable solution to the N2build up in the press pit area, and would limit the risk area to the unoccupied accumulator base
Conclusions on CFD Conclusions on CFD
• CFD was a powerful tool that enabled operator appreciation of potential risks in the event of a leak or potential valve failure
• Visualization of the flow regime and likely outcomes were important
• The evaluation of the transient leak evolution enabled generation of a series of time step predictions and creation of an animation presentation of iso-surface propagation representing the leak

16
Conclusions on CFD Conclusions on CFD (Cont’d)(Cont’d)
• Without the use of CFD, changes in the facility operations would not have been implemented
ThankThank--you.you.
Stantec Consulting Ltd.Stantec Consulting Ltd.4000+ Person Professional Services Firm
NYSE – SXE TSE - STN
Allan E.Allan E. PritsPrits, P.Eng, P.Eng
EHS Services, Toronto, CanadaEHS Services, Toronto, Canada
905905--817817--20722072
aprits@[email protected]
17
Study of Nitrogen Leakage Study of Nitrogen Leakage Impact on Operator Safety Impact on Operator Safety
Using CFDUsing CFD
Allan E. Prits, P.EngMay 15, 2006May 15, 2006