Embed Size (px)
Citation preview

STUDY OF METAL DUSTING MECHANISM IN IRON USING RAMAN SPECTROSCOPY AND X-RAY DIFFRACTION
Z. ZENG, K. NATESAN, and V. A. MARONI
Argonne National Laboratory Argonne, IL 60439, USA
December 2001 Distribution R. B. Poeppel W. J. Shack K. Natesan Z. Zeng V. A. Maroni S. Hagamann For Proceeding of the International Workshop on Metal Dusting, Sept. 26-28, 2001, Argonne National Laboratory, Argonne, IL . *Work supported by Office of Industrial Technologies, U.S. Department of Energy, under Contract W-31-109-Eng-38.

STUDY OF METAL DUSTING MECHANISM IN IRON USING RAMAN SPECTROSCOPY AND X-RAY DIFFRACTION
Z. ZENG*, K. NATESAN, and V. A. MARONI
Argonne National Laboratory Argonne, IL 60439, USA
ABSTRACT
The metal dusting phenomenon, which is a metal loss process that occurs in hot reactive gases, was investigated in iron and certain iron-base alloys by Raman scattering, X-ray diffraction (XRD), and scanning electron microscopy. Coke from metal dusting exhibits six Raman bands at 1330 (D band), 1580 (G band), 1617, 2685, 2920, and 3235 cm-1. The bandwidths and the relative intensities of the 1330 and 1580 cm-1 bands are related to the crystallinity and defect structure of the coke. Both Raman and XRD analyses suggest that the metal dusting process influences the catalytic crystallization of carbon. A new mechanism of metal dusting is therefore proposed, based on the premise that coke cannot crystallize well by deposition from carburizing gases at low temperature without catalytic activation because of its strong C-C bonds and high melting temperature. Cementite or iron participates in the coke crystallizing process in a manner that tends to improve the crystallinity of the coke. At the same time, fine iron or cementite particles are liberated from the pure metal or alloys.
INTRODUCTION
Metal dusting is a high temperature corrosion phenomenon that occurs in Fe-, Co-, or Ni-base alloys in strongly carburizing gas atmospheres at carbon activities (aC) > 1 in the temperature range of 400 to 900°C. During the metal dusting process, corrosion of the metals and alloys occurs, accompanied by the formation of fine metal carbide or pure metal and carbon dust. Dusting-related failures have occurred most often in the petroleum and petrochemical industries. This deterioration has been studied for more than 50 years, but its mechanism and driving force are still not clear.
Hochman (Hochman 1977) proposed the following mechanism for the metal dusting of iron: (a) Carbon is deposited on the metal surface and is dissolved in the metal; (b) cementite (Fe3C) forms as carbon diffuses into the iron and the metal becomes oversaturated; and (c) metastable Fe3C decomposes to Fe and graphite. Grabke and his coworkers carried out detailed studies on this mechanism (Grabke et al. 1998; Pippel et al. 1995)
According to Hochman’s mechanism, the final products are graphite and iron. However, there is no conclusive evidence that the iron phase is present in every case of metal dusting. It is not clear what drives the formation and decomposition of cementite under the same conditions of temperature, pressure, and composition. It is easy to understand that graphite crystallizes from a supersaturated solution, but it is doubtful that this crystallization also causes Fe3C to decompose. * Corresponding author address: Z. Zeng, Argonne National Laboratory, 9700 S. Cass Ave., Argonne, IL 60439; e-mail: [email protected]

The formation and decomposition of chemical bonds require a sizeable free energy change. There is no question that cementite is a product of metal dusting. However, it is arguable whether this compound is essential to metal dusting or is only a by-product of that process.
To investigate the metal dusting phenomenon, scanning electron microscopy(SEM), Transmission electron microscopy, Auger electron spectroscopy, and X-ray diffraction(XRD) analyses have been used to study the microstructure, electron binding, and phase chemistry of the metal dusting products. Thus far, investigations have focused on defects in the metals. Defects in the carbon dust have hardly been studied, even though carbon is an integral part of the metal dusting process.
Graphite has a layered structure with the space group P63/mmc (see Fig. 1). Carbon atoms within the layers bond strongly through sp2 hybridization and arrange in a two-dimensional honeycomb network. The layers are stacked in a hexagonal crystal structure and are bound together by van der Waals forces. Because the van der Waals forces are weak, the C-C distance between layers is large (335.4 pm). For this reason, graphite crystals readily disorder along the c-axis (Krebs, 1968)
a
c
FIGURE 1. Structure of graphite. Carbon atoms within layers are arranged in a two-dimensional honeycomb network; layers are stacked in a hexagonal crystal structure.
Raman scattering from various forms of carbon is sensitive to structural
disorder of the material (Dillon and Woollam 1984; Tuinstra and Koenig 1970; Nakamizo et al. 1978). As a result, Raman spectroscopy provides a useful nondestructive technique for structural characterization of carbon materials. Lattice defects in graphite break down the hexagonal symmetry of the graphite lattice and modify the optical selection rules for the lattice vibrational modes that are observable in Raman scattering. A single Raman line, the E2g2 vibration mode, is theoretically expected for the hexagonal lattice of graphite and has been observed at 1575 cm-1 in natural graphite. In glassy carbon, the layers are perfectly parallel but their mutual orientation in the direction of the planes is random (due to the weak link between the layers). A band at 1355 cm-1 observed for glassy carbon has been assigned to a defect-activated vibrational mode originating from

the distorted hexagonal lattice of graphite near the crystal boundary. The two bands at 1355 and 1575 cm-1 are designated as the D (distorted) band and the G (graphite) band, respectively. It has been reported that the relative intensity ratio ID/IG and the relative bandwidths increase in progression from single-crystal graphite though polycrystalline graphite up to glassy carbon; hence, their values can be used as a measure of imperfection of the graphite layer planes (Dillon and Woollam 1984; Tuinstra and Koenig 1970; Nakamizo et al. 1978). These parameters are more defect-sensitive than are the XRD parameters that define crystalline size. Therefore, Raman spectroscopy represents a useful tool for investigating the defects in carbon structures and their relationships to the metal dusting phenomenon. In this paper, we present results of Raman spectroscopy measurements that are pertinent to metal dusting.
EXPERIMENTAL
Pure iron and 78Fe-22Al alloy were used for metal dusting experiments. Specimens were polished with 400 grit SiC paper, and experiments were conducted in a horizontal furnace with a quartz tube (1.5 inch in diameter). One set of specimens was hung in an alumina boat and exposed to a flowing carburizing atmosphere of 72.4% H2-8.1% CO2-17.2% CO-2.3% H2O593°C and 704°C. The specimens were then cooled in the furnace to room temperature in the same atmosphere after exposure.
After each exposure period, specimen weight change was determined after removal of adhering coke in an ultrasonic bath with acetone. Phases present in the coke and metal samples were analyzed by X-ray powder diffraction. Microstructure was examined with a JSM-6400 scanning electron microscope. To study the metallographic cross section, the samples were electrolytically etched with 10% acetic acid at 10 V for 30 seconds.
Raman spectra were obtained with a Renishaw System 2000 imaging Raman microscope equipped with an He-Ne laser that delivered ~ 5 mW to the specimen. The spectra were recorded between 190 and 4000 cm-1 with the laser partially defocused to a diameter of ~ 5 µm to avoid burning or otherwise transforming the carbon deposits. Spectra were taken at three to six locations on a given specimen to verify that the observed surface deposits were uniform in composition.
Magnetization of the samples was measured by a vibrational sample magnetometer under 1 Tesla in an Ar atmosphere.
RESULTS AND DISCUSION
Metal dusting rates of the iron and the Fe-Al alloys are shown in Table 1. The pure iron was corroded severely. At 593°C, the metal dusting rate of the Fe-Al alloy is close to that of the pure iron, which indicates that an Al2O3 protecting layer had not formed to protect the alloy from metal dusting. However, the Fe-Al alloy gained weight at 704°C because it took oxygen from the atmosphere and formed an oxide layer on the surface to stop metal dusting.

Table 1 Metal loss of iron and alloys (mg/cm2)
Exposure Temperature (°C) Metal 593 704
Fe -55.1 -13.7 Fe-Al -45.7 0.45
There is a tightly adhering carbon layer on the surface of the iron and the Fe-Al alloy (Fig. 2a). It cannot be removed by ultrasonic cleaning followed by acetone washing with a cotton tip. Metallographic cross section shows that the iron is separated into small islands on the surface of the specimen. The overall volume increase is ~10% when the carbon diffuses into the iron and forms cementite. This volume expansion must create many defects. The metal dusting process causes the metal particles to further separate into nanometer size particles that become embedded in the coke. The metal appears to have been attacked more severely at grain boundaries and dislocation points (Fig. 2b). Therefore, defects in the metal seem to initiate and propagate the metal dusting process.
FIGURE 2. (a) SEM photomicrograph of metallographic cross section of iron, showing tightly bound carbon layer on iron surface after ultrasonic cleaning. Iron particles are separated into small particles and move away from the metal surface. (b) Grain boundaries that were attacked more severely.
The major phases in the metal dusting product are graphite and Fe3C (Fig. 3a). There may be a small amount of Fe3O4, which presents a weak diffraction peak at 2θ = 35.4°. According to the mechanism proposed by Hochman (Hochman 1977), Fe3C decomposes to Fe and C at the final step, in which case the final products should be Fe and C. However, there is no iron diffraction peak in the product of metal dusting. Because XRD may not be able to find the iron when its content is < 5%; a magnetic measurement method was used. Iron is a strong ferromagnetic material with a Curie temperature (Tc) of 770°C (Lide
a b

1999). A huge magnetization increase would be observed at 770°C if there were iron in the product of metal dusting. Figure 4 shows the magnetization of metal dusting product as a function of temperature. The large transition of magnetization at 210°C is due to Fe3C (Lide 1999). The small magnetization increase at 582°C may be due to a small amount of ferromagnetic Fe3O4 with a Tc of 585°C (Lide 1999). However, there is no obviously transition of magnetization near 770°C. The very small magnetic moment near 700°C indicates that the concentration of regular α-iron in the product of metal dusting is < 0.1%. It is possible that some iron particles are too small for XRD and magnetic measurement to observe. However, both XRD and magnetic measurement show that the major phase in coke is obviously Fe3C rether than Fe. The Fe3C is the final product of metal dusting, not merely the intermediate compound predicted by Hochman’s mechanism. Therefore, further investigation is needed to establish metal dusting causes and mitigation for the metal dusting corrosion observed under our experimental conditions.
0
200
400
600
800
1000
1200
1400
1600
20 30 40 50 60 70 80
Arb
itrar
y In
tens
ity
2θ
(a)
(b)
g
g
c
c c
c
c
c c
cc c
c
cc cc
cc
c
g
c
cc c cc
c cc
c cc c c
coke
layer on Fe surface
*
*
FIGURE 3. X-ray diffraction pattern of coke and surface layer on iron sample after exposure to carburizing gas at 593°C for 100 h; major phases are graphite (g) and cementite (c); there may also be a small amount of Fe3O4 (aesterisk) which presents only its strongest peak.

0
1
2
3
4
5
0 200 400 600 800
M (e
mu/
g)
T (oC)
Fe3C
Fe3O
4Fe
FIGURE 4. Magnetization (M) of metal dusting product made at 593°C as a function of temperature.
0
1000
2000
3000
4000
25 25.5 26 26.5 27 27.5 28
Arb
itrar
y In
tens
ity
2θθθθ
Graphite
593C coke
704C coke
FIGURE 5. Peak widths of [002] diffraction increase from graphite to coke made at 704°C to coke made at 593°C; narrower peak width indicates better crystallinity.

The [002] X-ray diffraction peak widths of the carbon dust are broader than that of the well-crystallized graphite (Fig. 5), which we interpret as indicating that the crystallinity of carbon dust is poorer than that of graphite. However, the [002] peak widths of the coke are much narrower than those of glassy carbon (see Fig. 6). Table 2 shows that the crystallite sizes of cokes are much larger than that of glassy carbon. To the authors’ knowledge, the crystallite sizes of cokes are also considerably larger than those reported for other carbonaceous materials made at a similar temperature (Blayden et al. 1940; Schaeffer et al. 1953; Kinney 1956).
0
500
1000
1500G lassy carbon
0
1000
2000
3000
4000Graphite
0500
100015002000
20 30 40 50 60 70 802θ
593C
0
1000
2000
3000
704C
002
FIGURE 6. X-ray diffraction pattern of glassy carbon, well-crystallized graphite, and coke made at 593°C and 704°C. Major phases in coke samples are graphite and cementite. Table 2 Crystallite dimensions and interlayer plane distances of graphite, coke made at 704°C, coke made at 593°C, and glassy carbon; ∆ is difference of interlayer plane distance of carbon from single-crystal graphite (with interlayer plane distance 3.354 Å).
Crystallite size (Å) Carbon materials
Interlayer plane distance (Å)
∆ (Å)
c-axis a-axis
Mean number of layers per particle
Graphite 3.356 0.002 220 299 65.7 Coke made at 704°C
3.362 0.006 145 151 43.3
Coke made at 593°C
3.365 0.011 110 127 32.8
Glassy carbon 3.736 0.382 12 15 3.4

The interlayer distances of the carbon plane are related to the degree of disorder (Blayden et al. 1940; Schaeffer et al. 1953). The layers are not parallel in the disoriented graphite structure. Average interlayer plane distance increases when the layers are disoriented, as shown in Fig. 7. The interlayer plane distance is 3.354 Å for single-crystal graphite (Franklin 1951). The interlayer plane distance of coke is very close to that of the well-crystallized graphite. Franklin (Franklin 1951) proposed the following relationship of the proportion of disorientated layers (p) as a function of interlayer plane distance (d):
d = 3.44 - 0.086(1-p2). According to this relationship, the interlayer plane distances of coke made at 704°C seen in Table 2 (3.362 Å) are indicative of a carbon having ~70% three-dimensional ordering. For the carbons produced by conventional treatment of carbon-containing raw materials, a heat treatment temperature > 2000°C for thermal recrystallization is necessary before this high degree of three-dimensional ordering is achieved (Blayden et al. 1940; Schaeffer et al. 1953).
Single crystal graphite Disoriented graphite
FIGURE 7. Average interlayer plane distance of disoriented graphite is greater than that of single-crystal graphite
Raman spectra of coke, glassy carbon, and graphite are presented in Fig. 8.
The well-crystallized graphite shows two peaks: the sharp band at 1580 cm-1 (G band) can be assigned to the E2g C-C stretching mode (Tuinstra and Koenig 1970; Nemanich and Solin 1977; Al-Jishi 1982). The other peak at 2685 cm-1 is a two-phonon band taken to be 2 x 1330 cm-1. The first-order phonon band at 1330 cm-1 (D band) is not observed for well-crystallized graphite because of the k = 0 selection rule (Tuinstra and Koenig 1970). However, disorder in the lattice can cause a breakdown of this selection rule, which is why the 1330 band is observed in the Raman spectra of glassy carbon. Symmetry may also be affected by a high degree of disorder that could, for example, cause the second-order phonon at 2685 cm-1 to disappear in the Raman spectra of glassy carbon. The 2685 cm-1 band is designated as the G’ band because its character is similar to that of the G band. The highly disordered carbons have very broad Raman bands, and the intensity of the 1330 cm-1 band increases when carbon becomes more disordered. Intensities of the D band are considered to depend on in-plane displacements, which lead to a loss of hexagonal symmetry of the two dimensional graphite lattice within the
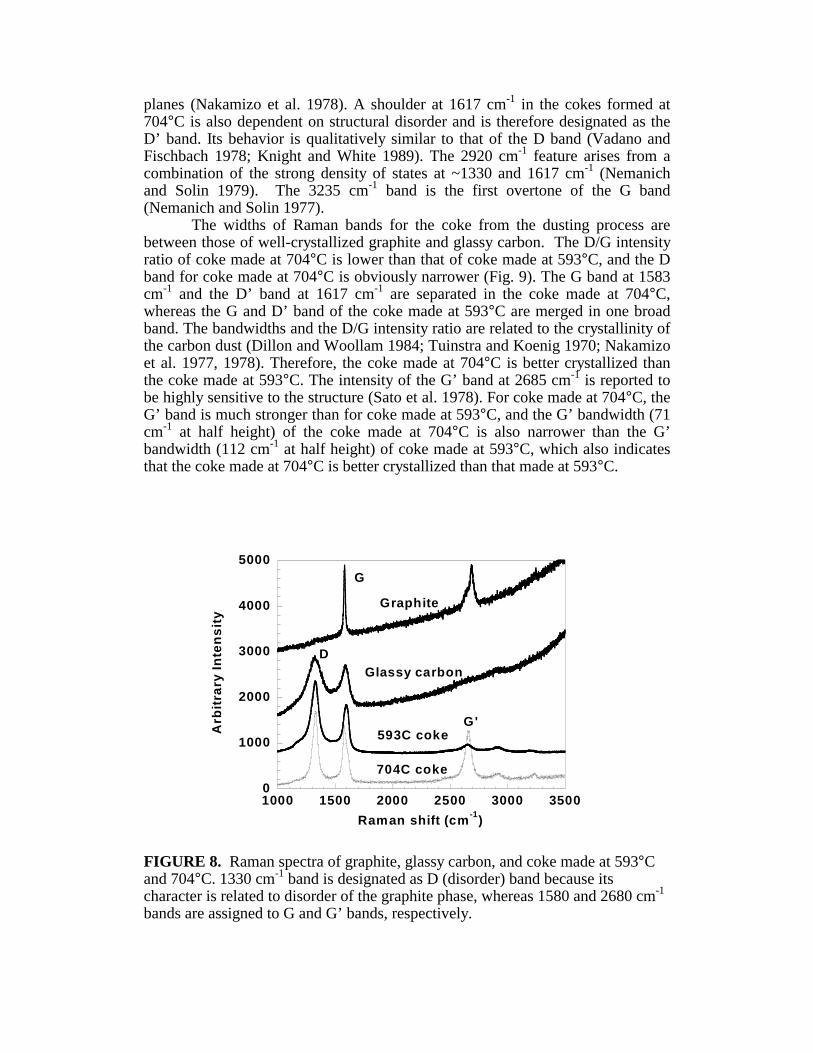
planes (Nakamizo et al. 1978). A shoulder at 1617 cm-1 in the cokes formed at 704°C is also dependent on structural disorder and is therefore designated as the D’ band. Its behavior is qualitatively similar to that of the D band (Vadano and Fischbach 1978; Knight and White 1989). The 2920 cm-1 feature arises from a combination of the strong density of states at ~1330 and 1617 cm-1 (Nemanich and Solin 1979). The 3235 cm-1 band is the first overtone of the G band (Nemanich and Solin 1977).
The widths of Raman bands for the coke from the dusting process are between those of well-crystallized graphite and glassy carbon. The D/G intensity ratio of coke made at 704°C is lower than that of coke made at 593°C, and the D band for coke made at 704°C is obviously narrower (Fig. 9). The G band at 1583 cm-1 and the D’ band at 1617 cm-1 are separated in the coke made at 704°C, whereas the G and D’ band of the coke made at 593°C are merged in one broad band. The bandwidths and the D/G intensity ratio are related to the crystallinity of the carbon dust (Dillon and Woollam 1984; Tuinstra and Koenig 1970; Nakamizo et al. 1977, 1978). Therefore, the coke made at 704°C is better crystallized than the coke made at 593°C. The intensity of the G’ band at 2685 cm-1 is reported to be highly sensitive to the structure (Sato et al. 1978). For coke made at 704°C, the G’ band is much stronger than for coke made at 593°C, and the G’ bandwidth (71 cm-1 at half height) of the coke made at 704°C is also narrower than the G’ bandwidth (112 cm-1 at half height) of coke made at 593°C, which also indicates that the coke made at 704°C is better crystallized than that made at 593°C.
0
1000
2000
3000
4000
5000
1000 1500 2000 2500 3000 3500
Arb
itrar
y In
tens
ity
Raman shift (cm-1)
Graphite
Glassy carbon
593C coke
704C coke
D
G
G'
FIGURE 8. Raman spectra of graphite, glassy carbon, and coke made at 593°C and 704°C. 1330 cm-1 band is designated as D (disorder) band because its character is related to disorder of the graphite phase, whereas 1580 and 2680 cm-1 bands are assigned to G and G’ bands, respectively.

0
500
1000
1500
2000
2500
3000
1000 1200 1400 1600 1800 2000
Arb
itrar
y In
tens
ity
Raman shift ( cm-1 )
704C
593C
D
G
D'
FIGURE 9. Raman spectra of coke made at 593°C and 704°C. Raman bandwidth for coke made at 704°C is narrower than that for coke made at 593°C. D/G intensity ratio for coke made at 593°C is 1.5, whereas that for coke made at 593°C is only 1.1.
1000
2000
3000
4000
5000
6000
7000
1150 1200 1250 1300 1350 1400 1450
Arb
itrar
y In
tens
ity
Raman shift (cm-1)
Coke
Carbon on sample surface
Carbon in sample
FIGURE 10. Raman spectra of coke, carbon on alloy sample surface, and
carbon in sample defects. As mentioned, there is a closely adhering layer of carbon on the surface of
the alloys. The Raman spectra in Fig. 10 show that the Raman band for the carbon on the surface of the iron is narrower than that for coke at some distance from the

surface. This may indicate that carbon in the tightly adhering layer of the iron surface has better crystallinity.
Figure 11 is a cross section of the Fe-Al alloy layer after a metal dusting experiment. Carbon has diffused and precipitated inside the alloy. Energy dispersive X-ray analysis reveals that the dark areas are filled with carbon. Raman spectra were obtained by spotting the laser on the carbon deposits in the Fe-Al coating layer. Figure 8 shows that the line width of the Raman band for the carbon in the alloy is narrower than that for the coke and the surface carbon. The band position is shifted to a slightly higher frequency (10 cm-1) for the carbon in iron. Therefore, crystallinity of the carbon increases progressively from coke through surface carbon to carbon in the metal after metal dusting.
FIGURE 11. SEM cross section of Fe-Al alloy after metal dusting
experiment at 593°C. Carbon has diffused into and precipitated within the alloy. EDX analysis indicates that dark areas are filled with carbon.
Experimental results from the Raman, XRD, and SEM measurements shed
some light on the mechanism of metal dusting. There appears to be a relationship between metal dusting and the degree of crystallization of the carbon dust.
Our interpretation of the crystallizing process for carbon during dusting is shown in Fig. 12. In the initial stage, single carbon atoms are deposited on the surface of the iron; they then either dissolve in the iron or accumulate to form small carbon particles. There are dangling bonds on the particle surfaces as well as many defects such as vacancies and distorted bonds in the particles. All of these surface and internal defects cause an increase in the free energy of these particles compared to the free energy of well-crystallized graphite. At higher temperature, where the carbon atoms have enough energy to migrate, the carbon recrystallizes from small distorted particles to large well-crystallized graphite. However, because the C-C bond is very strong (the melting temperature of carbon is

4492°C), the recrystallization process requires a higher temperature. Therefore, achieving good crystallinity below 1000°C is difficult for two : first, carbon layers in the graphite structure are easily disoriented because the van der Waals forces between the layers are very weak, and second, recrystallization below 1000°C is difficult because the bond in the layers is too strong.
Carbon atoms accumulate on iron surface
Carbon atoms dissolve into iron
Poorly crystallized coke
Small carbon particles
Catalytic crystallization of carbon on other side of cementite particles
Carbon with better crystallinity
Form cementite
Carbon diffuses through cementite
Single carbon atoms deposit on iron surface
FIGURE 12. Proposed process for carbon crystallization after deposition from carburizing gas.
The rate of carbon recrystallization could be dramatically increased by the catalysts of iron or cementite. The cementite structure has been described as a framework of almost close-packed iron atoms held together by metallic bonding to the small carbon atoms in the largest interstices. Because carbon occupies only one-sixth of the interstices, it can dissolve in and move though those interstices. When carbon dissolves in the iron or cementite, the Fe-C bond is much weaker than the C-C bond, and transportation of carbon atoms is greatly facilitated. Therefore, the poorly crystallized coke can transfer though iron and eventually achieve improved crystallinity. The carbon free energy is then reduced by reducing the number of dangling bonds on the surface and the number of internal defects in the carbon particles.
Figure 13 shows the catalytic recrystallization process. Carbon atoms are deposited on the surface of Fe3C. As mentioned above, the carbon layers in the

graphite structure are easily disoriented because the van der Waals forces between the layers are weak. Carbon cannot grow with good crystallinity if the lattice planes of Fe3C do not match the graphite lattice planes to help the crystallization of carbon (up position of Fig. 13). However, when carbon atoms diffuse through the cementite and precipitate from a favorable lattice plane, the lattice of cementite provides an excellent orientation for the epitaxial growth of graphite. Graphite was reported to grow perpendicular to the lattice plane of Fe3C with its layer plane (Chun et al. 1999). Cementite has an orthorhombic lattice with cell parameters a = 5.091, b = 6.743, c = 4.526 Å; its b axis is almost the same as the c axis of graphite (6.724 Å). This is helpful for the crystallization of graphite. Such a catalytic crystallization process causes the coke produced from metal dusting to have a much larger crystallite size and a smaller interlayer plane distance than those carbons made by other methods at a similar temperature (Franklin 1951; Blayden et al. 1940; Schaeffer et al. 1953).
••
•
•
•
•
•
•
•
•
••
•
•
•
•
••
•
•
•
•
••
•
•
•
••
•
•
•
•
••
•
•
•
•
•• •
•
• •
•
•
•••••
••••••
••••••
••••••
•
c
b
Fe3Clattice
Carburizing Gas
Carbon diffusion
Fe atomC atom
Poorly crystallizedcoke layer
Well-crystallizedgraphite
••
••
••
• ••
••
••
•••
••••
FIGURE 13. Poorly crystallized carbon dissolves in and diffuses through cementite, whose lattice provides excellent orientation for crystallization of graphite; b dimension of cementite (6.743 Å) is very close to c dimension of graphite (6.724 Å).
The catalytic crystallization effect by iron was proven by Nakamizo et al
(Nakamizo et al. 1974; Kammereck et al. 1974). They investigated the effect of iron on the crystallization of glassy carbon made from furfuryl alcohol. Addition of only 3% iron led to a dramatic decrease in the widths of the D and G bands and the D/G intensity ratio. The line widths of carbon with iron annealed at 600°C were narrower than those of the carbon without iron annealed at 2000°C (Nakamizo et al. 1974). X-ray diffraction showed that addition of iron narrows the graphite [002] peak dramatically (Kammereck et al. 1974). These experiments

show that the crystallization rate of carbon is dramatically increased by iron or cementite catalysts. In our proposed catalytic crystallization process, carbon dissolves on the surface of the iron and crystallizes out in the bulk iron. Because the free energy of coke is probably higher than that of well-crystallized graphite, the saturating concentrations for coke and graphite will be different. High free energy coke should have a slightly higher saturating concentration than that of graphite (aC = 1); then the saturating concentration of coke will be oversaturating for graphite. Therefore, poorly crystalline coke could dissolve in iron or cementite and crystallize out as well-crystallized graphite. In this process, carbon transfers from the cementite surface and grows inward via the defects or grain boundary of cementite or iron. The accumulation of carbon in alloy causes the metal particles to disintegrate, as seen in Figs. 2a and 11. Fig. 14 shows how cementite particles separate into small particles as carbon particles accumulate at the defects. Such a transport process will continue until the cementite particles become too small to provide a template for carbon growth to 10nm-size crystals (Table 2). The metal finally become nanometer-size dust in this process. X-ray diffraction shows that the average size of the cementite particles in the coke is only 27 nm.
Our proposed metal dusting mechanism of iron can be described as follows: 1. Carbon deposit on iron surface and supersaturates the iron. 2. Cementite forms at the surface of the iron, and the volume expansion creates
defects. 3. Carbon diffuses through the cementite and precipitates at cementite defects. 4. Accumulation of carbon at cementite defects causes the cementite particles to
separate into small particles and move away from the metal. 5. Gas penetrates into cracks in the metal and continues further carbon
deposition and metal dusting. At high temperature, cementite decomposes quickly (Chun et al. 1999).
Iron may work directly as a catalyst to help the crystallization of carbon because the iron lattice can also provide a good orientation for the growth of graphite. Carbon diffuses through the iron and precipitates at the defects, which also cause iron particles to separate.
Cementite is a phase that forms when carbon diffuses into iron. However, in our mechanism, the decomposition of cementite is not a necessary condition to initiate the metal dusting. In the metal dusting process, cementite works as a solvent and catalyst for the diffusion and crystallization of carbon. XRD shows that cementite and carbon are the major phases in the products of metal dusting, whereas according to Hochman’s mechanism, the final product should be iron and carbon.
The effect of carbon on the metal dusting of iron is the focus of Hochman’s mechanism. In our proposed mechanism, however, iron plays a major role in the crystallization of carbon, and the metal dusting phenomenon is only a by-product of the catalytic crystallization process.

CO+H2
Fe3C
Fe
Fe
C
C
FIGURE 14. Process of cementite particle separation by the accumulation of carbon particles in defects. First step: carbon is deposited on the surface of iron. Second step: carbon dissolves the iron and forms cementite, creating many defects as the volume increases ~10% when cementite forms. Third step: carbon diffuses though cementite and precipitates at the defects; the accumulation of carbon at the defects causes the cementite particles separate. Fourth step: gas penetrates into cracked areas and deposits carbon. More cementite forms, and the metal dusting corrosion proceed further.
As mentioned above, carbon crystallinity increases from coke to surface
carbon to carbon inside the alloy after metal dusting. This phenomenon can be explained if we assume that there are two types of carbon in the carbon deposition and metal dusting process. According to Fig. 12, the carbon that participates during the metal dusting process will have better crystallinity. This carbon should have already diffused through the metal, whereas the carbon that is not involved in the catalytic crystallization is poorly crystallized and does not diffuse into the metals. Carbon inside the alloy (Fig. 11) may have already diffused through the iron and participated in the metal dusting process; at that point, it should be well crystallized, while the coke and surface carbon may contain carbon entities that accumulated on the iron surface without participating in metal dusting. The average size of cementite particles in the coke is only 27 nm; these particles may function as a catalyst for carbon deposition, but some may be too small to help the carbon grow to large crystals. Carbon deposited on these small cementite particles may not crystallize well and thus will remain small and have little growth. Coke at some distance from the metal surface is more likely to contain such poorly crystalline carbon. Therefore, the crystallinity of this coke is the poorest of all the carbon that formed during metal dusting.

CONCLUSIONS
Information on crystallinity of coke formed by metal dusting can be derived from the line width and the D/G intensity ratio in the Raman spectra of dust residues. Raman and XRD experiments show that coke deposited at high temperature has better crystallinity than that deposited at low temperature, while the metal dusting rate is lower at 704°C than that at 593°C. Crystallinity of the participating carbon that diffuses into the iron is better than that of the non-participating carbon far away from the iron surface. These results could be explained if the mechanism for metal dusting in iron is considered to be a process of catalytic crystallization of carbon with participation by iron. The difference in the free energies of poorly crystallized coke and well-crystallized graphite causes a driving force for recrystallization of coke. However, this process cannot occur at low temperature because the C-C bonds are too strong to allow movement of carbon atoms. Cementite and iron help the crystallization process, and their particles are moved in the process of carbon transportation that leads to metal dusting. Although the driving force is very small, it results in severe corrosion in the long term. It is not necessary to invoke the decomposition of cemenitite in this metal dusting mechanism.
ACKNOWLEDGMENTS
This work is supported by the U.S. Department of Energy, Office of Industrial Technologies, under Contract W-31-109-Eng-38. Special thanks to D. L. Rink for his assistance in conducting the metal dusting experiments.
REFERENCES
Al-Jishi R., 1982, “Lattice-dynamical Model for Graphite,” Phys. Rev. B,
26: 4514-4522. Blayden H. E., H. L. Riley, and A. Taylor, 1940, “Crystallite Growth During
Carbonization,” J. Am. Chem. Soc., 62:180-186. Chun C. M., T. A. Ramanarayannan, and J. D. Murnford, 1999, “Relationship
between Coking and Metal Dusting,” Materials And Corrosion, 50:634- 639.
Dillon R. O. and J. A. Woollam, 1984, “Use Raman Scattering to Investigate Disorder and Crystallite Formation in as-deposited and Annealed Carbon Film,” Physical Review B, 29:3482-3489.
Franklin R. E., 1951, “The Structure of Graphite Carbons,” Acta Cryst., 4: 253- 261.
Grabke H. J., 1998, “Thermodynamics, Mechanisms and Kinetics of Metal Dusting,” Materials and Corrosion, 49:303-308.
Hochman R. F., 1977, “ Catastrophic Deterioration of High Temperature Alloys in Carbonaceous Atmospheres,” pp. 715-732 in Proc. Symp. on Properties of High-Temperature Alloys with Emphasis on Environmental Effects, Z. A. Foroulis and F. S. Pettit, eds. (The Electrochemical Society, 1977).
Kammereck R., M. Nakamizo, and P. L. Walker, 1974, “Stucture and Properties of Iron Containing Glassy Carbons,” Carbon, 12, 281-289.
Knight D. S., and W. B. White, 1989, “ Characterization of Diamond Films by

Raman Spectroscopy,” J. Mater. Res., 4:385-393. Krebs H., 1968, Fundamentals of Inorganic Crystal Chemistry, McGraw-Hill,
p. 150. Lide D. R., 1999, CRC Handbook of Chemistry and Physics, (CRC Press), P12-
119 to P12-123 Nakamizo M., R. Kammereck, and P. L. Walker, 1974, “Laser Raman Studies on
Carbons,” Carbon, 12:259-267. Nakamizo M., H. Honda, M. Inagaki, and Y. Hishiyama, 1977, “Raman Spectra,
Effective Debye Parameter and Magnetoresistance of Graphitized Cokes,” Carbon, 15:295-298. Nakamizo M., H. Honda, and M. Inagaki, 1978, “Raman Spectra of Ground
Natural Graphite,” Carbon, 16:281-283. Nemanich R. J. and S. A. Solin, 1977, “Observation of an Anomalously Sharp
Feature in the 2nd Order Raman Spectrum of Graphite,” Solid State Comm. 23:417-419. Nemanich R. J. and S. A. Solin, 1979, “First-and Second-order Raman Scaterring from Finite-size Crystals of Graphite,” Phys. Rev. B, 20:392-401. Pippel E., J. Woltersdorf, H.J. Grabke, and S. Strauss, 1995, “Microprocesses of Metal Dusting on Iron,” Steel Research, 66: 217-221. Sato Y., M. Kamo, and N. Setaka, 1978, “Raman Spectra of Carbons at 2600- 3300 cm-1 Region,” Carbon, 16:279-280. Schaeffer W. D., W. R. Smith, and M. H. Polley, 1953, Ind. Eng. Chem., 45, 1721 Tuinstra F. and J. L. Koenig, 1970, “Raman Spectrum of Graphite,” J. Chem. Phy. 53:1126-1130. Vidano R. and D. B. Fischbach, 1978, “New Lines in the Raman Spectra of Carbons and Graphite,” J. Amer. Ceram. Soc. 61:13-17.