Embed Size (px)
Citation preview

This document is the unedited author's version of a Submitted Work that was subsequently accepted for publication in
Sadhana after peer review. To access the final edited and published work see Sadhana 39(Part 3), 2014,
http://doi.org/10.1007/s12046-014-0248-3. Study of liquid fuel transport in a small carburetted engine in the context of cold-start HC
emission control
Sumit Tewari, Anand T.N.C., Nishikant M. P. and Ravikrishna R. V.
Department of Mechanical Engineering,
Indian Institute of Science, Bangalore 560 012, India
Email: [email protected]
ABSTRACT
In the present study, a detailed visualization of the transport of fuel film has been performed in a
small carburetted engine with a transparent manifold at the exit of the carburettor. The presence of
fuel film is observed significantly on the lower half of the manifold at idling, while at load
conditions, the film is found to be distributed all throughout the manifold walls. Quantitative
measurement of the fuel film in a specially-designed manifold of square cross section has also been
performed using the planar laser-induced fluorescence (PLIF) technique. The measured fuel film
thickness is observed to be of the order of 1 mm at idling, and in the range of 0.1 to 0.4 mm over
the range of load and speed studied. These engine studies are complemented by experiments
conducted in a carburettor rig to study the state of the fuel exiting the carburettor. Laser-based
Particle/Droplet Image Analysis (PDIA) technique is used to identify fuel droplets and ligaments
and estimate droplet diameters. At a throttle position corresponding to idling, the fuel exiting the
carburettor is found to consist of very fine droplets of size less than 15 μm and large fuel ligaments
associated with length scales of the order of 500 μm and higher. For a constant pressure difference
across the carburettor, the fuel consists of droplets with an SMD of the order of 30 μm. Also, the
effect of liquid fuel film on the cold start HC emissions is studied. Based on the understanding
obtained from these studies, strategies such as manifold heating and varying carburettor main jet
nozzle diameter are implemented. These are observed to reduce emissions under both idling and
varying load conditions.
This document is the unedited author's version of a Submitted Work that was subsequently accepted for publication in
Sadhana after peer review. To access the final edited and published work see Sadhana 39(Part 3), 2014,
http://doi.org/10.1007/s12046-014-0248-3. Keywords: Carburettor, small engines, Cold-start HC emissions, Fuel film visualization, PLIF,
PDIA, Droplet sizing, Backlit Visualization.
1. INTRODUCTION
There is a renewed interest in small carburetted engines both from the point of view of Small off-
road engines (SORE) emissions in USA, and extensive use of two-wheelers in Europe and Asian
countries. Particularly in Asian countries where a majority of two-wheelers are powered by engines
of capacity 150 cc or less, carburettors have remained the fuel mixture preparation device of choice
due to their much lower cost, simplicity and relative insensitivity to fuel quality which makes them
ideal for use in a range of conditions. Also, for low power applications such as power tools, and for
small off-road engines such as those in lawn-mowers and snowmobiles, carburettors are an ideal
choice. Hence, there is a pressing need to develop better emission control strategies for carburetted
engines. Often, emission standards are met by exhaust after treatment using catalytic converters.
However, very few studies have focussed on the fuel transport processes in the intake manifold
which has a major effect on mixture preparation and hence emission formation. Some important
studies among these include early studies by Harrington and Bolt [1] who performed a numerical
simulation of an air-bled type carburetted system, and Oya [2] who studied the two-phase flow
through emulsion tubes similar to that in carburettor and has given some empirical equations for the
pressure drop at the confluence of the air and fuel flow for different values of void-fraction
corresponding to different flow regimes. More recently, Li and Collings [3] proposed a semi-
empirical model of fuel transport in the intake manifold and demonstrated its application to
transient conditions. Arias and Shedd [4] developed a one-dimensional model which could predict
the mixture enrichment and pressure drop under pulsating flow conditions. Itano et al. [5] studied
the flow at the exit of three carburettors under steady state conditions and obtained qualitative film
thicknesses by measuring the electric resistance of the fuel film, though droplet sizes were not
This document is the unedited author's version of a Submitted Work that was subsequently accepted for publication in
Sadhana after peer review. To access the final edited and published work see Sadhana 39(Part 3), 2014,
http://doi.org/10.1007/s12046-014-0248-3. measured. Very few studies have been done to understand the state of the fuel exiting the
carburettor. In a work done by Finlay et al. [6], the size of droplets at the exit of the throttle plate of
a carburettor was measured. It was observed that the fuel film formation at the manifold walls
created problems in this measurement. This study also brought out the challenges involved in
droplet sizing due to fuel droplet deposition on the visualization window. The poor transient
response of carburetted engines has been attributed to film formation in previous studies. Tanaka
and Durbin [7] investigated the transient response of a single cylinder SI carbureted engine, and
concluded that part of the fuel which flows in as a liquid film exhibits a first order delay. Hamid
and Walter [8], by taking a similar approach as that of Tanaka and Durbin [7], performed a
numerical study to estimate the amount of the fuel film at different pipe length to diameter ratios
and also to estimate the time delay caused by the fuel film.
Studies in literature have also purported to observe the effect of these liquid fuel films on
HC emissions from carburetted engines. Experiments by Hasson et al. [9] utilised a wall film
separator to remove the film and has reported a reduction in HC emissions when wall films were
removed. Felton et al. [10] compared an electronic fuel injection system with an air-assisted fuel
injection system and observed that while the extent of wall films was very different, the level of
unburned hydrocarbons was similar, thus indicating that it is not necessary that liquid fuel film
deposition is the cause of unburned HC emissions. Salazaar et al. [11] studied a pre-vaporized
fuelling system and a carburetted system. From a statistical point of view, there is no difference in
HC emissions between both fuel systems. Therefore, this suggests that the liquid fuel does not
significantly affect the HC emissions. They also indicated that day-to-day variability is a
significant issue.
To summarize, wall films have been observed to affect HC emissions to a large extent in
some studies, whereas others have not found this to be the case. As mentioned earlier, one study
has attributed changes in HC emissions to day-to-day variability rather than to the film itself. Thus,

This document is the unedited author's version of a Submitted Work that was subsequently accepted for publication in
Sadhana after peer review. To access the final edited and published work see Sadhana 39(Part 3), 2014,
http://doi.org/10.1007/s12046-014-0248-3. it is observed from literature that there are contradictory observations regarding the effect of wall
films on HC emissions. The present work attempts to resolve this ambiguity.
In the present work, a detailed study of liquid fuel film transport inside the inlet manifold of a small
carburetted engine has been done at cold–start conditions. This includes a qualitative visualization
of fuel film transport inside the manifold, a quantitative measurement of fuel film thickness, and a
study of the state of the fuel exiting the carburettor. Experiments have also been conducted to
understand cold start hydrocarbon emissions and their relation with the fuel film observed in the
inlet manifold at cold start conditions. The following sections describe the engine setup, the optical
diagnostic techniques utilised, discussion of the results and conclusions from the study.
2. EXPERIMENTAL SETUP
2.1 Engine with instrumentation
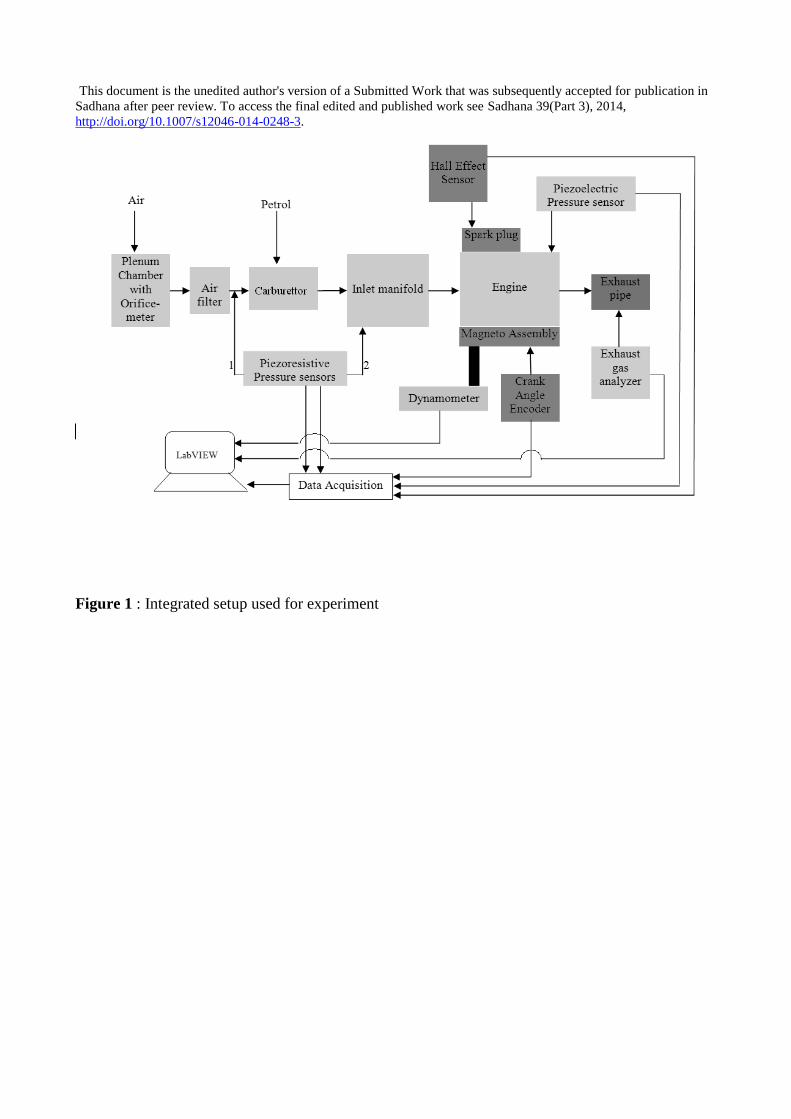
Figure 1 shows the block diagram of the integrated setup utilized for the experiments. The engine
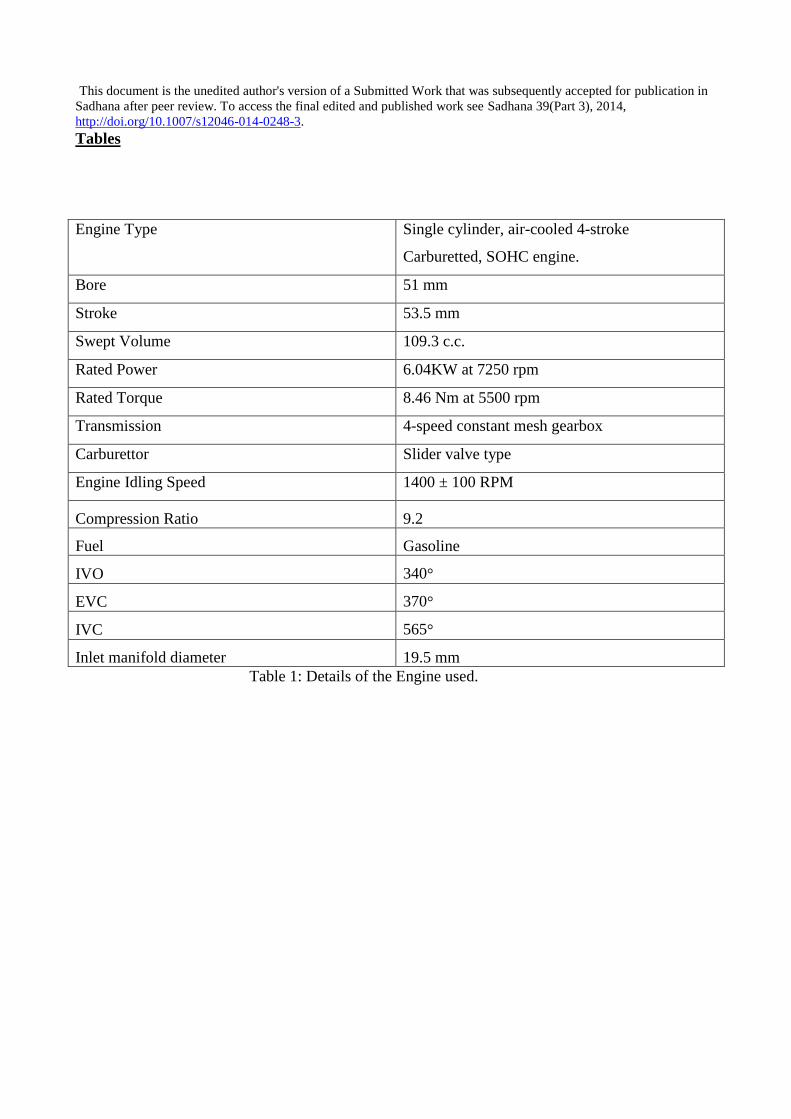
used for experiments is a small 110 cc single-cylinder, four-stroke, carburetted engine whose
specifications are given in Table 1. The inlet system of the engine consists of the air filter, inlet
pipe, carburettor, inlet manifold (diameter = 19.5 mm) and inlet valve. The carburettor used is a
standard slider valve carburettor. The engine is coupled to a water-cooled eddy-current
dynamometer by a universal coupling. The dynamometer is controlled by a controller with a
LabVIEW interface. The measurement sensors incorporated on the setup include a Kistler
piezoelectric in-cylinder pressure sensor, crank angle encoder, piezoresistive absolute pressure
sensors in the manifold, a MRU Delta 1600-L exhaust gas analyser and a Hall-Effect spark timing
sensor. The signals from the pressure sensors, crank angle encoder and spark timing sensor were
acquired using a National Instruments data acquisition system with LabVIEW interface. The
exhaust gas analyser output was connected to computer with the help of a RS 232 port for
This document is the unedited author's version of a Submitted Work that was subsequently accepted for publication in
Sadhana after peer review. To access the final edited and published work see Sadhana 39(Part 3), 2014,
http://doi.org/10.1007/s12046-014-0248-3. continuous measurement.
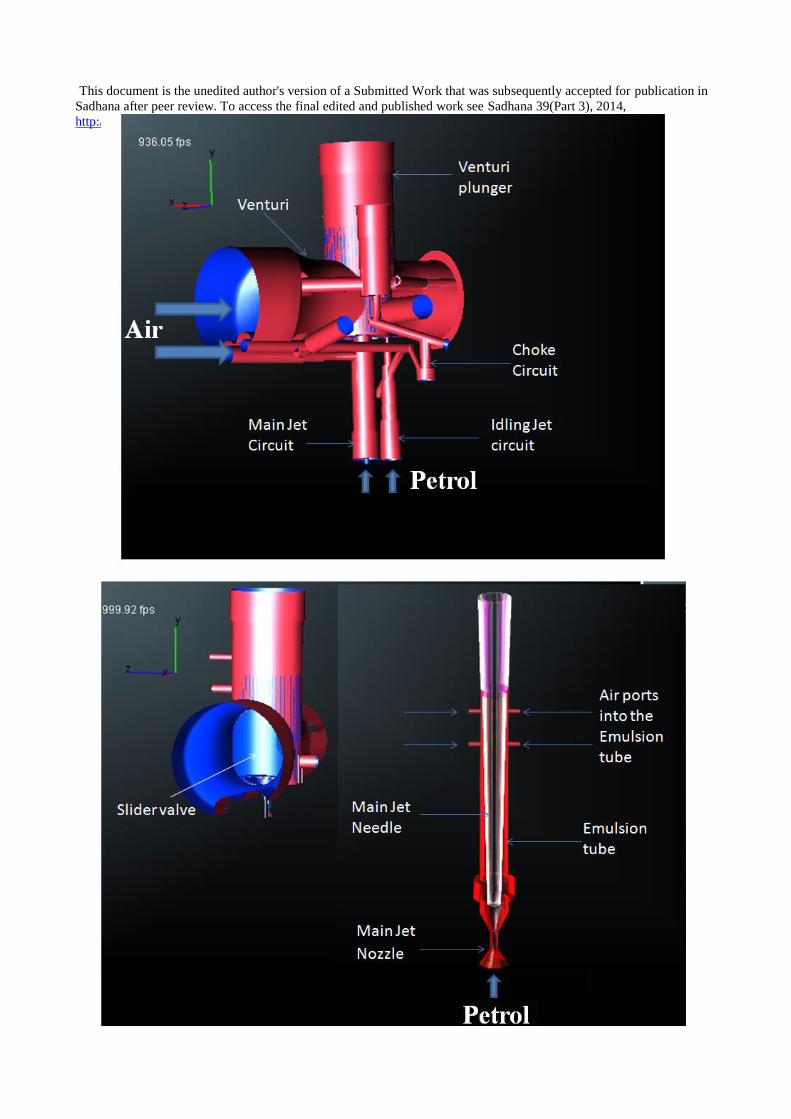
Figure 2 shows a schematic of the carburettor used in the experiments. The first image
shows the three main circuits of a carburettor- Idling jet circuit, main jet circuit and choke circuit.
The figure also shows the flow volumes of the main jet circuit. The flow in the main jet circuit is
regulated by the needle which is attached to the bottom of the slide valve. This tapered main jet
needle moves inside the emulsion tube and varies the cross section available for fluid flow. The
petrol enters the emulsion tube through the main jet nozzle at the bottom which is dipped inside the
petrol sump. The emulsion tube has eight side orifices through which air enters. The idling jet
circuit is similar to the main jet circuit – It has an emulsion tube with the idling jet at the bottom and
air holes on the sides. However, the idling circuit does not have a needle to control the flow of
petrol based on throttle. The air for the main jet and idling jet circuit is bled off just upstream of the
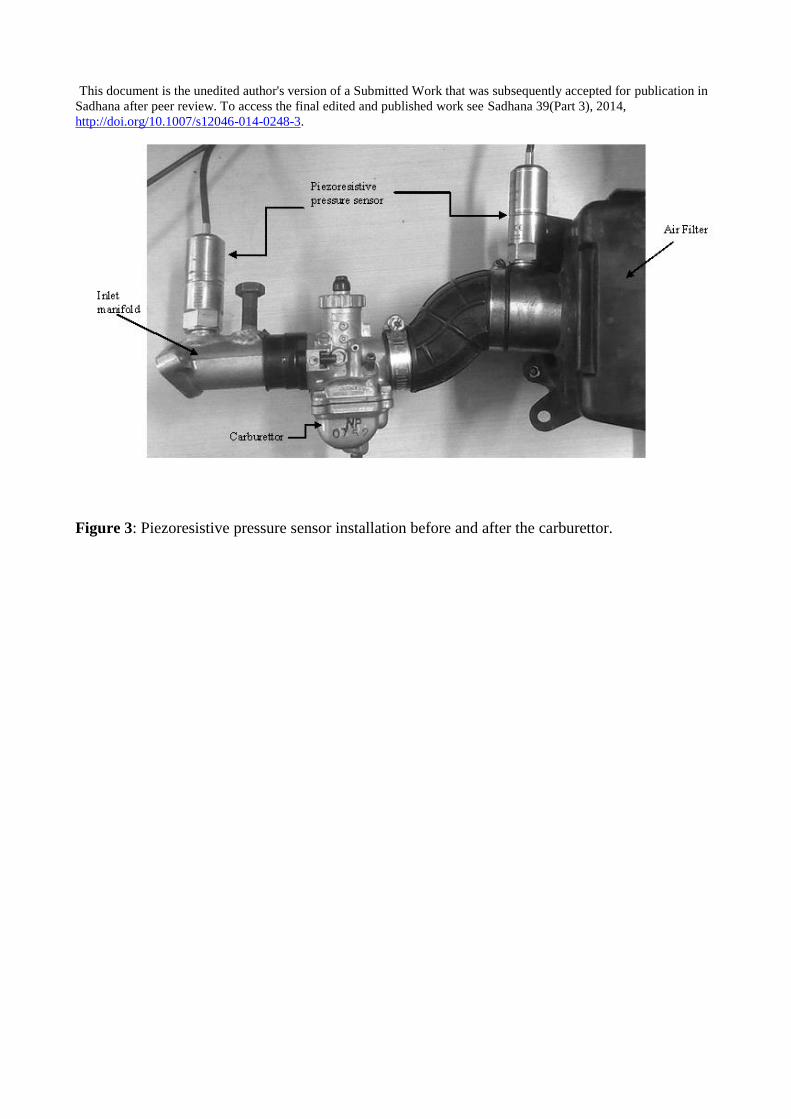
carburettor through two passages which can be seen in the figure. The absolute pressure sensors are
installed before and after the carburettor and used for studying the pressure difference across the
carburettor and also for calibrating the in-cylinder piezoelectric pressure sensor. The carburettor and
piezo-resistive pressure sensors are shown in Fig. 3.
2.2 Optical Diagnostics
To study the transport of the liquid fuel film moving inside the inlet manifold and to study the state
of the charge exiting the carburettor, various visualization experiments were performed in the inlet
manifold, and at the carburettor exit. The techniques and the setups used for these are discussed
below.
2.2.1 Backlit Imaging Setup
Backlit images of the flow in the intake manifold were obtained with backlighting, to study the
fuelling and the flow of liquid film. To obtain optical access, an attempt was made to prepare a
This document is the unedited author's version of a Submitted Work that was subsequently accepted for publication in
Sadhana after peer review. To access the final edited and published work see Sadhana 39(Part 3), 2014,
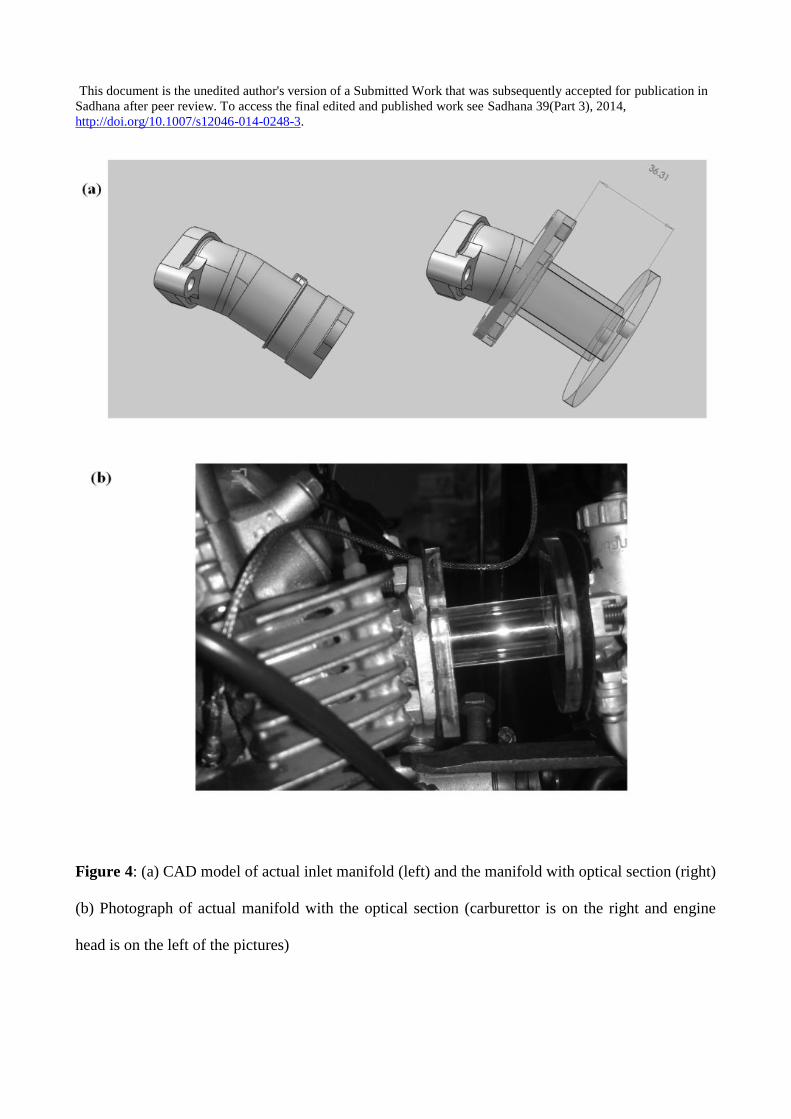
http://doi.org/10.1007/s12046-014-0248-3. transparent manifold while retaining the size and shape of the original manifold. As shown in Fig.
4(a), the geometry of the actual manifold is complex and inclined in two planes, and due to its small
dimensions, it was not possible to fabricate an identical transparent section while maintaining the
desired transparency and optical characteristics as well. Hence, a portion of it, 46 mm in length,
which corresponds to the straight part, was manufactured in quartz and the metal portion retained
for the rest of the other manifold. Figure 4(b) shows a photograph of the actual manifold with
optical section. A Bosch 90W, 12V D.C. incandescent lamp was utilized to provide backlighting in
the optical manifold described. A frosted glass plate was utilised to get a uniform distribution of
light on the back of the manifold, and images were acquired using a Photron 500 frames per second
high speed camera with a Nikon 50 mm focal length lens. For prolonging the cold start condition, a
neoprene high-temperature resistant gasket was used to avoid heat transfer from the engine side.
2.2.2 Planar Laser Induced Fluorescence (PLIF) Setup
For quantitative measurement of the film thickness, an extensive set of experiments was done using
the Planar Laser Induced Fluorescence (PLIF) technique. The experiments were performed under
both idling and load conditions. For fluorescence, Rhodamine 6G dissolved in ethanol was mixed
with petrol in the ratio of 1:10:200 [Rhodamine(g): Ethanol(l):Petrol(l)]. Since it is not possible to
visualize the film in a manifold of circular cross section due to distortion of light, a manifold with
an insert (19.5 mm × 19.5 mm × 30 mm) having a square cross section, was used for these
experiments. Transition inserts were used to change the geometry from a circular to square and
square to circular cross section at the carburettor and engine sides respectively, as shown in Fig. 5.
A continuous diode laser (532 nm) was used in conjunction with a cylindrical lens to form a 1 mm
thin laser sheet. A high-speed Photron camera with a band pass filter of centre wavelength 600 nm,
and a FWHM of 80 nm was used to capture the fluorescence images. The camera was phase-locked
with the engine by means of a controller circuit to enable capture of images at any particular crank

This document is the unedited author's version of a Submitted Work that was subsequently accepted for publication in
Sadhana after peer review. To access the final edited and published work see Sadhana 39(Part 3), 2014,
http://doi.org/10.1007/s12046-014-0248-3. angle. In the present study, phase-locked images of the fluorescence were captured at various crank
angle degrees after TDC and the background image was subtracted from these images. The
thickness measurements were made based on image data, i.e., counting the number of pixels in the
wall-normal direction that are associated with the fluorescence signal After subtracting the
background (which includes the camera noise), the presence of a pixel intensity greater than a
predefined threshold value was taken as an indication of the presence of a film. A calibration target
was imaged prior to the experiment to obtain an accurate estimate of the spatial resolution. At the
given magnification, each pixel represents 100 µm, and hence the resolution is of that order.
Hence, the error in the measurement of film thickness is ±100 µm.
2.2.3 Droplet Sizing using PDIA
Studying the state of the charge exiting the carburettor is a challenge due to the fuel film formed in
the inlet manifold and the circular cross section of the manifold. Hence, for performing droplet
sizing measurements, a setup was prepared where the carburettor exit is kept open to the
atmosphere, while the carburettor inlet, the petrol sump and the fuel surge are all pressurized,
maintaining the pressure difference across the carburettor to the values measured in the running
engine. The pressure measurement at the carburettor inlet was done with a piezoresistive pressure
sensor and for the real time analysis of the pressure a LabVIEW interface is used. A schematic of
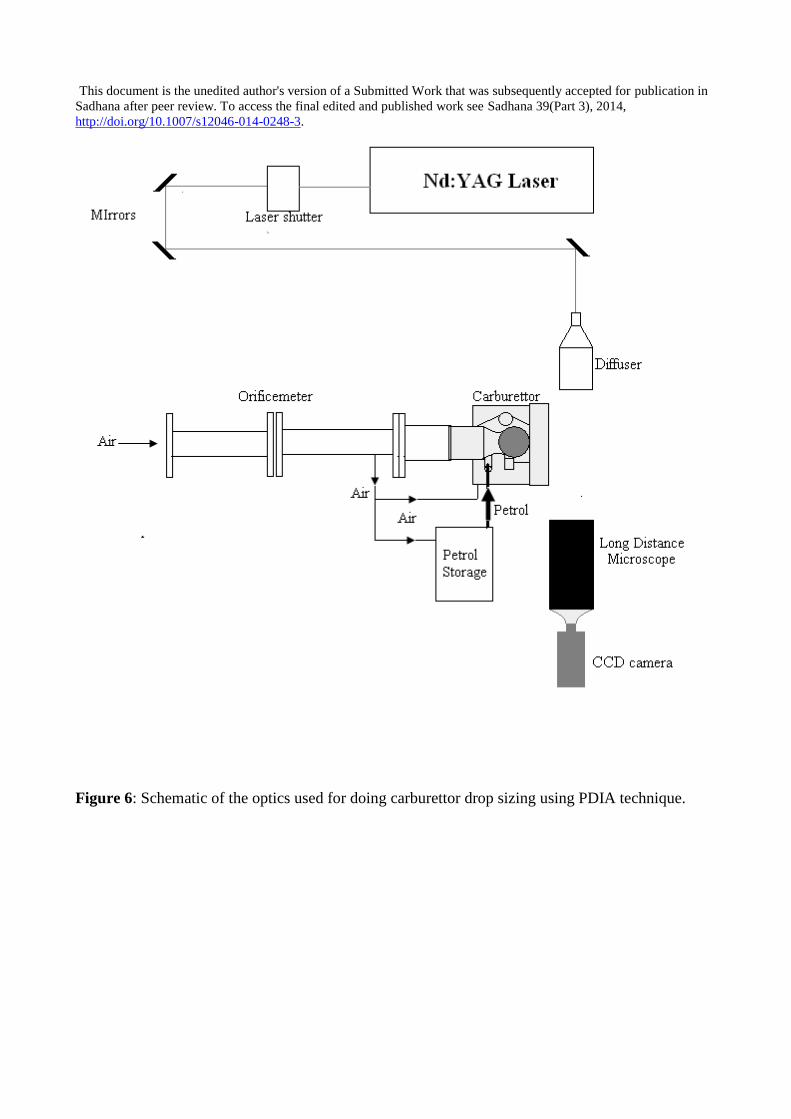
the setup used for the drop sizing is shown in Fig. 6. For drop sizing, the Particle/Droplet Image
Analysis (PDIA) technique is used, where the fuel droplets are illuminated with a frequency-
doubled pulsed Nd:YAG laser beam of wavelength 532 nm in combination with a fluorescent
diffuser. A 12-bit LaVision CCD camera was synchronized with the laser, and used to acquire
images. A long distance microscope was used in conjunction with the camera to zoom in and
measure droplet sizes. The DaVis software was used to acquire images which were processed using
the LaVision Particle Master Shadow module. The software rejects the particles which are out of
This document is the unedited author's version of a Submitted Work that was subsequently accepted for publication in
Sadhana after peer review. To access the final edited and published work see Sadhana 39(Part 3), 2014,
http://doi.org/10.1007/s12046-014-0248-3. focus based on the relative intensity of the particles. Thus, only particles within the depth of focus
are processed and sized.
3. RESULTS AND DISCUSSION
In a single cylinder engine, the behaviour of the flow across the carburettor is highly transient and
shows large variations with crank angle compared to a multi-cylinder engine, where the pressure
across the carburettor remains comparatively steady. As shown in Fig. 7, under idling condition, the
pressure difference (defined here as upstream value minus downstream value) across the carburettor
remains always positive. Under loading conditions, the pressure difference across the carburettor
attains negative values at various times in the cycle, which shows a possibility of back flow across
the carburettor. The data show damped oscillations with a peak at the start of the intake stroke. The
amplitude of the pressure difference across the carburettor (both at positive and negative side)
increases as the speed increases at a fixed throttle position, i.e., as the speed increases, the charge
going inside the engine cylinder increases, but the amount of back flow also increases. Most of the
back flow (due to a negative pressure difference) is recorded around and after the intake valve
closing (IVC), though for high speed cases, a negative pressure difference is also observed at IVO,
in the valve overlap region. As the throttle opening increases, the amplitude of the pressure
difference across the carburettor decreases though the span of negative pressure difference increases
to a small extent.
3.1 Study of fuel film transport
Initially, visualization of the fuel film transport inside the inlet manifold was performed by
backlighting technique. A portion of the manifold is made transparent, and the visualization was
performed at the exit of the carburettor under cold start conditions at idling and three throttle
positions. The film formed from the carburettor end does not evaporate at cold start conditions in

This document is the unedited author's version of a Submitted Work that was subsequently accepted for publication in
Sadhana after peer review. To access the final edited and published work see Sadhana 39(Part 3), 2014,
http://doi.org/10.1007/s12046-014-0248-3. the manifold, and thus a constant presence of film moving towards the engine is observed at the
bottom of the manifold in the case of idling. There is hardly any film which is observed on the
upper half of the manifold for the length of the manifold analysed. The film appears to emerge from
the sides of the slide valve of the carburettor. Due to circular cross-section of the pipe, after a small
distance the fuel film starts converging towards the bottom of the manifold. The thickness of the
film cannot be measured in this experiment, however, due to circular nature of the pipe. As the
throttle is opened, the fuel film which lies at the bottom of the manifold under idling starts to spread
over the sides, followed by recirculation of the fuel film along the sides of the manifold towards the
carburettor. The reason for the recirculation is as follows: at low throttle openings, the air fuel
mixture comes out of the carburettor as a jet from a small opening below the slider valve (throttle
valve). This high speed jet causes a low pressure zone above the jet due to entrainment of air, and
hence causes a recirculation of the fuel film as well as charge towards the carburettor. As the
throttle is opened further, the film gets distributed all throughout the manifold inner walls, rather
than staying just at bottom like in the idling case. Visualization experiments were performed at
different engine speed at three throttle positions. From a qualitative visualization standpoint, the
nature of the fuel transport is similar at all speeds. As the throttle is increased, the fuel film which is
initially found to spread along the side walls at an angle at low throttle is observed to flow
horizontally at high throttle. This is primarily due to the nature of the air flow while the throttle is
being opened.
The results obtained through these visualization studies show a clear picture of fuel film
transport under idling and load conditions, but the results are qualitative. In order to obtain a
quantitative value of the thickness of the fuel film, a separate set of experiments were performed
using the Planar Laser Induced Fluorescence (PLIF) technique. For these experiments, a square
manifold was used with the optical setup as explained earlier. The results of the film thickness
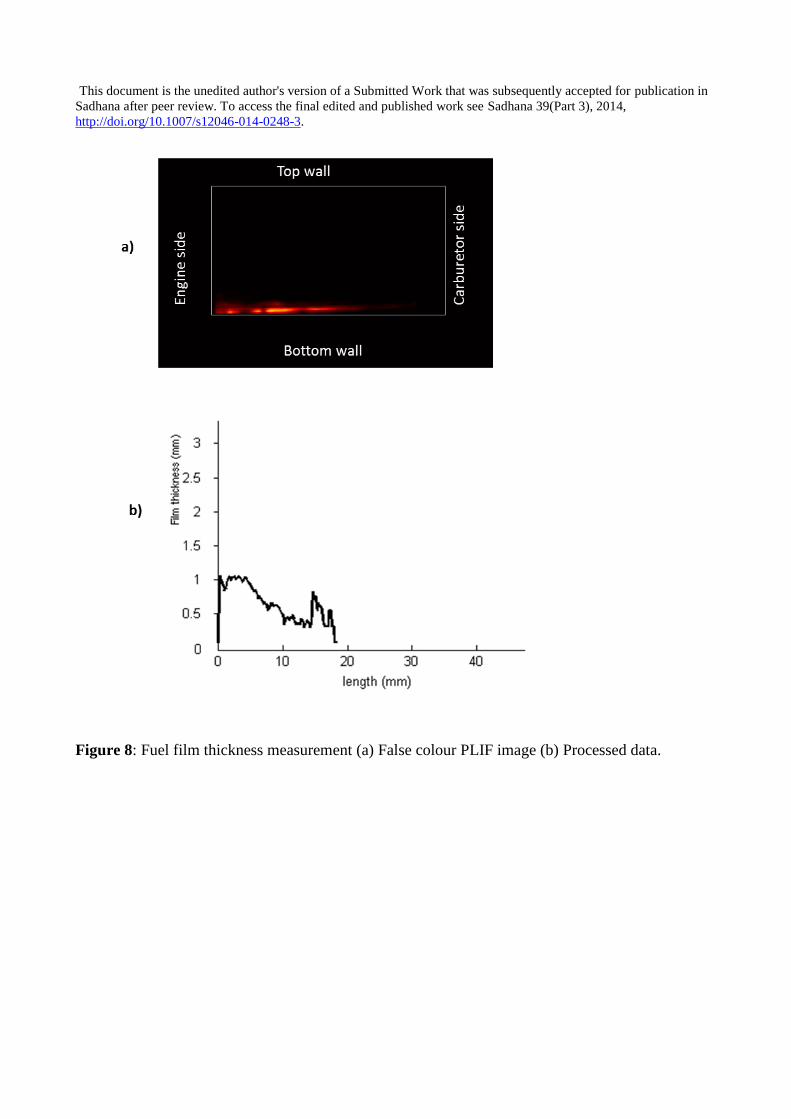
measurement have shown a maximum film thickness under idling of around 1 mm as shown in Fig.
This document is the unedited author's version of a Submitted Work that was subsequently accepted for publication in
Sadhana after peer review. To access the final edited and published work see Sadhana 39(Part 3), 2014,
http://doi.org/10.1007/s12046-014-0248-3. 8. It shows a typical PLIF image captured with a CCD camera provided with a narrow band filter.
The background was subtracted from the images. The presence of fluorescence intensity now
indicates the presence of a film. At every location along the length, the number of pixels in the
direction perpendicular to the wall with intensities greater than a predefined threshold value was
recorded as the film thickness. Similarly, film thickness measurements were also performed at
different load conditions, the results of which are shown in Fig. 9. It is observed that under idling
condition, the film thickness is highest, with films of the order of 1 mm. Then as the engine is
throttled, initially at low speed and low load, the film thickness is very low; of the order of 0.1 mm.
As the throttle is further opened, the film thickness increases to a maximum of 0.4 mm at high
speed high load cases. One possible explanation for this variation could be that as the throttle is
opened at low load and low speed condition (10 to 15% throttle opening), the fuel film present at
the bottom wall under idling condition gets spread throughout the manifold cross section, thus
decreasing the film thickness. As the throttle is further opened for mid and high load cases, the
other main metering circuit starts operating in the carburettor increasing the amount of fuel exiting
the carburettor and consequently, the film thickness increases.
In order to further understand the state of charge exiting the carburettor, droplet sizing was
conducted using the PDIA technique. Due to difficulty in ensuring good optical access with
manifold walls getting wetted with fuel, these tests were performed in a stand-alone carburettor rig
under steady state operation, where good optical access was ensured. Values of pressure difference
across the carburettor under idling as well as load conditions in the engine were maintained across
the carburettor in this steady-state test. The visualization results of the steady state tests for full
throttle, half throttle and idling cases are shown in Fig. 10. In this figure, the visualization of the
carburettor exit flows at steady state with normal and magnified views is obtained using the long
distance microscope. A pressure difference of 0.08 bar across the carburettor was applied at both

This document is the unedited author's version of a Submitted Work that was subsequently accepted for publication in
Sadhana after peer review. To access the final edited and published work see Sadhana 39(Part 3), 2014,
http://doi.org/10.1007/s12046-014-0248-3. full and half load, and 0.55 bar under idling. From Fig. 11, it can be observed that the SMD of the
droplets at full and half throttle is similar, and in the range of 30 μm, with a similar droplet size
distribution. Under steady-state idling conditions, the charge exiting the carburettor is primarily in
two states – a cloud of very small droplets (less than 10 μm) and large droplets or ligaments exiting
out from the bottom surface of the carburettor as shown in the Fig. 10 (c). A transient test was also
performed where the pressure difference across the carburettor was varied. The experimental setup
for the transient pressure test is mostly similar to that for the steady state test of the carburettor. For
the transient test, the pressure upstream of the carburettor was varied using a valve which was
present in the pipe ahead of the carburettor. The flow exits into atmospheric conditions. The
pressure was varied slowly (as compared to variations in an actual engine). The objective of this
experiment was to obtain a qualitative understanding of the effect of an unsteady pressure drop on
the fuel delivery through the carburettor. The value of pressure difference measured across the
carburettor during the idling throttle and full throttle tests is shown in Fig. 12.
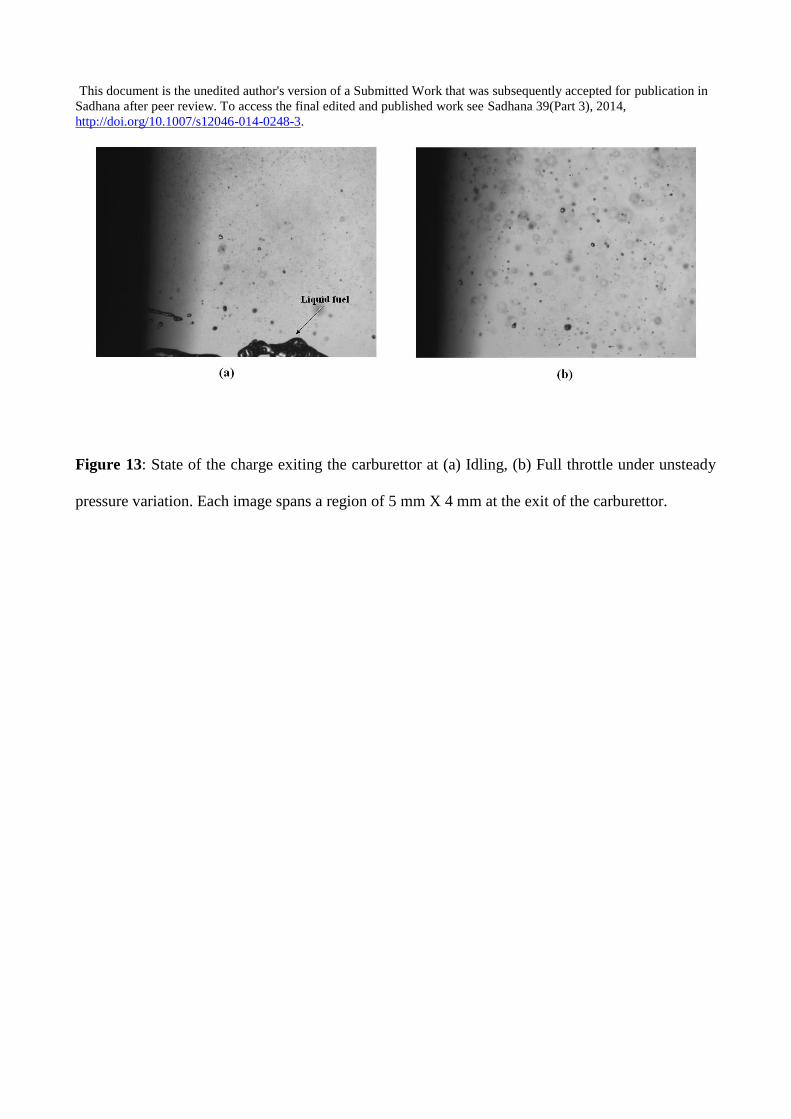
Under unsteady carburettor functioning, however, there are larger droplets also observed at lower
pressure values, as shown in Fig. 13. The droplets sizes under unsteady pressure fluctuation vary
from larger size droplets (at low pressure) to smaller size droplets (at higher pressure) and then
again become large as the pressure reduces. Under idling conditions, some large ligaments of the
fuel are also observed exiting the carburettor, which forms the fuel film. Thus, it can be concluded
from the visualization that under idling, the fuel film observed is possibly forming inside the
carburettor at the edge of the slider valve and comes out in the form of large ligaments of liquid
fuel. Variations in pressure would lead to large droplets and ligaments under unsteady engine
conditions. Under high load conditions, the fuel film is being formed largely because of the fuel
droplets striking the manifold walls. A few ligaments are also found to exit the carburettor under
wide open throttle conditions.
This document is the unedited author's version of a Submitted Work that was subsequently accepted for publication in
Sadhana after peer review. To access the final edited and published work see Sadhana 39(Part 3), 2014,
http://doi.org/10.1007/s12046-014-0248-3.
3.2 Cold-start emission studies
As discussed earlier, there lies an ambiguity on the effect of these fuel films over hydrocarbon
emissions in the literature. There is a need to have a better understanding of the cold start
phenomena. Thus, after studying the nature of the fuel film transport inside the inlet manifold and
its formation by studying the state of the charge exiting the carburettor, the important question of
whether these films have any effect on HC emissions was also studied. For this, cold start idling
emission tests are performed after every 12 hours of soak time, as specified in many test protocols.
For emission testing, a Delta 1600L electro-chemical sensor based exhaust gas analyser with a RS
232 interface is used. In order to make sure that there is no influence of any prior engine runs, the
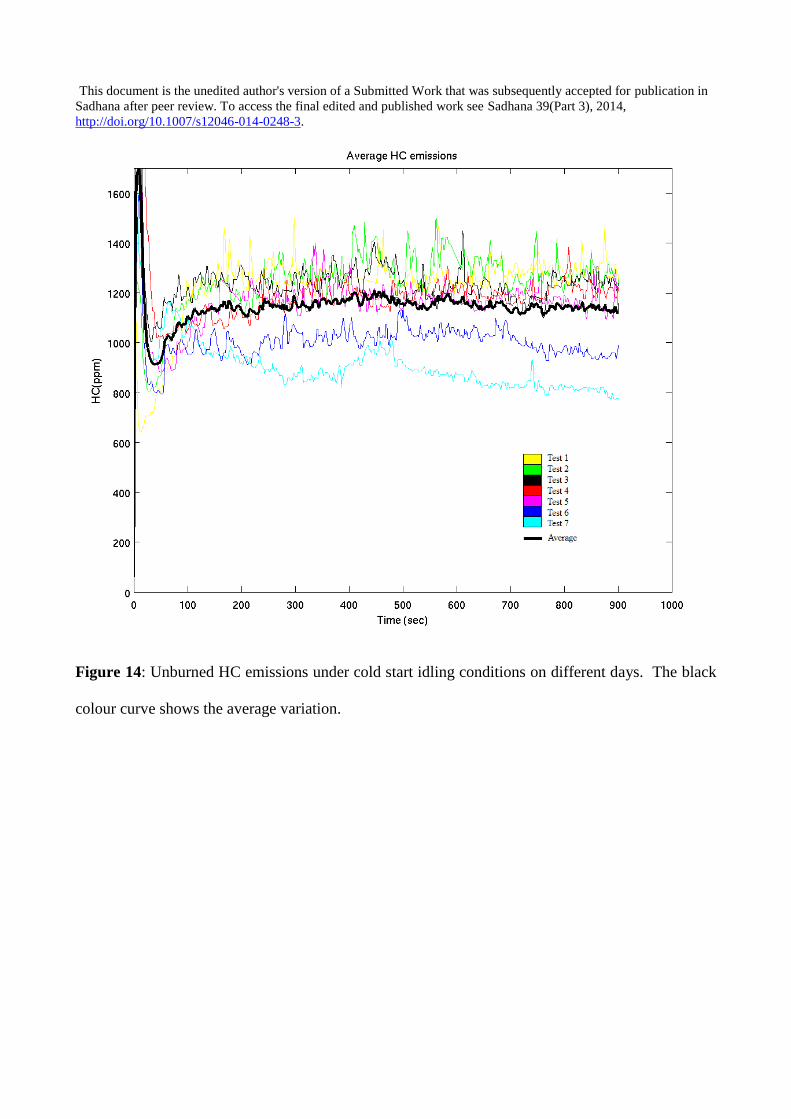
exhaust port is purged before each run. Figure 14 shows a typical HC variation observed in various
tests taken after a soak period of 12 hrs under idling condition. The HC emission curves starts with
a peak (local maxima) followed by a dip (local minima) and it then increases and stabilizes at some
intermediate value. The period at the beginning at which the emission reaches the peak and the local
minima, is around 50 seconds. The peak value at engine startup is observed not only at cold start
conditions, but also under warmed-up conditions. This could be attributed to the transient operation
involved at startup which causes incomplete combustion due to the lower speeds and the
consequent high HC emissions. It can also be concluded that though the emission curves follow the
same trend, they vary largely in magnitude from day-to-day, as also observed by Salazar and
Ghandhi [4]. The day-to-day variation in HC emissions was observed to be in the range of 900-
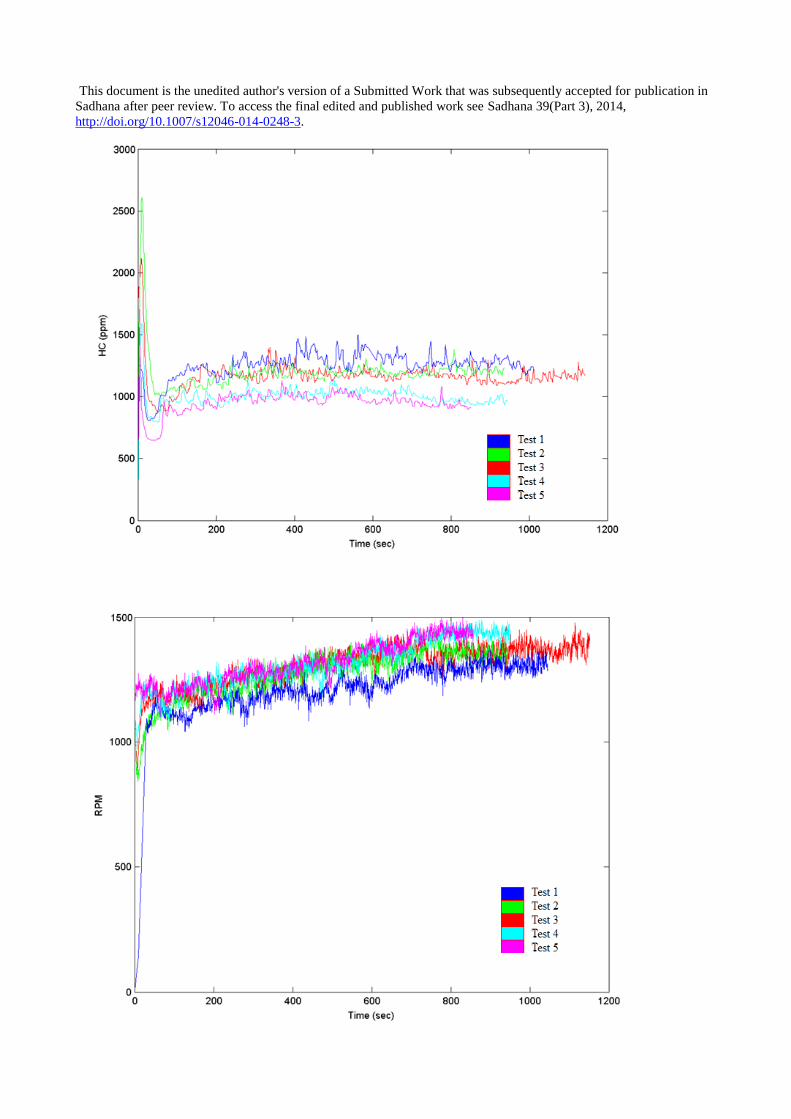
1200 ppm. To understand the reason for this variation, the engine speeds were also recorded and the
correlation is shown in Fig. 15. It is observed that the HC emissions have a strong correlation with
engine speed, varying inversely with engine speed. Also, with day-to-day variation in engine idling
speed, the air-fuel ratio is found to become leaner as the engine speed increases. As the engine
idling speed increases, the amount of air entering the engine increases, which causes the mixture to
This document is the unedited author's version of a Submitted Work that was subsequently accepted for publication in
Sadhana after peer review. To access the final edited and published work see Sadhana 39(Part 3), 2014,
http://doi.org/10.1007/s12046-014-0248-3. become leaner. Due to larger air flow over the fuel film inside the manifold, there may be increased
shearing of the fuel film, which may lead to smaller droplets and hence more efficient combustion.
This could explain the lowering of HC emissions.
A manifold heating strategy was then utilized to vaporize the film and to study its effect on
HC emissions. The manifold was heated with a circumferential heating element from the outside.
The heating was performed for a period of 240 seconds. The location for heating was based on the
fuel film visualization results under idling condition which showed the presence of a large amount
of fuel film near the carburettor end. The engine was started after the manifold reaches certain
preheated temperature. It was observed that there was a large day-to-day variation in the HC
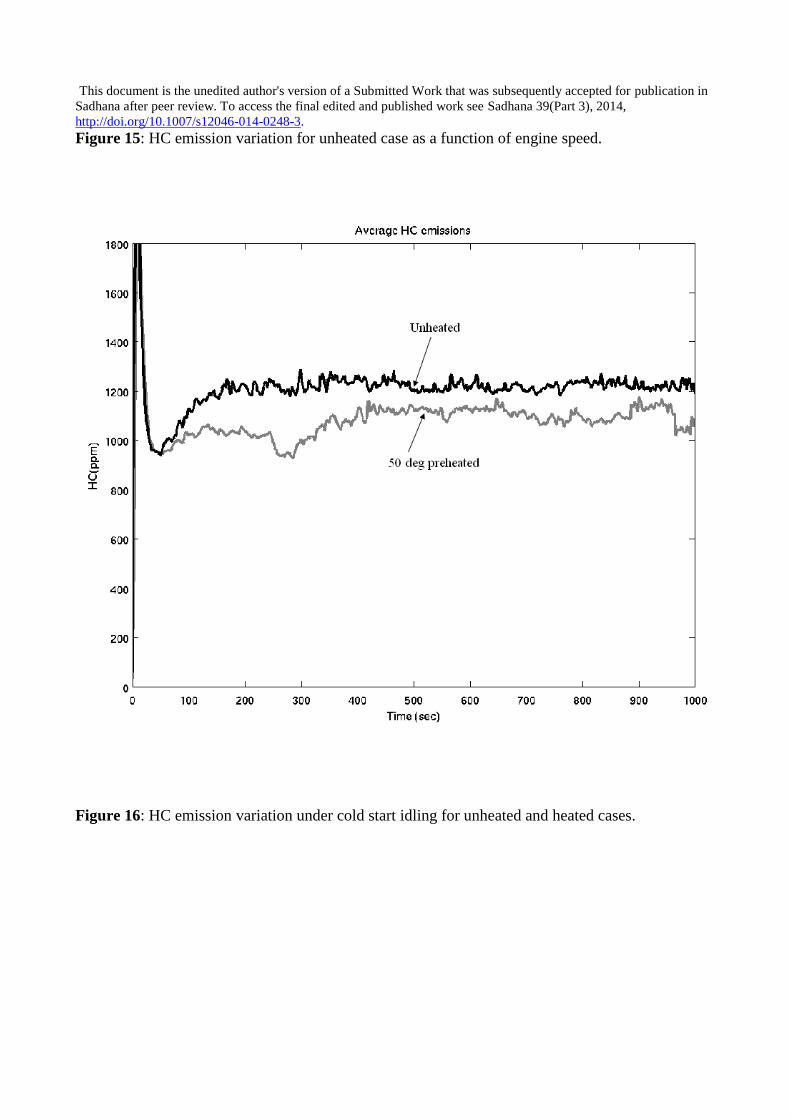
emission data in the heated cases also. Since a strong correlation was observed between the HC
emissions and engine speed, the data for the heated and unheated cases were compared for cases
where the engine speeds were similar, the results of which are shown in Fig. 16. The data shown in
Fig. 16 was obtained by averaging 7 sets of data each of which corresponds to experiments
performed on different days, for the unheated and heated cases. Figure 16 shows that heating the
manifold leads to a consistent reduction in HC emissions. It is also observed from Fig. 16 that for
the preheated case, the HC emission shows a momentary drop when the manifold heating is stopped
at t=240 seconds. Since the manifold is initially heated, wall films are not initially present and any
droplets impinging on the walls evaporate and the vapour reaches the engine. However, when the
heater is switched off, a fuel film starts to form over the manifold walls, which momentarily
reduces the amount of fuel going inside the engine. This causes the mixture entering the engine to
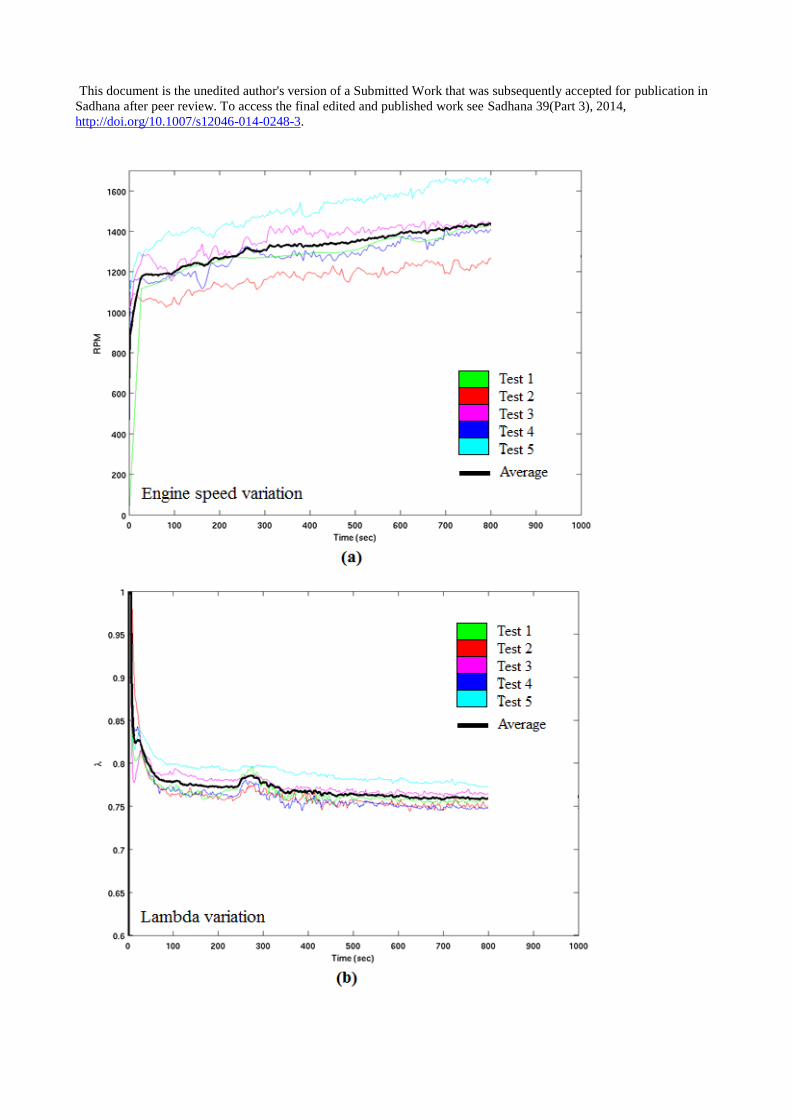
become lean and is reflected as a reduction in HC emissions. Figure 17 gives more insight into the
effect of variation in lambda (λ) of the air-fuel mixture on HC emission. It shows the variation of λ
with engine speed for the 35º C preheated case on different days. At the time the heater is switched
off (after 240 seconds from the starting of the engine), the λ value shows a sudden jump indicating
that the mixture becomes lean, and then settles down after a period of 60-100 seconds. This leads to
This document is the unedited author's version of a Submitted Work that was subsequently accepted for publication in
Sadhana after peer review. To access the final edited and published work see Sadhana 39(Part 3), 2014,
http://doi.org/10.1007/s12046-014-0248-3. a dip in the HC emission as observed earlier in Fig. 16. During this period, there is no significant
change or jump in the engine speed values (Fig. 17(a)), which indicates that the only reason the
mixture is becoming lean is due to a formation of fuel film, i.e., a part of the fuel ends up forming
the film. This is how one of the physical effects concerning fuel transport is affecting the HC
emissions. The second conclusion that can be drawn by comparing the day-to-day engine speed
variation with the corresponding variation in λ values is that as the engine speed increases, the λ
value increases, i.e., the mixture becomes lean. The reason is that the amount of air entering the
engine is increased compared to the amount of fuel. Thus, this further explains why the cold start
idling HC emission has an inverse relationship with the engine idling speed.
For easy starting of the engine at cold conditions, the mixture is currently maintained rich so that
even after fuel film formation, a sufficient quantity of fuel exiting the carburettor reaches the engine
in the intake stroke. The above results show that by vaporizing the fuel present in the form of film
at idling, overall lower fuel consumption and reduced emissions can be achieved. The effect of
manifold heating was studied under loading cases as well. However, the heating strategy did not
show any consistent reduction in emissions under conditions of load. One possible reason for this is
that the amount of fuel in the form of film is small compared to the total amount of fuel entering the
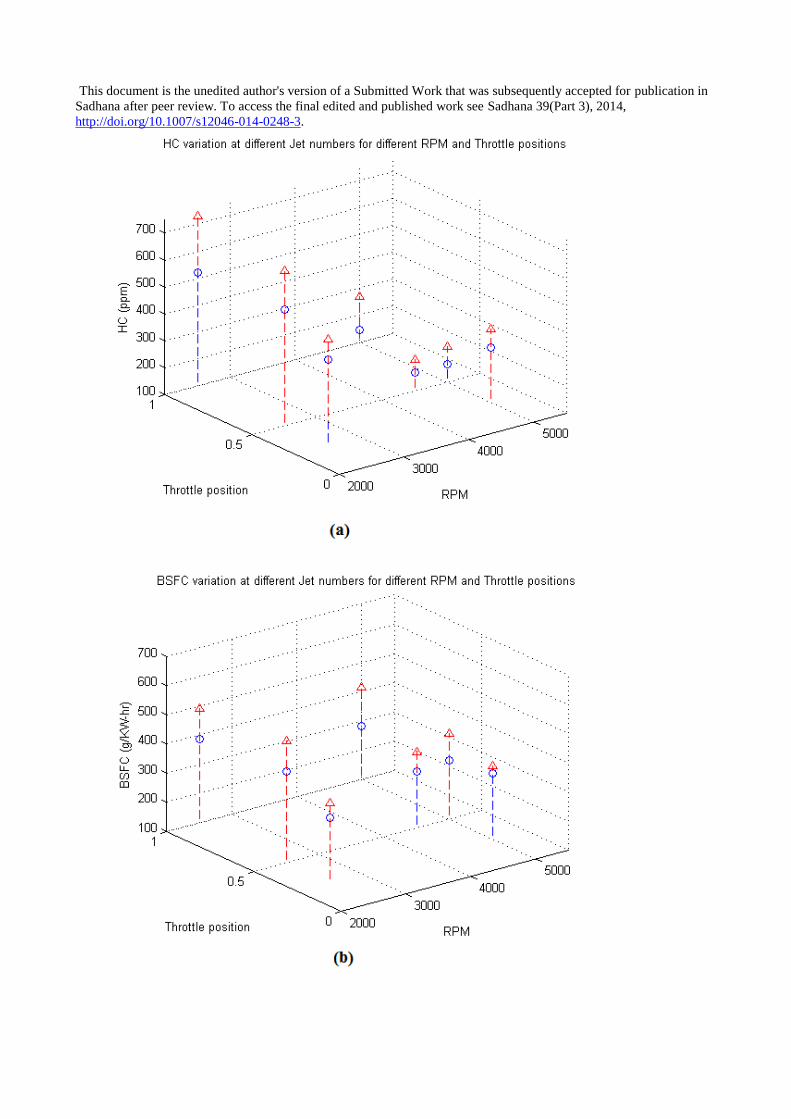
engine. Hence, for the loading case, a different strategy is required. It was decided to evaluate a
strategy involving reducing the main nozzle diameter keeping the carburettor idling circuit intact.
For this, two nozzles were studied, i.e., Jet I with a diameter of 782 μm and Jet II with a diameter of
667 μm. The manifold temperature values remain almost constant (except for full throttle) within a
range of 40-45 °C. The air-cooled engine was cooled using a blower at non-idling conditions. The
HC emissions and BSFC values for the two jets were compared at similar load points. The results
shown in Fig. 18 indicate that by regulating the nozzle diameter, HC emission reduction as well as
improvement in Brake Specific Fuel Consumption (BSFC) is possible. A reduction from 15 to 46%

This document is the unedited author's version of a Submitted Work that was subsequently accepted for publication in
Sadhana after peer review. To access the final edited and published work see Sadhana 39(Part 3), 2014,
http://doi.org/10.1007/s12046-014-0248-3. is observed in cold start HC emissions with 13 to 32% improvement in BSFC values. The other
important finding from the experiment is that the percentage HC emission reduction increases with
the RPM and also with throttle position. Thus, this work shows that for such small carburetted
engines, there is a clear need for regulating the amount of fuel entering the engine under loading as
well as for idling cases.
4 CONCLUSIONS
The present study involves the study of fuel film transport in the intake manifold of a small,
carburetted engine and its effect on HC emissions under cold start conditions. Specifically,
diagnostic techniques such as backlit visualization, PLIF and PDIA are used to qualitatively study
the fuel film dynamics, and quantitatively to measure the fuel film thickness in a transparent section
of the manifold and droplet sizes at the exit of the carburettor. Under cold start idling conditions,
the fuel film is mostly observed at the bottom wall of the manifold. As the carburettor is throttled,
the fuel film gets distributed all throughout the manifold cross-section. PLIF measurements have
shown that under idling conditions, the fuel film thickness measured is of the order of 1 mm. At
low-speed, low-load case, the fuel film spreads throughout the manifold cross section and shows a
minimum thickness of 0.1 mm. As the speed and load is increased, the fuel film thickness increases
to around 0.4 mm. Experiments in a steady-state carburettor rig have shown that under idling, the
fuel exiting the carburettor is mostly in two regimes – a cloud of very small droplets (less than 10
μm in size) and large droplets with ligaments. At half and full throttle loading conditions, the SMD
is in the range of 30 μm. Based on the understanding obtained from these studies, the formation of
HC emissions under cold start is also studied. Detailed cold start emission studies have shown that
the day-to-day variations in HC emissions under cold start idling were due to the variation in engine
speed and have an inverse relation with engine idling speed. A manifold heating strategy has
shown a consistent reduction in HC emissions under idling, however was ineffective under load. A
This document is the unedited author's version of a Submitted Work that was subsequently accepted for publication in
Sadhana after peer review. To access the final edited and published work see Sadhana 39(Part 3), 2014,
http://doi.org/10.1007/s12046-014-0248-3. strategy of reducing the diameter of the inlet nozzle of the main jet of carburettor was observed to
reduce HC emissions and also increase fuel efficiency. Overall, this work shows that a combination
of a manifold heating strategy under cold start conditions along with an electronic carburettor to
control fuel flow under idling and load has the potential to reduce HC emissions and increase fuel
efficiency for small carburetted engines.
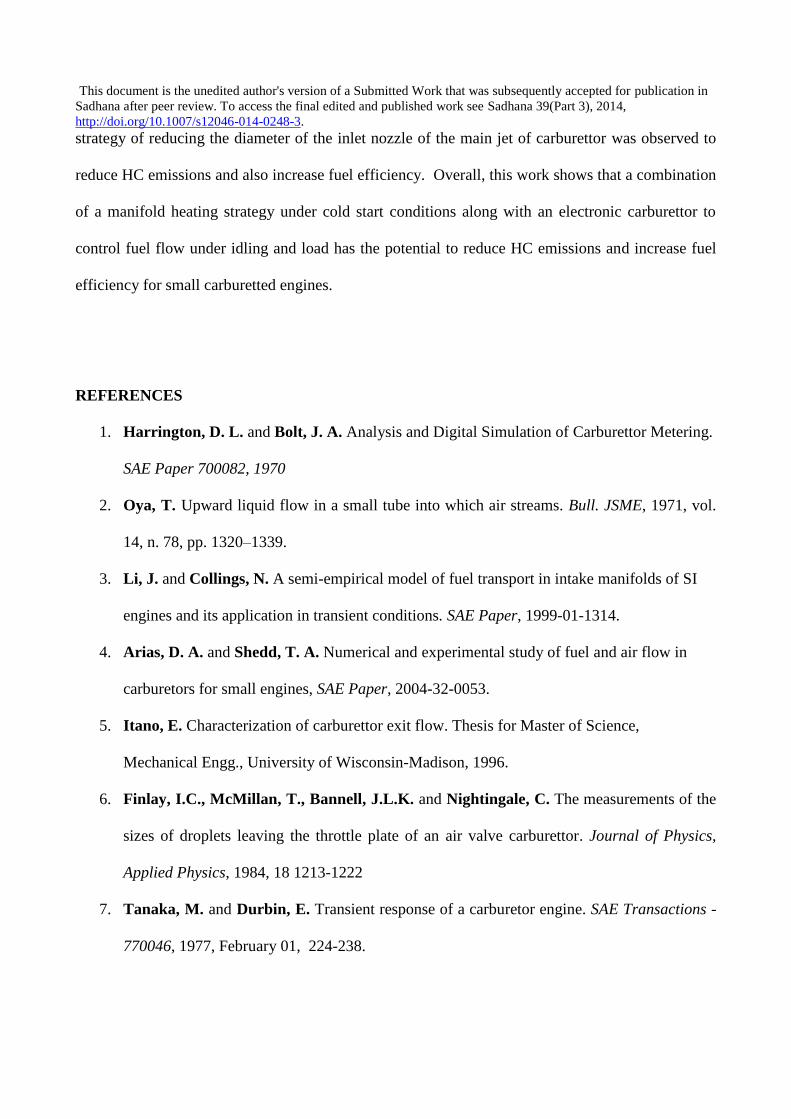
REFERENCES
1. Harrington, D. L. and Bolt, J. A. Analysis and Digital Simulation of Carburettor Metering.
SAE Paper 700082, 1970
2. Oya, T. Upward liquid flow in a small tube into which air streams. Bull. JSME, 1971, vol.
14, n. 78, pp. 1320–1339.
3. Li, J. and Collings, N. A semi-empirical model of fuel transport in intake manifolds of SI
engines and its application in transient conditions. SAE Paper, 1999-01-1314.
4. Arias, D. A. and Shedd, T. A. Numerical and experimental study of fuel and air flow in
carburetors for small engines, SAE Paper, 2004-32-0053.
5. Itano, E. Characterization of carburettor exit flow. Thesis for Master of Science,
Mechanical Engg., University of Wisconsin-Madison, 1996.
6. Finlay, I.C., McMillan, T., Bannell, J.L.K. and Nightingale, C. The measurements of the
sizes of droplets leaving the throttle plate of an air valve carburettor. Journal of Physics,
Applied Physics, 1984, 18 1213-1222
7. Tanaka, M. and Durbin, E. Transient response of a carburetor engine. SAE Transactions -
770046, 1977, February 01, 224-238.

This document is the unedited author's version of a Submitted Work that was subsequently accepted for publication in
Sadhana after peer review. To access the final edited and published work see Sadhana 39(Part 3), 2014,
http://doi.org/10.1007/s12046-014-0248-3. 8. Hamid, B. S. and Walter, W. Y. Deposition of Fuel Droplets in Horizontal Intake
Manifolds and the Behavior of Fuel Film Flow on its Walls. SAE Transactions - 840239,
1985, 2.125-2.133.
9. Hasson, D.A. and Flint, W.L. An investigation of the liquid petrol wall film in the manifold
of a carburetted spark ignition engine: effect of carburettor and manifold geometry on wall
film quantities, engine performance and emissions. Proceedings of the Institution of
Mechanical Engineers, 203(Number D2/1989), 1989, 77-89.
10. Felton, P.G., Kyritsis, D.C., and Fulcher, S.K. LIF visualization of liquid fuel in the intake
manifold during cold start. SAE Transactions - 952464, 1995, 2278-2286.
11. Salazar, V. M. and Ghandhi, J.B. Liquid Fuel Effects on the Unburned Hydrocarbon
Emissions of a Small Engine. SAE Transactions , 2006-32-0033.
This document is the unedited author's version of a Submitted Work that was subsequently accepted for publication in
Sadhana after peer review. To access the final edited and published work see Sadhana 39(Part 3), 2014,
http://doi.org/10.1007/s12046-014-0248-3. Tables
Table 1: Details of the Engine used.
Engine Type Single cylinder, air-cooled 4-stroke
Carburetted, SOHC engine.
Bore 51 mm
Stroke 53.5 mm
Swept Volume 109.3 c.c.
Rated Power 6.04KW at 7250 rpm
Rated Torque 8.46 Nm at 5500 rpm
Transmission 4-speed constant mesh gearbox
Carburettor Slider valve type
Engine Idling Speed 1400 ± 100 RPM
Compression Ratio 9.2
Fuel Gasoline
IVO 340°
EVC 370°
IVC 565°
Inlet manifold diameter 19.5 mm
This document is the unedited author's version of a Submitted Work that was subsequently accepted for publication in
Sadhana after peer review. To access the final edited and published work see Sadhana 39(Part 3), 2014,
http://doi.org/10.1007/s12046-014-0248-3. List of Figures
Figure 1 : Integrated setup used for experiment.
Figure 2: CAD drawing of the slider valve carburettor used in the experiment.
Figure 3: Piezoresistive pressure sensor installation before and after the carburettor.
Figure 4: (a) CAD model of actual inlet manifold (left) and the manifold with optical section (right)
(b) Photograph of actual manifold with the optical section (carburettor is on the right and engine
head is on the left of the pictures).
Figure 5: Schematic of the PLIF setup.
Figure 6: Schematic of the optics used for doing carburettor drop sizing using PDIA technique.
Figure 7: Pressure difference across the carburettor for different RPM cases compared to idling (a)
Half-throttle, (b) Full-throttle.
Figure 8: Fuel film thickness measurement (a) Raw PLIF image (b) Processed PLIF image.
Figure 9: Fuel film thickness variation for different load and engine speed combinations.
Figure 10: State of the charge exiting the carburettor at (a) Full throttle, (b) Half Throttle & (c)
Idling conditions under steady pressure difference across the carburettor. The images on the right
are typical magnified views of a small region near the exit of the carburettor for each of the cases.
Figure 11: Droplet size distribution at (a) Half-throttle (b) Full-throttle.
Figure 12: Pressure difference measured across the carburettor during (a) Idling throttle and (b) full
throttle position.
Figure 13: State of the charge exiting the carburettor at (a) Idling, (b) Full throttle under unsteady
pressure variation. Each image spans a region of 5 mm X 4 mm at the exit of the carburettor.
Figure 14: Unburned HC emissions under cold start idling conditions on different days. The black
This document is the unedited author's version of a Submitted Work that was subsequently accepted for publication in
Sadhana after peer review. To access the final edited and published work see Sadhana 39(Part 3), 2014,
http://doi.org/10.1007/s12046-014-0248-3. colour curve shows the average variation.
Figure 15: HC emission variation for unheated case as a function of engine speed.
Figure 16: HC emission variation under cold start idling for unheated and heated cases.
Figure 17: Lambda (λ) variations at 35º C preheated case for different days with the engine speed
variation with the corresponding colours.
Figure 18: Comparison between Jet I (circle) and Jet II (triangle) nozzle diameter cases for various
throttle and speed combinations (a) HC emissions (b) Brake specific fuel consumption.
List of Notations
BSFC Brake Specific Fuel Consumption
CCD Charge Coupled Device
DC Direct Current
FWHM Full width half maximum
EVC Exhaust Valve Closer
EVO Exhaust Valve Open
HC Hydrocarbon
IVC Inlet Valve Closure
IVO Inlet Valve Open
PLIF Planar Laser Induced Fluorescence
RPM Revolution per minute
SMD Sauter Mean Diameter
SORE Small Off-road Engines
TDC Top Dead Center
This document is the unedited author's version of a Submitted Work that was subsequently accepted for publication in
Sadhana after peer review. To access the final edited and published work see Sadhana 39(Part 3), 2014,
http://doi.org/10.1007/s12046-014-0248-3.
Figure 1 : Integrated setup used for experiment
This document is the unedited author's version of a Submitted Work that was subsequently accepted for publication in
Sadhana after peer review. To access the final edited and published work see Sadhana 39(Part 3), 2014,
http://doi.org/10.1007/s12046-014-0248-3.

This document is the unedited author's version of a Submitted Work that was subsequently accepted for publication in
Sadhana after peer review. To access the final edited and published work see Sadhana 39(Part 3), 2014,
http://doi.org/10.1007/s12046-014-0248-3. Figure 2: CAD drawing of the slider valve carburettor used in the experiment.
This document is the unedited author's version of a Submitted Work that was subsequently accepted for publication in
Sadhana after peer review. To access the final edited and published work see Sadhana 39(Part 3), 2014,
http://doi.org/10.1007/s12046-014-0248-3.
Figure 3: Piezoresistive pressure sensor installation before and after the carburettor.
This document is the unedited author's version of a Submitted Work that was subsequently accepted for publication in
Sadhana after peer review. To access the final edited and published work see Sadhana 39(Part 3), 2014,
http://doi.org/10.1007/s12046-014-0248-3.
Figure 4: (a) CAD model of actual inlet manifold (left) and the manifold with optical section (right)
(b) Photograph of actual manifold with the optical section (carburettor is on the right and engine
head is on the left of the pictures)

This document is the unedited author's version of a Submitted Work that was subsequently accepted for publication in
Sadhana after peer review. To access the final edited and published work see Sadhana 39(Part 3), 2014,
http://doi.org/10.1007/s12046-014-0248-3.
Figure 5: Schematic of the PLIF setup
This document is the unedited author's version of a Submitted Work that was subsequently accepted for publication in
Sadhana after peer review. To access the final edited and published work see Sadhana 39(Part 3), 2014,
http://doi.org/10.1007/s12046-014-0248-3.
Figure 6: Schematic of the optics used for doing carburettor drop sizing using PDIA technique.

This document is the unedited author's version of a Submitted Work that was subsequently accepted for publication in
Sadhana after peer review. To access the final edited and published work see Sadhana 39(Part 3), 2014,
http://doi.org/10.1007/s12046-014-0248-3.
Figure 7: Pressure difference across the carburettor for different RPM cases compared to idling (a)

This document is the unedited author's version of a Submitted Work that was subsequently accepted for publication in
Sadhana after peer review. To access the final edited and published work see Sadhana 39(Part 3), 2014,
http://doi.org/10.1007/s12046-014-0248-3. Half-throttle, (b) Full-throttle.
This document is the unedited author's version of a Submitted Work that was subsequently accepted for publication in
Sadhana after peer review. To access the final edited and published work see Sadhana 39(Part 3), 2014,
http://doi.org/10.1007/s12046-014-0248-3.
Figure 8: Fuel film thickness measurement (a) False colour PLIF image (b) Processed data.

This document is the unedited author's version of a Submitted Work that was subsequently accepted for publication in
Sadhana after peer review. To access the final edited and published work see Sadhana 39(Part 3), 2014,
http://doi.org/10.1007/s12046-014-0248-3.
Figure 9: Fuel film thickness variation for different load and engine speed combinations. The error
in the measurement of film thickness is ±100 µm.

This document is the unedited author's version of a Submitted Work that was subsequently accepted for publication in
Sadhana after peer review. To access the final edited and published work see Sadhana 39(Part 3), 2014,
http://doi.org/10.1007/s12046-014-0248-3.
Figure 10: State of the charge exiting the carburettor at (a) Full throttle, (b) Half Throttle & (c)
Idling conditions under steady pressure difference across the carburettor. The images on the right

This document is the unedited author's version of a Submitted Work that was subsequently accepted for publication in
Sadhana after peer review. To access the final edited and published work see Sadhana 39(Part 3), 2014,
http://doi.org/10.1007/s12046-014-0248-3. are magnified views of a small region spanning 5mm x 4mm near the exit of the carburettor.

This document is the unedited author's version of a Submitted Work that was subsequently accepted for publication in
Sadhana after peer review. To access the final edited and published work see Sadhana 39(Part 3), 2014,
http://doi.org/10.1007/s12046-014-0248-3.
Figure 11: Droplet size distribution at (a) Half-throttle (b) Full-throttle.

This document is the unedited author's version of a Submitted Work that was subsequently accepted for publication in
Sadhana after peer review. To access the final edited and published work see Sadhana 39(Part 3), 2014,
http://doi.org/10.1007/s12046-014-0248-3.
Figure 12: Pressure difference measured across the carburettor during (a) Idling throttle and (b) full
throttle position.
This document is the unedited author's version of a Submitted Work that was subsequently accepted for publication in
Sadhana after peer review. To access the final edited and published work see Sadhana 39(Part 3), 2014,
http://doi.org/10.1007/s12046-014-0248-3.
Figure 13: State of the charge exiting the carburettor at (a) Idling, (b) Full throttle under unsteady
pressure variation. Each image spans a region of 5 mm X 4 mm at the exit of the carburettor.
This document is the unedited author's version of a Submitted Work that was subsequently accepted for publication in
Sadhana after peer review. To access the final edited and published work see Sadhana 39(Part 3), 2014,
http://doi.org/10.1007/s12046-014-0248-3.
Figure 14: Unburned HC emissions under cold start idling conditions on different days. The black
colour curve shows the average variation.
This document is the unedited author's version of a Submitted Work that was subsequently accepted for publication in
Sadhana after peer review. To access the final edited and published work see Sadhana 39(Part 3), 2014,
http://doi.org/10.1007/s12046-014-0248-3.
This document is the unedited author's version of a Submitted Work that was subsequently accepted for publication in
Sadhana after peer review. To access the final edited and published work see Sadhana 39(Part 3), 2014,
http://doi.org/10.1007/s12046-014-0248-3. Figure 15: HC emission variation for unheated case as a function of engine speed.
Figure 16: HC emission variation under cold start idling for unheated and heated cases.
This document is the unedited author's version of a Submitted Work that was subsequently accepted for publication in
Sadhana after peer review. To access the final edited and published work see Sadhana 39(Part 3), 2014,
http://doi.org/10.1007/s12046-014-0248-3.

This document is the unedited author's version of a Submitted Work that was subsequently accepted for publication in
Sadhana after peer review. To access the final edited and published work see Sadhana 39(Part 3), 2014,
http://doi.org/10.1007/s12046-014-0248-3. Figure 17: Lambda (λ) variations at 35º C preheated case for different days with the engine speed
variation with the corresponding colours.
This document is the unedited author's version of a Submitted Work that was subsequently accepted for publication in
Sadhana after peer review. To access the final edited and published work see Sadhana 39(Part 3), 2014,
http://doi.org/10.1007/s12046-014-0248-3.

This document is the unedited author's version of a Submitted Work that was subsequently accepted for publication in
Sadhana after peer review. To access the final edited and published work see Sadhana 39(Part 3), 2014,
http://doi.org/10.1007/s12046-014-0248-3. Figure 18: Comparison of (a) HC emissions and (b) Brake specific fuel consumption for Jet I
(circle) and Jet II (triangle) nozzle diameter cases for various load and speed combinations. The
vertical lines show the position on the x-y plane.


![R [unedited]](https://img.dokumen.tips/doc/110x75/577d2d381a28ab4e1ead2b4b/r-unedited.jpg)


