Embed Size (px)
Citation preview
Department of Chemistry and Chemical Engineering CHALMERS UNIVERSITY OF TECHNOLOGY Gothenburg, Sweden 2017
Study of barium and radium complex
formation with EDTA in alkaline
sodium chloride media Master’s thesis in the Nuclear Science and Technology programme
Niklas L. Hansson

ii
iii
MASTER’S THESIS
Study of barium and radium complex formation with EDTA in alkaline
sodium chloride media
Niklas L. Hansson
Department of Chemistry and Chemical Engineering
Division of Nuclear Chemistry and Industrial Materials Recycling
CHALMERS UNIVERSITY OF TECHNOLOGY
Göteborg, Sweden 2017

iv
Study of barium and radium complex formation with EDTA in alkaline sodium chloride media
Niklas L. Hansson
© NIKLAS L. HANSSON, 2017
Supervisor: Artem V. Matyskin
Examiner: Christian Ekberg
Department of Chemistry and Chemical Engineering
Division of Nuclear Chemistry and Industrial Materials Recycling
Chalmers University of Technology
SE – 412 96 Göteborg
Sweden
Telephone +46(0)31-772 1000
Cover: The apparent stability constants of the RaEDTA2- complex formation extrapolated to zero
ionic strength using the specific ion interaction theory

v
Study of barium and radium complex formation with EDTA in alkaline sodium
chloride media
Niklas L. Hansson
Division of Nuclear Chemistry and Industrial Materials Recycling
Department of Chemistry and Chemical Engineering
Chalmers University of Technology
Abstract
The complex formation of Ra2+ and Ba2+ with ethylenediaminetetraacetic acid (EDTA) was studied at two
pH regions where the EDTA4- and HEDTA3- species are dominant. The complex formation was investigated
at 25°C in NaCl ionic media at ionic strengths 0.2, 0.5, 1.0, 2.0 and 2.5 mol∙l-1, using an ion exchange
method and batch technique. Radium-226 and barium-133 were used as radiotracers and their activities in
the aqueous phases were measured using gamma spectrometry and liquid scintillation counting,
respectively. The specific ion interaction theory, SIT, was used to account for the complex formation
between the ionic media and the ligand, [NaEDTA]3- and [NaHEDTA]2- complex formations, as well as for
extrapolating determined apparent stability constants to zero ionic strength (BaEDTA2-: log10β=9.88±0.11
and RaEDTA2-: log10β=9.11±0.09). SIT was also used in order to obtain the Ba2+ and Ra2+ ion interaction
coefficient terms ((BaEDTA2-)=-(0.44±0.07); (RaEDTA2-)=-(0.54±0.06)). From these terms, the ion
interaction coefficients of Ba2+ and Ra2+ with various ions were calculated as: ε(Na+,BaEDTA2-)=-
(0.03±0.11) and ε(Na+, RaEDTA2-) =-(0.10±0.11). It was found that in the HEDTA3- dominant pH region,
the reaction of Ba2+ and Ra2+ with the HEDTA3- results in the emission of a proton and formation of the
BaEDTA2- and RaEDTA2- complexes. The comparison of ion interaction parameters of Ba2+ and Ra2+
strongly indicate that both metal ions and their EDTA complexes have similar activity coefficients and
undergo similar short-range interactions in aqueous NaCl media.
Keywords: alkaline earth metal, EDTA, radium, complex formation, activity coefficient, SIT, specific ion
interaction theory, infinite dilution, ionic strength, barium

vi
Table of contents 1. Introduction ............................................................................................................................................... 1
2. Background ............................................................................................................................................... 3
2.1 Decontamination using ethylenediaminetetraacetic acid .................................................................... 3
2.2 Co-precipitation and dissolution of Ba(Ra)SO4 .................................................................................. 3
2.3 Stability constant determination of alkaline earth metals ................................................................... 4
3. Theory ....................................................................................................................................................... 5
3.1 Activity coefficient models ................................................................................................................. 5
3.2 Stability constants of a complex formation reaction ........................................................................... 6
3.3 Stability constant determination using ion exchange distribution method ......................................... 7
3.4 Ethylenediaminetetraacetic acid (EDTA) ........................................................................................... 9
3.5 Corrections for ligand ionic media complex formation .................................................................... 12
3.6 pH titration ........................................................................................................................................ 13
4. Experimental ........................................................................................................................................... 15
4.1 Materials and Methods ...................................................................................................................... 15
4.2 Apparatus .......................................................................................................................................... 16
5. Results ..................................................................................................................................................... 17
5.1 Titration curves ................................................................................................................................. 17
5.2.1 Stability constant determination ..................................................................................................... 18
5.2.2 BaEDTA2- stability constant determination ................................................................................... 19
5.2.3 RaEDTA2- stability constant determination ................................................................................... 22
5.2.4 BaEDTA2- and BaEDTA2- stability constant comparison with literature data ............................... 24
5.2.5 Study of Ba2++HEDTA3- equilibrium ............................................................................................ 27
5.2.6 RaHEDTA- stability constant determination ................................................................................. 35
5.3 Specific ion interaction coefficients .................................................................................................. 38
6. Conclusion .............................................................................................................................................. 40
7. Future work ............................................................................................................................................. 41
8. Acknowledgements ................................................................................................................................. 42
9. References ............................................................................................................................................... 43
Appendix A ................................................................................................................................................. 48
1.1 Linear free Gibbs energy analysis ..................................................................................................... 48
1.2 Distribution ratio series data ............................................................................................................. 49
1.3 Equilibrium time study ..................................................................................................................... 52
Paper I ......................................................................................................................................................... 54

vii

1
1. Introduction
Radium is the heaviest element in the alkaline earth metal group, with 34 known isotopes [KAR15]. Only
four isotopes are found naturally, 226Ra (t1/2=1600 y), 228Ra (t1/2=5.75 y), 223Ra (t1/2=11.43 d), and 224Ra
(t1/2=3.66 d), as only these are part of the naturally occurring 238U, 235U and 232Th decay-series. Uranium
and thorium are abundant in many different rock and mineral types, which makes radium globally
widespread [LEE05]. Radium can be transferred from rocks to water by several mechanisms: diffusion,
alpha recoil, leaching and ion exchange, where the ion exchange is the most probable environmental
mechanism causing relatively high radium concentrations [LEE05b]. The Ra2+ ion is replaced most
efficiently by other alkaline earth metal ions, Ca2+, Ba2+ and Sr2+, but can also be replaced to some extent
by alkali metal ions, mainly Na+ and K+ [LEE05b]. Radium is therefore one of the most abundant naturally
occurring radioactive materials (NORM) in saline waters, in which it is present in its cation form, Ra2+.
There are different mechanisms of radium accumulation in the waste streams, but its co-precipitation with
similar-size ions (e.g. Ba2+, Sr2+, Ca2+, Pb2+) in the form of carbonates and sulfates [LEE05b] is one of the
main mechanisms. The radium isotopes are of significant environmental concern, and its isotopes may pose
a health risk because of their presence in soils and drinking water [COT90]. 226Ra is of particular concern
as it has a half-life of 1600 years, and is one of the most radiotoxic alpha emitters present in the environment
[EIS90]. Isolation and removal of Ra2+ from these waste streams can be done through dissolution using
chelating agents such as EDTA or ion exchange [LEE05b].
The radium isotopes have a variety of uses, such as tracers in groundwater flow, geochronology and in
radiotherapy [CHI99]. Radium is a bone tissue seeking element since it accumulates in the body according
to the same pathways as calcium because of their chemical similarity [JOH97]. This makes radium
especially harmful if ingested, even though it accumulates mostly in the mineral bone tissue, and not in the
bone marrow [LEE05b]. Ionizing radiation is nowadays widely used for diagnostics and treatment of cancer
[BRU08]. Radium has historically been the most important element in the development of radiochemistry
and medical uses of ionizing radiation. In the beginning of the 20th century 226Ra was used for
brachytherapy, a procedure where the radiation source is placed close to the tumor. Since radium
accumulates in bone tissue, it is used for the treatment of bone metastases. In radiotherapy in general, alpha-
emitting isotopes are preferable for the treatment of bone metastases, since radiation with sufficient range
can damage the bone marrow [BRU08]. Amongst the radium isotopes, only 223Ra and 224Ra are suitable
radionuclides for internal radiotherapy because of their appropriate short half-lives. They are both emitters
of alpha particles which has a very short range (<100µm) in the bone tissue, since alpha-particles deposits
a massive amount of energy per unit track length [BRU06]. This minimizes the damage to surrounding
tissue, which is why radium-223 has recently spiked in interest as a radiopharmaceutical. In 2013 223RaCl2
was approved by US Food and Drug administration as a bone seeking radiopharmaceutical for treatment of
prostate cancer with skeletal metastases [PAR13].
In the 1950s it was realized that radium is a substantial environmental pollutant in tailings originating from
the uranium mining industry. Radium can be also found in waste streams from other industries, e.g. in the
processes of phosphate and gold mining and milling, as well as in fossil fuel combustion [DIC90]. As a
consequence of these processes, radium has polluted surrounding waters and soils. Therefore,
understanding of the mechanism of radium accumulation in these waste streams as well as its migration
mechanisms is important for predicting and preventing excessive human exposure [DIC90].
2
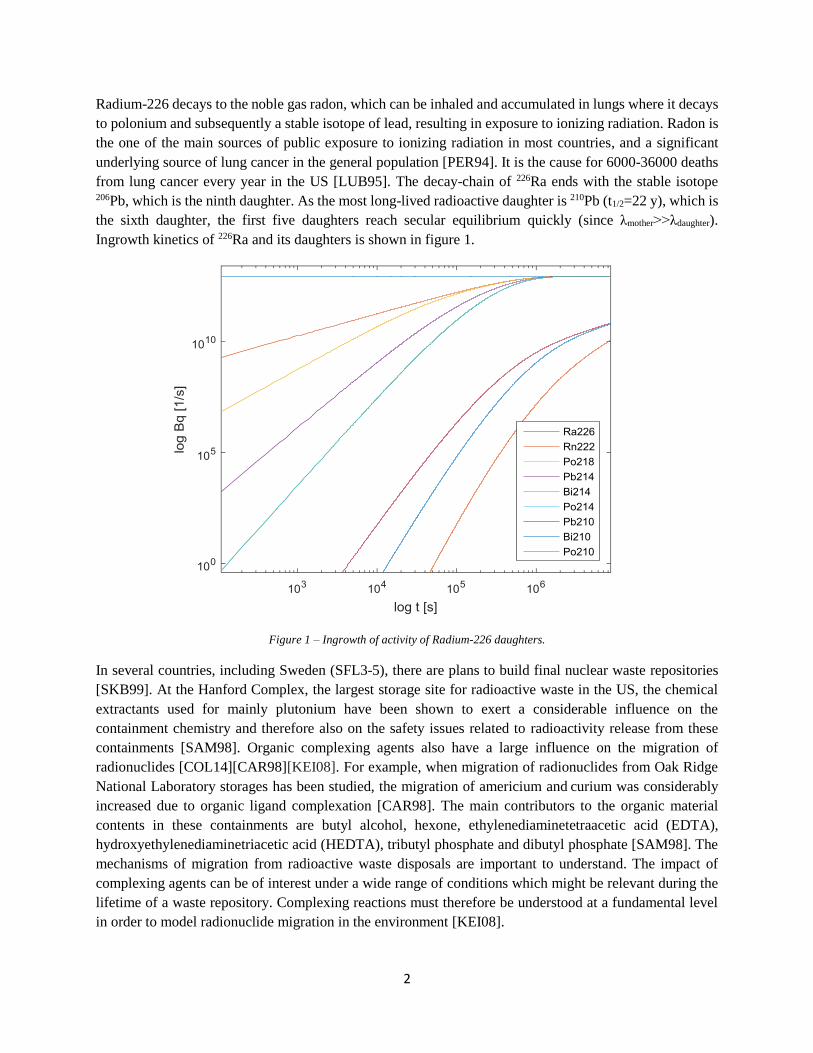
Radium-226 decays to the noble gas radon, which can be inhaled and accumulated in lungs where it decays
to polonium and subsequently a stable isotope of lead, resulting in exposure to ionizing radiation. Radon is
the one of the main sources of public exposure to ionizing radiation in most countries, and a significant
underlying source of lung cancer in the general population [PER94]. It is the cause for 6000-36000 deaths
from lung cancer every year in the US [LUB95]. The decay-chain of 226Ra ends with the stable isotope 206Pb, which is the ninth daughter. As the most long-lived radioactive daughter is 210Pb (t1/2=22 y), which is
the sixth daughter, the first five daughters reach secular equilibrium quickly (since λmother>>λdaughter).
Ingrowth kinetics of 226Ra and its daughters is shown in figure 1.
Figure 1 – Ingrowth of activity of Radium-226 daughters.
In several countries, including Sweden (SFL3-5), there are plans to build final nuclear waste repositories
[SKB99]. At the Hanford Complex, the largest storage site for radioactive waste in the US, the chemical
extractants used for mainly plutonium have been shown to exert a considerable influence on the
containment chemistry and therefore also on the safety issues related to radioactivity release from these
containments [SAM98]. Organic complexing agents also have a large influence on the migration of
radionuclides [COL14][CAR98][KEI08]. For example, when migration of radionuclides from Oak Ridge
National Laboratory storages has been studied, the migration of americium and curium was considerably
increased due to organic ligand complexation [CAR98]. The main contributors to the organic material
contents in these containments are butyl alcohol, hexone, ethylenediaminetetraacetic acid (EDTA),
hydroxyethylenediaminetriacetic acid (HEDTA), tributyl phosphate and dibutyl phosphate [SAM98]. The
mechanisms of migration from radioactive waste disposals are important to understand. The impact of
complexing agents can be of interest under a wide range of conditions which might be relevant during the
lifetime of a waste repository. Complexing reactions must therefore be understood at a fundamental level
in order to model radionuclide migration in the environment [KEI08].

3
2. Background
2.1 Decontamination using ethylenediaminetetraacetic acid
EDTA is amongst other organic ligands, e.g. NTA and picolinic acid, commonly used for decontamination
because of its strong chelating properties [KEI08], and is therefore commonly present in nuclear waste
repositories. It is estimated that in the US Department of Energy’s storage tanks for radioactive waste there
is 83 tons of EDTA present [SAM98], which makes thermodynamic data of EDTA important for the
understanding of the overall containment chemistry. It is estimated that radium will be the main contributor
to the long term radiation dose in case of containment failure of a nuclear repository [HED06][BRO16]. It
is therefore necessary to know radium thermodynamic properties, for example stability constants for its
complex formation with EDTA, to be able to accurately model its behavior, for example its migration from
wastes.
2.2 Co-precipitation and dissolution of Ba(Ra)SO4
In the uranium mining industry, uranium is generally leached from the milled uranium ore or leached using
sulfuric acid in situ. After the uranium leaching process, the liquid and solid residues in the tailings are
neutralized and disposed of in surface ponds in a liquid waste mixture [NIR88]. The key mechanism of
radium pre concentration in this process is its rapid dissolution and co-precipitation in the form of
Ba(Ra)SO4 [PAI98]. In these tailings, the 226Ra concentration is greater than in the used uranium ore, and
can reach activities of 43.4 kBq·kg-1 [CAR07b]. The background radiation levels are increased by quite a
large amount not only by radium, but also by its decay products, which can amount to a change from 0.1 -
0.2 μSv∙h-1 in reference areas (such as in the tailings storage region), up to 10-20 μSv∙h-1 on top of waste
dumps [CAR07b]. In water produced in petroleum industrial processes, 226Ra concentrations can reach
levels up to 200 Bq·l-1, which is significantly higher than the industrial effluents limits [ZHA14]. In order
to remove 226Ra, sulfates are usually added to co-precipitate radium in the form of Ba(Ra)SO4. This co-
precipitation of radium with barite acts mainly via an inclusion mechanism (lattice replacement) [ZHA14],
and is the main mechanism which controls radium behaviour in waste streams and its environmental
migration [LAN85][PAI98]. In order to be able to effectively decontaminate the uranium tailings or solid
residues originating from e.g. petroleum industries, dissolution of Ba(Ra)SO4 after co-precipitation is
necessary. Both pure radium and barium sulfates as well as their co-precipitates are practically insoluble in
aqueous solutions of mineral acids or in alkali media at room temperature [MAT16]. With the use of
chelating agents, Ba(Ra)SO4 can be dissolved at room temperature. The most widely used chelating agent
for the dissolution of Ba(Ra)SO4 is ethylenediaminetetraacetic acid (EDTA). EDTA in alkaline aqueous
solutions have previously been proven to be an effective agent for dissolution of Ba(Ra)SO4 [KOZ15]. At
Elliot Lake, Ontario, Canada, an aqueous alkaline solution containing 0.04 M EDTA was used in the
extraction of 226Ra from uranium tailings, successfully extracting 80-85% of the radium [NIX83]. In the
process of preparing 227Ac/223Ra radiopharmaceutical generators, alkaline EDTA solutions have been used
in dissolving irradiated 226RaSO4 targets [KUZ13]. The main reason for the high Ba(Ra)SO4 solubility in
alkaline EDTA solutions is the strong complex formation of Ba2+ and Ra2+ with EDTA.

4
2.3 Stability constant determination of alkaline earth metals
Stability constants of metals with various ligands is one of the fundamental thermodynamic properties
which can be used to model metal speciation in solution. Due to the high toxicity of 226Ra and its daughters,
access to experimental data of radium thermodynamic properties is limited. Therefore, extrapolations of
ion interaction parameters from other alkaline-earth metals are often used in order to model radium
[ROS11]. Since radium and barium are both alkaline-earth metals, studying them in conjunction makes it
possible to investigate the effect of radii on the chemical properties of alkaline earth metals. Radium and
barium have very similar chemical properties. For instance, the effective ionic radii of radium and barium
in 8-fold coordination are 1.42 and 1.48 Å respectively [SHA76]. The activity coefficient ratio γRa2+/γBa2+
is therefore often treated as unity [ROS11]. The ion interaction coefficients are necessary to describe the
ionic strength dependence of the stability constants. Comparison between these SIT ion interaction
coefficients has never been performed and would contribute to the solution chemistry of these elements.
Stability constants are usually determined under experimental conditions with constant ionic strength
[GRE00]. In order to maintain constant ionic strength during the experimental procedure, an inert
electrolyte with concentration much higher than the concentrations of the species involved in the
complexation is used. These stability constants are called apparent stability constants since they are only
valid under the specific experimental conditions used, since they depend on the concentration and
composition of the background electrolyte. In many cases, values of thermodynamic properties, e.g, activity
coefficients, cannot be directly determined experimentally, rather only changes can be measured. The
changes are related to a well-defined standard state, so that the deviations can be compared.
The focus of this work is to study the complex formation between Ra2+, as well as Ba2+, with EDTA at
different pH as a function of ionic strengths (NaCl ionic media) using an ion exchange batch technique
method. The specific ion interaction theory (SIT) model is used to extrapolate the apparent stability
constants of the studied complexes to a theoretical value at infinite dilution, as well as for calculating the
ion interaction coefficients of the species involved in the complex formation.
5
3. Theory
3.1 Activity coefficient models
Activity coefficients are used to describe deviations from ideal behavior of chemical species in solutions.
The chemical activity is defined as:
𝑎𝑖 ≡ 𝑐𝑖𝛾𝑖 (1)
where γi is the activity coefficient and ci is the concentration of species i. When the activity coefficient is
equal to unity, the system behaves ideally and the activities of the species present in solution are equal to
their respective concentrations. At very low concentrations, the activity coefficient of species in solution
can be approximated as 1, since the species can be considered to behave ideally under this circumstance.
The Debye-Hückel model is the foundation for all activity coefficient models which stems from the
following assumptions [LUT06][GRE00][TYA06]:
i. All strong electrolytes are dissociated to full extent.
ii. The interactions between ions obey Coulomb’s law.
iii. The ions can be considered point charges, where each ion is surrounded by oppositely charged ions
forming an ionic atmosphere which solvent molecules are attached to.
iv. The solvent is a continuous medium with dielectric constant ε.
These assumptions leads to the strong theoretical basis of the Debye-Hückel limiting law:
𝑙𝑜𝑔10𝛾𝑗 = −𝐴𝑧𝑗2√𝐼𝑚 (2)
Where A=0.509±0.001 kg1/2∙mol-1/2 at 25 °C [NEA05], zj is the electrical charge number and Im is the
ionic strength in molal units (mol∙kg-1) defined as:
𝐼𝑚 =
1
2∑ 𝑧𝑗
2𝑏𝑗
𝑗
(3)
where bi is the molality (mol∙kg-1) of species j. Eq. (2) is only valid for very low ionic strengths, below
IM=5·10-3 (mol∙dm-3) [STU70]. Empirical modifications can be made which extends the validity of Eq. (2)
to IM=0.1 (mol∙dm-3) [STU70], leading to the extended Debye-Hückel equation:
𝑙𝑜𝑔10𝛾𝑗 = −
𝐴𝑧𝑖2√𝐼𝑚
1 + 𝐵𝑎𝑖√𝐼𝑚
(4)
Including an ion-size parameter ai and the constant B with a value of 0.3283±0.0003 kg1/2·mol-1/2·Å-1 at 25
°C [NEA05]. The specific ion interaction theory (SIT) method has a much wider applicable ionic strength
range for calculating activity coefficients, up to Im=3.5 (mol∙kg-1) [LUT06]. Using the SIT methodology the
activity coefficient γj of an ion j with charge zj in a solution with ionic strength Im is expressed as:

6
𝑙𝑜𝑔10𝛾𝑗 = −𝑧𝑗2𝐷 + ∑ 𝜀(𝑗, 𝑘, 𝐼𝑚)𝑚𝑘
𝑘
(5)
where ε(j,k,Im) is the empirical ion interaction coefficient, mk is the molality of ion k and D is the Debye-
Hückel term which is defined as:
𝐷 =
𝐴√𝐼𝑚
1 + 1.5√𝐼𝑚
(6)
where the value of 1.5 is an empirical parameter chosen to minimize the effect of ionic strength on the ion
interaction coefficients [GRE00]. The ion interaction coefficients have a slight dependence on ionic
strength which can be considered negligible for ionic strengths below 3.5 mol·kg-1 when using 1:1, 1:2 and
2:1 electrolytes, but ionic strength corrections can be made by expressing the ion interaction coefficients in
two terms, one independent and one dependent on the ionic strength [GRE00].
3.2 Stability constants of a complex formation reaction
A general complex formation reaction can be expressed as:
𝑚𝑀 + 𝑞𝐿 + 𝑛𝐻2𝑂 ⇌ 𝑀𝑚𝐿𝑞(𝑂𝐻)𝑛 + 𝑛𝐻 (7)
where M is a metal ion, L is a ligand and MmLq(OH)n is the formed complex [GRE00], charges have been
omitted for brevity. The apparent stability constant βq,n,m of the complex formation is defined in terms of
concentrations between the products and reactants in Eq. (7) according to:
𝛽
∗𝑞,𝑛,𝑚 =
[𝑀𝑚𝐿𝑞(𝑂𝐻)𝑛][𝐻+]𝑛
[𝑀]𝑚[𝐿]𝑞
(8)
Expressing the stability constant in terms of activities instead yields the stability constant at zero ionic
strength, which is defined as:
𝛽
∗𝑞,𝑛,𝑚0 =
[𝑀𝑚𝐿𝑞(𝑂𝐻)𝑛][𝐻+]𝑛
[𝑀]𝑚[𝐿]𝑞
𝛾𝑞,𝑛,𝑚𝛾𝐻+𝑛
𝛾𝑀𝑚𝛾𝐿
𝑞 (9)
Substituting the concentrations with the apparent stability constant defined in Eq. (8) yields:
𝛽
∗𝑞,𝑛,𝑚0 = 𝛽
∗𝑞,𝑛,𝑚
𝛾𝑞,𝑛,𝑚𝛾𝐻+𝑛
𝛾𝑀𝑚𝛾𝐿
𝑞 (10)
Taking the logarithm of both sides of Eq. (10) yields:
𝑙𝑜𝑔10 𝛽 ∗
𝑞,𝑛,𝑚0 = 𝑙𝑜𝑔10 𝛽
∗𝑞,𝑛,𝑚 − 𝑚 𝑙𝑜𝑔10𝛾𝑀 − 𝑞 𝑙𝑜𝑔10𝛾𝑀 + 𝑙𝑜𝑔10𝛾𝑞,𝑛,𝑚 + 𝑛 𝑙𝑜𝑔10𝛾𝐻+ (11)
Eq. (11) can be rewritten by substituting the activity coefficients by the SIT model definition defined in Eq.
(5) [LUT06]:

7
𝑙𝑜𝑔10 𝛽 ∗
𝑞,𝑛,𝑚 − ∆𝑧2𝐷 = 𝑙𝑜𝑔10 𝛽
∗𝑞,𝑛,𝑚0 − ∆𝜀𝐼𝑚 (12)
where
∆𝑧2 = (𝑧𝑐𝑜𝑚𝑝𝑙𝑒𝑥)2 + 𝑛 − 𝑚𝑧𝑚2 − 𝑞𝑧𝐿
2 (13)
∆𝜀 = 𝜀(𝑐𝑜𝑚𝑝𝑙𝑒𝑥, 𝑁 𝑜𝑟 𝑋 ) − 𝑞𝜀(𝑁, 𝐿) − 𝑚𝜀(𝑀, 𝑋) + 𝑛𝜀(𝐻, 𝑋) (14)
3.3 Stability constant determination using ion exchange distribution method
A sodium ion form cation exchange resin exchanges its sodium ion with a cation Mm+ in aqueous phase
according to:
𝑧[𝑁𝑎+]̅̅ ̅̅ ̅̅ ̅̅ + [𝑀𝑧+] ⇌ [𝑀𝑧+]̅̅ ̅̅ ̅̅ ̅̅ + 𝑧[𝑁𝑎+] (15)
Where the bar superscript indicates resin phase. The distribution ratio, D, between a resin phase and an
aqueous phase is defined as:
Where the specific radioactivity is the radioactivity per unit volume or unit mass. Measurements of the
radioactivity in the aqueous phase allows for calculation the distribution ratio, D, between the resin phase
and the aqueous phase, according to:
𝐷 = (
𝐴0 − 𝐴𝑓
𝐴𝑓) (
𝑉
𝑤)
(17)
where the unit of D is in mL/g, A0 is the total radioactivity of the radioisotope in the sample volume, Af is
the radioactivity of the radioisotope in the aqueous phase after equilibrium has been reached, V is the
solution volume and w is the weight of the dry resin [GAL78]. The complex formation reaction in Eq. (7)
where M is an alkaline earth metal ion and L=HrEDTA(r-4) is expressed as:
𝑚𝑀2+ + 𝑞𝐻𝑟𝐸𝐷𝑇𝐴(𝑟−4) ⇌ [𝑀𝑚(𝐻(𝑟−𝑛)𝐸𝐷𝑇𝐴)
𝑞]
(2𝑚+𝑞(𝑟−𝑛−4))+ 𝑛𝐻+
(18)
with a stability constant βq,r,m, where it is assumed that no hydrolysis occurs. The distribution coefficient of
M2+ between the resin and the aqueous phase in the absence of ligand can be expressed by [GAL78]:
𝜆 =
[𝑀2+]̅̅ ̅̅ ̅̅ ̅̅
[𝑀2+]
𝑉
𝑤
(19)
For the investigated system this can be expressed as:
𝐷 =
𝑆𝑝𝑒𝑐𝑖𝑓𝑖𝑐 𝑟𝑎𝑑𝑖𝑜𝑎𝑐𝑡𝑖𝑣𝑖𝑡𝑦 𝑖𝑛 𝑟𝑒𝑠𝑖𝑛 𝑝ℎ𝑎𝑠𝑒
𝑆𝑝𝑒𝑐𝑖𝑓𝑖𝑐 𝑟𝑎𝑑𝑖𝑜𝑎𝑐𝑡𝑖𝑣𝑖𝑡𝑦 𝑖𝑛 𝑎𝑞𝑢𝑒𝑜𝑢𝑠 𝑝ℎ𝑎𝑠𝑒
(16)

8
𝐷 =
[𝑀2+]̅̅ ̅̅ ̅̅ ̅̅
∑ (𝑚 [𝑀𝑚(𝐻(𝑟−𝑛)𝐸𝐷𝑇𝐴)𝑞
](2𝑚+𝑞(𝑟−𝑛−4))
)∞ 𝑞,𝑟=0,𝑚=1
𝑉
𝑤
(20)
In this expression when q=0, the concentration term becomes equal to [𝑀2+], since there is no ligand
involved, and there are no free metal ions with m>1. Under these circumstances, i.e. if q=0, Eq (20) becomes
equal to the definition of λ shown in Eq. (19). Eq. (19) also allows for expressing the resin M2+ concentration
as:
[𝑀2+]̅̅ ̅̅ ̅̅ ̅̅ = 𝜆[𝑀2+]𝑤
𝑉
(21)
The stability constant βq,r,m can be defined through the reaction of formation for the complex
[𝑀𝑚(𝐻(𝑟−𝑛)𝐸𝐷𝑇𝐴)𝑞
](2𝑚+𝑞(𝑟−𝑛−4))
according to:
𝛽𝑞,𝑟,𝑚 =[𝑀𝑚(𝐻(𝑟−𝑛)𝐸𝐷𝑇𝐴)
𝑞]
(2𝑚+𝑞(𝑟−𝑛−4))
[𝑀2+]𝑚[𝐻(𝑟−𝑛)𝐸𝐷𝑇𝐴(𝑟−𝑛−4)]𝑞
(22)
This allows for expressing the concentration of [𝑀𝑚(𝐻(𝑟−𝑛)𝐸𝐷𝑇𝐴)𝑞
](2𝑚+𝑞(𝑟−𝑛−4))
as:
[𝑀𝑚(𝐻𝑟𝐸𝐷𝑇𝐴)𝑞](2+𝑞(𝑟−4))
= 𝛽𝑞,𝑟,𝑚[𝑀2+]𝑚[𝐻𝑟𝐸𝐷𝑇𝐴(𝑟−4)]𝑞 (23)
Substituting the resin M2+ concentration with the expression in Eq. (21) and the concentration from Eq. (23)
into Eq. (20) yields:
𝐷 =
𝜆[𝑀2+]
[𝑀2+] + ∑ (𝛽𝑞,𝑟,𝑚[𝑀2+]𝑚[𝐻𝑟𝐸𝐷𝑇𝐴(𝑟−4)]𝑞) 𝑞,𝑟=0,𝑚=1
(24)
Assuming that only mononuclear complexes, m=1 are formed under the studied experimental conditions
[GAL78], the M2+ concentration can be cancelled from Eq. (24) resulting in:
𝐷 =
𝜆
1 + ∑ 𝛽𝑞,𝑟,1[𝐻𝑟𝐸𝐷𝑇𝐴(𝑟−4)]𝑞 𝑞,𝑟
(25)
Rewriting this expression as the stability constant as a function of the distribution yields:
𝐷 (1 + ∑ 𝛽𝑞,𝑟,1[𝐻𝑟𝐸𝐷𝑇𝐴(𝑟−4)]𝑞
𝑞,𝑟
) = 𝜆
(26)
∑ 𝛽𝑞,𝑟,1[𝐻𝑟𝐸𝐷𝑇𝐴(𝑟−4)]
𝑞
𝑞,𝑟
=𝜆
𝐷− 1
(27)
By measuring the distribution ratio under varying ligand concentrations, [HrEDTA(r-4)] can be related to the
apparent stability constants *β1,r,1 according to Eq. (28):

9
∑(𝛽1,𝑟,1[𝐻𝑟𝐸𝐷𝑇𝐴(𝑟−4)])
𝑟
+ 1 =𝜆
𝐷
(28)
where it has been assumed that only one ligand molecule is included in each complex.
3.4 Ethylenediaminetetraacetic acid (EDTA)
Ethylenediaminetetraacetic acid, (CH2COOH)2NCH2CH2N(CH2COOH)2, henceforth referred to as EDTA,
is a polyaminocarboxylate that forms strong complexes with a variety of cations [GHA09]. It is a
hexadentate ligand, i.e. it has six donor groups with which it binds to a central cation to form a complex.
EDTA is resilient to radiation-induced degradation as well as to high temperatures as it will not degrade
until temperatures of 200-250° C [KEI08]. It can act as a double zwitterion, i.e. it is able to hold both
positive and negative charges by redistributing electrons, contributing to its chemical stability and resilience
to biodegradation [NEA05][ZAI97]. Pure H4EDTA has very low solubility in water, therefore,
Na2EDTA∙2H2O is commonly used for preparation of aqueous EDTA solutions. Na2EDTA·2H2O has a
density of 1.01 g/cm3 and molar mass of 372.24 g/mole [NEA05].
EDTA has six protonation constants:
𝐻𝑟𝐸𝐷𝑇𝐴(𝑟−4) + 𝐻+ ⇌ 𝐻(𝑟+1)𝐸𝐷𝑇𝐴(𝑟−3) (29)
The protonation constants, K°r of the reaction in Eq. (29) at zero ionic strength and 25°C are listed in table
1.
Table 1 – Stability constants for the protonation of H(r-1)EDTA(r-5) at zero ionic strength [NEA05].
r log10Kr0 log10βr
0
1 (11.24±0.03) (11.24±0.03)
2 (6.80±0.02) (18.04±0.04)
3 (3.15±0.02) (21.19±0.04)
4 (2.23±0.05) (23.42±0.07)
5 (1.3±0.1) (24.72±0.12)
6 –(0.5±0.2) (24.22±0.23)
The protonation constants Kr can be expressed as acid dissociation constants, Ka, through:
𝐾𝑎 =
1
𝐾𝑟
(30)
Applying the SIT methodology, the protonation constants at zero ionic strength are extrapolated to the ionic
strengths used in this work. Extrapolating using the SIT methodology defined by Eq. (12) yields:
𝑙𝑜𝑔10K𝑎,𝑟 = 𝑙𝑜𝑔10𝐾𝑎,𝑟
0 − ∆𝜀𝐼𝑚 + ∆𝑧2𝐷 (31)
The ion interaction coefficient term as defined in SIT (Eq. (14)) for reaction (29) can thus be calculated as:
∆𝜀 = 𝜀(𝐻(𝑟+1)𝐸𝐷𝑇𝐴(𝑟−3), 𝑁𝑎+) − 𝜀(𝐻𝑟𝐸𝐷𝑇𝐴(𝑟−4), 𝑁𝑎+) − 𝜀(𝐻+, 𝐶𝑙−) (32)
10
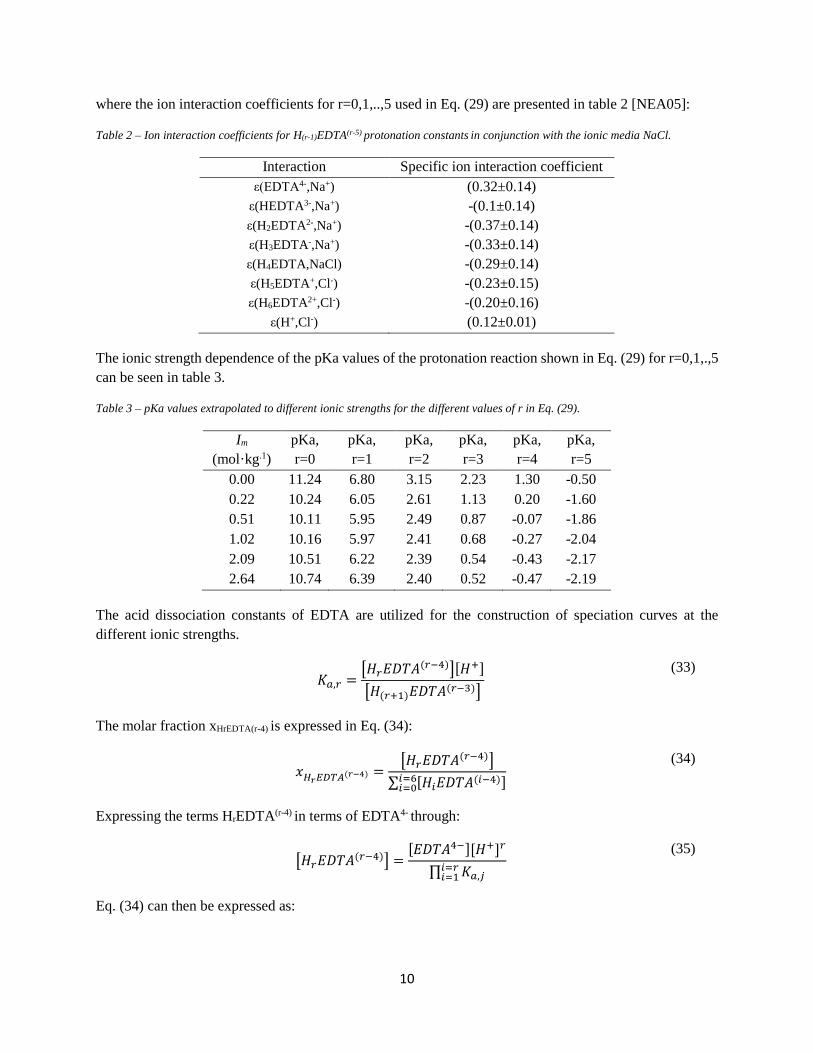
where the ion interaction coefficients for r=0,1,..,5 used in Eq. (29) are presented in table 2 [NEA05]:
Table 2 – Ion interaction coefficients for H(r-1)EDTA(r-5) protonation constants in conjunction with the ionic media NaCl.
Interaction Specific ion interaction coefficient
ε(EDTA4-,Na+) (0.32±0.14)
ε(HEDTA3-,Na+) -(0.1±0.14)
ε(H2EDTA2-,Na+) -(0.37±0.14)
ε(H3EDTA-,Na+) -(0.33±0.14)
ε(H4EDTA,NaCl) -(0.29±0.14)
ε(H5EDTA+,Cl-) -(0.23±0.15)
ε(H6EDTA2+,Cl-) -(0.20±0.16)
ε(H+,Cl-) (0.12±0.01)
The ionic strength dependence of the pKa values of the protonation reaction shown in Eq. (29) for r=0,1,.,5
can be seen in table 3.
Table 3 – pKa values extrapolated to different ionic strengths for the different values of r in Eq. (29).
Im
(mol·kg.1)
pKa,
r=0
pKa,
r=1
pKa,
r=2
pKa,
r=3
pKa,
r=4
pKa,
r=5
0.00 11.24 6.80 3.15 2.23 1.30 -0.50
0.22 10.24 6.05 2.61 1.13 0.20 -1.60
0.51 10.11 5.95 2.49 0.87 -0.07 -1.86
1.02 10.16 5.97 2.41 0.68 -0.27 -2.04
2.09 10.51 6.22 2.39 0.54 -0.43 -2.17
2.64 10.74 6.39 2.40 0.52 -0.47 -2.19
The acid dissociation constants of EDTA are utilized for the construction of speciation curves at the
different ionic strengths.
𝐾𝑎,𝑟 =
[𝐻𝑟𝐸𝐷𝑇𝐴(𝑟−4)][𝐻+]
[𝐻(𝑟+1)𝐸𝐷𝑇𝐴(𝑟−3)]
(33)
The molar fraction xHrEDTA(r-4) is expressed in Eq. (34):
𝑥𝐻𝑟𝐸𝐷𝑇𝐴(𝑟−4) =
[𝐻𝑟𝐸𝐷𝑇𝐴(𝑟−4)]
∑ [𝐻𝑖𝐸𝐷𝑇𝐴(𝑖−4)]𝑖=6𝑖=0
(34)
Expressing the terms HrEDTA(r-4) in terms of EDTA4- through:
[𝐻𝑟𝐸𝐷𝑇𝐴(𝑟−4)] =
[𝐸𝐷𝑇𝐴4−][𝐻+]𝑟
∏ 𝐾𝑎,𝑗𝑖=𝑟𝑖=1
(35)
Eq. (34) can then be expressed as:
11
𝑥𝐻𝑟𝐸𝐷𝑇𝐴(𝑟−4) =
[𝐻+]𝑟/ ∏ 𝐾𝑎,𝑖𝑖=𝑟𝑖=1
∑[𝐻+](𝑗−1)
∏ 𝐾𝑎,𝑖𝑖=𝑗−1𝑖=1
𝑗=7𝑗=1
(36)
Solving Eq. (36) for the different molar fractions using the SIT interaction coefficients established by
OECD NEA [NEA05], together with the acid dissociation constants of EDTA presented in table 3, a
speciation curve with molar fraction against –log10[H+] can be constructed at any ionic strength (below
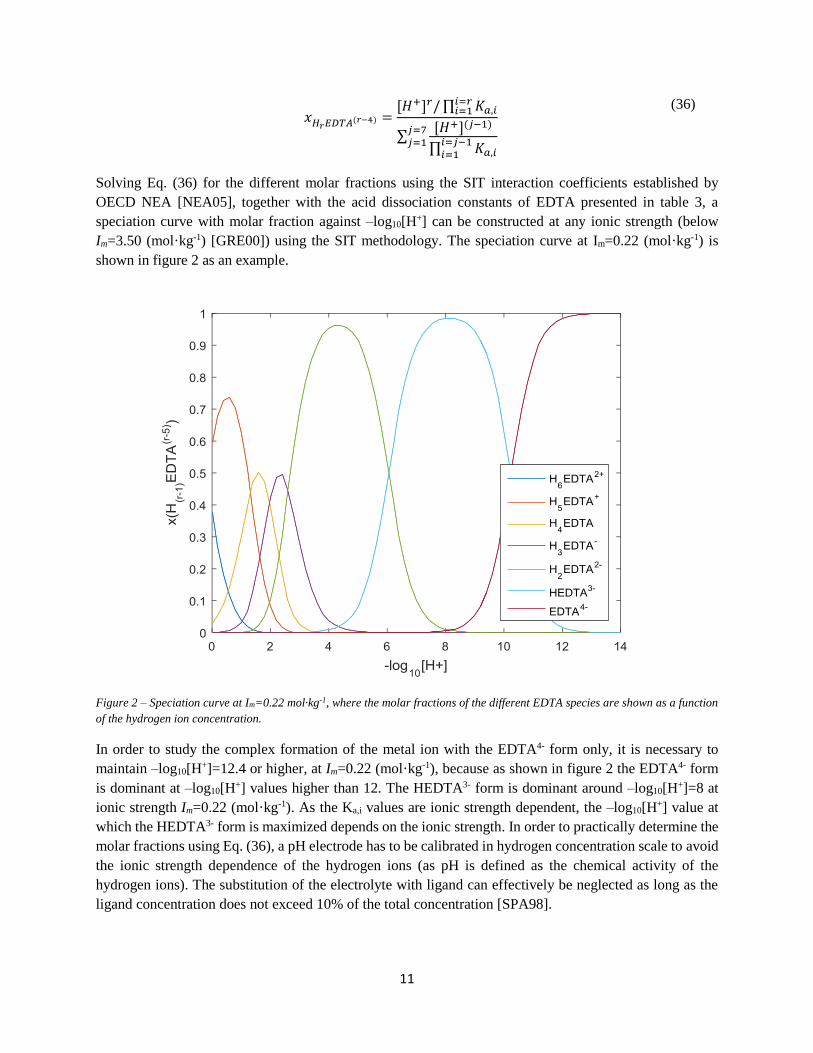
Im=3.50 (mol·kg-1) [GRE00]) using the SIT methodology. The speciation curve at Im=0.22 (mol·kg-1) is
shown in figure 2 as an example.
Figure 2 – Speciation curve at Im=0.22 mol·kg-1, where the molar fractions of the different EDTA species are shown as a function
of the hydrogen ion concentration.
In order to study the complex formation of the metal ion with the EDTA4- form only, it is necessary to
maintain –log10[H+]=12.4 or higher, at Im=0.22 (mol·kg-1), because as shown in figure 2 the EDTA4- form
is dominant at –log10[H+] values higher than 12. The HEDTA3- form is dominant around –log10[H+]=8 at
ionic strength Im=0.22 (mol·kg-1). As the Ka,i values are ionic strength dependent, the –log10[H+] value at
which the HEDTA3- form is maximized depends on the ionic strength. In order to practically determine the
molar fractions using Eq. (36), a pH electrode has to be calibrated in hydrogen concentration scale to avoid
the ionic strength dependence of the hydrogen ions (as pH is defined as the chemical activity of the
hydrogen ions). The substitution of the electrolyte with ligand can effectively be neglected as long as the
ligand concentration does not exceed 10% of the total concentration [SPA98].

12
3.5 Corrections for ligand ionic media complex formation
The apparent stability constants needs to be corrected for the NaEDTA3- complex formation, since the
amount of free ligand HrEDTA(r-4) that can form complex with the metal ion M2+ is decreased by the
following reaction:
𝑁𝑎 + 𝐻𝑟𝐸𝐷𝑇𝐴(𝑟−4) ⇌ [𝑁𝑎𝐻𝑟𝐸𝐷𝑇𝐴](𝑟−3) (37)
As the concentration of Na+ is considerably higher than the M2+ concentration under all experimental
conditions, this effect has to be accounted for even though the stability constant of this reaction is low, with
a value of log10K0NaEDTA=(2.8±0.2) at zero ionic strength [NEA05]. The total EDTA concentration in the
studied system can in the –log10[H+] range 8.0-12.4 be expressed as:
[𝐻𝑟𝐸𝐷𝑇𝐴(𝑟−4)]𝑡𝑜𝑡
= [𝐸𝐷𝑇𝐴4−] + [𝐻𝐸𝐷𝑇𝐴3−] + [𝐻2𝐸𝐷𝑇𝐴2−] + [𝑀𝐸𝐷𝑇𝐴]2−
+[𝑀𝐻𝐸𝐷𝑇𝐴]− + [𝑁𝑎𝐸𝐷𝑇𝐴]3− + [𝑁𝑎𝐻𝐸𝐷𝑇𝐴]2−
(38)
since the other forms of HrEDTA(r-4) are negligible in the specified pH interval. The metal ion concentrations
are only in trace amounts which makes the MHrEDTA(r-2) concentration negligible compared to the other
concentrations. HEDTA3- and H2EDTA2- concentrations can be expressed in terms of EDTA4- concentration
according to Eq. (39).
𝐾𝑎,𝑟 =
[𝐻𝑟𝐸𝐷𝑇𝐴(𝑟−4)][𝐻+]
[𝐻(𝑟+1)𝐸𝐷𝑇𝐴(𝑟−3)]
(39)
Similarly, the MEDTA2-, concentration is expressed in terms of EDTA4- concentration:
[𝑀𝐸𝐷𝑇𝐴]2− = 𝛽𝑀𝐸𝐷𝑇𝐴[𝑀2+][𝐸𝐷𝑇𝐴4−] (40)
From Eq. (37) the NaEDTA3- and NaHEDTA2- concentrations can also be expressed in this manner.
Substituting the terms in the total HrEDTA(r-4) concentration expression yields:
[𝐻𝑟𝐸𝐷𝑇𝐴(𝑟−4)]
𝑡𝑜𝑡= [𝐸𝐷𝑇𝐴4−] +
[𝐸𝐷𝑇𝐴4−][𝐻+]
𝐾𝑎,1+
[𝐸𝐷𝑇𝐴4−][𝐻+]2
𝐾𝑎,1 · 𝐾𝑎,2+
+𝛽𝑀𝐸𝐷𝑇𝐴[𝑀2+][𝐸𝐷𝑇𝐴4−] + 𝐾𝑁𝑎𝐸𝐷𝑇𝐴[𝑁𝑎+][𝐸𝐷𝑇𝐴4−] + 𝐾𝑁𝑎𝐻𝐸𝐷𝑇𝐴
[𝑁𝑎+][𝐸𝐷𝑇𝐴4−][𝐻+]
𝐾𝑎,1
(41)
The metal ion concentrations are only in trace amounts which makes the MEDTA2- concentration negligible
compared to the other terms. The EDTA4- concentration can therefore be expressed as:
[𝐸𝐷𝑇𝐴4−] =
[𝐻𝑟𝐸𝐷𝑇𝐴(𝑟−4)]𝑡𝑜𝑡
1 +[𝐻+]𝐾𝑎,1
+[𝐻+]2
𝐾𝑎,1 · 𝐾𝑎,2+ 𝐾𝑁𝑎𝐸𝐷𝑇𝐴[𝑁𝑎+] + 𝐾𝑁𝑎𝐻𝐸𝐷𝑇𝐴
[𝑁𝑎+][𝐻+]𝐾𝑎,1
(42)
At –log10[H+]≥12 the HrEDTA(r-4) concentrations for r≠0 can be considered negligible, and the total EDTA
concentration can therefore be expressed in even simpler terms:

13
[𝐻𝑟𝐸𝐷𝑇𝐴(𝑟−4)]𝑡𝑜𝑡
= [𝐸𝐷𝑇𝐴4−] + [𝑁𝑎𝐸𝐷𝑇𝐴3−] (43)
The EDTA4- concentration can similarly be expressed as:
[𝐸𝐷𝑇𝐴4−] =
[𝐻𝑟𝐸𝐷𝑇𝐴(𝑟−4)]𝑡𝑜𝑡
(1 + 𝛽𝑁𝑎𝐸𝐷𝑇𝐴 [𝑁𝑎+])
(44)
The apparent stability constants βMEDTA can then be corrected for the NaEDTA complexation according to:
𝛽𝑀𝐸𝐷𝑇𝐴
=[𝑀𝐸𝐷𝑇𝐴]2−
[𝑀2+][𝐸𝐷𝑇𝐴4−]=
[𝑀𝐸𝐷𝑇𝐴]2−
[𝑀2+][𝐻𝑟𝐸𝐷𝑇𝐴(𝑟−4)]𝑡𝑜𝑡
(1 + 𝛽𝑁𝑎𝐸𝐷𝑇𝐴 [𝑁𝑎+])
=
=[𝑀𝐸𝐷𝑇𝐴]2−(1 + 𝛽𝑁𝑎𝐸𝐷𝑇𝐴
𝑎𝑝𝑝[𝑁𝑎+])
[𝐻𝑟𝐸𝐷𝑇𝐴(𝑟−4)]𝑡𝑜𝑡[𝑀2+]
(45)
Expressing the term
[𝑀𝐸𝐷𝑇𝐴]2−
[𝐻𝑟𝐸𝐷𝑇𝐴(𝑟−4)]𝑡𝑜𝑡[𝑀2+]= 𝛽𝑀𝐸𝐷𝑇𝐴
𝑡𝑜𝑡 (46)
Allows for expressing the apparent stability constant in terms of the total HrEDTA(r-4) concentration:
𝛽𝑀𝐸𝐷𝑇𝐴 = 𝛽𝑀𝐸𝐷𝑇𝐴
𝑡𝑜𝑡 (1 + 𝛽𝑁𝑎𝐸𝐷𝑇𝐴𝑎𝑝𝑝
[𝑁𝑎+]) (47)
𝑙𝑜𝑔10𝛽𝑀𝐸𝐷𝑇𝐴 = 𝑙𝑜𝑔10𝛽𝑀𝐸𝐷𝑇𝐴
𝑡𝑜𝑡 + 𝑙𝑜𝑔10(1 + 𝛽𝑁𝑎𝐸𝐷𝑇𝐴 [𝑁𝑎+]) (48)
which is similar to the suggested (and fairly simplified) NaEDTA3- correction procedure presented by
OECD NEA in their extensive EDTA-review [NEA05].
3.6 pH titration
Nernst equation describes the potential change as a function of the reaction quotient of species j [ATK09]:
𝐸 = 𝐸0 +
𝑅𝑇
𝑛𝐹· 𝑙𝑛𝑄𝑗 (49)
For a pH-electrode, this can be expressed in terms of the hydrogen activity according to Eq (50):
𝐸 = 𝐸0 +
𝑅𝑇
𝑛𝐹· 𝑙𝑛{𝐻+} (50)
The natural logarithm can be expressed as the logarithm in base 10 as:
𝑙𝑛{𝐻+} = 𝑙𝑜𝑔10{𝐻+} ∙ 𝑙𝑛(10) (51)
Substituting this expression into Eq. (50) results in:

14
𝐸 = 𝐸0 + 𝑙𝑛(10) ·
𝑅𝑇
𝑛𝐹· 𝑙𝑜𝑔{𝐻+} (52)
The activity of hydrogen can be expressed as the hydrogen concentration and activity coefficient:
𝐸 = 𝐸0 + 𝑙𝑛(10) ·
𝑅𝑇
𝑛𝐹· 𝑙𝑜𝑔[𝐻+] + 𝑙𝑛(10) ·
𝑅𝑇
𝑛𝐹· 𝑙𝑜𝑔 𝛾𝐻+ (53)
The titrations are performed at five different ionic strengths, where the ionic strength and temperature is
maintained constant throughout the titration. The term containing the activity coefficient in Eq. (53) is
therefore maintained constant throughout every individual titration and the invariable terms can be summed
together:
𝐸0
∗ = 𝐸0 + 𝑙𝑛(10) ·𝑅𝑇
𝑛𝐹· 𝑙𝑜𝑔 𝛾𝐻+ (54)
which results in Eq (55):
𝐸 = 𝐸0
∗ + 𝑙𝑛(10) ·𝑅𝑇
𝑛𝐹· 𝑙𝑜𝑔[𝐻+] (55)
The potential E is linearly dependent on the hydrogen concentration, making it possible to calibrate the pH
electrode in the concentration scale if the ionic strength is constant as the titration volume is changed. Since
the E0 value is a characteristic of the pH electrode, the change in 𝐸0∗ can be attributed to the change in
activity coefficient because of the ionic strength difference between titrations. Using the SIT equation, Eq.
(5), for the activity coefficient calculations, the activity coefficient change can be attributed to the change
in the Debye-Hückel term as well as in the ion interaction coefficient term. The Debye-Hückel term is
known for all ionic strengths, which makes it possible to calculate the ion interaction coefficient of H+ in
NaCl media, ε(H+,Cl-), from the titration data. The ion interaction coefficient is calculated by minimizing
the error squares sum from Eq. (56):
𝑆 = ∑(𝛾𝑒𝑥𝑝𝑒𝑟𝑖𝑚𝑒𝑛𝑡𝑎𝑙,𝑖 − 𝛾𝑐𝑎𝑙𝑐𝑢𝑙𝑎𝑡𝑒𝑑,𝑖)2 (56)
15
4. Experimental
4.1 Materials and Methods
The complex formations were studied in duplicate series, where each series contained 11 samples per ionic
strength, at the ionic strengths: 0.22, 0.5, 1.0, 2.0 and 2.5 mol∙dm-3. Cation exchange resin (Biorad AG
50W-X8 Resin 200-400 Mesh in sodium form) was added to each sample in order to distribute the alkaline
earth metal ions between the aqueous phase and the resin phase. Eckert & Ziegler Isotope Products 133BaCl2
(t1/2=10.54 y [KAR15]) stock solution was used, which also contained barium carrier, resulting in an activity
of 3.7∙104 Bq per sample. Radium stock solutions were prepared from dissolved RaCO3 powder according
to the previously established procedure [MAT16], resulting in a specific activity of 226Ra of 2.51∙104
Bq∙µl-1. Due to the high radioactivity of 133Ba and 226Ra stock solutions, radiation protection measures had
to be taken during the experimental work to minimize potential risks. All measurements and calculations
throughout this study have been done at 25.1 °C unless specified otherwise.
All aqueous solutions were prepared using MQ water with resistivity equal to 18.2 MΩ·cm at 25°C and
total organic content < 5mg/l. Ionic strength was adjusted using NaCl stock solution prepared using solid
NaCl (Sigma-Aldrich ACS reagent p.a. ≥99.0 %). Ethylenediaminetetraacetic acid (EDTA), stock solutions
were prepared from solid Na2EDTA·2H2O (Sigma p.a. ≥99.0 %). In order to study the complexation of the
EDTA4- form, the pH was increased by adding 50 µl of 5M NaOH stock solution prepared from Sigma-
Aldrich fixanal to each sample of the Ba2+ series and 5 µl to each sample of the Ra2+ series. When studying
the HEDTA3- complexation, the pH was adjusted in order to maximize the HEDTA3- form, according to
Eq. (36). The HrEDTA(r-4) total concentrations were varied throughout the sample series ranging between 0
and 6.67∙10-5 mol∙dm-3. Samples without ion exchange resin and ligand concentration were prepared in
order to measure the total sample radioactivity. The total aqueous volumes were adjusted to 10 and 1 ml,
for the Ba2+ and Ra2+ series respectively, using NaCl stock solution and MQ water. The pH electrode was
calibrated using Certipur Merck pH 4, 7 and 10 buffers, and a potentiometric titration was performed in
order to calibrate the electrode in the concentration scale. For all [BaHrEDTA](r-2) complex formation
measurements, 50 µl of the aqueous phase was extracted from each sample and added to a 7 ml LSC-vial
and subsequently mixed with Emulsifier safe LSC cocktail. For the [RaHrEDTA](r-2) measurements, 10 µl
of the aqueous phase was extracted from each sample and added to a plastic vial containing 1 ml of 4M
HCl prepared from Sigma-Aldrich fixanal. As the equilibration time of the complex formation is rather
slow, the samples had to be shaken several times to speed up the equilibrium (see Appendix A for more
information).
The potentiometric titrations required preparation of 10 ml samples with the appropriate ionic strengths at
–log10[H+]≈2.6, by adding 5 µl of 5M Sigma-Aldrich fixanal HCl solution to 9.998 ml NaCl solution. The
titrated solution was measured with the specified pH electrodes while a few µl of 0.1M NaOH solution was
added and the potentiometric values were noted between additions. Plotting -log10[H+] against voltage, the
data was fitted linearly according to Eq. (. From the fitted equation the corresponding potential to the
required hydrogen concentration was calculated. The measurement series were then adjusted to the
calculated potential required to maximize the molar fraction of the HEDTA3- form.

16
4.2 Apparatus
Resin and all other solid chemicals used were weighed on a Sartorius Quintix125D-1S scale. The barium
samples were measured using a Perkin Elmer Guardian 1414 Liquid Scintillation Counter. The radium
samples were measured using a Canberra DSA-2000/A coupled with Canberra GEM23195 closed-end
coaxial HPGe detector (53.5 mm diameter, 63.1 mm length) and a digital spectrum analyzer Ortec
DSPEC50 coupled to an Ortec GEM-C5060 coaxial HPGe detector (50.5 mm diameter, 68.3 mm length)
with a 0.9 mm carbon epoxy entrance window. The detectors were calibrated using a NIST traceable, Eckert
and Ziegler radionuclide reference solution. The spectra obtained from the measurements were analyzed
using Gamma Vision 7.01.03, and Apex Gamma software. The 827 pH lab Metrohm pH meter and
Metrohm Primatrode with NTC electrode was used for the potentiometric measurements.

17
5. Results
5.1 Titration curves
The potentiometric titration curve at Im=2.5 (mol∙kg-1) is shown in figure 3. The equation shown in figure
3 is obtained from least squares fitting and is used to calculate the potential corresponding to the desired
hydrogen concentration [GRA52]. The potentiometric titrations were performed at 23±1°C with very small
changes in volume and at constant ionic strengths. The slope obtained in the potentiometric measurement
is in agreement with the theoretical value at 25 °C of 59.16 [ATK09]. Linear regressions of the
potentiometric titrations were performed at every ionic strength used, which all had a high coefficients of
determination, r2 [MIL02], and slopes close to the theoretical value, indicating accurate potentiometric
titrations [SOK01].
Figure 3 – Potentiometric titration curve at Im=2.5 mol∙kg-1.
18
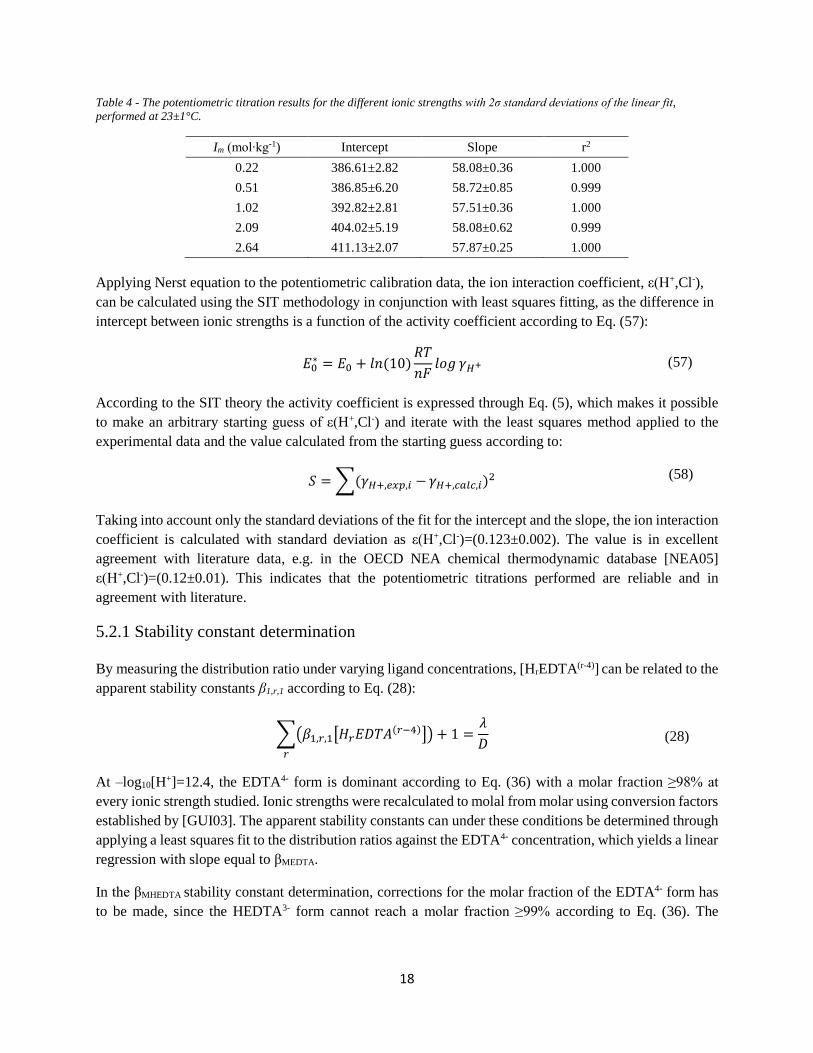
Table 4 - The potentiometric titration results for the different ionic strengths with 2σ standard deviations of the linear fit,
performed at 23±1°C.
Im (mol∙kg-1) Intercept Slope r2
0.22 386.61±2.82 58.08±0.36 1.000
0.51 386.85±6.20 58.72±0.85 0.999
1.02 392.82±2.81 57.51±0.36 1.000
2.09 404.02±5.19 58.08±0.62 0.999
2.64 411.13±2.07 57.87±0.25 1.000
Applying Nerst equation to the potentiometric calibration data, the ion interaction coefficient, ε(H+,Cl-),
can be calculated using the SIT methodology in conjunction with least squares fitting, as the difference in
intercept between ionic strengths is a function of the activity coefficient according to Eq. (57):
𝐸0
∗ = 𝐸0 + 𝑙𝑛(10)𝑅𝑇
𝑛𝐹𝑙𝑜𝑔 𝛾𝐻+ (57)
According to the SIT theory the activity coefficient is expressed through Eq. (5), which makes it possible
to make an arbitrary starting guess of ε(H+,Cl-) and iterate with the least squares method applied to the
experimental data and the value calculated from the starting guess according to:
𝑆 = ∑(𝛾𝐻+,𝑒𝑥𝑝,𝑖 − 𝛾𝐻+,𝑐𝑎𝑙𝑐,𝑖)2 (58)
Taking into account only the standard deviations of the fit for the intercept and the slope, the ion interaction
coefficient is calculated with standard deviation as ε(H+,Cl-)=(0.123±0.002). The value is in excellent
agreement with literature data, e.g. in the OECD NEA chemical thermodynamic database [NEA05]
ε(H+,Cl-)=(0.12±0.01). This indicates that the potentiometric titrations performed are reliable and in
agreement with literature.
5.2.1 Stability constant determination
By measuring the distribution ratio under varying ligand concentrations, [HrEDTA(r-4)] can be related to the
apparent stability constants β1,r,1 according to Eq. (28):
∑(𝛽1,𝑟,1[𝐻𝑟𝐸𝐷𝑇𝐴(𝑟−4)])
𝑟
+ 1 =𝜆
𝐷 (28)
At –log10[H+]=12.4, the EDTA4- form is dominant according to Eq. (36) with a molar fraction ≥98% at
every ionic strength studied. Ionic strengths were recalculated to molal from molar using conversion factors
established by [GUI03]. The apparent stability constants can under these conditions be determined through
applying a least squares fit to the distribution ratios against the EDTA4- concentration, which yields a linear
regression with slope equal to βMEDTA.
In the βMHEDTA stability constant determination, corrections for the molar fraction of the EDTA4- form has
to be made, since the HEDTA3- form cannot reach a molar fraction ≥99% according to Eq. (36). The

19
influence of H2EDTA2- is considered negligible, since it expectedly forms considerably weaker complexes
than the EDTA4- form.
5.2.2 BaEDTA2- stability constant determination
At ionic strengths Im=0.22, 0.50, 1.02, 2.09 and 2.64 (mol∙kg-1) the distribution ratios of 133Ba are plotted
against [HrEDTA(r-4)]tot and shown in figure 4.
Figure 4 – Determination of apparent stability constants for BaEDTA2- in the linear regressions by least squares fitting at Im=0.22,
0.50 (a), 1.02, 2.09 (b), and 2.64 (mol∙kg-1) (c) according to Eq. (28). The 2σ confidence boundsof the fit are the dotted lines and
the uncertainties correspond to standard deviation based on duplicate samples.
Since the apparent stability constants in Fig. 4 are determined as a function of the total HrEDTA(r-4)
concentration, a correction for both the sodium complex formation with EDTA as well as EDTA-

20
protonation is required to find the apparent stability constants of BaEDTA2-, according to section 3.4.
According to Eq. (42), the relationship between [HrEDTA(r-4)]tot and [EDTA4-] is expressed as:
[𝐸𝐷𝑇𝐴4−] =
[𝐻𝑟𝐸𝐷𝑇𝐴(𝑟−4)]𝑡𝑜𝑡
1 +[𝐻+]𝐾𝑎,1
+[𝐻+]2
𝐾𝑎,1 · 𝐾𝑎,2+ 𝐾𝑁𝑎𝐸𝐷𝑇𝐴[𝑁𝑎+] + 𝐾𝑁𝑎𝐻𝐸𝐷𝑇𝐴
[𝑁𝑎+][𝐻+]𝐾𝑎,1
(42)
Stability constants for the NaEDTA3- complexation are available in literature at various ionic strengths
[NEA05], which are shown in table 5 together with the Debye-Hückel term, D defined in Eq. (6).
Table 5 - KNaEDTA values taken from literature together with corresponding Debye-Hückel terms
Im (mol·kg-1) log10KNaEDTA [NEA05] Debye-Hückel term, D
0.00 (2.80±0.20) 0.000
0.10 (1.95±0.21) 0.110
0.25 (1.71±0.23) 0.146
0.51 (1.54±0.31) 0.175
0.76 (1.47±0.41) 0.192
1.02 (1.45±0.52) 0.204
2.09 (1.50±1.00) 0.232
3.20 (1.70±1.70) 0.247
Using the SIT methodology, the values of KNaEDTA found in literature can be extrapolated to the ionic
strengths used in this work that are not available in literature. The slope Δε=-0.27±0.33 was found to fit the
data in table 5 very well providing KNaEDTA at every ionic strength used in this work. If available,
uncertainties were taken from literature [NEA05], and were otherwise propagated using the SIT
methodology with Δε=-0.27±0.33.
Table 6 - KNaEDTA calculated using the SIT methodology with a slope Δε=-0.27±0.33
Im (mol·kg-1) Extrapolated KNaEDTA
0.217 (1.74±0.23)a
0.506 (1.54±0.31)
1.022 (1.44±0.52)
2.086 (1.50±1.00)
2.637 (1.59±1.30)a aUncertainties were propagated from used literature ion interaction coefficients
Eq. (42) was then used to convert the [HrEDTA(r-4)]tot term into the corresponding EDTA4- concentration.
The NaEDTA3- complex formation, is a substantial contribution to the denominator on the right hand side
of Eq. (42), meaning it consumes a large fraction of the free EDTA4- concentration. The uncertainties for
the apparent KNaEDTA-values as seen in table 5 are large, and will account for a large part of the uncertainty
of the corrected apparent stability constants. The stability constant at zero ionic strength, β°BaEDTA is
calculated using the SIT methodology applied to the determined apparent stability constants according to
Eq. (12):

21
𝑙𝑜𝑔10 𝛽 ∗
𝑞,𝑛,𝑚 − ∆𝑧2𝐷 = 𝑙𝑜𝑔10 𝛽
∗𝑞,𝑛,𝑚0 − ∆𝜀𝐼𝑚 (12)
where
∆𝑧2 = 𝑧𝐵𝑎𝐸𝐷𝑇𝐴2 − 𝑧𝐵𝑎
2 − 𝑧𝐸𝐷𝑇𝐴2 = −16 (59)
Figure 5 – Extrapolation of BaEDTA2- stability constant to zero ionic strength using the SIT methodology. The 2σ confidence
bounds of the fit are the dotted lines and the uncertainties correspond to standard deviation obtained from the linear regressions
of the apparent stability constants and from the uncertainties of the sodium-EDTA constants.
As it can be observed from figure 5, the linear fit is good for the data set, suggesting that the experimental
data fits the theoretical model accurately. The intercept, i.e. (9.88±0.11), is equal to the stability constant
of the BaEDTA2- complex formation at zero ionic strength. The uncertainties shown in figure 5 are largely
originating from the standard deviations of the NaEDTA complex formation. As these standard deviations
are quite large, especially for the higher ionic strengths, the standard deviations of the individual points and
of the slope of the linear regression are affected to quite some extent. The ion interaction coefficient term,
Δε, is equal to the slope, with reversed sign, of the linear regression obtained by applying the SIT
methodology to the data set. For the BaEDTA2- complex formation the ion interaction coefficient term is
expressed as:
∆𝜀𝐵𝑎𝐸𝐷𝑇𝐴 = 𝜀(𝐵𝑎𝐸𝐷𝑇𝐴2−, 𝑁𝑎+ ) − 𝜀(𝐵𝑎2+, 𝐶𝑙−) + 𝜀(𝐸𝐷𝑇𝐴4−, 𝑁𝑎+) (60)
As the slope, ε(Ba2+,Cl-) and ε(EDTA4-,Na+) are all known, the ion interaction coefficient ε(BaEDTA2-,Na+)
can be calculated as –(0.05±0.16). The standard deviation of the linear fit, by ignoring the standard

22
deviations of the individual points, is equal to 0.03, which puts into perspective the influence of the
propagated uncertainties of the NaEDTA constants.
5.2.3 RaEDTA2- stability constant determination
At ionic strengths Im=0.22, 0.50, 1.02, 2.09 and 2.64 (mol∙kg-1) the plot of distribution ratios of 226Ra against
[HrEDTA(r-4)]tot is shown in figure. 6.
Figure 6 –Determination of apparent stability constants for RaEDTA2- in the linear regressions by least squares fitting at Im=0.22,
0.50 (a), 1.02, 2.09 (b), and 2.64 (mol∙kg-1) (c) according to Eq. (28). The 2σ confidence bounds are the dotted lines and the
uncertainties correspond to standard deviation based on duplicate samples.
23
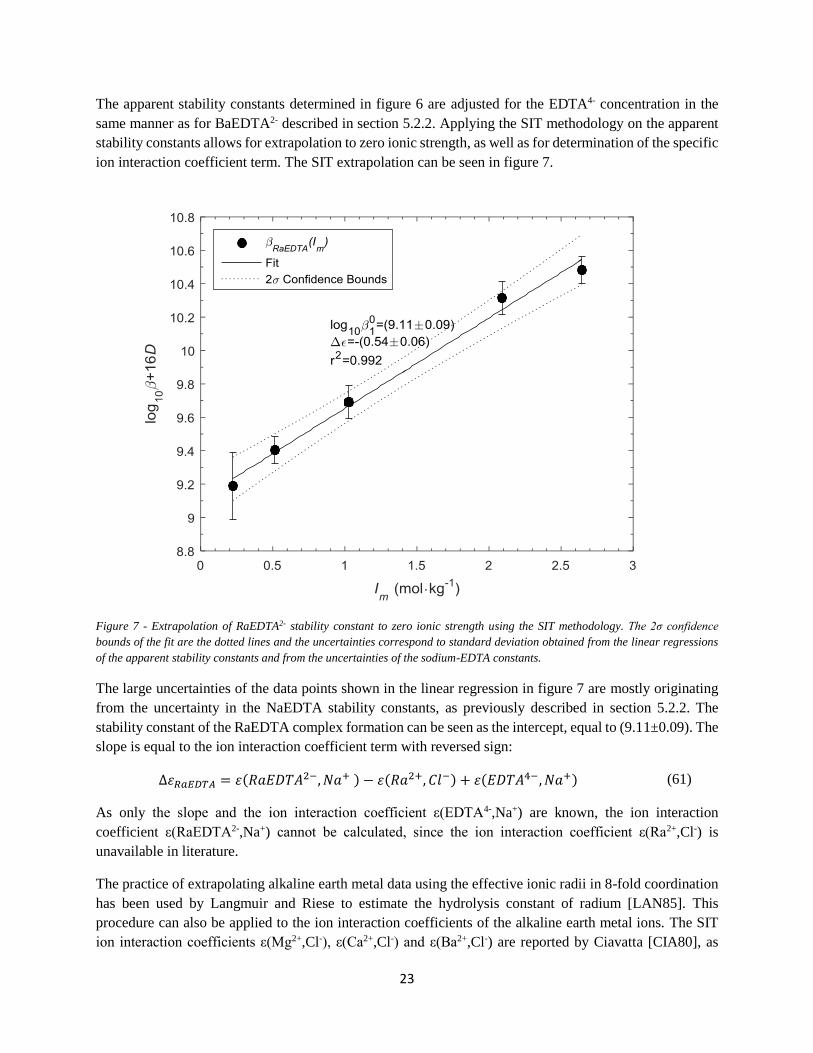
The apparent stability constants determined in figure 6 are adjusted for the EDTA4- concentration in the
same manner as for BaEDTA2- described in section 5.2.2. Applying the SIT methodology on the apparent
stability constants allows for extrapolation to zero ionic strength, as well as for determination of the specific
ion interaction coefficient term. The SIT extrapolation can be seen in figure 7.
Figure 7 - Extrapolation of RaEDTA2- stability constant to zero ionic strength using the SIT methodology. The 2σ confidence
bounds of the fit are the dotted lines and the uncertainties correspond to standard deviation obtained from the linear regressions
of the apparent stability constants and from the uncertainties of the sodium-EDTA constants.
The large uncertainties of the data points shown in the linear regression in figure 7 are mostly originating
from the uncertainty in the NaEDTA stability constants, as previously described in section 5.2.2. The
stability constant of the RaEDTA complex formation can be seen as the intercept, equal to (9.11±0.09). The
slope is equal to the ion interaction coefficient term with reversed sign:
∆𝜀𝑅𝑎𝐸𝐷𝑇𝐴 = 𝜀(𝑅𝑎𝐸𝐷𝑇𝐴2−, 𝑁𝑎+ ) − 𝜀(𝑅𝑎2+, 𝐶𝑙−) + 𝜀(𝐸𝐷𝑇𝐴4−, 𝑁𝑎+) (61)
As only the slope and the ion interaction coefficient ε(EDTA4-,Na+) are known, the ion interaction
coefficient ε(RaEDTA2-,Na+) cannot be calculated, since the ion interaction coefficient ε(Ra2+,Cl-) is
unavailable in literature.
The practice of extrapolating alkaline earth metal data using the effective ionic radii in 8-fold coordination
has been used by Langmuir and Riese to estimate the hydrolysis constant of radium [LAN85]. This
procedure can also be applied to the ion interaction coefficients of the alkaline earth metal ions. The SIT
ion interaction coefficients ε(Mg2+,Cl-), ε(Ca2+,Cl-) and ε(Ba2+,Cl-) are reported by Ciavatta [CIA80], as

24
(0.19±0.02), (0.14±0.01) and (0.07±0.01) respectively. The effective ionic radii of Mg2+, Ca2+, Ba2+ and
Ra2+ in 8-fold coordination, are reported by Shannon as 0.89, 1.12, 1.42 and 1.48 pm respectively [SHA76].
Linearly fitting the effective ionic radii in 8-fold coordination against the ion interaction coefficients for
the alkaline earth metals makes it possible to extrapolate to the SIT ion interaction coefficient ε(Ra2+,Cl-).
The procedure can be seen in figure 8, resulting in ε(Ra2+,Cl-)=(0.057±0.02). Using this estimation of the
ion interaction coefficient, the ε(RaEDTA2-,Na+) parameter can be calculated as –(0.16±0.15).
Figure 8 – Extrapolation of ε(Ra2+,Cl-) SIT ion interaction coefficient using ion interaction coefficients of other alkaline metals
with their effective ionic radii [SHA76].
5.2.4 BaEDTA2- and BaEDTA2- stability constant comparison with literature data
A comparison of the determined metal-EDTA stability constants at zero ionic strength with available
literature data is shown in table 7. The stability constants taken from literature were extrapolated to zero
ionic strength using Davies equation [STU12], (using the additive term 0.2·Im instead of the, by Davies,
originally proposed value of 0.3·Im [DAV62]).

25
Table 7 - Comparison of reported stability constants for the formation of BaEDTA and RaEDTA
Method Metal
ion Ionic medium
Temperature
(ºC)
Reported
log10β
Extrapolated to
zero ionic
strength log10β0
Reference
Ion
exchange Ba2+
0.2; 0.5; 1; 2;
2.5 (NaCl) 25.1 Table 8 9.88±0.11 This work
Review Ba2+ 0.1 25 7.86 9.64
Smith and
Martell
[MAR74]
pH Ba2+ 0.1 (KCl) 20 7.76 9.54
Schwarzen
bach et al
[SCH47]
pH Ba2+ 0 25 7.73 7.73 Carini et
al[CAR54]
pH Ba2+ 0.1 25 7.9 9.68 Schmid et
al [SCH56]
Ion
exchange Ba2+ 0 25 9.92 9.92
Astakhov
and
Fomenko
[AST57]
pH Ba2+ 0.1 (KNO3) 25 7.63 9.41
Bohigian et
al
[BOH60]
Paper
electropho
resis
Ba2+ 0.1 (KNO3) 20 8 9.78 Jokl et
al[JOK65]
pH Ba2+ 0.1 (KNO3 or
(CH3)4N(NO3)) 25 7.8 9.58
Delgado et
al
[DEL82]
Ion
exchange Ra2+
0.2; 0.5; 1; 2;
2.5 M (NaCl) 25.1 Table 8 9.11±0.09 This work
Ion
exchange Ra2+ 0.1 Mb 20b 7.12 8.9
Nikolsky et
al [NIK59]
Ion
exchange Ra2+
0.1 M (sodium
salt)c 20 7.07c 9.22c
Baetsle and
Bengsch
[BAE62]
Ion
exchange Ra2+
0.1 M
(NaClO4) 25 7.7 9.29
Sekine et al
[SEK68]
Estimated Ra2+ 0.1 25 7.4 9.2
Nelson et
al
[NEL60] b ionic strength and temperature were assumed, c contribution of the 0.01 mol·l-1 EDTA to the total ionic strength
has been taken into account

26
As can be seen from the data in table 7, there is a very small variation in ionic strengths used to determine
the stability constants. Without the data presented in this work, where stability constants are determined
several ionic strengths, including high ionic strengths, it would be impossible to determine ion interaction
coefficients, or ionic strength dependence of the stability constants. The extrapolation of the literature data
shown in table 7 to zero ionic strength is in good agreement with the value determined in the present work,
except for the value from Carini et al. [CAR54]. Consequently, this latter value is therefore disregarded.
Radium-EDTA complex formation has been studied previously by several researchers using both solvent
extraction and ion exchange methods. The experimental data from these studies have been reviewed
[AND13]. The first to study the RaEDTA2- complex formation was Nikolsky et. al. who obtained a log10K
value of 7.12 [NIK59], which value was extrapolated to zero ionic strength from the presumed ionic strength
and temperature 0.1 mol·l-1 and 20 °C respectively. This complex formation has also been studied by
Baetsle and Bengsch who used the Amberlite IR120 ion exchange resin at ionic strength 0.1 mol·l-1 at 20
°C and reported the log10K value as 7.07±0.06 [BAE62]. When studying the complex formation, an EDTA4-
concentration of 0.01 mol·l-1 with acetate buffer was used. As this EDTA4- concentration has a significant
contribution to the ionic strength which was not accounted for, the ionic strength was recalculated as 0.19
mol·l-1 before extrapolating to the value at zero ionic strength. Sekine et. al. used the solvent extraction
method using a 0.1 M tributylphosphate and 0.1 M thenoyltrifluoroacetone in CCl4 solution to study the
complex formation between Ra2+ in conjunction with different aminocarboxylic acids in 0.1 mol·l-1 NaClO4
at 25 °C. The log10K value for RaEDTA2- was obtained as 7.7 [SEK68]. Nelson and co-workers estimated
the stability constant for the RaEDTA2- complex as log10K=7.4 at ionic strength 0.1 mol·l-1 and 25 °C
[NEL60]. The obtained stability constant in this work for RaEDTA2- is in excellent agreement with the
literature data shown in table 7, when taking ionic strength, temperature differences and other factors
involved in the analysis of literature data (e.g. ionic strength corrections for EDTA4- concentration) into
account. The value obtained by Sekine et. al. is most likely the best value to compare with the stability
constants obtained in this work. Comparing these values at zero ionic strength gives a very good agreement.
All stability constants determined in this work for the MEDTA2- complex formation are shown in table 8.
Table 8 - Stability constants for MEDTA2- in NaCl at Im=0, 0.22, 0.51, 1.02, 2.09 and 2.64 (mol∙kg-1).
Im (mol∙kg-1) log10βRaEDTA log10βBaEDTA
0.00 (9.11±0.09) (9.88 ± 0.11)
0.22 (6.98±0.08) (7.61 ± 0.08)
0.51 (6.71±0.10) (7.32 ± 0.10)
1.02 (6.37±0.11)a (7.00 ± 0.11)
2.09 (6.36±0.15) (7.02 ± 0.14)
2.64 (6.50±0.18) (6.99 ± 0.18) a The ionic strength was slightly different, Im=1.03 (mol∙kg-1)
The log10β0
MEDTA stability constants determined in this work can also be compared to stability constants of
other alkaline earth metals at infinite dilution. The stability constant for the CaEDTA2- species formation is
recommended through an extensive data review by OECD NEA [NEA05], as log10β0=(12.69±0.06). Least
squares fitting of the log10β0MEDTA stability constants against the effective ionic radii in 8-fold coordination
yields a fit with r2=0.998, suggesting that the log10β0
MEDTA stability constants provided in this work are in
good agreement with the literature data. The linear fit can be seen in figure 8. It is important to note that
27
Mg2+ cannot be compared to Ca2+, Sr2+, Ba2+ and Ra2+ in regard to its EDTA complex formation, as Mg2+
has a smaller ionic radius than Ca2+, but still forms a weaker complex. The MgEDTA2- complex having a
smaller stability constant might be due to steric hindrance, as the radius might be too small for the six donor
groups of EDTA to be able to fit around the metal ion efficiently.
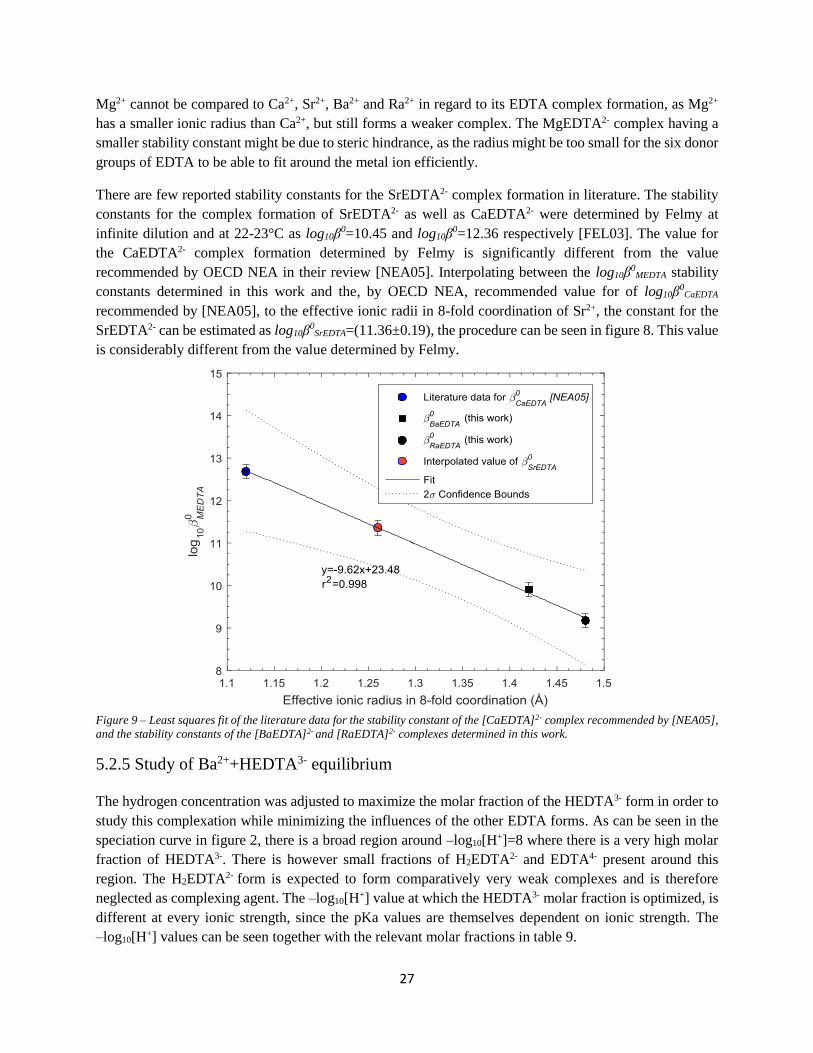
There are few reported stability constants for the SrEDTA2- complex formation in literature. The stability
constants for the complex formation of SrEDTA2- as well as CaEDTA2- were determined by Felmy at
infinite dilution and at 22-23°C as log10β0=10.45 and log10β
0=12.36 respectively [FEL03]. The value for
the CaEDTA2- complex formation determined by Felmy is significantly different from the value
recommended by OECD NEA in their review [NEA05]. Interpolating between the log10β0
MEDTA stability
constants determined in this work and the, by OECD NEA, recommended value for of log10β0CaEDTA
recommended by [NEA05], to the effective ionic radii in 8-fold coordination of Sr2+, the constant for the
SrEDTA2- can be estimated as log10β0SrEDTA=(11.36±0.19), the procedure can be seen in figure 8. This value
is considerably different from the value determined by Felmy.
Figure 9 – Least squares fit of the literature data for the stability constant of the [CaEDTA]2- complex recommended by [NEA05],
and the stability constants of the [BaEDTA]2- and [RaEDTA]2- complexes determined in this work.
5.2.5 Study of Ba2++HEDTA3- equilibrium
The hydrogen concentration was adjusted to maximize the molar fraction of the HEDTA3- form in order to
study this complexation while minimizing the influences of the other EDTA forms. As can be seen in the
speciation curve in figure 2, there is a broad region around –log10[H+]=8 where there is a very high molar
fraction of HEDTA3-. There is however small fractions of H2EDTA2- and EDTA4- present around this
region. The H2EDTA2- form is expected to form comparatively very weak complexes and is therefore
neglected as complexing agent. The –log10[H+] value at which the HEDTA3- molar fraction is optimized, is
different at every ionic strength, since the pKa values are themselves dependent on ionic strength. The
–log10[H+] values can be seen together with the relevant molar fractions in table 9.

28
Table 9 – Molar fractions of the different H(r-1)EDTA(r-5) forms in the different ionic strength sample series.
Im (mol∙kg-1) -log10[H+] 𝑥𝐸𝐷𝑇𝐴4− 𝑥𝐻𝐸𝐷𝑇𝐴3−
0.22 8.0 5.65·10-3 0.983
0.51 7.9 6.04·10-3 0.983
1.02 7.9 5.45·10-3 0.983
2.09 8.2 3.58·10-3 0.985
2.64 8.3 4.83·10-3 0.984
Even though the –log10[H+] values are slightly different at the different ionic strengths, the speciation is
very similar with respect to the molar fractions of the different HrEDTA(r-4) forms. As long as the molar
fractions are known, the system can be accurately described. The apparent stability constants for the
BaHEDTA- and complexes were derived from the experiments conducted at –log[H+] of 7.9-8.3 with mole
fraction of HEDTA3- ≥98% using the same method as for BaEDTA2- and RaEDTA2- complexes and
assuming formation of only BaHEDTA- according to the reaction shown in Eq. (18) where r=1. At ionic
strengths Im=0.22, 0.50, 1.02, 2.09 and 2.64 (mol∙kg-1) the distribution ratios of 133Ba are plotted against
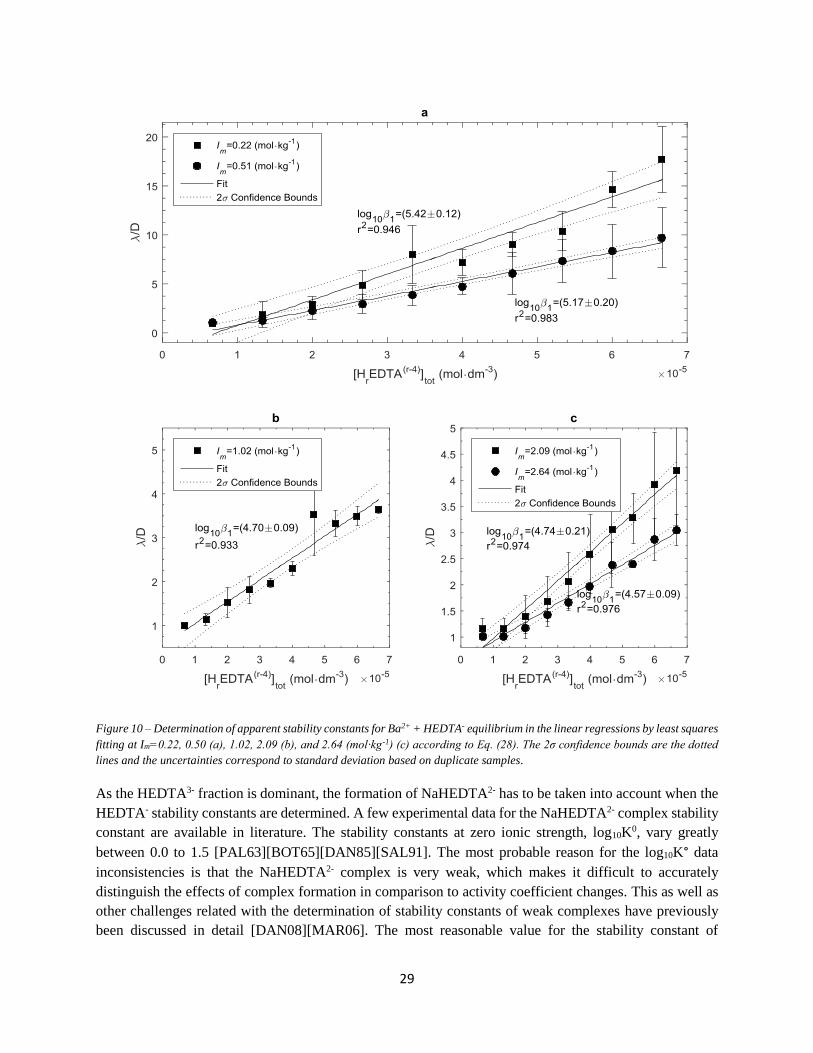
[HrEDTA(r-4)]tot in figure 10.
29
Figure 10 – Determination of apparent stability constants for Ba2+ + HEDTA- equilibrium in the linear regressions by least squares
fitting at Im=0.22, 0.50 (a), 1.02, 2.09 (b), and 2.64 (mol∙kg-1) (c) according to Eq. (28). The 2σ confidence bounds are the dotted
lines and the uncertainties correspond to standard deviation based on duplicate samples.
As the HEDTA3- fraction is dominant, the formation of NaHEDTA2- has to be taken into account when the
HEDTA- stability constants are determined. A few experimental data for the NaHEDTA2- complex stability
constant are available in literature. The stability constants at zero ionic strength, log10K0, vary greatly
between 0.0 to 1.5 [PAL63][BOT65][DAN85][SAL91]. The most probable reason for the log10K° data
inconsistencies is that the NaHEDTA2- complex is very weak, which makes it difficult to accurately
distinguish the effects of complex formation in comparison to activity coefficient changes. This as well as
other challenges related with the determination of stability constants of weak complexes have previously
been discussed in detail [DAN08][MAR06]. The most reasonable value for the stability constant of

30
NaHEDTA2- complex is conceivably the value stated by Palaty [PAL63]. Temperature was not given by
the author [PAL63], but based on all obtained values, it can be assumed that Na-EDTA equilibrium was
studied at 25 ºC. The author used ion selective electrodes to study EDTA dissociation and Na-EDTA
equilibrium and obtained values that are in good agreement with the values listed in table 5 and table 6.
Tetramethylammonium chloride was used as a background electrolyte and the total ionic strengths was 0.12
(mol·l-1). The reported stability constant at zero ionic strength for the NaHEDTA2- complex was log10K°=-
0.03. The reported value by Palaty is subject to some uncertainty and it can be assumed that the actual
log10K° value at zero ionic strength is in the range of -0.5 to 0.5 (i.e. log10K0=(0.0±0.5)). Presumably, the
ascription of such a high uncertainty for the stability constant of this weak complex is the only way to
overcome the lack of reliable data. The proposed uncertainty is in agreement with Marcus and Hefter who
stated that for weak complex formation, the accuracy of the constant is difficult to estimate by experiments
or theoretical approximations [MAR06].
To be able to extrapolate the NaHEDTA2- log10K° value of (0.0±0.5) to the ionic strengths used in this work,
it is important to know the SIT interaction parameters: ε(Na+, Cl-), ε(Na+, HEDTA3-) and ε(Na+,
NaHEDTA2-). The first two parameters and their associated uncertainties are available in literature
[GUI03][HUM05], and the last parameter has never been reported. Comparison of sodium SIT ion
interaction coefficients with numerous different anionic ligands shows that this parameter typically varies
between -0.3 to 0.1 [GUI03]. Furthermore, the sodium SIT interaction coefficients with ligands similar to
H2EDTA2- is –(0.37±0.14) [HUM05]. Based on these values, the ε(Na+, NaHEDTA2-) SIT parameter has
therefore been estimated as -(0.2±0.3) kg·mol-1, where a substantial uncertainty has been assigned. All the
coefficients associated with NaHEDTA2- complexation (Eq. 37) that are necessary in this work are listed
in table 10.
Table 10. Stability constants and SIT ion interaction parameters for the NaHEDTA2- complex formation (Eq. 37) at 25 ºC
Parameter Value Reference
log10K° (0±0.5) Estimated in this work, based on available
experimental data from Palaty [PAL63]
ε(Na+,Cl-) (0.03±0.01) Guillaumont et al. [GUI03]
ε(Na+,HEDTA3-) -(0.1±0.14) Hummel et al. [HUM05]
ε(Na+,NaHEDTA2-) -(0.2 ± 0.3) Estimated in this work
Assuming that the BaHEDTA- complex is the complex causing the redistribution of the Ba2 ions, the SIT
methodology can be applied to the apparent stability constants determined. The resulting linear regression
can be seen in figure 11.
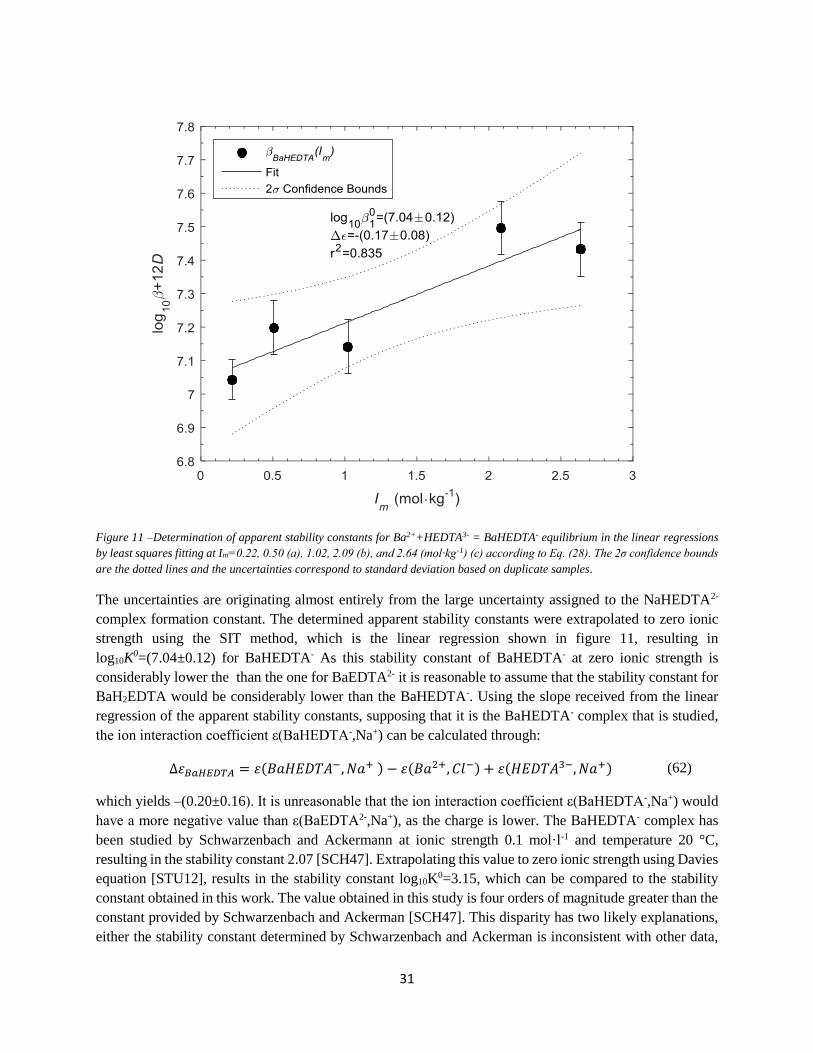
31
Figure 11 –Determination of apparent stability constants for Ba2++HEDTA3- = BaHEDTA- equilibrium in the linear regressions
by least squares fitting at Im=0.22, 0.50 (a), 1.02, 2.09 (b), and 2.64 (mol∙kg-1) (c) according to Eq. (28). The 2σ confidence bounds
are the dotted lines and the uncertainties correspond to standard deviation based on duplicate samples.
The uncertainties are originating almost entirely from the large uncertainty assigned to the NaHEDTA2-
complex formation constant. The determined apparent stability constants were extrapolated to zero ionic
strength using the SIT method, which is the linear regression shown in figure 11, resulting in
log10K0=(7.04±0.12) for BaHEDTA- As this stability constant of BaHEDTA- at zero ionic strength is
considerably lower the than the one for BaEDTA2- it is reasonable to assume that the stability constant for
BaH2EDTA would be considerably lower than the BaHEDTA-. Using the slope received from the linear
regression of the apparent stability constants, supposing that it is the BaHEDTA- complex that is studied,
the ion interaction coefficient ε(BaHEDTA-,Na+) can be calculated through:
∆𝜀𝐵𝑎𝐻𝐸𝐷𝑇𝐴 = 𝜀(𝐵𝑎𝐻𝐸𝐷𝑇𝐴−, 𝑁𝑎+ ) − 𝜀(𝐵𝑎2+, 𝐶𝑙−) + 𝜀(𝐻𝐸𝐷𝑇𝐴3−, 𝑁𝑎+) (62)
which yields –(0.20±0.16). It is unreasonable that the ion interaction coefficient ε(BaHEDTA-,Na+) would
have a more negative value than ε(BaEDTA2-,Na+), as the charge is lower. The BaHEDTA- complex has
been studied by Schwarzenbach and Ackermann at ionic strength 0.1 mol·l-1 and temperature 20 °C,
resulting in the stability constant 2.07 [SCH47]. Extrapolating this value to zero ionic strength using Davies
equation [STU12], results in the stability constant log10K0=3.15, which can be compared to the stability
constant obtained in this work. The value obtained in this study is four orders of magnitude greater than the
constant provided by Schwarzenbach and Ackerman [SCH47]. This disparity has two likely explanations,
either the stability constant determined by Schwarzenbach and Ackerman is inconsistent with other data,
32
or it is not the BaHEDTA- complex that is formed according to Eq. (18), where r=1, as log10[H+] is in the
range of 7.9-8.3. In order to check the former hypothesis, the data provided by Schwarzenbach and
Ackermann can be compared with literature data where stability constants of EDTA4- and HEDTA3- with
various metals has been studied [MAR74][SCH54]. Comparing constants obtained under the same
experimental conditions, a linear Gibbs free energy analysis, i.e. a plot of stability constants for a variety
of metal ions with charge n ≥2 together with EDTA4- and HEDTA3- according to Eq. (18), can be performed,
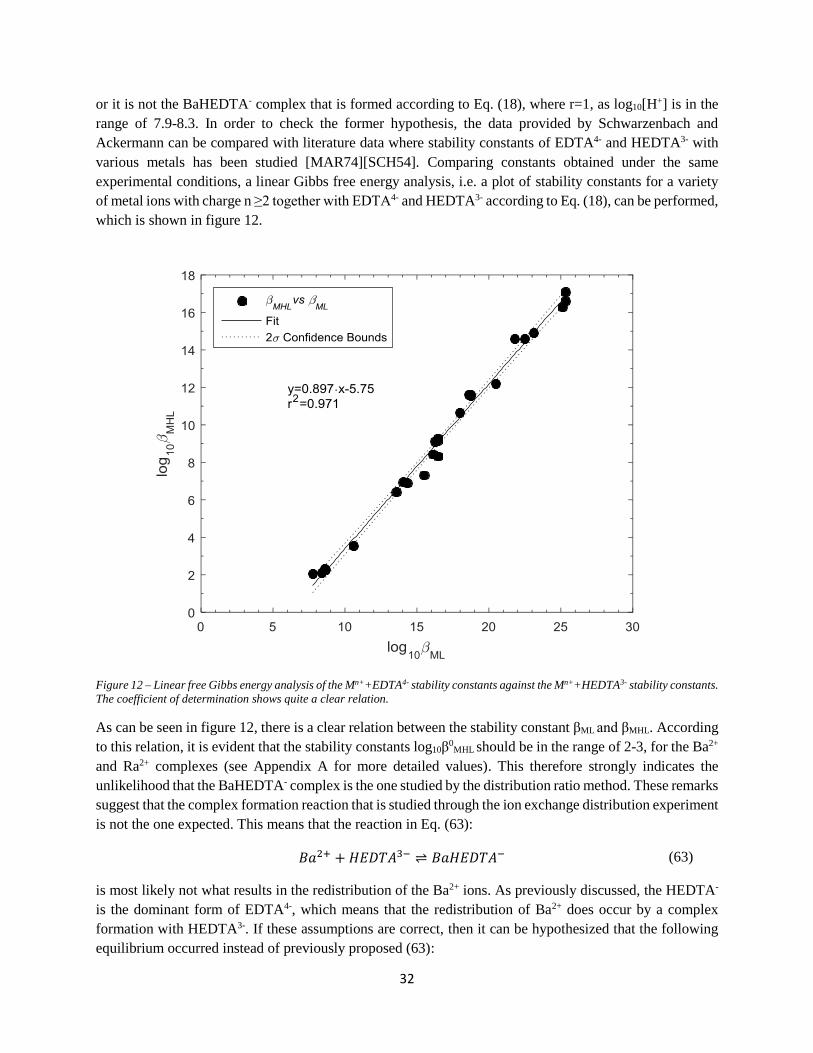
which is shown in figure 12.
Figure 12 – Linear free Gibbs energy analysis of the Mn++EDTA4- stability constants against the Mn++HEDTA3- stability constants.
The coefficient of determination shows quite a clear relation.
As can be seen in figure 12, there is a clear relation between the stability constant βML and βMHL. According
to this relation, it is evident that the stability constants log10β0MHL should be in the range of 2-3, for the Ba2+
and Ra2+ complexes (see Appendix A for more detailed values). This therefore strongly indicates the
unlikelihood that the BaHEDTA- complex is the one studied by the distribution ratio method. These remarks
suggest that the complex formation reaction that is studied through the ion exchange distribution experiment
is not the one expected. This means that the reaction in Eq. (63):
𝐵𝑎2+ + 𝐻𝐸𝐷𝑇𝐴3− ⇌ 𝐵𝑎𝐻𝐸𝐷𝑇𝐴− (63)
is most likely not what results in the redistribution of the Ba2+ ions. As previously discussed, the HEDTA-
is the dominant form of EDTA4-, which means that the redistribution of Ba2+ does occur by a complex
formation with HEDTA3-. If these assumptions are correct, then it can be hypothesized that the following
equilibrium occurred instead of previously proposed (63):
33
𝐵𝑎2+ + 𝐻𝐸𝐷𝑇𝐴3− ⇌ 𝐵𝑎𝐸𝐷𝑇𝐴2− + 𝐻+ (64)
with stability constant:
𝛽𝐵𝑎𝐸𝐷𝑇𝐴+𝐻
=[𝐵𝑎𝐸𝐷𝑇𝐴2−][𝐻+]
[𝐵𝑎2+][𝐻𝐸𝐷𝑇𝐴3−] (65)
The assumption that the reaction that has been studied in the one defined in Eq. (64) has to be motivated
thoroughly. The redistribution of barium using the ion exchange method only takes the ligand and barium
concentrations into account, i.e. the acid dissociation of the ligand during the complex formation reaction
cannot be appropriately taken into account by the redistribution method only. According to Eq. (65), the
apparent stability constants βBaEDTA+H are equal to the apparent stability constants determined using the
distribution ratio method, and subsequently corrected for the ionic media ligand complex formation,
multiplied by the hydrogen concentration. The recalculated apparent stability constants for the
BaEDTA2-+H+ complex formation reaction can be seen in table 11.
Table 11 – Apparent stability constants determined according to the reaction shown in Eq. (65).
Im (mol∙kg-1) log10βBaEDTA+H
0.00 -(1.41±0.12)
0.22 -(2.63±0.06)
0.51 -(2.80±0.08)
1.02 -(3.21±0.08)
2.09 -(3.49±0.08)
2.64 -(3.75±0.08)
Using the SIT methodology, the stability constant at zero ionic strength for the equilibrium shown in Eq.
(64) is calculated as log10β0=-(1.41±0.12), with a slope of (0.14±0.08). The ion interaction coefficient
ε2(BaEDTA2-,Na+) can therefore be calculated as –(0.01±0.16), and is in good agreement with the value
determined for the BaEDTA2- complex in section 5.2.2. The SIT linear regression applied to the apparent
stability constants given in table 11 is shown in figure 13.

34
Figure 13 – Extrapolation of stability constants of BaEDTA2+H+ = BaEDTA + H equilibrium to zero ionic strength using SIT.
It could be worth mentioning that the coefficient of determination is not very indicative of the accuracy of
the fit for low slopes, as the one shown in figure 13, because of the mathematical properties of r2 are such
that it is equal to zero for a slope of zero [MIL02]. The stability constants for the suggested reaction shown
in Eq. (64) can also be expressed through definitions of other stability constants in the specified
experimental system:
𝛽𝐵𝑎𝐸𝐷𝑇𝐴+𝐻
=[𝐵𝑎𝐸𝐷𝑇𝐴2−][𝐻+]
[𝐵𝑎2+][𝐻𝐸𝐷𝑇𝐴3−]=
𝛽𝐵𝑎𝐸𝐷𝑇𝐴[𝐵𝑎2+][𝐸𝐷𝑇𝐴4−][𝐻+]
[𝐵𝑎2+][𝐻𝐸𝐷𝑇𝐴3−]= 𝛽𝐵𝑎𝐸𝐷𝑇𝐴 ∙ 𝐾𝑎,1
(66)
Using the previously determined stability constant log10β0BaEDTA, the stability constant log10β0
BaEDTA+H at
zero ionic strength can be calculated as -(1.36±0.13). This is in good agreement with the stability constant
determined, which is strong evidence for the occurrence of reaction (64) under the studied experimental
conditions.

35
5.2.6 RaHEDTA- stability constant determination
At ionic strengths Im=0.22, 0.50, 1.02, 2.09 and 2.64 (mol∙kg-1) the distribution ratios of 226Ra are plotted
against [HrEDTA(r-4)]tot according to Eq. (28) in figure 14.
Figure 14 – Determination of apparent stability constants for Ra2++HEDTA3- equilibrium in the linear regressions by least squares
fitting at Im=0.22, 0.50 (a), 1.02, 2.09 (b), and 2.64 (mol∙kg-1) (c) according to Eq. (28). The 2σ confidence bounds are the dotted
lines and the uncertainties correspond to standard deviation based on duplicate samples.

36
Since the complex formation between Ba2+ and HEDTA3- did not mainly form the complex BaHEDTA-, it
is highly unlikely that the RaHEDTA- complex is formed under identical experimental conditions, with the
only exception that the metal ion is replaced by Ra2+, because of the very similar chemistry of these two
alkaline earth metal ions in solution. As the apparent stability constants obtained from the BaHEDTA-
analysis could easily be converted into the constants describing the highly likely occurring reaction shown
in Eq. (64), the SIT methodology is also here applied to the data received from the distribution ratio
experimental data shown in figure 14. The linear regression of the applied SIT methodology is shown in
figure 15.
Figure 15 – Determination of apparent stability constants for Ba2++HEDT-3-=BaHEDTA- equilibrium in the linear regressions by
least squares fitting at Im=0.22, 0.50 (a), 1.02, 2.09 (b), and 2.64 (mol∙kg-1) (c) according to Eq. (28). The 2σ confidence bounds
of the fit are the dotted lines and the uncertainties correspond to standard deviation based on duplicate samples.
The radium stability constant for the redistribution of radium between the aqueous phase and the resin phase
is, as discussed in the previous section, is not for the RaHEDTA- complex. The redistribution therefore
occurs through:
𝑅𝑎2+ + 𝐻𝐸𝐷𝑇𝐴3− ⇌ 𝑅𝑎𝐸𝐷𝑇𝐴2− + 𝐻+ (67)
with stability constant:
𝛽𝑅𝑎+𝐻𝐸𝐷𝑇𝐴
=[𝑅𝑎𝐸𝐷𝑇𝐴2−][𝐻+]
[𝑅𝑎2+][𝐻𝐸𝐷𝑇𝐴3−] (68)
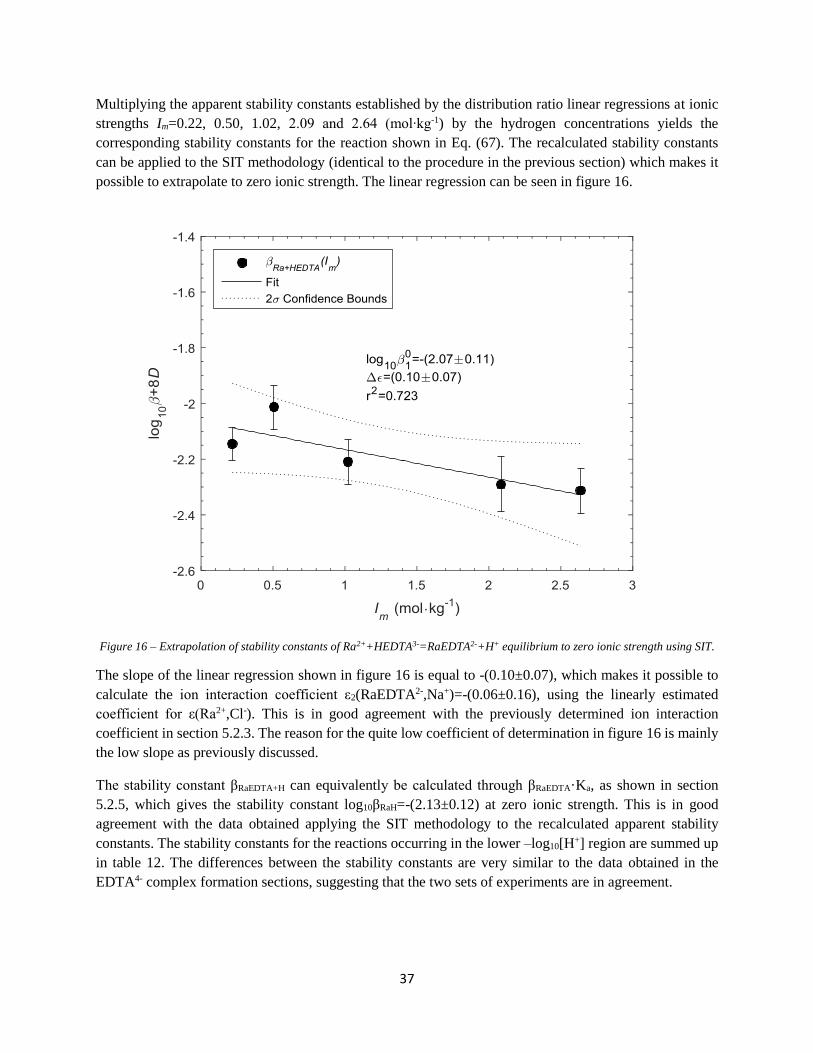
37
Multiplying the apparent stability constants established by the distribution ratio linear regressions at ionic
strengths Im=0.22, 0.50, 1.02, 2.09 and 2.64 (mol∙kg-1) by the hydrogen concentrations yields the
corresponding stability constants for the reaction shown in Eq. (67). The recalculated stability constants
can be applied to the SIT methodology (identical to the procedure in the previous section) which makes it
possible to extrapolate to zero ionic strength. The linear regression can be seen in figure 16.
Figure 16 – Extrapolation of stability constants of Ra2++HEDTA3-=RaEDTA2-+H+ equilibrium to zero ionic strength using SIT.
The slope of the linear regression shown in figure 16 is equal to -(0.10±0.07), which makes it possible to
calculate the ion interaction coefficient ε2(RaEDTA2-,Na+)=-(0.06±0.16), using the linearly estimated
coefficient for ε(Ra2+,Cl-). This is in good agreement with the previously determined ion interaction
coefficient in section 5.2.3. The reason for the quite low coefficient of determination in figure 16 is mainly
the low slope as previously discussed.
The stability constant βRaEDTA+H can equivalently be calculated through βRaEDTA·Ka, as shown in section
5.2.5, which gives the stability constant log10βRaH=-(2.13±0.12) at zero ionic strength. This is in good
agreement with the data obtained applying the SIT methodology to the recalculated apparent stability
constants. The stability constants for the reactions occurring in the lower –log10[H+] region are summed up
in table 12. The differences between the stability constants are very similar to the data obtained in the
EDTA4- complex formation sections, suggesting that the two sets of experiments are in agreement.

38
Table 12 – Stability constants of reaction (64) determined by recalculating the apparent stability constants determined by the
distribution ratio calculations.
Im (mol∙kg-1) log10βRaEDTA+H log10βBaEDTA+H
0.00 -(2.07±0.11) -(1.41±0.12)
0.22 -(3.26±0.06) -(2.63±0.06)
0.51 -(3.42±0.08) -(2.80±0.08)
1.02 -(3.85±0.08)b -(3.21±0.08)
2.09 -(4.15±0.10) -(3.49±0.08)
2.64 -(4.24±0.08) -(3.75±0.08)
The importance of the Na+HrEDTA(r-4) complex formation was under all experimental conditions of
significant magnitude. The comparison of the apparent stability constants with and without taking the
sodium effect into account is shown in tables 13 and 14 below.
Table 13 – Apparent stability constants at ionic strengths Im=0.22, 0.51, 1.02, 2.09 and 2.64 (mol∙kg-1) without the sodium ligand
interaction taken into account.
Im (mol∙kg-1) log10βRaEDTA log10βRaEDTA+H log10βBaEDTA log10βBaEDTA+H
0.22 (5.89±0.11) -(3.29±0.14) (6.63±0.06) -(2.58±0.12)
0.51 (5.41±0.08) -(3.44±0.20) (6.14±0.06) -(2.73±0.20)
1.02 (5.05±0.23)b -(3.90±0.15) (5.58±0.15) -(3.20±0.09)
2.09 (4.82±0.13) -(4.19±0.09) (5.34±0.13) -(3.46±0.21)
2.64 (4.68±0.15) -(4.19±0.22) (5.21±0.09) -(3.73±0.09) b The ionic strength was slightly different, Im=1.03 (mol∙kg-1)
Table 14 - Sodium-EDTA corrected apparent stability constants in NaCl at ionic strengths Im=0.22, 0.51, 1.02, 2.09 and 2.64
(mol∙kg-1).
Im (mol∙kg-1) log10βRaEDTA log10βRaEDTA+H log10βBaEDTA log10βBaEDTA+H
0.22 (6.97±0.11) -(3.19±0.14) (7.74±0.06) -(2.52±0.12)
0.51 (6.69±0.08) -(3.32±0.20) (7.40±0.06) -(2.68±0.20)
1.02 (6.49±0.23)b -(3.71±0.15)b (7.05±0.15) -(3.15±0.09)
2.09 (6.63±0.13) -(3.94±0.09) (7.17±0.13) -(3.32±0.21)
2.64 (6.67±0.15) -(3.90±0.22) (7.22±0.09) -(3.58±0.09) b The ionic strength was slightly different, Im=1.03 (mol∙kg-1)
As is shown in tables 13 and 14, the sodium-EDTA correction was not as significant for the HEDTA3-
cases, as would be expected from the much lower equilibrium constant for this complex formation.
5.3 Specific ion interaction coefficients
The SIT ion interaction coefficient terms were solved for the ε(MH(r-n)EDTA(r-n-3),Na+) interaction according
to Eq. (14):
∆𝜀 = 𝜀(𝑐𝑜𝑚𝑝𝑙𝑒𝑥, 𝑁 𝑜𝑟 𝑋 ) − 𝑞𝜀(𝑁, 𝐿) − 𝑚𝜀(𝑀, 𝑋) + 𝑛𝜀(𝐻, 𝑋) (14)
The ion interaction coefficients taken from literature and the ones established in this work can be found in
table 15. The ε(MH(r-n)EDTA(r-n-3),Na+) SIT ion interaction coefficients are calculated using the estimated
ε(Ra2+,Cl-) value.
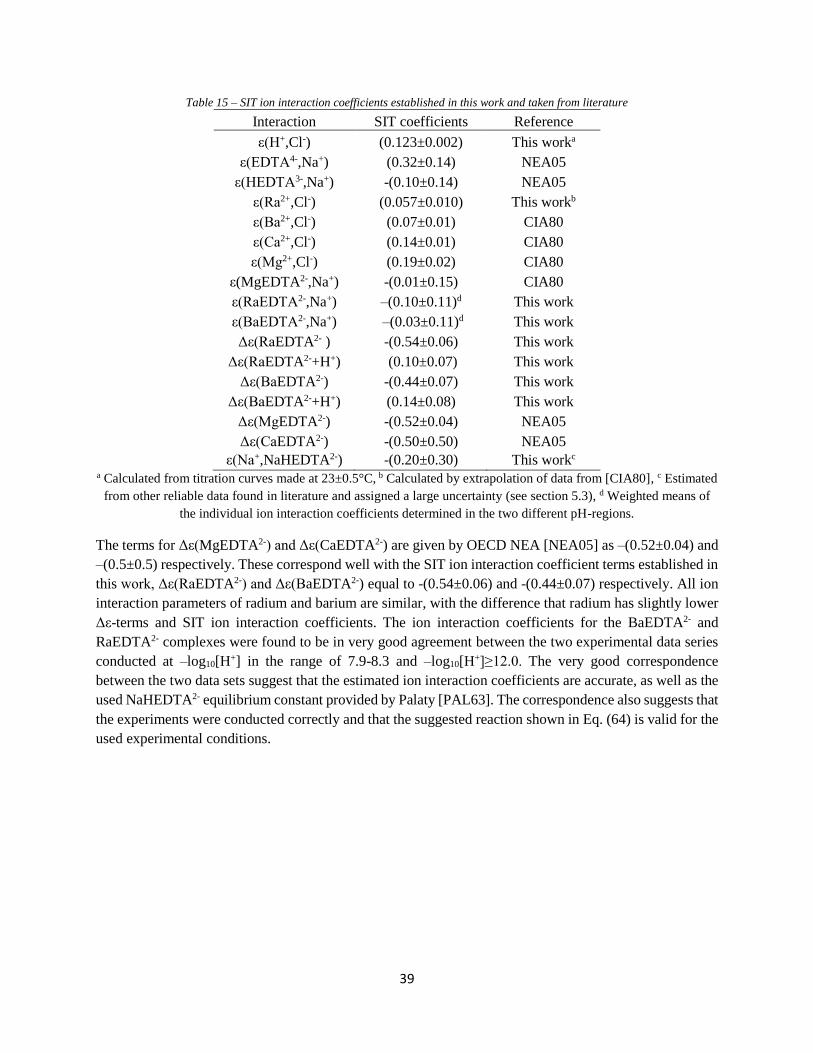
39
Table 15 – SIT ion interaction coefficients established in this work and taken from literature
Interaction SIT coefficients Reference
ε(H+,Cl-) (0.123±0.002) This worka
ε(EDTA4-,Na+) (0.32±0.14) NEA05
ε(HEDTA3-,Na+) -(0.10±0.14) NEA05
ε(Ra2+,Cl-) (0.057±0.010) This workb
ε(Ba2+,Cl-) (0.07±0.01) CIA80
ε(Ca2+,Cl-) (0.14±0.01) CIA80
ε(Mg2+,Cl-) (0.19±0.02) CIA80
ε(MgEDTA2-,Na+) -(0.01±0.15) CIA80
ε(RaEDTA2-,Na+) –(0.10±0.11)d This work
ε(BaEDTA2-,Na+) –(0.03±0.11)d This work
Δε(RaEDTA2- ) -(0.54±0.06) This work
Δε(RaEDTA2-+H+) (0.10±0.07) This work
Δε(BaEDTA2-) -(0.44±0.07) This work
Δε(BaEDTA2-+H+) (0.14±0.08) This work
Δε(MgEDTA2-) -(0.52±0.04) NEA05
Δε(CaEDTA2-) -(0.50±0.50) NEA05
ε(Na+,NaHEDTA2-) -(0.20±0.30) This workc a Calculated from titration curves made at 23±0.5°C, b Calculated by extrapolation of data from [CIA80], c Estimated
from other reliable data found in literature and assigned a large uncertainty (see section 5.3), d Weighted means of
the individual ion interaction coefficients determined in the two different pH-regions.
The terms for Δε(MgEDTA2-) and Δε(CaEDTA2-) are given by OECD NEA [NEA05] as –(0.52±0.04) and
–(0.5±0.5) respectively. These correspond well with the SIT ion interaction coefficient terms established in
this work, Δε(RaEDTA2-) and Δε(BaEDTA2-) equal to -(0.54±0.06) and -(0.44±0.07) respectively. All ion
interaction parameters of radium and barium are similar, with the difference that radium has slightly lower
Δε-terms and SIT ion interaction coefficients. The ion interaction coefficients for the BaEDTA2- and
RaEDTA2- complexes were found to be in very good agreement between the two experimental data series
conducted at –log10[H+] in the range of 7.9-8.3 and –log10[H+]≥12.0. The very good correspondence
between the two data sets suggest that the estimated ion interaction coefficients are accurate, as well as the
used NaHEDTA2- equilibrium constant provided by Palaty [PAL63]. The correspondence also suggests that
the experiments were conducted correctly and that the suggested reaction shown in Eq. (64) is valid for the
used experimental conditions.

40
6. Conclusion
The apparent stability constants of barium and radium EDTA complexes were determined over a wide range
of NaCl concentrations (0.2-2.5 M) at –log10[H+] ~8 and 12.4 at 25 °C. Determined stability constants were
then extrapolated to zero ionic strength using the SIT methodology. The determined stability constants and
ion interaction coefficients are important for describing the dissolution of Ba(Ra)SO4 co-precipitate using
EDTA, especially at high ionic strengths.
pH has a considerable influence on the stability constants at zero ionic strength of complex formation
between alkaline earth metals and EDTA. The stability constants at infinite dilution for the complex formed
in the high pH region are log10*β0
Ba,0,1=(9.88±0.11) and log10*β0
Ra,0,1=(9.11±0.09). These stability constants
are in excellent agreement with values previously published in literature. As all previously experimentally
determined stability constants were provided at low ionic strength, there was no possibility of calculating
ion interaction coefficients. To the best of our knowledge, the ion interaction coefficient terms of radium
were experimentally determined for the first time in this work: Δε(BaEDTA2-)=-(0.44±0.07) and
Δε(RaEDTA2-)=-(0.54±0.06). This makes it possible to calculate the ion interaction coefficients
ε(BaEDTA2-,Na+)=-(0.03±0.11) and ε(RaEDTA2-,Na+)=-(0.10±0.11). The BaEDTA2-+H+ and RaEDTA2-
+H+ complex formation reactions have stability constants log10*β0
BaEDTA+H=-(1.41±0.12) and
log10*β0
RaEDTA+H=-(2.07±0.11). The proposed formation reactions fit the experimental data very accurately,
providing ion interaction coefficients that are consistent with the ones determined in the high pH region.
Thus, comparisons of the ion interaction coefficients, and therefore the ionic strength dependence of Ba2+
and Ra2+ in NaCl-EDTA4- systems can be performed. The difference in stability constants in log units
between the MEDTA2- complex formation reactions is very similar to the corresponding difference between
the M2++HEDTA3- complex formation reactions. The difference in stability constants in log units between
the MEDTA2- and the M2++HEDTA3- reactions is also very similar between radium and barium, indicating
that the differences between radium and barium complex formation are quite consistent between different
experimental conditions. A comparison of the obtained values at zero ionic strength indicate that Ba2+ and
Ra2+ complex formation with EDTA4- and HEDTA3- is mostly electrostatic. The similarity of the barium
and radium ion interaction parameters indicates that both metal ions undergo very similar short- and long-
range electrostatic interactions with EDTA4- and Cl-. The results also show that using the SIT interaction
parameters of Ba2+ as a substitute for Ra2+ SIT interaction parameters that are unavailable could be a
potentially useful tool for the Ra2+–NaCl–EDTA4- system taking into account the uncertainties of associated
ion interaction coefficients.
The distribution method can be a powerful tool for studying complex formation reactions occurring in the
Ra2+/Ba2+-NaCl-EDTA4- systems. When investigating complex formations in Ra2+-Ba2+-Na-Cl systems, the
use of the ion exchange resin method would be advocated for future experimental work as it effectively
circumvents issues of working with substantial amounts of radioactivity. It is also an effective method for
studies at high ionic strength, making it useful for the determination of ion interaction coefficients.

41
7. Future work
There is in general a lack of radium thermodynamic properties and also organic ligand ion interaction
coefficients, therefore determination of these could contribute to the understanding of their chemistry in
solution. A thorough and precise determination of ε(Ra2+,Cl-) would also be useful for future complex
formation reactions of alkaline earth metals in NaCl media. Complex formation reactions that would be
interesting in future studies would for example be a precise determination of the ISA- complex formation
with Ba2+ and Ra2+, which would be relevant for repository conditions, as well as other particularly strong
complex formation reactions with other organic complexing ligands, such as DOTA or cryptands.

42
8. Acknowledgements
I would really like to thank my exceptional supervisor Artem Matyskin for putting up with my endless
questions and guiding me through this challenging and interesting project, from which I’ve learned very
much. I am also very grateful to Christian Ekberg and Paul Brown, who have provided very valuable and
insightful contributions to the analysis of the data. A big thanks to everyone at nuclear chemistry and
industrial materials recycling for being helpful and in general lovely people. Last but not least I also thank
Olivia for all her wonderful support.
43
9. References
[ALL05] [Allard, S. (2005). Investigations of α-D-isosaccharinate: fundamental properties and
complexation. Chalmers University of Technology.]
[ALL06] [Allard, S., & Ekberg, C. (2006). Complexing properties of α-isosaccharinate: thorium.
Radiochimica Acta, 94(9-11), 537-540.]
[AND13] [G. Anderegg (2013), Critical Survey of Stability Constants of EDTA Complexes: Critical
Evaluation of Equilibrium Constants in Solution: Stability Constants of Metal Complexes, Elsevier.]
[AST57] [Astakhov, K.V. and Fomenko, M.G., (1957). The use of calcium-45 isotope for the determination
of the instability constants of intracomplex compunds of alkali earth metals with ethylevediaminetetraacetic
acid. Zhur. Fiz. Khim., 31, 2110-2120.]
[ATK09] [Atkins, P., De Paula, J., & Friedman, R. (2009). Quanta, matter, and change: a molecular
approach to physical chemistry. Oxford University Press.]
[BAE62] [L. Baetsle, E. Bengsch (1962), Ion-exchange characteristics of the radium-ethylene-
diaminetetraacetate complex, Journal of Chromatography A, 8, 265-273.]
[BOH60] [T. Bohigian, A. Martell (1960), Progress Report US Atomic Energy Comm, Contract No.
AT,(30-1)-1823, DOI.]
[BOT65] [J. Botts, A. Chashin, H.L. Young (1965), Alkali Metal Binding by Ethylenediaminetetraacetate,
Adenosine 5'-Triphosphate, and Pyrophosphate*, Biochemistry, 4 1788-1796.]
[BRU06] [Bruland, Ø. S., Nilsson, S., Fisher, D. R., & Larsen, R. H. (2006). High-linear energy transfer
irradiation targeted to skeletal metastases by the α-emitter 223Ra: adjuvant or alternative to conventional
modalities?. Clinical Cancer Research, 12(20), 6250s-6257s.]
[BRU08] [Bruland, O. S., Jonasdottir, T. J., Fisher, D. R., & Larsen, R. H. (2008). Radium-223: From
radiochemical development to clinical applications in targeted cancer therapy. Current
Radiopharmaceuticals, 1(3), 203-208.]
[CAR07] [Cartwright, A. J., May, C. C., Worsfold, P. J., & Keith-Roach, M. J. (2007). Characterisation of
thorium–ethylenediaminetetraacetic acid and thorium–nitrilotriacetic acid species by electrospray
ionisation-mass spectrometry. Analytica chimica acta, 590(1), 125-131.]
[CAR07b] [F.P. Carvalho, M.G. Madruga, M.C. Reis, J.G. Alves, J.M. Oliveira, J. Gouveia and L. Silva
(2007). Radioactivity in the environment around past Ra and U mining sites of Portugal, Journal of
Environmental Radioactivity, 96, pp. 39-46.]
[CAR54] [F.F. Carini, A.E. Martell (1954), Thermodynamic quantities associated with the interaction
between ethylenediaminetetraacetate and alkaline earth ions, Journal of the American Chemical Society,
76, 2153-2157.]
[CAR98] [McCarthy, J. F., Czerwinski, K. R., Sanford, W. E., Jardine, P. M., & Marsh, J. D. (1998).
Mobilization of transuranic radionuclides from disposal trenches by natural organic matter. Journal of
Contaminant Hydrology, 30(1), 49-77.]

44
[CHI98] [Chiarizia, R., Horwitz, E. P., Dietz, M. L., & Cheng, Y. D. (1998). Radium separation through
complexation by aqueous crown ethers and extraction by dinonylnaphthalenesulfonic acid. Reactive and
Functional Polymers, 38(2), 249-257.]
[CHI99] [Chiarizia, R., Dietz, M. L., Horwitz, E. P., Burnett, W. C., & Cable, P. H. (1999). Radium
separation through complexation by aqueous crown ethers and ion exchange or solvent extraction.
Separation science and technology, 34(6-7), 931-950.]
[CIA80] [Ciavatta, L. (1980). The specific interaction theory in evaluating ionic equilibria. Ann. Chim, 70,
551-567.]
[COX82] [Cox, J. D. (1982). Notation for states and processes, significance of the word standard in
chemical thermodynamics, and remarks on commonly tabulated forms of thermodynamic functions. Pure
and Applied Chemistry, 54(6), 1239-1250.]
[DAN08] [P.G. Daniele, C. Foti, A. Gianguzza, E. Prenesti, S. Sammartano (2008), Weak alkali and
alkaline earth metal complexes of low molecular weight ligands in aqueous solution, Coordination
Chemistry Reviews, 252 1093-1107.]
[DAN85] [P.G. Daniele, C. Rigano, S. Sammartano (1985), Ionic strength dependence of formation
constants. Alkali metal complexes of ethylenediaminetetraacetate nitrilotriacetate, diphosphate, and
tripolyphosphate in aqueous solution, Analytical Chemistry, 57 2956-2960.]
[DAV62] [C.W. Davies (1962), Ion association, Butterworths.]
[DEL82] [R. Delgado, J.F. Da Silva (1982), Metal complexes of cyclic tetra-azatetra-acetic acids, Talanta,
29, 815-822.]
[DIC90] [Dickson, B. L. (1990). Radium in groundwater. The environmental behaviour of radium, 1, 335-
372.]
[EIS97] [Eisenbud, M., & Gesell, T. F. (1997). Environmental Radioactivity from Natural, Industrial &
Military Sources: From Natural, Industrial and Military Sources. Academic press.]
[ESC96] [Escandar, G. M., Peregrin, J. M. S., Sierra, M. G., Santoro, M., Frutos, A. A., Garci, S. I., & Sala,
L. F. (1996). Interaction of divalent metal ions with d-gluconic acid in the solid phase and aqueous
solution. Polyhedron, 15(13), 2251-2261.]
[GAL78] [Galindo, G., & Zunino, H. (1978). Some limiting factors of the ion-exchange equilibrium method
for determining apparent formation constants of mononuclear complexes. Talanta, 25(8), 447-450.]
[GHA09] [Gharib, F., Jabbari, M., & Farajtabar, A. (2009). Interaction of dioxouranium (VI) ion with EDTA
at different ionic strengths. Journal of Molecular Liquids, 144(1), 5-8.]
[GME77] [Gmelin Handbuch der Anorganische Chemie, 1977. Radium. 8th ed.; Springer, Berlin, p. 372.]
[GRA52] [Gran, G. (1952) Determination of the Equivalence Point in Potentiometric Titration, Part
II, Analyst 77, 661-671.]
[GRE00] [Grenthe, I., & Wanner, H. (2000). Guidelines for the extrapolation to zero ionic strength.]

45
[GUI03] [R. Guillaumont, T. Fanghänel, V. Neck, J. Fuger, D.A. Palmer, I. Grenthe, M.H. Rand (2003),
Update on the chemical thermodynamics of uranium, neptunium, plutonium, americium and technetium,
Elsevier.]
[HED06] [Hedin, A. (2006). Long-term safety for KBS-3 repositories at Forsmark and Laxemar-a first
evaluation. Main Report of the SR-Can project (No. SKB-TR--06-09). Swedish Nuclear Fuel and Waste
Management Co.]
[HUM05] [W. Hummel, G. Anderegg, L. Rao, I. Puigdomènech, O. Tochiyama (2005), Chemical
thermodynamics of compounds and complexes of U, Np, Pu, Am, Tc, Se, Ni and Zr with selected organic
ligands, Elsevier.]
[JOH97] [John Jr, D., & Lubin, J. H. (1997). Occupational and environmental radiation and cancer. Cancer
Causes & Control, 8(3), 309-322.]
[JOK65] [V. Jokl, J. Majer (1965), Investigation of complex compounds in solution using paper
electrophoresis. IV. Complexes of 1, 3-diamino-2-propanol-N, N, N′, N′-tetraacetic acid, Chem. Vesti, 19,
249-258.]
[KAR15] [Magill, J., Pfennig, Dreher, G., Sóti, Z. (2015). Karlsruher Nuklidkarte, European Commission
Joint Research Centre Institute for Transuranium Elements, 9.]
[KEI08] [Keith-Roach, M. J. (2008). The speciation, stability, solubility and biodegradation of organic co-
contaminant radionuclide complexes: A review. Science of the Total Environment, 396(1), 1-11.]
[LAN85] [Langmuir, D., & Riese, A. C. (1985). The thermodynamic properties of radium. Geochimica et
cosmochimica acta, 49(7), 1593-1601.]
[LEE05] [van Leeuwen, F. W., Verboom, W., & Reinhoudt, D. N. (2005). Selective extraction of naturally
occurring radioactive Ra 2+. Chemical Society Reviews, 34(9), 753-761.]
[LEE05b] [Leeuwen, F. W. B. (2005). Selective extraction of naturally occurring radioactive Ra2+ from
aqueous waste streams: extractants based on thiacalix [4] arene and (iso) guanosine. University of
Twente.]
[LIN02] [Linert, W. (Ed.). (2002). Highlights in solute-solvent interactions. Springer-Verlag.]
[LUB95] [Lubin, J. H.; Boice Jr, J. D.; Edling, C.; Hornung, R. W.; Howe, G. R.; Kunz, E.; Kusiak, R. A.;
Morrison, H. I.; Radford E. P.; Samet, J. M. JNCI, 1995, 87, 817-827.]
[LUT06] [Lutzenkirchen, J. (Ed.). (2006). Surface complexation modelling (Vol. 11). Academic press.]
[MAR06] Y. Marcus, G. Hefter, Ion pairing, Chemical reviews, 106 (2006) 4585-4621.
[MAR74] [Martell, A. E., & Smith, R. M. (1974). Critical stability constants (Vol. 1, p. 135). New York:
Plenum Press.]
[MIL02] [Milton, J. S., & Arnold, J. C. (2002). Introduction to probability and statistics: principles and
applications for engineering and the computing sciences. McGraw-Hill, Inc..]
[NAT16] [National Center for Biotechnology Information. PubChem Compound Database; CID=25204,
https://pubchem.ncbi.nlm.nih.gov/compound/25204 (accessed June 10, 2016).]

46
[NEA05] [Mompean, F. J., Illemassène, M., & Perrone, J. (2005). Chemical thermodynamics of compounds
and complexes of U, Np, Pu, Am, Tc, Se, Ni and Zr with selected organic ligands (Vol. 9). Elsevier.]
[NEL60] [F. Nelson, R. Day, K. Kraus (1960), Anion exchange studies—XXX a number of elements in
ethylenediaminetetraacetic acid solutions, Journal of Inorganic and Nuclear Chemistry, 15, 140-150.]
[NIK59] [B.P. Nikolsky, A.M. Trofimov, N.B. Vysokoostrovskaya (1959), Complex formation of barium
and radium in Trilon B solutions, Radiochemistry, 1, 147-154.]
[NIR88] [Nirdosh, I., & Muthuswami, S. V. (1988). Distribution of 230Th and other radionuclides in
Canadian uranium mill streams. Hydrometallurgy, 20(1), 31-47.]
[PAI98] [Paige, C. R., Kornicker, W. A., Hileman, O. E., & Snodgrass, W. J. (1998). Solution Equilibria
for Uranium Ore Processing: The BaSO 4-H 2 SO 4-H 2 O System and the RaSO 4-H 2 SO 4-H 2 O
System. Geochimica et cosmochimica acta, 62(1), 15-23.]
[PAL63] [V. Palaty (1963), Sodium Chelates of Ethylenediaminetetraacetic Acid, Canadian Journal of
Chemistry, 41, 18-20.]
[PAR13] [Parker, C., Nilsson, S., Heinrich, D., Helle, S. I., O'sullivan, J. M., Fosså, S. D., ... & Widmark,
A. (2013). Alpha emitter radium-223 and survival in metastatic prostate cancer. New England Journal of
Medicine, 369(3), 213-223.]
[PER94] [Pershagen, G., Akerblom, G., Axelson, O., Clavensjo, B., Damber, L., Desai, G., ... &
Swedjemark, G. A. (1994). Residential radon exposure and lung cancer in Sweden. New England journal
of medicine, 330(3), 159-164.]
[ROS09] [Rosenberg, Y. O., & Ganor, J. (2009). Radium co-precipitation in evaporitic systems.
Geochimica et Cosmochimica Acta Supplement, 73, 1119.]
[ROS11] [Rosenberg, Y. O., Metz, V., & Ganor, J. (2011). Co-precipitation of radium in high ionic strength
systems: 1. Thermodynamic properties of the Na–Ra–Cl–SO 4–H 2 O system–estimating Pitzer parameters
for RaCl 2. Geochimica et Cosmochimica Acta, 75(19), 5389-5402.]
[ROS61] [Rossotti, F. J., & Rossotti, H. (1961). The determination of stability constants: and other
equilibrium constants in solution. McGraw-Hill.]
[SAL91] [Y. Sal'nikov, G. Boos, K. Gibadullina, R. Basyrova, N. Shakirova (1991),
Ethylenediaminetetraacetate complexes of patassium and sodium and dissociation of EDTA in aqueous-
acetonitrile and aqueous-dioxane media, Russian journal of inorganic chemistry, 36, 745-749.]
[SAM98] [William D. Samuels 1998, Initial Laboratory Studies into the Chemical and
Radiological Aging of Organic Materials in Underground Storage Tanks at the Hanford Complex]
[SCH47] [G.v. Schwarzenbach, H. Ackermann (1947), Komplexone V. Die Äthylendiamin‐tetraessigsäure,
Helvetica Chimica Acta, 30, 1798-1804.]
[SCH54] [G. Schwarzenbach, R. Gut, G. Anderegg (1954), Komplexone XXV. Die polarographische
Untersuchung von Austauschgleichgewichten. Neue Daten der Bildungskonstanten von Metallkomplexen
der Äthylendiamin‐ tetraessigsäure und der 1, 2‐ Diaminocyclohexan‐ tetraessigsäure, Helvetica
Chimica Acta, 37, 937-957.]

47
[SCH56] [R. Schmid, C.N. Reilley (1956), A rapid electrochemical method for the determination of metal
chelate stability constants, Journal of the American Chemical Society, 78, 5513-5518.]
[SEK68] [T. Sekine, Y. Kawashima, T. Unnai, M. Sakairi (1968), Studies of the Alkaline Earth Complexes
in Various Solutions. IV. Solvent Extraction Study of Radium (II) Complexes with Some Aminocarboxylic
Acids in Perchlorate Media, Bulletin of the Chemical Society of Japan, 41, 3013-3015.]
[SHA76] [Shannon, R. T. (1976). Revised effective ionic radii and systematic studies of interatomic
distances in halides and chalcogenides. Acta Crystallographica Section A: Crystal Physics, Diffraction,
Theoretical and General Crystallography, 32(5), 751-767.]
[SKB99] [SKB Technical Report (1999): Deep repository for long-lived low and intermediate-level waste.
Preliminary safety assessment, TR-99-28.]
[SOK01] [Sokalski, T., & Lewenstam, A. (2001). Application of Nernst–Planck and Poisson equations for
interpretation of liquid-junction and membrane potentials in real-time and space domains. Electrochemistry
communications, 3(3), 107-112.]
[SPA98] [Spahiu, K., & Puigdomenech, I. (1998). On weak complex formation: re-interpretation of
literature data on the Np and Pu nitrate complexation. Radiochimica acta, 82(s1), 413-420.]
[STU12] [W. Stumm, J.J. Morgan (2012), Aquatic chemistry: chemical equilibria and rates in natural
waters, John Wiley & Sons.]
[STU70] [Stumm, W., & Morgan, J. J. (1970). Aquatic chemistry; an introduction emphasizing chemical
equilibria in natural waters.]
[TOF13] [Tófalvi, R., Horváth, K., & Hajós, P. (2013). High performance ion chromatography of transition
metal chelate complexes and aminopolycarboxylate ligands. Journal of Chromatography A, 1272, 26-32.]
[TYA06] [Tyagi, P. (2006). Electrochemistry. Discovery Publishing House.]
[VER99] [Vercammen, K., Glaus, M. A., & Van Loon, L. R. (1999). Complexation of Calcium by -
Isosaccharinic Acid under Alkaline Conditions. Acta Chemica Scandinavica, 53, 241-246.]
[ZAI97] [Zaitoun, M. A., & Lin, C. T. (1997). Chelating Behavior between Metal Ions and EDTA in Sol−
Gel Matrix. The Journal of Physical Chemistry B, 101(10), 1857-1860.]
[ZHA14] [Zhang, T., Gregory, K., Hammack, R. W., & Vidic, R. D. (2014). Co-precipitation of radium
with barium and strontium sulfate and its impact on the fate of radium during treatment of produced water
from unconventional gas extraction. Environmental science & technology, 48(8), 4596-4603.]

48
Appendix A
1.1 Linear free Gibbs energy analysis
Linear free Gibbs energy analysis of the EDTA data used in figure 12, all data are taken from [SCH47],
[SCH54], [MAR74].
Ion log10βML+H log10βML log10βMHL
Mn2+ 3.1 14.04 6.92
Co2+ 3 16.31 9.09
Ni2+ 3.2 18.62 11.6
Cu2+ 3 18.8 11.58
Zn2+ 3 16.5 9.28
Cd2+ 2.9 16.46 9.14
Pb2+ 2.8 18.04 10.62
VO2+ 3 18.77 11.55
Al3+ 2.5 16.13 8.41
Sc3+ 2 23.1 14.88
La3+ 2 15.5 7.28
Nd3+ 2 16.51 8.29
Fe3+ 1.4 25.1 16.28
Ba2+ 7.76 2.07
Ca2+ 10.59 3.51
Mg2+ 8.69 2.28
Be2+ 8.4 2.1
Fe2+ 14.33 6.86
Hg2+ 21.8 14.6
Sr2+ 8.63 2.3
Ga3+ 1.91 20.5 12.19
In3+ 1.5 25.3 16.58
Th4+ 1.98 25.3 17.06
Cr2+ 3 13.61 6.39
Tl3+ 2.3 22.5 14.58

49
1.2 Distribution ratio series data
The distribution ratio data for the Ba2+ and Ra2+ in EDTA4- and HEDTA3- regions are given in the table.
I=0.2167 Batch 1 BaEDTA2- BaHEDTA- RaEDTA2- RaHEDTA-
sample [EDTA]tot lambda/D lambda/D lambda/D lambda/D
1 6.667E-06 20.5306 1.1595 2.1971 1.2572
2 1.333E-05 46.3467 2.9519 5.2573 1.9075
3 2.000E-05 76.1011 3.7403 8.7853 2.0109
4 2.667E-05 114.2592 6.2890 12.6202 2.6135
5 3.333E-05 127.2629 10.5889 16.1165 2.6328
6 4.000E-05 119.9605 6.8498 21.0599 3.6916
7 4.667E-05 124.8759 8.8525 23.8773 4.2738
8 5.333E-05 210.2802 9.7357 28.9774 4.9424
9 6.000E-05 229.7309 16.7631 34.9176 4.5906
10 6.667E-05 281.8757 21.0621 42.3309 4.6063
11 0.000E+00 1.0000 1.0000 1.0000 1.0000
I=0.2167 Batch 2 BaEDTA2- BaHEDTA- RaEDTA2- RaHEDTA-
sample [EDTA]tot lambda/D lambda/D lambda/D lambda/D
1 6.667E-06 16.6456 0.9748 1.5890 1.1129
2 1.333E-05 40.5311 1.0759 4.1635 1.7341
3 2.000E-05 67.5354 2.7426 6.9261 1.8364
4 2.667E-05 97.0345 4.1932 9.6901 1.7534
5 3.333E-05 129.8813 6.3540 11.6158 2.6590
6 4.000E-05 157.0419 8.6763 12.7874 2.5837
7 4.667E-05 200.0555 10.5783 18.5605 3.6742
8 5.333E-05 199.9718 12.5334 21.1912 3.4856
9 6.000E-05 242.0072 14.1764 22.7836 4.1292
10 6.667E-05 312.0428 16.2699 30.7544 3.6723
11.1 0.000E+00 1.0000 1.0000 1.0000 1.0000
11.2 0.000E+00 1.0000 1.0000
I=0.5062 Batch 1 BaEDTA2- BaHEDTA- RaEDTA2- RaHEDTA-
sample [EDTA]tot lambda/D lambda/D lambda/D lambda/D
1 6.667E-06 7.1843 1.1438 1.3716 0.9278
2 1.333E-05 11.5188 1.5336 2.7488 1.1000
3 2.000E-05 25.2273 2.9293 8.9142 1.3619
4 2.667E-05 33.8739 3.7200 4.7650 1.6702
5 3.333E-05 47.6120 4.6756 7.4199 2.0818
6 4.000E-05 65.6664 5.5068 9.0000 1.6368
7 4.667E-05 65.1628 7.7173 11.0398 2.4391

50
8 5.333E-05 54.9357 9.0968 12.8360 1.9913
9 6.000E-05 81.7887 10.4642 14.4675 2.3808
10 6.667E-05 96.8871 12.1594 20.2054 2.4151
11 0.000E+00 1.0000 1.0000 1.0000 1.0000
I=0.5062 Batch 2 BaEDTA2- BaHEDTA- RaEDTA2- RaHEDTA-
sample [EDTA]tot lambda/D lambda/D lambda/D lambda/D
1 6.667E-06 5.1423 1.0034 1.1919 0.9596
2 1.333E-05 13.4881 1.0560 2.2522 1.1357
3 2.000E-05 22.8834 1.6908 3.5757 1.4973
4 2.667E-05 29.8631 2.3779 5.0615 2.1087
5 3.333E-05 41.0032 3.2434 6.5208 1.8179
6 4.000E-05 49.7427 4.2923 3.5979 1.9605
7 4.667E-05 75.9951 4.7422 9.2931 2.6643
8 5.333E-05 56.6856 5.9905 11.6418 2.4429
9 6.000E-05 78.2264 6.6068 13.5242 2.5827
10 6.667E-05 80.4681 7.7950 17.9011 3.9904
11 0.000E+00 1.0000 1.0000 1.0000 1.0000
I=1.022 Batch 1 BaEDTA2- BaHEDTA- RaEDTA2- RaHEDTA-
sample [EDTA]tot lambda/D lambda/D lambda/D lambda/D
1 6.667E-06 2.3229 0.9640 1.0958 0.9196
2 1.333E-05 4.6481 1.2437 1.5848 1.1362
3 2.000E-05 7.3118 1.7800 2.5498 1.3849
4 2.667E-05 11.5173 2.0371 3.2738 1.2701
5 3.333E-05 17.0387 1.9146 3.8386 1.2020
6 4.000E-05 12.3660 2.2056 5.0393 1.5122
7 4.667E-05 23.5462 4.2369 6.2991 1.3254
8 5.333E-05 25.7427 3.5611 6.7975 1.7286
9 6.000E-05 14.3129 3.3842 8.3471 1.5296
10 6.667E-05 20.0341 3.6276 9.2720 1.6645
11 0.000E+00 1.0000 1.0000 1.0000 1.0000
I=1.022 Batch 2 BaEDTA2- BaHEDTA- RaEDTA2- RaHEDTA-
sample [EDTA]tot lambda/D lambda/D lambda/D lambda/D
1 6.667E-06 1.9755 1.0429 0.7679 0.7365
2 1.333E-05 4.7208 1.0564 1.1052 1.0782
3 2.000E-05 6.9126 1.3044 1.4607 1.0827
4 2.667E-05 10.9204 1.6029 2.0282 1.2640
5 3.333E-05 13.8806 2.0691 2.5384 1.2513
6 4.000E-05 17.0470 2.4339 3.3309 1.7425
7 4.667E-05 20.1488 2.8980 3.8880 1.5267

51
8 5.333E-05 21.3805 3.1518 4.1420 1.6283
9 6.000E-05 24.4810 3.6857 5.1458 1.5450
10 6.667E-05 29.5080 3.7346 5.8915 1.5719
11 0.000E+00 1.0000 1.0000 1.0000 1.0000
I=2.086 Batch 1 BaEDTA2- BaHEDTA- RaEDTA2- RaHEDTA-
sample [EDTA]tot lambda/D lambda/D lambda/D lambda/D
1 6.667E-06 1.5433 1.3029 1.0162 0.6899
2 1.333E-05 2.8414 1.3057 1.3436 0.7684
3 2.000E-05 4.4151 1.6853 1.3804 1.1164
4 2.667E-05 4.7412 2.0222 1.8928 1.0935
5 3.333E-05 6.7263 2.4672 2.5720 0.9199
6 4.000E-05 8.8915 3.1213 2.9138 1.2421
7 4.667E-05 9.1867 3.6563 3.2517 1.1181
8 5.333E-05 10.1936 3.6185 3.4064 1.6950
9 6.000E-05 15.2888 4.6324 3.6469 1.2351
10 6.667E-05 16.8184 4.9314 4.1739 1.5957
11 0.000E+00 1.0000 1.0000 1.0000 1.0000
I=2.086 Batch 2 BaEDTA2- BaHEDTA- RaEDTA2- RaHEDTA-
sample [EDTA]tot lambda/D lambda/D lambda/D lambda/D
1 6.667E-06 1.1245 1.0183 1.0444 0.6443
2 1.333E-05 2.1009 1.0179 1.2511 0.8658
3 2.000E-05 3.2678 1.1033 1.4611 0.9223
4 2.667E-05 4.5772 1.3449 1.9512 1.1182
5 3.333E-05 5.2632 1.6757 1.6055 1.0872
6 4.000E-05 6.4668 2.0589 3.1608 1.3161
7 4.667E-05 8.9140 2.4616 3.2122 1.1909
8 5.333E-05 11.3728 2.9421 3.6164 2.0440
9 6.000E-05 10.1061 3.2110 4.1211 1.4323
10 6.667E-05 12.2956 3.4458 6.7712 1.4247
11 0.000E+00 1.0000 1.0000 1.0000 1.0000
I=2.637 Batch 1 BaEDTA2- BaHEDTA- RaEDTA2- RaHEDTA-
sample [EDTA]tot lambda/D lambda/D lambda/D lambda/D
1 6.667E-06 1.2035 1.0271 1.3389 0.8709
2 1.333E-05 1.8997 1.0412 1.6212 0.8940
3 2.000E-05 2.9072 1.2456 1.5324 0.9804
4 2.667E-05 3.7169 1.5122 1.9808 0.8925
5 3.333E-05 4.4337 1.7546 2.4917 1.1528
6 4.000E-05 4.2557 1.9567 2.6408 1.2534
7 4.667E-05 7.6343 2.6815 3.0890 1.7337

52
8 5.333E-05 8.2990 2.4345 3.2424 1.1891
9 6.000E-05 10.1383 3.1466 3.4840 1.6517
10 6.667E-05 13.0920 3.2552 4.7614 1.7178
11 0.000E+00 1.0000 1.0000 1.0000 1.0000
I=2.637 Batch 2 BaEDTA2- BaHEDTA- RaEDTA2- RaHEDTA-
sample [EDTA]tot lambda/D lambda/D lambda/D lambda/D
1 6.667E-06 1.2609 0.9964 1.0049 0.6452
2 1.333E-05 1.9045 1.0029 1.1552 1.0333
3 2.000E-05 2.9473 1.1028 1.2945 1.1993
4 2.667E-05 4.8366 1.3367 1.5559 1.1387
5 3.333E-05 4.3986 1.5885 1.9809 1.2636
6 4.000E-05 5.1674 1.9867 2.1513 1.1954
7 4.667E-05 6.2351 2.0736 2.5563 1.4042
8 5.333E-05 7.3293 2.3723 2.7621 1.6360
9 6.000E-05 9.5928 2.5807 3.3256 1.4180
10 6.667E-05 9.4371 2.8346 3.6181 1.8087
11 0.000E+00 1.0000 1.0000 1.0000 1.0000
I=0.2167 Batch 3 BaEDTA2- BaHEDTA- RaEDTA2- RaHEDTA-
sample [EDTA]tot lambda/D lambda/D lambda/D lambda/D
1 6.667E-06 21.2614 1.4227
2 1.333E-05 46.0662 4.9781
3 2.000E-05 71.2890 8.9405
4 2.667E-05 97.7705 13.5867
5 3.333E-05 113.9104 19.1125
6 4.000E-05 25.3283
7 4.667E-05 32.8719
8 5.333E-05 38.5148
9 6.000E-05 45.7098
10 6.667E-05 242.1822 55.9473
11 0.000E+00 1.0000 1.0000
1.3 Equilibrium time study
As the equilibration time of the complex formation is rather slow, the samples had to be shaken several
times in order to speed up the equilibrium. As no shaking machine was available for the quite active
samples, the shaking had to be done manually with some time in between the shakings. To illustrate the
quite dramatic effect of the first few shakings, the cpm detected by LSC in the aqueous phase can be seen
as a function of shakings.

53

54
Paper I

55
Study of barium and radium complexation with ethylenediaminetetraacetic
acid in aqueous alkaline sodium chloride media
Artem V. Matyskin1*, Niklas L. Hansson1, Paul L. Brown2 and Christian Ekberg1
1 Nuclear Chemistry and Industrial Materials Recycling Groups, Energy and Materials Division,
Chemistry and Chemical Engineering Department, Chalmers University of Technology, Kemivägen 4,
SE-412 96 Gothenburg, Sweden.
2 Rio Tinto Growth and Innovation, 1 Research Avenue, Bundoora 3083, Victoria, Australia
* Corresponding author: [email protected], tel: +46 31 772 29 47
Artem V. Matyskin: orcid.org/0000-0002-9435-0823
Niklas L. Hansson: orcid.org/0000-0002-2826-9613
Abstract
The speciation of Ra2+ and Ba2+ with EDTA was investigated at 25 °C in aqueous alkaline NaCl media as
a function of ionic strength (0.2 – 2.5 M) in two pH regions where the EDTA4- and HEDTA3- species
dominate. The stability constants for the formation of the [BaEDTA]2- and [RaEDTA]2- complexes were
determined using an ion exchange method. Barium-133 and radium-226 were used as radiotracers and their
concentrations in the aqueous phases were measured using liquid scintillation counting and gamma
spectrometry, respectively. The specific ion interaction theory (SIT) was used to account for [NaEDTA]3-
and [NaHEDTA]2- complex formation, and used to extrapolate the apparent stability constants to zero ionic
strength (BaEDTA2-: 9.86 ± 0.09; RaEDTA2-: 9.13 ± 0.07) and obtain the Ba2+ and Ra2+ ion interaction
parameters: (ε(Na+, BaEDTA2-): -(0.03±0.11); ε(Na+, RaEDTA2-): -(0.10±0.11)). It was found that in the
pH region where HEDTA3- dominates, the reaction of Ba2+ or Ra2+ with the HEDTA3- ligand also results in
the formation of the BaEDTA2- and RaEDTA2- complexes (as it does in the region where the EDTA4- ligand
dominates) with the release of a proton. Comparison of the ion interaction parameters of Ba2+ and Ra2+
strongly indicates that both metal ions and their EDTA complexes have similar activity coefficients and
undergo similar short-range interactions in aqueous NaCl media.
Keywords: alkaline-earth metal, EDTA, complex formation, activity coefficient, specific ion interaction
theory, infinite dilution

56
1. Introduction
Barium and radium are members of the alkaline-earth metal group. While barium is an abundant element
in the earth’s crustal rocks (340 mg·kg-1), radium occurs in nature only in trace amounts (0.1 ng·kg-1) [1].
Radium has no stable isotopes and the most abundant radium isotope is 226Ra with a half-life of 1600 years.
Radium-226 is part of the 238U decay chain and decays to the short lived (t1/2=3.4 d) α-emitting gas 222Rn.
Both 226Ra and 222Rn are among the more radiotoxic elements present in the environment [2]. As a
consequence of some anthropogenic processes, 226Ra is concentrated in waste streams. For example, in
uranium mining, uranium is usually leached from milled uranium ore or leached in situ using sulfuric acid.
After leaching, the tailings (solid and liquid residues) are usually neutralized and disposed in surface ponds
in the form of a slurry [3,4]. Predominantly, radium is rapidly dissolved in leaching and co-precipitates in
the form of Ba(Ra)SO4 [5]. The concentration of 226Ra in such tailings is higher than in the natural uranium
ore and can reach up to 43.4 kBq·kg-1 (1186.7 ng·kg-1) [6]. The background radiation levels are also
increased, mostly because of radium and its decay products, for example, from 0.1 - 0.2 μSv∙h-1 in reference
areas such as the tailings storage facility up to 10-20 μSv∙h-1 on the top of waste dumps [6]. Radium-226
concentrations up to 200 Bq·l-1 (0.2 nmol·l-1) also occur in water produced from the petroleum industry,
which is above the limits of industrial effluents [7]. Radium-226 is usually removed by addition of sulfate
salts which allow it to co-precipitate in the form of Ba(Ra)SO4. Therefore, co-precipitation of radium with
barite (BaSO4), mostly via an inclusion (lattice replacement) process [7], is the main mechanism controlling
radium behaviour in the waste streams and its migration in the environment [8,5]. To decontaminate
uranium tailings or solid residues from, e.g. the petroleum industry, it is necessary to dissolve Ba(Ra)SO4.
Pure radium and barium sulfate salts and their co-precipitates are, in principle, insoluble in water and
aqueous solutions of mineral acids and alkali at room temperature [9] (the recommended values for the
logarithm of the BaSO4 and RaSO4 solubility products at zero ionic strength and 298 K are -9.95 and -10.21,
respectively [10,11]). At room temperature, Ba(Ra)SO4 can be dissolved using chelating agents. The most
commercially available chelating agent for Ba(Ra)SO4 dissolution is ethylenediaminetetraacetic acid
(EDTA) and its derivatives. Aqueous alkaline EDTA solutions have been found to be effective in the
dissolution of Ba(Ra)SO4 and in the extraction of 226Ra from uranium tailings [12]. Approximately 80-85
% of 226Ra was extracted from uranium tailings using a 0.04 M aqueous alkaline EDTA solution at Elliot
Lake, Ontario, Canada [13]. Moreover, alkaline EDTA solutions have been used for dissolution of
irradiated 226RaSO4 targets and the preparation of 227Ac/223Ra radiopharmaceutical generators [14]. One of
the reasons for the high Ba(Ra)SO4 solubility in alkaline EDTA solutions is the formation of a strong
complex between Ba2+ or Ra2+ and EDTA. Therefore, it is necessary to know accurately the stability
constants of the BaEDTA2- and RaEDTA2- complexes to model the Ba(Ra)SO4 dissolution equilibrium in
alkaline EDTA systems including decontamination using EDTA.
Experimental studies of Ba2+ and Ra2+ complex formation are also important on a fundamental level.
Radium and barium have similar solution chemistry and one of the main reasons for this is the similarity of
the effective ionic radii, which are equal to 1.42 Å for Ba2+ and 1.48 Å for Ra2+ (in 8-fold coordination)
[15]. Due to the high radiotoxicity of radium and its daughters, experimental thermodynamic data for
radium are limited. For example, to the best of our knowledge, the experimental determination of radium
activity coefficients or ion interaction parameters have never been reported in the literature. Due to the lack
of experimental data, extrapolation of the ion interaction parameters for radium from values of the other
alkaline-earth metals using ionic radii or using interaction parameters of barium directly are the methods

57
used to calculate radium activity coefficients [5,16,17]. All approaches for modelling activity coefficient
are semi-empirical, with one or more parameters either fitted or extrapolated, thus the obtained ion
interaction parameters can be brought into question. Therefore, an experimental study of Ba2+ and Ra2+
complex formation using a background electrolyte would be beneficial on both applied and fundamental
levels.
The objective of this work was to study the complex formation of Ra2+, as well as Ba2+, with EDTA as a
function of ionic strength using NaCl as an ionic medium. Sodium chloride is an inert ionic electrolyte
which is also omnipresent in the environment. Due to the high radiotoxicity of radium, the complex
formation was studied via an ion exchange method which only requires trace amounts of radium. The
specific ion interaction theory (SIT) was used to extrapolate the apparent stability constants of the studied
complexes to zero ionic strength, and for determining the ion interaction parameters of the species involved
in the complex formation.
2. Experimental
2.1 Sample preparation
The complexation of Ba2+ and Ra2+ with EDTA was studied as a function of NaCl ionic strength (0.22, 0.5,
1.0, 2.0 and 2.5 M) via an ion exchange method with batch and radiotracer techniques. The method is based
on the different distribution of metal ions (133Ba2+ or 226Ra2+) and negatively charged metal-EDTA
complexes using a strong cation exchange resin. Distribution experiments were performed in polypropylene
tubes with aqueous phase volumes of 10 ml in the case of Ba2+, and 1 ml in the case of Ra2+, with 0.5 g and
0.05 g of ion exchange resin added to each tube, respectively. The ionic strength in the aqueous phase was
adjusted using concentrated NaCl stock solutions. Different doses of Na2EDTA stock solution were added
to each sample and its concentration was varied throughout the sample series, ranging between 0 and
6.67∙10-5 mol∙l-1. The apparent EDTA dissociation constants at various NaCl ionic strengths were
determined using the SIT methodology and the H+ concentration was adjusted using potentiometric
titrations to maximize the molar fractions of EDTA4- (-log [H+] = 12.4; more than 99 % EDTA4-) or
HEDTA3- (-log [H+]=7.9-8.3 depending on the ionic strength; always more than 98 % HEDTA3-). Samples
without the ion exchange resin and EDTA were prepared to measure the total radioactivity of 133Ba2+ or 226Ra2+ in the sample. Preliminary kinetic studies confirmed that the metal-EDTA equilibria were achieved
within 24 hours under the experimental conditions used. The experiments were performed in duplicate
where each series contained 11 samples per ionic strength. All samples were kept at 25 ± 1 °C.
2.2 Reagents and chemicals
All aqueous solutions were prepared using MQ water with 18.2 MΩ·cm resistivity at 25 °C and a total
organic content of less than 5 mg∙l-1. The barium stock solution was in the form of 133Ba with a specific
activity of 37 kBq∙µl-1 in 0.1 M HCl with an additional 10 µg∙ml-1 of BaCl2 carrier (Eckert and Ziegler
Isotope Products). Radium carbonate was synthesized from RaSO4 powder as previously described [9]. The
synthesized RaCO3 was dissolved in 0.1 M HCl (Sigma-Aldrich 99.999% trace metals basis) to obtain 14
ml of radium stock solution with a 226Ra specific activity of (2.5±0.1)∙104 Bq∙µl-1. The cation exchange
resin was in sodium form (Biorad AG 50W-X8 200-400 mesh). EDTA stock solutions were prepared from
solid Na2EDTA·2H2O (Sigma p.a. ≥99.0 %). The ionic strength and –log [H+] were adjusted using a NaCl
stock solution prepared from solid NaCl (Sigma-Aldrich ACS reagent p.a. ≥99.0 %) and standard NaOH
and HCl solutions (Fixanal, Sigma-Aldrich).

58
2.3 Apparatus
All solid chemicals were weighed on a standard analytical balance (Sartorius Quintix125D-1S) and samples
were kept at a constant temperature of 25 ± 1 °C in a shaking water bath (Julabo SW23). Potentiometric
measurements were performed using two pH meters coupled with combined glass electrodes (827 pH
laboratory Metrohm coupled with Metrohm Primatrode electrode and Radiometer MeterLab PHM240
coupled with Radiometer PHC3006-9 electrode). Both electrodes were filled with a 3 M NaCl reference
electrolyte and calibrated using the activity scale with standard buffer solutions (NIST and SRM traceable,
Certipur, Merck), and were subsequently calibrated in the concentration scale using a potentiometric
titration with negligible volume change [18]. The radioactivity of 133Ba was measured using Liquid
Scintillation Counting (LSC) (Perkin Elmer Guardian 1414) and aqueous 133Ba samples were subsequently
mixed with an Emulsifier safe LSC cocktail. The radioactivity of 226Ra was measured using two High Purity
Germanium Detectors (HPGe) (Canberra GEM23195 closed-end coaxial HPGe detector coupled with
digital spectrum analyzer Canberra-2000/A and Ortec GEM-C5060 coaxial HPGe coupled with digital
spectrum analyzer Ortec DSPEC50). Both detectors were calibrated using a mixed radionuclide reference
solution (NIST traceable, Eckert and Ziegler). Nuclide half-lives, gamma emission energies and photon
emission probabilities were taken from the Decay Data Evaluation Project [19].
3. The model
The speciation of a metal ion (M2+) with various forms of EDTA can be described by the reaction:
]EDTAH[M 4)(rr
2 ⇌ ]EDTAMH[ 2)(rr
(1)
where 0 ≤ r ≤ 6.
The stability constant for reaction (1) at zero ionic strength is defined as:
4)(rEDTArH2M
2)(rEDTArMH
4)(rr
2
2)(rr
4)(rEDTArH2M
2)(rEDTArMH
2)(rEDTArMH
o2)(rEDTArMH ]EDTAH[]M[
]EDTAMH[
KK (2)
The SIT model developed by Brønsted [20,21], Scatchard [22], Guggenheim and Turgeon [23] can be used
to express the activity coefficients γi of an ion i at ionic strengths below about 3.5 mol·kg-1:
i
i
mii mIjiDz ),,(log 210 (3)
where zi is the charge of the ion i, ε(i,j) is the interaction parameter of ion i with all oppositely charged
ions j, mi is molal concentration of ion i and D is the Debye-Hückel term which is defined as:
m
m
I
IAD
5.11 (4)
where A is a temperature dependent constant equal to 0.5090 and 0.5047 kg1/2∙mol-1/2 at 25 °C and 20 °C,
respectively, for aqueous solutions [24], Im is ionic strength in mol·kg-1. The value 1.5 is the product of B

59
(a constant dependent on temperature and the solvent relative permittivity) and a (distance of closest
approach or effective Debye-Hückel ionic radius). In the SIT, this product is usually taken to be 1.5 to
minimize the effect of ionic strength on the ion interaction parameters. In this work, each ionic strength of
NaCl was recalculated to the molal scale (from molar) using the relevant conversion factors [24].
Substituting the activity coefficients calculated using Eq.(3) into Eq.(2) yields:
mIKDzK o
2)(rEDTArMH102
2)(rEDTArMH10 loglog (5)
From Eq.5 it can be concluded that plotting the difference between the determined logarithm of the apparent
stability constants and ∆z2·D against ionic strength of the same background electrolyte will result in an
intercept which is the logarithm of the stability constant at zero ionic strength and a slope which is the ion
interaction parameter term.
Measurement of the metal ion radioactivity in the aqueous phase allows for calculation of the distribution
ratio between the solid phase and the aqueous phase according to:
m
V
A
AAD
aq
aqtotal
(6)
where Atotal is the total radioactivity of the metal ion in the sample, Aaq is the radioactivity of the metal ion
in the aqueous phase after the distribution equilibrium has been reached, V is the solution volume (ml) and
m is the mass of the ion exchange resin (g).
The distribution ratio can also be expressed through the apparent stability constant:
])EDTAH[]M[(]M[
]M[4)(r
r2
2)(rEDTArMH
2
2
KD (7)
where λ is the distribution ratio without the ligand (ml·g-1) and K is the apparent stability constant for the
MHrEDTA(r-2) complex.
The apparent dissociation constants of the HrEDTA(r-4) complexes can be computed via the SIT (Eq. 3)
using the EDTA dissociation constants at zero ionic strength and their ion interaction parameters given in
the literature [25]. The constants calculated in this manner have been used in this work. Molar fractions of
the different EDTA species can be computed as a function of hydrogen ion concentration using the
calculated apparent dissociation constants of HrEDTA(r-4). The concentration of H+ at which the molar
fractions of EDTA4- and HEDTA3- are maximized were calculated for all studied ionic strengths, and –log
[H+] was adjusted according to these calculations.
The hydrolysis of Ba2+ and Ra2+ at a –log [H+] of 12.4 (the highest –log [H+] used in this work) can be
neglected [26] compared to the metals strong complexation with EDTA. Polynuclear complexes are also
60
not formed when a metal ion is at radiotracer levels, therefore the M2+ concentration terms in Eq. (7) can
be cancelled. As a result, Eq. (7) can be simplified to:
1]EDTAH[ 4)(r
rEDTAMH 2)(rr
DK
(8)
Thus, according to Eq. (8) and under the experimental conditions studied, where only one form of
HrEDTA(r-4) is dominant, the apparent stability constants of the MHrEDTA(r-2) complexes can be determined
using linear regression.
The [HrEDTA(r-4)] term in Eq. (8) refers to the free concentration of the ligand. However, EDTA also forms
strong complexes with Na+, which was used as part of the ionic medium. The Na+ concentration was
considerably higher than the M2+ concentration under all experimental conditions. As a result, the
concentration of free EDTA was adjusted by the EDTA complex formation with Na+. The effect of complex
formation between EDTA4- and HEDTA3- with Na+ has been found to be important [27] and can be
described by the following reactions:
4EDTANa ⇌ 3NaEDTA (9)
3HEDTANa ⇌ 2NaHEDTA (10)
As a result, the free EDTA4- or HEDTA3- concentration in Eq. (8) can be expressed as:
]Na[]H[1
]EDTA[]EDTA[
NaEDTAHEDTA
44
KK
totalfree (11)
]Na[]H[
1
]EDTA[]HEDTA[
NaHEDTA
HEDTA
43
KK
totalfree
(12)
where KHEDTA refers to the protonation constant of EDTA4- and KNaEDTA or KNaHEDTA refer to the stability
constants for the reactions (9) and (10), respectively.
4. Results and discussion
4.1 Sodium speciation with EDTA
The dissociation constant of EDTA and stability constant for reaction (9) have been experimentally studied
by many researchers and a comprehensive review is available [25]. The values of the protonation constants
and the NaEDTA3- stability constant at zero ionic strength were taken from Hummel and co-workers [25]
and are listed in Table 1. The SIT ion interaction parameters and associated uncertainties were derived from
all available experimental data of NaEDTA3- and EDTA4- protonation in NaCl media at 25 ºC listed in the
review [25]. Subsequently, the apparent stability constants were calculated using the derived SIT ion
interaction parameters. The apparent EDTA4- protonation constants and NaEDTA3- stability constants

61
obtained were used to calculate the Ba2+ and Ra2+ stability constants (see Table 5) and free EDTA4-
concentration (Eq. (11)), respectively. All these stability constants are listed in Table 1.
Table 1. Stability constants and SIT ion interaction parameters at 25 ºC used in this work
Equilibrium reaction Im (mol∙kg-1) Stability constant log10 K
Specific ion
interaction parameters
(NaCl) ∆ε (mol·kg-1)
H+ + HEDTA3- ⇌ H2EDTA2- 0 6.80 ± 0.02 0.40 ± 0.03
H+ + EDTA4- ⇌ HEDTA3-
0 11.24 ± 0.03
0.55 ± 0.04
0.22 10.24 ± 0.03
0.51 10.12 ± 0.03
1.02 10.21 ± 0.04
2.09 10.51 ± 0.06
2.64 10.74 ± 0.08
Na+ + EDTA4- ⇌ NaEDTA3-
0 2.80 ± 0.20
0.27 ± 0.33
0.22 1.74 ± 0.22
0.51 1.54 ± 0.31
1.02 1.44 ± 0.52
2.09 1.51 ± 1.0
2.64 1.59 ± 1.3
Only a few experimental data for the formation of the NaHEDTA2- complex (Eq. (10)) are available in the
literature and the reported log10 K° values vary significantly from 0 to 1.5 [28-31]. The main reason for the
log10 K° data discrepancies is that the NaHEDTA2- complex is quite weak. In the case of weak complex
formation it is usually impossible to separate the weak complex formation effect from potential activity
coefficient changes. This and other challenges associated with the determination of the stability constants
of weak complexes have been previously discussed in detail [32,33]. Perhaps, the most reasonable value
for the stability constant of the NaHEDTA2- complex was reported by Palaty [30]. The author used ion
selective electrodes to study the proton dissociation reactions of EDTA and the sodium-EDTA equilibrium
and the obtained stability constant values are in good agreement with the values listed in Table 1 (11.34,
6.81 and 2.61, respectively [30]). Tetramethylammonium chloride was used as the background electrolyte
with a total ionic strength of 0.12 mol·l-1. The temperature was not given by the author [30] but based on
all the obtained values it can be assumed that the reported equilibria were studied at 25 ºC. The reported
value for the log10 K° value of the NaHEDTA2- complex was -0.03. The value is subject to some uncertainty
and it is assumed that the actual log10 K° value at zero ionic strength lies in the range from -0.5 to 0.5 (i.e.
log10 K = 0 ± 0.5). Most probably, the assignment of such a high, but reasonable, uncertainty for the stability
constant of a weak complex is the only way to overcome the lack of reliable data. The proposed log10 K°
value of 0 ± 0.5 is in accord with the statement made by Marcus and Hefter in relation to log10 K° values
less than 1, where substantial care needs to be taken in obtaining the exact magnitude of such constants by
either experiment or theory [33].
To be able to extrapolate the log10 K° value of 0 ± 0.5 for the NaHEDTA2- complex at the ionic strengths
used in this work, it is necessary to know the following SIT interaction parameters: ε(Na+, Cl-), ε(Na+,
HEDTA3-) and ε(Na+, NaHEDTA2-). The first two parameters, with their associated uncertainties, are
available in the literature [24,25] and to the best of our knowledge the last parameter has never been

62
reported. A comparison of the sodium SIT ion interactions with many different negatively charged ligands
shows that this parameter usually varies from -0.3 to 0.1 [24] (the sodium ion with a divalent anion).
Moreover, the sodium SIT ion interaction with ligands similar to H2EDTA2- is -0.37 [25]. Consequently,
based on these values, the ε(Na+, NaHEDTA2-) SIT parameter has been estimated as -(0.2 ± 0.3) kg·mol-1.
All the parameters associated with the NaHEDTA2- complex (Eq. (10)) used in this work are listed in Table
2.
Table 2. Stability constants and SIT ion interaction parameters for the NaHEDTA2- complex formation (Eq.
2) at 25 ºC
Parameter Value Reference
log10 K° 0 ± 0.5 Estimated in this work, based on available
experimental data from Palaty [30]
ε(Na+, Cl-) 0.03 ± 0.01 (kg·mol-1) Guillaumont et al. [24]
ε(Na+, HEDTA3-) -(0.1 ± 0.14) (kg·mol-1) Hummel et al. [25]
ε(Na+, NaHEDTA2-) -(0.2 ± 0.3) (kg·mol-1) Estimated in this work
4.2 Stability constants for the complex formation of Ba2+ and Ra2+ with EDTA
The apparent stability constants for the BaEDTA2- and RaEDTA2- complexes were obtained from
distribution coefficients (from the experiments conducted at a –log [H+] of 12.4) using a weighted linear
regression (ωi = σi) with a zero intercept (Eq. (8)). The free EDTA4- concentrations were obtained by
correcting for the formation of the NaEDTA3- complex (Eq. (9)) using Eq. (11) and the values which are
listed in Table 1. The standard deviations of the free EDTA4- concentrations were propagated from the
standard deviation of the apparent NaEDTA3- stability constants, also listed in Table 1. The standard
deviations of the distribution ratio without the ligand (λ) and the distribution ratio with the ligand (D) were
calculated based on duplicate series (biased standard deviation with (n-1) in the denominator) and were
propagated to the standard deviations of (λ/D - 1). Standard uncertainty propagation was used in the both
cases.
The uncertainty in the linear fitting were obtained using the method of Allard and Ekberg [34]. After
obtaining the uncertainties in both the (λ/D - 1) term and the free EDTA concentration, 30 points were
sampled from each uncertainty space using a normal distribution with the mean and standard deviation
obtained. Thus, the obtained simulated data points covered the entire standard deviation region in both x
and y forming confidence ellipses for each point. Negative simulated values of the free EDTA4-
concentrations were discarded. All these points were then used for the linear regression and the estimation
of the associated uncertainty analysis.
The weighted mean and associated 95 % confidence intervals of the BaEDTA2- and RaEDTA2- stability
constants at zero ionic strength were calculated from the values listed in Tables 3 and 4.
Figure 1 shows a representative dataset for the linear regression of the BaEDTA2- (reaction 1) apparent
stability constant in 0.22 mol∙kg-1 NaCl.
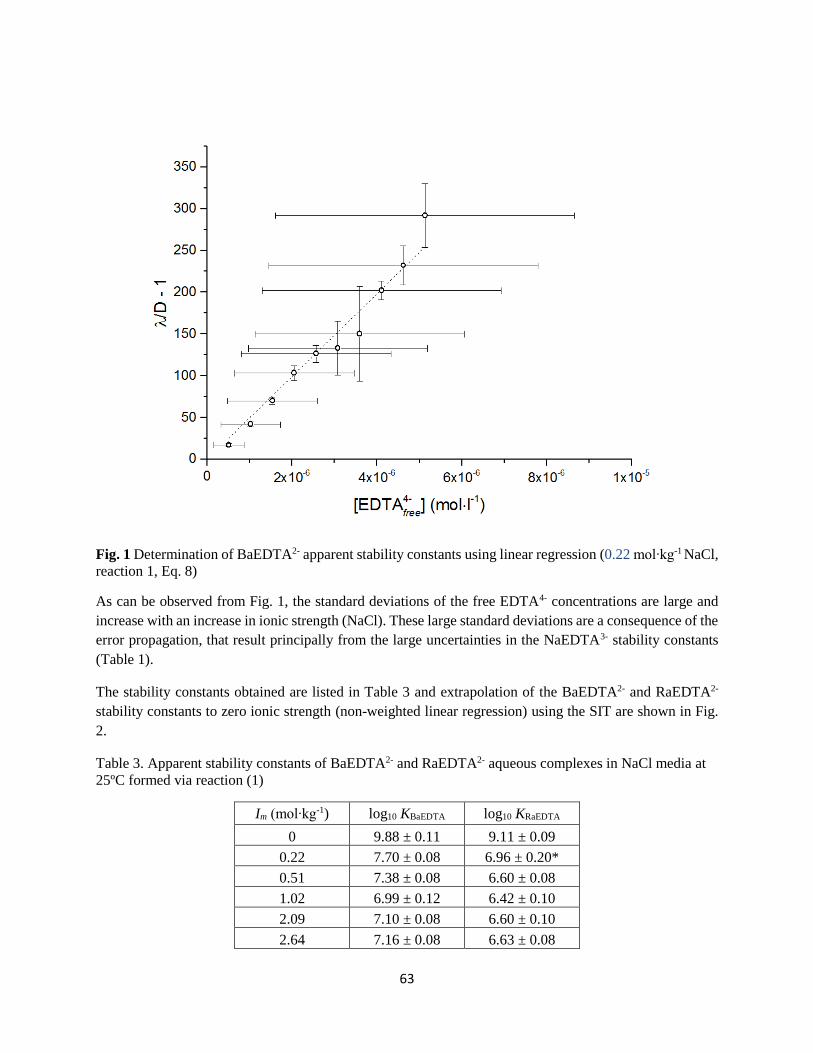
63
Fig. 1 Determination of BaEDTA2- apparent stability constants using linear regression (0.22 mol∙kg-1 NaCl,
reaction 1, Eq. 8)
As can be observed from Fig. 1, the standard deviations of the free EDTA4- concentrations are large and
increase with an increase in ionic strength (NaCl). These large standard deviations are a consequence of the
error propagation, that result principally from the large uncertainties in the NaEDTA3- stability constants
(Table 1).
The stability constants obtained are listed in Table 3 and extrapolation of the BaEDTA2- and RaEDTA2-
stability constants to zero ionic strength (non-weighted linear regression) using the SIT are shown in Fig.
2.
Table 3. Apparent stability constants of BaEDTA2- and RaEDTA2- aqueous complexes in NaCl media at
25ºC formed via reaction (1)
Im (mol∙kg-1) log10 KBaEDTA log10 KRaEDTA
0 9.88 ± 0.11 9.11 ± 0.09
0.22 7.70 ± 0.08 6.96 ± 0.20*
0.51 7.38 ± 0.08 6.60 ± 0.08
1.02 6.99 ± 0.12 6.42 ± 0.10
2.09 7.10 ± 0.08 6.60 ± 0.10
2.64 7.16 ± 0.08 6.63 ± 0.08

64
Ionic strengths were adjusted from the mol·l-1 to mol·kg-1 scale using the appropriate conversion factors [24].
Uncertainties correspond to 95 % confidence intervals. * estimated uncertainty.
Fig. 2 Extrapolation of BaEDTA2- and RaEDTA2- apparent stability constants (NaCl media, reaction 1) to
zero ionic strength using SIT
As can be observed from Fig. 2, the fits are satisfactory and the experimental data are accurately modelled
by the SIT. According to the calculations, the effect of Na+ complex formation with EDTA4- (Eq. (9)) is
significant and the difference between the corrected and uncorrected stability constants of both BaEDTA2-
and RaEDTA2- at zero ionic strength is more than 1 log unit. The difference between the slopes (with and
without correction for Na complex formation with EDTA), which corresponds to the ion interaction
parameter term, was also significant and the deviation of the experimental data points from the regression
line was higher at increased ionic strength. This strongly indicates that the complex formation between
sodium and EDTA is significant, which is in agreement with previous studies [27].
The apparent stability constants, assuming only the formation of the BaHEDTA- and RaHEDTA-
complexes (according to reaction (1) (r = 1)), were derived from the experiments conducted at a –log [H+]
of 7.9 - 8.3 with the mole fraction of HEDTA3- being more than 98 % using the same method as used for
derivation of the BaEDTA2- and RaEDTA2- complex stability constants. The apparent stability constants
obtained were extrapolated to zero ionic strength using the SIT that resulted in stability constants of log10
K° = 7.34 ± 0.30 (for BaHEDTA-) and log10 K° = 6.57 ± 0.30 (for RaHEDTA-). Schwarzenbach and
Ackermann [35] have previously given a log10 K value for the same reaction (BaHEDTA- complex) of 2.07

65
at 20 °C and an ionic strength of 0.1 M. This value, when extrapolated to zero ionic strength, results in log10
K° = 3.15, which is much lower than the value obtained in the present work. It can be seen that the value
from this study is more than four orders of magnitude larger than the value given by Schwarzenbach and
Ackermann. There are two probable reasons for the disagreement between these two values: either the
assumption that the BaHEDTA- complex is formed according to reaction (1) (r = 1) at –log [H+] of 7.9 -
8.3 is not valid or the data from Schwarzenbach and Ackermann are inconsistent. The latest hypothesis can
be verified by combining the data from Schwarzenbach and Ackermann [35] with other literature data
[36,37], where the stability constants for the reaction of various metals with EDTA4- and HEDTA3- are
reported for the same experimental conditions (20 °C and an ionic strength of 0.1 M) and performing a
linear free energy analysis of the data. This analysis (i.e. a plot of the log K values of Mn+ - EDTA4-
complexes against the log K of Mn+ - HEDTA3- complexes, where Mn+ is a metal ion with n ≥ 2 (reaction
(1) with r = 0 and r = 1, respectively)) is shown in Fig. 3.
Fig. 3 Linear free energy analysis of available literature data [36,37,35] for the logarithm of Mn+EDTA(4-n)
and Mn+HEDTA(3-n) apparent stability constants (n ≥ 2) at the same experimental conditions (20 °C, I = 0.1
M)
As shown in Fig. 3 there is a strong relationship between the magnitude (log10 K values) of the Mn+EDTA(4-
n) and Mn+HEDTA(3-n) stability constants (n ≥ 2), and consequently, the available literature data [36,37,35]
are consistent. Therefore, the assumption that only the BaHEDTA- or RaHEDTA- complexes are formed at
a –log [H+] of 7.9 - 8.3 is not valid. The stability constant for the BaHEDTA- complex derived in the present
study is more than four orders of magnitude larger when compared to those values available in the literature

66
which indicates that another stronger complex dominates at a -log [H+] of 7.9 - 8.3. The only other strong
complex which could be formed in the studied system is BaEDTA2- (or RaEDTA2-). The likely mechanism
of the formation of these two complexes at a –log [H+] of 7.9 - 8.3, where the mole fraction of HEDTA3- is
more than 98 % is as follows:
32 HEDTABa ⇌ HBaEDTA2 (13)
32 HEDTARa ⇌ HRaEDTA2 (14)
If the proposed reactions (13-14) occur in the studied system, then Eq. (7) can be adopted to reactions (13-
14) to describe the experimental data obtained at a –log[H+] of 7.9 - 8.3:
1]H[
]HEDTA[ 3
EDTAM 4)(rr
DK
(15)
According to Eq. (15), the concentration of the free HEDTA3- must be divided by the H+ concentration to
obtain the apparent stability constant for the BaEDTA2- or RaEDTA2- complex via reactions (13-14) under
these lower –log [H+] conditions. Moreover, it can be shown that the sum of the logarithm of obtained
stability constants for reactions (13-14) and the logarithm of the protonation constant of EDTA4- results in
the stability constant for the BaEDTA2- or RaEDTA2- complexes formed via reaction (1) with r = 0. The
stability constants for reactions (13-14) occurred at a –log [H+] of 7.9 - 8.3 and associated standard
deviations were derived using the same method as was used to derive stability constants and standard
deviations for reaction (1) with r = 0 at a –log [H+] of 12.4. These stability constants and the calculated
stability constants for reaction (1) with r = 0, using the derived constants and the protonation constants of
EDTA4- from Table 1, are listed in Table 4. Extrapolation of the BaEDTA2- and RaEDTA2- stability
constants to zero ionic strength using the SIT is shown in Fig. 4.
Table 4. Apparent stability constants of BaEDTA2- and RaEDTA2- aqueous complexes in NaCl media at
25ºC formed via reactions (13-14) and (1)
Im (mol∙kg-1)
log10 KBaEDTA
(formed via
reaction 13)
log10 KBaEDTA
(formed via
reaction 1)
log10 KRaEDTA
(formed via
reaction 14)
log10 KRaEDTA
(formed via
reaction 1)
0 -1.41 ± 0.12 9.83 ± 0.14 -2.07 ± 0.11 9.17 ± 0.13
0.22 -2.63 ± 0.06 7.61 ± 0.08 -3.26 ± 0.06 6.98 ± 0.08
0.51 -2.80 ± 0.08 7.32 ± 0.10 -3.42 ± 0.08 6.71 ± 0.10
1.02 -3.21 ± 0.08 7.00 ± 0.11 -3.85 ± 0.08 6.37 ± 0.11
2.09 -3.49 ± 0.08 7.02 ± 0.14 -4.15 ± 0.10 6.36 ± 0.15
2.64 -3.75 ± 0.08 6.99 ± 0.18 -4.24 ± 0.08 6.50 ± 0.18 Ionic strengths were adjusted from the mol·l-1 to mol·kg-1 scale using the appropriate conversion factors [24] and
log10 KBaEDTA or log10 KRaEDTA for the reaction 13-14 were calculated using EDTA4- protonation constants listed in
Table 1. Uncertainties correspond to 95 % confidence interval
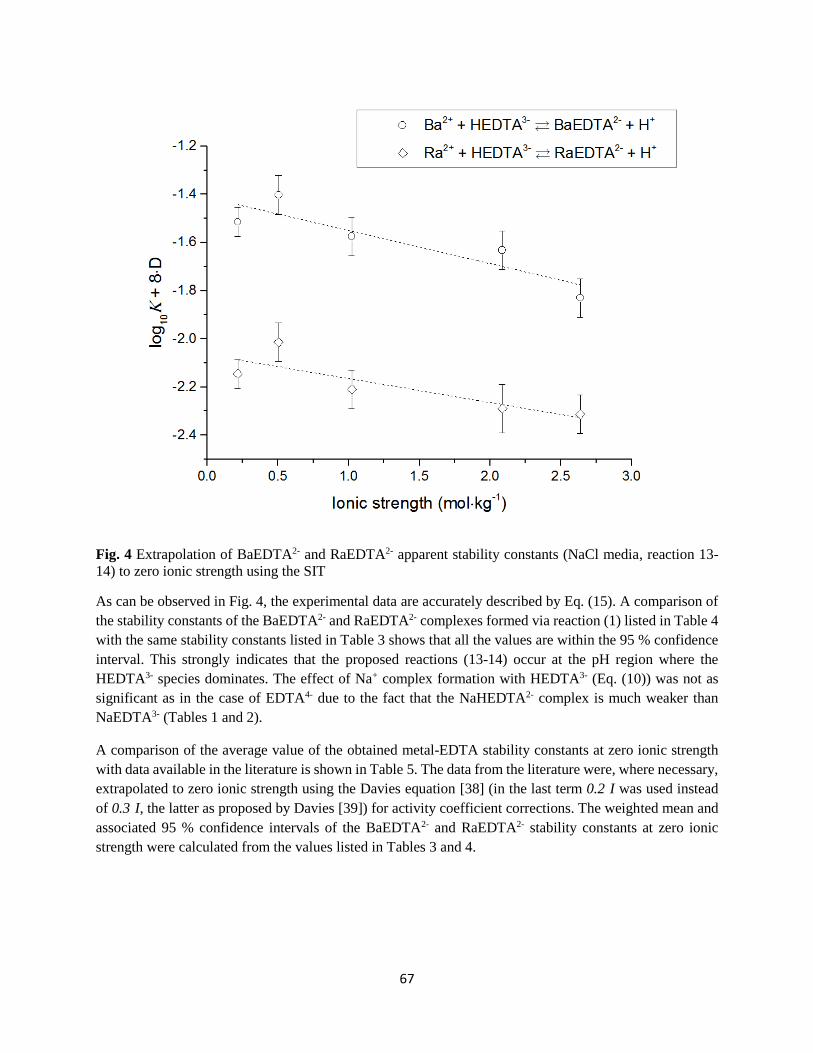
67
Fig. 4 Extrapolation of BaEDTA2- and RaEDTA2- apparent stability constants (NaCl media, reaction 13-
14) to zero ionic strength using the SIT
As can be observed in Fig. 4, the experimental data are accurately described by Eq. (15). A comparison of
the stability constants of the BaEDTA2- and RaEDTA2- complexes formed via reaction (1) listed in Table 4
with the same stability constants listed in Table 3 shows that all the values are within the 95 % confidence
interval. This strongly indicates that the proposed reactions (13-14) occur at the pH region where the
HEDTA3- species dominates. The effect of Na+ complex formation with HEDTA3- (Eq. (10)) was not as
significant as in the case of EDTA4- due to the fact that the NaHEDTA2- complex is much weaker than
NaEDTA3- (Tables 1 and 2).
A comparison of the average value of the obtained metal-EDTA stability constants at zero ionic strength
with data available in the literature is shown in Table 5. The data from the literature were, where necessary,
extrapolated to zero ionic strength using the Davies equation [38] (in the last term 0.2·I was used instead
of 0.3·I, the latter as proposed by Davies [39]) for activity coefficient corrections. The weighted mean and
associated 95 % confidence intervals of the BaEDTA2- and RaEDTA2- stability constants at zero ionic
strength were calculated from the values listed in Tables 3 and 4.
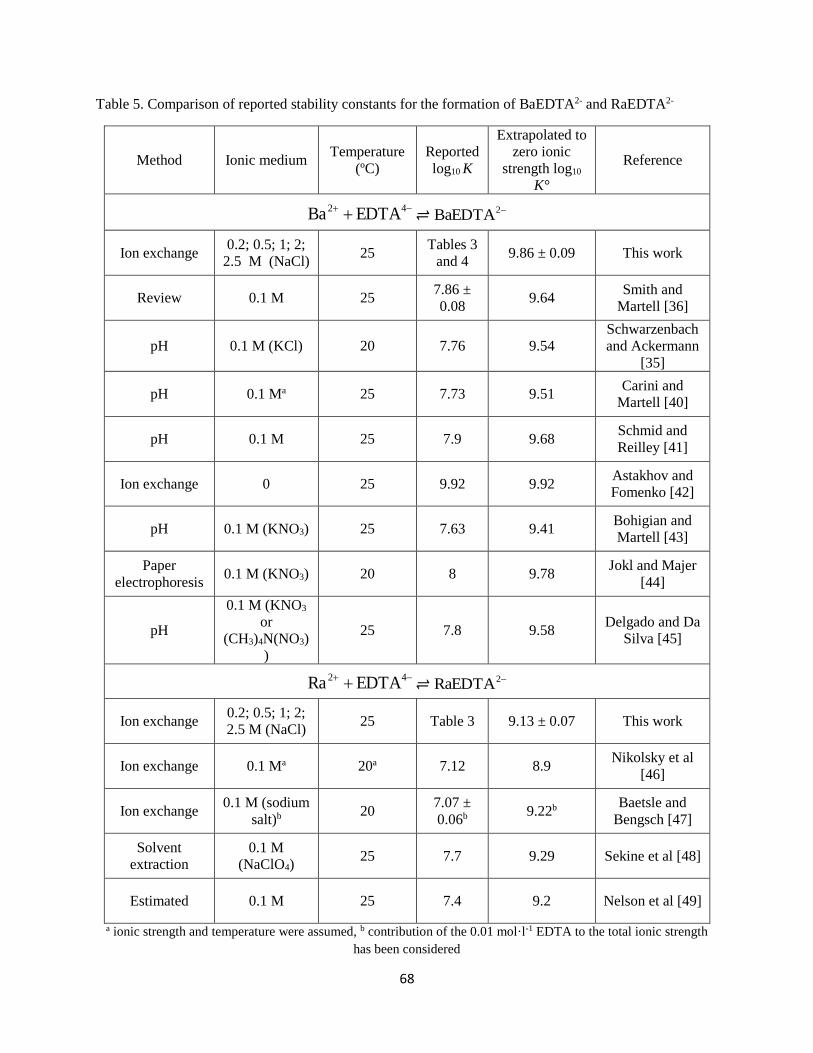
68
Table 5. Comparison of reported stability constants for the formation of BaEDTA2- and RaEDTA2-
Method Ionic medium Temperature
(ºC)
Reported
log10 K
Extrapolated to
zero ionic
strength log10
K°
Reference
42 EDTABa ⇌ 2BaEDTA
Ion exchange 0.2; 0.5; 1; 2;
2.5 M (NaCl) 25
Tables 3
and 4 9.86 ± 0.09 This work
Review 0.1 M 25 7.86 ±
0.08 9.64
Smith and
Martell [36]
pH 0.1 M (KCl) 20 7.76 9.54
Schwarzenbach
and Ackermann
[35]
pH 0.1 Ma 25 7.73 9.51 Carini and
Martell [40]
pH 0.1 M 25 7.9 9.68 Schmid and
Reilley [41]
Ion exchange 0 25 9.92 9.92 Astakhov and
Fomenko [42]
pH 0.1 M (KNO3) 25 7.63 9.41 Bohigian and
Martell [43]
Paper
electrophoresis 0.1 M (KNO3) 20 8 9.78
Jokl and Majer
[44]
pH
0.1 M (KNO3
or
(CH3)4N(NO3)
)
25 7.8 9.58 Delgado and Da
Silva [45]
42 EDTARa ⇌ 2RaEDTA
Ion exchange 0.2; 0.5; 1; 2;
2.5 M (NaCl) 25 Table 3 9.13 ± 0.07 This work
Ion exchange 0.1 Ma 20a 7.12 8.9 Nikolsky et al
[46]
Ion exchange 0.1 M (sodium
salt)b 20
7.07 ±
0.06b 9.22b
Baetsle and
Bengsch [47]
Solvent
extraction
0.1 M
(NaClO4) 25 7.7 9.29 Sekine et al [48]
Estimated 0.1 M 25 7.4 9.2 Nelson et al [49]
a ionic strength and temperature were assumed, b contribution of the 0.01 mol·l-1 EDTA to the total ionic strength
has been considered
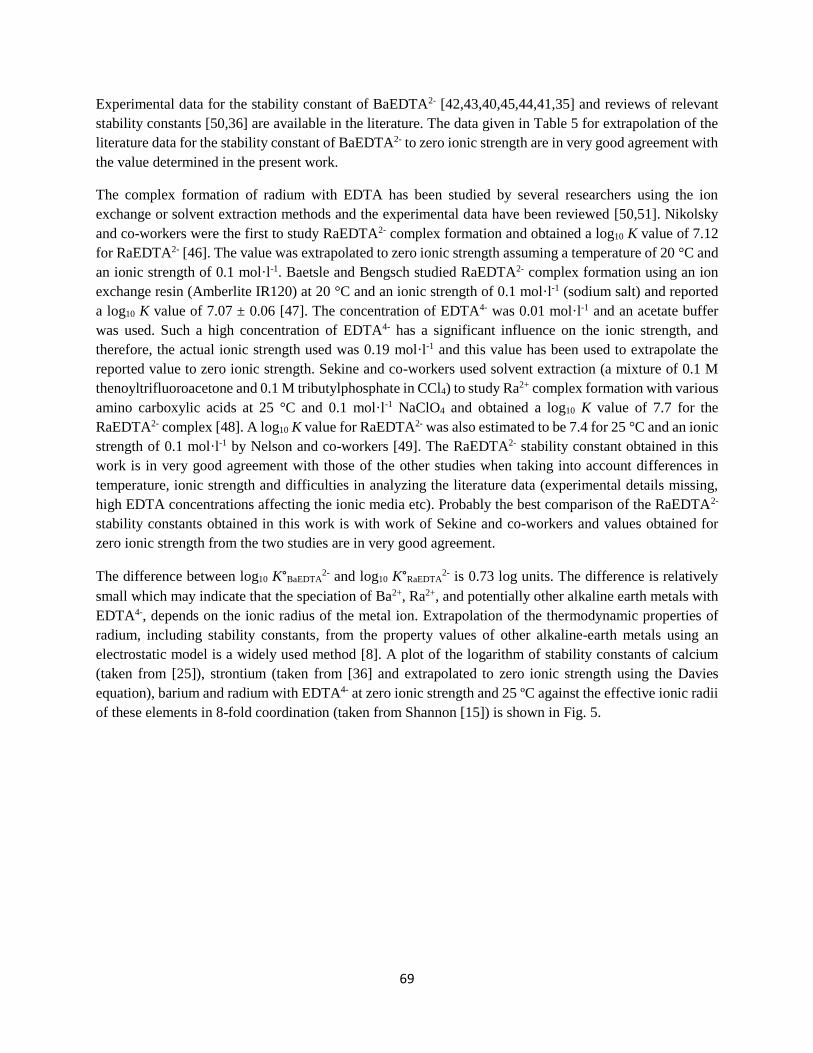
69
Experimental data for the stability constant of BaEDTA2- [42,43,40,45,44,41,35] and reviews of relevant
stability constants [50,36] are available in the literature. The data given in Table 5 for extrapolation of the
literature data for the stability constant of BaEDTA2- to zero ionic strength are in very good agreement with
the value determined in the present work.
The complex formation of radium with EDTA has been studied by several researchers using the ion
exchange or solvent extraction methods and the experimental data have been reviewed [50,51]. Nikolsky
and co-workers were the first to study RaEDTA2- complex formation and obtained a log10 K value of 7.12
for RaEDTA2- [46]. The value was extrapolated to zero ionic strength assuming a temperature of 20 °C and
an ionic strength of 0.1 mol·l-1. Baetsle and Bengsch studied RaEDTA2- complex formation using an ion
exchange resin (Amberlite IR120) at 20 °C and an ionic strength of 0.1 mol·l-1 (sodium salt) and reported
a log10 K value of 7.07 ± 0.06 [47]. The concentration of EDTA4- was 0.01 mol·l-1 and an acetate buffer
was used. Such a high concentration of EDTA4- has a significant influence on the ionic strength, and
therefore, the actual ionic strength used was 0.19 mol·l-1 and this value has been used to extrapolate the
reported value to zero ionic strength. Sekine and co-workers used solvent extraction (a mixture of 0.1 M
thenoyltrifluoroacetone and 0.1 M tributylphosphate in CCl4) to study Ra2+ complex formation with various
amino carboxylic acids at 25 °C and 0.1 mol·l-1 NaClO4 and obtained a log10 K value of 7.7 for the
RaEDTA2- complex [48]. A log10 K value for RaEDTA2- was also estimated to be 7.4 for 25 °C and an ionic
strength of 0.1 mol·l-1 by Nelson and co-workers [49]. The RaEDTA2- stability constant obtained in this
work is in very good agreement with those of the other studies when taking into account differences in
temperature, ionic strength and difficulties in analyzing the literature data (experimental details missing,
high EDTA concentrations affecting the ionic media etc). Probably the best comparison of the RaEDTA2-
stability constants obtained in this work is with work of Sekine and co-workers and values obtained for
zero ionic strength from the two studies are in very good agreement.
The difference between log10 K°BaEDTA2- and log10 K°RaEDTA
2- is 0.73 log units. The difference is relatively
small which may indicate that the speciation of Ba2+, Ra2+, and potentially other alkaline earth metals with
EDTA4-, depends on the ionic radius of the metal ion. Extrapolation of the thermodynamic properties of
radium, including stability constants, from the property values of other alkaline-earth metals using an
electrostatic model is a widely used method [8]. A plot of the logarithm of stability constants of calcium
(taken from [25]), strontium (taken from [36] and extrapolated to zero ionic strength using the Davies
equation), barium and radium with EDTA4- at zero ionic strength and 25 ºC against the effective ionic radii
of these elements in 8-fold coordination (taken from Shannon [15]) is shown in Fig. 5.
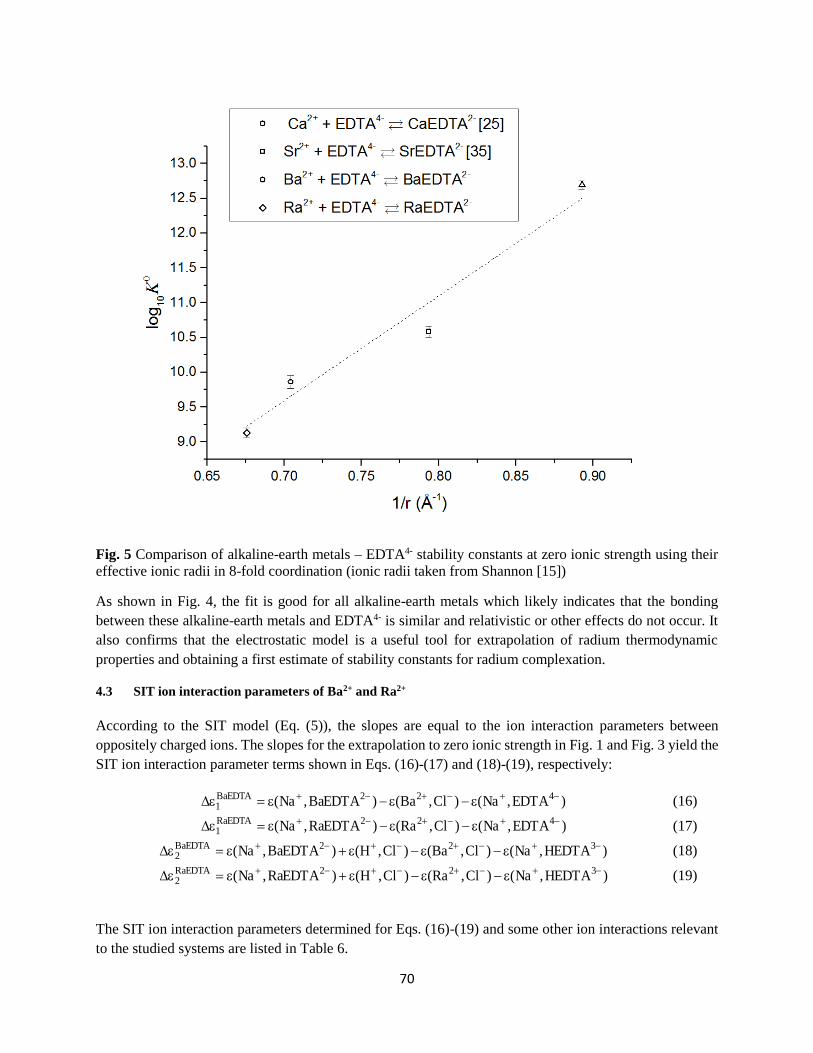
70
Fig. 5 Comparison of alkaline-earth metals – EDTA4- stability constants at zero ionic strength using their
effective ionic radii in 8-fold coordination (ionic radii taken from Shannon [15])
As shown in Fig. 4, the fit is good for all alkaline-earth metals which likely indicates that the bonding
between these alkaline-earth metals and EDTA4- is similar and relativistic or other effects do not occur. It
also confirms that the electrostatic model is a useful tool for extrapolation of radium thermodynamic
properties and obtaining a first estimate of stability constants for radium complexation.
4.3 SIT ion interaction parameters of Ba2+ and Ra2+
According to the SIT model (Eq. (5)), the slopes are equal to the ion interaction parameters between
oppositely charged ions. The slopes for the extrapolation to zero ionic strength in Fig. 1 and Fig. 3 yield the
SIT ion interaction parameter terms shown in Eqs. (16)-(17) and (18)-(19), respectively:
)EDTA,Na()Cl,Ba()BaEDTA,Na( 422BaEDTA1
(16)
)EDTA,Na()Cl,Ra()RaEDTA,Na( 422RaEDTA1
(17)
)HEDTA,Na()Cl,Ba()Cl,H()BaEDTA,Na( 322BaEDTA2
(18)
)HEDTA,Na()Cl,Ra()Cl,H()RaEDTA,Na( 322RaEDTA2
(19)
The SIT ion interaction parameters determined for Eqs. (16)-(19) and some other ion interactions relevant
to the studied systems are listed in Table 6.

71
Table 6. SIT ion interaction parameters kg·mol-1 of some metal ions and ligands relevant to the studied
systems at 25ºC
Interaction SIT parameters (kg·mol-1) Reference
Δε1(MgEDTA2-) -(0.52±0.04) [25]
Δε1(CaEDTA2-) -(0.5±0.5) [25]
Δε1(BaEDTA2-) -(0.44±0.07) Eq. 16 (This work)
Δε1(RaEDTA2-) -(0.54±0.06) Eq. 17 (This work)
Δε2(BaEDTA2-) 0.14±0.08 Eq. 18 (This work)
Δε2(RaEDTA2-) 0.10±0.07 Eq. 19 (This work)
ε(Na+, EDTA4-) 0.32±0.14 [24]
ε(Na+, HEDTA3-) -(0.10±0.14) [24]
ε(H+, Cl-) 0.12±0.01 [24]
ε(Ba2+, Cl-) 0.07±0.01 [24]
ε(Na+, MgEDTA2-) -(0.01±0.15) [24]
ε(Na+, BaEDTA2-) -(0.03±0.11) This work
ε(Na+, RaEDTA2-) -(0.10±0.11)* This work Uncertainties correspond to 95 % confidence interval.
* This value has been calculated using ε(Ba2+, Cl-) as a substitute for ε(Ra2+, Cl-).
As shown in Table 6, the SIT parameters for all of the listed alkaline-earth metal ions are very similar.
According to the SIT, interactions occur only between ions of opposite charge, which means that the
alkaline-earth metal ions undergo similar short- and long-range electrostatic interactions with EDTA4- and
Cl-. The SIT ion interaction parameters between Na+ and BaEDTA2- can be calculated as a weighted mean
(Eqs.(16) and (18)) and using the derived Δε1(BaEDTA2-) or Δε2(BaEDTA2-) and previously established
ion interaction parameters: ε(Ba2+, Cl-), ε(H+, Cl-), ε(Na+, EDTA4-) and ε(Na+, HEDTA3-) [24]. The SIT ion
interaction parameters between Na+ and RaEDTA2- can be calculated using the same method, with ε(Ba2+,
Cl-) continuing to substitute for ε(Ra2+, Cl-)). All parameters are listed in Table 6 and a comparison of the
computed ε(Na+, BaEDTA2-) and ε(Na+, RaEDTA2-) parameters with ε(Na+, MgEDTA2-), taken from the
literature [24], shows that all parameters are within the 95 % confidence intervals.
The barium ion interaction parameters are often used as a substitute for the radium parameters due to a lack
of experimental data in the case of radium [5,16,17]. It is possible to verify this methodology by calculation
of Δε1(RaEDTA2-) or Δε2(RaEDTA2-) (Eqs. (17) and (19)) using ε(Na+, EDTA4-), ε(Na+, HEDTA3-) and the
barium SIT parameters listed in Table 6 as substitutes for unknown radium parameters (i.e. ε(Na+,
BaEDTA2-) instead of ε(Na+, RaEDTA2-) and ε(Ba2+, Cl-) instead of ε(Ra2+, Cl-)). This results in
Δε1(RaEDTA2-) = -(0.42 ± 0.18) and Δε2(RaEDTA2-) = -(0.08 ± 0.18) which are within the 95 % confidence
intervals of the experimentally determined Δε1(RaEDTA2-) and Δε2(RaEDTA2-) SIT parameters. This
indicates that the method of using the barium SIT parameters as a substitute for those of radium is valid for
the Ra2+ – NaCl – EDTA4- system at ionic strengths below 3.5 mol·kg-1.
5. Conclusion
The apparent stability constants of the BaEDTA2- and RaEDTA2- complexes were determined over a wide
range of NaCl concentrations (0.2-2.5 M) at 25 °C and in two pH regions where the EDTA4- and HEDTA3-
72
species dominate. The obtained constants were extrapolated to zero ionic strength using the SIT and
compared with available literature data. It was found that in the pH region where the HEDTA3- species
dominates, the reaction of Ba2+ or Ra2+ with the HEDTA3- ligand results in the formation of the BaEDTA2-
and RaEDTA2- complexes and a proton and that formation of BaHEDTA- or RaHEDTA- does not occur in
alkaline media. The similarity of the barium and radium ion interaction parameters indicates that both metal
ions undergo almost identical short- and long-range electrostatic interactions with EDTA4- and Cl-. The
results also show that using the SIT interaction parameters of Ba2+ as a substitute for missing Ra2+ SIT
interaction parameters is a useful tool for the Ra2+ – NaCl – EDTA4- system.
References
1. Winter, M.: WebElements periodic table. https://www.webelements.com (1993). Accessed 27.12.2016
2. Eisenbud, M., Gesell, T.F.: Environmental Radioactivity from Natural, Industrial & Military Sources:
From Natural, Industrial and Military Sources. Academic press, (1997)
3. Nirdosh, I., Muthuswami, S.: Distribution of 230Th and other radionuclides in Canadian uranium mill
streams. Hydrometallurgy 20(1), 31-47 (1988). doi:http://dx.doi.org/10.1016/0304-
386X(88)90025-4
4. Tripathi, R., Sahoo, S., Jha, V., Khan, A., Puranik, V.: Assessment of environmental radioactivity at
uranium mining, processing and tailings management facility at Jaduguda, India. Applied Radiation
and Isotopes 66(11), 1666-1670 (2008). doi:http://dx.doi.org/10.1016/j.apradiso.2007.12.019
5. Paige, C., Kornicker, W., Hileman, O., Snodgrass, W.: Solution Equilibria for Uranium Ore Processing:
The BaSO4 - H2SO4 - H2O System and the RaSO4 - H2SO4 - H2O System. Geochimica et
cosmochimica acta 62(1), 15-23 (1998). doi:http://dx.doi.org/10.1016/S0016-7037(97)00320-7
6. Carvalho, F., Madruga, M., Reis, M., Alves, J., Oliveira, J., Gouveia, J., Silva, L.: Radioactivity in the
environment around past radium and uranium mining sites of Portugal. Journal of Environmental
Radioactivity 96(1), 39-46 (2007). doi:http://dx.doi.org/10.1016/j.jenvrad.2007.01.016
7. Zhang, T., Gregory, K., Hammack, R.W., Vidic, R.D.: Co-precipitation of radium with barium and
strontium sulfate and its impact on the fate of radium during treatment of produced water from
unconventional gas extraction. Environmental science & technology 48(8), 4596-4603 (2014).
doi:http://dx.doi.org/10.1021/es405168b
8. Langmuir, D., Riese, A.C.: The thermodynamic properties of radium. Geochimica et cosmochimica acta
49(7), 1593-1601 (1985). doi:http://dx.doi.org/10.1016/0016-7037(85)90264-9
9. Matyskin, A.V., Ebin, B., Tyumentsev, M., Allard, S., Skarnemark, G., Ramebäck, H., Ekberg, C.:
Disassembly of old radium sources and conversion of radium sulfate into radium carbonate for
subsequent dissolution in acid. Journal of Radioanalytical and Nuclear Chemistry 310(2), 589-595
(2016). doi:http://dx.doi.org/10.1007/s10967-016-4927-x
10. Brown, P.L., Ekberg, C., Ramebäck, H., Hedström, H., Matyskin, A.: Solubility of Radium and
Strontium Sulfate across the Temperature Range of 0 to 300° C. In: Uranium-Past and Future
Challenges. pp. 553-564. Springer, (2015)
11. Monnin, C.: A thermodynamic model for the solubility of barite and celestite in electrolyte solutions
and seawater to 200 C and to 1 kbar. Chemical Geology 153(1), 187-209 (1999).
doi:http://dx.doi.org/10.1016/S0009-2541(98)00171-5
12. Kozempel, J., Vlk, M., Floriánová, M., Drtinová, B., Němec, M.: Dissolution of [226Ra] BaSO4 as part
of a method for recovery of 226Ra from aged radium sources. Journal of Radioanalytical and
Nuclear Chemistry 304(1), 337-342 (2015). doi:http://dx.doi.org/10.1007/s10967-014-3433-2
13. Nixon, A., Keller, D., Fritze, K., Pidruczny, A., Corsini, A.: Radium removal from Elliot Lake uranium-
mill solids by EDTA leaching. Hydrometallurgy 10(2), 173-186 (1983).
doi:http://dx.doi.org/10.1016/0304-386X(83)90004-X
14. Kuznetsov, R., Butkalyuk, P., Butkalyuk, I.: A rapid method for radium regeneration from its sulfate.
Radiochemistry 55(1), 112-115 (2013). doi:http://dx.doi.org/10.1134/S1066362213010220

73
15. Shannon, R.t.: Revised effective ionic radii and systematic studies of interatomic distances in halides
and chalcogenides. Acta Crystallographica Section A: Crystal Physics, Diffraction, Theoretical and
General Crystallography 32(5), 751-767 (1976).
doi:http://dx.doi.org/10.1107/S0567739476001551
16. Rosenberg, Y., Metz, V., Oren, Y., Volkman, Y., Ganor, J.: Co-precipitation of radium in high ionic
strength systems: 2. Kinetic and ionic strength effects. Geochimica et Cosmochimica Acta 75(19),
5403-5422 (2011). doi:http://dx.doi.org/10.1016/j.gca.2011.07.013
17. Rosenberg, Y.O., Metz, V., Ganor, J.: Co-precipitation of radium in high ionic strength systems: 1.
Thermodynamic properties of the Na–Ra–Cl–SO 4–H 2 O system–estimating Pitzer parameters for
RaCl 2. Geochimica et Cosmochimica Acta 75(19), 5389-5402 (2011).
doi:http://dx.doi.org/10.1016/j.gca.2011.06.042
18. Gran, G.: Determination of the equivalence point in potentiometric titrations. Part II. Analyst 77(920),
661-671 (1952).
19. Decay Data Evaluation Project, L.N.H.B., France.
http://www.nucleide.org/DDEP_WG/DDEPdata.htm. Accessed 27th of December 2016
20. Brønsted, J.N.: Studies on solubility. IV. The principle of the specific interaction of ions. Journal of the
American Chemical Society 44(5), 877-898 (1922). doi:http://dx.doi.org/10.1021/ja01426a001
21. Brønsted, J.N.: Calculation of the osmotic and activity functions in solutions of uni-univalent salts.
Journal of the American Chemical Society 44(5), 938-948 (1922).
doi:http://dx.doi.org/10.1021/ja01426a003
22. Scatchard, G.: Concentrated solutions of strong electrolytes. Chemical Reviews 19(3), 309-327 (1936).
doi:http://dx.doi.org/10.1021/cr60064a008
23. Guggenheim, E., Turgeon, J.: Specific interaction of ions. Transactions of the Faraday Society 51, 747-
761 (1955).
24. Guillaumont, R., Fanghänel, T., Neck, V., Fuger, J., Palmer, D.A., Grenthe, I., Rand, M.H.: Update on
the chemical thermodynamics of uranium, neptunium, plutonium, americium and technetium.
Elsevier, (2003)
25. Hummel, W., Anderegg, G., Rao, L., Puigdomenech, I., Tochiyama, O.: Chemical thermodynamics of
compounds and complexes of U, Np, Pu, Am, Tc, Se, Ni and Zr with selected organic ligands, vol.
9. Elsevier, (2005)
26. Brown, P.L., Ekberg, C.: Hydrolysis of Metal Ions. Wiley VCH, (2016)
27. Felmy, A.R., Mason, M.J.: An aqueous thermodynamic model for the complexation of sodium and
strontium with organic chelates valid to high ionic strength. I. Ethylenedinitrilotetraacetic acid
(EDTA). Journal of solution chemistry 32(4), 283-300 (2003).
doi:http://dx.doi.org/10.1023/A:1023716703517
28. Botts, J., Chashin, A., Young, H.L.: Alkali Metal Binding by Ethylenediaminetetraacetate, Adenosine
5'-Triphosphate, and Pyrophosphate*. Biochemistry 4(9), 1788-1796 (1965).
doi:http://dx.doi.org/10.1021/bi00885a015
29. Daniele, P.G., Rigano, C., Sammartano, S.: Ionic strength dependence of formation constants. Alkali
metal complexes of ethylenediaminetetraacetate nitrilotriacetate, diphosphate, and
tripolyphosphate in aqueous solution. Analytical Chemistry 57(14), 2956-2960 (1985).
doi:http://dx.doi.org/10.1021/ac00291a046
30. Palaty, V.: Sodium Chelates of Ethylenediaminetetraacetic Acid. Canadian Journal of Chemistry 41(1),
18-20 (1963). doi:http://dx.doi.org/10.1139/v63-004
31. Sal'nikov, Y., Boos, G., Gibadullina, K., Basyrova, R., Shakirova, N.: Ethylenediaminetetraacetate
complexes of patassium and sodium and dissociation of EDTA in aqueous-acetonitrile and
aqueous-dioxane media. Russian journal of inorganic chemistry 36(5), 745-749 (1991).
32. Daniele, P.G., Foti, C., Gianguzza, A., Prenesti, E., Sammartano, S.: Weak alkali and alkaline earth
metal complexes of low molecular weight ligands in aqueous solution. Coordination Chemistry
Reviews 252(10), 1093-1107 (2008). doi:http://dx.doi.org/10.1016/j.ccr.2007.08.005

74
33. Marcus, Y., Hefter, G.: Ion pairing. Chemical reviews 106(11), 4585-4621 (2006).
doi:http://dx.doi.org/10.1021/cr040087x
34. Allard, S., Ekberg, C.: Complexing properties of α-isosaccharinate: stability constants, enthalpies and
entropies of Th-complexation with uncertainty analysis. Journal of solution chemistry 35(8), 1173-
1186 (2006). doi:http://dx.doi.org/10.1007/s10953-006-9048-7
35. Schwarzenbach, G.v., Ackermann, H.: Komplexone V. Die Äthylendiamin‐tetraessigsäure. Helvetica
Chimica Acta 30(6), 1798-1804 (1947). doi:http://dx.doi.org/10.1002/hlca.19470300649
36. Martell, A.E., Smith, R.M.: Critical stability constants, vol. 6. Springer, (1974)
37. Schwarzenbach, G., Gut, R., Anderegg, G.: Komplexone XXV. Die polarographische Untersuchung
von Austauschgleichgewichten. Neue Daten der Bildungskonstanten von Metallkomplexen der
Äthylendiamin‐tetraessigsäure und der 1, 2‐Diaminocyclohexan‐tetraessigsäure. Helvetica
Chimica Acta 37(4), 937-957 (1954). doi:http://dx.doi.org/10.1002/hlca.19540370402
38. Davies, C.W.: Ion association. Butterworths, (1962)
39. Stumm, W., Morgan, J.J.: Aquatic chemistry: chemical equilibria and rates in natural waters, vol. 126.
John Wiley & Sons, (2012)
40. Carini, F.F., Martell, A.E.: Thermodynamic quantities associated with the interaction between
ethylenediaminetetraacetate and alkaline earth ions. Journal of the American Chemical Society
76(8), 2153-2157 (1954). doi:http://dx.doi.org/10.1021/ja01637a032
41. Schmid, R., Reilley, C.N.: A rapid electrochemical method for the determination of metal chelate
stability constants. Journal of the American Chemical Society 78(21), 5513-5518 (1956).
doi:http://dx.doi.org/10.1021/ja01602a016
42. Astakhov, K., Fomenko, M.: The use of the Ca-45 isotope in the determination of the instability
constants of intracomplex compounds formed by alkali earth metals with
ethylenediaminotetraacetic acid. Zhurnal Fizicheskoi Khimii 31(9), 2110-2120 (1957).
43. Bohigian, T., Martell, A.: Progress Report US Atomic Energy Comm. Contract No. AT,(30-1)-1823
(1960).
44. Jokl, V., Majer, J.: Investigation of complex compounds in solution using paper electrophoresis. IV.
Complexes of 1, 3-diamino-2-propanol-N, N, N′, N′-tetraacetic acid. Chem. Vesti 19, 249-258
(1965).
45. Delgado, R., Da Silva, J.F.: Metal complexes of cyclic tetra-azatetra-acetic acids. Talanta 29(10), 815-
822 (1982). doi:http://dx.doi.org/10.1016/0039-9140(82)80251-8
46. Nikolsky, B.P., Trofimov, A.M., Vysokoostrovskaya, N.B.: Complex formation of barium and radium
in Trilon B solutions. Radiochemistry 1(2), 147-154 (1959).
47. Baetsle, L., Bengsch, E.: Ion-exchange characteristics of the radium-ethylene-diaminetetraacetate
complex. Journal of Chromatography A 8, 265-273 (1962). doi:http://dx.doi.org/10.1016/S0021-
9673(01)99257-X
48. Sekine, T., Kawashima, Y., Unnai, T., Sakairi, M.: Studies of the Alkaline Earth Complexes in Various
Solutions. IV. Solvent Extraction Study of Radium (II) Complexes with Some Aminocarboxylic
Acids in Perchlorate Media. Bulletin of the Chemical Society of Japan 41(12), 3013-3015 (1968).
doi:http://dx.doi.org/10.1246/bcsj.41.3013
49. Nelson, F., Day, R., Kraus, K.: Anion exchange studies—XXX a number of elements in
ethylenediaminetetraacetic acid solutions. Journal of Inorganic and Nuclear Chemistry 15(1-2),
140-150 (1960). doi:http://dx.doi.org/10.1016/0022-1902(60)80022-X
50. Anderegg, G.: Critical Survey of Stability Constants of EDTA Complexes: Critical Evaluation of
Equilibrium Constants in Solution: Stability Constants of Metal Complexes. Elsevier, (2013)
51. Vdovenko, V.M., Dubasov, Y.V.: Analytical chemistry of radium. Wiley, (1976)