Embed Size (px)
Citation preview
Study into River Bank Collapsing for Lower River Murray
GEOTECHNICAL INVESTIGATION REPORT
Rev E – FINAL February 2010

Study into River Bank Collapsing for Lower River Murray
GEOTECHNICAL INVESTIGATION REPORT
Rev E – FINAL February 2010
Sinclair Knight Merz ABN 37 001 024 095 590 Orrong Road, Armadale 3143 PO Box 2500 Malvern VIC 3144 Australia Tel: +61 3 9248 3100 Fax: +61 3 9248 3364 Web: www.skmconsulting.com COPYRIGHT: The concepts and information contained in this document are the property of Sinclair Knight Merz Pty Ltd. Use or copying of this document in whole or in part without the written permission of Sinclair Knight Merz constitutes an infringement of copyright.

Study into River Bank Collapsing for Lower River Murray Geotechnical Investigation Report
SINCLAIR KNIGHT MERZ
VW04794_MurrayRiverbank_Geotech_RevE_FINAL_20100217.docx PAGE i
Contents Executive Summary 2 1. Introduction 6 2. Scope of Work 7 3. Data Sources 9 4. Geotechnical Investigation 10
4.1. Field Investigation 10 4.1.1. Boreholes 10 4.1.2. In-situ Testing 11 4.1.3. CPTu Testing 11 4.1.4. Dilatometer Tests 12 4.2. Laboratory Testing 13
5. Assessment Criteria 14 5.1. Study Area 14 5.2. Failure Modes 14 5.3. Geometry 14 5.4. Soil Types 15 5.5. Stability Criteria 17
6. Riverfront Road-Murray Bridge 18 6.1. Site Geology 18 6.2. Subsurface Condition 18 6.3. Groundwater 18 6.4. Soil Parameter Plots 18 6.5. River Bank Issues 19 6.6. Stability Assessment 20 6.7. Discussion 20 6.8. Recommendations 22
7. Caloote 23 7.1. Site Geology 23 7.2. Subsurface Condition 23 7.3. Groundwater 23 7.4. Soil Parameter Plots 23 7.5. River Bank Issues 24 7.6. Stability Assessment 25 7.7. Discussion 25 7.8. Recommendations 27

Study into River Bank Collapsing for Lower River Murray Geotechnical Investigation Report
SINCLAIR KNIGHT MERZ
VW04794_MurrayRiverbank_Geotech_RevE_FINAL_20100217.docx PAGE ii
8. Woodlane Reserve 28 8.1. Site Geology 28 8.2. Subsurface Condition 28 8.3. Groundwater 28 8.4. Soil Parameter Plots 28 8.5. River Bank Issues 29 8.6. Stability Assessment 29 8.7. Discussion 30 8.8. Recommendations 31
9. South Punyelroo 32 9.1. Site Geology 32 9.2. Subsurface Condition 32 9.3. Groundwater 32 9.4. Soil Parameter Plots 32 9.5. River Bank Issues 33 9.6. Stability Assessment 33 9.7. Discussion 33 9.8. Recommendations 35
10. East Front Road 36 10.1. Site Geology 36 10.2. Subsurface Condition 36 10.3. Groundwater 36 10.4. Soil Parameter Plots 36 10.5. River Bank Issues 37 10.6. Stability Assessment 38 10.7. Discussion 38 10.8. Recommendations 39
11. Swan Reach 41 11.1. Site Geology 41 11.2. Subsurface Condition 41 11.3. Groundwater 41 11.4. Soil Parameters 41 11.5. River Bank Issues 42 11.6. Stability Assessment 42 11.7. Discussion 42 11.8. Recommendations 44
12. Walker Flat 45 12.1. Site Geology 45

Study into River Bank Collapsing for Lower River Murray Geotechnical Investigation Report
SINCLAIR KNIGHT MERZ
VW04794_MurrayRiverbank_Geotech_RevE_FINAL_20100217.docx PAGE iii
12.2. Subsurface Condition 45 12.3. Groundwater 45 12.4. Soil Parameters 45 12.5. River Bank Issues 45 12.6. Stability Assessments 46 12.7. Discussion 46 12.8. Recommendations 47
13. Remedial Works 48 13.1. Modification of the Geometry 48 13.1.1. Removal of Material from Top of the Slope 48 13.1.2. Removal of Weak Materials 48 13.1.3. Modification of the Slope 49 13.2. Buttressing 49 13.2.1. Soil / Rock Fill / Gabions or Geotextile 49 13.2.2. Shear Key 50 13.3. Drainage 50 13.3.1. Surface Drainage 50 13.3.2. Subsurface Drainage 50 13.4. Reinforcement 51 13.4.1. Soil Nailing 51 13.4.2. Stone Columns / Soil Mixing 51 13.4.3. Retaining Wall / Sheetpile / Driven Piles 52 13.5. Strength Improvement 52 13.5.1. Electro Osmosis 52 13.5.2. Grouting 52
14. Conclusion 53 15. Recommendations 54 16. References 56 Photographs 57 Figures 73 Appendix A Riverfront Road-Murray Bridge In-situ and Laboratory Test Results 76 Appendix B Caloote In-situ and Laboratory Data 77 Appendix C Woodlane Reserve In-situ and Laboratory Data 78 Appendix D South Punyelroo In-situ and Laboratory Data 79 Appendix E East Front Road In-situ and Laboratory Data 80 Appendix F Swan Reach In-situ and Laboratory Data 81 Appendix G Walker Flat In-situ and Laboratory Data 82

Study into River Bank Collapsing for Lower River Murray Geotechnical Investigation Report
SINCLAIR KNIGHT MERZ
VW04794_MurrayRiverbank_Geotech_RevE_FINAL_20100217.docx PAGE 1
LIMITATION STATEMENT This report has been prepared solely for the use of DWBLC and shall not be used or relied on by any other party without SKM’s consent. The sole purpose of this report is to present the findings of geotechnical investigations carried out by Sinclair Knight Merz (“SKM”) for DWLBC in connection with seven site locations along the Lower River Murray (for the purpose of this limitation statement to be known collectively and individually as the context requires as “the Site”). This report was produced in accordance with and is limited to the scope of services set out in the contract between SKM and DWLBC. That scope of services, as described in this report, was developed with DWLBC. Undertaking an assessment or study of on-site conditions is a useful tool in identifying risk and may assist in reducing the potential for exposure to the presence of inadequate bearing ground. All reports and conclusions that deal with sub-surface conditions are based on interpretation and judgement and as a result have uncertainty attached to them. You should be aware that this report contains interpretations and conclusions which are uncertain, due to the nature of the investigations. No study can completely eliminate risk, and even a rigorous assessment and/or sampling programme may not detect all problem areas within a site. This report is based on assumptions that the site conditions as revealed through sampling are indicative of conditions throughout the Site. The findings are the result of standard assessment techniques used in accordance with normal practices and standards, and (to the best of SKM’s knowledge) they represent a reasonable interpretation of the current conditions on the Site. However, all sampling techniques, by definition, cannot determine the conditions between the sample points and so the report can only provide an indication of, and cannot be taken to be a full representation of, the sub-surface conditions. It is an indication only of the likely sub surface conditions. Conditions at Site may change over time and may be different from those SKM infers based on its sampling techniques. The passage of time, manifestation of latent conditions or impacts of future events may require further examination of the Site and subsequent data analysis, and re-evaluation of the data, findings, observations and conclusions expressed in this report. In preparing this report, SKM has relied upon, and presumed accurate, any information (or confirmation of the absence thereof) provided by DWLBC and/or from other sources. Except as otherwise stated in the report, SKM has not attempted to verify the accuracy or completeness of any such information. If the information is subsequently determined to be false, inaccurate or incomplete then it is possible that our observations and conclusions as expressed in this report may change. SKM derived the data in this report from visual site inspections, detailed geotechnical investigations, information sourced from DWLBC and/or available in the public domain at the time or times outlined in this report. The passage of time, manifestation of latent conditions or impacts of future events may require further examination of the project and subsequent data analysis, and re-evaluation of the data, findings, observations and conclusions expressed in this report. SKM has prepared this report in accordance with the usual care and thoroughness of the consulting profession, for the sole purpose described above and by reference to applicable standards, guidelines, procedures and practices at the date of issue of this report. For the reasons outlined above and, to the extent permitted by law, no other warranty or guarantee, whether expressed or implied, is made as to the data, observations and findings expressed in this report, to the extent permitted by law. This report does not address environmental or geo-environmental issues including the presence of any contaminants or hazardous materials at the Site. Except as specifically stated in this report, SKM makes no statement or representation of any kind concerning the suitability of the Site for any purpose or the permissibility of any use. Use of the Site for any purpose may require planning and other approvals and, in some cases, Environmental Protection Authority and accredited site auditor approvals. SKM offers no opinion as to the likelihood of obtaining any such approvals, or the conditions and obligations which such approvals may impose, which may include the requirement for additional environmental investigations and/or works. This report should be read in full and no excerpts are to be taken as representative of the findings. No responsibility is accepted by SKM for use of any part of this report in any other context. This report has been prepared on behalf of, and for the exclusive use of, DWLBC, and is subject to, and issued in accordance with, the provisions of the agreement between SKM and DWLBC. SKM accepts no liability or responsibility whatsoever for, or in respect of, any use of, or reliance upon, this report by any third party. This Report was prepared solely for DWLBC and the matters covered by our Report and the emphasis placed on them may not necessarily address all or any specific concerns, purposes, requirements or interests of any third party. Our instructions were provided solely by DWLBC and may be different from those a third party would have provided. Third party interests and needs may be different to those of DWLBC. In particular, our Report does not cover all matters that a third party may wish to investigate and that there may be matters of interest to third parties which have not been considered to be material for the Report or investigated to the extent required. Third parties should not rely on this report and should seek their own advice to the matters addressed. The Report is strictly limited to the matters stated in it and does not extend by implication to any other matter. If DWLBC proposes to release the whole or any part of the Report to any third party DWLBC shall include appropriate limitations and disclaimers releasing SKM from any liability arising from any use or reliance by such third party.

Study into River Bank Collapsing for Lower River Murray Geotechnical Investigation Report
SINCLAIR KNIGHT MERZ
VW04794_MurrayRiverbank_Geotech_RevE_FINAL_20100217.docx PAGE 2
Executive Summary This report contains results, discussions and recommendations, related to Phase 3 of the “Study into River Bank Collapsing - Lower River Murray”, comprising the results of geotechnical site investigation and slope stability assessment at seven sites along the Lower River Murray which are shown in Figure 1. In absence of a quantitative risk assessment for the sites, the critical sites for the further studies have been defined by DWLBC.
Key findings, resulting from the geotechnical assessments at the investigated locations, are summarised below. The recommendations encompass the need for DWLBC’s duty of care to minimise consequences of bank collapse due to lowering river’s water levels to RL-1.50m AHD for the next three years. The location of recommended fence lines shown on Figures 1-7 represents our assessment of the area where Factor of Safety (FoS) value is 1.5.
Summary of the Findings
LOCATION SECTION SAFETY FACTOR (Existing Condition)
SAFETY FACTOR (Lowering River)
Probability of Failure*
Riverfront Road‐Murray Bridge
Boat Ramp 1.27 1.18 Very High
Riverside Properties 1.13 1.05
Caloote Car Park Area ‐ Southern Area 1.14 1.06 Very High
Woodlane Reserve Car Park Area 1.38 1.20 Very High
South Punyelroo Residential Area >1.50 >1.50 Low
East Front Road EF1 1.30 1.23
Very High EF2 1.02 0.95
Swan Reach Waste Disposal Facility >1.50 >1.50 Low
Walker Flat Waste Disposal Facility 1.02 0.94 Very High
*Note: The average Factor of Safety and Factors of Safety associated with 5% probability of failure have been adopted for the stability classification of the sites:
Riverfront Road-Murray Bridge
The results of our investigations indicate that this is a VERY HIGH RISK area and it is recommended that the reserve and access road for the riverfront properties within the study area should be fenced off and properly signed to stop all pedestrian and vehicle traffic. The location of recommended fencing is shown in Figure 2. The area should be monitored for deformation and any sign of instability. The effects of using the lagoons for surface water collection on the stability of the riverbank should be studied. River traffic should be warned of the very high probability of failure and advised not to moor in the area.

Study into River Bank Collapsing for Lower River Murray Geotechnical Investigation Report
SINCLAIR KNIGHT MERZ
VW04794_MurrayRiverbank_Geotech_RevE_FINAL_20100217.docx PAGE 3
Caloote
The results of our investigations indicate that this is a VERY HIGH RISK area. In addition to the risk of bank failure, the riverside properties in the southern area are also at risk of rock-fall from limestone overhangs. As a consequence, we recommend that the residents in the south eastern area should be advised that there is a high risk of bank failure and rock fall. No immediate damage to the structure of the riverside properties in the northern area is expected; however, the road and car park areas are high risk.
We recommend that access to the boat ramp, parking area adjacent to river and residential area in the south eastern areas; and the access road after the residential area in northern area should be fenced off and properly signed to stop public and vehicle traffic. The location of recommended fencing is shown in Figure 3. The area should be monitored for deformation and any sign of instability. River traffic should be warned of the very high probability of failure and advised not to moor in the area.
Woodlane Reserve
The results of our investigations indicate that this is a VERY HIGH RISK area. We recommend that public and residents of the seven riverside properties be advised that there is a high risk of bank failure at this site, and this risk will be increased after further reduction in the water level (below RL-0.80mAHD). The residents may still use the access road when water level is above RL-0.80m, but it is advised that the cars be parked within the residential properties and away from the river if the water levels fall below RL-0.80mAHD. Road users should be cautioned against parking in proximity to the river. The location of recommended fencing is shown in Figure 4. The area should be monitored for deformation and any sign of instability. River traffic should be warned of the very high probability of failure and advised not to moor in the area.
South Punyelroo
The results of our investigations indicate that this is a LOW RISK area. Slope stability analyses in the vicinity of the river side properties, based on observed existing static conditions, indicate that the FoS against slope failure, in this area, is well above the FoS that would normally be considered acceptable, for permanent areas used by the public. It is considered likely that further reductions in water level will not affect the stability of the properties; however, it may result in settlement and new cracks.
We recommend that the residents of these riverside properties be advised to monitor the cracks for accelerating ground movements. No fencing is required at this location.

Study into River Bank Collapsing for Lower River Murray Geotechnical Investigation Report
SINCLAIR KNIGHT MERZ
VW04794_MurrayRiverbank_Geotech_RevE_FINAL_20100217.docx PAGE 4
East Front Road
Our studies in a limited part of the road indicated that this site is VERY HIGH RISK. Furthermore, quality of the material used for the road construction is poor so on-going cracking in the section is likely. The shape and distribution of the cracks indicate that possible failure zones have already developed and the remedial works undertaken on the asphalt wearing cannot solve the problem or reduce the probability of the failure.
The responsible authority should decide on road closure and urgent remedial studies and works (such as detailed stability assessment) for the road alignment and the development of a new alignment away from the area of possible failure.
We recommend that the road in vicinity of the river should be signed as Very High Risk for road embankment failure in to the river. Furthermore, a reduced speed limit should be applied to the public to avoid car fall into the possible embankment failures. The road should be monitored weekly; however, after water level reduction to below RL-0.80mAHD or heavy rain falls, the road should be monitored more frequently for failure/deformation (at least twice a week). River traffic should be warned of the very high probability of failure and advised not to moor in the area.
Swan Reach
The results of our investigations indicate that this is a LOW RISK site. Slope stability analyses in the vicinity of the river side property, based on observed existing static conditions, indicate that the FoS against slope failure, is above the FoS that would normally be considered acceptable, for permanent areas used by the public. It is considered likely that further reductions in water level will not affect the stability of the properties.
We recommend that the owners of these riverside properties be advised to monitor the cracks for accelerating ground movements. No fencing is required at this location.
Walker Flat
The results of our investigations indicate that this is a VERY HIGH RISK area and it is considered highly likely that further reductions in water level may trigger a slope (bank) failure in this area. We recommend that public and operators be advised on the high risk of bank failure in the area and the area to be closed to traffic and car parking. Proper measures for closure and removal of important facilities in the area should be considered. It should be noted that the extent of the problem may be beyond the study area. River traffic should be warned of the very high probability of failure and advised not to moor in the area.

Study into River Bank Collapsing for Lower River Murray Geotechnical Investigation Report
SINCLAIR KNIGHT MERZ
VW04794_MurrayRiverbank_Geotech_RevE_FINAL_20100217.docx PAGE 5
Remediation Works
A series of potential bank remediation options have been considered in this report. Bank remediation options to address issues of bank collapse as assessed at these sites could be difficult and may not be considered economically practical.
Recommended Development of a Risk Map
The findings of this study, so far, highlight the potential risk of bank failures in some parts of the Lower River Murray, caused by continuing reductions in river level. Further investigations are recommended to determine the distribution of areas where bank collapsing is a high risk and is associated with high consequences. We recommend that a bank failure risk map be prepared for the river’s alignment which could be used as a tool for further management decisions, such as requirements for additional studies on potential for bank failures at other locations along the Lower River Murray.
Risk Avoidance and Separation
Until further work is carried out to determine the extent of the hazard we continue to recommend a strategy of risk avoidance and separation, where measures are taken to avoid the exposure of the public to the hazard, such as limiting access to river banks. Ongoing monitoring in areas deemed to have a high consequence exposure is recommended to support this strategy of risk avoidance and separation.
Guidance on Use of Report
The Report presents the results of specific investigations at specific sites in accordance with the Scope of Work. The results and recommendations outlined in the Report relate only to those specific sites that have been investigated and are not representative of the conditions at other locations and sites that have not been assessed. The results of investigations should not be used to draw conclusions about the potential for bank failures at locations that have not been assessed. There may be collapses in areas of riverbank that have not been inspected or investigated.
The results and recommendations outlined in the Report are intended to be read in the context of the limitations discussed more fully in the limitations section at the end of the Report. The way in which this report is used to manage the risks associated with river bank collapsing is the responsibility of DWLBC.

Figure 1

Figure 2

Figure 3

Figure 4

Figure 5

Figure 6

Figure 7

Figure 8

1.27
Assessment of the Existing ConditionsRiver Water Level at -0.80m AHDSurcharge of the Properties and Cars
FILL
Study into Riverbank Collapsing for Lower Murray RiverSturt Reserve - Section SR1
Very Soft Clay
Clayey Sand / Sandy Clay
Name: FILL Model: Mohr-Coulomb Unit Weight: Multiple Trial: 18 kN/m³Cohesion: Multiple Trial: 2 kPaPhi: Multiple Trial: 28 °
Name: Very Soft Clay Model: S=f(depth) Unit Weight: Multiple Trial: 16 kN/m³C-Top of Layer: Multiple Trial: 10 kPaC-Rate of Change: 1.25 kPa/mLimiting C: Multiple Trial: 25 kPa
Name: Clayey Sand Model: Mohr-Coulomb Unit Weight: Multiple Trial: 17 kN/m³Cohesion: Multiple Trial: 2 kPaPhi: Multiple Trial: 30 °
Lagoon Surcharge: 2.5 kPa
Distance (m)0 20 40 60 80 100 120 140 160 180 200
Ele
vatio
n (m
AH
D)
-50
-40
-30
-20
-10
0
10
20
30
Figure 9

1.18
Assessment of the Future ConditionsRiver Water Level at -1.50m AHDSurcharge of the Properties and Cars
FILL
Study into Riverbank Collapsing for Lower Murray RiverSturt Reserve - Section SR1
Very Soft Clay
Clayey Sand / Sandy Clay
Name: FILL Model: Mohr-Coulomb Unit Weight: Multiple Trial: 18 kN/m³Cohesion: Multiple Trial: 2 kPaPhi: Multiple Trial: 28 °
Name: Very Soft Clay Model: S=f(depth) Unit Weight: Multiple Trial: 16 kN/m³C-Top of Layer: Multiple Trial: 10 kPaC-Rate of Change: 1.25 kPa/mLimiting C: Multiple Trial: 25 kPa
Name: Clayey Sand Model: Mohr-Coulomb Unit Weight: Multiple Trial: 17 kN/m³Cohesion: Multiple Trial: 2 kPaPhi: Multiple Trial: 30 °
Lagoon Surcharge: 2.5 kPa
Distance (m)0 20 40 60 80 100 120 140 160 180 200
Ele
vatio
n (m
AH
D)
-50
-40
-30
-20
-10
0
10
20
30
Figure 10

1.13
Assessment of the Existing ConditionRiver Water Level at -0.80m AHD
FILL
Study into Riverbank Collapsing for Lower Murray RiverSturt Reserve - Section SR2
Very Soft Clay
Clayey Sand / Sandy Clay
Name: FILL Model: Mohr-Coulomb Unit Weight: Multiple Trial: 18 kN/m³Cohesion: Multiple Trial: 2 kPaPhi: Multiple Trial: 28 °
Name: Very Soft Clay Model: S=f(depth) Unit Weight: Multiple Trial: 16 kN/m³C-Top of Layer: Multiple Trial: 10 kPaC-Rate of Change: 1.25 kPa/mLimiting C: Multiple Trial: 25 kPa
Name: Clayey Sand Model: Mohr-Coulomb Unit Weight: Multiple Trial: 17 kN/m³Cohesion: Multiple Trial: 2 kPaPhi: Multiple Trial: 30 °
Distance (m)0 10 20 30 40 50 60 70 80 90 100 110 120 130 140 150
Ele
vatio
n (m
AH
D)
-50
-40
-30
-20
-10
0
10
20
30
Figure 11

1.05
Assessment of the Future ConditionsRiver Water Level at -1.50m AHD
FILL
Study into Riverbank Collapsing for Lower Murray RiverSturt Reserve - Section SR2
Very Soft Clay
Clayey Sand / Sandy Clay
Name: FILL Model: Mohr-Coulomb Unit Weight: Multiple Trial: 18 kN/m³Cohesion: Multiple Trial: 2 kPaPhi: Multiple Trial: 28 °
Name: Very Soft Clay Model: S=f(depth) Unit Weight: Multiple Trial: 16 kN/m³C-Top of Layer: Multiple Trial: 10 kPaC-Rate of Change: 1.25 kPa/mLimiting C: Multiple Trial: 25 kPa
Name: Clayey Sand Model: Mohr-Coulomb Unit Weight: Multiple Trial: 17 kN/m³Cohesion: Multiple Trial: 2 kPaPhi: Multiple Trial: 30 °
Distance (m)0 10 20 30 40 50 60 70 80 90 100 110 120 130 140 150
Ele
vatio
n (m
AH
D)
-50
-40
-30
-20
-10
0
10
20
30
Figure 12

1.14
Assessment of the Existing ConditionsRiver Water Level at -0.80m AHDSurcharge of the Properties and Cars
FILL
Study into Riverbank Collapsing for Lower Murray RiverCaloote - Section CA2
Very Soft Clay
Clayey Sand / Sandy Clay
Name: FILL Model: Mohr-Coulomb Unit Weight: Multiple Trial: 18 kN/m³Cohesion: Multiple Trial: 2 kPaPhi: Multiple Trial: 28 °
Name: Very Soft Clay Model: S=f(depth) Unit Weight: Multiple Trial: 16 kN/m³C-Top of Layer: Multiple Trial: 10 kPaC-Rate of Change: 1.07 kPa/mLimiting C: Multiple Trial: 17.5 kPa
Name: Clayey Sand Model: Mohr-Coulomb Unit Weight: Multiple Trial: 19 kN/m³Cohesion: Multiple Trial: 2 kPaPhi: Multiple Trial: 30 °
Surcharge: 2.5 kPa
Distance (m)0 10 20 30 40 50 60 70 80 90 100 110 120 130 140 150
Ele
vatio
n (m
AH
D)
-50
-40
-30
-20
-10
0
10
20
30
Figure 13

1.06
Assessment of the Existing ConditionsRiver Water Level at -1.50m AHDSurcharge of the Properties and Cars
FILL
Study into Riverbank Collapsing for Lower Murray RiverCaloote - Section CA2
Very Soft Clay
Clayey Sand / Sandy Clay
Name: FILL Model: Mohr-Coulomb Unit Weight: Multiple Trial: 18 kN/m³Cohesion: Multiple Trial: 2 kPaPhi: Multiple Trial: 28 °
Name: Very Soft Clay Model: S=f(depth) Unit Weight: Multiple Trial: 16 kN/m³C-Top of Layer: Multiple Trial: 10 kPaC-Rate of Change: 1.07 kPa/mLimiting C: Multiple Trial: 17.5 kPa
Name: Clayey Sand Model: Mohr-Coulomb Unit Weight: Multiple Trial: 19 kN/m³Cohesion: Multiple Trial: 2 kPaPhi: Multiple Trial: 30 °
Surcharge: 2.5 kPa
Distance (m)0 10 20 30 40 50 60 70 80 90 100 110 120 130 140 150
Ele
vatio
n (m
AH
D)
-50
-40
-30
-20
-10
0
10
20
30
Figure 14

1.38
Assessment of the Existing ConditionsRiver Water Level at -0.80m AHDSurcharge of the Properties and Cars
Study into Riverbank Collapsing for Lower Murray RiverWoodlane Reserve - Section WR1 Name: FILL
Model: Mohr-Coulomb Unit Weight: 17 kN/m³Cohesion: 0 kPaPhi: Multiple Trial: 30 °
Name: Very Soft Clay (CH) Model: Undrained (Phi=0) Unit Weight: 17 kN/m³Cohesion: Multiple Trial: 20 kPa
Name: Sand / Clay (loose) Model: Mohr-Coulomb Unit Weight: 20 kN/m³Cohesion: 0 kPaPhi: Multiple Trial: 29 °
Name: Sand / Silt Model: Mohr-Coulomb Unit Weight: 20 kN/m³Cohesion: 0 kPaPhi: Multiple Trial: 30 °
Name: Type 3C Model: Mohr-Coulomb Unit Weight: 20 kN/m³Cohesion: 0 kPaPhi: Multiple Trial: 31 °
Surcharge: 2.5 kPa
Distance (m)0 10 20 30 40 50 60 70 80 90 100 110 120 130 140 150
Ele
vatio
n (m
AH
D)
-50
-40
-30
-20
-10
0
10
20
30
Figure 15

1.20
Assessment of the Existing ConditionsRiver Water Level at -1.50m AHDSurcharge of the Properties and Cars
Study into Riverbank Collapsing for Lower Murray RiverWoodlane Reserve - Section WR1 Name: FILL
Model: Mohr-Coulomb Unit Weight: 17 kN/m³Cohesion: 0 kPaPhi: Multiple Trial: 30 °
Name: Very Soft Clay (CH) Model: Undrained (Phi=0) Unit Weight: 17 kN/m³Cohesion: Multiple Trial: 20 kPa
Name: Sand / Clay (loose) Model: Mohr-Coulomb Unit Weight: 20 kN/m³Cohesion: 0 kPaPhi: Multiple Trial: 29 °
Name: Sand / Silt Model: Mohr-Coulomb Unit Weight: 20 kN/m³Cohesion: 0 kPaPhi: Multiple Trial: 30 °
Name: Type 3C Model: Mohr-Coulomb Unit Weight: 20 kN/m³Cohesion: 0 kPaPhi: Multiple Trial: 31 °
Surcharge: 2.5 kPa
Distance (m)0 10 20 30 40 50 60 70 80 90 100 110 120 130 140 150
Ele
vatio
n (m
AH
D)
-50
-40
-30
-20
-10
0
10
20
30
Figure 16

1.38
Assessment of the Existing ConditionsRiver Water Level at -0.80m AHDSurcharge of the Properties and Cars
Study into Riverbank Collapsing for Lower Murray RiverWoodlane Reserve - Section WR2
Name: FILL Model: Mohr-Coulomb Unit Weight: 17 kN/m³Cohesion: 0 kPaPhi: Multiple Trial: 30 °
Name: Type B1 Clay Model: Undrained (Phi=0) Unit Weight: Multiple Trial: 17 kN/m³Cohesion: Multiple Trial: 50 kPa
Name: Type B2 Clay Model: Undrained (Phi=0) Unit Weight: Multiple Trial: 17 kN/m³Cohesion: Multiple Trial: 25 kPa
Name: Type C1 Silty Sand Model: Mohr-Coulomb Unit Weight: Multiple Trial: 17 kN/m³Cohesion: 0 kPaPhi: Multiple Trial: 30 °
Name: Type B3 Clay Model: Undrained (Phi=0) Unit Weight: Multiple Trial: 17 kN/m³Cohesion: Multiple Trial: 50 kPa
Name: Type B4 Clay Model: S=f(depth) Unit Weight: Multiple Trial: 17 kN/m³C-Top of Layer: Multiple Trial: 28 kPaC-Rate of Change: Multiple Trial: 7.2 kPa/mLimiting C: Multiple Trial: 46 kPa
Name: Type C2 Silty Sand Model: Mohr-Coulomb Unit Weight: Multiple Trial: 20 kN/m³Cohesion: 1 kPaPhi: Multiple Trial: 31 °
Surcharge: 2.5 kPa
Distance (m)0 10 20 30 40 50 60 70 80 90 100 110 120 130
Ele
vatio
n (m
AH
D)
-50
-40
-30
-20
-10
0
10
20
30
Figure 17

3.95
Assessment of the Existing ConditionsRiver Water Level at -0.80m AHDSurcharge of the Properties and CarsInferred Sub-surface Profile
Study into Riverbank Collapsing for Lower Murray RiverSouth Punyelroo - Section SP1
Name: FILL Model: Mohr-Coulomb Unit Weight: Multiple Trial: 20 kN/m³Cohesion: 0 kPaPhi: Multiple Trial: 30 °
Name: Type B1 Model: Undrained (Phi=0) Unit Weight: Multiple Trial: 20 kN/m³Cohesion: Multiple Trial: 100 kPa
Name: Type B2 Model: Undrained (Phi=0) Unit Weight: Multiple Trial: 17 kN/m³Cohesion: Multiple Trial: 25 kPa
Name: Type C Model: Mohr-Coulomb Unit Weight: Multiple Trial: 20 kN/m³Cohesion: 0 kPaPhi: Multiple Trial: 30 °
Surcharge: 2.5 kPa
Distance (m)0 10 20 30 40 50 60 70 80 90 100 110 120 130 140 150 160 170 180 190 200
Ele
vatio
n (m
AH
D)
-50
-40
-30
-20
-10
0
10
20
30
Figure 18

3.73
Assessment of the Existing ConditionsRiver Water Level at -1.50m AHDSurcharge of the Properties and CarsInferred Sub-surface Profile
Study into Riverbank Collapsing for Lower Murray RiverSouth Punyelroo - Section SP1
Name: FILL Model: Mohr-Coulomb Unit Weight: Multiple Trial: 20 kN/m³Cohesion: 0 kPaPhi: Multiple Trial: 30 °
Name: Type B1 Model: Undrained (Phi=0) Unit Weight: Multiple Trial: 20 kN/m³Cohesion: Multiple Trial: 100 kPa
Name: Type B2 Model: Undrained (Phi=0) Unit Weight: Multiple Trial: 17 kN/m³Cohesion: Multiple Trial: 25 kPa
Name: Type C Model: Mohr-Coulomb Unit Weight: Multiple Trial: 20 kN/m³Cohesion: 0 kPaPhi: Multiple Trial: 30 °
Surcharge: 2.5 kPa
Distance (m)0 10 20 30 40 50 60 70 80 90 100 110 120 130 140 150 160 170 180 190 200
Ele
vatio
n (m
AH
D)
-50
-40
-30
-20
-10
0
10
20
30
Figure 19

1.67
Assessment of the Existing ConditionsRiver Water Level at -0.80m AHDSurcharge of the Properties and CarsWorst Case Sub-surface Profile
Study into Riverbank Collapsing for Lower Murray RiverSouth Punyelroo - Section SP1
Name: FILL Model: Mohr-Coulomb Unit Weight: Multiple Trial: 20 kN/m³Cohesion: 0 kPaPhi: Multiple Trial: 30 °
Name: Type B1 Model: Undrained (Phi=0) Unit Weight: Multiple Trial: 20 kN/m³Cohesion: Multiple Trial: 100 kPa
Name: Type B2 Model: Undrained (Phi=0) Unit Weight: Multiple Trial: 17 kN/m³Cohesion: Multiple Trial: 25 kPa
Name: Type C Model: Mohr-Coulomb Unit Weight: Multiple Trial: 20 kN/m³Cohesion: 0 kPaPhi: Multiple Trial: 30 °
Surcharge: 2.5 kPa
Distance (m)0 10 20 30 40 50 60 70 80 90 100 110 120 130 140 150 160 170 180 190 200
Ele
vatio
n (m
AH
D)
-50
-40
-30
-20
-10
0
10
20
30
Figure 20

1.54
Assessment of the Existing ConditionsRiver Water Level at -1.50m AHDSurcharge of the Properties and CarsWorst Case Sub-surface Profile
Study into Riverbank Collapsing for Lower Murray RiverSouth Punyelroo - Section SP1
Name: FILL Model: Mohr-Coulomb Unit Weight: Multiple Trial: 20 kN/m³Cohesion: 0 kPaPhi: Multiple Trial: 30 °
Name: Type B1 Model: Undrained (Phi=0) Unit Weight: Multiple Trial: 20 kN/m³Cohesion: Multiple Trial: 100 kPa
Name: Type B2 Model: Undrained (Phi=0) Unit Weight: Multiple Trial: 17 kN/m³Cohesion: Multiple Trial: 25 kPa
Name: Type C Model: Mohr-Coulomb Unit Weight: Multiple Trial: 20 kN/m³Cohesion: 0 kPaPhi: Multiple Trial: 30 °
Surcharge: 2.5 kPa
Distance (m)0 10 20 30 40 50 60 70 80 90 100 110 120 130 140 150 160 170 180 190 200
Ele
vatio
n (m
AH
D)
-50
-40
-30
-20
-10
0
10
20
30
Figure 21

1.30
Assessment of the Existing ConditionsRiver Water Level at -0.80m AHDSurcharge of the Properties and Cars
Name: FILL A1 Model: Mohr-Coulomb Unit Weight: Multiple Trial: 20 kN/m³Cohesion: 0 kPaPhi: Multiple Trial: 32 °
Name: FILL A2 Model: Mohr-Coulomb Unit Weight: Multiple Trial: 21 kN/m³Cohesion: 0 kPaPhi: Multiple Trial: 35 °
Name: Type B Model: Undrained (Phi=0) Unit Weight: Multiple Trial: 17 kN/m³Cohesion: Multiple Trial: 50 kPa
Name: Rock Model: Bedrock (Impenetrable)
Study into Riverbank Collapsing for Lower Murray RiverEast Front Road - Section EF1
Surcharge: 2.5 kPa
Distance (m)0 10 20 30 40 50 60 70 80 90
Ele
vatio
n (m
AH
D)
-20
-15
-10
-5
0
5
10
15
20
Figure 22

1.23
Assessment of the Existing ConditionsRiver Water Level at -1.50m AHDSurcharge of the Properties and Cars
Name: FILL A1 Model: Mohr-Coulomb Unit Weight: Multiple Trial: 20 kN/m³Cohesion: 0 kPaPhi: Multiple Trial: 32 °
Name: FILL A2 Model: Mohr-Coulomb Unit Weight: Multiple Trial: 21 kN/m³Cohesion: 0 kPaPhi: Multiple Trial: 35 °
Name: Type B Model: Undrained (Phi=0) Unit Weight: Multiple Trial: 17 kN/m³Cohesion: Multiple Trial: 50 kPa
Name: Rock Model: Bedrock (Impenetrable)
Study into Riverbank Collapsing for Lower Murray RiverEast Front Road - Section EF1
Surcharge: 2.5 kPa
Distance (m)0 10 20 30 40 50 60 70 80 90
Ele
vatio
n (m
AH
D)
-20
-15
-10
-5
0
5
10
15
20
Figure 23

1.02
Assessment of the Existing ConditionsRiver Water Level at -0.80m AHDSurcharge of the Properties and Cars
Name: Type A FILL Model: Mohr-Coulomb Unit Weight: Multiple Trial: 20 kN/m³Cohesion: 0 kPaPhi: Multiple Trial: 31 °
Name: Type B1 Model: Undrained (Phi=0) Unit Weight: Multiple Trial: 17 kN/m³Cohesion: Multiple Trial: 17.5 kPa
Name: Type B2 Model: Undrained (Phi=0) Unit Weight: Multiple Trial: 17 kN/m³Cohesion: Multiple Trial: 14 kPa
Name: Type C Model: Mohr-Coulomb Unit Weight: Multiple Trial: 20 kN/m³Cohesion: 0 kPaPhi: Multiple Trial: 31 °
Study into Riverbank Collapsing for Lower Murray RiverEast Front Road - Section EF2
Surcharge: 2.5 kPa
Distance (m)0 10 20 30 40 50 60 70 80 90 100 110
Ele
vatio
n (m
AH
D)
-50
-40
-30
-20
-10
0
10
20
Figure 24

0.95
Assessment of the Existing ConditionsRiver Water Level at -1.50m AHDSurcharge of the Properties and Cars
Name: Type A FILL Model: Mohr-Coulomb Unit Weight: Multiple Trial: 20 kN/m³Cohesion: 0 kPaPhi: Multiple Trial: 31 °
Name: Type B1 Model: Undrained (Phi=0) Unit Weight: Multiple Trial: 17 kN/m³Cohesion: Multiple Trial: 17.5 kPa
Name: Type B2 Model: Undrained (Phi=0) Unit Weight: Multiple Trial: 17 kN/m³Cohesion: Multiple Trial: 14 kPa
Name: Type C Model: Mohr-Coulomb Unit Weight: Multiple Trial: 20 kN/m³Cohesion: 0 kPaPhi: Multiple Trial: 31 °
Study into Riverbank Collapsing for Lower Murray RiverEast Front Road - Section EF2
Surcharge: 2.5 kPa
Distance (m)0 10 20 30 40 50 60 70 80 90 100 110
Ele
vatio
n (m
AH
D)
-50
-40
-30
-20
-10
0
10
20
Figure 25

1.68
Assessment of the Existing ConditionsRiver Water Level at -0.70m AHDSurcharge of the Structures and CarsWith 4m Deep Tension Crack
Surcharge: 2.5 kPa
Study into Riverbank Collapsing for Lower Murray RiverSwan Reach - Section SW1
Name: Type A: FILL Model: Mohr-Coulomb Unit Weight: Multiple Trial: 20 kN/m³Cohesion: 0 kPaPhi: Multiple Trial: 30 °
Name: Type B1 Model: Undrained (Phi=0) Unit Weight: Multiple Trial: 20 kN/m³Cohesion: 250 kPa
Name: Type B2 Model: Undrained (Phi=0) Unit Weight: Multiple Trial: 20 kN/m³Cohesion: Multiple Trial: 50 kPa
Name: Type B3 Model: Undrained (Phi=0) Unit Weight: Multiple Trial: 18 kN/m³Cohesion: Multiple Trial: 18 kPa
Name: Type B4 Model: Undrained (Phi=0) Unit Weight: Multiple Trial: 18 kN/m³Cohesion: Multiple Trial: 12.5 kPa
Name: Type C Model: Mohr-Coulomb Unit Weight: Multiple Trial: 20 kN/m³Cohesion: 0 kPaPhi: Multiple Trial: 31 °
Distance (m)0 10 20 30 40 50 60 70 80 90 100 110 120
Ele
vatio
n (m
AH
D)
-50
-40
-30
-20
-10
0
10
20
30
Figure 26

1.70
Assessment of the Existing ConditionsRiver Water Level at -1.50m AHDSurcharge of the Structures and CarsWith 4m Deep Tension Crack
Surcharge: 2.5 kPa
Study into Riverbank Collapsing for Lower Murray RiverSwan Reach - Section SW1
Name: Type A: FILL Model: Mohr-Coulomb Unit Weight: Multiple Trial: 20 kN/m³Cohesion: 0 kPaPhi: Multiple Trial: 30 °
Name: Type B1 Model: Undrained (Phi=0) Unit Weight: Multiple Trial: 20 kN/m³Cohesion: 250 kPa
Name: Type B2 Model: Undrained (Phi=0) Unit Weight: Multiple Trial: 20 kN/m³Cohesion: Multiple Trial: 50 kPa
Name: Type B3 Model: Undrained (Phi=0) Unit Weight: Multiple Trial: 18 kN/m³Cohesion: Multiple Trial: 18 kPa
Name: Type B4 Model: Undrained (Phi=0) Unit Weight: Multiple Trial: 18 kN/m³Cohesion: Multiple Trial: 12.5 kPa
Name: Type C Model: Mohr-Coulomb Unit Weight: Multiple Trial: 20 kN/m³Cohesion: 0 kPaPhi: Multiple Trial: 31 °
Distance (m)0 10 20 30 40 50 60 70 80 90 100 110 120
Ele
vatio
n (m
AH
D)
-50
-40
-30
-20
-10
0
10
20
30
Figure 27

1.02
Assessment of the Existing ConditionsRiver Water Level at -0.70m AHDSurcharge of the Structures and Cars
Surcharge: 2.5 kPa
Study into Riverbank Collapsing for Lower Murray RiverWalker Flat - Section WF1 Name: Type A: FILL
Model: Mohr-Coulomb Unit Weight: Multiple Trial: 19 kN/m³Cohesion: 0 kPaPhi: Multiple Trial: 30 °
Name: Type B1 Model: Undrained (Phi=0) Unit Weight: Multiple Trial: 19 kN/m³Cohesion: Multiple Trial: 70 kPa
Name: Type B2 Model: Undrained (Phi=0) Unit Weight: Multiple Trial: 19 kN/m³Cohesion: Multiple Trial: 50 kPa
Name: Type B3 Model: Undrained (Phi=0) Unit Weight: Multiple Trial: 17 kN/m³Cohesion: Multiple Trial: 15 kPa
Name: Type B4 Model: Undrained (Phi=0) Unit Weight: Multiple Trial: 17 kN/m³Cohesion: Multiple Trial: 15 kPa
Name: Type B5 / C Model: Mohr-Coulomb Unit Weight: Multiple Trial: 20 kN/m³Cohesion: 0 kPaPhi: Multiple Trial: 31 °
Distance (m)0 10 20 30 40 50 60 70 80 90 100 110 120 130 140
Ele
vatio
n (m
AH
D)
-50
-40
-30
-20
-10
0
10
20
30

0.94
Assessment of the Existing ConditionsRiver Water Level at -1.50m AHDSurcharge of the Structures and Cars
Surcharge: 2.5 kPa
Study into Riverbank Collapsing for Lower Murray RiverWalker Flat - Section WF1
Name: Type A: FILL Model: Mohr-Coulomb Unit Weight: Multiple Trial: 19 kN/m³Cohesion: 0 kPaPhi: Multiple Trial: 30 °
Name: Type B1 Model: Undrained (Phi=0) Unit Weight: Multiple Trial: 19 kN/m³Cohesion: Multiple Trial: 70 kPa
Name: Type B2 Model: Undrained (Phi=0) Unit Weight: Multiple Trial: 19 kN/m³Cohesion: Multiple Trial: 50 kPa
Name: Type B3 Model: Undrained (Phi=0) Unit Weight: Multiple Trial: 17 kN/m³Cohesion: Multiple Trial: 15 kPa
Name: Type B4 Model: Undrained (Phi=0) Unit Weight: Multiple Trial: 17 kN/m³Cohesion: Multiple Trial: 15 kPa
Name: Type B5 / C Model: Mohr-Coulomb Unit Weight: Multiple Trial: 20 kN/m³Cohesion: 0 kPaPhi: Multiple Trial: 31 °
Distance (m)0 10 20 30 40 50 60 70 80 90 100 110 120 130 140
Ele
vatio
n (m
AH
D)
-50
-40
-30
-20
-10
0
10
20
30

Study into River Bank Collapsing for Lower River Murray Geotechnical Investigation Report
SINCLAIR KNIGHT MERZ
VW04794_MurrayRiverbank_Geotech_RevE_FINAL_20100217.docx PAGE 6
1. Introduction Sinclair Knight Merz (SKM) was commissioned by S.A Department of Water, Land and Biodiversity Conservation (DWLBC) to undertake a Geotechnical Investigation as part of the Study into River Bank Collapsing - Lower River Murray. The purpose of the study is to establish an understanding of the river bank collapsing issues arising from current and anticipated ongoing and lowering water levels in the lower pool. DWLBC will use the management and monitoring recommendations from the study to assist it with its response to collapsing.
The Study is being carried out in three phases. Phase 1 related to the development of project objectives and early advice provided from selected consultants. Phase 2 involved specialised observation and review of conditions leading to bank collapse and risk ranking of high consequence areas. A key output from Phase 2 was an Inspection Report (SKM, 2009) which provided a series of recommendations for future investigations, management and monitoring.
This work forms a component of Phase 3 of the study and builds upon earlier work documented in SKM (2009). The aim of the geotechnical investigation was to obtain subsurface information for assessment of the cracks and stability problems observed in seven (7) sites along the Lower River Murray. In absence of a quantitative risk assessment for the sites, the critical sites for the further studies have been defined by DWLBC.
Following on from site inspections performed during October 2009 (SKM, 2009) and further discussions with DWLBC, geotechnical investigations were performed between 21 to 28 October, 4 to 5 November and 18 to 19 November 2009, at the following sites:
Riverfront Road-Murray Bridge (2 Boreholes, 13 CPTu tests, 1 Dilatometer Test and 1 Piezometer)
Caloote (4 Boreholes, 17 CPTu tests, 1 Dilatometer Test and 1 Piezometer) Woodlane Reserve (2 Boreholes and 5 CPTu tests) South Punyelroo (3 Boreholes and 7 CPTu tests) East Front Road (3 Boreholes and 1 CPTu test) Swan Reach (1 Borehole, 3 CPTu tests) Walker Flat (1 Borehole, 3 CPTu tests)
Due to presence of very soft clays within the soil profile, additional sensitive CPTu and Dilatometer Tests were carried out adjacent to previous CPTu test locations, performed by Black In-Situ Testing, to supplement the CPTs performed by Engtest (University of Adelaide). The factual results of the investigation, together with the stability assessment results for nominated sites are presented in this report, including the borehole logs, CPTu profiles, in-situ tests from the field, laboratory test results, preliminary stability assessment and advice on possible effects of the further reduction in the river’s level.

Study into River Bank Collapsing for Lower River Murray Geotechnical Investigation Report
SINCLAIR KNIGHT MERZ
VW04794_MurrayRiverbank_Geotech_RevE_FINAL_20100217.docx PAGE 7
2. Scope of Work The objective of the geotechnical investigation was to provide information that would allow greater understanding of the ground conditions at the nominated sites, and, therefore, improve the reliability of associated stability assessments.
The scope of work comprised the following tasks:
• Desktop review of existing geotechnical and geological information;
• Development of a project EHS plan and JSEA for the work planned for each site;
• Provision of field survey including land survey and bathymetrical transects for maximum of two cross sections at each site;
• Provision of underground services locator to identify the existing infrastructures at the proposed test locations;
• Geotechnical sampling and testing, at each site, comprising:
Drilling of boreholes at each site. The boreholes were advanced using solid flight augering technique in the soil to a maximum depth of 20m; or at the discretion of the Supervising Geotechnical Engineer;
Standard Penetration Tests (SPT) in the boreholes, at nominal intervals at the discretion of the Supervising Geotechnical Engineer;
Collecting thin-walled push tube samples from the boreholes at depths nominated by the Supervising Geotechnical Engineer;
Identification and visual description of the samples including field classification, colour (referenced to a standard colour chart), odour, structure and consistency;
Measurement of the field undrained shear strength of cohesive material by Vane Shear and/or Pocket Penetrometer tests, at depth nominated by the Supervising Geotechnical Engineer;
Performance of a Cone Penetration Tests with pore-water pressure measurements (CPTu) at each site. The CPTu was performed to a nominal target depth of 20m, or refusal (as decided by the CPTu Operator);
Additional CPTu tests using sensitive cone for more accurate strength assessment of the very soft clays; and
Dilatometer Tests in selected sites to assess the in-situ strength of the very soft clays.
• Preparation of a draft factual report summarising the factual data from the field and including the following components:
Review of existing geotechnical and geological information;
Site plans showing the investigation locations;

Study into River Bank Collapsing for Lower River Murray Geotechnical Investigation Report
SINCLAIR KNIGHT MERZ
VW04794_MurrayRiverbank_Geotech_RevE_FINAL_20100217.docx PAGE 8
Description of the investigation methodology;
Borehole logs, including descriptions of the inferred subsurface conditions at each site; and
CPTu test results;
• Laboratory testing at a registered NATA laboratory, including:
Index testing for soil samples including Particle Size Distribution, Atterberg Limits, Moisture Content, Linear Shrinkage, Dry Density, Specific Gravity and Emerson Classification;
Strength tests including Unconsolidated Undrained (UU) Triaxial, Consolidated Undrained (CU) Triaxial and Direct Shear test to determine the strength characteristics of the soil profile; and
Odometer tests to determine the consolidation characteristics of the soft clays.
• Slope stability assessments for the selected cross sections using soil properties data obtained from the investigation;
• Preparation of a final report, including the following components:
Information presented in the draft factual report;
Revised borehole logs incorporating laboratory test results;
An interpretation of the field data and laboratory test results;
Results of slope stability analysis for the selected sites (for existing conditions and allowing for a further reduction in the river’s level); and
Discussion and recommendations on potential methods to stabilize the slopes (as appropriate).

Study into River Bank Collapsing for Lower River Murray Geotechnical Investigation Report
SINCLAIR KNIGHT MERZ
VW04794_MurrayRiverbank_Geotech_RevE_FINAL_20100217.docx PAGE 9
3. Data Sources The data sources used for this report comprised:
Geological Survey of South Australia (1962) 1:250,000 Adelaide, Barker and Renmark map-sheets;
Study into River Bank Collapsing- Lower River Murray Report (SKM, October 2009);
Ground investigation data (as presented in this report) including:
o Borehole logs;
o Cone Penetrometer Tests;
o Dilatometer tests;
o In-situ tests including Vane Shear, Pocket Penetrometer and Standard Penetrometer Tests; and
o Laboratory test results;
Site Survey and bathymetrical transects; and
DWLBC GIS Database.
The following subcontractors were engaged during the geotechnical investigation and laboratory testing:
Drilling Solution Pty Ltd of Lonsdale, South Australia;
EngTest (via the University of Adelaide) South Australia;
Black Insitu Testing of Glen Iris, Victoria;
Australian Soil Testing Pty Ltd of Rockdale, New South Wales; and
Coffey Information Pty Ltd of Mile End, South Australia.
These data sources are discussed in more detail in the following sections.

Study into River Bank Collapsing for Lower River Murray Geotechnical Investigation Report
SINCLAIR KNIGHT MERZ
VW04794_MurrayRiverbank_Geotech_RevE_FINAL_20100217.docx PAGE 10
4. Geotechnical Investigation 4.1. Field Investigation
The investigation methodology was generally consistent with Australian Standard AS1726-1993 (Geotechnical Site Investigations) and SKM’s standard work procedures. The investigation was undertaken by experienced geotechnical engineers from SKM in accordance with AS1726-1993. The approximate investigation locations are presented on Figure 1. Survey plans for each site are presented in the Appendices.
4.1.1. Boreholes
The field investigation was performed from 21st to 28th of October, 4th to 5th November, and 18th to 19th of November 2009. The fieldwork comprised 16 boreholes and 49 CPTu tests, to a maximum depth of 20m below existing ground surface level, at seven nominated sites. The boreholes were drilled using a Warman Scout 250. The soil profile encountered in the boreholes was logged (including vane testing and pocket penetrometer strength assessments) and soil samples were collected to confirm visual classification and for additional laboratory testing. The borehole logs are included in the appendices, and a summary of the borehole details is presented in Table 1.
Table 1 Geotechnical Borehole Details
Borehole No. Location Easting
[mE] Northing
[mN] Elevation [m AHD] 1
Final Depth [m bgl] 2
SR-BH1 Riverfront Road-Murray Bridge 343 936 6 111 971 1.1 20.0
SR-BH2 Riverfront Road-Murray Bridge 344 163 6 111 703 1.1 17.5
CA-BH1 Caloote 341 491 6 129 958 1.6 4.0 CA-BH2 Caloote 341 502 6 129 911 1.7 11.2 CA-BH3 Caloote 341 526 6 129 822 1.6 18.3 CA-BH4 Caloote 341 548 6 129 822 1.4 13.4 WR-BH1 Woodlane Reserve 348 154 6 126 175 2.8 19.5 WR-BH2 Woodlane Reserve 348 250 6 126 063 2.6 15.2 SP-BH1 South Punyelroo 372 786 6 169 365 2.0 4.6 SP-BH2 South Punyelroo 372 806 6 169 385 1.3 4.2 SP-BH3 South Punyelroo 344 171 6 111 718 2.4 4.6 EF-BH1 East Front Road 349 560 6 137 674 3.6 2.0 EF-BH2 East Front Road 349 575 6 137 684 3.7 6.2 EF-BH3 East Front Road 349 763 6 137 768 3.1 7.4 SW-BH1 Swan Reach 371 658 6 174 658 4.5 8.2 WF-BH1 Walker Flat 367 898 6 153 645 3.4 11.0
Notes: 1. metres Australian Height Datum and 2. metres below ground level

Study into River Bank Collapsing for Lower River Murray Geotechnical Investigation Report
SINCLAIR KNIGHT MERZ
VW04794_MurrayRiverbank_Geotech_RevE_FINAL_20100217.docx PAGE 11
4.1.2. In-situ Testing
In addition to CPTs, “Standard Penetration Tests” (SPTs) were performed at selected depths to assess the consistency and strength parameters of the soil layers. The results of these tests are included on the borehole logs in the relevant Appendix for each site.
4.1.3. CPTu Testing
The CPTu test is a Cone Penetration Test, including pore water pressure measurements, as well as cone resistance and sleeve friction. The addition of pore water pressure measurement allows more reliable assessment of soil type, shear strength, stiffness and consolidation characteristics.
Due to presence of a very soft clayey layer, at some locations, additional CPTu tests using a more sensitive cone were carried out by Black In-Situ Testing. These tests are identified by the suffix ‘S’ on the CPT number. The CPTu results are included in the appendices, and a summary of the test details is presented in Table 2.
Table 2 CPTu Test Details (continued overleaf)
CPTu No. Location Easting[mE]
Northing[mN]
Elevation [m AHD] 1
Final Depth[m bgl] 2
SR-CPT1 Riverfront Road-Murray Bridge 343 969 6 111 932 1.0 16.2
SR-CPT2 Riverfront Road-Murray Bridge 343 928 6 111 968 1.2 19.3
SR-CPT3 Riverfront Road-Murray Bridge 343 912 6 112 008 1.2 22.2
SR-CPT4 Riverfront Road-Murray Bridge 343 903 6 112 002 1.2 21.7
SR-CPT5 Riverfront Road-Murray Bridge 344 171 6 111 718 1.0 16.5
SR-CPT6 Riverfront Road-Murray Bridge 344 163 6 111 707 1.2 14.0
SR-CPT7 Riverfront Road-Murray Bridge 344 080 6 111 828 1.1 18.7
SR-CPT8 Riverfront Road-Murray Bridge 344 068 6 111 811 1.3 16.1
SR-CPT1S Riverfront Road-Murray Bridge 343 969 6 111 932 1.0 Refusal 3
SR-CPT2S Riverfront Road-Murray Bridge 343 928 6 111 968 1.2 Refusal 3
SR-CPT6S Riverfront Road-Murray Bridge 344 163 6 111 707 1.2 14.7
SR-CPT7S Riverfront Road-Murray Bridge 344 081 6 111 824 1.1 Refusal 3
CA-CPT1 Caloote 341 487 6 129 972 1.6 2.6 CA-CPT2 Caloote 341 483 6 129 960 2.3 0.9 CA-CPT3 Caloote 341 508 6 129 914 1.3 11.9 CA-CPT4 Caloote 341 572 6 129 777 2.0 3.2 CA-CPT5 Caloote 341 570 6 129 766 2.6 7.2 CA-CPT6a Caloote 341 533 6 129 825 1.5 6.4

Study into River Bank Collapsing for Lower River Murray Geotechnical Investigation Report
SINCLAIR KNIGHT MERZ
VW04794_MurrayRiverbank_Geotech_RevE_FINAL_20100217.docx PAGE 12
CPTu No. Location Easting[mE]
Northing[mN]
Elevation [m AHD] 1
Final Depth[m bgl] 2
CA-CPT6b Caloote 341 534 6 129 823 1.5 5.2 CA-CPT7 Caloote 341 556 6 129 801 1.7 10.9 CA-CPT8 Caloote 341 598 6 129 725 1.6 4.4 CA-CPT9 Caloote 341 549 6 129 813 1.2 10.1 CA-CPT10 Caloote 341 561 6 129 806 1.2 16.5 CA-CPT1S Caloote 341 487 6 129 823 1.6 Refusal 3 CA-CPT3S Caloote 341 487 6 129 823 1.3 11.1 CA-CPT7S Caloote 341 555 6 129 801 1.7 Refusal CA-CPT9S Caloote 341 549 6 129 813 1.2 5.8 CA-CPT9sa Caloote 341 549 6 129 813 1.2 6.0 CA-CPT9sb Caloote 341 549 6 129 813 1.2 5.7 WR-CPT2 Woodlane Reserve 348 102 6 126 238 2.8 6.9 WR-CPT3 Woodlane Reserve 348 152 6 126 193 3.1 11.6 WR-CPT4 Woodlane Reserve 348 243 6 126 056 2.9 7.3 WR-CPT5 Woodlane Reserve 348 302 6 126 000 3.3 12.9 WR-CPT6 Woodlane Reserve 348 232 6 129 094 1.9 11.3 SP-CPT1 South Punyelroo 372 809 6 169 361 2.1 4.5 SP-CPT2 South Punyelroo 372 751 6 169 365 1.8 5.2 SP-CPT3 South Punyelroo 372 773 6 169 345 1.7 4.7 SP-CPT4 South Punyelroo 372 789 6 169 327 1.5 4.7 SP-CPT5 South Punyelroo 372 815 6 169 352 2.2 4.6 SP-CPT6a South Punyelroo 372 783 6 169 352 2.3 1.5 SP-CPT6b South Punyelroo 372 783 6 169 352 2.3 4.3 SP-CPT7 South Punyelroo 372 802 616 9385 1.4 3.9 EF-CPT1 East Front Road 349 558 6 137 675 1.3 8.9 SW-CPT1 Swan Reach 371 659 6 174 658 4.5 9.2 SW-CPT2 Swan Reach 371 646 6 174 649 4.9 8.3 SW-CPT3 Swan Reach 371 636 6 174 636 0.9 4.5 WF-CPT1 Walker Flat 367 887 6 153 650 3.2 10.1 WF-CPT2 Walker Flat 367 899 6 153 647 3.4 11.1 WF-CPT3 Walker Flat 367 907 6 153 640 3.5 10.0
Notes: 1. metres Australian Height Datum 2. metres below ground level 3. Refusal indicates CPT did not penetrate fill material
4.1.4. Dilatometer Tests
The Dilatometer Tests were conducted by Black In-Situ Testing Company in Caloote and Riverfront Road-Murray Bridge sites. The results are presented in Appendix A and Appendix B.

Study into River Bank Collapsing for Lower River Murray Geotechnical Investigation Report
SINCLAIR KNIGHT MERZ
VW04794_MurrayRiverbank_Geotech_RevE_FINAL_20100217.docx PAGE 13
4.2. Laboratory Testing
Geotechnical laboratory testing was undertaken on selected samples from the boreholes by Coffey Information and Australian Soil Testing Pty Ltd, in their NATA registered laboratories. The tests that were undertaken are summarised in Table 3. Formal laboratory test certificates are presented in the relevant Appendix for each site.
Table 3 Geotechnical Laboratory Testing Program
Test Description Applicable Australian Standard Visual Classification and Moisture Content AS 1289.2.1.1 Atterberg Limits with Linear Shrinkage AS 1289.3.1.2, 3.2.1, 3.3.1, 3.4.1 Linear Shrinkage AS 1289.3.4.1 Percentage Fines (<75µm) AS 1289.3.6.1 Particle Size Distribution (sieving) AS 1289.3.6.1 Particle Size Distribution (with hydrometer) AS 1289.3.6.2 Unconsolidated Undrained (UU)Triaxial AS 1289.6.4.1 Saturated Consolidated Undrained (CIU) Triaxial AS 1289.6.4.2 Consolidation AS 1289.6.6.1 Soil Particle Density AS 1289.3.5.1 Direct Shear Test AS1289 6.2.2 Emerson Class Test AS 1289.3.8.1
Study into River Bank Collapsing for Lower River Murray Geotechnical Investigation Report
SINCLAIR KNIGHT MERZ
VW04794_MurrayRiverbank_Geotech_RevE_FINAL_20100217.docx PAGE 14
5. Assessment Criteria 5.1. Study Area
Seven high risk areas were nominated by DWLBC for this study. The extent of the study, in each area, covers the public accessible areas and residential developments. A vicinity map of the study areas is presented on Figure 1.
5.2. Failure Modes
Based on the observations in the preliminary site inspections, a number of modes of failure have been identified in the area
Desiccation and tension cracks;
Increase in surcharge due to lower river water level;
Slumping;
Toe erosion; and
Slope stability.
The following modes of failure have been adopted for more quantified assessment:
Slope stability including effects of additional surcharge and shrinkage cracks; and
Excessive deformation due to settlement and tension cracks.
5.3. Geometry
Some cross sections from each area have been selected for the site investigation and stability assessment which are representative of different slopes, developments and soil/rock condition.
Results of the land survey and bathymetrical transects carried out by SKM have been used to generate the cross sections which are presented in the appendices.
Study into River Bank Collapsing for Lower River Murray Geotechnical Investigation Report
SINCLAIR KNIGHT MERZ
VW04794_MurrayRiverbank_Geotech_RevE_FINAL_20100217.docx PAGE 15
5.4. Soil Types
Soils in each site have been separated into three distinct soil types, namely Type-A, Type-B and Type-C. A summary of the descriptions and layer thicknesses for each soil type is presented in Table 4 overleaf.
Type-A: Fill Material.
In Riverfront Road-Murray Bridge, Caloote, Woodlane Reserve and South Punyelroo sites, Soil Type A is generally described as Silty/Clayey SAND with around 1000mm thickness.
In East Front Road, Swan Reach and Walker Flat, Soil Type A is in the form of a fill platform with gravely nature and unknown level of compaction. The thickness of the fill platforms varies from 1.5m to 6.0m.
Fill materials at all sites are located above the river’s water table.
Type-B: Very Soft Silty CLAY (CH)
Soil Type B generally comprises very soft high plasticity silty CLAY layer with consistent colour, strength and physical properties. Moisture contents of this material under the water table tend to be close to the Liquid Limit. Organic matter, like leaves and roots, has been observed in this layer at different levels.
As the stability and deformation of the cross sections are highly dependent on the properties of this layer, the strength parameters of the very soft clays have been assessed by several different methods, i.e. CPTu, Vane Shear, Dilatometer, UU Triaxial. The undrained shear strength of this material tends to be in the range 10kPa to 25 kPa, with a trend of increasing shear strength with depth.
Type-C: SANDY Layer
Soil Type B generally comprises medium dense to very dense sandy material, underlying Soil Type B.

Study into River Bank Collapsing for Lower River Murray Geotechnical Investigation Report
SINCLAIR KNIGHT MERZ
VW04794_MurrayRiverbank_Geotech_RevE_FINAL_20100217.docx PAGE 16
Table 4 Summary of Soil Types Adopted for Stability Assessments
Type Site Description Depth (m) Type-A Riverfront Road-
Murray Bridge Fill: Silty/Clayey SAND (SM/SC) 0 to 1
Caloote Fill: Silty/Clayey SAND (SM/SC) 0.to 1 Woodlane Reserve Fill: Silty/Clayey SAND (SM/SC) 0 to 1 East Front Road Fill: Silty/Clayey SAND (SC/SM) /
Silty/Clayey GRAVEL (GC/GM) 0 to 2-6
South Punyelroo Fill: Silty Sand (SM) 0 to 0.5-1 Swan Reach Fill: Silty SAND/GRAVEL (SM/GM) 0 to 2 Walker Flat Fill: Silty/Clayey GRAVEL (GM/GC) 0 to 1.5 TYPE-B Riverfront Road-
Murray Bridge Silty CLAY (CH) 1 to 10~ >20
Caloote Silty CLAY (CH) 1 to 8.5~15 Woodlane Reserve Silty CLAY (CH) 1 to 4~6 East Front Road Silty CLAY (CH) 3 to 6.5 South Punyelroo Silty CLAY (CL) 0.5~1 to 3.5~4.5 Swan Reach Silty CLAY (CH) 2 to 8 Walker Flat Silty CLAY (CH) 1.5 to 10.5 TYPE-C Riverfront Road-
Murray Bridge Clayey SAND/Sandy CLAY (SC/CL) 10~ >20
Caloote Silty/Clayey SAND (SC/SM) / Silty/Clayey GRAVEL (GC/GM)
>8.5-15
Woodlane Reserve Silty/Clayey SAND (SM/SC), SILT (ML)
>4-6
East Front Road Clayey SAND (SC) >6.5 South Punyelroo SAND (SP) >3.5-4.5 Swan Reach SAND (SW) >8 Walker Flat Clayey SAND/Sandy CLAY (SC/CL) >10.5
Study into River Bank Collapsing for Lower River Murray Geotechnical Investigation Report
SINCLAIR KNIGHT MERZ Error! Unknown document property name. Error! Unknown document property name.
Document2 PAGE 17
5.5 Stability Criteria
The following criteria were adopted for the stability assessment of the river bank slopes: Limit equilibrium methods to estimate minimum Factor of Safety (FoS);
Morgenstern and Price method of analysis with circular and optimised non-circular slip surfaces;
Mohr-Coulomb model with drained strength parameters, for the fill and sandy materials;
The very soft clays have been modelled with undrained shear strength (su) a function of depth. The results of CPTu, Dilatometer, Vane Shear and Triaxial tests were used to estimate the undrained shear strength, rate of increase and maximum undrained shear strength;
A minimum of 2.5kPa distributed live loading for car parks, public access and riverside properties;
Stability assessment for the existing conditions and further reduction in river’s water level;
The minimum acceptable FoS in excess of 1.5 for the existing conditions and after reduction in river’s water level to -1.5m AHD over three years (Feb 2010 to Feb 2013);
Sensitivity analysis to assess the effects of uncertainties in soil parameters on FoS;A probability of failure (Factor of Safety less than 1.5) less than 5% for each section due to variability in the parameters during the existing conditions and after reduction in water levels over three years (Feb 2010 to Feb 2013) using Monte Carlo trials method; and
In absence of a risk study for the area, the Average Factor of Safety and Factors of Safety associated with 5% probability of failure have been adopted for the stability classification of the sites.
For the Factors of Safety below the recommended value of 1.5 or above 3, no earthquake loading has been considered.

Study into River Bank Collapsing for Lower River Murray Geotechnical Investigation Report
SINCLAIR KNIGHT MERZ
VW04794_MurrayRiverbank_Geotech_RevE_FINAL_20100217.docx PAGE 18
6. Riverfront Road-Murray Bridge 6.1. Site Geology
Based on the Geological Survey of South Australia (1962) 1:250,000 Barker map-sheet, the Riverfront Road-Murray Bridge site is located on Quaternary aged Alluvial Flat Deposits, and is in close proximity to the geological boundary with sandy limestone of the Tertiary aged Mannum Formation.
6.2. Subsurface Condition
The subsurface profile encountered at Riverfront Road-Murray Bridge generally comprised silty sand overlying Silty CLAY with a transition typically around 1.0m depth. The investigation confirmed the expected Quaternary aged Alluvial Flat Deposits, as seen on the Survey of South Australia (1962) 1:250,000 Barker map sheet.
The layers of dark grey very soft silty CLAY were relatively thick, extending up to 11m deep in SR-BH-2, and up to more than 20m deep in SR-BH-1. SPT results in this layer were typically zero and the sampler tended to sink under its self-weight. The push tube samples also penetrated easily into the soil under the weight of the rod and hand pressure.
Pockets of medium dense Sandy CLAY/Clayey SAND underlay this layer of silty CLAY, extending up to the termination depth of 17.5m at SR-BH-2. Further details of the subsurface profiles encountered during the investigation are presented on the borehole logs in Appendix A.
6.3. Groundwater
Due to the drilling methods, it was difficult to determine the inflow of groundwater. Moisture conditions of the soils were recorded in the borehole logs presented in Appendix A. Piezometers were installed at Riverfront Road-Murray Bridge for the monitoring of groundwater levels. Groundwater Level in piezometer well was 1.12 m below ground level (measured on 19/11/2009).
6.4. Soil Parameter Plots
Results of moisture content and Atterberg limit tests with depth for Riverfront Road-Murray Bridge are presented in Figure 30. Results of dry density and bulk density tests are presented in Figure 31. A Liquidity Index versus depth plot is presented on Figure 32. An activity plot, based on clay fraction and plasticity index, is presented on Figure 33.
The variation in sensitivity (calculated as the virgin shear strength divided by the remoulded shear strength from Vane Shear and Triaxial tests) versus depth for Riverfront Road-Murray Bridge is presented on Figure 34. Plots of undrained and remoulded shear strength, measured from Vane

Study into River Bank Collapsing for Lower River Murray Geotechnical Investigation Report
SINCLAIR KNIGHT MERZ
VW04794_MurrayRiverbank_Geotech_RevE_FINAL_20100217.docx PAGE 19
Shear, dilatometer, UU triaxial tests and CPTs are presented on Figure 35 and Figure 36 respectively. A plot of plasticity index versus depth is presented on Figure 37.
Moisture content results in very soft silty clay layer are close to liquidity limits, and dry density of clay material is less than 1t/m3. Results of Shear Strength based on in-situ tests (Vane and Dilatometer) and laboratory tests (UU triaxial) are approximately within the range 10kPa to 20kPa.
A summary of the soil parameters used for the stability assessment is presented in Table 5.
Table 5 Soil Parameter for Stability Assessments – Riverfront Road-Murray Bridge
Type Description Soil Model Unit Weight (kN/m3)
φ’ (°)
C’ / Su (kPa)
Increase Rate for Su
Type - A Fill: Silty/Clayey SAND (SM/SC) Mohr-Coulomb 18 ± 1 28 ± 2 2 ± 2 -
Type - B Silty CLAY (CH) Undrained Su=f(depth) 16 ± 1 - 10 ± 5 1.25 kPa/m
(25±5 kPa max)
Type - C Clayey SAND/Sandy CLAY (SC/CL)
Mohr-Coulomb 17 ± 1 30 ± 2 2 ± 2 -
6.5. River Bank Issues
This section provides an outline of the river bank issues present at the site with respect to its history of development and cracking. This has been determined from information provided by DWLBC and discussions with landowners and council employees on site and over the telephone. For a more general discussion of erosion problems along the River Murray refer to earlier Inspection Report prepared by SKM (2009).
Water level, rainfall and temperature records have been reviewed for the period over which major incidences were recorded along the Lower River Murray earlier this year. It needs to be appreciated that it is very difficult based on existing information to build up an accurate timeline of the history of cracking and slumping at sites. We cannot be certain of the exact timing of events as reports made are of the date in which an incident is reported, and does not necessarily represent the time in which cracking or failure actually occurred.
Riverfront Road-Murray Bridge is located on the southern bank of a straight section of the River Murray, within the urban area of Murray Bridge (Figure 1). Riverfront Road-Murray Bridge is an area of reclaimed land, formerly part of a larger wetland, the remnants of which are still present in the area west of Riverfront Road. This area to west of Riverfront Road is indicative of what the floodplain area would have been like prior to development, a series of lagoons/swamps subject to seasonal flooding. The area is believed to have been reclaimed 50-70 years ago, with 1m of fill being placed on top of the banks at this site. A series of riverside properties sitting on shallow stilts were then built on this reserve.

Study into River Bank Collapsing for Lower River Murray Geotechnical Investigation Report
SINCLAIR KNIGHT MERZ
VW04794_MurrayRiverbank_Geotech_RevE_FINAL_20100217.docx PAGE 20
Reports of cracking at this site were first documented in early March 2009 with photographs dating from the 13 March provided in a Report by Robert Frazer on this site. Further development of cracks was noted on the 20 April when water levels were at -1.24 m AHD and on 28 April there was a report that cracking extends from the back of the Barrangul Boat all the way to Long Island Boat Ramp (921 m), taking in 18 riverside properties along Riverfront road. This coincided with the time when water levels were at their lowest. From the 24th to 28th April there was also 30 mm of precipitation, with daily totals ranging from 2-10 mm (Figure 64 ). At the time in which SKM’s detailed geotechnical investigations were carried out, cracking was limited to one area in line with the back of the riverside properties, 9 m from Riverfront Road. This crack is about 100mm wide and 5m in length. This crack and the position of earlier cracks as documented by Glenn Dean (Rural City of Murray Bridge) over the Summer 2008/09 period were surveyed by SKM surveyors.
There is some uncertainty around the nature of historical channel changes along this section of river and the impact that these may be having on bank stability. The splitting of flow around Long Island results in an increase in overall channel width through this reach. It is possible that there may be ongoing processes of channel widening in response to widening and lengthening of Long Island. If this is the case, this may be contributing to problems of bank stability for this section of the River Murray from Riverfront Road-Murray Bridge through to Long Island Marina. Further analysis of historical aerial photography is recommended to determine if channel widening is an ongoing process and the implications this may have for further bank retreat.
6.6. Stability Assessment
Two cross sections have been assessed in this study:
Section SR1: In the vicinity of the riverside properties and the surface water collection lagoons; and
Section SR2: In vicinity of the boat ramp
Photos for the locations have been presented in Photo 1 and Photo 2. A plan showing the locations of the cross sections are included in Appendix A.
Both existing condition and further reduction of the river’s level to -1.5m AHD have been assessed. The analysis results are presented in Figure 9 to Figure 12.
6.7. Discussion
The Murray River levels have dropped approximately 2m since 2005 along the 200km stretch of the river north of Murray Bridge. This has led to groundwater levels lowering adjacent to the river bank; however, the existing surface lagoons away from the river bank may affect the groundwater levels.

Study into River Bank Collapsing for Lower River Murray Geotechnical Investigation Report
SINCLAIR KNIGHT MERZ
VW04794_MurrayRiverbank_Geotech_RevE_FINAL_20100217.docx PAGE 21
The banks of the river contain normally consolidated alluvium overlying over-consolidated weathered calcareous rock. The depth of this alluvium varies and could be deeper than 20m adjacent to the river. Some permeable sand lenses occur in these normally consolidated clays. This means that the lowering of the river level is transmitted quickly back into the banks but vertical flow of perched water tables in the lagoon will take some time to respond to the lowering. A phreatic surface will form between the river and the lagoons with zero drawdown at the lagoons and 2m at the river. At the top of the river bank there is often housing or other assets which are about 1 to 2m above the groundwater table. The lowering of the groundwater table adjacent to the river has the following adverse affects on the stability of the banks:
Increased seepage flow pressure towards the river;
Tilting of the soil blocks towards the river due to differential subsidence;
Tension at the crest of the slope due to tilting;
Shrinkage cracks increasing to the depth of the water table due to drying of the reactive clays being exposed to surface temperatures and evaporation to a greater depth. The seasonal moisture zone in Murray River area is approximately 4m deep, so as the groundwater table drops so the shrinkage cracks follow.
Shrinkage cracks become tension cracks that fill with surface water and drive failure from the crest when it rains. Tilting increases the width of shrinkage cracks in the direction of the tilting.
Shrinkage cracks can form in cubic blocks or hexagonal blocks and the cracks will become wider as the level of desiccation increases with climate change. This can cause additional settlement of the ground due to the 3D shrinkage of the desiccated blocks.
Subsidence due to the lowering of the groundwater level would have led to surface settlement over the last 4 years and the next 3 years with some time delay effects due to the rate of dissipation of the pore water pressures after drawdown. Differential subsidence due to changing thicknesses of the normally consolidated clay in the banks and/or the changes in the drawdown levels between points in the bank can lead to tilting and the development of tensile strains in the river bank. These strains are not necessarily evenly spread at the surface and can concentrate in existing shrinkage cracks or at points near the crest of the bank where tensile strains may already be approaching the maximum tensile capacity of the soil.
Tree roots exaggerate the shrinkage effects in reactive soils and if the root system cannot follow the falling groundwater level then the tree will become brittle and fall. A row of trees may cause instability at the edge of the river if there is a vertical bank along which a row of trees is subject to high winds leading to an over-turning moment. This may also apply to trees already leaning over the bank. A toppling failure would occur immediately behind the row of trees with the minimum volume of soil in the slide mass to resist the failure.

Study into River Bank Collapsing for Lower River Murray Geotechnical Investigation Report
SINCLAIR KNIGHT MERZ
VW04794_MurrayRiverbank_Geotech_RevE_FINAL_20100217.docx PAGE 22
Slope stability analyses in the vicinity of the boat ramp, based on observed existing static conditions, indicate that the Factor of Safety (FoS = 1.13) against slope failure, in this area, is well below the FoS (FoS = 1.50) that would normally be considered acceptable, for permanent areas used by the public. It is considered highly likely that further reductions in water level could trigger a slope (bank) failure in this area (FoS = 1.05).
In addition, in the area where riverside properties are present, our analyses indicate an FoS of approximately 1.27 for the existing condition and FoS of 1.18 if the River Murray “pool” level reduces, as predicted, to -1.5m AHD. Again, we consider that both FoS values are below the minimum acceptable level for permanent occupation.
6.8. Recommendations
We recommend that residents of these riverside properties be advised that there is a high risk of bank failure and the access road be closed to public traffic. In addition, we recommend that access to Riverfront Road-Murray Bridge should be fenced off to stop all pedestrian and vehicle traffic. River traffic should be warned of the very high probability of failure and advised not to moor in the area.
Furthermore, it is understood that surface water is collected by the existing upstream lagoons which are higher than the river’s water level. The implication of the water seepage from lagoons to the river on the stability should be considered in the future management plan.

Study into River Bank Collapsing for Lower River Murray Geotechnical Investigation Report
SINCLAIR KNIGHT MERZ
VW04794_MurrayRiverbank_Geotech_RevE_FINAL_20100217.docx PAGE 23
7. Caloote 7.1. Site Geology
The Caloote site is mapped on the Geological Survey of South Australia (1969) 1:250,000 Adelaide map sheet as Quaternary grey fluvial silts, sands and gravels. The site is also mapped close to the boundary of the Quaternary Hindmarsh clays and the Tertiary Mannum Formation. The Hindmarsh clays typically consist of grey and red-brown mottled sandy clay and the Mannum Formation typically consists of yellow-brown calcareous sandstone.
7.2. Subsurface Condition
The soil profile encountered at Caloote confirmed the expected Quaternary fluvial silts, sands and gravels as seen in the Geological Survey of South Australia (1969) 1:250,000 Adelaide map sheet.
The subsurface profile comprised of Silty/Gravelly SAND underlain by Silty CLAY. The layer of Silty CLAY was typically encountered at 1m to 1.5m below ground level, generally very soft and wet. The thickness of the very soft Silty CLAY layer varies from 3m in CA-BH-1 to 15m in CA-BH-3. There are some sandy clay/clayey sand layers/lenses in very soft silty clay layer from 6 to 15m depth.
Beneath this layer, the sand content had generally increased up to the depth of termination, transitioning to a Clayey SAND and Gravelly SAND. At CA-BH1, the borehole had terminated at 4m, due to refusal on SANDSTONE, confirming the Mannum Formation. Further details of the subsurface profiles encountered during the investigation are presented on the borehole logs in Appendix B.
7.3. Groundwater
Due to the drilling methods, it was difficult to determine the inflow of groundwater. Moisture conditions of the soils were recorded in the borehole logs presented in Appendix B. Piezometers were installed at Caloote for the monitoring of groundwater levels. Groundwater Level measured in the installed piezometer was 1.92m below ground level (measured on 19/11/2009).
A high range of pore water pressure has been measured in CPTu tests in very soft Silty CLAY layer in some of the CPTu tests, which is more than the weight of water column at that depth, like an artesian well.
7.4. Soil Parameter Plots
Results of moisture content and Atterberg limit tests with depth for Caloote are presented in Figure 39. Results of dry density and bulk density tests for this site are presented in Figure 40. A

Study into River Bank Collapsing for Lower River Murray Geotechnical Investigation Report
SINCLAIR KNIGHT MERZ
VW04794_MurrayRiverbank_Geotech_RevE_FINAL_20100217.docx PAGE 24
liquidity versus depth plot is presented on Figure 41. An activity plot, based on clay fraction and plasticity index, is presented on Figure 42.
The variation in sensitivity (calculated as the undisturbed shear strength divided by the remoulded shear strength from Vane Shear and Triaxial tests) versus depth for Caloote is presented in Figure 43. Plots of virgin and remoulded shear strength, measured from Vane Shear, Dilatometer, UU Triaxial tests and CPTs at Caloote are presented on Figure 44 and Figure 45 respectively. A plot of plasticity index versus depth is presented on Figure 46.
Moisture content results in very soft silty clay layer are close to liquidity limits, and dry density of clay material is less than 1t/m3. There are some intervals of sandy layers and lenses in very soft silty clay layer which have less parameter in liquid limit tests. There is no clear trend for depth and thickness of sandy layer/lenses but generally they are in depth from 6 to 15m. Results of Shear Strength based on in-situ tests (Vane and Dilatometer) and laboratory tests (TRX UU) are approximately in same range.
A summary of the soil parameters used for the stability assessment is presented in Table 6.
Table 6 Soil Parameter for Stability Assessments - Caloote
Type Description Soil Model Unit Weight (kN/m3)
φ’ (°)
C’ / Su (kPa)
Increase Rate for Su
Type - A Fill: Silty/Clayey SAND (SM/SC) Mohr-Coulomb 18 ± 1 28 ± 2 2 ± 2 -
Type - B Silty CLAY (CH) Undrained Su=f(depth) 16 ± 1 - 10 ± 5 1.07 kPa/m
(17±5 kPa max)
Type - C Clayey SAND/Sandy CLAY (SC/CL)
Mohr-Coulomb 19 ± 1 30 ± 2 2 ± 2 -
7.5. River Bank Issues
This section provides an outline of the river bank issues present at the site with respect to its history of development and cracking. This has been determined from information provided by DWLBC and discussions with landowners and council employees on site and over the telephone. For a more general discussion of erosion problems along the River Murray refer to earlier Inspection Report prepared by SKM (2009).
Caloote is located on the southern bank of a tight meander bend of the River Murray. A boat ramp and car parking area is located at this site, known as Caloote Landing (Photo 3). Similar to Riverfront Road-Murray Bridge, the area around Caloote Landing was formerly a swamp, which was then reclaimed in the 1930’s/1940’s. Rock for the surrounding cliffs may have been used to provide fill and reclaim the swampy area.

Study into River Bank Collapsing for Lower River Murray Geotechnical Investigation Report
SINCLAIR KNIGHT MERZ
VW04794_MurrayRiverbank_Geotech_RevE_FINAL_20100217.docx PAGE 25
The first reports of cracking and movement in the area are as early as February 2008. Domenic Priolo, who owns one of the residences downstream of the landing area, first noted movement around his doorways and cracking in his building. This early report conflicts with reports from other landowners in the area who state that no incidences of cracking were evident more than 12 months ago and that crack development was not sudden but rather has developed over the duration of the past 12 months.
Tension cracks run through properties downstream of the landing area and there is evidence of slumping at the front of the houses (Photo 4 to Photo 10). Furthermore, long tension cracks are evident in the northern area of the site which resulted in change in the alignment of an overhead.
7.6. Stability Assessment
A critical cross section has been assessed in this study:
Section CA2: In the vicinity of the riverside properties in the southern area and the car park area.
Plan and location of the cross section have been presented in Appendix B.
Both existing condition and further reduction of the river’s level to -1.5m AHD have been assessed. The analysis results are presented in Figure 13 and Figure 14.
7.7. Discussion
The Murray River levels have dropped approximately 2m since 2005 along the 200km stretch of the river north of Murray Bridge. This has led to groundwater levels lowering adjacent to the river bank.
The banks of the river contain fill material overlying normally consolidated clay followed by rock with different degrees of weathering. The depth of this alluvium varies from zero to up to around 20m adjacent to the river. Some permeable sand lenses occur in these normally consolidated clays. This means that the lowering of the river level may be transmitted quickly back into the banks but will take some time to respond to the lowering; however, the permeability and continuity of the sand lenses have not been confirmed. At the top of the river bank there is often housing or other assets which are about 1 to 2m above the groundwater table. The lowering of the groundwater table adjacent to the river has the following adverse affects on the stability of the banks:
Tilting of the soil blocks towards the river due to differential subsidence;
Tension at the crest of the slope due to tilting;
Shrinkage cracks increasing to the depth of the water table due to drying of the reactive clays being exposed to surface temperatures and evaporation to a greater depth. The seasonal

Study into River Bank Collapsing for Lower River Murray Geotechnical Investigation Report
SINCLAIR KNIGHT MERZ
VW04794_MurrayRiverbank_Geotech_RevE_FINAL_20100217.docx PAGE 26
moisture zone in Murray River area is approximately 4m deep so as the groundwater table drops so the shrinkage cracks follow.
Shrinkage cracks become tension cracks that fill with surface water and drive failure from the crest when it rains. Tilting increases the width of shrinkage cracks in the direction of the tilting.
Shrinkage cracks can form in cubic blocks or hexagonal blocks and the cracks will become wider as the level of desiccation increases with climate change. This causes additional settlement of the ground due to the 3D shrinkage of the desiccated blocks.
Subsidence due to the lowering of the groundwater level would have led to surface settlement over the last 4 years and the next 3 years with some time delay effects due to the rate of dissipation of the pore water pressures after drawdown. Differential subsidence due to changing thicknesses of the normally consolidated clay in the banks and/or the changes in the drawdown levels between points in the bank can lead to tilting and the development of tensile strains in the river bank. These strains are not necessarily evenly spread at the surface and can concentrate in existing shrinkage cracks or at points near the crest of the bank where tensile strains may already be approaching the maximum tensile capacity of the soil.
Tree roots exaggerate the shrinkage effects in reactive soils and if the root system cannot follow the falling groundwater level then the tree will become brittle and fall. A row of trees may cause instability at the edge of the river if there is a vertical bank along which a row of trees is subject to high winds leading to an over-turning moment. This may also apply to trees already leaning over the bank. A toppling failure would occur immediately behind the row of trees with the minimum volume of soil in the slide mass to resist the failure.
Results of geotechnical investigations at the Caloote site indicate that the factor of safety for the existing condition against slope (bank) failure (FoS = 1.14), in the parking/landing area around the boat ramp and the residential area immediately to the south, are below the FoS that would normally be considered acceptable, for permanent areas used by the public (FoS = 1.5).
Furthermore, stability analysis results indicate that the reduction in the river’s level could trigger the failure (FoS = 1.06).
The houses downstream of the landing area lie beneath a cliff overhang. Tension cracks developed in the cliffs and nature of the overhangs, mean that toppling/cantilever failure will result in blocks landing on the houses (Photo 11).
The existing condition of the rock over hang in the south eastern area indicates that cracks have been progressed in the section (Photo 11 and Photo 12). Furthermore, from the general condition of the cliffs in the area (Photo 13) it is evident that there is a high risk of rock fall in southern site which could be catastrophic for the coastal home. A recent rock fall has been reported in November 2009 which is presented in Photo 14.

Study into River Bank Collapsing for Lower River Murray Geotechnical Investigation Report
SINCLAIR KNIGHT MERZ
VW04794_MurrayRiverbank_Geotech_RevE_FINAL_20100217.docx PAGE 27
Due to the presence of possible large size rocks, determination of the geometry and continuity of the bed rock was not possible; however, it is expected that depth of the rock, thickness of the soft clay and alteration of the sandy lenses are highly variable in the area which may result in differential settlements and cracks.
7.8. Recommendations
We recommend that the residents in the south eastern area should be advised that there is a high risk of bank failure and rock fall.
No immediate damage to the structure of the riverside properties in the north western area is expected; however, the road and car park areas are high risk.
We recommend that access to the boat ramp, parking area adjacent to river and residential area in the south eastern areas and the access road after the residential area in the north western side should be fenced off to stop public and vehicle traffic. River traffic should be warned of the very high probability of failure and advised not to moor in the area.

Study into River Bank Collapsing for Lower River Murray Geotechnical Investigation Report
SINCLAIR KNIGHT MERZ
VW04794_MurrayRiverbank_Geotech_RevE_FINAL_20100217.docx PAGE 28
8. Woodlane Reserve 8.1. Site Geology
The Woodlane Reserve site is mapped on the Geological Survey of South Australia (1969) 1:250,000 Adelaide map sheet as Quaternary grey fluvial silts, sands and gravels.
8.2. Subsurface Condition
The soil profile encountered at Woodlane Reserve also confirmed the expected Quaternary aged grey fluvial silts, sands and gravels, as seen in the Geological Survey of South Australia (1969) 1:250,000 Adelaide map sheet. The subsurface profile comprised clayey SAND and SAND overlying silty CLAY, with a transition also occurring around 1.0m in depth. The dark grey very soft silty CLAY extended to about 3.0m to 4.0m depth in both Boreholes WR-BH1 and WR-BH2. From this depth, the sand content with trace of gravel increases with depth up to about 7.5m below the ground level, transitioning from a very soft sandy CLAY to a medium dense SAND or gravelly SAND. From 7.5m below ground level, the silt content increased with depth, transitioning from a soft sandy SILT or clayey SILT to firm SILT. Thereafter, alternating SILTS and SANDS were observed up to the depth of termination of the boreholes. Further details of the subsurface profiles encountered during the investigation are presented on the borehole logs in Appendix C.
8.3. Groundwater
Due to the drilling methods, it was difficult to determine the inflow of groundwater. Moisture conditions of the soils were recorded in the borehole logs presented in Appendix C.
8.4. Soil Parameter Plots
Results of moisture content and Atterberg limit tests with depth for Woodlane Reserve are presented in Figure 48. Results of dry density and bulk density tests for this site are presented in Figure 49. A liquidity versus depth plot is presented on Figure 50. A plot of plasticity index versus depth is presented on Figure 51.
A summary of the soil parameters used for the stability assessment is presented in Table 7.

Study into River Bank Collapsing for Lower River Murray Geotechnical Investigation Report
SINCLAIR KNIGHT MERZ
VW04794_MurrayRiverbank_Geotech_RevE_FINAL_20100217.docx PAGE 29
Table 7 Soil Parameter for Stability Assessments – Woodlane Resrve
Type Description Soil Model Unit Weight (kN/m3)
φ’ (°)
C’ / Su (kPa)
Increase Rate for Su
Type - A Fill: Silty/Clayey SAND (SM/SC) Mohr-Coulomb 17 ± 1 30 ± 2 - -
Type - B Silty CLAY (CH) Undrained Su=f(depth) 17 ± 1 - 20 ± 5 -
Type–C1 Clayey SAND/Sandy CLAY (SC/CL)
Mohr-Coulomb 20 ± 1 29 ± 2 - -
Type-C2 Clayey SAND/Sandy CLAY (SC/CL)
Mohr-Coulomb 20 ± 1 30 ± 2 - -
Type–C3 Clayey SAND/Sandy CLAY (SC/CL)
Mohr-Coulomb 20 ± 1 31 ± 2 - -
8.5. River Bank Issues
This section provides an outline of the river bank issues present the site with respect to its history of development and cracking. This has been determined from information provided by DWLBC and discussions with landowners and council employees on site and over the telephone. For a more general discussion of erosion problems along the River Murray refer to earlier Inspection Report prepared by SKM (2009).
Water level, rainfall and temperature records have been reviewed for the period over which major incidences were recorded along the Lower River Murray earlier this year. It needs to be appreciated that it is very difficult based on existing information to build up an accurate timeline of the history of cracking and slumping at sites. We cannot be certain of the exact timing of events as reports made are of the date in which an incident is reported, and does not necessarily represent the time in which cracking or failure actually occurred.
Woodlane Reserve is located on the southern bank of a straight section of the River Murray. A large section of river bank slumped at this location in late February 2009, damaging a pump station. The slump occurred at a location where a road runs close to river bank but also borders a lagoon/swamp area. Further collapses were documented on the 7 March, enlarging the slumped area of the first collapse and leading to the loss of the pump station. This slumping continued with a loss of Stobbie Pole documented on the 10 March. The construction of road at this site has added c.1-1.5m of fill on top of the banks. Variation in water level over the March period and temperature and rainfall in the region are shown in Figure 63 .
8.6. Stability Assessment
Two critical cross sections have been assessed in this study:

Study into River Bank Collapsing for Lower River Murray Geotechnical Investigation Report
SINCLAIR KNIGHT MERZ
VW04794_MurrayRiverbank_Geotech_RevE_FINAL_20100217.docx PAGE 30
Section WR1: In the vicinity of the failed pump station and the car park area; and
Section WR2: In the vicinity of the last residential home.
Plan and location of the cross section have been presented in Appendix C.
Both existing condition and further reduction of the river’s level to -1.5m AHD have been assessed. The analysis results were presented in Figure 15 and Figure 16.
8.7. Discussion
The Murray River levels have dropped approximately 2m since 2005 along the 200km stretch of the river north of Murray Bridge. This has led to groundwater levels lowering adjacent to the river bank; however, the existing surface lagoons away from the river bank may affect the groundwater levels.
The banks of the river contain fill material overlying normally consolidated alluvium followed by over-consolidated clays and sand. The depth of this alluvium varies and could be deeper than 20m adjacent to the river. Some permeable sand lenses occur in these normally consolidated clays. This means that the lowering of the river level is transmitted back into the banks but will take some time to respond to the lowering. At the top of the river bank there is often housing or other assets which are about 1 to 2m above the groundwater table. The lowering of the groundwater table adjacent to the river has the following adverse affects on the stability of the banks:
Tilting of the soil blocks towards the river due to differential subsidence;
Tension at the crest of the slope due to tilting;
Shrinkage cracks increasing to the depth of the water table due to drying of the reactive clays being exposed to surface temperatures and evaporation to a greater depth. The seasonal moisture zone in Murray River area is approximately 4m deep so as the groundwater table drops so the shrinkage cracks follow.
Shrinkage cracks become tension cracks that fill with surface water and drive failure from the crest when it rains. Tilting increases the width of shrinkage cracks in the direction of the tilting.
Shrinkage cracks can form in cubic blocks or hexagonal blocks and the cracks will become wider as the level of desiccation increases with climate change. This can cause additional settlement of the ground due to the 3D shrinkage of the desiccated blocks.
Subsidence due to the lowering of the groundwater level would have led to surface settlement over the last 4 years and the next 3 years with some time delay effects due to the rate of dissipation of the pore water pressures after drawdown. Differential subsidence due to changing thicknesses of the normally consolidated clay in the banks and/or the changes in the drawdown levels between points in the bank can lead to tilting and the development of

Study into River Bank Collapsing for Lower River Murray Geotechnical Investigation Report
SINCLAIR KNIGHT MERZ
VW04794_MurrayRiverbank_Geotech_RevE_FINAL_20100217.docx PAGE 31
tensile strains in the river bank. These strains are not necessarily evenly spread at the surface and can concentrate in existing shrinkage cracks or at points near the crest of the bank where tensile strains may already be approaching the maximum tensile capacity of the soil.
Tree roots exaggerate the shrinkage effects in reactive soils and if the root system cannot follow the falling groundwater level then the tree will become brittle and fall. A row of trees may cause instability at the edge of the river if there is a vertical bank along which a row of trees is subject to high winds leading to an over-turning moment. This may also apply to trees already leaning over the bank. A toppling failure would occur immediately behind the row of trees with the minimum volume of soil in the slide mass to resist the failure.
Slope stability analyses in the vicinity of the failed pump station, based on observed existing static conditions, indicate that the Factor of Safety (FoS = 1.38) against slope failure, in this area, is below the FoS (FoS = 1.50) that would normally be considered acceptable, for permanent areas used by the public. It is considered highly likely that further reductions in water level may trigger a slope (bank) failure in this area (FoS = 1.20).
8.8. Recommendations
We recommend that public and residents of these riverside properties be advised that after further reduction in the water level (below RL-0.80m), there is a high risk of bank failure and the access road and car park area be closed to public traffic and car parking (residents may still use the access road when water level is above RL-0.80m, but it is advised that the cars to be parked away from the river). River traffic should be warned of the very high probability of failure and advised not to moor in the area.

Study into River Bank Collapsing for Lower River Murray Geotechnical Investigation Report
SINCLAIR KNIGHT MERZ
VW04794_MurrayRiverbank_Geotech_RevE_FINAL_20100217.docx PAGE 32
9. South Punyelroo 9.1. Site Geology
South Punyelroo is mapped on the Geological Survey of South Australia (1971) Renmark map-sheet as Quaternary Coonambidgal Formation, comprising fluvial clays, silts and sands; light grey alluvium of the Murray River system.
9.2. Subsurface Condition
The soil profile encountered at South Punyelroo confirmed the expected Quaternary Coonambidgal Formation, as seen on the Geological Survey of South Australia (1971) Renmark map-sheet. The subsurface profile consisted of an upper layer of SAND and Silty SAND, with a thickness about 0.4 to 1.2m, usually underlain by firm to very soft silty CLAY. A layer of light green to grey SAND typically underlay this layer around 3.8m to 4.5m below ground level. The three boreholes conducted at this site were terminated just before 5m below ground level in medium dense SAND. Further details of the subsurface profiles encountered during the investigation are presented on the borehole logs in Appendix D.
9.3. Groundwater
Due to the drilling methods, it was difficult to determine the inflow of groundwater. Moisture conditions of the soils were recorded in the borehole logs presented in Appendix D.
9.4. Soil Parameter Plots
Results of moisture content and Atterberg limit tests with depth for South Punyelroo are presented in Figure 53. Results of dry density and bulk density tests for this site are presented in Figure 54. Results of dry density and liquidity in clay layer indicate that there is a major different between parameters of this layer above and under water table. Consistency of this layer varies from firm to very stiff with increases in depth from above water table to under water table. A liquidity versus depth plot is presented on Figure 55. A plot of plasticity index versus depth is presented on Figure 56.
A summary of the soil parameters used for the stability assessment is presented in Table 8.

Study into River Bank Collapsing for Lower River Murray Geotechnical Investigation Report
SINCLAIR KNIGHT MERZ
VW04794_MurrayRiverbank_Geotech_RevE_FINAL_20100217.docx PAGE 33
Table 8 Soil Parameter for Stability Assessments – South Punyelroo
Type Description Soil Model Unit Weight (kN/m3)
φ’ (°)
C’ / Su (kPa)
Increase Rate for Su
Type - A Fill: Silty/Clayey SAND (SM/SC) Mohr-Coulomb 20 ± 1 30 ± 1 - -
Type–B1 Silty CLAY (CL) Undrained Su=f(depth) 20 ± 1 - 100 ± 20 -
Type–B2 Silty CLAY (CL) Undrained Su=f(depth) 17 ± 1 - 25 ± 5 -
Type - C Clayey SAND/Sandy CLAY (SC/CL)
Mohr-Coulomb 20 ± 1 30 ± 1 - -
9.5. River Bank Issues
This section provides an outline of the river bank issues present the site with respect to its history of development and cracking. This has been determined from information provided by DWLBC and discussions with landowners and council employees on site and over the telephone. For a more general discussion of erosion problems along the River Murray refer to earlier Inspection Report prepared by SKM (2009).
South Punyelroo is located on the west bank on an inside meander bend of the River Murray. At this site tension cracks were noted in the shoreline and also along road which is positioned at back of houses, 80m from the shoreline. There has also been lateral movement of earth around house foundations with movement in the direction of the river (c.2cm). Houses were developed in this area in the 1960’s/1970’s. The cracking in the road first appeared over the 2008-2009 Summer Period, the exact timing is unknown.
9.6. Stability Assessment
A critical cross section has been assessed in this study:
Section SP1: In the vicinity of the failed pump station and the car park area.
Plan and location of the cross section have been presented in Appendix D.
Both existing condition and further reduction of the river’s level to -1.5m AHD have been assessed. The analysis results were presented in Figure 18 to Figure 21.
9.7. Discussion
The Murray River levels have dropped approximately 2m since 2005 along the 200km stretch of the river north of Murray Bridge. This has led to groundwater levels lowering adjacent to the river bank; however, the existing surface lagoons away from the river bank may affect the groundwater levels.

Study into River Bank Collapsing for Lower River Murray Geotechnical Investigation Report
SINCLAIR KNIGHT MERZ
VW04794_MurrayRiverbank_Geotech_RevE_FINAL_20100217.docx PAGE 34
The banks of the river contain over-consolidated clays followed by sand. The depth of this alluvium varies adjacent to the river. Some permeable sand lenses were observed within the clayey layers. This means that the lowering of the river level is transmitted back into the banks but will take some time to respond to the lowering. At the top of the river bank there is often housing or other assets which are about 1 to 2m above the groundwater table. The lowering of the groundwater table adjacent to the river has the following adverse affects on the stability of the banks:
Tilting of the soil blocks towards the river due to differential subsidence;
Tension at the crest of the slope due to tilting;
Shrinkage cracks increasing to the depth of the water table due to drying of the reactive clays being exposed to surface temperatures and evaporation to a greater depth. The seasonal moisture zone in Murray River area is approximately 4m deep, so as the groundwater table drops so the shrinkage cracks follow.
Shrinkage cracks become tension cracks that fill with surface water and drive failure from the crest when it rains. Tilting increases the width of shrinkage cracks in the direction of the tilting.
Shrinkage cracks can form in cubic blocks or hexagonal blocks and the cracks will become wider as the level of desiccation increases with climate change. This cause additional settlement of the ground due to the 3D shrinkage of the desiccated blocks.
Subsidence due to the lowering of the groundwater level would have led to surface settlement over the last 4 years and the next 3 years with some time delay effects due to the rate of dissipation of the pore water pressures after drawdown. Differential subsidence due to changing thicknesses of the normally consolidated clay in the banks and/or the changes in the drawdown levels between points in the bank can lead to tilting and the development of tensile strains in the river bank. These strains are not necessarily evenly spread at the surface and can concentrate in existing shrinkage cracks or at points near the crest of the bank where tensile strains may already be approaching the maximum tensile capacity of the soil.
Tree roots exaggerate the shrinkage effects in reactive soils and if the root system cannot follow the falling groundwater level then the tree will become brittle and fall. A row of trees may cause instability at the edge of the river if there is a vertical bank along which a row of trees is subject to high winds leading to an over-turning moment. This may also apply to trees already leaning over the bank. A toppling failure would occur immediately behind the row of trees with the minimum volume of soil in the slide mass to resist the failure.
Slope stability analyses in the vicinity of the river side properties, based on observed existing static conditions, indicate that the Factor of Safety (FoS = 3.95) against slope failure, in this area, is well above the FoS (FoS = 1.50) that would normally be considered acceptable, for permanent areas used by the public. As the boreholes in this area are 4m to 5m deep, a worst case scenario of presence of deep very soft clay (similar to other sites) has been assessed which resulted in

Study into River Bank Collapsing for Lower River Murray Geotechnical Investigation Report
SINCLAIR KNIGHT MERZ
VW04794_MurrayRiverbank_Geotech_RevE_FINAL_20100217.docx PAGE 35
FoS=1.67. It is considered likely that further reductions in water level will not affect the stability of the properties.
Furthermore, the shape and distribution of the cracks (Photo 16) indicates that the cracks are likely to be as a result of shrinkage of the top layers due to the reduction in the moisture content.
9.8. Recommendations
We recommend that the residents of these riverside properties be advised to monitor the cracks for accelerating ground movements.

Study into River Bank Collapsing for Lower River Murray Geotechnical Investigation Report
SINCLAIR KNIGHT MERZ
VW04794_MurrayRiverbank_Geotech_RevE_FINAL_20100217.docx PAGE 36
10. East Front Road 10.1. Site Geology
The East Front Road site is mapped on the Adelaide map-sheet as an Upper Cambrian to Lower Ordovician Pegmatite dyke, which is likely to be a medium to coarse grained granitic intrusion. Adjacent to this Pegmatite dyke consists the Mannum Formation as well as Quaternary grey fluvial silts, sands and gravels from the Murray River system.
10.2. Subsurface Condition
The soil profile encountered at East Front Road confirmed the expected geology, as seen in the Geological Survey of South Australia (1969) 1:250,000 Adelaide map sheet. The subsurface profile typically consisted of a medium dense clayey or sandy GRAVEL (a base/sub-base material for road construction, with thickness about 0.7 to 1.6m) underlain by a medium dense silty/gravelly sand. Below this layer of gravelly SAND and silty SAND, dark brown silty CLAY was usually encountered. Borehole EF-BH1, which was located adjacent to an outcrop of rock material, refused at a relatively shallow depth of 2.0m below ground level. At Borehole EF-BH2, layers of medium dense to very dense clayey GRAVEL, clayey SAND and gravelly SAND, of varying thickness were encountered. At borehole EF-BH-3 a very soft silty CLAY layer, of about 3.5 to 6.5m depth, was encountered, underlain by a dense clayey SAND layer. Further details of the subsurface profiles encountered during the investigation are presented on the borehole logs in Appendix E.
10.3. Groundwater
Due to the drilling methods, it was difficult to determine the inflow of groundwater. Moisture conditions of the soils were recorded in the borehole logs presented in Appendix E.
10.4. Soil Parameter Plots
Results of moisture content and Atterberg limit tests with depth for East Front Road are presented in Figure 57. Results of dry density and bulk density tests for this site are presented in Figure 58. A liquidity versus depth plot is presented on Figure 59. A plot of plasticity index versus depth is presented on Figure 60.
A summary of the soil parameters used for the stability assessment is presented in Table 9.

Study into River Bank Collapsing for Lower River Murray Geotechnical Investigation Report
SINCLAIR KNIGHT MERZ
VW04794_MurrayRiverbank_Geotech_RevE_FINAL_20100217.docx PAGE 37
Table 9 Soil Parameter for Stability Assessments – East Front Road
Type Description Soil Model Unit Weight (kN/m3)
φ’ (°)
C’ / Su (kPa)
Increase Rate for Su
Type-A1
Fill: Silty/Clayey SAND (SM/SC) and GRAVEL (GM/GC)
Mohr-Coulomb 20 ± 1 32 ± 2 - -
Type–A2
Fill: Silty/Clayey SAND (SM/SC) and GRAVEL (GM/GC)
Mohr-Coulomb 21 ± 1 35 ± 3 - -
Type-B Silty CLAY (CH) Undrained 17 ± 1 - 50 ± 10 -
Type–B1 Silty CLAY (CH) Undrained 17 ± 1 - 17.5 ± 2.5 -
Type–B2 Silty CLAY (CH) Undrained 17 ± 1 - 14 ± 2 -
Type–C Clayey SAND (SC) Undrained 20 ± 1 31 ± 1 - -
ROCK ROCK Bedrock (Inpenetrable) - - - -
Type B1 and B2 materials are not present in Section EF1, where Type A1 and A2 FILL overlies a thin layer of Type B Silty CLAY on bedrock.
10.5. River Bank Issues
This section provides an outline of the river bank issues present at the site with respect to its history of development and cracking. This has been determined from information provided by DWLBC and discussions with landowners and council employees on site and over the telephone. For a more general discussion of erosion problems along the River Murray refer to earlier Inspection Report prepared by SKM (2009).
Water level, rainfall and temperature records have been reviewed for the period over which major incidences were recorded along the Lower River Murray earlier this year. It needs to be appreciated that it is very difficult based on existing information to build up an accurate timeline of the history of cracking and slumping at sites. We cannot be certain of the exact timing of events as reports made are of the date in which an incident is reported, and does not necessarily represent the time in which cracking or failure actually occurred.
The original East Front Road is believed to have been constructed in 1970’s. The road was rebuilt in the 1980’s and lies on top of fill. The fill consists of cliff rock from the nearby quarry. Large stones were put at the base, with gaps filled with fines. A 150mm limestone layer was put on top and compacted, before sealing the road. On the 24 July 2009 the first report was made on the

Study into River Bank Collapsing for Lower River Murray Geotechnical Investigation Report
SINCLAIR KNIGHT MERZ
VW04794_MurrayRiverbank_Geotech_RevE_FINAL_20100217.docx PAGE 38
appearance of tension cracks forming an arc across the road at one location. Figure 64 shows the history of water level, temperature and rainfall records available for this time.
10.6. Stability Assessment
Two critical cross sections has been assessed in this study:
Section EF1: In the vicinity of the cracks in the road, where the road passes below the approximately 3(H):1(V) rock slope; and
Section EF2: Approximately 200m north-east of Section EF1 along East Front Road.
Plan and location of the cross sections have been presented Appendix E.
Both existing condition and further reduction of the river’s level to -1.5m AHD have been assessed. The analysis results were presented in Figure 22 to Figure 25.
10.7. Discussion
The Murray River levels have dropped approximately 2m since 2005 along the 200km stretch of the river north of Murray Bridge. This has led to groundwater levels lowering adjacent to the river bank; however, the existing surface lagoons away from the river bank may affect the groundwater levels.
The banks of the river contain fill embankment constructed on the rock or natural clays followed by rock. The depth of this alluvium varies adjacent to the river. Some permeable sand lenses occur within the clays. This means that the lowering of the river level is transmitted back into the banks but will take some time to respond to the lowering. At the top of the river bank there is often housing or other assets which are about 1 to 2m above the groundwater table. The lowering of the groundwater table adjacent to the river has the following adverse affects on the stability of the banks:
Tilting of the soil blocks towards the river due to differential subsidence;
Tension at the crest of the slope due to tilting;
Shrinkage cracks increasing to the depth of the water table due to drying of the reactive clays being exposed to surface temperatures and evaporation to a greater depth. The seasonal moisture zone in Murray River area is approximately 4m deep so as the groundwater table drops the shrinkage cracks follow.
Shrinkage cracks become tension cracks that fill with surface water and drive failure from the crest when it rains. Tilting increases the width of shrinkage cracks in the direction of the tilting.

Study into River Bank Collapsing for Lower River Murray Geotechnical Investigation Report
SINCLAIR KNIGHT MERZ
VW04794_MurrayRiverbank_Geotech_RevE_FINAL_20100217.docx PAGE 39
Shrinkage cracks can form in cubic blocks or hexagonal blocks and the cracks will become wider as the level of desiccation increases with climate change. This cause additional settlement of the ground due to the 3D shrinkage of the desiccated blocks.
Subsidence due to the lowering of the groundwater level would have led to surface settlement over the last 4 years and the next 3 years with some time delay effects due to the rate of dissipation of the pore water pressures after drawdown. Differential subsidence due to changing thicknesses of the normally consolidated clay in the banks and/or the changes in the drawdown levels between points in the bank can lead to tilting and the development of tensile strains in the river bank. These strains are not necessarily evenly spread at the surface and can concentrate in existing shrinkage cracks or at points near the crest of the bank where tensile strains may already be approaching the maximum tensile capacity of the soil.
Tree roots exaggerate the shrinkage effects in reactive soils and if the root system cannot follow the falling groundwater level then the tree will become brittle and fall. A row of trees may cause instability at the edge of the river if there is a vertical bank along which a row of trees is subject to high winds leading to an over-turning moment. This may also apply to trees already leaning over the bank. A toppling failure would occur immediately behind the row of trees with the minimum volume of soil in the slide mass to resist the failure.
Slope stability analyses in the vicinity Section EF1, based on observed existing static conditions, indicate that the Factor of Safety (FoS = 1.30) against slope failure, in this area, is below the FoS (FoS = 1.50) that would normally be considered acceptable, for permanent areas used by the public. Furthermore, stability analysis results indicate that the reduction in the river’s level will decrease the factor of safety to 1.23. Noting the effects of the existing trees bending toward the river and the existing crack in this area, this section is considered to be high risk.
Slope stability analyses in the vicinity Section EF2, indicate that the Factor of Safety (FoS = 1.02) against slope failure, is well below the FoS (FoS = 1.50) and is high risk for permanent areas used by the public. Furthermore, stability analysis results indicate that the reduction in the river’s level could trigger the failure (FoS = 0.95).
Furthermore, the shape and distribution of the cracks (Photo 17 and Photo 18) indicate that possible failure zones already developed and the remedial works undertaken on the asphalt wearing cannot solve the problem or reduce the probability of the failure.
10.8. Recommendations
We recommend that the responsible authority should decide on road closure and urgent remedial studies and works (such as detailed stability assessment) for the road alignment and the development of a new alignment away from the area of possible failure.

Study into River Bank Collapsing for Lower River Murray Geotechnical Investigation Report
SINCLAIR KNIGHT MERZ
VW04794_MurrayRiverbank_Geotech_RevE_FINAL_20100217.docx PAGE 40
We recommend that the road in vicinity of the river should be signed as Very High Risk for road embankment failure in to the river. Furthermore, a reduced speed limit should be applied to the public to avoid car fall into the possible embankment failures. The road should be monitored weekly; however, after water level reduction to below RL-0.80mAHD or heavy rain falls, the road should be monitored more frequently for failure/deformation (at least twice a week). River traffic should be warned of the very high probability of failure and advised not to moor in the area.
A soft layer was noticed in the soil profile adjacent to the rock layer which could be developed by water seepage through the fill embankment. Installation of a proper drainage system for interception of the water seepage through the embankment is recommended.

Study into River Bank Collapsing for Lower River Murray Geotechnical Investigation Report
SINCLAIR KNIGHT MERZ
VW04794_MurrayRiverbank_Geotech_RevE_FINAL_20100217.docx PAGE 41
11. Swan Reach 11.1. Site Geology
Swan Reach is mapped on the Renmark (1971) map-sheet as Quaternary Coonambidgal Formation, comprising fluvial clays, silts and sands; light grey alluvium of the Murray River system. This unit overlies coarse grained riverine sand of the Monoman Formation.
11.2. Subsurface Condition
The soil profile encountered at Swan Reach confirmed the expected Quaternary Coonambidgal Formation, as seen on the Geological Survey of South Australia (1971) Renmark map sheet. The subsurface profile consisted of a 0.1m thickness topsoil layer of coarse GRAVEL, underlain by sandy GRAVEL/gravelly SAND fill material to around 1.7m below ground level. The fill material overlaid a dry to moist firm black silty CLAY layer. From 5m below ground level, the moisture content increased, the colour changed to a dark grey and the consistency became very soft to 7.5m depth, where the sand content increased gradually, eventually becoming medium dense SAND. Further details of the subsurface profiles encountered during the investigation are presented on the borehole logs in Appendix F.
11.3. Groundwater
Due to the drilling methods, it was difficult to determine the inflow of groundwater. Moisture conditions of the soils were recorded in the borehole logs presented in Appendix F.
11.4. Soil Parameters
A summary of the soil parameters used for the stability assessment is presented in Table 10.
Table 10 Soil Parameter for Stability Assessments – Swan Reach
Type Description Soil Model Unit Weight (kN/m3)
φ’ (°)
C’ / Su (kPa)
Increase Rate for Su
Type - A Fill: Silty/Clayey SAND (SM/SC) Mohr-Coulomb 20 ± 1 30 ± 2 - -
Type-B1 Silty CLAY (CH) Undrained 20 ± 1 - 250 -
Type-B2 Silty CLAY (CH) Undrained 20 ± 1 - 50 ± 10 -
Type-B3 Silty CLAY (CH) Undrained 18 ± 1 - 18 ± 2 -
Type-B4 Silty CLAY (CH) Undrained 18 ± 1 - 12.5 ± 2.5 -
Type - C Clayey SAND/Sandy CLAY (SC/CL)
Mohr-Coulomb 20 ± 1 31 ± 1 - -

Study into River Bank Collapsing for Lower River Murray Geotechnical Investigation Report
SINCLAIR KNIGHT MERZ
VW04794_MurrayRiverbank_Geotech_RevE_FINAL_20100217.docx PAGE 42
11.5. River Bank Issues
This section provides an outline of the river bank issues present the site with respect to its history of development and cracking. This has been determined from information provided by DWLBC and discussions with landowners and council employees on site and over the telephone. For a more general discussion of erosion problems along the River Murray refer to earlier Inspection Report prepared by SKM (2009).
Water level, rainfall and temperature records have been reviewed for the period over which major incidences were recorded along the Lower River Murray earlier this year. It needs to be appreciated that it is very difficult based on existing information to build up an accurate timeline of the history of cracking and slumping at sites. We cannot be certain of the exact timing of events as reports made are of the date in which an incident is reported, and does not necessarily represent the time in which cracking or failure actually occurred.
Reports of cracking at this site are first recorded in the database on the 2 April 2009 (large crack in bank) and then again on the 16 July 2009. The report on the 16 July 2009 noted river bank slumping near the Swan Reach pump station. Longitudinal cracks about 50-70 mm wide were observed parallel to the river approximately 5 metres from the river edge.
11.6. Stability Assessment
One critical cross section has been assessed in this study:
Section SW1: In the vicinity of the existing facilities.
Plan and location of the cross sections have been presented Appendix F.
Both existing condition and further reduction of the river’s level to -1.5m AHD have been assessed. The analysis results were presented in Figure 26 and Figure 27.
11.7. Discussion
The Murray River levels have dropped approximately 2m since 2005 along the 200km stretch of the river north of Murray Bridge. This has led to groundwater levels lowering adjacent to the river bank; however, the existing surface lagoons away from the river bank may affect the groundwater levels.
The banks of the river contain over-consolidated to normally consolidated clays followed by sand. The depth of this alluvium varies adjacent to the river. Some permeable sand lenses occur the clays. This means that the lowering of the river level is transmitted back into the banks but will take some

Study into River Bank Collapsing for Lower River Murray Geotechnical Investigation Report
SINCLAIR KNIGHT MERZ
VW04794_MurrayRiverbank_Geotech_RevE_FINAL_20100217.docx PAGE 43
time to respond to the lowering. At the top of the river bank there is a waste disposal station facility. The lowering of the groundwater table adjacent to the river has the following adverse affects on the stability of the banks:
Tilting of the soil blocks towards the river due to differential subsidence;
Tension at the crest of the slope due to tilting;
Shrinkage cracks increasing to the depth of the water table due to drying of the reactive clays being exposed to surface temperatures and evaporation to a greater depth. The seasonal moisture zone in Murray River area is approximately 4m deep so as the groundwater table drops so the shrinkage cracks follow.
Shrinkage cracks become tension cracks that fill with surface water and drive failure from the crest when it rains. Tilting increases the width of shrinkage cracks in the direction of the tilting.
Shrinkage cracks can form in cubic blocks or hexagonal blocks and the cracks will become wider as the level of desiccation increases with climate change. This cause additional settlement of the ground due to the 3D shrinkage of the desiccated blocks.
Subsidence due to the lowering of the groundwater level would have led to surface settlement over the last 4 years and the next 3 years with some time delay effects due to the rate of dissipation of the pore water pressures after drawdown. Differential subsidence due to changing thicknesses of the normally consolidated clay in the banks and/or the changes in the drawdown levels between points in the bank can lead to tilting and the development of tensile strains in the river bank. These strains are not necessarily evenly spread at the surface and can concentrate in existing shrinkage cracks or at points near the crest of the bank where tensile strains may already be approaching the maximum tensile capacity of the soil.
Tree roots exaggerate the shrinkage effects in reactive soils and if the root system cannot follow the falling groundwater level then the tree will become brittle and fall. A row of trees may cause instability at the edge of the river if there is a vertical bank along which a row of trees is subject to high winds leading to an over-turning moment. This may also apply to trees already leaning over the bank. A toppling failure would occur immediately behind the row of trees with the minimum volume of soil in the slide mass to resist the failure.
Slope stability analyses in the vicinity of the failed pump station, based on observed existing static conditions, indicate that the Factor of Safety (FoS = 1.68) against slope failure, in this area, is above the FoS (FoS = 1.50) that would normally be considered acceptable, for permanent areas used by the public. It is considered that the predicted further reductions in water level would not reduce the FoS against failure at this location (FoS = 1.70). Factors of Safety for the earthquake loading are about 1.20.

Study into River Bank Collapsing for Lower River Murray Geotechnical Investigation Report
SINCLAIR KNIGHT MERZ
VW04794_MurrayRiverbank_Geotech_RevE_FINAL_20100217.docx PAGE 44
11.8. Recommendations
We recommend that the operators of this facility be advised to monitor the cracks for accelerating ground movements.

Study into River Bank Collapsing for Lower River Murray Geotechnical Investigation Report
SINCLAIR KNIGHT MERZ
VW04794_MurrayRiverbank_Geotech_RevE_FINAL_20100217.docx PAGE 45
12. Walker Flat 12.1. Site Geology
The Walker Flat site is mapped on the Renmark (1971) map-sheet as Tertiary Mannum Formation, comprising sandy limestones and calcarenite.
12.2. Subsurface Condition
The subsurface profile consisted of a topsoil layer of silty/clayey GRAVEL, underlain by dry-moist firm silty CLAY layer. From 3.5m below ground level, the moisture content increased and the consistency reduced to very soft. From 9.8m depth, the sand content gradually increased, eventually becoming sandy CLAY/clayey SAND at 10.5m depth. Further details of the subsurface profiles encountered during the investigation are presented on the borehole logs in Appendix G.
12.3. Groundwater
Due to the drilling methods, it was difficult to determine the inflow of groundwater. Moisture conditions of the soils were recorded in the borehole logs presented in Appendix G.
12.4. Soil Parameters
A summary of the soil parameters used for the stability assessment is presented in Table 11.
Table 11 Soil Parameter for Stability Assessments – Walker Flat
Type Description Soil Model Unit Weight (kN/m3)
φ’ (°)
C’ / Su (kPa)
Increase Rate for Su
Type - A Fill: Silty/Clayey SAND (SM/SC) Mohr-Coulomb 19 ± 1 30 ± 2 - -
Type–B1 Silty CLAY (CH) Undrained 19 ± 1 - 70 ± 10 -
Type-B2 Silty CLAY (CH) Undrained 19 ± 1 - 50 ± 10 -
Type-B3 Silty CLAY (CH) Undrained 17 ± 1 - 15 ± 10 -
Type-B4 Silty CLAY (CH) Undrained 17 ± 1 - 15 ± 5 -
Type - C Clayey SAND/Sandy CLAY (SC/CL)
Mohr-Coulomb 19 ± 1 31 ± 1 - -
12.5. River Bank Issues
This section provides an outline of the river bank issues present the site with respect to its history of development and cracking. This has been determined from information provided by DWLBC

Study into River Bank Collapsing for Lower River Murray Geotechnical Investigation Report
SINCLAIR KNIGHT MERZ
VW04794_MurrayRiverbank_Geotech_RevE_FINAL_20100217.docx PAGE 46
and discussions with landowners and council employees on site and over the telephone. For a more general discussion of erosion problems along the River Murray refer to earlier Inspection Report prepared by SKM (2009).
This area was only recently noted as an area of concern. On the 10 October 2009, DWLBC reported a hole on the bank that was a concern as it was located in close proximity to landing.
12.6. Stability Assessments
A critical cross section has been assessed in this study:
Section WF1: In the vicinity of the facilities.
Plan and location of the cross section have been presented Appendix G.
Both existing condition and further reduction of the river’s level to -1.5m AHD have been assessed. The analysis results were presented in Figure 28 and Figure 29.
12.7. Discussion
The Murray River levels have dropped approximately 2m since 2005 along the 200km stretch of the river north of Murray Bridge. This has led to groundwater levels lowering adjacent to the river bank; however, the existing surface lagoons away from the river bank may affect the groundwater levels.
The banks of the river contain over-consolidated overlying normally consolidated alluvium clays followed by sand. The depth of this alluvium varies and could be deeper than 10m adjacent to the river. Some permeable sand lenses occur in these normally consolidated clays. This means that the lowering of the river level is transmitted back into the banks but will take some time to respond to the lowering. At the top of the river bank there is a waste disposal facility. The lowering of the groundwater table adjacent to the river has the following adverse affects on the stability of the banks:
Tilting of the soil blocks towards the river due to differential subsidence;
Tension at the crest of the slope due to tilting;
Shrinkage cracks increasing to the depth of the water table due to drying of the reactive clays being exposed to surface temperatures and evaporation to a greater depth. The seasonal moisture zone in Murray River area is approximately 4m deep so as the groundwater table drops the shrinkage cracks follow.
Shrinkage cracks become tension cracks that fill with surface water and drive failure from the crest when it rains. Tilting increases the width of shrinkage cracks in the direction of the tilting.

Study into River Bank Collapsing for Lower River Murray Geotechnical Investigation Report
SINCLAIR KNIGHT MERZ
VW04794_MurrayRiverbank_Geotech_RevE_FINAL_20100217.docx PAGE 47
Shrinkage cracks can form in cubic blocks or hexagonal blocks and the cracks will become wider as the level of desiccation increases with climate change. This cause additional settlement of the ground due to the 3D shrinkage of the desiccated blocks.
Subsidence due to the lowering of the groundwater level would have led to surface settlement over the last 4 years and the next 3 years with some time delay effects due to the rate of dissipation of the pore water pressures after drawdown. Differential subsidence due to changing thicknesses of the normally consolidated clay in the banks and/or the changes in the drawdown levels between points in the bank can lead to tilting and the development of tensile strains in the river bank. These strains are not necessarily evenly spread at the surface and can concentrate in existing shrinkage cracks or at points near the crest of the bank where tensile strains may already be approaching the maximum tensile capacity of the soil.
Tree roots exaggerate the shrinkage effects in reactive soils and if the root system cannot follow the falling groundwater level then the tree will become brittle and fall. A row of trees may cause instability at the edge of the river if there is a vertical bank along which a row of trees is subject to high winds leading to an over-turning moment. This may also apply to trees already leaning over the bank. A toppling failure would occur immediately behind the row of trees with the minimum volume of soil in the slide mass to resist the failure.
Slope stability analyses in the vicinity of the failed pump station, based on observed existing static conditions, indicate that the Factor of Safety (FoS = 1.02) against slope failure, in this area, is well below the FoS (FoS = 1.50) that would normally be considered acceptable, for permanent areas used by the public. It is considered highly likely that further reductions in water level may trigger a slope (bank) failure in this area (FoS = 0.94).
12.8. Recommendations
We recommend that public and operators be advised on the high risk of bank failure in the area and the area to be closed to traffic and car parking. Proper measures for closure and removal of important facilities in the area should be considered. It should be noted that the extent of the problem may be beyond the study area. River traffic should be warned of the very high probability of failure and advised not to moor in the area.

Study into River Bank Collapsing for Lower River Murray Geotechnical Investigation Report
SINCLAIR KNIGHT MERZ
VW04794_MurrayRiverbank_Geotech_RevE_FINAL_20100217.docx PAGE 48
13. Remedial Works Consolidation settlements and initiation and extension of the shrinkage cracks are mostly due to lowering of the Murray River which resulted in increase in surcharge and changes in the moisture content of the soils which may result in excessive settlement or instability.
The potential remedial works should be able to increase the stability of the slope against failure, reduce the settlements or other deformations due to desiccation and cracks.
Remedial works within the sensitive areas to reduce settlement, control moisture content or increase the stability of the bank; may be resource demanding, expensive and time consuming which could make the remedial measures economically impractical.
A few potential options to improve the stability conditions of the slopes along the Lower River Murray are presented in this section.
13.1. Modification of the Geometry
In this method, the driving forces within the sliding mass will be reduced by modifications to the geometry of the slope’s cross section.
13.1.1. Removal of Material from Top of the Slope
Advantages: Reduction in driving forces from the accessible parts of the slope;
Permanent solution;
Soil removal does not need special techniques; and
Relatively fast procedure.
Disadvantages: Deep seated failures require large quantities of soil to be removed;
Excavated materials should be stored in stockpiles;
In some of the areas where ground levels are 2m above the existing river level, removal of 2m soil will result in possible intrusion of water landward if water levels rise in the future; and
In most of the areas, existing buildings, access roads and other infrastructures are within the failure mass so removal of the soil is not practical.
13.1.2. Removal of Weak Materials
Due to the presence of very soft clay in depth, removal is not possible.

Study into River Bank Collapsing for Lower River Murray Geotechnical Investigation Report
SINCLAIR KNIGHT MERZ
VW04794_MurrayRiverbank_Geotech_RevE_FINAL_20100217.docx PAGE 49
13.1.3. Modification of the Slope
Advantages: Reduction in driving forces from the accessible parts of the slope;
Part of excavated materials could be used in the fill areas at the same location;
Permanent solution; and
Relatively fast procedure.
Disadvantages: Deep seated failures require large quantities of soil to be removed / placed;
Excavation of material in the water may expose the soft materials to erosion;
In most of the areas, existing buildings, access roads and other infrastructures are within the failure mass so removal of the soil is not practical and the slopes should be flattened toward the river which requires working over water or dredging;
Quality control of underwater placement is not possible;
Changing the cross section of the river can change the erosion behaviour of the area; and
Imported fill may be required.
13.2. Buttressing
In this method, the driving forces within the sliding mass will be moved by adding weight of material or shear keys to the cross section to increase the resisting forces by increasing the mass in the resisting zone, increasing shear strength of the toe or forcing the critical failure surface to go deeper.
13.2.1. Soil / Rock Fill / Gabions or Geotextile
Advantages: Local materials could be used for construction;
Permanent solution; and
Relatively fast procedure.
Disadvantages: Deep seated failures require large quantities of soil to be placed;
Gabions are expensive;
Remedial works should be toward the river so working over water is required;
Changing the cross section of the river can change the erosion behaviour of the area;
Imported fill may be required; and
Quality control of underwater placement is not possible.
Study into River Bank Collapsing for Lower River Murray Geotechnical Investigation Report
SINCLAIR KNIGHT MERZ
VW04794_MurrayRiverbank_Geotech_RevE_FINAL_20100217.docx PAGE 50
13.2.2. Shear Key
Advantages: Local materials could be used for construction;
Permanent solution; and
Relatively fast procedure.
Disadvantages: Deep seated failures require long shear keys to be placed;
The strength of the very soft clayey layer does not increase significantly with depth;
Underwater excavation and construction is required which could be economically and technically impractical; and
Excavation of deep shear keys could result in instability of the slopes.
13.3. Drainage
A proper drainage system can reduce the possibility of seepage forces toward the river, erosion, piping and softening of the material.
13.3.1. Surface Drainage
Advantages: Reduction in face erosion;
Reduction in softening of the materials; and
Reduction in erosion and water infill in the cracks.
Disadvantages: Compared to the effect of river’s level fluctuation, the effect of surface water drainage on
stability is not significant.
13.3.2. Subsurface Drainage
Advantages: Reduction in softening of the materials; and
Reduction in erosion and water infill in the cracks.
Disadvantages: Compared to the effect of river’s level fluctuation, the effect of surface water drainage on
stability is not significant.

Study into River Bank Collapsing for Lower River Murray Geotechnical Investigation Report
SINCLAIR KNIGHT MERZ
VW04794_MurrayRiverbank_Geotech_RevE_FINAL_20100217.docx PAGE 51
13.4. Reinforcement
Reinforcement methods such as soil nails, piles and retaining walls could be used to reinforce the possible failure face or force them to move to the deeper layers.
13.4.1. Soil Nailing
Advantages: Improving stability in suitable soil and groundwater conditions.
Disadvantages: Needs soil displacement for developing tension in the nails;
May need to be installed over/under water;
Requires stronger soil layers;
Squeezing of soft clays between the nails;
Long nails are required for deep seated failures;
Quality control for construction under water;
Unknown long term performance and durability in the river; and
Erosion of the soil around the nail’s head.
13.4.2. Stone Columns / Soil Mixing
Advantages: Improving stability in suitable soil and groundwater conditions.
Disadvantages: May result in drainage and accelerate the consolidation process which increases the settlement;
May need to be installed over/under water;
Stability of the holes, may need casing;
Squeezing of soft clays between the columns;
Long columns are required for deep seated failures;
Quality control for construction under water;
Erosion of the soil around the columns’ head.

Study into River Bank Collapsing for Lower River Murray Geotechnical Investigation Report
SINCLAIR KNIGHT MERZ
VW04794_MurrayRiverbank_Geotech_RevE_FINAL_20100217.docx PAGE 52
13.4.3. Retaining Wall / Sheetpile / Driven Piles
Advantages: Improving stability in suitable soil and groundwater conditions;
Quality control; and
Could be constructed from the land.
Disadvantages: Expensive;
Squeezing of soft clays between the piles;
Long piles / sheetpiles / retaining walls are required for deep seated failures; and
Erosion of the soil around the wall.
13.5. Strength Improvement
The consistency of the very soft clay could be improved by different methods.
13.5.1. Electro Osmosis
Advantages: Improving stability in suitable soil and groundwater conditions.
Disadvantages: High energy requirement;
Not effective in vicinity of the river;
Performance in sandy layers and river’s water cannot be guaranteed; and
May accelerate settlement.
13.5.2. Grouting
Advantages: Improving stability in suitable soil and groundwater conditions.
Disadvantages: Working over water;
Constructability and performance cannot be guaranteed in soft clays;
Poor quality control and uniformity; and
Deep grouting is required for deep seated failures.

Study into River Bank Collapsing for Lower River Murray Geotechnical Investigation Report
SINCLAIR KNIGHT MERZ
VW04794_MurrayRiverbank_Geotech_RevE_FINAL_20100217.docx PAGE 53
14. Conclusion The following activities were carried out in this study:
• A detailed desktop study, site investigation, laboratory tests and stability assessment was carried out for seven sites, nominated by DWLBC;
• Land survey and bathymetrical transactions for the critical sections of each site were prepared. The shape and location of the existing cracks were surveyed; however, traffic, heavy rain falls and sediment in-fills already obscured some of the cracks;
• Factual geotechnical information for each site were collected comprising:
• Observed soil profile including materials and layering information;
• In-situ test results for strength, consistency and pore-pressures; and
• Laboratory tests results on the index properties, strength and deformation of the soil samples;
• Interpretation of the factual information were carried out to estimate the properties of the soil profiles to be used for stability and deformation assessments;
• Stability assessment of the selected cross sections were carried out to evaluate the Factors of Safety against instability for each site;
• Preliminary assessments of the predicted settlements due to lowering the river’s water level for selected cross sections from 2005 to 2013 were undertaken;
• Stability issues after further reduction in river’s level, over the next three years, were assessed and discussed;
• Management recommendations for each site, including location of the fencing and access control have been provided; and
• Preliminary recommendations for possible remedial works, together with advantages and disadvantages were presented.
Study into River Bank Collapsing for Lower River Murray Geotechnical Investigation Report
SINCLAIR KNIGHT MERZ
VW04794_MurrayRiverbank_Geotech_RevE_FINAL_20100217.docx PAGE 54
15. Recommendations On the basis of our assessments, we make the following recommendations:
• The authorities, residents and public need to be made aware of areas considered to be “high risk”.
• Fencing and using “High Risk” signs should be put in place in “high risk” areas.
• Constant monitoring of “high risk” areas should be performed, especially shrinkage cracks and slumping during the dry season, deformation and movements during and after heavy rains and throughout the tourism season.
• Workshop training for DWLBC’s monitoring staff (or other stack holders) for monitoring requirements;
• Preparation of a Risk Map for bank failures for the Lower River Murray. This risk map will incorporate the existing geological information, historical aerial photography, major infrastructures, population at risk and other important items along the river’s alignment to create a base map for the risk study. Using this map together with the assessment of the failure consequences will enable the preparation of a River bank Slumping Hazard Risk Map;
• This map can then used to identify the distribution of high risk/high consequence areas and form the basis for prioritising management actions and monitoring. To achieve this, requires a shift in focus, moving away from specific sites where failure have occurred, to assessments of lengths of river and the distribution of conditions influencing risk of collapse. The diagram over the page outlines the process in which this risk map is developed;
• Preparation of a base map indicating areas near the river that should not be developed, i.e. residential, commercial and other infrastructure.
• Detailed geotechnical assessment of the existing buildings and infrastructures for the high risk areas in the Risk Map, especially East Front Road.
• Preparation of Risk Management Tools, such as “Preliminary Stability Assessment Charts” and “Settlement Prediction Charts” for the river bank.

Study into River Bank Collapsing for Lower River Murray Geotechnical Investigation Report
SINCLAIR KNIGHT MERZ
VW04794_MurrayRiverbank_Geotech_RevE_FINAL_20100217.docx PAGE 55
Proposed Methodology to Prepare a Risk Map for Bank Failures along the Lower River Murray
Task 1 – Data collection & review of background information.
Review of existing information. Much information has already been collected during earlier phases of the project and is available on the GIS Database.
Task 2 – Project initiation meeting with DWLBC to identify known risks and scope.
The scope of the risk mapping would need to be refined in consultation with DWLBC. This would involve discussions with DWLBC staff about the risks that collapses pose to different assets and its stakeholders.
Task 3 - Develop a Risk Register in conjunction with DWLBC.
This task would involve the development of a draft Risk Register from the results of previous investigations and discussions with DWLBC. Possible threats, likelihood and consequence would be documented in the Risk Register.
Task 4 – Initial Risk Mapping
Risk Maps will be developed based on topography, aerial photography, mapped geology and data gained from recent studies. Threats from Task 3 will be identified on long sections of the Lower River Murray and presented as Risk Maps.
Task 6 –Investigate data gaps & undertake site investigations if required.
This task will only be carried out if it is deemed necessary to improve the accuracy of the risk mapping developed from Task 4.
Task 7 - Prepare final Risk Register & Maps on the basis of all inputs.
Finalise Risk Register and Maps based on all information, filling in all data gaps.
Tasks 8 - Identify, classify and cost risk reduction measures.
Report on risk assessment, risk reduction strategies and indicative costs of these options. A series of Risk Maps for the area would be produced.
Task 5 - Workshop to test the risk matrix, and identify data gaps.
A technical risk workshop or series of interviews would be convened with stakeholders to workshop potential risks. Any data gaps would be identified at this stage.

Study into River Bank Collapsing for Lower River Murray Geotechnical Investigation Report
SINCLAIR KNIGHT MERZ
VW04794_MurrayRiverbank_Geotech_RevE_FINAL_20100217.docx PAGE 56
16. References L.W. Abramson, T.S. Lee, S. Sharma, G.M. Boyce (2002), Slope Stability and Stabilization
Methods, 2nd Ed.
J.E. Bowles (1995), Foundation Analysis and Design, 5th Ed.
B.M. Das (2006), Principles of Foundation Engineering, 6th Ed.
T. Lunne, P.K. Robertson, J.M.M. Powell (1997), Cone Penetration Testing in Geotechnical Practice.
Geological Survey of South Australia (1969), 1:250,000 Adelaide Map Sheet.
Geological Survey of South Australia (1971), 1:250,000 Renmark Map Sheet.
Geological Survey of South Australia (1962), 1:250,000 Barker Map Sheet.
SKM (2009) Study into River Bank Collapsing – Lower River Murray. Inspection Report. Report to Department of Water, Land and Biodiversity Conservation.
Standards Australia (2000), AS1289-2000 Methods of testing soils for engineering purposes.
Standards Australia (1993), AS1726-1993 Geotechnical Site Investigations.
Transportation Research Board National Research Council (1996), Landslide Investigation and Mitigation, Special Report 247.

Study into River Bank Collapsing for Lower River Murray Geotechnical Investigation Report
SINCLAIR KNIGHT MERZ
VW04794_MurrayRiverbank_Geotech_RevE_FINAL_20100217.docx PAGE 57
Photographs
Photo 1 Riverfront Road-Murray Bridge Boat Ramp

Study into River Bank Collapsing for Lower River Murray Geotechnical Investigation Report
SINCLAIR KNIGHT MERZ
VW04794_MurrayRiverbank_Geotech_RevE_FINAL_20100217.docx PAGE 58
Photo 2 Riverfront Road-Murray Bridge Riverfront Homes
Photo 3 Caloote Landing

Study into River Bank Collapsing for Lower River Murray Geotechnical Investigation Report
SINCLAIR KNIGHT MERZ
VW04794_MurrayRiverbank_Geotech_RevE_FINAL_20100217.docx PAGE 59
Photo 4 Caloote Tension Crack
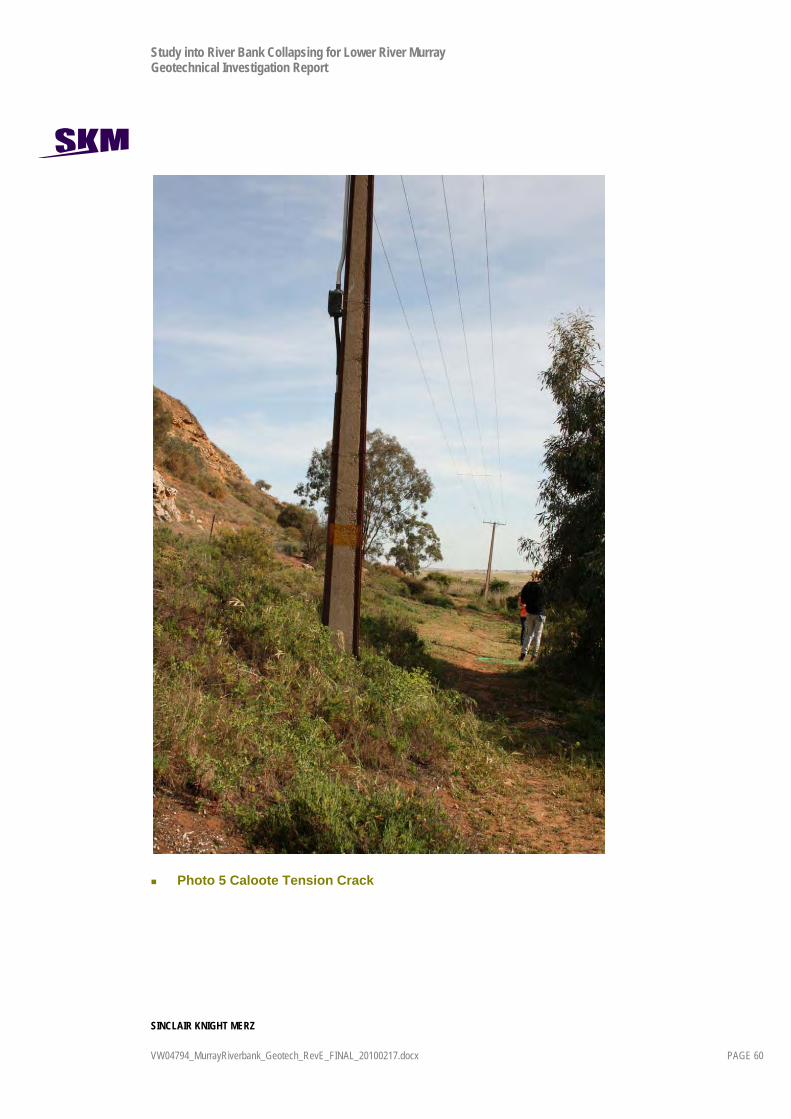
Study into River Bank Collapsing for Lower River Murray Geotechnical Investigation Report
SINCLAIR KNIGHT MERZ
VW04794_MurrayRiverbank_Geotech_RevE_FINAL_20100217.docx PAGE 60
Photo 5 Caloote Tension Crack

Study into River Bank Collapsing for Lower River Murray Geotechnical Investigation Report
SINCLAIR KNIGHT MERZ
VW04794_MurrayRiverbank_Geotech_RevE_FINAL_20100217.docx PAGE 61
Photo 6 Caloote Tension Crack

Study into River Bank Collapsing for Lower River Murray Geotechnical Investigation Report
SINCLAIR KNIGHT MERZ
VW04794_MurrayRiverbank_Geotech_RevE_FINAL_20100217.docx PAGE 62
Photo 7 Caloote Tension Crack

Study into River Bank Collapsing for Lower River Murray Geotechnical Investigation Report
SINCLAIR KNIGHT MERZ
VW04794_MurrayRiverbank_Geotech_RevE_FINAL_20100217.docx PAGE 63
Photo 8 Caloote Tension Crack
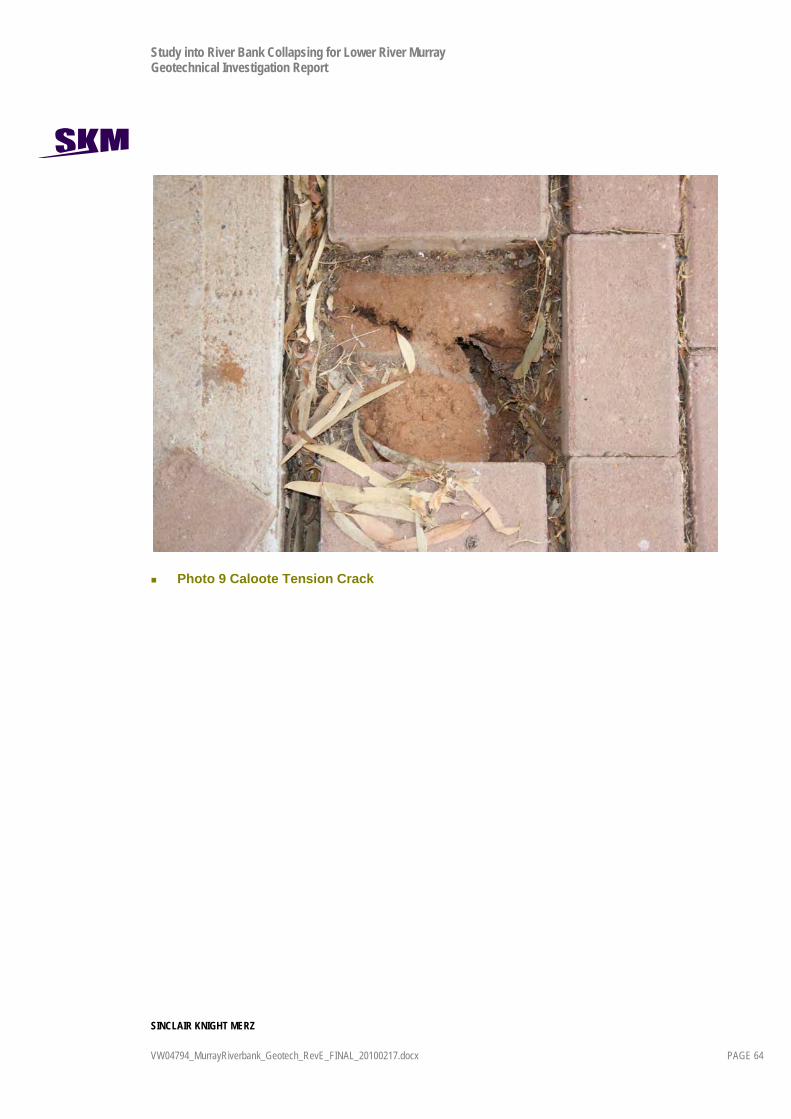
Study into River Bank Collapsing for Lower River Murray Geotechnical Investigation Report
SINCLAIR KNIGHT MERZ
VW04794_MurrayRiverbank_Geotech_RevE_FINAL_20100217.docx PAGE 64
Photo 9 Caloote Tension Crack

Study into River Bank Collapsing for Lower River Murray Geotechnical Investigation Report
SINCLAIR KNIGHT MERZ
VW04794_MurrayRiverbank_Geotech_RevE_FINAL_20100217.docx PAGE 65
Photo 10 Caloote Tension Crack
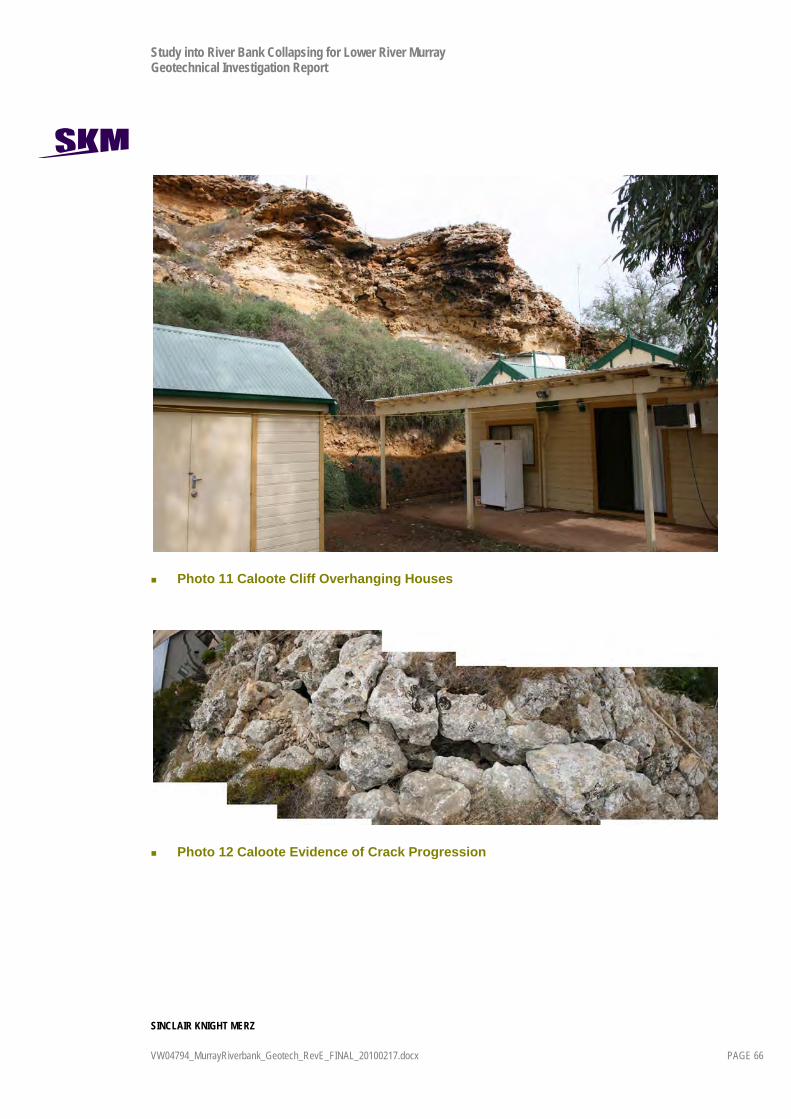
Study into River Bank Collapsing for Lower River Murray Geotechnical Investigation Report
SINCLAIR KNIGHT MERZ
VW04794_MurrayRiverbank_Geotech_RevE_FINAL_20100217.docx PAGE 66
Photo 11 Caloote Cliff Overhanging Houses
Photo 12 Caloote Evidence of Crack Progression

Study into River Bank Collapsing for Lower River Murray Geotechnical Investigation Report
SINCLAIR KNIGHT MERZ
VW04794_MurrayRiverbank_Geotech_RevE_FINAL_20100217.docx PAGE 67
Photo 13 Caloote Cliffs
Photo 14 Caloote Rock Fall
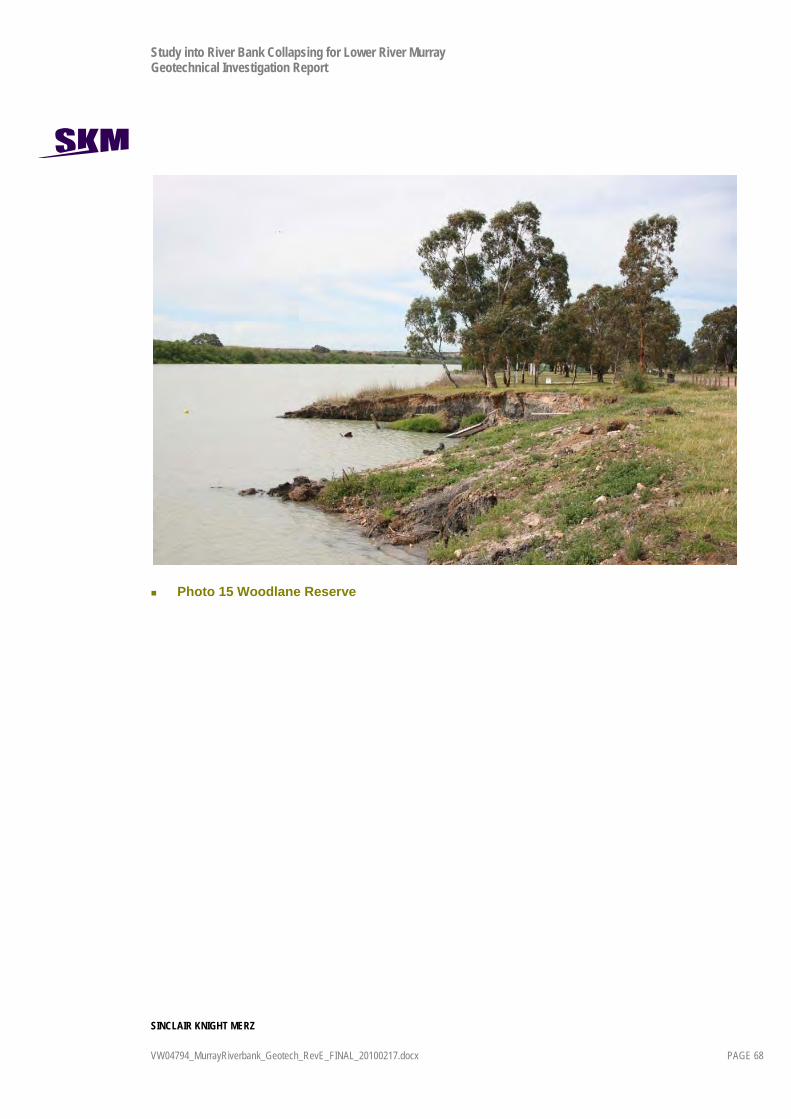
Study into River Bank Collapsing for Lower River Murray Geotechnical Investigation Report
SINCLAIR KNIGHT MERZ
VW04794_MurrayRiverbank_Geotech_RevE_FINAL_20100217.docx PAGE 68
Photo 15 Woodlane Reserve

Study into River Bank Collapsing for Lower River Murray Geotechnical Investigation Report
SINCLAIR KNIGHT MERZ
VW04794_MurrayRiverbank_Geotech_RevE_FINAL_20100217.docx PAGE 69
Photo 16 South Punyelroo

Study into River Bank Collapsing for Lower River Murray Geotechnical Investigation Report
SINCLAIR KNIGHT MERZ
VW04794_MurrayRiverbank_Geotech_RevE_FINAL_20100217.docx PAGE 70
Photo 17 East Front Road
Photo 18 East Front Road

Study into River Bank Collapsing for Lower River Murray Geotechnical Investigation Report
SINCLAIR KNIGHT MERZ
VW04794_MurrayRiverbank_Geotech_RevE_FINAL_20100217.docx PAGE 71
Photo 19 Swan Reach

Study into River Bank Collapsing for Lower River Murray Geotechnical Investigation Report
SINCLAIR KNIGHT MERZ
VW04794_MurrayRiverbank_Geotech_RevE_FINAL_20100217.docx PAGE 72
Photo 20 Walker Flat

Study into River Bank Collapsing for Lower River Murray Geotechnical Investigation Report
SINCLAIR KNIGHT MERZ
VW04794_MurrayRiverbank_Geotech_RevE_FINAL_20100217.docx PAGE 73
Figures Figure 1 Geotechnical Investigation Location Plan
Figure 2 Riverfront Road-Murray Bridge Fencing
Figure 3 Caloote Fencing
Figure 4 Woodlane Reserve Fencing
Figure 5 South Punyelroo Fencing
Figure 6 East Front Road Fencing
Figure 7 Swan Reach Fencing
Figure 8 Walker Flat Fencing
Figure 9 Riverfront Road-Murray Bridge Slope Stability – Section SR1 – Existing Conditions
Figure 10 Riverfront Road-Murray Bridge Slope Stability – Section SR1 – Lowered River
Figure 11 Riverfront Road-Murray Bridge Slope Stability – Section SR2 – Existing Conditions
Figure 12 Riverfront Road-Murray Bridge Slope Stability – Section SR2 – Lowered River
Figure 13 Caloote Slope Stability – Section CA2 – Existing Conditions
Figure 14 Caloote Slope Stability – Section CA2 – Lowered River
Figure 15 Woodlane Reserve Stability – Section WR1 – Existing Conditions
Figure 16 Woodlane Reserve Stability – Section WR1 – Lowered River
Figure 17 Woodlane Reserve Stability – Section WR2 – Existing Conditions
Figure 18 South Punyelroo Slope Stability – Section SP1 – Inferred Profile – Existing Conditions
Figure 19 South Punyelroo Slope Stability – Section SP1 – Inferred Profile – Lowered River
Figure 20 South Punyelroo Slope Stability – Section SP1 – Worst Case Profile – Existing Conditions
Figure 21 South Punyelroo Slope Stability – Section SP1 – Worst Case Profile – Lowered River
Figure 22 East Front Road Slope Stability – Section EF1 – Existing Conditions
Figure 23 East Front Road Slope Stability – Section EF1 – Lowered River
Figure 24 East Front Road Slope Stability – Section EF2 – Existing Conditions
Figure 25 East Front Road Slope Stability – Section EF2 – Lowered River
Figure 26 Swan Reach Slope Stability – Section SW2 – Existing Conditions
Figure 27 Swan Reach Slope Stability – Section SW2 – Lowered River
Figure 28 Walker Flat Slope Stability – Section WF1 – Existing Conditions
Figure 29 Walker Flat Slope Stability – Section WF1 – Lowered River

Study into River Bank Collapsing for Lower River Murray Geotechnical Investigation Report
SINCLAIR KNIGHT MERZ
VW04794_MurrayRiverbank_Geotech_RevE_FINAL_20100217.docx PAGE 74
Figure 30 Riverfront Road-Murray Bridge – Moisture Content and Atterberg Limits Profile
Figure 31 Riverfront Road-Murray Bridge – Dry Density and Bulk Density Profile
Figure 32 Riverfront Road-Murray Bridge – Liquidity Profile
Figure 33 Riverfront Road-Murray Bridge – Activity Plot
Figure 34 Riverfront Road-Murray Bridge – Sensitivity Profile
Figure 35 Riverfront Road-Murray Bridge – Undrained Shear Strength versus Depth
Figure 36 Riverfront Road-Murray Bridge – Remoulded Shear Strength versus Depth
Figure 37 Riverfront Road-Murray Bridge – Plasticity Index Profile
Figure 38 Riverfront Road-Murray Bridge – N’70 SPT Value Profile
Figure 39 Caloote – Moisture Content and Atterberg Limits Profile – Caloote
Figure 40 Caloote – Dry Density and Bulk Density Profile – Caloote
Figure 41 Caloote – Liquidity Profile – Caloote
Figure 42 Caloote – Caloote – Activity Plot
Figure 43 Caloote – Sensitivity Profile
Figure 44 Caloote – Undrained Shear Strength versus Depth
Figure 45 Caloote – Remoulded Shear Strength versus Depth
Figure 46 Caloote – Plasticity Index Profile
Figure 47 Caloote – N’70 SPT Value Profile
Figure 48 Woodlane Reserve – Moisture Content and Atterberg Limits Profile
Figure 49 Woodlane Reserve – Dry Density and Bulk Density Profile
Figure 50 Woodlane Reserve – Liquidity Profile
Figure 51 Woodlane Reserve – Plasticity Index Profile
Figure 52 Woodlane Reserve – N’70 SPT Value Profile
Figure 53 South Punyelroo – Moisture Content and Atterberg Limits Profile
Figure 54 South Punyelroo – Dry Density and Bulk Density Profile
Figure 55 South Punyelroo – Liquidity Profile
Figure 56 South Punyelroo – Plasticity Index Profile
Figure 57 East Front Road – Moisture Content and Atterberg Limits Profile
Figure 58 East Front Road – Dry Density and Bulk Density Profile
Figure 59 East Front Road – Liquidity Profile
Figure 60 East Front Road – Plasticity Index Profile
Figure 61 East Front Road – N’70 SPT Value Profile
Figure 62 River Murray at Swan Reach (A4261164) – Daily water levels (m AHD) from 11 March to 16 June 2009. Maximum air temperature for region and daily rainfall recorded at Swan Reach are also shown.

Study into River Bank Collapsing for Lower River Murray Geotechnical Investigation Report
SINCLAIR KNIGHT MERZ
VW04794_MurrayRiverbank_Geotech_RevE_FINAL_20100217.docx PAGE 75
Figure 63 River Murray at Mannum (A4261161) – Daily water levels (m AHD) from 1 March to 28 April 2009. Maximum air temperature for region and daily rainfall recorded at Mannum are also shown.
Figure 64 River Murray at Murray Bridge (A4261162) – Daily water levels (m AHD) from 7 January to 30 March 2009. Maximum air temperature for region and daily rainfall recorded at Murray Bridge are also shown.
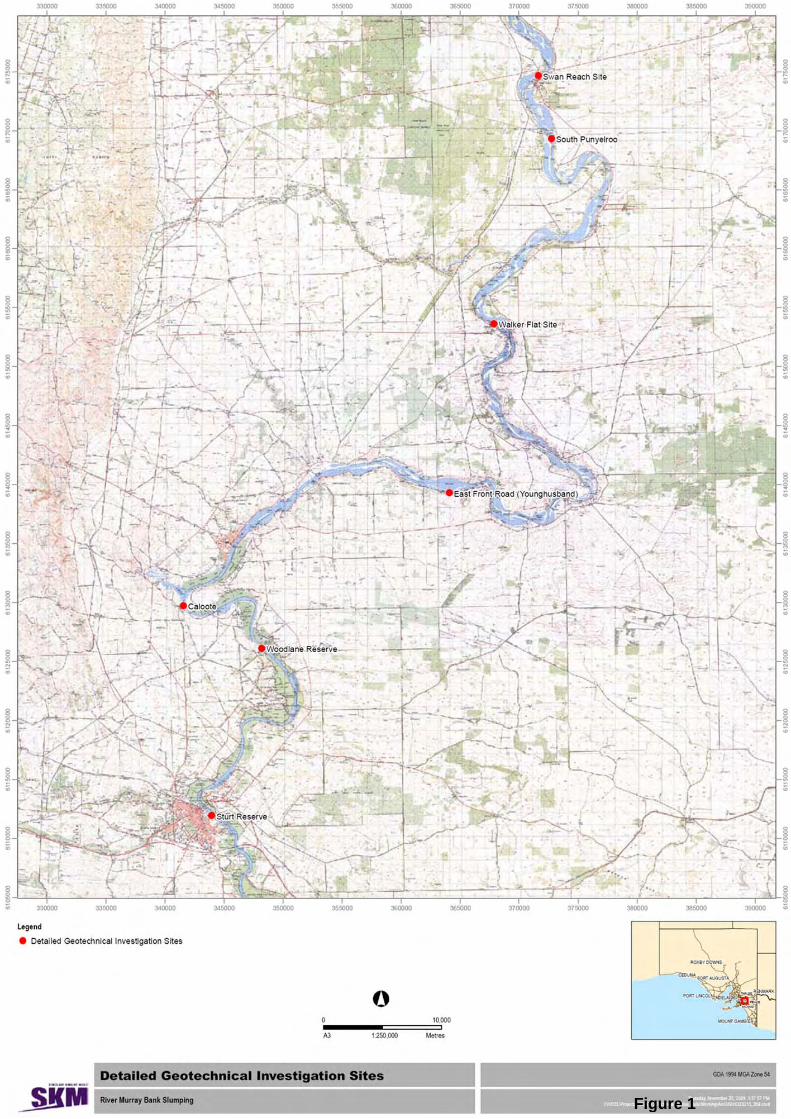
Figure 1

Figure 2

Figure 3

Figure 4

Figure 5

Figure 6
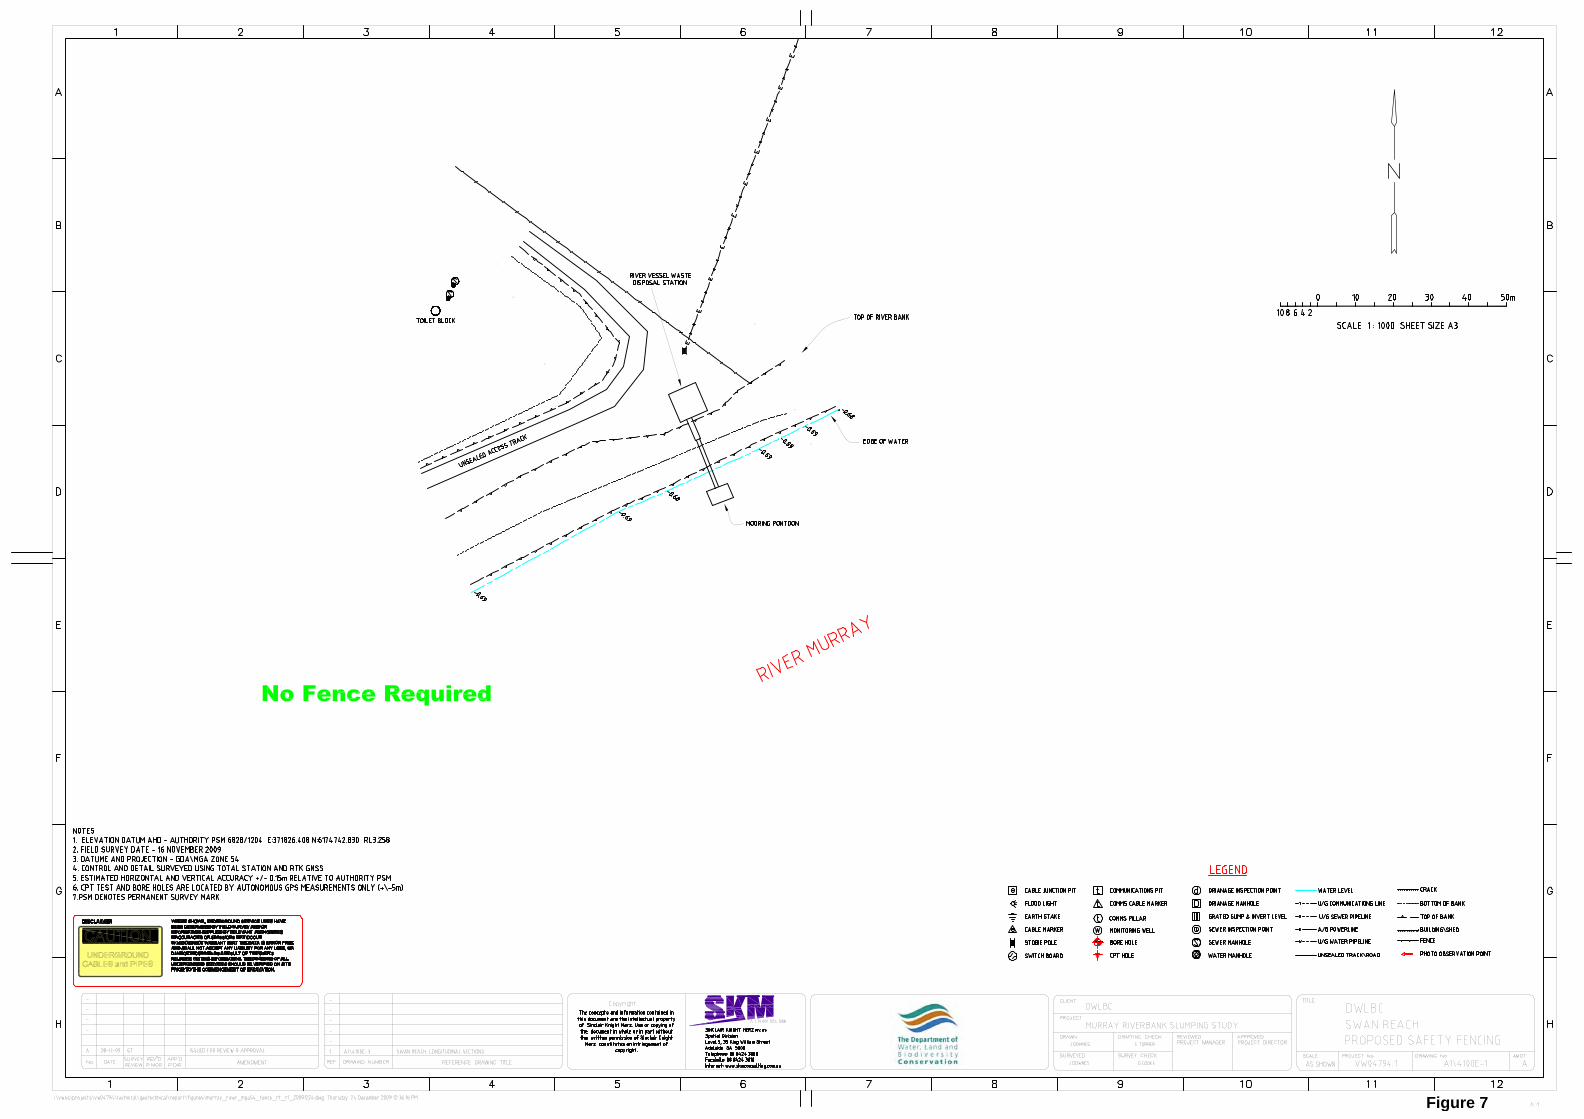
Figure 7

Figure 8

1.27
Assessment of the Existing ConditionsRiver Water Level at -0.80m AHDSurcharge of the Properties and Cars
FILL
Study into Riverbank Collapsing for Lower Murray RiverSturt Reserve - Section SR1
Very Soft Clay
Clayey Sand / Sandy Clay
Name: FILL Model: Mohr-Coulomb Unit Weight: Multiple Trial: 18 kN/m³Cohesion: Multiple Trial: 2 kPaPhi: Multiple Trial: 28 °
Name: Very Soft Clay Model: S=f(depth) Unit Weight: Multiple Trial: 16 kN/m³C-Top of Layer: Multiple Trial: 10 kPaC-Rate of Change: 1.25 kPa/mLimiting C: Multiple Trial: 25 kPa
Name: Clayey Sand Model: Mohr-Coulomb Unit Weight: Multiple Trial: 17 kN/m³Cohesion: Multiple Trial: 2 kPaPhi: Multiple Trial: 30 °
Lagoon Surcharge: 2.5 kPa
Distance (m)0 20 40 60 80 100 120 140 160 180 200
Ele
vatio
n (m
AH
D)
-50
-40
-30
-20
-10
0
10
20
30
Figure 9

1.18
Assessment of the Future ConditionsRiver Water Level at -1.50m AHDSurcharge of the Properties and Cars
FILL
Study into Riverbank Collapsing for Lower Murray RiverSturt Reserve - Section SR1
Very Soft Clay
Clayey Sand / Sandy Clay
Name: FILL Model: Mohr-Coulomb Unit Weight: Multiple Trial: 18 kN/m³Cohesion: Multiple Trial: 2 kPaPhi: Multiple Trial: 28 °
Name: Very Soft Clay Model: S=f(depth) Unit Weight: Multiple Trial: 16 kN/m³C-Top of Layer: Multiple Trial: 10 kPaC-Rate of Change: 1.25 kPa/mLimiting C: Multiple Trial: 25 kPa
Name: Clayey Sand Model: Mohr-Coulomb Unit Weight: Multiple Trial: 17 kN/m³Cohesion: Multiple Trial: 2 kPaPhi: Multiple Trial: 30 °
Lagoon Surcharge: 2.5 kPa
Distance (m)0 20 40 60 80 100 120 140 160 180 200
Ele
vatio
n (m
AH
D)
-50
-40
-30
-20
-10
0
10
20
30
Figure 10

1.13
Assessment of the Existing ConditionRiver Water Level at -0.80m AHD
FILL
Study into Riverbank Collapsing for Lower Murray RiverSturt Reserve - Section SR2
Very Soft Clay
Clayey Sand / Sandy Clay
Name: FILL Model: Mohr-Coulomb Unit Weight: Multiple Trial: 18 kN/m³Cohesion: Multiple Trial: 2 kPaPhi: Multiple Trial: 28 °
Name: Very Soft Clay Model: S=f(depth) Unit Weight: Multiple Trial: 16 kN/m³C-Top of Layer: Multiple Trial: 10 kPaC-Rate of Change: 1.25 kPa/mLimiting C: Multiple Trial: 25 kPa
Name: Clayey Sand Model: Mohr-Coulomb Unit Weight: Multiple Trial: 17 kN/m³Cohesion: Multiple Trial: 2 kPaPhi: Multiple Trial: 30 °
Distance (m)0 10 20 30 40 50 60 70 80 90 100 110 120 130 140 150
Ele
vatio
n (m
AH
D)
-50
-40
-30
-20
-10
0
10
20
30
Figure 11

1.05
Assessment of the Future ConditionsRiver Water Level at -1.50m AHD
FILL
Study into Riverbank Collapsing for Lower Murray RiverSturt Reserve - Section SR2
Very Soft Clay
Clayey Sand / Sandy Clay
Name: FILL Model: Mohr-Coulomb Unit Weight: Multiple Trial: 18 kN/m³Cohesion: Multiple Trial: 2 kPaPhi: Multiple Trial: 28 °
Name: Very Soft Clay Model: S=f(depth) Unit Weight: Multiple Trial: 16 kN/m³C-Top of Layer: Multiple Trial: 10 kPaC-Rate of Change: 1.25 kPa/mLimiting C: Multiple Trial: 25 kPa
Name: Clayey Sand Model: Mohr-Coulomb Unit Weight: Multiple Trial: 17 kN/m³Cohesion: Multiple Trial: 2 kPaPhi: Multiple Trial: 30 °
Distance (m)0 10 20 30 40 50 60 70 80 90 100 110 120 130 140 150
Ele
vatio
n (m
AH
D)
-50
-40
-30
-20
-10
0
10
20
30
Figure 12

1.14
Assessment of the Existing ConditionsRiver Water Level at -0.80m AHDSurcharge of the Properties and Cars
FILL
Study into Riverbank Collapsing for Lower Murray RiverCaloote - Section CA2
Very Soft Clay
Clayey Sand / Sandy Clay
Name: FILL Model: Mohr-Coulomb Unit Weight: Multiple Trial: 18 kN/m³Cohesion: Multiple Trial: 2 kPaPhi: Multiple Trial: 28 °
Name: Very Soft Clay Model: S=f(depth) Unit Weight: Multiple Trial: 16 kN/m³C-Top of Layer: Multiple Trial: 10 kPaC-Rate of Change: 1.07 kPa/mLimiting C: Multiple Trial: 17.5 kPa
Name: Clayey Sand Model: Mohr-Coulomb Unit Weight: Multiple Trial: 19 kN/m³Cohesion: Multiple Trial: 2 kPaPhi: Multiple Trial: 30 °
Surcharge: 2.5 kPa
Distance (m)0 10 20 30 40 50 60 70 80 90 100 110 120 130 140 150
Ele
vatio
n (m
AH
D)
-50
-40
-30
-20
-10
0
10
20
30
Figure 13

1.06
Assessment of the Existing ConditionsRiver Water Level at -1.50m AHDSurcharge of the Properties and Cars
FILL
Study into Riverbank Collapsing for Lower Murray RiverCaloote - Section CA2
Very Soft Clay
Clayey Sand / Sandy Clay
Name: FILL Model: Mohr-Coulomb Unit Weight: Multiple Trial: 18 kN/m³Cohesion: Multiple Trial: 2 kPaPhi: Multiple Trial: 28 °
Name: Very Soft Clay Model: S=f(depth) Unit Weight: Multiple Trial: 16 kN/m³C-Top of Layer: Multiple Trial: 10 kPaC-Rate of Change: 1.07 kPa/mLimiting C: Multiple Trial: 17.5 kPa
Name: Clayey Sand Model: Mohr-Coulomb Unit Weight: Multiple Trial: 19 kN/m³Cohesion: Multiple Trial: 2 kPaPhi: Multiple Trial: 30 °
Surcharge: 2.5 kPa
Distance (m)0 10 20 30 40 50 60 70 80 90 100 110 120 130 140 150
Ele
vatio
n (m
AH
D)
-50
-40
-30
-20
-10
0
10
20
30
Figure 14

1.38
Assessment of the Existing ConditionsRiver Water Level at -0.80m AHDSurcharge of the Properties and Cars
Study into Riverbank Collapsing for Lower Murray RiverWoodlane Reserve - Section WR1 Name: FILL
Model: Mohr-Coulomb Unit Weight: 17 kN/m³Cohesion: 0 kPaPhi: Multiple Trial: 30 °
Name: Very Soft Clay (CH) Model: Undrained (Phi=0) Unit Weight: 17 kN/m³Cohesion: Multiple Trial: 20 kPa
Name: Sand / Clay (loose) Model: Mohr-Coulomb Unit Weight: 20 kN/m³Cohesion: 0 kPaPhi: Multiple Trial: 29 °
Name: Sand / Silt Model: Mohr-Coulomb Unit Weight: 20 kN/m³Cohesion: 0 kPaPhi: Multiple Trial: 30 °
Name: Type 3C Model: Mohr-Coulomb Unit Weight: 20 kN/m³Cohesion: 0 kPaPhi: Multiple Trial: 31 °
Surcharge: 2.5 kPa
Distance (m)0 10 20 30 40 50 60 70 80 90 100 110 120 130 140 150
Ele
vatio
n (m
AH
D)
-50
-40
-30
-20
-10
0
10
20
30
Figure 15

1.20
Assessment of the Existing ConditionsRiver Water Level at -1.50m AHDSurcharge of the Properties and Cars
Study into Riverbank Collapsing for Lower Murray RiverWoodlane Reserve - Section WR1 Name: FILL
Model: Mohr-Coulomb Unit Weight: 17 kN/m³Cohesion: 0 kPaPhi: Multiple Trial: 30 °
Name: Very Soft Clay (CH) Model: Undrained (Phi=0) Unit Weight: 17 kN/m³Cohesion: Multiple Trial: 20 kPa
Name: Sand / Clay (loose) Model: Mohr-Coulomb Unit Weight: 20 kN/m³Cohesion: 0 kPaPhi: Multiple Trial: 29 °
Name: Sand / Silt Model: Mohr-Coulomb Unit Weight: 20 kN/m³Cohesion: 0 kPaPhi: Multiple Trial: 30 °
Name: Type 3C Model: Mohr-Coulomb Unit Weight: 20 kN/m³Cohesion: 0 kPaPhi: Multiple Trial: 31 °
Surcharge: 2.5 kPa
Distance (m)0 10 20 30 40 50 60 70 80 90 100 110 120 130 140 150
Ele
vatio
n (m
AH
D)
-50
-40
-30
-20
-10
0
10
20
30
Figure 16

1.38
Assessment of the Existing ConditionsRiver Water Level at -0.80m AHDSurcharge of the Properties and Cars
Study into Riverbank Collapsing for Lower Murray RiverWoodlane Reserve - Section WR2
Name: FILL Model: Mohr-Coulomb Unit Weight: 17 kN/m³Cohesion: 0 kPaPhi: Multiple Trial: 30 °
Name: Type B1 Clay Model: Undrained (Phi=0) Unit Weight: Multiple Trial: 17 kN/m³Cohesion: Multiple Trial: 50 kPa
Name: Type B2 Clay Model: Undrained (Phi=0) Unit Weight: Multiple Trial: 17 kN/m³Cohesion: Multiple Trial: 25 kPa
Name: Type C1 Silty Sand Model: Mohr-Coulomb Unit Weight: Multiple Trial: 17 kN/m³Cohesion: 0 kPaPhi: Multiple Trial: 30 °
Name: Type B3 Clay Model: Undrained (Phi=0) Unit Weight: Multiple Trial: 17 kN/m³Cohesion: Multiple Trial: 50 kPa
Name: Type B4 Clay Model: S=f(depth) Unit Weight: Multiple Trial: 17 kN/m³C-Top of Layer: Multiple Trial: 28 kPaC-Rate of Change: Multiple Trial: 7.2 kPa/mLimiting C: Multiple Trial: 46 kPa
Name: Type C2 Silty Sand Model: Mohr-Coulomb Unit Weight: Multiple Trial: 20 kN/m³Cohesion: 1 kPaPhi: Multiple Trial: 31 °
Surcharge: 2.5 kPa
Distance (m)0 10 20 30 40 50 60 70 80 90 100 110 120 130
Ele
vatio
n (m
AH
D)
-50
-40
-30
-20
-10
0
10
20
30
Figure 17

3.95
Assessment of the Existing ConditionsRiver Water Level at -0.80m AHDSurcharge of the Properties and CarsInferred Sub-surface Profile
Study into Riverbank Collapsing for Lower Murray RiverSouth Punyelroo - Section SP1
Name: FILL Model: Mohr-Coulomb Unit Weight: Multiple Trial: 20 kN/m³Cohesion: 0 kPaPhi: Multiple Trial: 30 °
Name: Type B1 Model: Undrained (Phi=0) Unit Weight: Multiple Trial: 20 kN/m³Cohesion: Multiple Trial: 100 kPa
Name: Type B2 Model: Undrained (Phi=0) Unit Weight: Multiple Trial: 17 kN/m³Cohesion: Multiple Trial: 25 kPa
Name: Type C Model: Mohr-Coulomb Unit Weight: Multiple Trial: 20 kN/m³Cohesion: 0 kPaPhi: Multiple Trial: 30 °
Surcharge: 2.5 kPa
Distance (m)0 10 20 30 40 50 60 70 80 90 100 110 120 130 140 150 160 170 180 190 200
Ele
vatio
n (m
AH
D)
-50
-40
-30
-20
-10
0
10
20
30
Figure 18

3.73
Assessment of the Existing ConditionsRiver Water Level at -1.50m AHDSurcharge of the Properties and CarsInferred Sub-surface Profile
Study into Riverbank Collapsing for Lower Murray RiverSouth Punyelroo - Section SP1
Name: FILL Model: Mohr-Coulomb Unit Weight: Multiple Trial: 20 kN/m³Cohesion: 0 kPaPhi: Multiple Trial: 30 °
Name: Type B1 Model: Undrained (Phi=0) Unit Weight: Multiple Trial: 20 kN/m³Cohesion: Multiple Trial: 100 kPa
Name: Type B2 Model: Undrained (Phi=0) Unit Weight: Multiple Trial: 17 kN/m³Cohesion: Multiple Trial: 25 kPa
Name: Type C Model: Mohr-Coulomb Unit Weight: Multiple Trial: 20 kN/m³Cohesion: 0 kPaPhi: Multiple Trial: 30 °
Surcharge: 2.5 kPa
Distance (m)0 10 20 30 40 50 60 70 80 90 100 110 120 130 140 150 160 170 180 190 200
Ele
vatio
n (m
AH
D)
-50
-40
-30
-20
-10
0
10
20
30
Figure 19

1.67
Assessment of the Existing ConditionsRiver Water Level at -0.80m AHDSurcharge of the Properties and CarsWorst Case Sub-surface Profile
Study into Riverbank Collapsing for Lower Murray RiverSouth Punyelroo - Section SP1
Name: FILL Model: Mohr-Coulomb Unit Weight: Multiple Trial: 20 kN/m³Cohesion: 0 kPaPhi: Multiple Trial: 30 °
Name: Type B1 Model: Undrained (Phi=0) Unit Weight: Multiple Trial: 20 kN/m³Cohesion: Multiple Trial: 100 kPa
Name: Type B2 Model: Undrained (Phi=0) Unit Weight: Multiple Trial: 17 kN/m³Cohesion: Multiple Trial: 25 kPa
Name: Type C Model: Mohr-Coulomb Unit Weight: Multiple Trial: 20 kN/m³Cohesion: 0 kPaPhi: Multiple Trial: 30 °
Surcharge: 2.5 kPa
Distance (m)0 10 20 30 40 50 60 70 80 90 100 110 120 130 140 150 160 170 180 190 200
Ele
vatio
n (m
AH
D)
-50
-40
-30
-20
-10
0
10
20
30
Figure 20
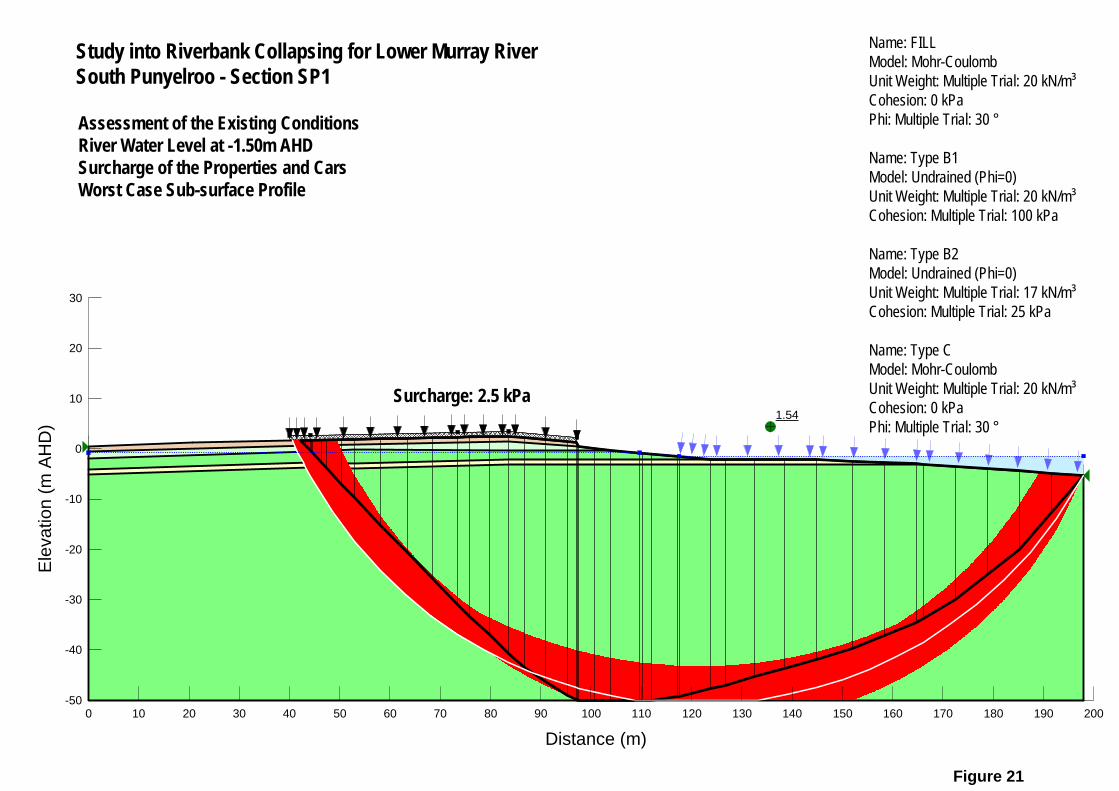
1.54
Assessment of the Existing ConditionsRiver Water Level at -1.50m AHDSurcharge of the Properties and CarsWorst Case Sub-surface Profile
Study into Riverbank Collapsing for Lower Murray RiverSouth Punyelroo - Section SP1
Name: FILL Model: Mohr-Coulomb Unit Weight: Multiple Trial: 20 kN/m³Cohesion: 0 kPaPhi: Multiple Trial: 30 °
Name: Type B1 Model: Undrained (Phi=0) Unit Weight: Multiple Trial: 20 kN/m³Cohesion: Multiple Trial: 100 kPa
Name: Type B2 Model: Undrained (Phi=0) Unit Weight: Multiple Trial: 17 kN/m³Cohesion: Multiple Trial: 25 kPa
Name: Type C Model: Mohr-Coulomb Unit Weight: Multiple Trial: 20 kN/m³Cohesion: 0 kPaPhi: Multiple Trial: 30 °
Surcharge: 2.5 kPa
Distance (m)0 10 20 30 40 50 60 70 80 90 100 110 120 130 140 150 160 170 180 190 200
Ele
vatio
n (m
AH
D)
-50
-40
-30
-20
-10
0
10
20
30
Figure 21

1.30
Assessment of the Existing ConditionsRiver Water Level at -0.80m AHDSurcharge of the Properties and Cars
Name: FILL A1 Model: Mohr-Coulomb Unit Weight: Multiple Trial: 20 kN/m³Cohesion: 0 kPaPhi: Multiple Trial: 32 °
Name: FILL A2 Model: Mohr-Coulomb Unit Weight: Multiple Trial: 21 kN/m³Cohesion: 0 kPaPhi: Multiple Trial: 35 °
Name: Type B Model: Undrained (Phi=0) Unit Weight: Multiple Trial: 17 kN/m³Cohesion: Multiple Trial: 50 kPa
Name: Rock Model: Bedrock (Impenetrable)
Study into Riverbank Collapsing for Lower Murray RiverEast Front Road - Section EF1
Surcharge: 2.5 kPa
Distance (m)0 10 20 30 40 50 60 70 80 90
Ele
vatio
n (m
AH
D)
-20
-15
-10
-5
0
5
10
15
20
Figure 22

1.23
Assessment of the Existing ConditionsRiver Water Level at -1.50m AHDSurcharge of the Properties and Cars
Name: FILL A1 Model: Mohr-Coulomb Unit Weight: Multiple Trial: 20 kN/m³Cohesion: 0 kPaPhi: Multiple Trial: 32 °
Name: FILL A2 Model: Mohr-Coulomb Unit Weight: Multiple Trial: 21 kN/m³Cohesion: 0 kPaPhi: Multiple Trial: 35 °
Name: Type B Model: Undrained (Phi=0) Unit Weight: Multiple Trial: 17 kN/m³Cohesion: Multiple Trial: 50 kPa
Name: Rock Model: Bedrock (Impenetrable)
Study into Riverbank Collapsing for Lower Murray RiverEast Front Road - Section EF1
Surcharge: 2.5 kPa
Distance (m)0 10 20 30 40 50 60 70 80 90
Ele
vatio
n (m
AH
D)
-20
-15
-10
-5
0
5
10
15
20
Figure 23
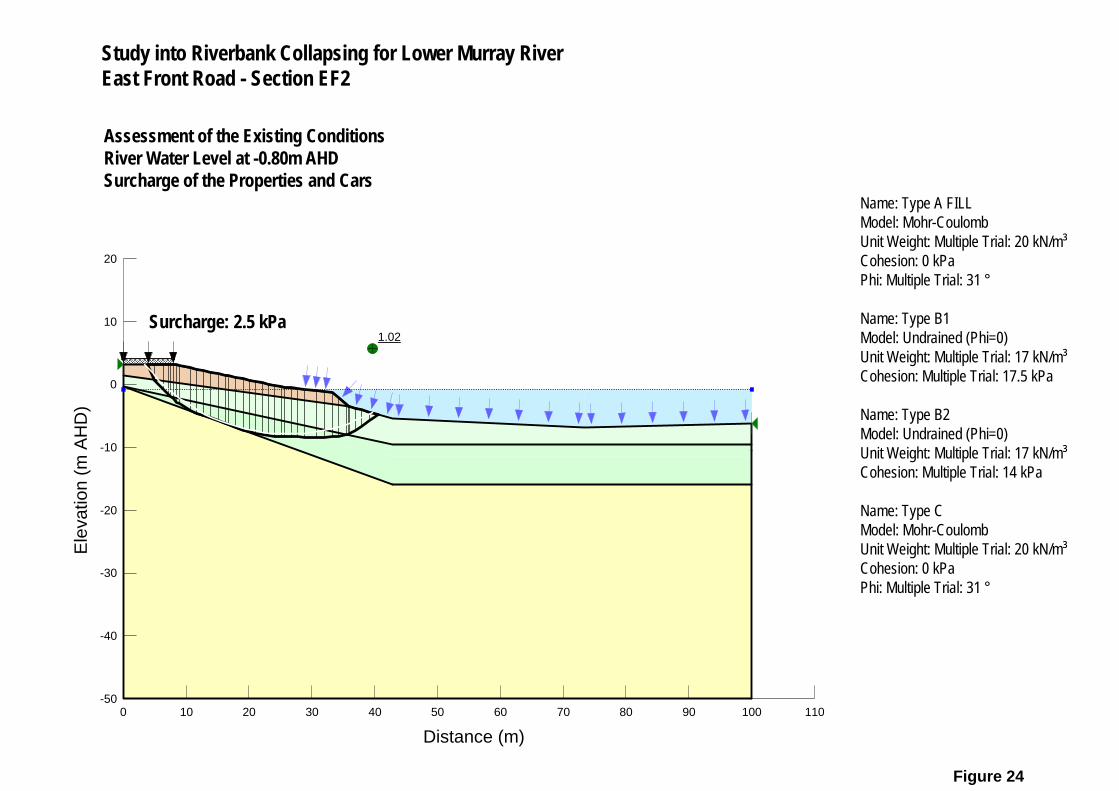
1.02
Assessment of the Existing ConditionsRiver Water Level at -0.80m AHDSurcharge of the Properties and Cars
Name: Type A FILL Model: Mohr-Coulomb Unit Weight: Multiple Trial: 20 kN/m³Cohesion: 0 kPaPhi: Multiple Trial: 31 °
Name: Type B1 Model: Undrained (Phi=0) Unit Weight: Multiple Trial: 17 kN/m³Cohesion: Multiple Trial: 17.5 kPa
Name: Type B2 Model: Undrained (Phi=0) Unit Weight: Multiple Trial: 17 kN/m³Cohesion: Multiple Trial: 14 kPa
Name: Type C Model: Mohr-Coulomb Unit Weight: Multiple Trial: 20 kN/m³Cohesion: 0 kPaPhi: Multiple Trial: 31 °
Study into Riverbank Collapsing for Lower Murray RiverEast Front Road - Section EF2
Surcharge: 2.5 kPa
Distance (m)0 10 20 30 40 50 60 70 80 90 100 110
Ele
vatio
n (m
AH
D)
-50
-40
-30
-20
-10
0
10
20
Figure 24

0.95
Assessment of the Existing ConditionsRiver Water Level at -1.50m AHDSurcharge of the Properties and Cars
Name: Type A FILL Model: Mohr-Coulomb Unit Weight: Multiple Trial: 20 kN/m³Cohesion: 0 kPaPhi: Multiple Trial: 31 °
Name: Type B1 Model: Undrained (Phi=0) Unit Weight: Multiple Trial: 17 kN/m³Cohesion: Multiple Trial: 17.5 kPa
Name: Type B2 Model: Undrained (Phi=0) Unit Weight: Multiple Trial: 17 kN/m³Cohesion: Multiple Trial: 14 kPa
Name: Type C Model: Mohr-Coulomb Unit Weight: Multiple Trial: 20 kN/m³Cohesion: 0 kPaPhi: Multiple Trial: 31 °
Study into Riverbank Collapsing for Lower Murray RiverEast Front Road - Section EF2
Surcharge: 2.5 kPa
Distance (m)0 10 20 30 40 50 60 70 80 90 100 110
Ele
vatio
n (m
AH
D)
-50
-40
-30
-20
-10
0
10
20
Figure 25

1.68
Assessment of the Existing ConditionsRiver Water Level at -0.70m AHDSurcharge of the Structures and CarsWith 4m Deep Tension Crack
Surcharge: 2.5 kPa
Study into Riverbank Collapsing for Lower Murray RiverSwan Reach - Section SW1
Name: Type A: FILL Model: Mohr-Coulomb Unit Weight: Multiple Trial: 20 kN/m³Cohesion: 0 kPaPhi: Multiple Trial: 30 °
Name: Type B1 Model: Undrained (Phi=0) Unit Weight: Multiple Trial: 20 kN/m³Cohesion: 250 kPa
Name: Type B2 Model: Undrained (Phi=0) Unit Weight: Multiple Trial: 20 kN/m³Cohesion: Multiple Trial: 50 kPa
Name: Type B3 Model: Undrained (Phi=0) Unit Weight: Multiple Trial: 18 kN/m³Cohesion: Multiple Trial: 18 kPa
Name: Type B4 Model: Undrained (Phi=0) Unit Weight: Multiple Trial: 18 kN/m³Cohesion: Multiple Trial: 12.5 kPa
Name: Type C Model: Mohr-Coulomb Unit Weight: Multiple Trial: 20 kN/m³Cohesion: 0 kPaPhi: Multiple Trial: 31 °
Distance (m)0 10 20 30 40 50 60 70 80 90 100 110 120
Ele
vatio
n (m
AH
D)
-50
-40
-30
-20
-10
0
10
20
30
Figure 26

1.70
Assessment of the Existing ConditionsRiver Water Level at -1.50m AHDSurcharge of the Structures and CarsWith 4m Deep Tension Crack
Surcharge: 2.5 kPa
Study into Riverbank Collapsing for Lower Murray RiverSwan Reach - Section SW1
Name: Type A: FILL Model: Mohr-Coulomb Unit Weight: Multiple Trial: 20 kN/m³Cohesion: 0 kPaPhi: Multiple Trial: 30 °
Name: Type B1 Model: Undrained (Phi=0) Unit Weight: Multiple Trial: 20 kN/m³Cohesion: 250 kPa
Name: Type B2 Model: Undrained (Phi=0) Unit Weight: Multiple Trial: 20 kN/m³Cohesion: Multiple Trial: 50 kPa
Name: Type B3 Model: Undrained (Phi=0) Unit Weight: Multiple Trial: 18 kN/m³Cohesion: Multiple Trial: 18 kPa
Name: Type B4 Model: Undrained (Phi=0) Unit Weight: Multiple Trial: 18 kN/m³Cohesion: Multiple Trial: 12.5 kPa
Name: Type C Model: Mohr-Coulomb Unit Weight: Multiple Trial: 20 kN/m³Cohesion: 0 kPaPhi: Multiple Trial: 31 °
Distance (m)0 10 20 30 40 50 60 70 80 90 100 110 120
Ele
vatio
n (m
AH
D)
-50
-40
-30
-20
-10
0
10
20
30
Figure 27

1.02
Assessment of the Existing ConditionsRiver Water Level at -0.70m AHDSurcharge of the Structures and Cars
Surcharge: 2.5 kPa
Study into Riverbank Collapsing for Lower Murray RiverWalker Flat - Section WF1 Name: Type A: FILL
Model: Mohr-Coulomb Unit Weight: Multiple Trial: 19 kN/m³Cohesion: 0 kPaPhi: Multiple Trial: 30 °
Name: Type B1 Model: Undrained (Phi=0) Unit Weight: Multiple Trial: 19 kN/m³Cohesion: Multiple Trial: 70 kPa
Name: Type B2 Model: Undrained (Phi=0) Unit Weight: Multiple Trial: 19 kN/m³Cohesion: Multiple Trial: 50 kPa
Name: Type B3 Model: Undrained (Phi=0) Unit Weight: Multiple Trial: 17 kN/m³Cohesion: Multiple Trial: 15 kPa
Name: Type B4 Model: Undrained (Phi=0) Unit Weight: Multiple Trial: 17 kN/m³Cohesion: Multiple Trial: 15 kPa
Name: Type B5 / C Model: Mohr-Coulomb Unit Weight: Multiple Trial: 20 kN/m³Cohesion: 0 kPaPhi: Multiple Trial: 31 °
Distance (m)0 10 20 30 40 50 60 70 80 90 100 110 120 130 140
Ele
vatio
n (m
AH
D)
-50
-40
-30
-20
-10
0
10
20
30

0.94
Assessment of the Existing ConditionsRiver Water Level at -1.50m AHDSurcharge of the Structures and Cars
Surcharge: 2.5 kPa
Study into Riverbank Collapsing for Lower Murray RiverWalker Flat - Section WF1
Name: Type A: FILL Model: Mohr-Coulomb Unit Weight: Multiple Trial: 19 kN/m³Cohesion: 0 kPaPhi: Multiple Trial: 30 °
Name: Type B1 Model: Undrained (Phi=0) Unit Weight: Multiple Trial: 19 kN/m³Cohesion: Multiple Trial: 70 kPa
Name: Type B2 Model: Undrained (Phi=0) Unit Weight: Multiple Trial: 19 kN/m³Cohesion: Multiple Trial: 50 kPa
Name: Type B3 Model: Undrained (Phi=0) Unit Weight: Multiple Trial: 17 kN/m³Cohesion: Multiple Trial: 15 kPa
Name: Type B4 Model: Undrained (Phi=0) Unit Weight: Multiple Trial: 17 kN/m³Cohesion: Multiple Trial: 15 kPa
Name: Type B5 / C Model: Mohr-Coulomb Unit Weight: Multiple Trial: 20 kN/m³Cohesion: 0 kPaPhi: Multiple Trial: 31 °
Distance (m)0 10 20 30 40 50 60 70 80 90 100 110 120 130 140
Ele
vatio
n (m
AH
D)
-50
-40
-30
-20
-10
0
10
20
30

JOB No: VW04794
Drawn:
Approved:
Date:
Revision:
MT
NR
08/12/09
A
STURT RESERVEMurray Riverbank Geotechnical Investigation
Moisture Content and Atterberg Limits Profile
0 20 40 60 80 100 120Moisture Content (%)
20
18
16
14
12
10
8
6
4
2
0D
epth
Bel
ow G
roun
d Su
rface
(m)
Moisture ContentGType-A>Type-B"Type-C
Plastic Limit-Type-A(Type-B+Type-C
Liquid Limit-Type-A’Type-B+Type-C
Figure 30

JOB No: VW04794
Drawn:
Approved:
Date:
Revision:
MT
NR
08/12/09
A
STURT RESERVEMurray Riverbank Geotechnical Investigation
Dry Density & Bulk Density Profile
0 0.4 0.8 1.2 1.6 2 2.4 2.8Dry Density & Bulk Density (t/m3)
20
18
16
14
12
10
8
6
4
2
0D
epth
Bel
ow G
roun
d Su
rface
(m)
Key to Symbols-Type-A’Type-B+Type-C
Key to Symbol Colours„Dry Density„Bulk Density
Note: Measured values shown in bold type
Figure 31

JOB No: VW04794
Drawn:
Approved:
Date:
Revision:
MT
NR
08/12/09
A
STURT RESERVEMurray Riverbank Geotechnical Investigation
Liquidity Profile
-0.4 0 0.4 0.8 1.2 1.6 2Liquidity Index (-)
20
18
16
14
12
10
8
6
4
2
0D
epth
Bel
ow G
roun
d Su
rface
(m)
Type-AType-BType-C
Figure 32

JOB No: VW04794
Drawn:
Approved:
Date:
Revision:
MT
NR
08/12/09
A
STURT RESERVEMurray Riverbank Geotechnical Investigation
Activity Plot
0 20 40 60 80 100Clay fraction (<0.002mm) %
0
20
40
60
80
100
Pla
stic
ity In
dex
(%)
Type-B
Sodium montmorillonite (A=7.2)
Illite (A=0.9)
Kaolinite (A=0.38)
(18m) (8m)
(13m)
(7m)
Figure 33

JOB No: VW04794
Drawn:
Approved:
Date:
Revision:
MT
NR
08/12/09
A
STURT RESERVEMurray Riverbank Geotechnical Investigation
Sensitivity Profile
0 2 4 6 8 10 12 14Measured Sensitivity (-)
20
18
16
14
12
10
8
6
4
2
0D
epth
Bel
ow G
roun
d Su
rface
(m)
Su/Sur Vane(Type-B
Su/Sur TRX UU’Type-B
Figure 34

JOB No: VW04794
Drawn:
Approved:
Date:
Revision:
MT
NR
08/12/09
A
STURT RESERVEMurray Riverbank Geotechnical Investigation
Undrained Shear Strength vs Depth
0 10 20 30 40 50Undrained Shear Strength (kPa)
20
18
16
14
12
10
8
6
4
2
0D
epth
Bel
ow G
roun
d Su
rface
(m)
Su Vane(Type-B+Type-C
Su Dilatometer’Type-B
Su TRX UU ’Type-B+Type-C
Su SR-CPT6s---------------- Nkt=15---------------- Nkt=20
Figure 35

JOB No: VW04794
Drawn:
Approved:
Date:
Revision:
MT
NR
08/12/09
A
STURT RESERVEMurray Riverbank Geotechnical Investigation
Remoulded Shear Strength vs Depth
0 10 20 30 40 50Remoulded Shear Strength (kPa)
20
18
16
14
12
10
8
6
4
2
0D
epth
Bel
ow G
roun
d Su
rface
(m)
Sur Vane’Type-B
Sur TRX UU’Type-B
Sur Inferred Data-Type-A’Type-B+Type-C
Figure 36

JOB No: VW04794
Drawn:
Approved:
Date:
Revision:
MT
NR
08/12/09
A
STURT RESERVEMurray Riverbank Geotechnical Investigation
Plasticity Index Profile
0 20 40 60 80 100 120Plasticity Index (%)
20
18
16
14
12
10
8
6
4
2
0D
epth
Bel
ow G
roun
d Su
rface
(m)
-Type-A’Type-B+Type-C
Figure 37

JOB No: VW04794
Drawn:
Approved:
Date:
Revision:
MT
NR
08/12/09
A
STURT RESERVEMurray Riverbank Geotechnical Investigation
N'70 Value (SPT) Profile
0 10 20 30 40 50N'70 Value (SPT)
20
18
16
14
12
10
8
6
4
2
0D
epth
Bel
ow G
roun
d Su
rface
(m)
-Type-A’Type-B+Type-C
Figure 38

JOB No: VW04794
Drawn:
Approved:
Date:
Revision:
MT
NR
08/12/09
A
CALOOTEMurray Riverbank Geotechnical Investigation
Moisture Content and Atterberg Limits Profile
0 20 40 60 80 100 120Moisture Content (%)
20
18
16
14
12
10
8
6
4
2
0D
epth
Bel
ow G
roun
d Su
rface
(m)
Moisture ContentGType-A>Type-B"Type-C
Plastic Limit-Type-A(Type-B+Type-C
Liquid Limit-Type-A’Type-B+Type-C
Figure 39

JOB No: VW04794
Drawn:
Approved:
Date:
Revision:
MT
NR
08/12/09
A
CALOOTEMurray Riverbank Geotechnical Investigation
Dry Density & Bulk Density Profile
0 0.4 0.8 1.2 1.6 2 2.4 2.8Dry Density & Bulk Density (t/m3)
20
18
16
14
12
10
8
6
4
2
0D
epth
Bel
ow G
roun
d Su
rface
(m)
Key to Symbols-Type-A’Type-B+Type-C
Key to Symbol Colours„Dry Density„Bulk Density
Note: Measured values shown in bold type
Figure 40

JOB No: VW04794
Drawn:
Approved:
Date:
Revision:
MT
NR
08/12/09
A
CALOOTEMurray Riverbank Geotechnical Investigation
Liquidity Profile
-0.4 0 0.4 0.8 1.2 1.6 2Liquidity Index (-)
20
18
16
14
12
10
8
6
4
2
0D
epth
Bel
ow G
roun
d Su
rface
(m)
Type-AType-BType-C
Figure 41

JOB No: VW04794
Drawn:
Approved:
Date:
Revision:
MT
NR
08/12/09
A
CALOOTEMurray Riverbank Geotechnical Investigation
Activity Plot
0 20 40 60 80 100Clay fraction (<0.002mm) %
0
20
40
60
80
100
Pla
stic
ity In
dex
(%)
Type-BType-C
Sodium montmorillonite (A=7.2)
Illite (A=0.9)
Kaolinite (A=0.38)
(4m)
(10m) (5m)
(6m)
(11m)
Figure 42

JOB No: VW04794
Drawn:
Approved:
Date:
Revision:
MT
NR
08/12/09
A
CALOOTEMurray Riverbank Geotechnical Investigation
Sensitivity Profile
0 2 4 6 8 10 12 14Measured Sensitivity (-)
20
18
16
14
12
10
8
6
4
2
0D
epth
Bel
ow G
roun
d Su
rface
(m)
Su/Sur Vane(Type-B+Type-C
Figure 43

JOB No: VW04794
Drawn:
Approved:
Date:
Revision:
MT
NR
08/12/09
A
CALOOTEMurray Riverbank Geotechnical Investigation
Undrained Shear Strength vs Depth
0 10 20 30 40 50Undrained Shear Strength (kPa)
20
18
16
14
12
10
8
6
4
2
0D
epth
Bel
ow G
roun
d Su
rface
(m)
Su Vane(Type-B+Type-C
Su Dilatometer’Type-B
Su TRX UU ’Type-B+Type-C
Su CA-CPT3s---------------- Nkt=15---------------- Nkt=20
Su CA-CPT9s a---------------- Nkt=15---------------- Nkt=20
Su CA-CPT9s b---------------- Nkt=15---------------- Nkt=20
**
*
*
*
*
* Refer to text for discussion regarding this result
Figure 44

JOB No: VW04794
Drawn:
Approved:
Date:
Revision:
MT
NR
08/12/09
A
CALOOTEMurray Riverbank Geotechnical Investigation
Remoulded Shear Strength vs Depth
0 10 20 30 40 50Remoulded Shear Strength (kPa)
20
18
16
14
12
10
8
6
4
2
0D
epth
Bel
ow G
roun
d Su
rface
(m)
Sur Vane’Type-B+Type-C
Sur Inferred Data’Type-B+Type-C
Figure 45

JOB No: VW04794
Drawn:
Approved:
Date:
Revision:
MT
NR
08/12/09
A
CALOOTEMurray Riverbank Geotechnical Investigation
Plasticity Index Profile
0 20 40 60 80 100 120Plasticity Index (%)
20
18
16
14
12
10
8
6
4
2
0D
epth
Bel
ow G
roun
d Su
rface
(m)
-Type-A’Type-B+Type-C
Figure 46
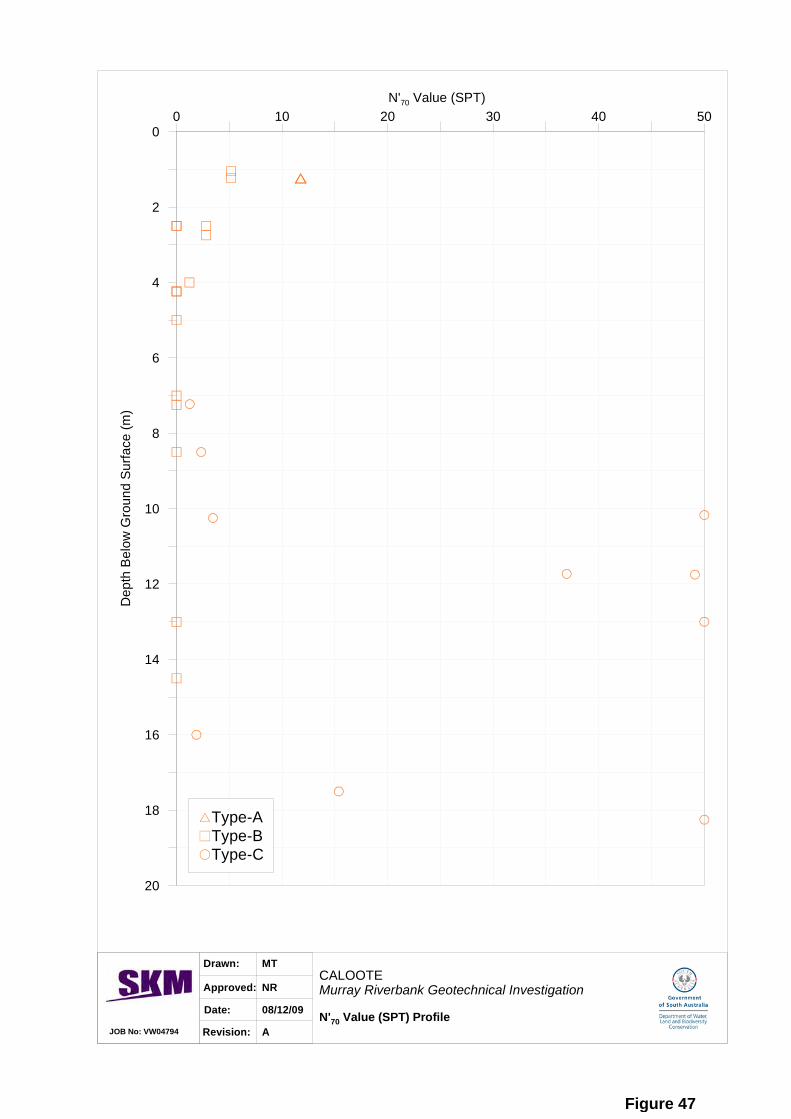
JOB No: VW04794
Drawn:
Approved:
Date:
Revision:
MT
NR
08/12/09
A
CALOOTEMurray Riverbank Geotechnical Investigation
N'70 Value (SPT) Profile
0 10 20 30 40 50N'70 Value (SPT)
20
18
16
14
12
10
8
6
4
2
0D
epth
Bel
ow G
roun
d Su
rface
(m)
-Type-A’Type-B+Type-C
Figure 47

JOB No: VW04794
Drawn:
Approved:
Date:
Revision:
MT
NR
08/12/09
A
WOODLANE RESERVEMurray Riverbank Geotechnical Investigation
Moisture Content and Atterberg Limits Profile
0 20 40 60 80 100 120Moisture Content (%)
20
18
16
14
12
10
8
6
4
2
0D
epth
Bel
ow G
roun
d Su
rface
(m)
Moisture Content>Type-B"Type-C
Plastic Limit(Type-B+Type-C
Liquid Limit’Type-B+Type-C
Figure 48

JOB No: VW04794
Drawn:
Approved:
Date:
Revision:
MT
NR
08/12/09
A
WOODLANE RESERVEMurray Riverbank Geotechnical Investigation
Dry Density & Bulk Density Profile
0 0.4 0.8 1.2 1.6 2 2.4 2.8Dry Density & Bulk Density (t/m3)
20
18
16
14
12
10
8
6
4
2
0D
epth
Bel
ow G
roun
d Su
rface
(m)
Inferred Dry Density’Type-B+Type-C
Inferred Bulk Density(Type-B+Type-C
Figure 49

JOB No: VW04794
Drawn:
Approved:
Date:
Revision:
MT
NR
08/12/09
A
WOODLANE RESERVEMurray Riverbank Geotechnical Investigation
Liquidity Profile
-0.4 0 0.4 0.8 1.2 1.6 2Liquidity Index (-)
20
18
16
14
12
10
8
6
4
2
0D
epth
Bel
ow G
roun
d Su
rface
(m)
Type-AType-BType-C
Figure 50

JOB No: VW04794
Drawn:
Approved:
Date:
Revision:
MT
NR
08/12/09
A
WOODLANE RESERVEMurray Riverbank Geotechnical Investigation
Plasticity Index Profile
0 20 40 60 80 100 120Plasticity Index (%)
20
18
16
14
12
10
8
6
4
2
0D
epth
Bel
ow G
roun
d Su
rface
(m)
-Type-A’Type-B+Type-C
Figure 51

JOB No: VW04794
Drawn:
Approved:
Date:
Revision:
MT
NR
08/12/09
A
WOODLANE RESERVEMurray Riverbank Geotechnical Investigation
N'70 Value (SPT) Profile
0 10 20 30 40 50N'70 Value (SPT)
20
18
16
14
12
10
8
6
4
2
0D
epth
Bel
ow G
roun
d Su
rface
(m)
-Type-A’Type-B+Type-C
Figure 52

JOB No: VW04794
Drawn:
Approved:
Date:
Revision:
MT
NR
08/12/09
A
SOUTH PUNYELROOMurray Riverbank Geotechnical Investigation
Moisture Content and Atterberg Limits Profile
0 20 40 60 80 100 120Moisture Content (%)
20
18
16
14
12
10
8
6
4
2
0D
epth
Bel
ow G
roun
d Su
rface
(m)
Moisture Content>Type-B
Plastic Limit(Type-B
Liquid Limit’Type-B
Figure 53

JOB No: VW04794
Drawn:
Approved:
Date:
Revision:
MT
NR
08/12/09
A
SOUTH PUNYELROOMurray Riverbank Geotechnical Investigation
Dry Density & Bulk Density Profile
0 0.4 0.8 1.2 1.6 2 2.4 2.8Dry Density & Bulk Density (t/m3)
20
18
16
14
12
10
8
6
4
2
0D
epth
Bel
ow G
roun
d Su
rface
(m)
Inferred Dry Density(Type-B
Inferred Bulk Density’Type-B
Figure 54

JOB No: VW04794
Drawn:
Approved:
Date:
Revision:
MT
NR
08/12/09
A
SOUTH PUNYELROOMurray Riverbank Geotechnical Investigation
Liquidity Profile
-0.4 0 0.4 0.8 1.2 1.6 2Liquidity Index (-)
20
18
16
14
12
10
8
6
4
2
0D
epth
Bel
ow G
roun
d Su
rface
(m)
Type-AType-BType-C
Figure 55

JOB No: VW04794
Drawn:
Approved:
Date:
Revision:
MT
NR
08/12/09
A
SOUTH PUNYELROOMurray Riverbank Geotechnical Investigation
Plasticity Index Profile
0 20 40 60 80 100 120Plasticity Index (%)
20
18
16
14
12
10
8
6
4
2
0D
epth
Bel
ow G
roun
d Su
rface
(m)
-Type-A’Type-B+Type-C
Figure 56
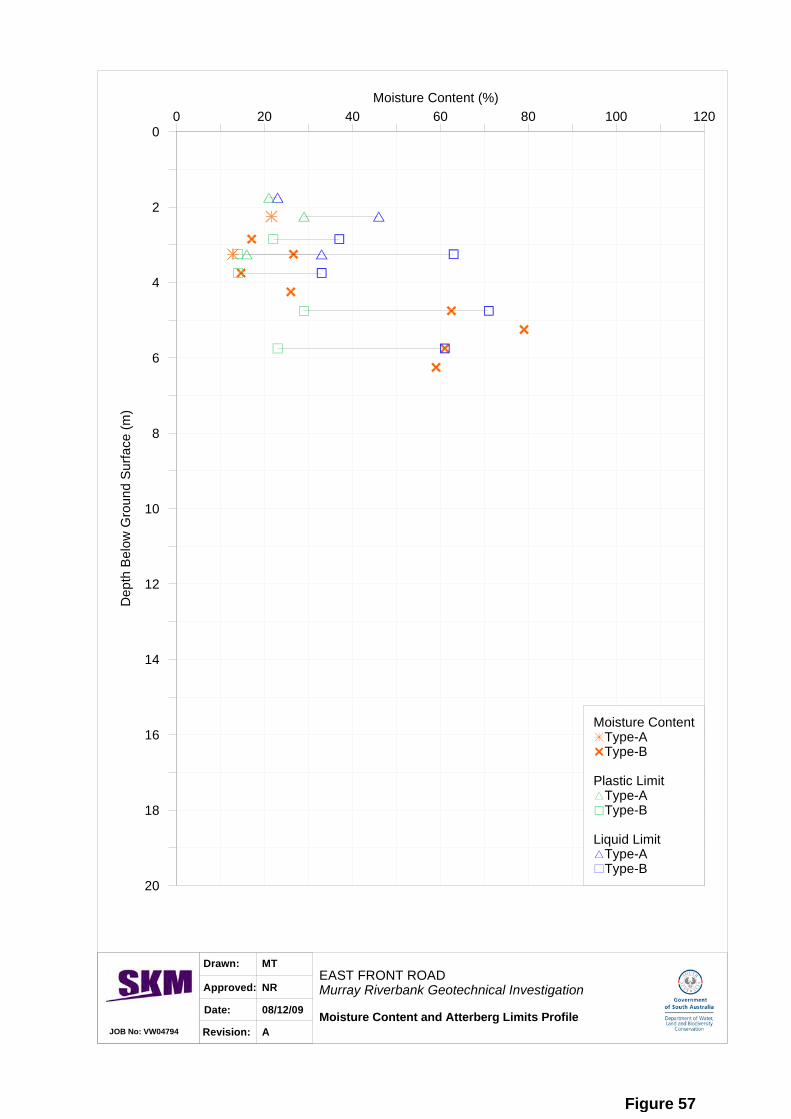
JOB No: VW04794
Drawn:
Approved:
Date:
Revision:
MT
NR
08/12/09
A
EAST FRONT ROADMurray Riverbank Geotechnical Investigation
Moisture Content and Atterberg Limits Profile
0 20 40 60 80 100 120Moisture Content (%)
20
18
16
14
12
10
8
6
4
2
0D
epth
Bel
ow G
roun
d Su
rface
(m)
Moisture ContentGType-A>Type-B
Plastic Limit-Type-A(Type-B
Liquid Limit-Type-A’Type-B
Figure 57

JOB No: VW04794
Drawn:
Approved:
Date:
Revision:
MT
NR
08/12/09
A
EAST FRONT ROADMurray Riverbank Geotechnical Investigation
Dry Density & Bulk Density Profile
0 0.4 0.8 1.2 1.6 2 2.4 2.8Dry Density & Bulk Density (t/m3)
20
18
16
14
12
10
8
6
4
2
0D
epth
Bel
ow G
roun
d Su
rface
(m)
Inferred Dry Density-Type-A’Type-B
Inferred Bulk Density-Type-A(Type-B
Figure 58

JOB No: VW04794
Drawn:
Approved:
Date:
Revision:
MT
NR
08/12/09
A
EAST FRONT ROADMurray Riverbank Geotechnical Investigation
Liquidity Profile
-0.4 0 0.4 0.8 1.2 1.6 2Liquidity Index (-)
20
18
16
14
12
10
8
6
4
2
0D
epth
Bel
ow G
roun
d Su
rface
(m)
Type-AType-BType-C
Figure 59

JOB No: VW04794
Drawn:
Approved:
Date:
Revision:
MT
NR
08/12/09
A
EAST FRONT ROADMurray Riverbank Geotechnical Investigation
Plasticity Index Profile
0 20 40 60 80 100 120Plasticity Index (%)
20
18
16
14
12
10
8
6
4
2
0D
epth
Bel
ow G
roun
d Su
rface
(m)
-Type-A’Type-B+Type-C
Figure 60

JOB No: VW04794
Drawn:
Approved:
Date:
Revision:
MT
NR
08/12/09
A
EAST FRONT ROADMurray Riverbank Geotechnical Investigation
N'70 Value (SPT) Profile
0 10 20 30 40 50N'70 Value (SPT)
20
18
16
14
12
10
8
6
4
2
0D
epth
Bel
ow G
roun
d Su
rface
(m)
-Type-A’Type-B+Type-C
Figure 61

SINCLAIR KNIGHT MERZ
River Murray at Swan Reach (A4261164) – Daily water levels (m AHD) from 11 March to 16 June 2009. Maximum air temperature for region
and daily rainfall recorded at Swan Reach are also shown.
Figure 62

SINCLAIR KNIGHT MERZ
River Murray at Mannum (A4261161) – Daily water levels (m AHD) from 1 March to 28 April 2009. Maximum air temperature for region and
daily rainfall recorded at Mannum are also shown.
Figure 63

SINCLAIR KNIGHT MERZ
River Murray at Murray Bridge (A4261162) – Daily water levels (m AHD) from 7 January to 30 March 2009. Maximum air temperature for
region and daily rainfall recorded at Murray Bridge are also shown.
Figure 64