Embed Size (px)
Citation preview
Abstract—The theatre-auditorium under investigation following
the highly reflective characteristics of materials used in it (marble, painted wood, smooth plaster, etc), architectural and structural features of the Protocol and its intended use (very multifunctional: Auditorium, theatre, cinema, musicals, conference room) from the analysis of the statement of fact made by the acoustic simulation software Ramsete and supported by data obtained through a campaign of acoustic measurements of the state of fact made on the spot by a Fonomet Svantek model SVAN 957, appears to be acoustically inadequate. After the completion of the 3D model according to the specifications necessary software used forecast in order to be recognized by him, have made three simulations, acoustic simulation of the state of and acoustic simulation of two design solutions.
Improved noise characteristics found in the first design solution, compared to the state in fact consists therefore in lowering Reverberation Time that you turn most desirable value, while the Indicators of Clarity, the Baricentric Time, the Lateral Efficiency, Ratio of Low Tmedia BR and defined the Speech Intelligibility improved significantly. Improved noise characteristics found instead in the second design solution, as compared to first design solution, is finally mostly in a more uniform distribution of Leq and in lowering Reverberation Time that you turn the optimum values. Indicators of Clarity, and the Lateral Efficiency improve further but at the expense of a value slightly worse than the BR. Slightly vary the remaining indices.
Keywords— Indoor, Acoustic, Acoustic simulation
I. INTRODUCTION HERE are several mathematical models that lead to a prediction of the acoustics of enclosed spaces (MISM –
method of image source, Ray Tracing – a method of tracing the ray of sound, Pyramid Tracing - a method of tracing pyramidal beams). Some more advanced calculation software, use so-called hybrid method (Hybrid Method) using fields of application most appropriate for each method and therefore the benefits of each method. They come together in the MISM and ray tracing, or the MISM and the Pyramid Tracing.
David Germanò is with the Department of Civil Engineering, University of
Messina, Contrada di Dio 98166 S.Agata (Messina) Italy (corresponding author to provide phone: +39 090 710016 fax: +39 090 3977480; e-mail: [email protected]).
Demetrio Plutino is with the Department of Civil Engineering, University of Messina, Contrada di Dio 98166 S.Agata (Messina) Italy (corresponding author to provide phone: +39 090 3977308 fax: +39 090 3977480; e-mail: [email protected]).
Giuseppe Cannistraro is with the Department of Civil Engineering, University of Messina, Contrada di Dio 98166 S.Agata (Messina) Italy (corresponding author to provide phone: +39 338 7140142 fax: +39 090 3977480; e-mail: [email protected]).
The software estimates the acoustic field which is part of the so-called hybrid method (MISM + Pyramid Tracing) we use to run simulations of our case study and RAMSETE.
In it, the choice of using the method of tracing pyramidal beams is the strong point. This idea thanks to the reverberant tail maintains a sufficient detail and does not show the typical scattering of other computational models, which give rise to a probability of impact on a receiver descending the route taken by it. In fact, both with traditional ray tracing models, both with the latest hybrid models (Ray Tracing + image source), you must draw a growing number of rays with the square of the length of the impulse response.
As in all trackers divergent beam (Beam Tracing, Cone Tracing, etc..), The tail sound tends to be underestimated in reverberant fields, since, with increasing the size of the base of each beam, increases the likelihood of "losing" a source image. Therefore needs to make a correction of the tail sound as was not necessary with algorithms like ray tracing, subject however to track the actual number of rays required by the report.
RAMSETE employs a correction of tail-type multiplicative noise, as originally suggested by Naylor. The intensity of sound received is therefore is corrected as follows:
I t I t
e
corr l N
c tcm
( ) ( )=
−⎛
⎝
⎜⎜
⎞
⎠
⎟⎟
−⋅
⋅12
02 24β
In the previous report there are two parameters dependent
on the nature of the sound field: the mean free path lcm, which is calculated by Ramsete on the basis of statistics on the actual distance of the rays fired on axis to the pyramids, and the dimensionless coefficient β, that depends on a more or less sabiniana sound field (field is perfectly diffuse β = 0.1). [1, 4] The theatre-auditorium under investigation following the highly reflective characteristics of materials used in it (marble, painted wood, smooth plaster, etc), architectural and structural features of the Protocol and its intended use (very multifunctional: Auditorium, theatre, cinema, musicals, conference room) from the analysis of the statement of fact made by the acoustic simulation software Ramsete and supported by data obtained through a campaign of acoustic measurements of the state of fact made on the spot by a Fonomet Svantek model SVAN 957, appears to be acoustically inadequate. After the completion of the 3D model according to the specifications necessary software used forecast (Ramsete 2.5) in order to be recognized by him, have made three simulations:
D. Germanò, D. Plutino, G. Cannistraro
Study Forecast Indoor Acoustics. A Case Study: the Auditorium Theatre-Hotel “Casa Tra Noi”
T
World Academy of Science, Engineering and Technology 44 2010
922

1. acoustic simulation of the state of 2. acoustic simulation of the design solution 1 3. acoustic simulation design solution 2.
II. CASE STUDY The Casa Tra Noi Hotel is located in Roma Via Monte del
Gallo half a mile from the Basilica of St. Peter. The property in question was born as a vocational training center and, on the grounds of requirements and social changes, it opens the doors to pilgrims and visitors becoming receptive activity while keeping the original spirit. It is an important reference point for both tourism primarily a religious Movement Tra Noi. The hotel complex consists of five buildings, all linked together and is equipped with several meeting rooms, bar, restaurant, two chapels, and an auditorium with 200 seats which is the case study of this article.
The Auditorium-Theatre was built around 1975 and was subsequently renovated in 1990. It is used in various ways since its internal perform plays and film, music and activities like conferences. The materials used for the construction of the auditorium (see Figure 1 - 6) are either:
• Marble flooring in the stalls, the lining of the pillars, the base, the paving of the walkway and parts of the stage;
• Wood painted for the stage; • Glass doors and windows; • Bricks for the painted walls; • Smooth plaster ceilings and side walls; • Fabric for the background of the stage; • Wood reflective chairs.
The total area of the auditorium is reported to be 290 square
meters with a height ranging from a minimum of 2.7 meters and a maximum of 6.5 meters and a total volume of about 1500 cubic meters.
Fig. 1 View of the auditorium and the stage
Fig. 2 View of the auditorium, the stage and the balcony
Fig. 3 View of the balcony
Fig. 4 View of the auditorium and the stage from the balcony
Fig. 5 View of the auditorium from the stage
World Academy of Science, Engineering and Technology 44 2010
923

Fig. 6 View of the pit and the ceiling
Fig. 7 Ground floor
Fig. 8 First Floor Plan
III. ACOUSTIC ANALYSIS OF THEATRE-AUDITORIUM Since the existing building has had the opportunity to experience
"live" the presence of obvious noise problems mainly dictated almost exclusively by the choice of reflective material (plaster smooth) or highly reflective (marble), and not least by choosing for the audience seating timber without any coating, this choice of the designer that
undoubtedly has only considered completely overlooking the acoustic aesthetic parameters, ignoring the fact of use of the theatre-auditorium. Obviously, the acoustic study was conducted only in the theatre structurally completed and not in the planning stages of the same. Were carried out measures of the state of the theatre, trying to get as close as possible to the conditions implemented on software estimates to calibrate the model, with a fountain on stage at a height of 1.7 meters (one speaker calibrated so that to register, one meter away, a value of 108.2 dB(A) ), and performing a measurement campaign using a SLM model Svantek SVAN 957 (see Fig.10) calibrated with A-weighted, which Record the polar diagram in Fig.11. [2]
Fig. 9 Lateral section
Fig. 10 SLM Svantek SVAN 957
Fig. 11 Polar curves in the range of frequencies from 250Hz to 12500Hz (SLM Svantek SVAN 957 ACO 7052H with microphone
and preamplifier SV 12L)
World Academy of Science, Engineering and Technology 44 2010
924

It was agreed to perform 13 measures in the most significant of the theatre (at 1.2 meters above the floor of the auditorium - the height of a seated listener - and taking into account, of course, the slope of the latter) for as shown in Figure 12. Of these 13 points, 5 were located in the stalls, 3 in the first gallery, 4 in the second gallery (balcony side).
Finally, there was a measure of comparison to 1mt from the source. In figure 12 is shown in plan the layout of the measuring points made and the source. For every point of measurement different methods are used: the first is the issue of impulsive noise shot by loudspeaker and the simultaneous analysis and signal acquisition, through our sound level meter in dB (A ) for an acquisition time equal to 3 seconds in order to take into account the decay of sound and, therefore, the reverberation time of the hall, the second requiring instead as a source of noise is always the same shot with acquisition (recording) of the blow and the subsequent decay sound on digital media. Then each recording was analyzed and compared with data obtained from the simulation of single event, both in terms of specific values of the equivalent level in dB (A) and as a result of comparison of the subsequent auralizzation samples taken at points at issue in the campaign of measurements, for as will be specified later.
Fig. 12 Arrangement of measuring points and source
Table 1 gives the figures obtained from measurement made,
while in Fig. 13 It shows the comparison between the pistol registered and those simulated in the same point 20
(auralizzation made on the front balcony of the stage). From the latter shows that the reverberation time recorded
and simulated match.
TABLE I MAXIMUM POWER PRODUCED BY THE SOURCE (SHOT) AT THE POINTS
OF MEASURE CHOSEN Meas dB(A)
Point 60 102.5 Point 56 102.3 Point 43 101.2 Point 18 100.1 Point 16 101.1 Point 26 98.8 Point 25 99.2 Point 20 100.1 Point 36 102.7
Point 110 102.3 Point 109 101.8 Point 32 101.4 Point 55 108.2
Fig. 13 Point 20: Comparison between real and simulated pistol
IV. ACOUSTIC SIMULATION OF THE STATE OF It was then passed through the realization of the model-
aided design (AutoCAD 2009) [3] following the specifications required to estimate software used (Ramses 2.5) in order to be recognized by that after importing the file created in dxf. (see fig. 14 - 18).
They are then assigned to the materials already present in the large database provided by Ramsete which could still be customized to our case study.
World Academy of Science, Engineering and Technology 44 2010
925

Fig. 14 Plant-auditorium theatre built in AutoCAD
Fig. 15 3D model created in AutoCAD theatre-auditorium: view 1
Fig. 16 3D model created in AutoCAD theatre-auditorium: view 2
Fig. 17 3D model of theatre-auditorium built in AutoCAD: view 3
Fig. 18 Model 3D theatre-auditorium built in AutoCAD: view 4
Below (see Fig. 19 - 25) we report the characteristics (ie the absorption coefficient of Ramsete in the range of frequencies from 31.5 Hz to 16000 Hz) of all materials used for the simulation of the state of being that we remember :
• Marble flooring in the stalls, the lining of the pillars, the base, the paving of the walkway and parts of the stage;
Fig. 19 Coefficient of absorption of Ramsete the parties in marble
• Wood painted for the stage;
World Academy of Science, Engineering and Technology 44 2010
926

Fig. 20 Coefficient of absorption of Ramsete the woodwork painted
• Glass doors and windows;
Fig. 21 Coefficient of absorption of Ramsete for doors and windows
• Bricks painted on a wall of the theatre;
Fig. 22 Coefficient of absorption of Ramsete for the right wall
• Smooth plaster ceilings and side walls;
Fig. 23 Coefficient of absorption of Ramsete the remaining
walls and ceilings • Fabric for the lining of the walls of the stage;
Fig. 24 Coefficient of absorption of Ramsete the walls of the
stage-coated • Wood reflective painted for chairs;
Fig. 25 Coefficient of absorption of wooden chairs
V. DATA OBTAINED FROM THE ACOUSTIC SIMULATION OF THE STATE OF AFFAIRS (WITH A SOURCE WITH CHARACTERISTICS
OMNIDIRECTIONAL) After completion of the model in AutoCAD to the
specifications imposed by the acoustic simulation software Ramsete, Ramsete CAD is in the form set the grid of listening posts next to almost all the seats (in the very limits imposed by the size of grids software) and the position of the source whose technical characteristics are specified in Figure 26.
Fig. 26 Characteristics of omnidirectional source used in the
simulations
Then you import the file created using the model in CAD Ramsete, Ramsete Tracer module that, in practice, is the actual calculation engine of the program.
The calculation software is set for each simulation, the following values:
• Subdivision Level = 8
World Academy of Science, Engineering and Technology 44 2010
927

(indicates how many pyramids drawn from each source: the number of pyramids is 8x2N where N is the value of Level. Typically, with N = 8 to 2048 pyramids - you get good results); • Time = 3.0sec (is the travel time of rays: it must be approximately equal to the reverberation time in seconds); • Time resolution = 0, 001 sec (the amplitude of time, in seconds, which is divided into intervals of the impulse response. They range from 1 ms (0001) for highly refined calculations (eg theatres) to 0.1s for industrial environments. However, you can also use values <0.001 or> 0.1. This parameter greatly affects the memory usage and size of file is produced); • History = 50 (and the number of reflections that each ray undergoes before being abandoned: -1 means to follow the beam throughout its history, and you should never give too low (below 10), because the accuracy of the calculation would be too corrupted) ; • Humidity = 37 (percentage of relative humidity, it affects the calculation of the attenuation of air, which increases exponentially with frequency. The value is actually measured at the measurement campaign carried out. For its evaluation used a Thermo-hygrometer - see Fig. 27 - whose technical specifications are shown in Table 2) • Temperature = 19.4 (is the temperature in ° C air, it influences the speed of propagation of acoustic waves. The value is actually measured at the measurement campaign carried out. For its evaluation we used a Thermo-Anemometer - see fig. 28 - whose technical specifications are reported in Table 3) • Randomize After = 4 (is a parameter that defines after much thought the pyramid is bounced back without following the laws of optics (Snell's law) and then take a random pathway); • Save hits = 4 (is a parameter that lets you view the path of the rays from the source because each receptor. Obviously, this implies a commitment of space on the hard drive are in fact generated files. @ __ for each source is processed); • Diffusion = active
(is a parameter that lets you choose whether to treat or neglect diffusion. Ramset also offers the ability to save themselves the
contribution of the spread if you have enabled the command 'Save common hits'.
This option refers to the parameter δ - scattering coefficient - in the database of materials).
TABLE II
SPECIFICATIONS THERMO-HYGROMETER
Sensor Hot-wire sensor, NTC measurement range m/s 0 - 10 m/s o 0 - 2000 fpm Accuracy ± 0,05 m/s ± 5% val. mis. (0 - 2
m/s) ± 0,5 m/s ± 5% val. mis. (2 - 10 m/s)
Measuring range °C 0 - +50°C o 32 - +122 °F Accuracy ± 0,5 °C o ± 0,9 °F Resolution 0,01 m/s – 1 fpm (< 1000 fpm); 10
fpm (1000 fpm) ; 0,1°C – 0,1 °F Working temperature 0 - +50°C Transport and storage temperature
- 20 - +70 °C
Dimensions 190 x 57 x 42 mm Weight 300 g approx. Battery Type 9V block
Fig. 27 Thermo-hygrometer
TABLE III
SPECIFICATIONS THERMO-ANEMOMETER
Sensor Sensor test @ %UR and NTC measurement range % UR 0 - 99,9 %UR Accuracy * ± 3%UR measurement range: 5
- 95%UR Measuring range °C 0 - +50 °C Accuracy °C * ± 0,4 °C Resolution 0,1%UR / 0,1 °C Battery Type 9V block Battery life approx. 100 h Operating temp 0 - +50 °C Storage temperature / transport
-20 ~ +70 °C
Dimensions 190x57x42 mm Weight Approx approx. 300 g *at a temperature of +25 °C
Fig. 28 Thermo-Anemometer
Subsequently (ie simulation performed by the plotter
pyramids) you import the file created by the form in Form Tracer Ramses Ramses View that enables viewing of data obtained by the simulation. Ramses View is a post-processor that allows one hand to perform three-dimensional perspective
World Academy of Science, Engineering and Technology 44 2010
928

views of geometry drawn with CAD or AutoCAD Ramses, second to map (in color and with curves isolivello) in plan or in perspective the results compiled and all the typical acoustic parameters (indexes of clarity, definition, strength, etc).
Can also view:
• impulse response at each receiver, or media room; • integrated response with Schroeder (decay curve); • ray paths up to order set; • Spectrum eighth overall at each receiver and the
environment: numerical tables of all data (SPL, reverberation time).
In it you have implemented an algorithm for mapping inside
but to give the user the ability to obtain graphical output level for professional presentation of your work, you can use transparently the calculation engine Surfer, (chosen from our analysis ).
Here are all the most important data (only the points selected for the actual measurement campaign, namely those shown in Table 1) determined by the status quo of our case study, assuming the installation of a single omnidirectional source (characteristics already defined) on stage.
Also in Figures 42 and 43 are respectively reported the mapping of Leq in dB(A) and the isofonic contour of Leq in dB(A).
For reasons of space have been reported values determined by simulation in all individual listening points and their mappings.
Fig. 29 Transcriptions obtained from the simulation at the point of measurement n°60
Fig. 30 Transcriptions obtained from the simulation at the point of measurement n° 56
Fig. 31 Transcriptions obtained from the simulation at the point of measurement n° 43
Fig. 32 Transcriptions obtained from the simulation at the point of measurement n°18
World Academy of Science, Engineering and Technology 44 2010
929

Fig. 33 Transcriptions obtained from the simulation at the point of measurement n°16
Fig. 34 Transcriptions obtained from the simulation at the point of measurement n°26
Fig. 35 Transcriptions obtained from the simulation at the point of measurement n°25
Fig. 36 Transcriptions obtained from the simulation at the point of measurement n°20
Fig. 37 Transcriptions obtained from the simulation at the point of measurement n°36
Fig. 38 Transcriptions obtained from the simulation at the point of measurement n°110
World Academy of Science, Engineering and Technology 44 2010
930

Fig. 39 Transcriptions obtained from the simulation at the point of measurementn°109
Fig. 40 Transcriptions obtained from the simulation at the point of measurement n°32
Fig. 41 Transcriptions obtained from the simulation at the point of measurement n°55
Fig. 42 Mapping of Leq in dB(A)
Fig. 43 Noise contours of Leq in dB(A)
World Academy of Science, Engineering and Technology 44 2010
931

VI. NUMERICAL COMPARISON BETWEEN THE DATA OBTAINED FROM MEASUREMENT AND THOSE GENERATED BY THE
ACOUSTIC SIMULATION OF THE STATE OF AFFAIRS (WITH A SOURCE WITH CHARACTERISTICS OMNIDIRECTIONAL)
The comparison between data obtained during the
measurement campaign carried out to calibrate the model of our case study (reported in Table 1) and those obtained by the first simulation, there was found a significant divergence of the Leq measured, in fact it varies between -0.1 dB and 0.9 dB, as found by numerically in Table 4 and qualitatively of the istogram reported in fig.44.
TABLE IV
COMPARISON BETWEEN THE Leq [dB (A)] "MEASURED" AND THE Leq [dB (A)] "SIMULATED"
Meas dB(A) measured
dB(A) simulated
dB(A) difference
Point 60 102.5 102.3 0.2 Point 56 102.3 102.4 -0.1 Point 43 101.2 101 0.2 Point 18 100.1 99.7 0.4 Point 16 101.1 100.6 0.5 Point 26 98.8 98.4 0.4 Point 25 99.2 98.3 0.9 Point 20 100.1 99.5 0.6 Point 36 102.7 102.3 0.4
Point 110 102.3 101.9 0.4 Point 109 101.8 101.3 0.5 Point 32 101.4 100.5 0.9 Point 55 108.2 108.2 0
Fig. 44 Comparison between the Leq [dB (A)] "measured" and the
Leq [dB (A)] "simulated"”
The almost total superposition of the results obtained by simulation with those obtained from measurement gives us comfort about the veracity of the model we have achieved in terms of adequacy of geometric examples taken, either in terms of correctness of the characteristics (coefficient of absorption and scattering ) of the materials chosen.
VII. COMPARISON "AUDITORY" BETWEEN THE DATA OBTAINED FROM MEASUREMENT AND THOSE GENERATED BY THE
ACOUSTIC SIMULATION OF THE STATEMENT OF FACT: THE STATE OF FACT AURALIZZATION
In order to have further confirmation on the veracity of the
model we built was made a comparative "hearing" between the data obtained from measurement and those generated by the acoustic simulation of the statement of fact, by auralizzation the acoustic simulation of the state in fact obtained by convolution of an anechoic signal with the impulse response (shot) as determined by the simulation, and the subsequent confrontation "hearing" with the actual signal recorded by digital recorder, in the same place means choice. So the comparison was repeated in other parts of the room and found a significant similarity almost superimposable reverberation time.
The convolution operation has been performed using the models Audio Converter and Convolver of Ramsete. The purpose of Audio Converter is to convert the impulse response of Ramsete in an impulse response ready for the processes of software through auralizzation convolution Convolver. Opening of Audio Converter are chosen file name and the number of receivers affected by the process.
The module allows Convolver the actual process of auralizzazione through the convolution operation, the operation involves sampling at 44.1 kHz. The files, the signal from anechoic and convolve the impulse response must be dragged (in the sense of the word) from the directory in which they are located in row of the image below. Chose the name and path of the file that report results, may start the process of convolution.
At this point it is then acceptable to assume that, since the theoretical model provides the same acoustic results obtained experimentally and then correctly describe the real data, any change will now be introduced into the theoretical model correctly describes the situation as hypothetical final. This way you can imagine interventions and analyze the acoustic nature result only level simulation. The determination of the new Impulse Response for the situation has changed then able to test the validity of the hypothetical intervention, not only by inspection of numerical data for the various acoustic parameters, but also by listening through headphones sound of reality final. In other words, once determined, for example the impulse response on the point of reception located in the fifth chair in the seventh row of the stalls, you can hear the cue as a hypothetical listener who is at that point.
The receivers were positioned in the model are the same points corresponding to points of measurement is considered more significant.
The agreement with the experimental data was obtained after a few simulations, because the acoustic characteristics of almost all materials used inside the auditorium-theatre corresponded to those reported in the large database of material contained within the software Ramsete.
World Academy of Science, Engineering and Technology 44 2010
932

VIII. ANALYSIS OF PROBLEMS ENCOUNTERED AND THE RESULTING DESIGN CHOICE
Let us now try to interpret the results of measurements in
order to be able to translate them into a reliable picture of the situation acoustics of the auditorium-theatre setup in its current financial year, almost equivalent to a configuration "naked", i.e. without the coating and / or fittings, which in practice at the time and therefore at such implementation.
Following the data obtained by simulation and supported by those obtained from measurement, we may find the following issues that need attention of our intervention remediation environmental noise.
A. Acoustic characteristics of the state of facts: the problems found on the reverberation time and the first reflections
The reverberation time is unacceptably high: in A-weighted minimum points are up to 1.6sec and 1.95sec. In fig.45 is reported the trend of the calculated reverberation time T20
1; the considered frequencies extending from 125 to 4000 Hz being the only meaningful analysis for this range of frequencies, outside the anomalous behavior may be significant. In other words, the reverberation time shows a decreasing trend with frequency, from 500Hz onwards which is a logical consequence of the fact that both the absorption due to air, is the coefficient of sound absorption materials to then present in theatre, are increasing function of frequency.
Fig. 45 Evolution of the reverberation time in the range 125Hz-4kHz
The fact that compared to the average value of the maximum and the minimum do not show obvious deviations (around 0.32sec), is indicative of an adequate homogeneity of spatial sound field: moving from one point to another theatre a generic observer will notice obvious changes in the reverberation time (like listening to the processes auralizzation
1 The "old" versions of Ramsete showing the value of T60, as well as T20,
T30, etc. Most users, however, complained that the values of T60 does not "return" with the experimental measurements in the same room. The reality is that no measure never T60: according to ISO 3382/1997, the magnitudes "standard" to be measured are T20 e T30. As a result of this, programmers have removed the display of Ramsete parameter T60, which generated only confusion. All typically rely T30 (both during measurement, both calculations), although some of the "renamed" improperly T60. [4]
made and attached to a CD to present). Moreover, contrary to what happens from 500Hz to 4000Hz, from 125Hz to 500Hz you see an upward trend.
The optimum reverberation time is given by the
expressions2:
4,,60 105,0 VT Popt += [sec]
(at 500Hz and the understanding of speech)
3,,60 1.0 VT Mopt ⋅= [sec]
(at 500Hz and the understanding of music) with: V volume of the room in m3 (in our case study about equal
to1550m3); In our case the desirable values are therefore:
65,0,,60 =PoptT [sec] to 500Hz
16,1,,60 =MoptT [sec] to 500Hz
However optimum values proposed in the literature [5] are
the following: sec10 60 << T (reading, drama)
sec8,12,1 60 << T (opera)
sec24,1 60 << T (rooms for chamber music)
sec3,27,1 60 << T (large concert halls)
sec42 60 << T (churches) The measured values for our case study, on average, at
500Hz: 500Hz Max 2.16 sec min 1.63 sec average 1.73 sec
and A-weighted are:
Max 1.95 sec min 1.63 sec average 1.72 sec
can therefore, in both cases (hearing the word and listening to music), high. To further confirm the optimum value of
2 According to some authors, the optimal value thus calculated can be
understood as an optimal value extended to the frequency range between 40Hz and 10kHz.
World Academy of Science, Engineering and Technology 44 2010
933
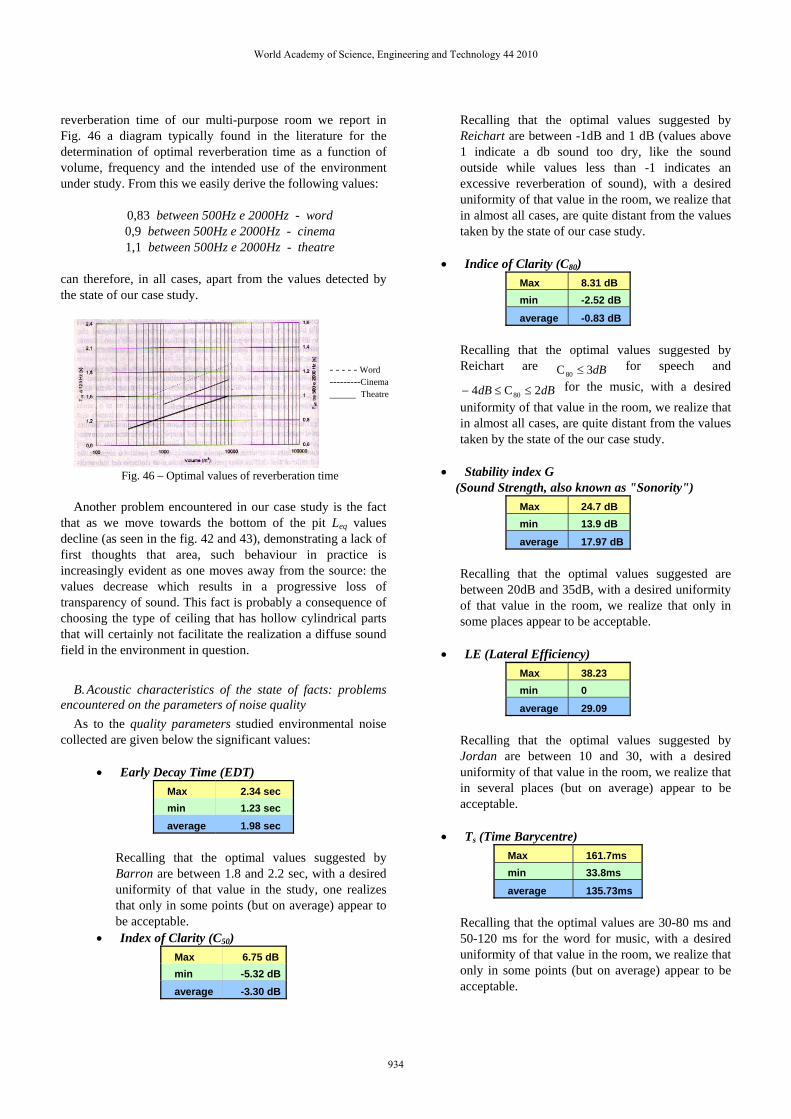
reverberation time of our multi-purpose room we report in Fig. 46 a diagram typically found in the literature for the determination of optimal reverberation time as a function of volume, frequency and the intended use of the environment under study. From this we easily derive the following values:
0,83 between 500Hz e 2000Hz - word 0,9 between 500Hz e 2000Hz - cinema 1,1 between 500Hz e 2000Hz - theatre
can therefore, in all cases, apart from the values detected by the state of our case study.
Fig. 46 – Optimal values of reverberation time
Another problem encountered in our case study is the fact
that as we move towards the bottom of the pit Leq values decline (as seen in the fig. 42 and 43), demonstrating a lack of first thoughts that area, such behaviour in practice is increasingly evident as one moves away from the source: the values decrease which results in a progressive loss of transparency of sound. This fact is probably a consequence of choosing the type of ceiling that has hollow cylindrical parts that will certainly not facilitate the realization a diffuse sound field in the environment in question.
B. Acoustic characteristics of the state of facts: problems encountered on the parameters of noise quality
As to the quality parameters studied environmental noise collected are given below the significant values:
• Early Decay Time (EDT)
Max 2.34 sec min 1.23 sec average 1.98 sec
Recalling that the optimal values suggested by Barron are between 1.8 and 2.2 sec, with a desired uniformity of that value in the study, one realizes that only in some points (but on average) appear to be acceptable.
• Index of Clarity (C50) Max 6.75 dB min -5.32 dB average -3.30 dB
Recalling that the optimal values suggested by Reichart are between -1dB and 1 dB (values above 1 indicate a db sound too dry, like the sound outside while values less than -1 indicates an excessive reverberation of sound), with a desired uniformity of that value in the room, we realize that in almost all cases, are quite distant from the values taken by the state of our case study.
• Indice of Clarity (C80)
Max 8.31 dB min -2.52 dB
average -0.83 dB
Recalling that the optimal values suggested by Reichart are dB3C80 ≤ for speech and
dBdB 2C4 80 ≤≤− for the music, with a desired uniformity of that value in the room, we realize that in almost all cases, are quite distant from the values taken by the state of the our case study.
• Stability index G
(Sound Strength, also known as "Sonority") Max 24.7 dB min 13.9 dB
average 17.97 dB
Recalling that the optimal values suggested are between 20dB and 35dB, with a desired uniformity of that value in the room, we realize that only in some places appear to be acceptable.
• LE (Lateral Efficiency)
Max 38.23 min 0
average 29.09
Recalling that the optimal values suggested by Jordan are between 10 and 30, with a desired uniformity of that value in the room, we realize that in several places (but on average) appear to be acceptable.
• Ts (Time Barycentre)
Max 161.7ms min 33.8ms
average 135.73ms Recalling that the optimal values are 30-80 ms and 50-120 ms for the word for music, with a desired uniformity of that value in the room, we realize that only in some points (but on average) appear to be acceptable.
- - - - - Word ---------Cinema _____ Theatre
World Academy of Science, Engineering and Technology 44 2010
934

They also calculated reverberation time at medium frequencies and the ratio of low tmedia BR finding, in the state of fact of our case study:
2)1000(60)500(60 HzHz
med
TTT
+= =1,72sec
that compared with the optimal values that are between 1.5
and 1.9 sec appears to be good;
med
HzHz
TTT
BR2
)250(60)125(60 += =0,99
that compared with the optimal values that are between 1.2
and 1.25 sec is too low.
IX. DESIGN CHOICE In principle you should do the following table:
• Introducing acoustically absorbent materials into the environment in order to lower the reverberation time, increasing the intelligibility of words and / or music and trying, of course, to the extent possible to improve the quality parameters of acoustic environments:
This is what runs in the first design choice (obtained after several simulations dictated by the search for materials with acoustic properties appropriate for our purposes) the results of which can be seen from their simulations. • Enhancing the number of first interesting reflections in
particular the balcony to the front stage and the balcony side and the back rows of the audience in order to provide uniform sound diffusion at all points of the room:
This is what runs in the second, more comprehensive design choice, the results can be seen from their simulations, which were kept all the materials chosen in the first design choice, by covering a large part of the ceiling (where shares are concave which certainly do not favor the diffuse reflection, but rather concentrated in some places unwanted) of reflective panels.
A. Characteristics of acoustic design solution 1: reduction of reverberation time
With the introduction of absorptive materials has managed to lower at all points of measurement values of reverberation time that, as already seen, are not relevant to use acoustic multi-auditorium theater where the object of study is intended. Below (see Fig. 47 - 53) we report the characteristics (i.e. the absorption coefficient of Ramsete in the range of frequencies from 31.5 Hz to 16000 Hz) of all materials used for the simulation of the design solution 1:
• Parts marble (pilasters, wainscoting, and some parts of the stage), the walls plastered and painted brick wall were coated Moquette;
Fig. 47 Absorption coefficient of Ramsete moquette
• The floor of the stage already painted wood was left unchanged;;
Fig. 48 Absorption coefficient of Ramsete the woodwork painted
• Glass doors and windows were covered with velvet curtains;
Fig. 49 Absorption coefficient of Ramsete velvet curtains
• Parts marble Floor (flooring the audience, paving
the balconies) were coated floors;
Fig. 50 Coefficient of absorption of Ramsete parquet
• The ceilings were originally left as a state of affairs (smooth plaster);
World Academy of Science, Engineering and Technology 44 2010
935

Fig. 51 Absorption coefficient of Ramsete ceiling
• The walls of the stage were left as in the state of affairs (coated cloth);
Fig. 52 Absorption coefficient of Ramsete the walls of the
stage-coated
• The sessions, originally painted wooden reflective, were padded and made absorbent.
Fig. 53 Coefficient of absorption of chairs absorbent
Following these changes the reverberation time is lower and, overall, the most appropriate environmental studies: as A-weighted points are found minimum and maximum points of 0.91sec to 1.33sec. In Fig. 54 shows the trend of the T20 is calculated; considered frequencies extending from 125 to 4000 Hz being the only meaningful analysis for this range of frequencies (outside the abnormal behaviour may be significant). In other words, the reverberation time shows a decreasing trend with frequency, this time more regularly starting from 125Hz onwards which is a logical consequence of the fact that both the absorption due to air, is the highest coefficients sound absorption materials introduced in the auditorium and theatre are increasing function of frequency.
The fact that compared to the average value of the maximum and the minimum continue to produce small deviations (around 0.42sec) is indicated for maintaining a good spatial homogeneity of the acoustic field: moving from one point to another theater a generic observer will not notice obvious changes in the reverberation time.
Fig. 54 Development of reverberation time in the range 125Hz-4kHz
Recalling that in our case the desirable values of optimal
reverberation time are: 65,0,,60 =PoptT [sec] a 500Hz
16,1,,60 =MoptT [sec] a 500Hz
Note that now (design solution 1) the values observed for
our case study, on average, at 500Hz:
500Hz
Max 1.32 sec min 1.09 sec
average 1.22 sec can therefore, nearly optimal for the spread of music and acceptable to the intelligibility of speech.
B. Acoustic characteristics of the design solution 1: as the values of the parameters of acoustic quality
of environment study
As to the quality parameters studied environmental noise collected are given below the significant values:
• Early Decay Time (EDT) Max 1.07 sec min 0.76 sec
average 0.97 sec Recalling that the optimal values suggested by Barron are between 1.8 and 2.2 sec, with a desired uniformity of that value in the environment studied, we realize that compared to the state of the values of this index are worse.
• Index of clarity (C50) Max 3.17 dB min -1.67 dB
average 0.43 dB Recalling that the optimal values suggested by Reichart are between-1dB and 1 dB (values above 1 indicate a db sound too dry, like the sound outside
World Academy of Science, Engineering and Technology 44 2010
936

while values less than -1 indicates an excessive reverberation of sound), with a desired uniformity of that value in the room, we realize that in all cases is much more suitable than the values reported by the state of our case study, well falling in the neighborhood of the desired range.
• Index of clarity (C80) Max 6.19 dB min 1.62 dB
average 3.50 dB
Recalling that the optimal values suggested by Reichart are dB3C80 ≤ for speech and
dBdB 2C4 80 ≤≤− for the music, with a desired uniformity of that value in the room, we realize that in almost all cases, is appropriate.
• Stability index G (Sound Strength, also known as "sonority")
Max 18.5 dB min 8.40 dB
average 14.16 dB Recalling that the optimal values suggested are between 20dB and 35dB, with a desired uniformity of that value in the room, you realize that do not fall in the desired range and therefore beyond the state of fact the values of this index are worse.
• LE (Efficiency Side) Max 35.86 min 0
average 25.1092
Recalling that the optimal values suggested by Jordan are between 10 and 30, with a desired uniformity of that value in the room, we realize that in almost all parts of the room proved suitable, and overall better than the values recorded in the state of made.
• Ts (Time barycentre)
Max 84.9 ms min 46.20 ms
average 69.19 ms
Recalling that the optimal values are 30-80 ms and 50-120 ms for the word for music, with a desired uniformity of that value in the room, we realize that prove to be very suitable for the intelligibility of speech and at the appropriate for listening to music.
Even in this case compared to the established fact that index values are better.
They also calculated reverberation time at medium frequencies Tmed and the ratio of low media BR finding, in the state of fact of our case study:
2)1000(60)500(60 HzHz
med
TTT
+= =1,11sec
that compared with the optimal values that are between 1.5 and 1.9 seconds off the situation is more optimal than the value found for the state of fact;
med
HzHz
TTT
BR2
)250(60)125(60 += =1,52sec
that compared with the optimal values that are between 1.2 and 1.25 sec appears to be closer to the optimal situation with the value found for status quo. The improvement of noise characteristics is therefore found in the decrease of Reverberation time that turns to the most desirable value, while the indicators of clarity, the baricentric time, the efficiency side, the ratio of low and called the speech intelligibility increased.
C. Acoustic characteristics of the design solution 2: further reduction of the reverberation time
In paragraph 9 he had already said it would be necessary to
increase the number of first interesting reflections in particular the balcony to the front stage and the balcony side and the back rows of the audience in order to provide uniform sound diffusion at all points of the room, and as mentioned, this is what has been done in the second, more comprehensive design choice, the results have been inferred from their simulations, which were kept all the materials chosen in the first design choice.
In practice the second and most complete design choice differs from the first only to cover much of the ceiling (where shares are concave and certainly not conducive to the diffuse reflection, but rather concentrated in some places not desired) of reflectors, Tilting the bottom of the dress ready and willing theatre according to height slightly increasing as we move away from the stage.
Here are some 3D reconstructions of the design solution 2.
World Academy of Science, Engineering and Technology 44 2010
937

Fig. 55 3D reconstruction of the design solution proposed 2
Following the installation of these panels has revealed a
further decline (albeit slightly) the reverberation time making attest to values even more desirable than those determined by the design solution 1.
Fig. 56 3D reconstruction of the design solution proposed 2
Below (Fig. 57) we report the characteristics (i.e. the
absorption coefficient of Ramsete in the range of frequencies from 31.5 Hz to 16000 Hz) of the material constituting these reflectors, insisting that no changes are made to the remaining materials compared to design solution 1:
• Such panels have a highly reflective surface toward the theatre as the audience made up of fibreglass panels, while on the back (the one that looks at the ceiling original) imagines the application of a mattress, low thickness, absorptive materials to prevent cavities from outgoing waves, generated by the multiple reflections produced by the original ceiling, are characterized by an excessive energy content.
Fig. 57 Absorption coefficient of Ramsete reflector
Following these changes the reverberation time is lower
and, overall, more capable environmental studies: as A-weighted points has minimum and maximum of 0.84sec to 1.13sec. In Fig. 58 shows the trend of the T20 is calculated; considered frequencies extending from 125 to 4000 Hz being the only meaningful analysis for this range of frequencies,
outside the anomalous behaviour may be significant. In other words, the reverberation time shows a decreasing trend with frequency, this time more regularly starting from 125Hz onwards which is a logical consequence of the fact that both the absorption due to air, is the highest coefficients sound absorption materials introduced in the auditorium and theatre are increasing function of frequency. The fact that compared to the average value of the maximum and the minimum deviations are of even smaller (around 0.29sec), relative to the first design solution, is indicative of a better spatial homogeneity of the acoustic field: moving from one point to Another of the theatre a generic observer will notice virtually no changes in the reverberation time (as would be audible to the processes of auralizzation performed).
Fig. 58 Development of reverberation time in the range
125Hz- 4kHz
Recalling that in our case the desirable values of optimal reverberation time are:
65,0,,60 =PoptT [sec] a 500Hz
16,1,,60 =MoptT [sec] a 500Hz
Note that now (design solution 2) the values observed for our case study, on average, at 500Hz:
500Hz Max 1.22 sec min 1.01 sec
average 1.11 sec
can therefore, nearly optimal for the spread of music and acceptable to the intelligibility of speech. D. Acoustic characteristics of the design solution 2: Improvements of the values of the parameters of acoustic quality environment study
As to the quality parameters studied environmental noise collected are given below the significant values:
• Early Decay Time (EDT) Max 1.06 sec min 0.75 sec
average 0.92 sec
World Academy of Science, Engineering and Technology 44 2010
938

Recalling that the optimal values suggested by Barron are between 1.8 and 2.2 sec, with a desired uniformity of that value in the environment studied, we realize that compared to the state of the values of this index are worse and vary slightly compared to design solution 1.
• Index of Clarity (C50)
Max 3.67 dB min -1.17 dB
average 0.98 dB Recalling that the optimal values suggested by Reichart are between-1dB and 1 dB (values above 1 indicate a db sound too dry, like the sound outside while values less than -1 indicates an excessive reverberation of sound), with a desired uniformity of that value in the room, we realize that in all cases is much more suitable than the values reported by the state of our case study and falling perfectly in the neighborhood of the desired range, reaching values even better compared to design solution 1.
• Index of Clarity (C80) Max 6.72 dB min 2.35 dB
average 4.02 dB
Recalling that the optimal values suggested by Reichart are dB3C80 ≤ per il for speech and
dBdB 2C4 80 ≤≤− for the music, with a desired uniformity of that value in the room, we realize that in almost all cases, appropriate and varied little compared to design solution 1 .
• Stability index G (Sound Strength, also known as "Sonority")
Max 18.3 dB min 9.1 dB
average 14.38 dB
Recalling that the optimal values suggested are between 20dB and 35dB, with a desired uniformity of that value in the room, you realize that do not fall in the desired range and therefore beyond the state of fact the values of this index are worse.
• LE (Lateral Efficiency) Max 38.71 min 0
average 24.38
Recalling that the optimal values suggested by Jordan are between 10 and 30, with a desired uniformity of
that value in the room, we realize that in almost all parts of the room proved suitable, and overall better than the values recorded in the state of fact, reaching values even better (albeit slightly) than the design solution 1.
• Ts (Baricentric Time) Max 78.7 ms min 42.8 ms
average 63.12 ms
Recalling that the optimal values are 30-80 ms and 50-120 ms for the word for music, with a desired uniformity of that value in the room, we realize that prove to be very suitable for the intelligibility of speech and at the appropriate for listening to music. Even in this case compared to the state of fact that index values are better and changed only slightly compared to design solution 1.
They also calculated reverberation time at medium
frequencies Tmed and the ratio of low media BR finding, in the state of fact of our case study
2)1000(60)500(60 HzHz
med
TTT
+= =1,01sec
that compared with the optimal values that are between 1.5 and 1.9 seconds off the situation is more optimal than the value found for the state of fact;
med
HzHz
TTT
BR2
)250(60)125(60 += =1,61sec
that compared with the optimal values that are between 1.2 and 1.25 sec is more close to the optimal situation with the value found for single event, but farther than the design solution 1.
Improved noise characteristics observed compared to design solution 1 is therefore mainly in a more uniform distribution of Leq and in lowering reverberation time that you turn the optimum values. Indices of clarity and efficiency to further improve the expense side, however, a value slightly worse than the BR. Slightly vary the remaining indexes.
X. CONCLUSIONS The theatre-auditorium under investigation following the
highly reflective characteristics of materials used in it (marble, painted wood, smooth plaster, etc), architectural and structural features of the same (total area of about 290 m2, height ranging from 2.7 m and 6.5 m, volume of about 1500 m3), and ultimately for its intended use (very multifunctional: auditorium, theatre, cinema, musicals, conferences, etc..) analysis of the statement of fact made by the software Ramsete acoustic simulation is supported by data obtained through a campaign of acoustic measurements of the state of fact made on the spot by a sound level meter model Svantek SVAN 957, appears to be acoustically inadequate.
World Academy of Science, Engineering and Technology 44 2010
939

After the completion of the 3D model according to the specifications required to estimate software used (Ramsete 2.5) in order to be recognized by the latter have been accompanied by three acoustic simulations:
1. state of 2. design solution 1 3. design solution 2
In figure 59, here is a comparison between the reverberation times regarding the status of fact and those relating to the two design proposals.
Fig. 59 Comparison of the evolution of reverberation time in the range 125Hz - 4kHz
In order to solve the problems connected with a choice of
designer who undoubtedly has only considered completely overlooking the acoustic aesthetic parameters, ignoring the fact of use of the theatre-auditorium had to be made:
Introduce acoustically absorbent materials into the environment in order to lower the reverberation time, increasing the intelligibility of words and / or music and trying, of course, improve as much as possible the parameters of acoustic quality of the environment: this is what runs in first proposed design solution (obtained after several simulations dictated by the search for materials with acoustic properties appropriate for our purposes).
Increase the number of first interesting reflections in particular the balcony to the front stage and the balcony side and the back rows of the audience in order to provide uniform sound diffusion at all points of the room: that is what runs in the second and more complete design solution, which remained all the materials chosen in the first design solution, by covering a large part of the ceiling with reflective panels.
Improved noise characteristics found in the first design solution, compared to the state in fact consists therefore in lowering Reverberation Time that you turn most desirable value, while the Indicators of Clarity, the Baricentric Time, the Lateral Efficiency, Ratio of Low Tmedia BR and defined the Speech Intelligibility improved significantly.
Improved noise characteristics found instead in the second design solution, as compared to design solution 1, is finally mostly in a more uniform distribution of Leq and in lowering Reverberation Time that you turn the optimum values. Indicators of Clarity, and the Lateral Efficiency improve further but at the expense of a value slightly worse than the BR. Slightly vary the remaining indices.
Considering the potential costs particularly burdensome for the implementation of the second design solution, taking into account the inherent characteristics of the theater auditorium in the subject and finally the discrete acoustic quality complex obtained already with the first and most economical design solution, it probably is more appropriate for our case study. Leaving a possible buyer and hoped the final choice, for our purposes can be considered completed, the project will sound.
REFERENCES
[1] A. Farina,"Propagation of sound and noise prediction in a work Environment”, [2] http://svantek.com/ [3] http://www.autodesk.it [4] Paolo Galaverna, Angelo Farina "Ramsete - Manual", Genesis Software and Acoustic Consultancy [5] Renato Spagnolo "Handbook of Applied Acoustics", Ed Utet Library. David Germanò qas born in Messina on 10/10/1974.Name and type of organization providing education and training: Faculty of Civil Engineering Structures - Università degli Studi di Messina.From 01/07/2004 to 05/11/2004 collaborated with the Sicilian Center for Atmospheric and Physics Researches of the Environment, for the implementation of a Plan of Acoustics Reorganization of Messina specializing in the use of simulation acoustics program Cadna A. Through this program, and at the end of the simulation above, achieved a three-dimensional model of the volume space of the City of Messina.Ph.D. degree in Engineering of Security of Civil Structural and Environmental Control, on 27/03/2008.Title of PhD thesis: Performance of optical energy and smart windows elettrocromica to control solar gain and visual comfort in buildings.From 01/01/2008 to 31/12/2008 attended a Masters Degree In Sound Engineering at the University of Rome Torvergata to obtain the title of Sound Engineer. He won a scholarship post-doctoral research is currently underway. Demetrio Plutino was born in Reggio Calabria on 06/03/1972. Name and type of organization Providing education and training: Faculty of Civil Engineering - University of Messina.From 2003 to 2004 collaborated with the Sicilian Center for Atmospheric Physics and Researches of the Environment, for the Implementation of a Plan of Reorganization of Messina Acoustics specializing in the use of acoustics simulation program Cadna A. Through this program, and at the end of the simulation above, Achieved a three-dimensional model of the volume space of the City of Messina. Ph.D. degree in Engineering of Security of Civil Structural and Environmental Control, on 2006. June 2007 Winner of the research with the title "Environmental monitoring in the metropolitan area of the Strait of Messina." Giuseppe Cannistraro was born in Palermo on 01/07/1950.Name and type of organization Providing education and training: Faculty of Civil Engineering - University of Palermo.Year 1983: Enter the Contest to Assistant Professor and is the winner. 07/16/1983 employed by the Department of Energy and Applications of Physics, University of Palermo.Year 1997 Wins National Competition for Technical Physics Associate Professor of Environmental. Professor of Physics at the Faculty of Environmental Engineering, University of Messina in 2002.
World Academy of Science, Engineering and Technology 44 2010
940