Embed Size (px)
Citation preview

UNIVERSITY ”ALEXANDRU IOAN CUZA” OF IA ȘI
FACULTY OF CHEMISTRY
DOCTORAL SCHOOL OF CHEMISTRY AND LIFE SCIENCES
Study by infrared spectroscopy, Raman and
SERS of imidazole derivatives
PhD THESIS SUMMARY
Scientific supervisor:
Prof. univ. dr. Mangalagiu Ionel
PhD student:
Aștefanei Dan
2013

2
Contents Keywords ................................................................................................................................................ 3
General .................................................................................................................................................... 4
II. Computational details ......................................................................................................................... 4
III. Personal researches ........................................................................................................................... 5
Objectives .............................................................................................................................. 5
III.1 Experimental (Selective) ................................................................................................ 5
III.1.1 Synthesis .............................................................................................................................. 6
III.1.2 Study by infrared spectroscopy, Raman and SERS of imidazole derivatives.Vibrational analysis. Adsorption on the silver surface....................................................................................... 7
Final conclusions .................................................................................................................................. 25
References (selective) ........................................................................................................................... 26

3
Keywords
• IR, Raman, SERS
• vibrational analysis
• adsorption on the silver surface
• imidazole derivatives
• benzimidazole derivatives

4
General
Infrared spectroscopy (FT-IR), Raman and SERS are techniques commonly used to identify
drugs and their precursors. Infrared spectroscopy and Raman spectroscopy provides detailed
information on molecular vibrations. Raman spectroscopy is an analytical method used frequently in
the analysis of pigments [1-3]. SERS (Surface-Enhanced Raman Spectroscopy) has become an
extremely useful method used in determining the structure of bioorganic compounds [4].
In order to understand correctly the infrared spectra, Raman and SERS of molecules, it is
required to identify the vibrational modes. Quantum mechanics methods ab-initio and DFT (Density
Functional Theory) are used. These methods calculate the theoretical vibration modes and
subsequently assigned to the results obtained experimentally.
The thesis is divided into three chapters. The first part briefly describes the techniques of
infrared spectroscopy, Raman and SERS investigation of imidazole derivatives used in the
experimental investigation of this thesis.
Section Two describes briefly the method of computational simulation used to determine the
theoretical vibratory modes of the imidazole derivatives investigated in the experimental part of this
thesis.
Personal researches are summarized in the third chapter of this thesis and present the FT-IR
spectra, Raman and SERS.
II. Computational details
Theoretical calculations were investigated with Firefly [5, 6]. DFT calculations are made
according to the method of Becke exchange functional [7] and Perdew-Wang 91 method (B3PW91)
[8]. Also, B3LYP method was used. This method contains hybrid parameters using Lee-Yang-Parr
correlation [9, 10].
DFT/B3LYP, DFT/B3PW91 methods were used, and ab initio HF with 6-31G basis set *.

5
III. Personal researches
Objectives
PhD thesis entitled “Study by infrared spectroscopy, Raman and SERS of imidazole
derivatives“ aims vibrational spectroscopic investigation of a series of organic compounds,
investigation in conjunction with computational methods of theoretical simulations.
The research presented in this paper had the following objectives:
1. Synthesis of imidazole derivatives by previously established methods.
2. The main objective was to investigate the synthesized imidazole derivatives by infrared
spectroscopy, Raman and SERS. Raman spectroscopy provides complementary information, but due
to fluorescence which may present some organic compounds, information may be limited. SERS
technique can be used instead.
3. Calculation of vibrational modes of the compounds studied by computational methods.
Interpretation of vibrational spectra (FT -IR , Raman and SERS ) is a difficult task. Identification of
vibrational modes is difficult in the case of complex spectra. The interpretation and identification of
vibrational modes in the spectra may be facilitated by comparison of experimentally obtained data
with computational simulation data.
4. Identification of functional groups involved in adsorption of molecules on the surface of
the particle of colloidal silver.
5. Development of SERS technique for the class of compounds studied. This technique is
highly sensitive. Spectra can be recorded with very small amounts of substance. The method can be
used for the detection and identification of compounds present in traces. The identification can be
used to create a database.
III.1 Experimental (Selective)
Infrared spectra were recorded with the Bruker VERTX 70, spectral resolution 2 cm-1 /pixel
within 3500 – 300 cm-1.
Raman and SERS spectra were recorded with Raman-Horiba Jobin Yvon RPA-HE 532
spectrometer.
The final concentration of analyte in the sol was approximately 1·10-3 M. NaOH and H2SO4
were used to adjust the pH value.

6
III.1.1 Synthesis
The synthesis of imidazole derivatives (Fig. III.1 and Fig. III.2) [11, 12].
1a
N
NH
N
NH1b
CN
N
N
N
N2b
CN
CN
3.a. R= X= I; Y= NH2 b. R= X= Br; Y= OCH3 c. R= X= Br; Y= OC2H5N
N
N
N
CN
CN
X
O
Y
X= I; Y= NH2 X= Br; Y= OCH3, OC2H5
YO
Y
O
X
X
3.d. X= I; Y= NH2 e. X= Br; Y= OCH3 f. X= Br; Y= OC2H5
2a
Fig.III.1 Synthesis of imidazole derivatives
1a
N
NH
N
NH1b
COOR
N
N
N
N2b
COOR
COOR
N
N
N
N
COOR
COOR
X
O
Y
X= I; Y= NH2 X= Br; Y= OCH3, OC2H5
YO
Y
O
X
X
2a
R= C2H5
3. d. R= C2H5; X= I; Y= NH2 e. R= C2H5; X= Br; Y= OCH3 f. R= C2H5; X= Br; Y= OC2H5
4. d. R= C2H5; X= I; Y= NH2 e. R= C2H5; X= Br; Y= OCH3 f. R= C2H5; X= Br; Y= OC2H5
Fig.III.2 Synthesis of imidazole derivatives
In basic medium, the salts of imidazole derivatives formed the corresponding ylides.
The characterization of ylide by SERS technique is scarce [13, 14].

III.1.2 Study by infrared spectroscopy, Raman and SERS of imidazole
derivatives.Vibrational analysis
III.2 Study by infrared spectroscopy, Raman and SERS of
imidazole. Adsorption on the
Fig.III.2.1 FT-IR (b) and Raman
N-(2-cyanoethil)-imidazole
Fig. III.2.3 Molecule adsorption in neutral and basic medium
Conclusions In neutral and basic medium the molecule is adsorbed via In acidic medium the molecule is adsorbed via the electronic cloud of imidazole.
7
Study by infrared spectroscopy, Raman and SERS of imidazole
derivatives.Vibrational analysis. Adsorption on the silver surface.
Study by infrared spectroscopy, Raman and SERS of
the silver surface.
Raman (a) spectra of imidazole
Fig. III.2.2 SERS spectra of
cyanoethil)-imidazole in different media(a) acidic, (b) neutral
Molecule adsorption in neutral and
basic medium Fig. III.2.4 Molecule adsorption in acidic
medium
In neutral and basic medium the molecule is adsorbed via nitrogen atom In acidic medium the molecule is adsorbed via the electronic cloud of imidazole.
Study by infrared spectroscopy, Raman and SERS of imidazole
Study by infrared spectroscopy, Raman and SERS of N-(2-cyanoethil)-
SERS spectra of N-(2-in different media:
ral and (c) basic
Molecule adsorption in acidic
medium
nitrogen atom N3. In acidic medium the molecule is adsorbed via the electronic cloud of imidazole.

8
III.3 Study by infrared spectroscopy, Raman and SERS of N-(2-cyanoethil)-
benzimidazole. Adsorption on the silver surface.
Fig. III.3.1 Raman (a) and FT-IR (b)
spectra of N-(2-cyanoethil)-benzimidazole
Fig. III.3.2 SERS spectra of N-(2-cyanoethil)-
benzimidazole at different pH values
Fig. III.3.3 Molecule adsorption in neutral
medium
Fig. III.3.4 Molecule adsorption in acidic and
basic medium Conclusions The molecule is adsorbed via nitrogen atom N3 in neutral medium. The molecule is adsorbed via nitrogen atom N13 in acidic and basic medium
3500 3000 2500 2000 1500 1000 500
2972 88
7 477
1265
1178
1202
631
1737
1032
1361
772
2246
442
994
1494
1594
2247
b
a
Wavenumber / cm-1
Ram
an in
tens
ity
A
bsor
ptio
n
3092
2923
3500 3000 2500 2000 1500 1000 500
541
776
776
772
1009
2988
299
429
88pH=3
pH=7
pH=12
2250
Ram
an in
tens
ity
Wavenumber / cm-1

9
III.4 Study by infrared spectroscopy, Raman and SERS of 3-(2-amino-2-
oxoethyl)-1-(2-cyanoethyl)-1H-imidazol-3-ium iodide. Adsorption on the silver surface.
Fig. III.4.1 Raman (a) and FT-IR (b) spectra of 3-(2-amino-2-oxoethyl)-1-(2-cyanoethyl)-1H-
imidazol-3-ium iodide
Fig. III.4.2 SERS spectra of 3-(2-amino-
2-oxoethyl)-1-(2-cyanoethyl)-1H-imidazol-3-ium iodide at different pH
values
Fig. III.4.3 Molecule adsorption on silver surface
Conclusions The molecule is adsorbed on the silver surface via nitrile and amide groups.
3500 3000 2500 2000 1500 1000 500
1684
614
1093
1422
2923
2252
760
116614
01
1560
1609
3241
2956
3075
1693
b22
54
a
Abs
orpt
ion
Ram
an in
tens
ity
Wavenumbers (cm-1)
3500 3000 2500 2000 1500 1000 500
1577
2917
2256
2255 61
1 558
1300
1626
1511
1511
1452
2844
722
559
87711
4212
08
1452
1577
1629 12
97
1208
558
1300
1452
1511
1577
1629
pH=3
pH=7
2850
pH=12
Ram
an in
tens
ity
Wavenumbers (cm-1)
10
III.5 Study by infrared spectroscopy, Raman and SERS of 3-(2-amino-2-
oxoethyl)-1-(2-cyanoethyl)-1H-benzo[d]imidazol-3-ium iodide. Adsorption on the silver
surface.
Fig. III.5.1 Raman (a) and FT-IR (b) spectra of 3-(2-amino-2-oxoethyl)-1-(2-cyanoethyl)-
1H-benzo[d]imidazol-3-ium iodide
Fig. III.5.2 SERS spectra of 3-(2-amino-2-
oxoethyl)-1-(2-cyanoethyl)-1H-benzo[d]imidazol-3-ium iodide at different
pH values
Fig. III.5.3 Molecule adsorption on silver surface
Conclusions The molecule is adsorbed on the silver surface via nitrile and amide groups.
3500 3000 2500 2000 1500 1000 500
1426
772
77210
12
1348
1424
296230
62
1609
2911
2243
427
497
597
1009 90
9
760
1134
118813
02
156016
1416
85
3345
3255
3181 30
65
2912
Abs
orpt
ion
Ram
an in
tens
ity
Wavenumbers (cm-1)
a
b
2245
3500 3000 2500 2000 1500 1000 500
614
130
0
120
8
772
2922
284
7
1208
1142
877
558
1297
142116
29
100
2
151
115
11
120
8
1303
284
2
558
136115
11
157
715
7715
77
1452
145
2
pH=12
pH=7
Ram
an in
tens
ity
Wavenumbers (cm-1)
pH=3
1452

11
III.6 Study by infrared spectroscopy, Raman and SERS of 1-(2-cyanoethyl)-3-(2-
methoxy-2-oxoethyl)-1H-imidazol-3-ium bromide. Adsorption on the silver surface.
Fig. III.6.1 Raman (a) and FT-IR (b) spectra
of 1-(2-cyanoethyl)-3-(2-methoxy-2-oxoethyl)-1H-imidazol-3-ium bromide
Fig. III.6.2 SERS spectra of 1-(2-
cyanoethyl)-3-(2-methoxy-2-oxoethyl)-1H-imidazol-3-ium bromide at different pH
values
Fig. III.6.3 Molecule adsorption on silver surface
Conclusions
The molecule is adsorbed on the silver surface via nitrile and ester groups.
3500 3000 2500 2000 1500 1000 500
1647
419
628
82196
8
1420
1230
1167
1569
1753
2854
3086
Abs
orpt
ion
Ram
an in
tens
ity
Wavenumbers (cm-1)
a
b
2247
3500 3000 2500 2000 1500 1000 500
558
164
8
611
718
772
92710
481180
130
7
358
225
5
292
0
136
1
151
1
305
4
1573
316
0
772
145
2
225
52844 11
43
877
614
559
1422
1297
1511
162
9
292
029
49
877
614
558
129
713
61
1452
1511
157
71
629
pH=12
pH=7
Ram
an in
tens
ity
Wavenumbers (cm-1)
pH=3
2922
12
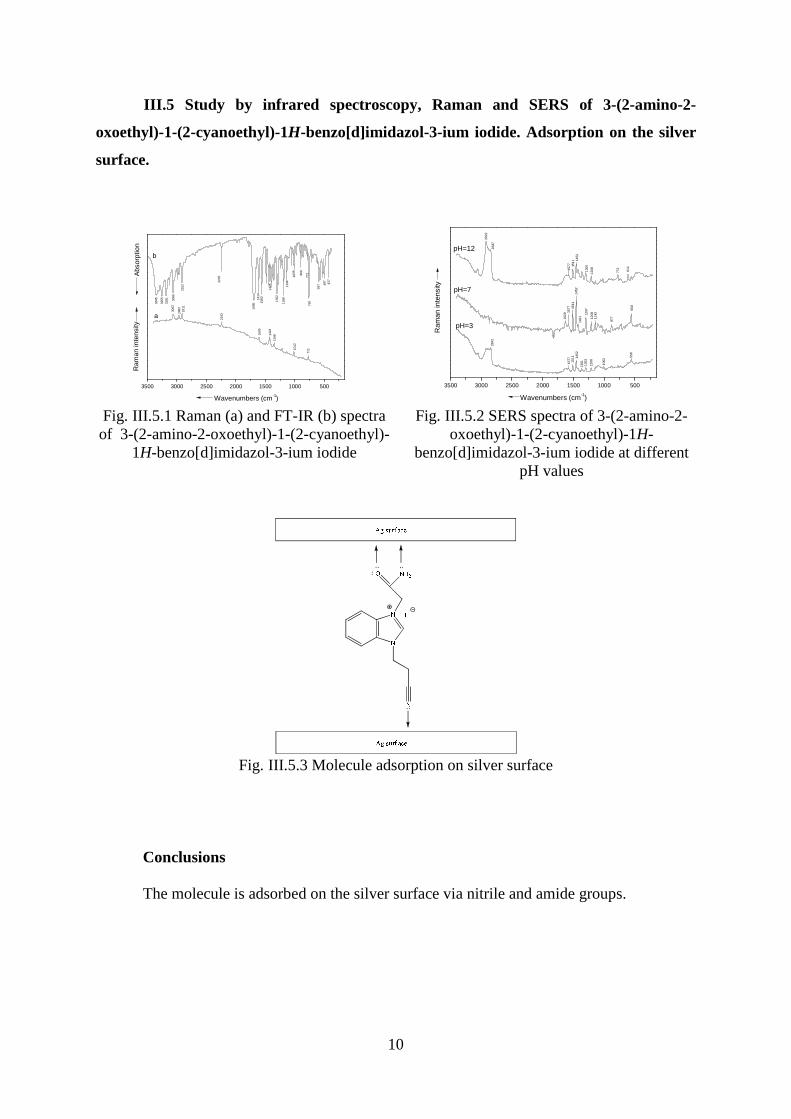
III.7 Study by infrared spectroscopy, Raman and SERS of 1-(2-cyanoethyl)-3-(2-
methoxy-2-oxoethyl)-1H-benzo[d]imidazol-3-ium bromide. Adsorption on the silver
surface.
Fig. III.7.1 FT-IR (b) and Raman (a) spectra
of 1-(2-cyanoethyl)-3-(2-methoxy-2-oxoethyl)-1H-benzo[d]imidazol-3-ium
bromide
Fig. III.7.2 SERS spectra of 1-(2-
cyanoethyl)-3-(2-methoxy-2-oxoethyl)-1H-benzo[d]imidazol-3-ium bromide at different
pH values
Fig. III.7.3 Molecule adsorption on silver surface
Conclusions The molecule is adsorbed on the silver surface via nitrile and ester groups.
3500 3000 2500 2000 1500 1000 500
1016
772
1348
1612
1613
2252
1431
1362
1229
967
757
428
2960
628
3072
3019
1738
1554
3108
Abs
orpt
ion
Ram
an In
tens
ity
Wavenumbers (cm-1)
a
b
2252
3500 3000 2500 2000 1500 1000 500
136
1
614
772
931
131
0
118
0
150
815
70
1648
3158
559
296
2
1296
1142
772
120
8
101
3
2252
1511
1613
1428
135
8306
2
614
559614
145
2
1142
1296
136
1
150
815
77
292
2
3062
1648
292
02
2951
pH=12
pH=7
Abs
orpt
ion
Ram
an
inte
nsity
Wavenumbers (cm-1)
pH=3
225
2

13
III.8 Study by infrared spectroscopy, Raman and SERS of ethyl 3-(1H-imidazol-
1-yl)propanoate. Adsorption on the silver surface.
Fig. III.8.1 Raman (a) and FT-IR (b) spectra
of ethyl 3-(1H-imidazol-1-yl)propanoate
Fig. III.8.2 SERS spectra of ethyl 3-(1H-imidazol-1-yl)propanoate at different pH
values
Fig. III.8.3 Molecule adsorption on silver surface
Conclusions The molecule is adsorbed on the silver surface via ester group.
3500 3000 2500 2000 1500 1000 500
1506
814940
663
73315
793441
3053 2875
2981
Abs
orpt
ion
Ram
an in
tens
ity
Wavenumbers (cm-1)
a
b
1731
3500 3000 2500 2000 1500 1000 500
931 81
6
611
1030
1347
1570
2922
926
614
772
1452
1421
614
1344
558
103
4
164
8
292
2
772
151
115
73
2967
136116
48
1511
1577
pH=12
pH=7
Ram
an in
tens
ity
Wavenumbers (cm-1)
pH=3
2920
14
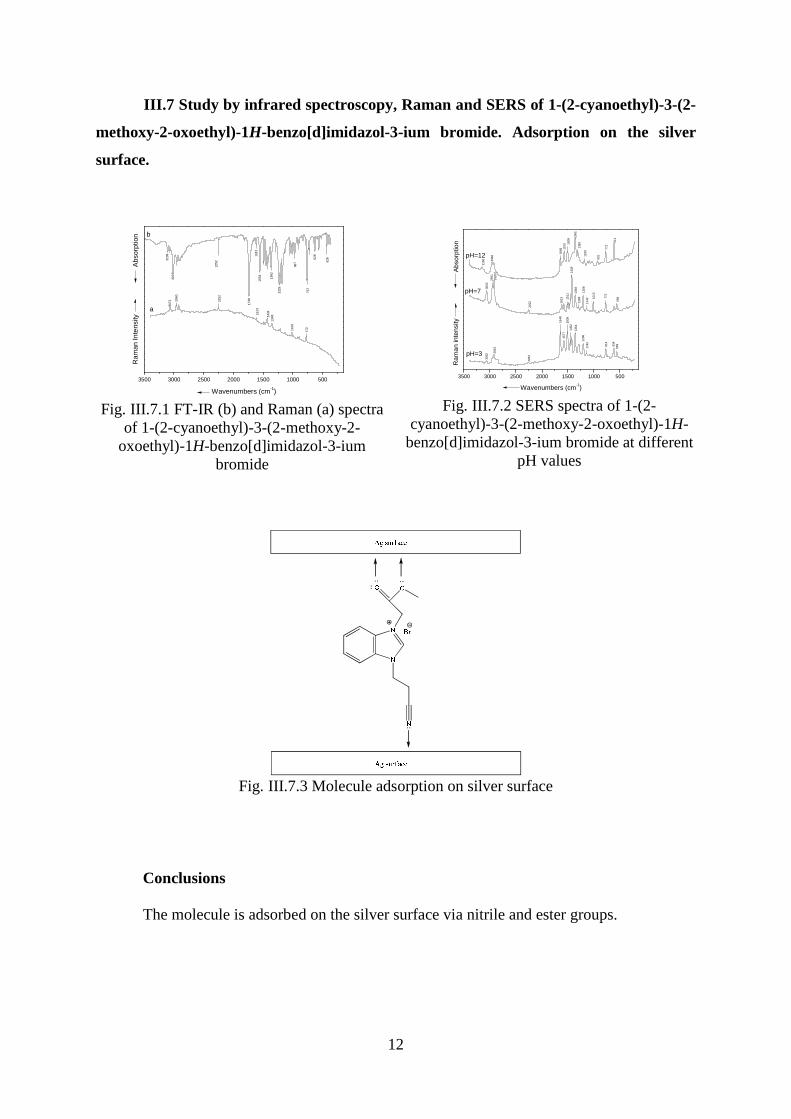
III.9 Study by infrared spectroscopy, Raman and SERS of methyl 3-(1H-
imidazol-1-yl)propanoate. Adsorption on the silver surface.
Fig. III.9.1 Raman (a) and FT-IR (b) spectra of methyl 3-(1H-imidazol-1-yl)propanoate
Fig. III.9.2 SERS spectra of methyl 3-(1H-imidazol-1-yl)propanoate at different pH
values
Fig. III.9.3 Molecule adsorption on silver surface
Conclusions The molecule is adsorbed on the silver surface via and ester group.
3500 3000 2500 2000 1500 1000 500
1729
2954
2848
1080
664
823
1507
746
1348
1079
1030
841
1439
3111
1507 90
7
624
2957
3114
2850
903
1286
Abs
orpt
ion
Ram
an in
tens
ity
Wavenumbers (cm-1)
a
b17
38
3500 3000 2500 2000 1500 1000 500
841
1573 15
08
1310
611
772
1180
1361
1030
1508
1341
1461
1314
2952
559
1239
1086
1645
838
1273
1385
1121 10
73
pH=12
pH=7
Ram
an in
tens
ity
Wavenumbers (cm-1)
pH=3
1648
15
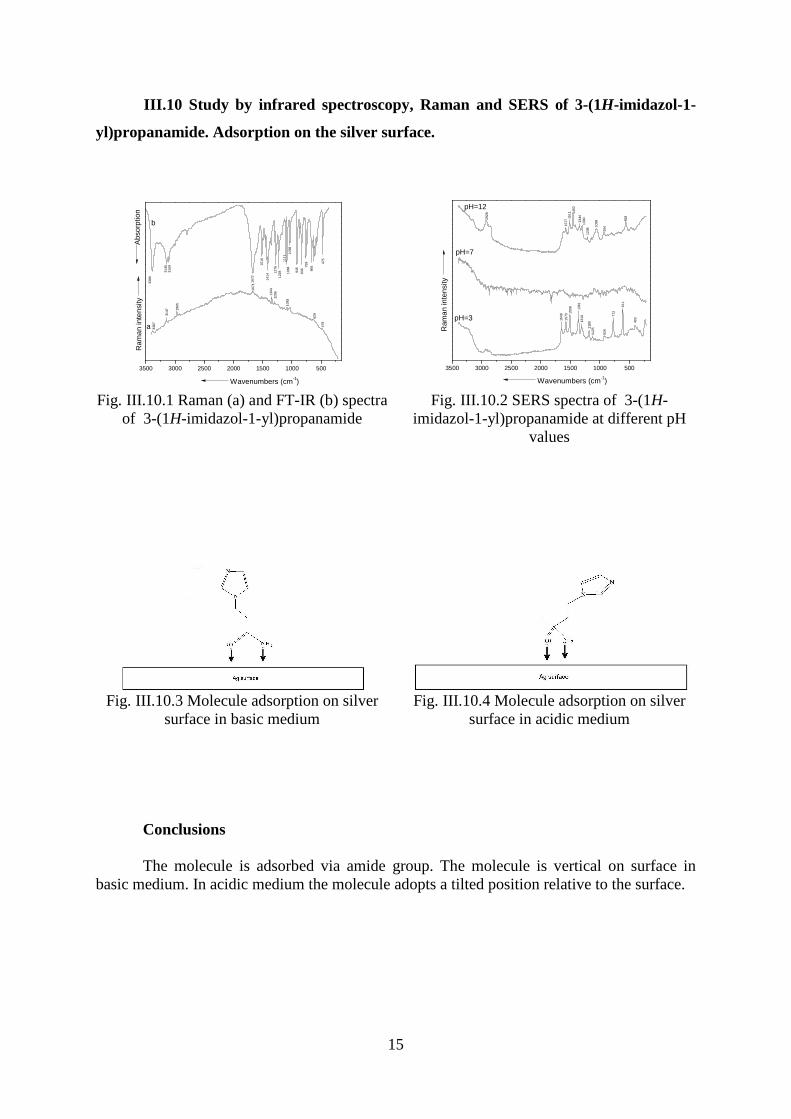
III.10 Study by infrared spectroscopy, Raman and SERS of 3-(1H-imidazol-1-
yl)propanamide. Adsorption on the silver surface.
Fig. III.10.1 Raman (a) and FT-IR (b) spectra
of 3-(1H-imidazol-1-yl)propanamide
Fig. III.10.2 SERS spectra of 3-(1H-
imidazol-1-yl)propanamide at different pH values
Fig. III.10.3 Molecule adsorption on silver
surface in basic medium
Fig. III.10.4 Molecule adsorption on silver
surface in acidic medium
Conclusions The molecule is adsorbed via amide group. The molecule is vertical on surface in
basic medium. In acidic medium the molecule adopts a tilted position relative to the surface.
3500 3000 2500 2000 1500 1000 500
Abs
orpt
ion
1084
1516
1228 83
6
1083
629
1671
75911
11
1038
1276
1672 14
14
479
1296
3147 29
65
3387
915
3145
3109
475
1344
666
Ram
an in
tens
ity
Wavenumbers (cm-1)
a
b
3386
3500 3000 2500 2000 1500 1000 500
611
924
403
772
1125
1180
1361
1310
1508
1573
1058
924
1344
1208
1648
1511
1577
2928
558
1300
Ram
an in
tens
ity
Wavenumbers (cm-1)
pH=3
pH=7
pH=12
1452

16
III.11 Study by infrared spectroscopy, Raman and SERS of 3-(1H-
benzo[d]imidazol-1-yl)propanamide. Adsorption on the silver surface.
Fig. III.11.1 Raman (a) and FT-IR (b) spectra
of 3-(1H-benzo[d]imidazol-1-yl)propanamide
Fig. III.11.2 SERS spectra of 3-(1H-
benzo[d]imidazol-1-yl)propanamide at different pH values
Fig. III.11.3 Molecule adsorption on silver surface
Conclusions The molecule is adsorbed on the silver surface via amide group.
3500 3000 2500 2000 1500 1000 500
1771
465
419
901
1246
1365
1493
1410
1611
1672
580
745
1003
1167
3350
Abs
orpt
ion
Ram
an in
tens
ity
Wavenumbers (cm-1)
a
b
3350
3500 3000 2500 2000 1500 1000 500
1009
3070
2844
1009
1645
1364
1577
1648
1452
559
411
1518
1418
1334
1307
772
611
884
1511
776
881
1080
1511
629
1191
Ram
an in
tens
ity
Wavenumbers (cm-1)
pH=3
pH=7
pH=12
1645

17
III.12 Study by infrared spectroscopy, Raman and SERS of 3-(2-amino-2-
oxoethyl)-1-methyl-1H-imidazol-3-ium iodide. Adsorption on the silver surface.
Fig. III.12.1 Raman (a) and FT-IR (b)
spectra of 3-(2-amino-2-oxoethyl)-1-methyl-1H-imidazol-3-ium iodide
Fig. III.12.2 SERS spectra of 3-(2-amino-2-
oxoethyl)-1-methyl-1H-imidazol-3-ium iodide at different pH values
Fig. III.12.3 Molecule adsorption on silver surface
Conclusions The molecule is adsorbed on the silver surface via amide group. The molecule adopts
a tilted position relative to the surface.
3500 3000 2500 2000 1500 1000 500
1687
972
2986
3247
3314
1688
622
1107
1034
1173
838
756
1020
856
1204
970
1104
411
625
673
1344
1299
1415
540
592
3161
1393
2954
1423
1612
Abs
orpt
ion
Ram
an in
tens
ity
Wavenumbers (cm-1)
a
b
3147
3500 3000 2500 2000 1500 1000 500
2845 11
80
1361
1310
559
2922
611
772
1570
1508
2946
1648
1421
1125
1101
1452
1648
1511
1097
555
311
pH=12
pH=7
Ram
an in
tens
ity
Wavenumbers (cm-1)
pH=3
2845

18
III.13 Study by infrared spectroscopy, Raman and SERS of 3-(2-ethoxy-2-
oxoethyl)-1-methyl-1H-imidazol-3-ium iodide. Adsorption on the silver surface.
Fig. III.13.1 Raman (a) and FT-IR (b) spectra of 3-(2-ethoxy-2-oxoethyl)-1-
methyl-1H-imidazol-3-ium iodide
Fig. III.13.2 SERS spectra of 3-(2-ethoxy-2-oxoethyl)-1-methyl-1H-imidazol-3-ium iodide at
different pH values
III.13.3 Molecule adsorption on silver surface
Conclusions The molecule is adsorbed on the silver surface via ester group. The molecule adopts a
tilted position relative to the surface.
3500 3000 2500 2000 1500 1000 500
410
373
411
1020
1201
644
772
906
1567
1369
633
708
1031
989
1179
881
2933
1344
2850
1415
2830
3015
310631
53
904
768
128
573
1754
1567
374
Ram
an in
tens
ity
Abs
orpt
ion
Wavenumbers (cm-1)
a
b
1752
3500 3000 2500 2000 1500 1000 500
1629
2946
2912
1300 10
97
772
1577
2844
614
2845
129715
77
562
1452
558
1649 10
94
552
1511
1511
pH=12
pH=7
Ram
an in
tens
ityWavenumbers (cm-1)
pH=3
1452

19
III.14 Study by infrared spectroscopy, Raman and SERS of 1-(2-cyanoethyl)-3-
(2-ethoxy-2-oxoethyl)-1H-imidazol-3-ium bromide. Adsorption on the silver surface.
Fig. III.14.1 Raman (a) and FT-IR (b) spectra of 1-(2-cyanoethyl)-3-(2-ethoxy-2-oxoethyl)-
1H-imidazol-3-ium bromide
Fig. III.14.2 SERS spectra of 1-(2-cyanoethyl)-3-(2-ethoxy-2-oxoethyl)-1H-imidazol-3-ium bromide at different pH
values
III.14.3 Molecule adsorption on silver surface
Conclusions The molecule is adsorbed on the silver surface via ester and nitrile groups.
3500 3000 2500 2000 1500 1000 500
623
116922
55 1398
759
1018
1568
1232
Abs
orpt
ion
Ram
an in
tens
ity
Wavenumbers (cm-1)
1746
a
b
3500 3000 2500 2000 1500 1000 500
2276
1104
284
551
2922
1104
967
729
450
835
1505
1418
729
2922
2920
2962
2960 14
18
1108
1348
1418
3163
2262
1571
2259
1587
2960
Ram
an in
tens
ity
Wavenumbers (cm-1)
pH=3
pH=7
pH=12
3163

20
III.15 Study by infrared spectroscopy, Raman and SERS of 1-(2-cyanoethyl)-3-
(2-ethoxy-2-oxoethyl)-1H-benzo[d]imidazol-3-ium bromide. Adsorption on the silver
surface.
Fig. III.15.1 Raman (a) and FT-IR (b) spectra of 1-(2-cyanoethyl)-3-(2-ethoxy-2-oxoethyl)-
1H-benzo[d]imidazol-3-ium bromide
Fig. III.15.2 SERS spectra of 1-(2-
cyanoethyl)-3-(2-ethoxy-2-oxoethyl)-1H-benzo[d]imidazol-3-ium bromide at different
pH values
N
N
N
O O
Ag surface
Ag surface
Br
Fig. III.15.3 Molecule adsorption on silver surface
Conclusions The molecule is adsorbed on the silver surface via ester and nitrile groups.
3500 3000 2500 2000 1500 1000 500
1182
91710
161211
1431
1613
3075 29
60
967
1229
772
756
1554
42862
8
1362
2252
2957
1738
3019
3108
Abs
orpt
ion
Ram
an in
tens
ity
Wavenumbers (cm-1)
a
b
2252
3500 3000 2500 2000 1500 1000 500
225 9
1013
6 11
770
12081 3
5814
2514
2514
8 2
1358
1 425
1013
773
773
2920
2 259 16
13
292 2
101 3
1208
2 256
3065
3 065
2922
2949
306 5
1139
pH=12
pH=7
Ram
an in
tens
ity
Wavenumbers (cm-1)
pH=3
1 613

21
III.16 Study by infrared spectroscopy, Raman and SERS of 3-(2-ethoxy-2-
oxoethyl)-1-(3-ethoxy-3-oxopropyl)-1H-imidazol-3-ium bromide. Adsorption on the
silver surface.
Fig. III.16.1 Raman (a) and FT-IR (b) spectra of 3-(2-ethoxy-2-oxoethyl)-1-(3-ethoxy-3-oxopropyl)-1H-imidazol-3-ium bromide
Fig. III.16.2 SERS spectra of 3-(2-ethoxy-2-oxoethyl)-1-(3-ethoxy-3-oxopropyl)-1H-imidazol-3-ium bromide at different pH
values
Fig. III.16.3 Molecule adsorption on silver surface
Conclusions The molecule is adsorbed on the silver surface via ester groups.
3500 3000 2500 2000 1500 1000 500
1377
1030
2935
1020
1424
1567
762
939
576
2970
2981
1096
Abs
orpt
ion
Ram
an in
tens
ity
Wavenumbers (cm-1)
a
b
624
3500 3000 2500 2000 1500 1000 500
407
3 166
1 574
773
1090
56313
6113
11
1181
61416
49
1508
1191
5 5961
41283
7 69
1361
2 960
1 570 15081648
131 0
136 1
164 8
1408
1573
1508
772
141 8
2920
823
2922
614
102 3
1180
Ram
an in
tens
ity
Wavenumbers (cm-1)
pH=12
pH=7
pH=3
2922

22
III.17 Study by infrared spectroscopy, Raman and SERS of 1-(3-ethoxy-3-
oxopropyl)-3-(2-methoxy-2-oxoethyl)-1H-imidazol-3-ium bromide. Adsorption on the
silver surface.
Fig. III.17.1 Raman (a) and FT-IR (b)
spectra of 1-(3-ethoxy-3-oxopropyl)-3-(2-methoxy-2-oxoethyl)-1H-imidazol-3-ium
bromide
Fig. III.17.2 SERS spectra of 1-(3-ethoxy-3-oxopropyl)-3-(2-methoxy-2-oxoethyl)-1H-
imidazol-3-ium bromide at different pH values
N
N
O O
Ag surface
Ag surface
O O
Br
III.17.3 Molecule adsorption on silver surface
Conclusions The molecule is adsorbed on the silver surface via ester groups.
3500 3000 2500 2000 1500 1000 500
622
1096
767163
5
939
855
1024
575
Abs
orpt
ion
Ram
an in
tens
ity
Wavenumbers (cm-1)
a
b
156
7
3500 3000 2500 2000 1500 1000 500
2957
611
559
1649
1297
1361
1508
773
615
1421
1361
1307
1508
1573
1511
1648
2922
77215
7316
48
1180
2946
1421
614
Ram
an in
tens
ity
Wavenumbers (cm-1)
pH=3
pH=7
pH=12
2922

23
III.18 Study by infrared spectroscopy, Raman and SERS of 3-(2-ethoxy-2-
oxoethyl)-1-(3-methoxy-3-oxopropyl)-1H-imidazol-3-ium bromide. Adsorption on the
silver surface.
Fig. III.18.1 Raman (a) and FT-IR (b) spectra of 3-(2-ethoxy-2-oxoethyl)-1-(3-methoxy-3-
oxopropyl)-1H-imidazol-3-ium bromide
Fig. III.18.2 SERS spectra of 3-(2-ethoxy-2-oxoethyl)-1-(3-methoxy-3-oxopropyl)-1H-
imidazol-3-ium bromide at different pH values
N
N
O O
Ag surface
Ag surface
O O
Br
III.18.3 Molecule adsorption on silver surface
Conclusions The molecule is adsorbed on the silver surface via ester groups.
3500 3000 2500 2000 1500 1000 500
6 251 7
36
1 424
1023
1566
578
1021
144
0
843
1735
1348
29 3
629
57
841
7 02
626
7 61
1376
1636
1 108
406
936Abs
orpt
ion
Ram
an in
tens
ity
Wavenumbers (cm-1)
a
b8 7
0
3500 3000 2500 2000 1500 1000 500
163
5
558
292 2
156
7
1 418
3163
614
102
3
1097
1 508 13
61
772
141
8
316
5
1310
2922
1 570
1648
6 14
1 180
Ram
an in
tens
ity
Wavenumbers (cm-1)
pH=12
pH=7
pH=3

24
III.19 Study by infrared spectroscopy, Raman and SERS of 3-(2-methoxy-2-
oxoethyl)-1-(3-methoxy-3-oxopropyl)-1H-imidazol-3-ium bromide. Adsorption on the
silver surface.
Fig. III.19.1 Raman (a) and FT-IR (b) spectra of 3-(2-methoxy-2-oxoethyl)-1-(3-methoxy-3-oxopropyl)-1H-imidazol-3-ium
bromide
Fig. III.19.2 SERS spectra of 3-(2-methoxy-2-oxoethyl)-1-(3-methoxy-3-oxopropyl)-1H-
imidazol-3-ium bromide at different pH values
III.19.3 Molecule adsorption on silver surface
Conclusions
The molecule is adsorbed on the silver surface via ester groups.
3500 3000 2500 2000 1500 1000 500
902
770 62
4
845
1347
626
902
842
1034
142428
52
Abs
orpt
ion
Ram
an in
tens
ity
Wavenumbers (cm-1)
a
b
2957
3500 3000 2500 2000 1500 1000 500
927
614
7 72
1 180
1104
136 1
434
559
555
1570
2946
2 920
1 635
2 847
3163
2847
2845
2946
2922
1 30715
08 1 418
1023
3161
1422
1 125
1 648
Ram
an in
tens
ityWavenumbers (cm-1)
pH=12
pH=7
pH=3
156 7

25
Final conclusions
• In this thesis nineteen imidazole derivatives were synthesized and studied by infrared spectroscopy,
Raman and SERS.
• Twelve imidazole derivatives were evaluated and optimized by computational methods type a- initio
(HF) and DFT methods B3PW91/6-31G* and B3LYP/6-31G*.
• The theoretical vibrational modes were corrected according to the literature; for ab-inito method has
been applied a correction factor of 0.8953; for DFT methods (B3LYP and B3PW91) has been applied
a correction factor of 0.9614
• The theoretical data are consistent with the experimental values.
• The FT- IR spectra of the imidazole derivatives studied (with some exceptions) are clear and sharp.
• Raman spectra show a strong fluorescence. In some cases no useful information occurs. In other
cases, on the contrary, complete the FT -IR spectra.
• The adsorption mechanisms on classes of compounds in SERS spectra were elucidated. Imidazole
derivatives with amide or ester groups are strongly adsorbed on the particle surface of the colloidal
silver. The band corresponding to the vibration of C ═ O in amide and ester groups is shifted towards
lower wave numbers.
• The nitrile group of imidazole derivatives studied is involved in the adsorption process. Imidazole
derivatives containing only nitrile functional group can be adsorbed on the silver surface through the
electronic cloud of the imidazole nucleus.
• These results can provide a basis for building a database to allow rapid identification of imidazole
derivatives from various materials.
• The results of this study were published in two papers in ISI journals.

26
References (selective)
1. Buzgar, N., Buzatu, A., Apopei, A. I., Aștefanei, D., Topoleanu, F., Raman study of the brownish-yellow pigment from a Roman Basilica (Dobrogea, Romania - 4th -6th century A.D.) Analele Știintifice ale Universității "Al. I. Cuza" din Iași, Geologie, 2011. 57(2): p. 15-18.
2. Buzgar, N., Bodi, G., Buzatu, A., Apopei, I. A., Aștefanei, D., Raman and XRD studies of black pigment from Cucuteni ceramics. Analele Știintifice ale Universității "Al. I. Cuza" din Iași, Geologie, 2010. LVI (2).
3. Buzgar, N., Bodi, G., Aștefanei, D., Buzatu, A., Apopei, I. A., The Raman study of white, red and black pigments used in Cucuteni Neolithic painted ceramics. Analele Știintifice ale Universității "Al. I. Cuza" din Iași, Geologie, 2010. LVI (1).
4. Ells, R., et al., Arachidonic acid increases antifungal susceptibility of Candida albicans and Candida dubliniensis. Journal of Antimicrobial Chemotherapy, 2009. 63(1): p. 124-128.
5. Granovsky, A.A., Firefly version 7.1.G, www http://classic.chem.msu.su/gran/firefly/index.html.
6. Schmidt, M.W., et al., General Atomic and Molecular Electronic-Structure System. Journal of Computational Chemistry, 1993. 14(11): p. 1347-1363.
7. Becke, A.D., Density-Functional Exchange-Energy Approximation with Correct Asymptotic-Behavior. Physical Review A, 1988. 38(6): p. 3098-3100.
8. Perdew, J.P. and Y. Wang, Accurate and Simple Analytic Representation of the Electron-Gas Correlation-Energy. Physical Review B, 1992. 45(23): p. 13244-13249.
9. Becke, A.D., A New Mixing of Hartree-Fock and Local Density-Functional Theories. Journal of Chemical Physics, 1993. 98(2): p. 1372-1377.
10. Baia, M., Astilean, S., Iliescu, T., Raman and SERS Investigations of Pharmaceuticals. 2008: Springer.
11. Risca, M., Moldoveanu, C., Astefanei, D., Mangalagiu, I. I., Microwave Assisted Reactions of Imidazole Derivatives of Potential Practical Applications. Revista De Chimie, 2010. 61(3): p. 303-305.
12. Zbancioc, G., Bejan, V., Risca, M., Moldoveanu, C., Mangalagiu, I. I., Microwave Assisted Reactions of Some Azaheterocylic Compounds. Molecules, 2009. 14(1): p. 403-411.
13. Cao, P.G., R.A. Gu, and Z.Q. Tian, Surface-enhanced Raman spectroscopy studies on the interaction of imidazole with a silver electrode in acetonitrile solution. Journal of Physical Chemistry B, 2003. 107(3): p. 769-777.
14. Bukowska, J., A. Kudelski, and K. Jackowska, The Use of Surface Enhanced Raman-Scattering (Sers) to Probe the Interaction of Imidazole with the Silver Electrode Surface. Journal of Electroanalytical Chemistry, 1991. 309(1-2): p. 251-261.