Embed Size (px)
Citation preview

Study and Reports on the VAT Gap in the EU-28 Member States:
2019 Final Report
TAXUD/2015/CC/131
Client: Directorate General Taxation and Customs Union
CASE – Center for Social and Economic Research (Project leader)
Institute for Advanced Studies (Consortium leader)
In consortium with
CPB IFS
DIW IPP
DONDENA PWC
ETLA ISER
IEB
Warsaw, September 4, 2019

VAT Gap in the EU-28 Member States
page 2 of 79
IHS, Institute for Advanced Studies
Josefstädter Straße 39
1060 Vienna
Austria
Telephone: +43 599 91-0
Telefax: +43 599 91 555
Internet: www.ihs.ac.at
FWC No. TAXUD/2015/CC/131
Acknowledgements
This Report was written by a team of experts from CASE (Center for Social and Economic
Research, Warsaw) and IEB (University of Barcelona – Barcelona Institute of Economics),
directed by Grzegorz Poniatowski, and composed of Mikhail Bonch-Osmolovskiy, José María
Durán-Cabré, Alejandro Esteller-Moré, and Adam Śmietanka. The Project was coordinated by
Thomas Davoine (Institute for Advanced Studies, IHS).
We also acknowledge discussions with several officials of tax and statistical offices of the
Member States, who offered valuable information, comments, and suggestions. All
responsibility for the estimates and the interpretation in this Report remains with the
authors.
VAT Gap in the EU-28 Member States
page 3 of 79
Contents
List of Acronyms and Abbreviations ................................................................................................. 7
Executive Summary .......................................................................................................................... 8
Introduction ...................................................................................................................................... 9
I. Background: Economic and Policy Context in 2017 ............................................................... 10
a. Economic Conditions in the EU during 2017 ...................................................................... 10
b. VAT Regime Changes .......................................................................................................... 11
c. Sources of Change in VAT Revenue Components .............................................................. 13
II. The VAT Gap in 2017 .............................................................................................................. 15
III. Individual Country Results .................................................................................................. 20
IV. Policy Gap Measures for 2017 ............................................................................................ 51
V. Econometric Analysis of VAT Gap Determinants ................................................................... 54
a. Introduction: The Incentives of the Agents Involved ......................................................... 54
b. Variables to Explain Agents’ Incentives .............................................................................. 54
c. Empirical Application .......................................................................................................... 56
Annex A. Methodological Considerations ...................................................................................... 62
I. Source of Revisions of VAT Gap Estimates ......................................................................... 62
II. Decomposition of VAT Revenue ......................................................................................... 63
III. Data Sources and Estimation Method ............................................................................ 63
IV. Fast VAT Gap estimates .................................................................................................. 66
V. Derivation of the Policy Gap ............................................................................................... 66
Annex B. Statistical Appendix ......................................................................................................... 71
References ...................................................................................................................................... 78
VAT Gap in the EU-28 Member States
page 4 of 79
List of Figures
Figure 1.1. Change in VAT Revenue Components, 2017 over 2016 (%) ........................................ 15
Figure 2.1. Evolution of the VAT Gap in the EU, 2013-2018 .......................................................... 16
Figure 2.2. VAT Gap as a percent of the VTTL in EU-28 Member States, 2017 and 2016 ............. 17
Figure 2.3. Percentage Point Change in VAT Gap, 2017 over 2016 ............................................... 17
Figure 2.4. VAT Gap in EU Member States, 2013-2017 ................................................................. 18
Figure A1. Components of Ideal Revenue, VTTL, and VAT Collection ........................................... 70
VAT Gap in the EU-28 Member States
page 5 of 79
List of Tables
Table 1.1. Real and Nominal Growth in the EU-28 in 2017 (in national currencies [NAC]) ........... 11
Table 1.2. VAT Rate Structure as of 31 December 2016 and Changes during 2017 ...................... 12
Table 1.3. Change in VAT Revenue Components, 2017 over 2016 ................................................ 14
Table 3.1. Belgium: VAT Revenue, VTTL, Composition of VTTL, and VAT Gap, 2013-2017 (EUR
million) ............................................................................................................................................ 21
Table 3.2. Bulgaria: VAT Revenue, VTTL, Composition of VTTL, and VAT Gap, 2013-2017 (BGN
million) ............................................................................................................................................ 22
Table 3.3. Czechia: VAT Revenue, VTTL, Composition of VTTL, and VAT Gap, 2013-2017 (CZK
million) ............................................................................................................................................ 23
Table 3.4. Denmark: VAT Revenue, VTTL, Composition of VTTL, and VAT Gap, 2013-2017 (DKK
million) ............................................................................................................................................ 24
Table 3.5. Germany: VAT Revenue, VTTL, Composition of VTTL, and VAT Gap, 2013-2017 (EUR
million) ............................................................................................................................................ 25
Table 3.6. Estonia: VAT Revenue, VTTL, Composition of VTTL, and VAT Gap, 2013-2017 (EUR
million) ............................................................................................................................................ 26
Table 3.7. Ireland: VAT Revenue, VTTL, Composition of VTTL, and VAT Gap, 2013-2017 (EUR
million) ............................................................................................................................................ 27
Table 3.8. Greece: VAT Revenue, VTTL, Composition of VTTL, and VAT Gap, 2013-2017 (EUR
million) ............................................................................................................................................ 28
Table 3.9a. Spain: VAT Revenue, VTTL, Composition of VTTL, and VAT Gap, 2013-2017 (EUR
million) ............................................................................................................................................ 29
Table 3.9b. Spain: Alternative Estimates ........................................................................................ 30
Table 3.10. France: VAT Revenue, VTTL, Composition of VTTL, and VAT Gap, 2013-2017 (EUR
million) ............................................................................................................................................ 31
Table 3.11. Croatia: VAT Revenue, VTTL, Composition of VTTL, and VAT Gap, 2014-2017 (HRK
million) ............................................................................................................................................ 32
Table 3.12a. Italy: VAT Revenue, VTTL, Composition of VTTL, and VAT Gap, 2013-2017 (EUR
million) ............................................................................................................................................ 33
Table 3.12b. Italy: Alternative Estimates ........................................................................................ 34
Table 3.13. Cyprus: VAT Revenue, VTTL, Composition of VTTL, and VAT Gap, 2014-2017 (EUR
million) ............................................................................................................................................ 35
Table 3.14. Latvia: VAT Revenue VTTL, Composition of VTTL, and VAT Gap, 2013-2017 (EUR
million) ............................................................................................................................................ 36
Table 3.15. Lithuania: VAT Revenue, VTTL, Composition of VTTL, and VAT Gap, 2013-2017 (EUR
million) ............................................................................................................................................ 37
Table 3.16. Luxembourg: VAT Revenue, VTTL, Composition of VTTL, and VAT Gap, 2013-2017
(EUR million) ................................................................................................................................... 38
Table 3.17. Hungary: VAT Revenue, VTTL, Composition of VTTL, and VAT Gap, 2013-2017 (HUF
million) ............................................................................................................................................ 39
Table 3.18. Malta: VAT Revenue, VTTL, Composition of VTTL, and VAT Gap, 2013-2017 (EUR
million) ............................................................................................................................................ 40
VAT Gap in the EU-28 Member States
page 6 of 79
Table 3.19. Netherlands: VAT Revenue, VTTL, Composition of VTTL, and VAT Gap, 2013-2017
(EUR million) .................................................................................................................................. 41
Table 3.20. Austria: VAT Revenue, VTTL, Composition of VTTL, and VAT Gap, 2013-2017 (EUR
million) ........................................................................................................................................... 42
Table 3.21. Poland: VAT Revenue VTTL, Composition of VTTL, and VAT Gap, 2013-2017 (PLN
million) ........................................................................................................................................... 43
Table 3.22. Portugal: VAT Revenue, VTTL, Composition of VTTL, and VAT Gap, 2013-2017 (EUR
million) ........................................................................................................................................... 44
Table 3.23. Romania: VAT Revenue, VTTL, Composition of VTTL, and VAT Gap, 2013-2017 (RON
million) ........................................................................................................................................... 45
Table 3.24. Slovenia: VAT Revenue, VTTL, Composition of VTTL, and VAT Gap, 2013-2017 (EUR
million) ........................................................................................................................................... 46
Table 3.25. Slovakia: VAT Revenue, VTTL, Composition of VTTL, and VAT Gap, 2013-2017 (EUR
million) ........................................................................................................................................... 47
Table 3.26. Finland: VAT Revenue, VTTL, Composition of VTTL, and VAT Gap, 2012-2016 (EUR
million) ........................................................................................................................................... 48
Table 3.27. Sweden: VAT Revenue, VTTL, Composition of VTTL, and VAT Gap, 2013-2017 (SEK
million) ........................................................................................................................................... 49
Table 3.28. United Kingdom: VAT Revenue, VTTL, Composition of VTTL, and VAT Gap, 2013-2017
(GBP million) .................................................................................................................................. 50
Table 4.1. Policy Gap, Rate Gap, Exemption Gap, and Actionable Gaps ....................................... 53
Table 5.1. Descriptive Statistics and Data Sources ........................................................................ 57
Table 5.2. Estimation of the Determinants of VAT GAP. Fixed Effects Specification..................... 60
Table A1. Data Sources .................................................................................................................. 65
Table B1. VTTL (EUR million) .......................................................................................................... 71
Table B2. Household VAT Liability (EUR million) ........................................................................... 72
Table B3. Intermediate Consumption and Government VAT Liability (EUR million) ..................... 73
Table B4. GFCF VAT Liability (EUR million) ..................................................................................... 74
Table B5. VAT Revenues (EUR million) ........................................................................................... 75
Table B6. VAT Gap (EUR million) .................................................................................................... 76
Table B7. VAT Gap (percent of VTTL) ............................................................................................. 77
VAT Gap in the EU-28 Member States
page 7 of 79
List of Acronyms and Abbreviations
B2C Business-to-Consumer
CASE Center for Social and Economic Research (Warsaw)
COICOP Classification of Individual Consumption according to Purpose
CPA Statistical Classification of Products by Activity in accordance with Regulation (EC) No 451/2008 of the European Parliament and of the Council of 23 April 2008 establishing a new statistical classification of products by activity
EC European Commission
ESA European System of National and Regional Accounts
EU European Union
EU-28 Current Member States of the European Union
GDP Gross Domestic Product
GFCF Gross Fixed Capital Formation
HMRC Her Majesty’s Revenue and Excise
IC Intermediate Consumption
MOSS` Mini One Stop Shop
NPISH Non-Profit Institutions Serving Households
OECD Organisation for Economic Cooperation and Development
ORS Own Resource Submissions
o/w of which
RR Reduced Rate
SR Standard Rate
SUT Supply and Use Tables
TAXUD Taxation and Customs Union Directorate-General of the European Commission
VAT Value Added Tax
VTTL VAT Total Tax Liability
VR VAT Revenue

VAT Gap in the EU-28 Member States
page 8 of 79
Executive Summary
This Report has been prepared for the European Commission, DG TAXUD under contract
TAXUD/2017/DE/329, “Study and Reports on the VAT Gap in the EU-28 Member States” and
serves as a follow-up to the six reports published between 2013 and 2018.
This Study contains new estimates of the Value Added Tax (VAT) Gap for 2017, as well as updated
estimates for 2013-2016. As a novelty in this series of reports, so called “fast VAT Gap estimates”
are also presented the year immediately preceding the analysis, namely for 2018. In addition, the
study reports the results of the econometric analysis of VAT Gap determinants initiated and
initially reported in the 2018 Report (Poniatowski et al., 2018). It also scrutinises the Policy Gap in
2017 as well as the contribution that reduced rates and exemptions made to the theoretical VAT
revenue losses.
In 2017, growth in the European Union (EU) continued to accelerate with a combined real GDP
growth of 2.5 percent, providing a sound environment for an increase in VAT collections. As a
result, VAT revenue increased in all Member States (MS). An increase in the base was the main,
but not the only, source for growth. Increase in compliance contributed to an approximate 1.1%
increase in VAT revenue. In nominal terms, in 2017, the VAT Gap in EU-28 MS fell to EUR 137.5
billion, down from EUR 145.4 billion. In relative terms, the VAT Gap share of the VAT total tax
liability (VTTL) dropped to 11.2 percent in 2017 and is the lowest value in the analysed period of
2013-2017. Fast estimates for 2018 indicate that the downward trend will continue and that VAT
Gap will likely fall below EUR 130 billion in 2018.
Of the EU-28, the VAT Gap as percentage of the VTTL decreased in 25 countries and increased in
three. The biggest declines in the VAT Gap occurred in Malta, Poland, and Cyprus. The smallest
Gaps were observed in Cyprus (0.6 percent), Luxembourg (0.7 percent), and Sweden (1.5 percent).
The largest Gaps were registered in Romania (35.5 percent), Greece (33.6 percent), and Lithuania
(25.3 percent). Overall, half of EU-28 MS recorded a Gap above 10.1 percent (see Figure 2.2 and
Table 2.1).
The Policy Gaps and its components remained stable. The average Policy Gap level was 44.5
percent, out of which 9.6 percentage points are due to the application of various reduced and
super-reduced rates instead of standard rates (the Rate Gap). The countries with the most flat
levels of rates in the EU, according to the Rate Gap, are Denmark (0.8 percent) and Estonia (3
percent). On the other side of spectrum are Cyprus (29.6 percent), Malta (16.5 percent), and
Poland (14.6 percent). The Exemption Gap, or the average share of Ideal Revenue lost due to
various exemptions, is, on average, 35 percent in the EU, whereas the Actionable Policy Gap – a
combination of the Rate Gap and the Actionable Exemption Gap – is, on average, 13 percent of
the Notional Ideal Revenue.
The econometric analysis repeated after the 2017 Study confirmed the earlier results. We observe
that the dispersion of tax rates and unemployment rate have a positive impact on the VAT Gap.
Regarding the variables in hands of the administration, on the extended times series compared to
the previous year, our results suggest that the nature of the expenditure of the administration, in
particular IT expenditure, is more important that the amount of the overall resources.
VAT Gap in the EU-28 Member States
page 9 of 79
Introduction
This Report presents the findings of the 2019 “Study to quantify the VAT Gap in the EU Member
States”, which is already the sixth update following the Study originally conducted by Barbone et
al. in 2013.1
This Report contains new Value Added Tax (VAT) Gap estimates for 2017, as well as updated
estimates for 2013-2016. As a novelty in this series of reports, we use a simplified methodology
to forecast the VAT Gap for 2018. We also present the updated results of the econometric analysis
of VAT Gap determinants initiated and initially reported in the 2018 Report (Poniatowski et al.,
2018).
The VAT Gap, which is addressed in detail by this Report, is also referred to as the Compliance
Gap. It is understood as the difference between the expected and actual VAT revenues and
represents more than just fraud and evasion and their associated policy measures. The VAT Gap
also covers VAT lost due to, for example, insolvencies, bankruptcies, administrative errors, and tax
optimisation. It is defined as the difference between the amount of VAT collected and the VAT
Total Tax Liability (VTTL) – namely, the tax liability according to tax law. The VAT Gap can be
expressed in absolute or relative terms, commonly as a ratio of the VTTL or gross domestic product
(GDP).
In addition to the analysis of the Compliance Gap, this Report also examines the Policy Gap in 2017
as well as the contribution that reduced rates and exemptions made to the theoretical VAT
revenue losses.
The structure of this Report builds on the previous publications. Chapter I presents the main
economic and policy factors that affected Member States (MS) during the course of 2017. It also
includes a decomposition of the change in VAT revenues. The overall results are presented and
briefly described in Chapter II. Chapter III provides detailed results and outlines trends for
individual countries coupled with analytical insights. In Chapter IV, we examine the Policy Gap and
the contribution that VAT reduced rates and exemptions have made to this Gap. Chapter V
discusses the findings of the econometric analysis. Annex A contains methodological
considerations and Annex B provides statistical data and a set of comparative tables.
1 The first study of the VAT Gap in the EU was conducted by Reckon (2009); however, due to differences in methodology, it cannot be directly compared to these latter studies.

VAT Gap in the EU-28 Member States
page 10 of 79
I. Background: Economic and Policy Context in 2017
a. Economic Conditions in the EU during 2017
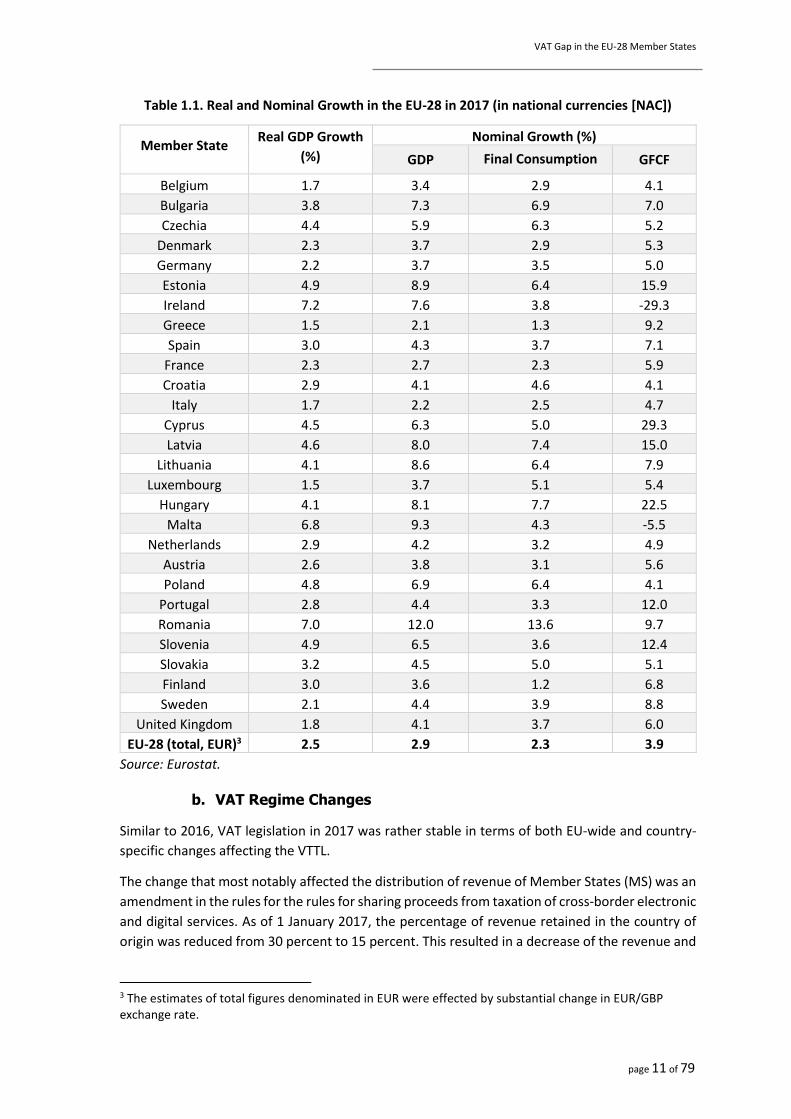
In 2017, growth in the European Union (EU) continued to accelerate, providing a sound
environment for an increase in VAT collections. More specifically, growth of the EU economy
amounted to 2.5 percent (a 0.5 percentage point increase compared to 2016) in real terms and
was record high in the post-crisis period. The highest GDP growth rates in 2017 were observed in
Ireland (7.2 percent), Romania (7 percent), and Malta (6.8 percent).
In nominal terms, GDP increased by 2.9 percent and consumer prices by 1.8 percent. GDP growth
was largely driven by final consumption. Final consumption, which is the core of the VAT base (68
percent of the VTTL in 2017), increased by 2.3 percent on average.
The change in gross fixed capital formation (GFCF) was volatile across countries and varied from
-29.3 percent in Ireland to 29.3 percent in Cyprus. However, the growth and volatility of GFCF was
largely driven by the private sector. The pace of government GFCF was slower than the overall
growth of GFCF and amounted to 2.5 percent.2
Due to the volatility and the frequent revisions of GFCF figures by Statistical Offices, GFCF is the
main source of VAT Gap revisions. Whenever new information on the actual investment figures of
exempt sectors becomes available, the estimates of VAT Gap are revised backwards.
2 Source: AMECO Database, European Commission, Directorate General for Economic and Financial Affairs, https://ec.europa.eu/economy_finance/ameco/user/serie/SelectSerie.cfm.
VAT Gap in the EU-28 Member States
page 11 of 79
Table 1.1. Real and Nominal Growth in the EU-28 in 2017 (in national currencies [NAC])
Member State Real GDP Growth
(%)
Nominal Growth (%)
GDP Final Consumption GFCF
Belgium 1.7 3.4 2.9 4.1
Bulgaria 3.8 7.3 6.9 7.0
Czechia 4.4 5.9 6.3 5.2
Denmark 2.3 3.7 2.9 5.3
Germany 2.2 3.7 3.5 5.0
Estonia 4.9 8.9 6.4 15.9
Ireland 7.2 7.6 3.8 -29.3
Greece 1.5 2.1 1.3 9.2
Spain 3.0 4.3 3.7 7.1
France 2.3 2.7 2.3 5.9
Croatia 2.9 4.1 4.6 4.1
Italy 1.7 2.2 2.5 4.7
Cyprus 4.5 6.3 5.0 29.3
Latvia 4.6 8.0 7.4 15.0
Lithuania 4.1 8.6 6.4 7.9
Luxembourg 1.5 3.7 5.1 5.4
Hungary 4.1 8.1 7.7 22.5
Malta 6.8 9.3 4.3 -5.5
Netherlands 2.9 4.2 3.2 4.9
Austria 2.6 3.8 3.1 5.6
Poland 4.8 6.9 6.4 4.1
Portugal 2.8 4.4 3.3 12.0
Romania 7.0 12.0 13.6 9.7
Slovenia 4.9 6.5 3.6 12.4
Slovakia 3.2 4.5 5.0 5.1
Finland 3.0 3.6 1.2 6.8
Sweden 2.1 4.4 3.9 8.8
United Kingdom 1.8 4.1 3.7 6.0
EU-28 (total, EUR)3 2.5 2.9 2.3 3.9
Source: Eurostat.
b. VAT Regime Changes
Similar to 2016, VAT legislation in 2017 was rather stable in terms of both EU-wide and country-
specific changes affecting the VTTL.
The change that most notably affected the distribution of revenue of Member States (MS) was an
amendment in the rules for the rules for sharing proceeds from taxation of cross-border electronic
and digital services. As of 1 January 2017, the percentage of revenue retained in the country of
origin was reduced from 30 percent to 15 percent. This resulted in a decrease of the revenue and
3 The estimates of total figures denominated in EUR were effected by substantial change in EUR/GBP exchange rate.
VAT Gap in the EU-28 Member States
page 12 of 79
VTTL for MS providing services to foreigners (i.e. Cyprus and Malta) and an increase in the VTTL
and revenue for the MS which are the destination of such services.
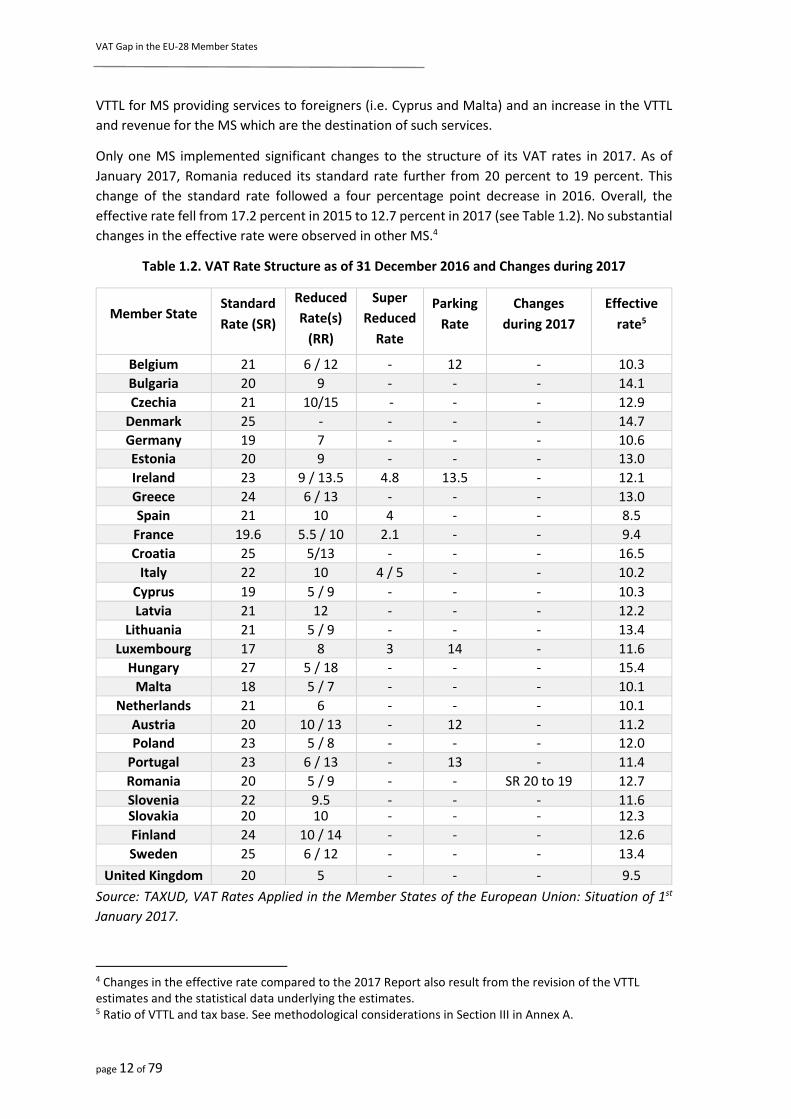
Only one MS implemented significant changes to the structure of its VAT rates in 2017. As of
January 2017, Romania reduced its standard rate further from 20 percent to 19 percent. This
change of the standard rate followed a four percentage point decrease in 2016. Overall, the
effective rate fell from 17.2 percent in 2015 to 12.7 percent in 2017 (see Table 1.2). No substantial
changes in the effective rate were observed in other MS.4
Table 1.2. VAT Rate Structure as of 31 December 2016 and Changes during 2017
Source: TAXUD, VAT Rates Applied in the Member States of the European Union: Situation of 1st
January 2017.
4 Changes in the effective rate compared to the 2017 Report also result from the revision of the VTTL estimates and the statistical data underlying the estimates. 5 Ratio of VTTL and tax base. See methodological considerations in Section III in Annex A.
Member State Standard
Rate (SR)
Reduced
Rate(s)
(RR)
Super
Reduced
Rate
Parking
Rate
Changes
during 2017
Effective
rate5
Belgium 21 6 / 12 - 12 - 10.3
Bulgaria 20 9 - - - 14.1
Czechia 21 10/15 - - - 12.9
Denmark 25 - - - - 14.7
Germany 19 7 - - - 10.6
Estonia 20 9 - - - 13.0
Ireland 23 9 / 13.5 4.8 13.5 - 12.1
Greece 24 6 / 13 - - - 13.0
Spain 21 10 4 - - 8.5
France 19.6 5.5 / 10 2.1 - - 9.4
Croatia 25 5/13 - - - 16.5
Italy 22 10 4 / 5 - - 10.2
Cyprus 19 5 / 9 - - - 10.3
Latvia 21 12 - - - 12.2
Lithuania 21 5 / 9 - - - 13.4
Luxembourg 17 8 3 14 - 11.6
Hungary 27 5 / 18 - - - 15.4
Malta 18 5 / 7 - - - 10.1
Netherlands 21 6 - - - 10.1
Austria 20 10 / 13 - 12 - 11.2
Poland 23 5 / 8 - - - 12.0
Portugal 23 6 / 13 - 13 - 11.4
Romania 20 5 / 9 - - SR 20 to 19 12.7
Slovenia 22 9.5 - - - 11.6 Slovakia 20 10 - - - 12.3
Finland 24 10 / 14 - - - 12.6
Sweden 25 6 / 12 - - - 13.4
United Kingdom 20 5 - - - 9.5
VAT Gap in the EU-28 Member States
page 13 of 79
c. Sources of Change in VAT Revenue Components
The value of the actual VAT revenue can be decomposed into components, which is helpful in
understanding the underlying sources of its evolution. Since revenue is a product of the VTTL and
the compliance ratio, VAT collection could be expressed as:
Actual Revenue = VTTL * Compliance Ratio,
where Compliance Ratio is: 1 - VAT Gap (%).
As the VTTL is a product of the base and the effective rate, the actual revenue could be further
decomposed and expressed as:
Actual Revenue = Net Base * Effective Rate * Compliance Ratio,
where Effective Rate is the ratio of the theoretical VTTL to the Net Base. The Net Base (which is
the sum of the final consumption and investment by households, non-profit institutions serving
households (NPISH), and government), in turn, is calculated as the difference between the Gross
Base, which includes VAT, and the VAT revenues actually collected.
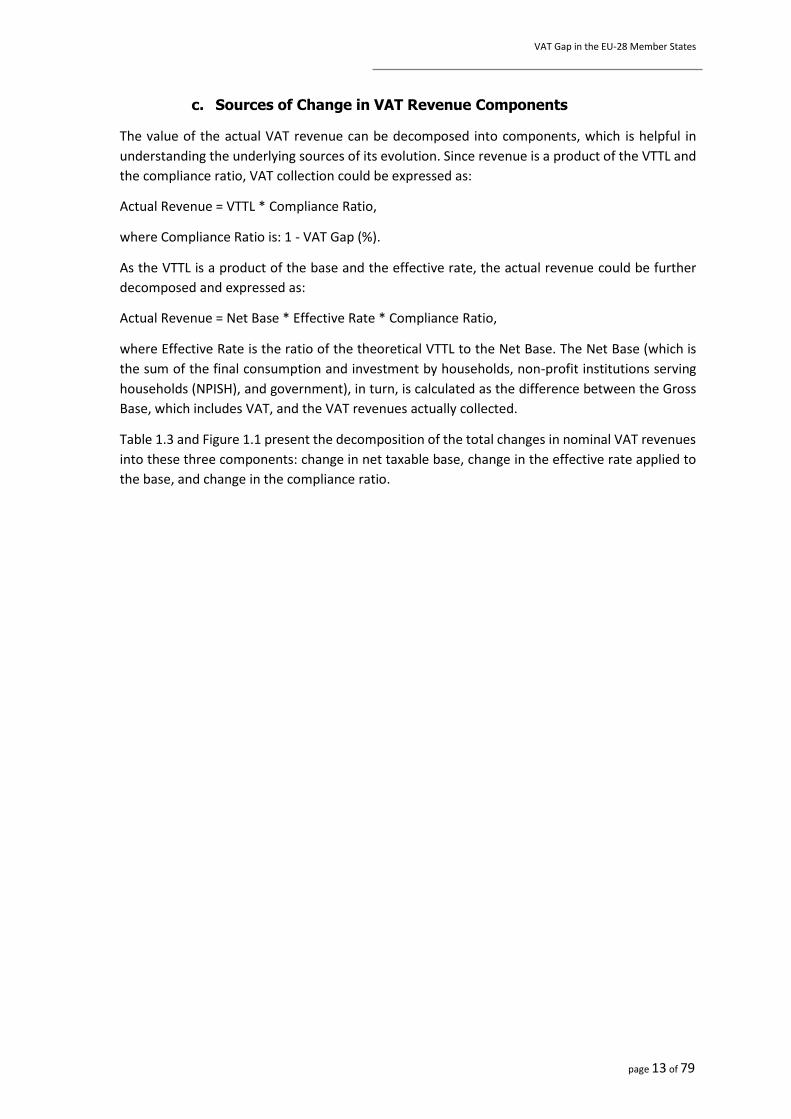
Table 1.3 and Figure 1.1 present the decomposition of the total changes in nominal VAT revenues
into these three components: change in net taxable base, change in the effective rate applied to
the base, and change in the compliance ratio.
VAT Gap in the EU-28 Member States
page 14 of 79
Table 1.3. Change in VAT Revenue Components, 2017 over 2016
Member State
Change in Revenue (%)
Change in the VTTL (%)
Change in
Compliance (%)
Change in Base (%)
Change in Effective Rate
(%)
Belgium 3.5% 3.5% 3.3% 0.2% 0.0%
Bulgaria 5.6% 5.4% 4.9% 0.4% 0.2%
Czechia 9.5% 6.6% 6.1% 0.4% 2.8%
Denmark 4.4% 3.5% 2.7% 0.8% 0.8%
Germany 3.6% 3.8% 3.7% 0.1% -0.2%
Estonia 8.8% 8.1% 7.8% 0.3% 0.7%
Ireland 3.5% 3.0% 4.0% -1.0% 0.5%
Greece 2.2% 6.1% 2.6% 3.4% -3.7%
Spain 4.8% 4.4% 4.4% 0.0% 0.4%
France 4.8% 2.5% 2.5% 0.0% 2.3%
Croatia 6.8% 5.5% 4.4% 1.1% 1.2%
Italy 5.4% 1.5% 2.1% -0.6% 3.8%
Cyprus 11.3% 6.4% 6.4% 0.0% 4.6%
Latvia 6.5% 8.9% 7.9% 0.9% -2.2%
Lithuania 9.4% 9.3% 6.2% 2.9% 0.1%
Luxembourg 1.0% -1.8% 6.2% -7.5% 2.8%
Hungary 9.9% 9.0% 10.4% -1.1% 0.8%
Malta 13.9% 5.2% 7.2% -1.9% 8.3%
Netherlands 4.3% 3.7% 3.5% 0.3% 0.5%
Austria 3.7% 3.6% 3.6% 0.0% 0.1%
Poland 14.9% 6.4% 6.0% 0.4% 8.0%
Portugal 6.6% 3.7% 5.2% -1.4% 2.8%
Romania 8.1% 7.0% 10.9% -3.5% 1.0%
Slovenia 4.9% 1.4% 3.9% -2.4% 3.4%
Slovakia 9.2% 5.7% 4.1% 1.5% 3.3%
Finland 3.6% 3.4% 2.1% 1.3% 0.2%
Sweden 5.0% 4.8% 4.2% 0.5% 0.2%
United Kingdom 5.8% 5.5% 4.0% 1.4% 2.9%
EU-28 (total, EUR)6
4.1% 2.9% 2.5% 0.4% 1.1%
Source: own calculations.
6 The estimates of total figures denominated in EUR were effected by substantial change in EUR/GBP exchange rate.
VAT Gap in the EU-28 Member States
page 15 of 79
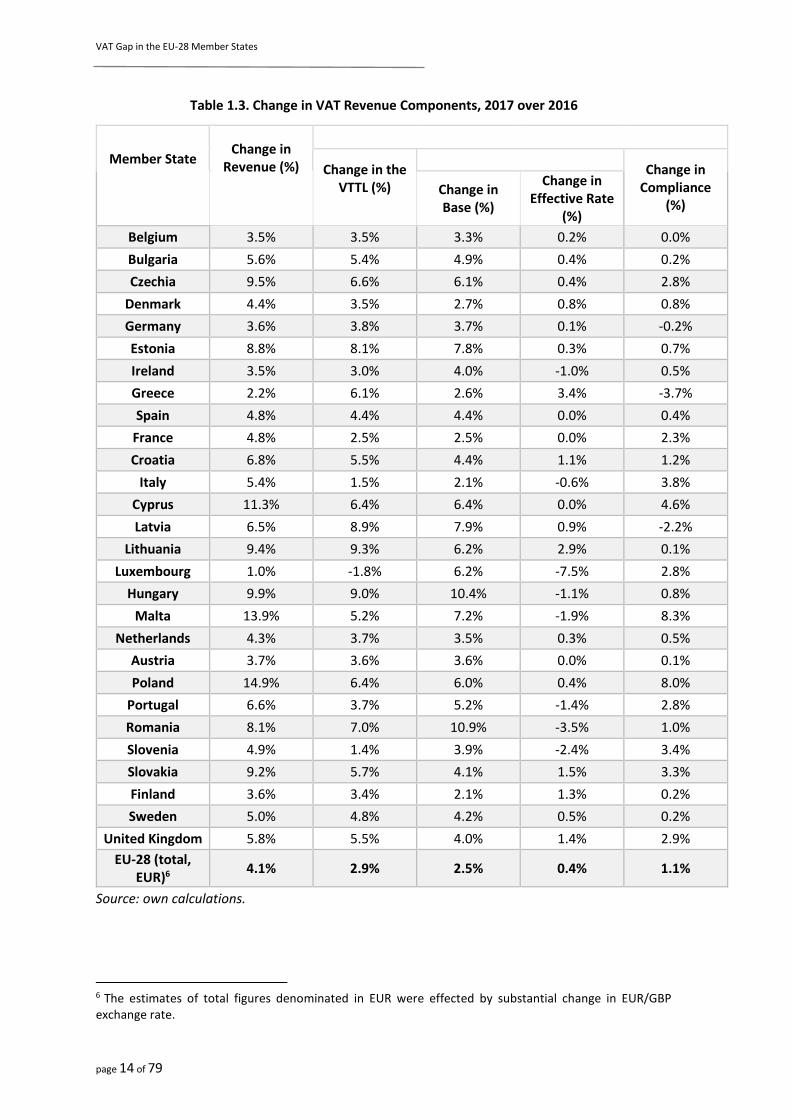
Figure 1.1. Change in VAT Revenue Components, 2017 over 2016 (%)
Source: own calculations.
The increase in the VTTL had the most significant impact on the revenue, contributing to an
approximate 2.8 percent growth. In addition, the increase in the VAT compliance led to a 1.2
percent growth in revenue. VTTL increase was driven mainly by the change of the base. The
effective rate remained nearly unchanged (0.3 percent increase).
II. The VAT Gap in 2017
The estimates of the VAT Gap presented in this section were derived using the same methodology
as in the previously cited VAT Gap Studies. The VAT Gap is defined as the difference between the
VTTL, sometimes also known as VAT total theoretical liability, and the amount of VAT actually
collected. We compute VTTL in a “top-down” “consumption-side” approach by deriving the
expected VAT liability from the observed national accounts data, such as supply and use tables
(SUT). For this reason, the methodology used in this Study relies on the availability and quality of
SUT data, which may vary from country to country.
The VAT liability is estimated for final household, government, and NPISH expenditures; non-
deductible VAT from intermediate consumption of exempt industries; and VAT from the GFCF of
exempt sectors. We also account for country-specific tax regulations, such as exemptions for small
business under the VAT thresholds (if applicable); non-deductible business expenditures on food,
drinks, and accommodation; and restrictions to deduct VAT on leased cars, among others. The
precise formula is given in Section III in Annex A.
The results presented in this report are not fully comparable with the results presented in the
earlier Reports, as each year some figures are revised backwards. The main source of the revisions
-10
-5
0
5
10
15
20
BE BG CZ DK DE EE IE EL ES FR HR IT CY LV LT LU HU MT NL AT PL PT RO SI SK FI SE UK
Effective rate VAT compliance Base

VAT Gap in the EU-28 Member States
page 16 of 79
are the updates of national accounts figures. In the course of our computations, some expenditure
and investment figures, which are not available for the most recent years, are estimated. Thus,
whenever actual national accounts data is published or new information on taxable investment
becomes available, VAT Gap estimates need to be revised. A detailed discussion on the sources of
the revisions is presented in Section I in Annex A.
In nominal terms, in 2017, the VTTL increased to EUR 1,223 billion (2.9 percent), whereas VAT
revenue amounted to EUR 1,086 billion (increase by 4.1 percent). As a result, the VAT Gap fell
from EUR 145.4 billion in 2016 to EUR 137.5 billion in 2017. In relative terms, the EU-wide Gap
dropped to 11.2 percent, down from 12.2 percent in 2016. Fast estimates indicate that the VAT
Gap will likely continue its downward trend and fall below EUR 130 billion and 10 percent of the
VTTL in 2018.
Figure 2.1. Evolution of the VAT Gap in the EU, 2013-2018
Source: own calculations.
The smallest Gaps were observed in Cyprus (0.6 percent), Luxembourg (0.7 percent), and Sweden
(1.5 percent). The largest Gaps were registered in Romania (35.5 percent), Greece (33.6 percent),
and Lithuania (25.3 percent). Overall, half of the EU-28 MS recorded a Gap above 10.1 percent
(see Figure 2.2 and Table 2.1). In nominal terms, the largest Gaps were recorded in Italy (EUR 33.6
billion), Germany (EUR 25 billion), and the United Kingdom (EUR 19.2 billion).
100
110
120
130
140
150
160
170
9%
10%
11%
12%
13%
14%
15%
16%
2013 2014 2015 2016 2017 2018*
% of VTTL (left axis) EUR billion (right axis)
VAT Gap in the EU-28 Member States
page 17 of 79
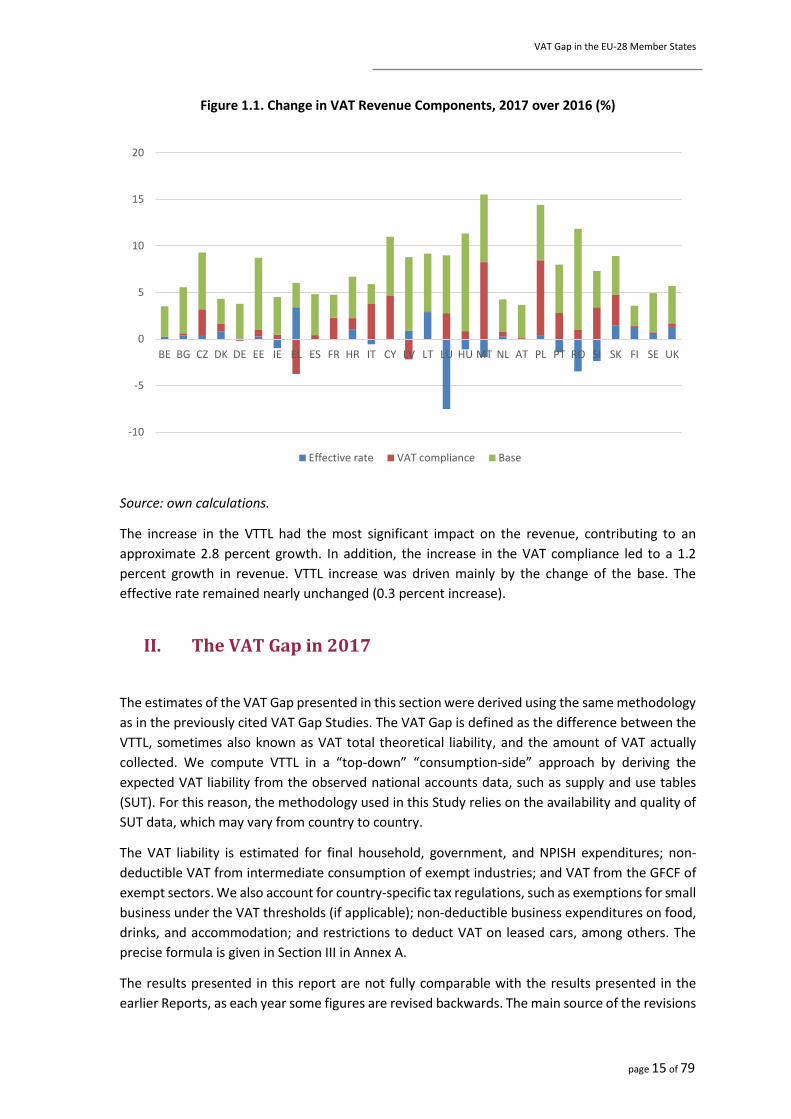
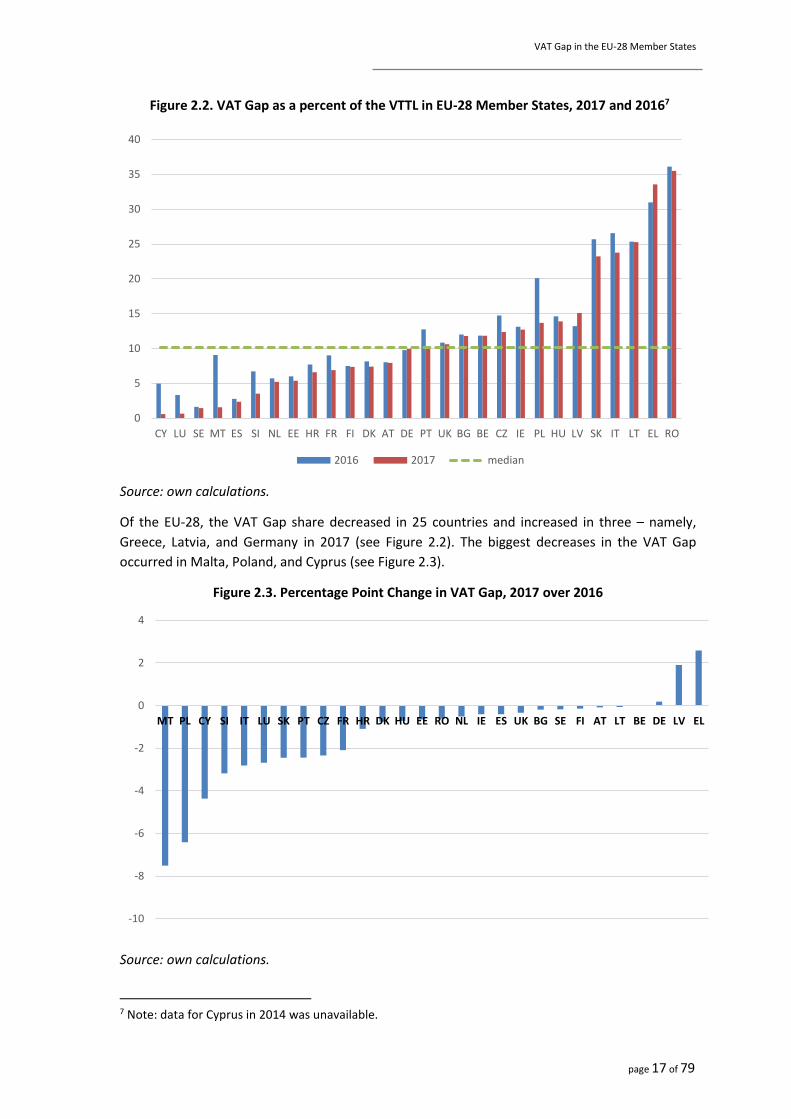
Figure 2.2. VAT Gap as a percent of the VTTL in EU-28 Member States, 2017 and 20167
Source: own calculations.
Of the EU-28, the VAT Gap share decreased in 25 countries and increased in three – namely,
Greece, Latvia, and Germany in 2017 (see Figure 2.2). The biggest decreases in the VAT Gap
occurred in Malta, Poland, and Cyprus (see Figure 2.3).
Figure 2.3. Percentage Point Change in VAT Gap, 2017 over 2016
Source: own calculations.
7 Note: data for Cyprus in 2014 was unavailable.
-10
-8
-6
-4
-2
0
2
4
MT PL CY SI IT LU SK PT CZ FR HR DK HU EE RO NL IE ES UK BG SE FI AT LT BE DE LV EL
0
5
10
15
20
25
30
35
40
CY LU SE MT ES SI NL EE HR FR FI DK AT DE PT UK BG BE CZ IE PL HU LV SK IT LT EL RO
2016 2017 median
page 18 of 79
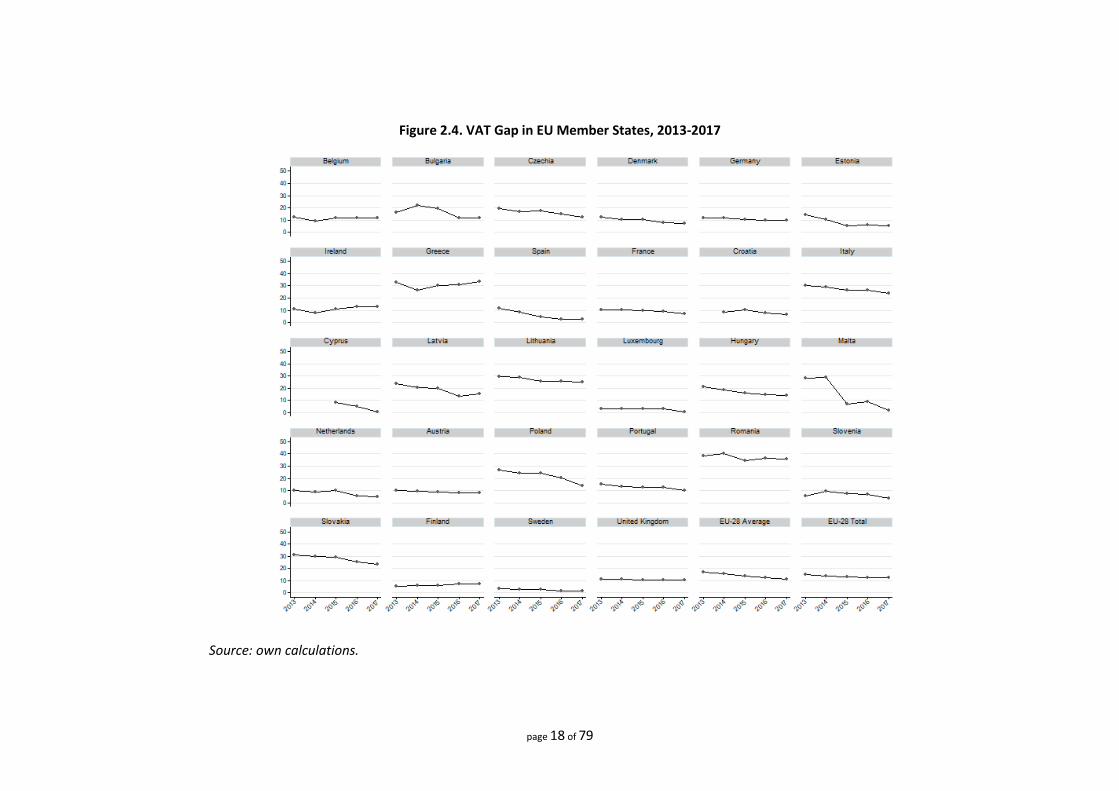
Figure 2.4. VAT Gap in EU Member States, 2013-2017
Source: own calculations.

page 19 of 79
Table 2.1. VAT Gap Estimates, 2016-2017 (EUR million)
2016 2017 VAT Gap
Change (pp)
MS Revenues VTTL VAT Gap
VAT Gap (%)
Revenues VTTL VAT Gap
VAT Gap (%)
BE 28750 32615 3865 11.9% 29763 33759 3996 11.8% 0.0
BG 4417 5020 603 12.0% 4664 5289 625 11.8% -0.2
CZ 13091 15355 2264 14.7% 14721 16803 2082 12.4% -2.3
DK 26735 29113 2378 8.2% 27931 30166 2235 7.4% -0.8
DE 218779 242441 23662 9.8% 226582 251598 25016 9.9% 0.2
EE 1974 2101 126 6.0% 2148 2270 122 5.4% -0.7
IE 12826 14767 1941 13.1% 13278 15215 1938 12.7% -0.4
EL 14333 20769 6436 31.0% 14642 22041 7399 33.6% 2.6
ES 70705 72729 2024 2.8% 74107 75913 1806 2.4% -0.4
FR 154490 169784 15294 9.0% 161932 173962 12030 6.9% -2.1
HR 6016 6519 503 7.7% 6485 6944 459 6.6% -1.1
IT 102378 139422 37044 26.6% 107901 141530 33629 23.8% -2.8
CY 1664 1750 87 5.0% 1851 1862 11 0.6% -4.4
LV 2032 2342 310 13.2% 2164 2549 385 15.1% 1.9
LT 3026 4054 1027 25.3% 3310 4429 1119 25.3% -0.1
LU 3436 3554 119 3.3% 3469 3492 23 0.7% -2.7
HU 10587 12400 1813 14.6% 11725 13617 1893 13.9% -0.7
MT 712 783 71 9.1% 810 823 13 1.6% -7.5
NL 47849 50755 2906 5.7% 49900 52644 2744 5.2% -0.5
AT 27301 29685 2384 8.0% 28304 30748 2444 7.9% -0.1
PL 30838 38599 7761 20.1% 36330 42094 5764 13.7% -6.4
PT 15767 18069 2301 12.7% 16809 18738 1929 10.3% -2.4
RO 10968 17169 6201 36.1% 11650 18063 6413 35.5% -0.6
SI 3316 3555 239 6.7% 3479 3606 128 3.5% -3.2
SK 5420 7294 1874 25.7% 5917 7708 1791 23.2% -2.5
FI 19694 21293 1599 7.5% 20404 22026 1622 7.4% -0.1
SE 42770 43484 714 1.6% 44115 44769 654 1.5% -0.2
UK 163344 183224 19880 10.9% 161509 180708 19199 10.6% -0.2
Total EU-28
1043219 1188647 145428 12.2% 1085899 1223369 137470 11.2% -1.0
Median 10.3% 10.1%

page 20 of 79
III. Individual Country Results
Country Page
Belgium 21
2 Bulgaria 22
Czechia 23
Denmark 24
Germany 25
Estonia 26
Ireland 27
Greece 28
Spain 29
France 31
Croatia 32
Italy 33
Cyprus 35
Latvia 36
Lithuania 37
Luxembourg 38
Hungary 39
Malta 40
Netherlands 41
Austria 42
Poland 43
Portugal 44
Romania 45
Slovenia 46
Slovakia 47
Finland 48
Sweden 49
United Kingdom 50
page 21 of 79
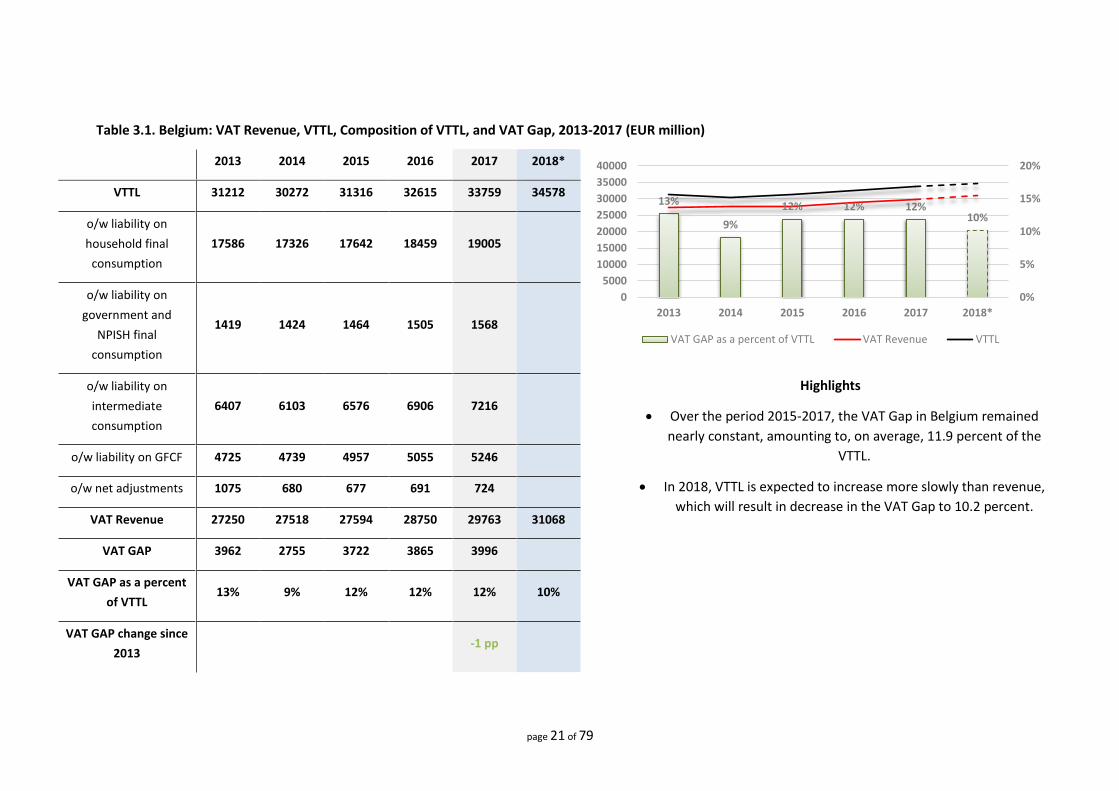
Table 3.1. Belgium: VAT Revenue, VTTL, Composition of VTTL, and VAT Gap, 2013-2017 (EUR million)
2013 2014 2015 2016 2017 2018*
VTTL 31212 30272 31316 32615 33759 34578
o/w liability on
household final
consumption
17586 17326 17642 18459 19005
o/w liability on
government and
NPISH final
consumption
1419 1424 1464 1505 1568
o/w liability on
intermediate
consumption
6407 6103 6576 6906 7216
Highlights
Over the period 2015-2017, the VAT Gap in Belgium remained
nearly constant, amounting to, on average, 11.9 percent of the
VTTL.
In 2018, VTTL is expected to increase more slowly than revenue,
which will result in decrease in the VAT Gap to 10.2 percent.
o/w liability on GFCF 4725 4739 4957 5055 5246
o/w net adjustments 1075 680 677 691 724
VAT Revenue 27250 27518 27594 28750 29763 31068
VAT GAP 3962 2755 3722 3865 3996
VAT GAP as a percent
of VTTL 13% 9% 12% 12% 12% 10%
VAT GAP change since
2013 -1 pp
13%
9%
12% 12% 12%10%
0%
5%
10%
15%
20%
0
5000
10000
15000
20000
25000
30000
35000
40000
2013 2014 2015 2016 2017 2018*
VAT GAP as a percent of VTTL VAT Revenue VTTL
page 22 of 79
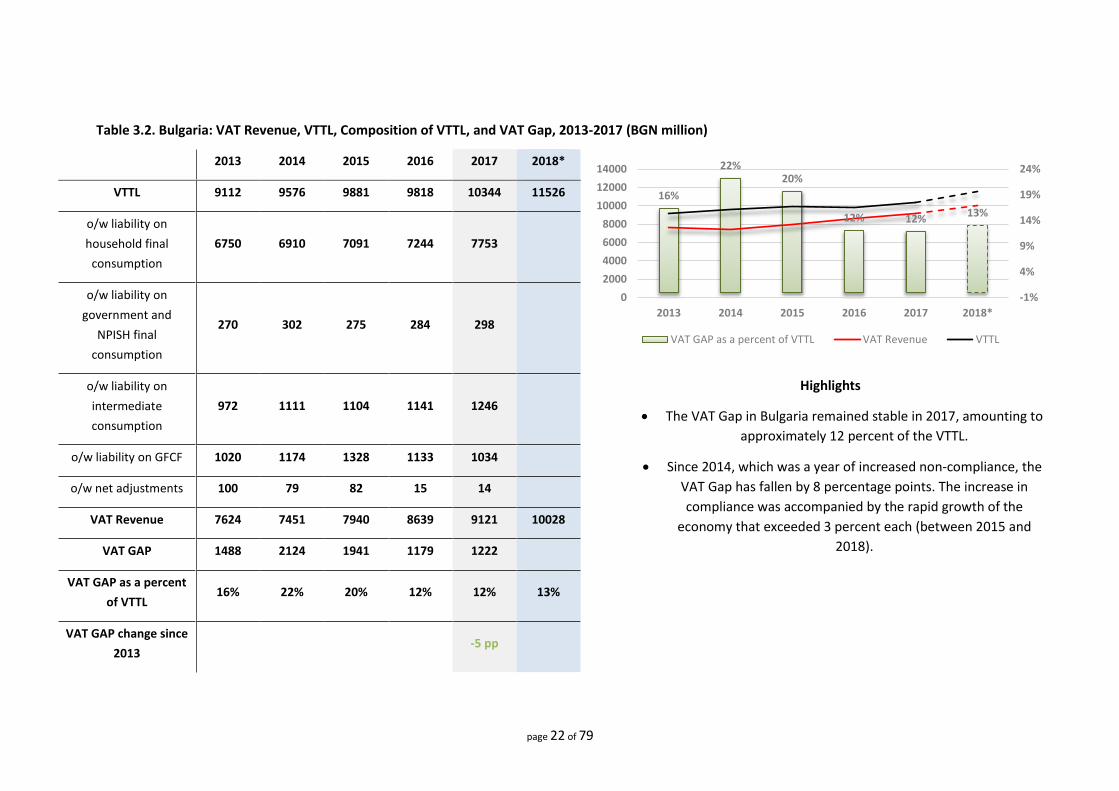
Table 3.2. Bulgaria: VAT Revenue, VTTL, Composition of VTTL, and VAT Gap, 2013-2017 (BGN million)
2013 2014 2015 2016 2017 2018*
VTTL 9112 9576 9881 9818 10344 11526
o/w liability on
household final
consumption
6750 6910 7091 7244 7753
o/w liability on
government and
NPISH final
consumption
270 302 275 284 298
o/w liability on
intermediate
consumption
972 1111 1104 1141 1246
Highlights
The VAT Gap in Bulgaria remained stable in 2017, amounting to
approximately 12 percent of the VTTL.
Since 2014, which was a year of increased non-compliance, the
VAT Gap has fallen by 8 percentage points. The increase in
compliance was accompanied by the rapid growth of the
economy that exceeded 3 percent each (between 2015 and
2018).
o/w liability on GFCF 1020 1174 1328 1133 1034
o/w net adjustments 100 79 82 15 14
VAT Revenue 7624 7451 7940 8639 9121 10028
VAT GAP 1488 2124 1941 1179 1222
VAT GAP as a percent
of VTTL 16% 22% 20% 12% 12% 13%
VAT GAP change since
2013 -5 pp
16%
22%20%
12% 12%13%
-1%
4%
9%
14%
19%
24%
0
2000
4000
6000
8000
10000
12000
14000
2013 2014 2015 2016 2017 2018*
VAT GAP as a percent of VTTL VAT Revenue VTTL
page 23 of 79
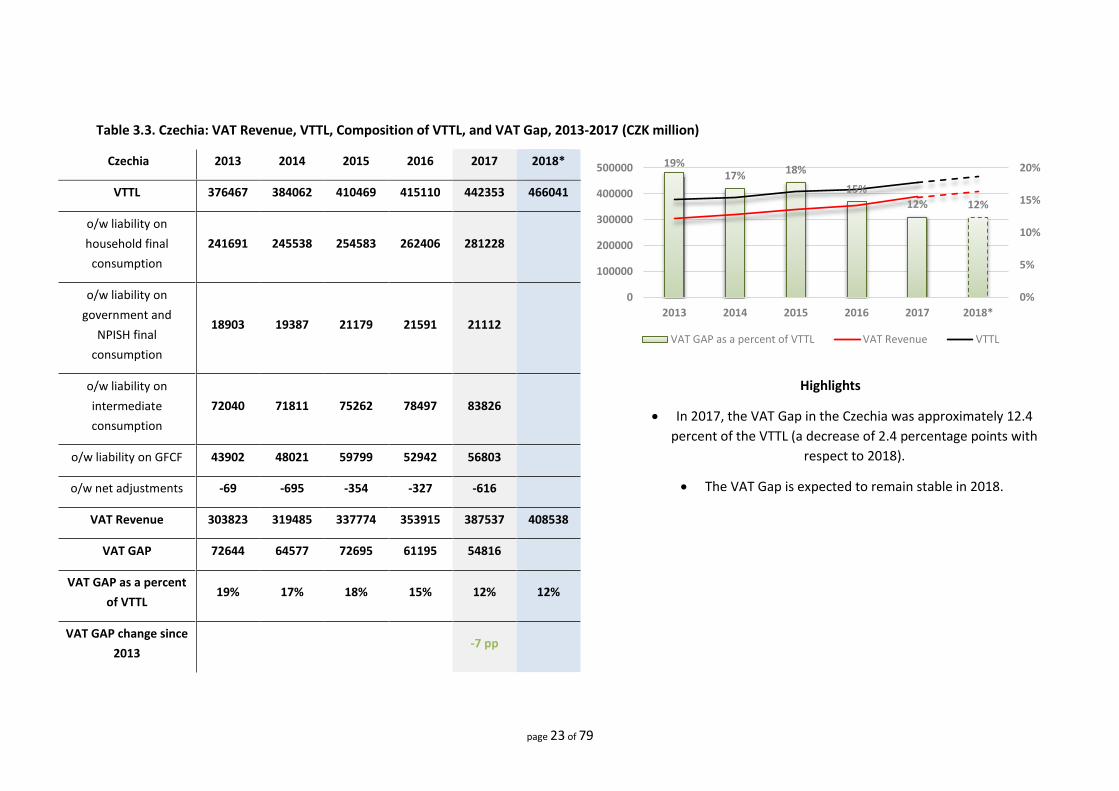
Table 3.3. Czechia: VAT Revenue, VTTL, Composition of VTTL, and VAT Gap, 2013-2017 (CZK million)
Czechia 2013 2014 2015 2016 2017 2018*
VTTL 376467 384062 410469 415110 442353 466041
o/w liability on
household final
consumption
241691 245538 254583 262406 281228
o/w liability on
government and
NPISH final
consumption
18903 19387 21179 21591 21112
o/w liability on
intermediate
consumption
72040 71811 75262 78497 83826
Highlights
In 2017, the VAT Gap in the Czechia was approximately 12.4
percent of the VTTL (a decrease of 2.4 percentage points with
respect to 2018).
The VAT Gap is expected to remain stable in 2018.
o/w liability on GFCF 43902 48021 59799 52942 56803
o/w net adjustments -69 -695 -354 -327 -616
VAT Revenue 303823 319485 337774 353915 387537 408538
VAT GAP 72644 64577 72695 61195 54816
VAT GAP as a percent
of VTTL 19% 17% 18% 15% 12% 12%
VAT GAP change since
2013 -7 pp
19%17% 18%
15%
12% 12%
0%
5%
10%
15%
20%
0
100000
200000
300000
400000
500000
2013 2014 2015 2016 2017 2018*
VAT GAP as a percent of VTTL VAT Revenue VTTL
page 24 of 79
Table 3.4. Denmark: VAT Revenue, VTTL, Composition of VTTL, and VAT Gap, 2013-2017 (DKK million)
2013 2014 2015 2016 2017 2018*
VTTL 206490 208401 213396 216753 224395 230778
o/w liability on
household final
consumption
119265 120503 123843 127509 131791
o/w liability on
government and
NPISH final
consumption
5222 5283 5395 5473 5564
o/w liability on
intermediate
consumption
52897 52826 53321 51209 52878
Highlights
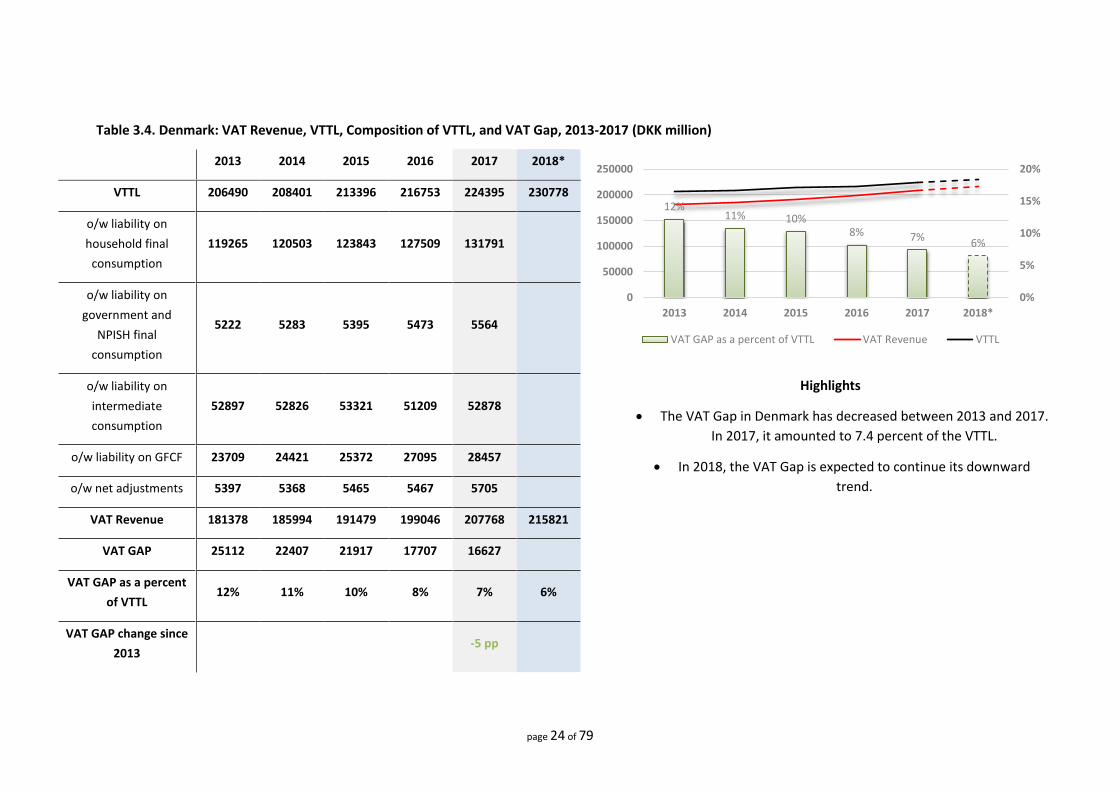
The VAT Gap in Denmark has decreased between 2013 and 2017.
In 2017, it amounted to 7.4 percent of the VTTL.
In 2018, the VAT Gap is expected to continue its downward
trend.
o/w liability on GFCF 23709 24421 25372 27095 28457
o/w net adjustments 5397 5368 5465 5467 5705
VAT Revenue 181378 185994 191479 199046 207768 215821
VAT GAP 25112 22407 21917 17707 16627
VAT GAP as a percent
of VTTL 12% 11% 10% 8% 7% 6%
VAT GAP change since
2013 -5 pp
12%11% 10%
8% 7% 6%
0%
5%
10%
15%
20%
0
50000
100000
150000
200000
250000
2013 2014 2015 2016 2017 2018*
VAT GAP as a percent of VTTL VAT Revenue VTTL

page 25 of 79
Table 3.5. Germany: VAT Revenue, VTTL, Composition of VTTL, and VAT Gap, 2013-2017 (EUR million)
2013 2014 2015 2016 2017 2018*
VTTL 223018 229624 235841 242441 251598 259231
o/w liability on
household final
consumption
139672 142430 145749 148921 153903
o/w liability on
government and
NPISH final
consumption
5896 6207 6530 6778 7006
o/w liability on
intermediate
consumption
39982 42450 44295 45505 47382
Highlights
The VAT Gap in Germany amounted to approximately 9.9
percent of the VTTL in 2017.
Between 2013 and 2017, the Gap decreased by approximately
0.4 percentage points each year and is expected to decrease
further in 2018.
o/w liability on GFCF 36084 37176 37843 39792 41794
o/w net adjustments 1384 1360 1424 1446 1513
VAT Revenue 197005 203081 211616 218779 226582 235130
VAT GAP 26013 26543 24225 23662 25016
VAT GAP as a percent
of VTTL 12% 12% 10% 10% 10% 9%
VAT GAP change since
2013 -2 pp
12% 12%10% 10% 10% 9%
0%
5%
10%
15%
20%
0
50000
100000
150000
200000
250000
300000
2013 2014 2015 2016 2017 2018*
VAT GAP as a percent of VTTL VAT Revenue VTTL
page 26 of 79
Table 3.6. Estonia: VAT Revenue, VTTL, Composition of VTTL, and VAT Gap, 2013-2017 (EUR million)
2013 2014 2015 2016 2017 2018*
VTTL 1814 1911 1985 2101 2270 2446
o/w liability on
household final
consumption
1273 1338 1374 1441 1532
o/w liability on
government and
NPISH final
consumption
26 34 35 61 66
o/w liability on
intermediate
consumption
227 232 244 262 280
Highlights
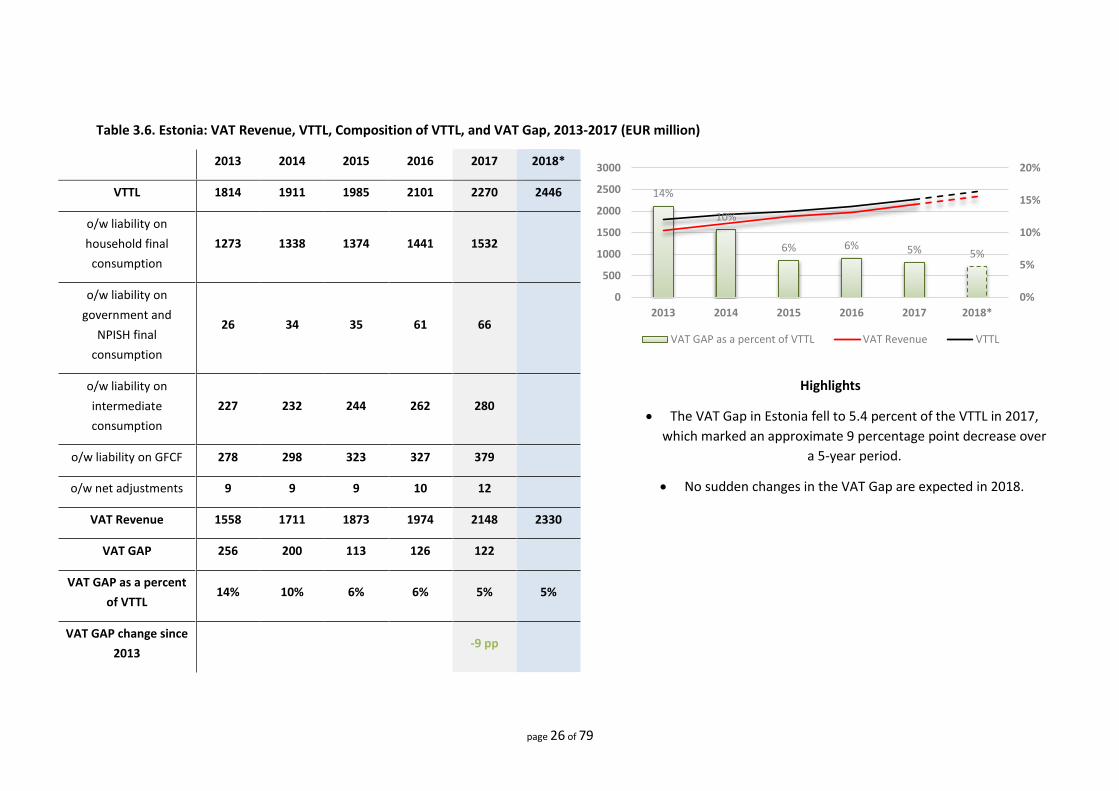
The VAT Gap in Estonia fell to 5.4 percent of the VTTL in 2017,
which marked an approximate 9 percentage point decrease over
a 5-year period.
No sudden changes in the VAT Gap are expected in 2018.
o/w liability on GFCF 278 298 323 327 379
o/w net adjustments 9 9 9 10 12
VAT Revenue 1558 1711 1873 1974 2148 2330
VAT GAP 256 200 113 126 122
VAT GAP as a percent
of VTTL 14% 10% 6% 6% 5% 5%
VAT GAP change since
2013 -9 pp
14%
10%
6% 6% 5% 5%
0%
5%
10%
15%
20%
0
500
1000
1500
2000
2500
3000
2013 2014 2015 2016 2017 2018*
VAT GAP as a percent of VTTL VAT Revenue VTTL
page 27 of 79
Table 3.7. Ireland: VAT Revenue, VTTL, Composition of VTTL, and VAT Gap, 2013-2017 (EUR million)
2013 2014 2015 2016 2017 2018*
VTTL 11668 12467 13420 14767 15215 15846
o/w liability on
household final
consumption
7243 7471 7842 8378 8588
o/w liability on
government and
NPISH final
consumption
181 153 164 170 174
o/w liability on
intermediate
consumption
3054 3236 3591 3982 4155
Highlights
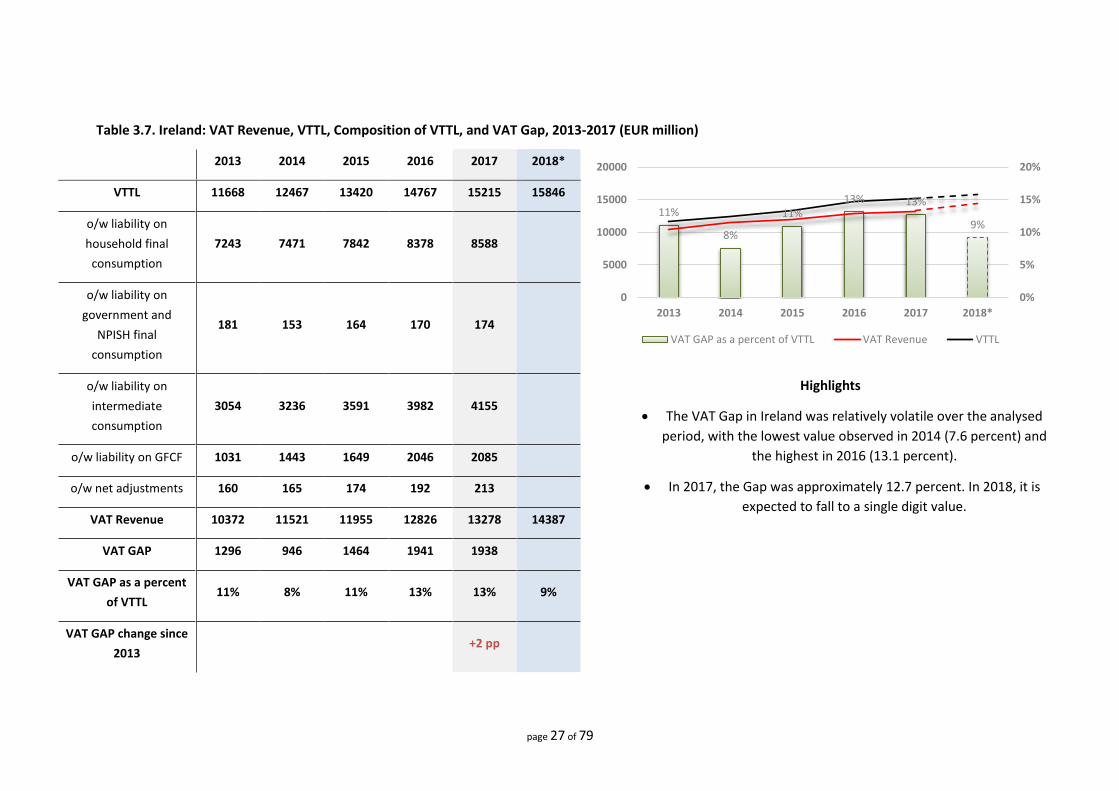
The VAT Gap in Ireland was relatively volatile over the analysed
period, with the lowest value observed in 2014 (7.6 percent) and
the highest in 2016 (13.1 percent).
In 2017, the Gap was approximately 12.7 percent. In 2018, it is
expected to fall to a single digit value.
o/w liability on GFCF 1031 1443 1649 2046 2085
o/w net adjustments 160 165 174 192 213
VAT Revenue 10372 11521 11955 12826 13278 14387
VAT GAP 1296 946 1464 1941 1938
VAT GAP as a percent
of VTTL 11% 8% 11% 13% 13% 9%
VAT GAP change since
2013 +2 pp
11%
8%
11%13% 13%
9%
0%
5%
10%
15%
20%
0
5000
10000
15000
20000
2013 2014 2015 2016 2017 2018*
VAT GAP as a percent of VTTL VAT Revenue VTTL

page 28 of 79
Table 3.8. Greece: VAT Revenue, VTTL, Composition of VTTL, and VAT Gap, 2013-2017 (EUR million)
2013 2014 2015 2016 2017 2018*
VTTL 18807 17287 18545 20769 22041 22310
o/w liability on
household final
consumption
13498 12750 13695 15785 16486
o/w liability on
government and
NPISH final
consumption
582 424 603 608 637
o/w liability on
intermediate
consumption
1769 1759 1858 2029 2137
Highlights
In 2017, the VAT Gap was 33.6 percent, which was a record high
in the 2013-2017 period.
The increase in the VTTL in 2017 was largely driven by the
increase in GFCF. As more detailed information on the structure
of GFCF in 2017 becomes available, the VAT Gap for 2017 may be
subject to revisions.
In 2018, the Gap is expected to fall by approximately 3
percentage points.
o/w liability on GFCF 2691 2114 2143 2067 2489
o/w net adjustments 267 239 246 281 292
VAT Revenue 12593 12676 12885 14333 14642 15288
VAT GAP 6214 4611 5660 6436 7399
VAT GAP as a percent
of VTTL 33% 27% 31% 31% 34% 31%
VAT GAP change since
2013 +1 pp
33%
27%31% 31%
34% 31%
0%
5%
10%
15%
20%
25%
30%
35%
0
5000
10000
15000
20000
25000
2013 2014 2015 2016 2017 2018*
VAT GAP as a percent of VTTL VAT Revenue VTTL
page 29 of 79
Table 3.9a. Spain: VAT Revenue, VTTL, Composition of VTTL, and VAT Gap, 2013-2017 (EUR million)
2013 2014 2015 2016 2017
VTTL 69100 69543 71810 72729 75913
o/w liability on
household final
consumption
50150 50920 52864 53873 56165
o/w liability on
government and
NPISH final
consumption
2387 2413 2433 2473 2536
o/w liability on
intermediate
consumption
8818 8525 8451 8710 8834
Highlights
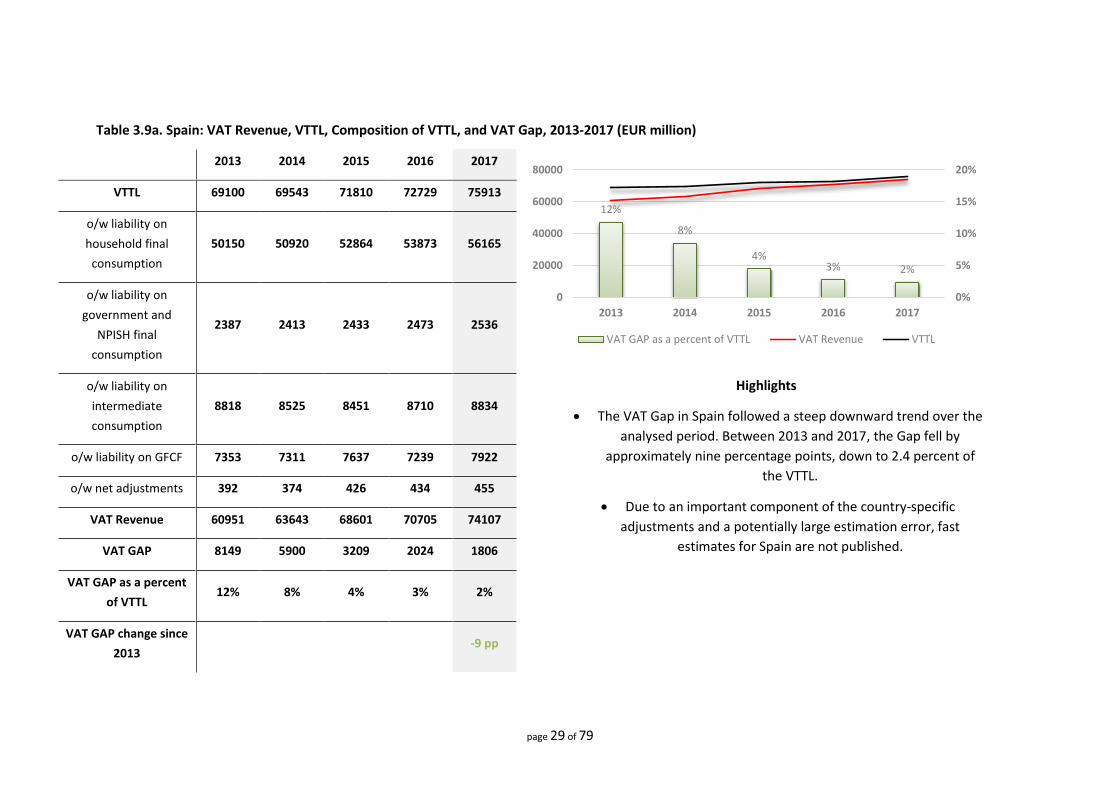
The VAT Gap in Spain followed a steep downward trend over the
analysed period. Between 2013 and 2017, the Gap fell by
approximately nine percentage points, down to 2.4 percent of
the VTTL.
Due to an important component of the country-specific
adjustments and a potentially large estimation error, fast
estimates for Spain are not published.
o/w liability on GFCF 7353 7311 7637 7239 7922
o/w net adjustments 392 374 426 434 455
VAT Revenue 60951 63643 68601 70705 74107
VAT GAP 8149 5900 3209 2024 1806
VAT GAP as a percent
of VTTL 12% 8% 4% 3% 2%
VAT GAP change since
2013 -9 pp
12%
8%
4%3% 2%
0%
5%
10%
15%
20%
0
20000
40000
60000
80000
2013 2014 2015 2016 2017
VAT GAP as a percent of VTTL VAT Revenue VTTL

page 30 of 79
Table 3.9b. Spain: Alternative Estimates
Spain 2013 2014 2015 2016 2017
VAT Gap based on
alternative data 4483 2756 1922 815 -1085
VAT Gap based on
alternative data, as a
percent of VTTL
7% 4% 3% 1% -1%
Note: Adjusting revenues for the continuing reduction in the stock of claims and adjusting the VTTL for the difference between national accounting and tax
conventions in the construction sector based on the data received from Spanish Tax Authorities led to a downward revision of the VAT Gap for the entire period
2013-2017.

page 31 of 79
Table 3.10. France: VAT Revenue, VTTL, Composition of VTTL, and VAT Gap, 2013-2017 (EUR million)
2013 2014 2015 2016 2017 2018*
VTTL 160630 165520 167521 169784 173962 177480
o/w liability on
household final
consumption
94591 98441 98826 100515 102158
o/w liability on
government and
NPISH final
consumption
1426 1606 1631 1656 1696
o/w liability on
intermediate
consumption
27867 27176 30159 30060 30571
Highlights
The VAT Gap in France followed a downward trend over the
period 2013-2017. In 2017, it fell to 6.9 percent and is expected
to decrease further in 2018.
Thanks to the inclusion of more detailed information on
household consumption structure, the estimates were revised
downwards.
o/w liability on GFCF 31814 32852 31667 32356 34300
o/w net adjustments 4932 5445 5238 5198 5237
VAT Revenue 144490 148454 151680 154490 161932 168849
VAT GAP 16140 17066 15841 15294 12030
VAT GAP as a percent
of VTTL 10% 10% 9% 9% 7% 5%
VAT GAP change since
2013 -3 pp
10% 10% 9% 9%7%
5%
0%
5%
10%
15%
20%
0
50000
100000
150000
200000
2013 2014 2015 2016 2017 2018*
VAT GAP as a percent of VTTL VAT Revenue VTTL

page 32 of 79
Table 3.11. Croatia: VAT Revenue, VTTL, Composition of VTTL, and VAT Gap, 2014-2017 (HRK million)
2014 2015 2016 2017 2018*
VTTL 45493 48187 49110 51831 54094
o/w liability on
household final
consumption
33517 34679 35424 37368
o/w liability on
government and
NPISH final
consumption
1596 1615 1646 1886
o/w liability on
intermediate
consumption
5641 6722 7112 7488
Highlights
The VAT Gap in Croatia in 2017 was approximately 6.6 percent,
which was a 1.1 percentage point decrease from 2016. In 2018, it
is expected to follow downward trend.
Croatia substantially revised its national accounts figures in the
course of 2018. As a result, the Gap was revised upwards by
nearly 7 percentage points.
o/w liability on GFCF 4485 4508 4694 4871
o/w net adjustments 254 663 233 218
VAT Revenue 41647 43322 45322 48402 51709
VAT GAP 3846 4865 3788 3429
VAT GAP as a percent
of VTTL 8% 10% 8% 7% 4%
VAT GAP change since
2014 -2 pp
8%10%
8%7%
4%
0%
5%
10%
15%
20%
0
10000
20000
30000
40000
50000
60000
2014 2015 2016 2017 2018*
VAT GAP as a percent of VTTL VAT Revenue VTTL
page 33 of 79
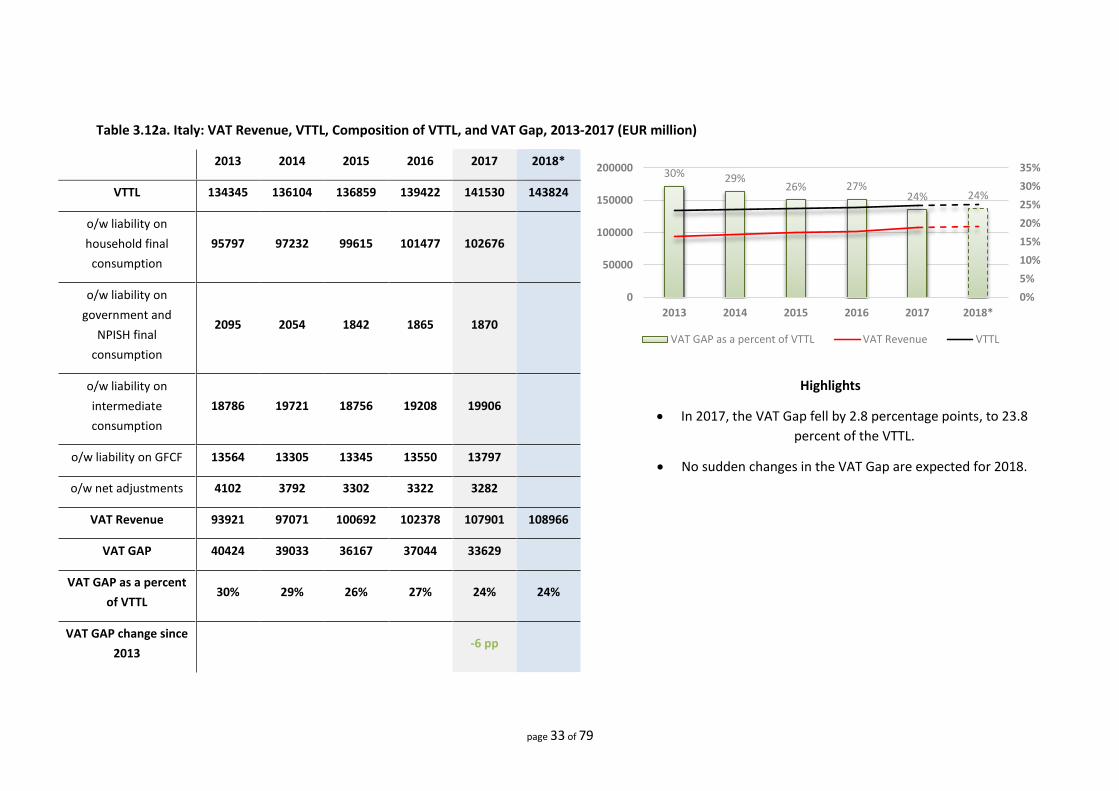
Table 3.12a. Italy: VAT Revenue, VTTL, Composition of VTTL, and VAT Gap, 2013-2017 (EUR million)
2013 2014 2015 2016 2017 2018*
VTTL 134345 136104 136859 139422 141530 143824
o/w liability on
household final
consumption
95797 97232 99615 101477 102676
o/w liability on
government and
NPISH final
consumption
2095 2054 1842 1865 1870
o/w liability on
intermediate
consumption
18786 19721 18756 19208 19906
Highlights
In 2017, the VAT Gap fell by 2.8 percentage points, to 23.8
percent of the VTTL.
No sudden changes in the VAT Gap are expected for 2018. o/w liability on GFCF 13564 13305 13345 13550 13797
o/w net adjustments 4102 3792 3302 3322 3282
VAT Revenue 93921 97071 100692 102378 107901 108966
VAT GAP 40424 39033 36167 37044 33629
VAT GAP as a percent
of VTTL 30% 29% 26% 27% 24% 24%
VAT GAP change since
2013 -6 pp
30% 29%26% 27%
24% 24%
0%
5%
10%
15%
20%
25%
30%
35%
0
50000
100000
150000
200000
2013 2014 2015 2016 2017 2018*
VAT GAP as a percent of VTTL VAT Revenue VTTL
page 34 of 79
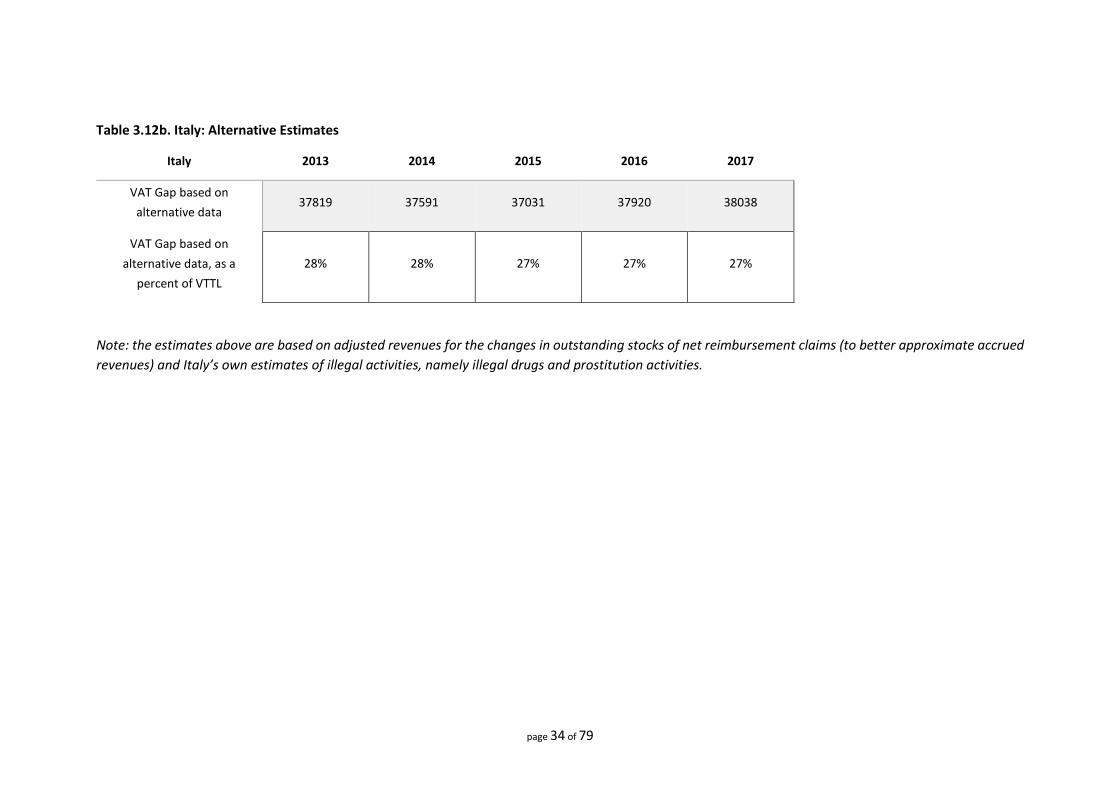
Table 3.12b. Italy: Alternative Estimates
Italy 2013 2014 2015 2016 2017
VAT Gap based on
alternative data 37819 37591 37031 37920 38038
VAT Gap based on
alternative data, as a
percent of VTTL
28% 28% 27% 27% 27%
Note: the estimates above are based on adjusted revenues for the changes in outstanding stocks of net reimbursement claims (to better approximate accrued
revenues) and Italy’s own estimates of illegal activities, namely illegal drugs and prostitution activities.
page 35 of 79
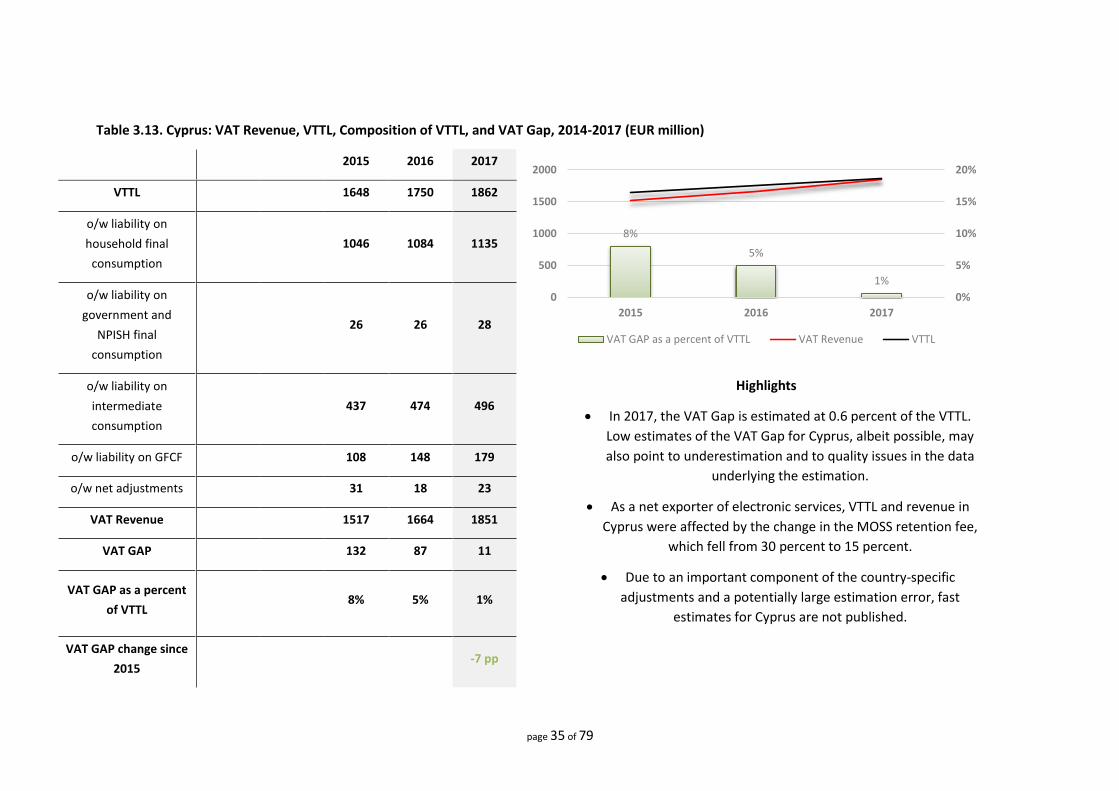
Table 3.13. Cyprus: VAT Revenue, VTTL, Composition of VTTL, and VAT Gap, 2014-2017 (EUR million)
2015 2016 2017
VTTL 1648 1750 1862
o/w liability on
household final
consumption
1046 1084 1135
o/w liability on
government and
NPISH final
consumption
26 26 28
o/w liability on
intermediate
consumption
437 474 496
Highlights
In 2017, the VAT Gap is estimated at 0.6 percent of the VTTL.
Low estimates of the VAT Gap for Cyprus, albeit possible, may
also point to underestimation and to quality issues in the data
underlying the estimation.
As a net exporter of electronic services, VTTL and revenue in
Cyprus were affected by the change in the MOSS retention fee,
which fell from 30 percent to 15 percent.
Due to an important component of the country-specific
adjustments and a potentially large estimation error, fast
estimates for Cyprus are not published.
o/w liability on GFCF 108 148 179
o/w net adjustments 31 18 23
VAT Revenue 1517 1664 1851
VAT GAP 132 87 11
VAT GAP as a percent
of VTTL 8% 5% 1%
VAT GAP change since
2015 -7 pp
8%
5%
1%
0%
5%
10%
15%
20%
0
500
1000
1500
2000
2015 2016 2017
VAT GAP as a percent of VTTL VAT Revenue VTTL
page 36 of 79
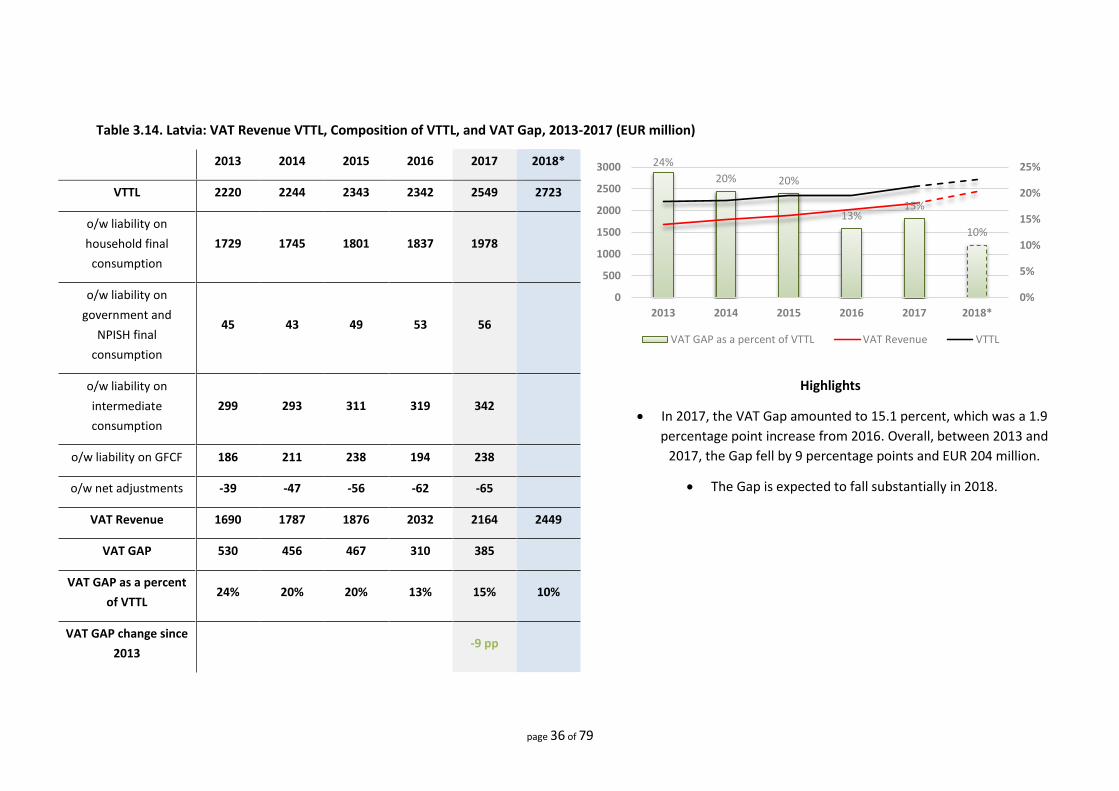
Table 3.14. Latvia: VAT Revenue VTTL, Composition of VTTL, and VAT Gap, 2013-2017 (EUR million)
2013 2014 2015 2016 2017 2018*
VTTL 2220 2244 2343 2342 2549 2723
o/w liability on
household final
consumption
1729 1745 1801 1837 1978
o/w liability on
government and
NPISH final
consumption
45 43 49 53 56
o/w liability on
intermediate
consumption
299 293 311 319 342
Highlights
In 2017, the VAT Gap amounted to 15.1 percent, which was a 1.9
percentage point increase from 2016. Overall, between 2013 and
2017, the Gap fell by 9 percentage points and EUR 204 million.
The Gap is expected to fall substantially in 2018.
o/w liability on GFCF 186 211 238 194 238
o/w net adjustments -39 -47 -56 -62 -65
VAT Revenue 1690 1787 1876 2032 2164 2449
VAT GAP 530 456 467 310 385
VAT GAP as a percent
of VTTL 24% 20% 20% 13% 15% 10%
VAT GAP change since
2013 -9 pp
24%
20% 20%
13%15%
10%
0%
5%
10%
15%
20%
25%
0
500
1000
1500
2000
2500
3000
2013 2014 2015 2016 2017 2018*
VAT GAP as a percent of VTTL VAT Revenue VTTL

page 37 of 79
Table 3.15. Lithuania: VAT Revenue, VTTL, Composition of VTTL, and VAT Gap, 2013-2017 (EUR million)
2013 2014 2015 2016 2017 2018*
VTTL 3706 3879 3875 4054 4429 4696
o/w liability on
household final
consumption
3063 3168 3173 3363 3632
o/w liability on
government and
NPISH final
consumption
43 41 43 44 48
o/w liability on
intermediate
consumption
330 373 393 394 396
Highlights
The VAT Gap remained nearly unchanged between 2015 and
2017 and is also expected to be stable in 2018.
In 2017, the Gap accounted for 25.3 percent of the VTTL and EUR
1,119 million.
o/w liability on GFCF 398 442 461 454 494
o/w net adjustments -127 -145 -195 -202 -141
VAT Revenue 2611 2764 2888 3026 3310 3522
VAT GAP 1095 1115 987 1027 1119
VAT GAP as a percent
of VTTL 30% 29% 25% 25% 25% 25%
VAT GAP change since
2013 -4 pp
30% 29%25% 25% 25% 25%
0%
5%
10%
15%
20%
25%
30%
35%
0
1000
2000
3000
4000
5000
2013 2014 2015 2016 2017 2018*
VAT GAP as a percent of VTTL VAT Revenue VTTL
page 38 of 79
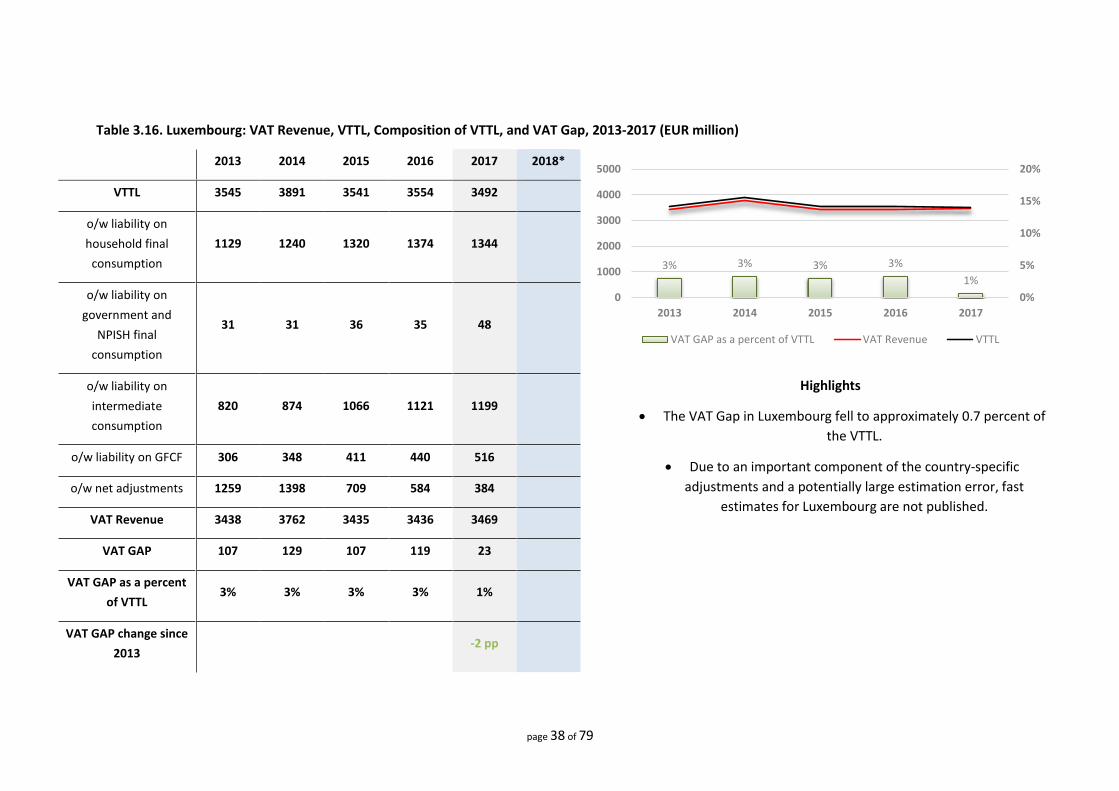
Table 3.16. Luxembourg: VAT Revenue, VTTL, Composition of VTTL, and VAT Gap, 2013-2017 (EUR million)
2013 2014 2015 2016 2017 2018*
VTTL 3545 3891 3541 3554 3492
o/w liability on
household final
consumption
1129 1240 1320 1374 1344
o/w liability on
government and
NPISH final
consumption
31 31 36 35 48
o/w liability on
intermediate
consumption
820 874 1066 1121 1199
Highlights
The VAT Gap in Luxembourg fell to approximately 0.7 percent of
the VTTL.
Due to an important component of the country-specific
adjustments and a potentially large estimation error, fast
estimates for Luxembourg are not published.
o/w liability on GFCF 306 348 411 440 516
o/w net adjustments 1259 1398 709 584 384
VAT Revenue 3438 3762 3435 3436 3469
VAT GAP 107 129 107 119 23
VAT GAP as a percent
of VTTL 3% 3% 3% 3% 1%
VAT GAP change since
2013 -2 pp
3% 3% 3% 3%
1%
0%
5%
10%
15%
20%
0
1000
2000
3000
4000
5000
2013 2014 2015 2016 2017
VAT GAP as a percent of VTTL VAT Revenue VTTL

page 39 of 79
Table 3.17. Hungary: VAT Revenue, VTTL, Composition of VTTL, and VAT Gap, 2013-2017 (HUF million)
2013 2014 2015 2016 2017 2018*
VTTL 3413225 3695038 3948143 3861850 4210262 4521931
o/w liability on
household final
consumption
2440438 2561233 2679346 2777597 2894662
o/w liability on
government and
NPISH final
consumption
114398 114447 118440 124162 135188
o/w liability on
intermediate
consumption
435834 495980 519500 534323 568029
Highlights
In 2017, the VAT Gap fell by approximately 0.7 percentage points
to 13.9 percent of the VTTL.
The VAT Gap as a percent of the VTTL fell by approximately 7
percentage points between 2013 and 2017.
o/w liability on GFCF 362648 464953 576458 377355 553092
o/w net adjustments 59907 58426 54399 48413 59292
VAT Revenue 2693555 3011162 3307312 3297156 3625111 4127678
VAT GAP 719670 683876 640831 564694 585152
VAT GAP as a percent
of VTTL 21% 19% 16% 15% 14% 9%
VAT GAP change since
2013 -7 pp
21%19%
16%15% 14%
9%
0%
5%
10%
15%
20%
25%
0
1000000
2000000
3000000
4000000
5000000
2013 2014 2015 2016 2017 2018*
VAT GAP as a percent of VTTL VAT Revenue VTTL

page 40 of 79
Table 3.18. Malta: VAT Revenue, VTTL, Composition of VTTL, and VAT Gap, 2013-2017 (EUR million)
2013 2014 2015 2016 2017
VTTL 808 906 724 783 823
o/w liability on
household final
consumption
437 457 485 502 524
o/w liability on
government and
NPISH final
consumption
15 16 18 49 54
o/w liability on
intermediate
consumption
304 367 123 135 148
Highlights
The estimates of the VAT Gap show the largest decline among all
EU MS, to 1.6 percent of the VTTL.
The significant drop in the VAT Gap in Malta resulted from the
reclassification of inputs (from non-deductible to deductible) to
the financial sector in 2015.
Due to an important component of the country-specific
adjustments and a potentially large estimation error, fast
estimates for Malta are not published.
o/w liability on GFCF 50 63 82 74 81
o/w net adjustments 3 2 16 22 16
VAT Revenue 582 642 673 712 810
VAT GAP 226 264 51 71 13
VAT GAP as a percent
of VTTL 28% 29% 7% 9% 2%
VAT GAP change since
2013 -26 pp
28% 29%
7%9%
2%
0%
5%
10%
15%
20%
25%
30%
0
200
400
600
800
1000
2013 2014 2015 2016 2017
VAT GAP as a percent of VTTL VAT Revenue VTTL

page 41 of 79
Table 3.19. Netherlands: VAT Revenue, VTTL, Composition of VTTL, and VAT Gap, 2013-2017 (EUR million)
2013 2014 2015 2016 2017 2018*
VTTL 47134 47199 49756 50755 52644 54654
o/w liability on
household final
consumption
25882 25363 25953 26320 27207
o/w liability on
government and
NPISH final
consumption
565 556 595 599 618
o/w liability on
intermediate
consumption
13000 12853 13718 13661 13964
Highlights
In 2017, the VAT Gap in the Netherlands was 5.2 percent of the
VTTL and EUR 2,744 million.
In 2018, the Gap is expected to decrease to less than 5 percent of
the VTTL.
o/w liability on GFCF 7205 7867 8962 9642 10342
o/w net adjustments 482 560 528 533 513
VAT Revenue 42408 42951 44746 47849 49900 52730
VAT GAP 4726 4248 5010 2906 2744
VAT GAP as a percent
of VTTL 10% 9% 10% 6% 5% 4%
VAT GAP change since
2013 -5 pp
10%9%
10%
6% 5%4%
0%
5%
10%
15%
20%
0
10000
20000
30000
40000
50000
60000
2013 2014 2015 2016 2017 2018*
VAT GAP as a percent of VTTL VAT Revenue VTTL
page 42 of 79
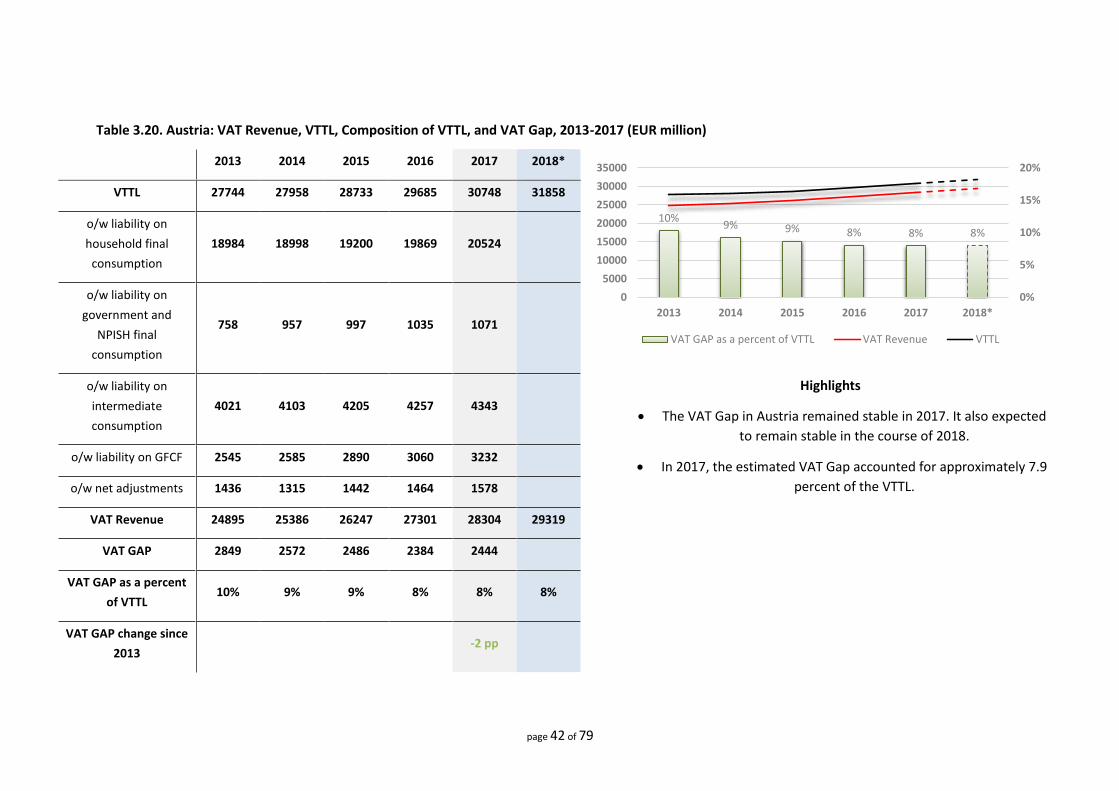
Table 3.20. Austria: VAT Revenue, VTTL, Composition of VTTL, and VAT Gap, 2013-2017 (EUR million)
2013 2014 2015 2016 2017 2018*
VTTL 27744 27958 28733 29685 30748 31858
o/w liability on
household final
consumption
18984 18998 19200 19869 20524
o/w liability on
government and
NPISH final
consumption
758 957 997 1035 1071
o/w liability on
intermediate
consumption
4021 4103 4205 4257 4343
Highlights
The VAT Gap in Austria remained stable in 2017. It also expected
to remain stable in the course of 2018.
In 2017, the estimated VAT Gap accounted for approximately 7.9
percent of the VTTL.
o/w liability on GFCF 2545 2585 2890 3060 3232
o/w net adjustments 1436 1315 1442 1464 1578
VAT Revenue 24895 25386 26247 27301 28304 29319
VAT GAP 2849 2572 2486 2384 2444
VAT GAP as a percent
of VTTL 10% 9% 9% 8% 8% 8%
VAT GAP change since
2013 -2 pp
10%9% 9% 8% 8% 8%
0%
5%
10%
15%
20%
0
5000
10000
15000
20000
25000
30000
35000
2013 2014 2015 2016 2017 2018*
VAT GAP as a percent of VTTL VAT Revenue VTTL
page 43 of 79
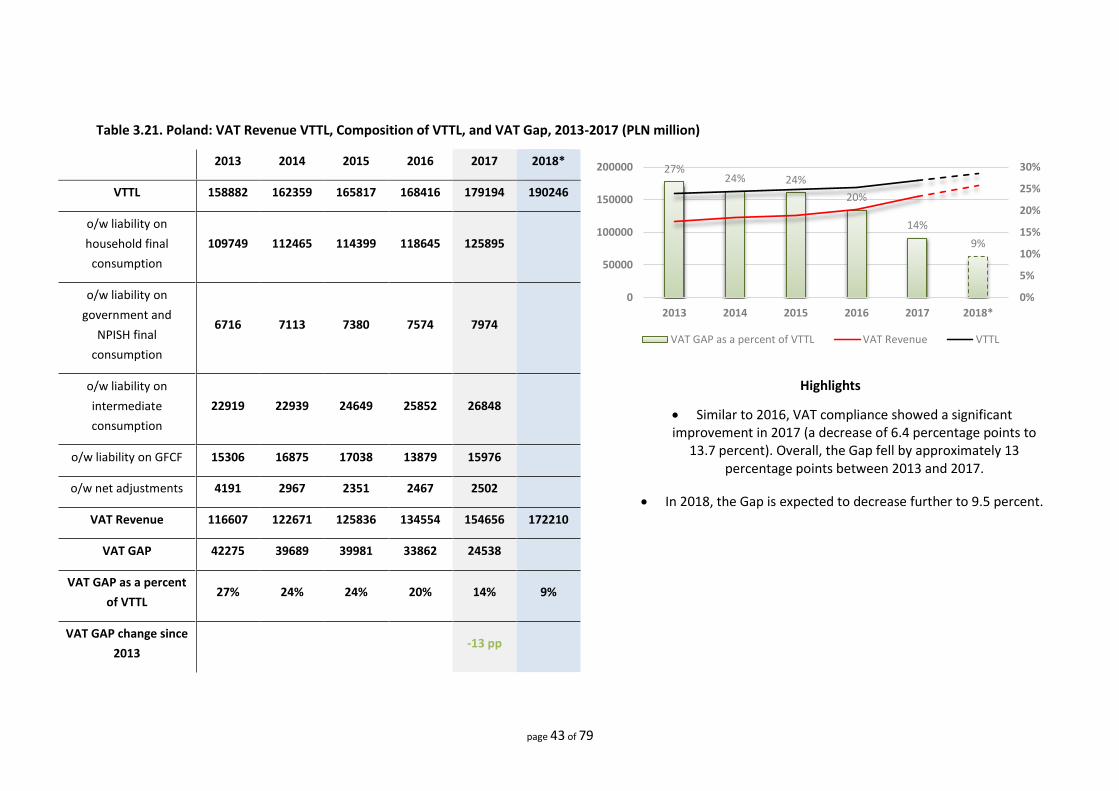
Table 3.21. Poland: VAT Revenue VTTL, Composition of VTTL, and VAT Gap, 2013-2017 (PLN million)
2013 2014 2015 2016 2017 2018*
VTTL 158882 162359 165817 168416 179194 190246
o/w liability on
household final
consumption
109749 112465 114399 118645 125895
o/w liability on
government and
NPISH final
consumption
6716 7113 7380 7574 7974
o/w liability on
intermediate
consumption
22919 22939 24649 25852 26848
Highlights
Similar to 2016, VAT compliance showed a significant improvement in 2017 (a decrease of 6.4 percentage points to
13.7 percent). Overall, the Gap fell by approximately 13 percentage points between 2013 and 2017.
In 2018, the Gap is expected to decrease further to 9.5 percent.
o/w liability on GFCF 15306 16875 17038 13879 15976
o/w net adjustments 4191 2967 2351 2467 2502
VAT Revenue 116607 122671 125836 134554 154656 172210
VAT GAP 42275 39689 39981 33862 24538
VAT GAP as a percent
of VTTL 27% 24% 24% 20% 14% 9%
VAT GAP change since
2013 -13 pp
27%24% 24%
20%
14%
9%
0%
5%
10%
15%
20%
25%
30%
0
50000
100000
150000
200000
2013 2014 2015 2016 2017 2018*
VAT GAP as a percent of VTTL VAT Revenue VTTL

page 44 of 79
Table 3.22. Portugal: VAT Revenue, VTTL, Composition of VTTL, and VAT Gap, 2013-2017 (EUR million)
2013 2014 2015 2016 2017 2018*
VTTL 16220 16982 17632 18069 18738 19445
o/w liability on
household final
consumption
12210 12788 13190 13358 14055
o/w liability on
government and
NPISH final
consumption
219 218 444 484 551
o/w liability on
intermediate
consumption
2568 2624 2454 2728 2512
Highlights
The VAT Gap fell in 2017 by roughly 3 percentage points down to
10.3 percent of the VTTL and continued its downward trend.
In 2018, the Gap is expected to decline further. o/w liability on GFCF 887 1017 1170 1103 1249
o/w net adjustments 336 334 373 396 371
VAT Revenue 13710 14682 15368 15767 16809 17850
VAT GAP 2511 2300 2264 2301 1929
VAT GAP as a percent
of VTTL 15% 14% 13% 13% 10% 8%
VAT GAP change since
2013 -5 pp
15%14% 13% 13%
10%8%
0%
5%
10%
15%
20%
0
5000
10000
15000
20000
25000
2013 2014 2015 2016 2017 2018*
VAT GAP as a percent of VTTL VAT Revenue VTTL

page 45 of 79
Table 3.23. Romania: VAT Revenue, VTTL, Composition of VTTL, and VAT Gap, 2013-2017 (RON million)
2013 2014 2015 2016 2017 2018*
VTTL 83525 85828 88151 77097 82528 88851
o/w liability on
household final
consumption
49363 51889 53728 48071 52773
o/w liability on
government and
NPISH final
consumption
3510 4177 3745 4110 4259
o/w liability on
intermediate
consumption
7859 9760 9646 7849 8362
Highlights
The VAT Gap a percent of the VTTL remained the highest in the
EU.
In 2018, the VAT Gap is expected to decrease to 32.5 percent
from 35.5 percent in 2017.
As of January 2017, Romania reduced its standard rate from 20
to 19. The change of the standard rate in 2017 and earlier in
2016 had a substantial impact on the effective rate, which fell to
12.7 percent.
o/w liability on GFCF 20944 16978 18640 14955 14992
o/w net adjustments 1849 3025 2391 2111 2142
VAT Revenue 51745 51086 57520 49253 53229 59990
VAT GAP 31780 34742 30631 27844 29299
VAT GAP as a percent
of VTTL 38% 40% 35% 36% 36% 32%
VAT GAP change since
2013 -3 pp
38%40%
35% 36% 36%32%
-5%
5%
15%
25%
35%
45%
0
20000
40000
60000
80000
100000
2013 2014 2015 2016 2017 2018*
VAT GAP as a percent of VTTL VAT Revenue VTTL
page 46 of 79
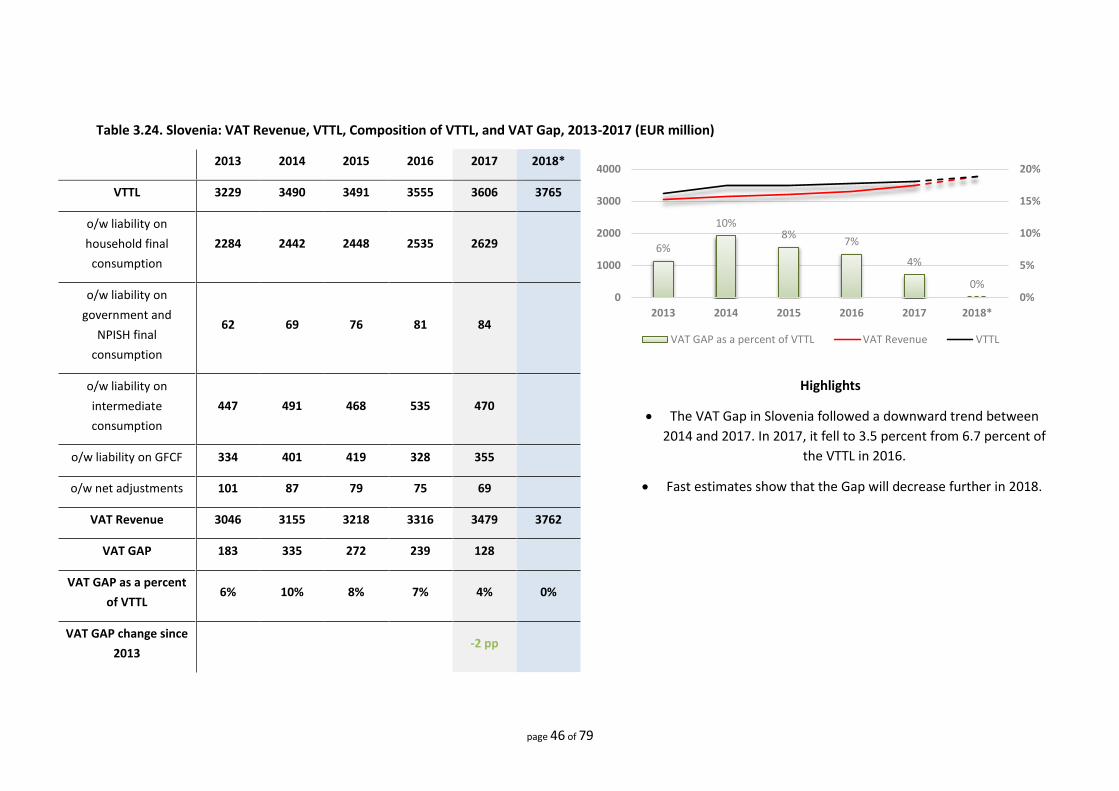
Table 3.24. Slovenia: VAT Revenue, VTTL, Composition of VTTL, and VAT Gap, 2013-2017 (EUR million)
2013 2014 2015 2016 2017 2018*
VTTL 3229 3490 3491 3555 3606 3765
o/w liability on
household final
consumption
2284 2442 2448 2535 2629
o/w liability on
government and
NPISH final
consumption
62 69 76 81 84
o/w liability on
intermediate
consumption
447 491 468 535 470
Highlights
The VAT Gap in Slovenia followed a downward trend between
2014 and 2017. In 2017, it fell to 3.5 percent from 6.7 percent of
the VTTL in 2016.
Fast estimates show that the Gap will decrease further in 2018.
o/w liability on GFCF 334 401 419 328 355
o/w net adjustments 101 87 79 75 69
VAT Revenue 3046 3155 3218 3316 3479 3762
VAT GAP 183 335 272 239 128
VAT GAP as a percent
of VTTL 6% 10% 8% 7% 4% 0%
VAT GAP change since
2013 -2 pp
6%
10%8%
7%
4%
0%0%
5%
10%
15%
20%
0
1000
2000
3000
4000
2013 2014 2015 2016 2017 2018*
VAT GAP as a percent of VTTL VAT Revenue VTTL

page 47 of 79
Table 3.25. Slovakia: VAT Revenue, VTTL, Composition of VTTL, and VAT Gap, 2013-2017 (EUR million)
2013 2014 2015 2016 2017 2018*
VTTL 6844 7132 7630 7294 7708 8109
o/w liability on
household final
consumption
5101 5303 5369 5330 5611
o/w liability on
government and
NPISH final
consumption
96 93 96 99 102
o/w liability on
intermediate
consumption
911 883 969 982 1036
Highlights
The VAT Gap in Slovakia in 2017 accounted for approximately 23.2 percent of the VTTL. Over the analysed period, the Gap followed a downward trend that will likely continue in 2018.
o/w liability on GFCF 725 869 1206 893 963
o/w net adjustments 11 -16 -11 -10 -5
VAT Revenue 4696 5021 5420 5420 5917 6326
VAT GAP 2147 2111 2209 1874 1791
VAT GAP as a percent
of VTTL 31% 30% 29% 26% 23% 22%
VAT GAP change since
2013 -8 pp
31%30% 29%
26%23% 22%
0%
5%
10%
15%
20%
25%
30%
35%
0
2000
4000
6000
8000
10000
2013 2014 2015 2016 2017 2018*
VAT GAP as a percent of VTTL VAT Revenue VTTL

page 48 of 79
Table 3.26. Finland: VAT Revenue, VTTL, Composition of VTTL, and VAT Gap, 2012-2016 (EUR million)
2013 2014 2015 2016 2017 2018*
VTTL 20008 20125 20197 21293 22026 22687
o/w liability on
household final
consumption
11041 11074 11135 11450 11745
o/w liability on
government and
NPISH final
consumption
456 465 474 532 520
o/w liability on
intermediate
consumption
4343 4485 4644 4877 5031
Highlights
The VAT Gap in Finland remained relatively stable and
significantly below the EU median.
In 2017, it was estimated at approximately 7.4 percent of the
VTTL.
o/w liability on GFCF 3622 3498 3316 3745 3969
o/w net adjustments 545 602 628 690 762
VAT Revenue 18888 18948 18974 19694 20404 21345
VAT GAP 1120 1177 1223 1599 1622
VAT GAP as a percent
of VTTL 6% 6% 6% 8% 7% 6%
VAT GAP change since
2013 +2 pp
6% 6% 6%8% 7%
6%
0%
5%
10%
15%
20%
0
5000
10000
15000
20000
25000
2013 2014 2015 2016 2017 2018*
VAT GAP as a percent of VTTL VAT Revenue VTTL

page 49 of 79
Table 3.27. Sweden: VAT Revenue, VTTL, Composition of VTTL, and VAT Gap, 2013-2017 (SEK million)
2013 2014 2015 2016 2017 2018*
VTTL 349797 365187 389952 411748 431357 443351
o/w liability on
household final
consumption
182545 188056 197358 205017 213676
o/w liability on
government and
NPISH final
consumption
19231 19869 20549 22024 22730
o/w liability on
intermediate
consumption
86002 89068 95339 98606 101475
Highlights
The VAT Gap in Sweden remained one of the lowest in the EU,
with a share of 1.5 percent of the VTTL in 2017.
Fast estimates show that the Gap may fall below 0, thus the
simplified estimates need to be treated with caution.
o/w liability on GFCF 56775 62428 70346 79592 86733
o/w net adjustments 5244 5766 6360 6509 6743
VAT Revenue 337823 353439 378830 404987 425053 445571
VAT GAP 11974 11748 11122 6761 6304
VAT GAP as a percent
of VTTL 3% 3% 3% 2% 1% -1%
VAT GAP change since
2013 -2 pp
3% 3% 3%2% 1%
-1%-5%
0%
5%
10%
15%
20%
0
100000
200000
300000
400000
500000
2013 2014 2015 2016 2017 2018*
VAT GAP as a percent of VTTL VAT Revenue VTTL

page 50 of 79
Table 3.28. United Kingdom: VAT Revenue, VTTL, Composition of VTTL, and VAT Gap, 2013-2017 (GBP million)
2013 2014 2015 2016 2017 2018*
VTTL 133557 140452 144337 150149 158421 164399
o/w liability on
household final
consumption
87245 93128 95346 100497 105552
o/w liability on
government and
NPISH final
consumption
2520 2726 3536 3206 3283
o/w liability on
intermediate
consumption
29255 30354 30729 31254 33224
Highlights
The VAT Gap as a percent of the VTTL remained stable between 2013 and 2017. No sudden changes are expected in 2018.
In 2017, the VAT Gap was approximately 10.6 percent of the
VTTL.
o/w liability on GFCF 11436 12255 13468 13761 14717
o/w net adjustments 3101 1989 1258 1432 1644
VAT Revenue 118234 124211 129327 133857 141590 152013
VAT GAP 15323 16241 15010 16292 16831
VAT GAP as a percent
of VTTL 11% 12% 10% 11% 11% 9%
VAT GAP change since
2013 -1 pp
11% 12%10% 11% 11%
9%
0%
5%
10%
15%
20%
0
50000
100000
150000
200000
2013 2014 2015 2016 2017 2018*
VAT GAP as a percent of VTTL VAT Revenue VTTL
VAT Gap in the EU-28 Member States
page 51 of 79
IV. Policy Gap Measures for 2017
In this chapter, we present an update of the series of estimates of the Policy Gap and its
components for the EU-28.
As discussed in the previous Reports, the Policy Gap captures the effects of applying multiple rates
and exemptions on the theoretical revenue that could be levied in a given VAT system. In other
words, the Policy Gap is an indicator of the additional VAT revenue that a MS could theoretically
(i.e. in the case of perfect tax compliance) generate if it applied a uniform VAT rate on all goods
and services. Due to the idealistic assumption of perfect tax compliance and a very broad base
that captures entire final consumption,8 the practical interpretation of the Policy Gap draws
criticism. Nonetheless, the assumption of perfect VAT collectability is indispensable, as
interdependencies between tax compliance and rate structure are not straightforward.
In order to learn how different components contribute to revenue losses, we compose the Policy
Gap into different components of revenue loss, as we show in Section IV in Annex A. Such
elements are, for instance, the Rate Gap and the Exemption Gap, which capture the loss in VAT
liability due to the application of reduced rates, and the loss in liability due to the implementation
of exemptions.
Moreover, following Barbone et al. (2013), the Policy Gap and its components could be further
adjusted to address the issue of the extent to which the loss of theoretical revenue depends on
the decisions of policymakers. Measures that exclude liability from the final consumption of
“imputed rents” (the notional value of home occupancy by homeowners), financial services, and
the provision of public goods and services, as charging them with VAT is impractical or beyond the
control of national authorities, are named the “Actionable Gaps”.
The estimates of the Policy Gap, Rate Gap, Exemption Gap, Actionable Policy Gap, and Actionable
Exemption Gap for the EU-28 MS for 2017 are presented in Table 4.1.
For the EU overall, the average Policy Gap level was 44.5 percent and remained nearly unchanged
from 2016. Our interpretation of the numbers is that VAT levied on final consumption and
household investment, even in the case of 100 percent compliance, generates just slightly more
than half of what it could bring in if taxed uniformly at the full rate. Of this 44.52 percent, in 2017,
approximately 9.56 percentage points were due to the application of various reduced and super
reduced rates (the Rate Gap).
According to the Rate Gap estimates, reduced rates are least applied in Denmark (0.77 percent)
and Estonia (2.91 percent). On the other side of spectrum are Cyprus (29.55 percent), Malta (16.46
percent), and Poland (14.61 percent).
The Exemption Gap, or the average share of Ideal Revenue lost due to various exemptions, is 35
percent in the EU on average. The MS with the highest values of the Exemption Gap are Spain
(46.64 percent), due to the application of other than VAT indirect taxes in the Canary Islands,
Ceuta, and Melilla, and the United Kingdom (44.32 percent). The lowest value of the Exemption
8 We also include housing GFCF in the Notional Ideal Revenue, which is explained in Section V in Annex A.

VAT Gap in the EU-28 Member States
page 52 of 79
Gap was observed in Cyprus (15.86 percent). In six other countries, the Exemption Gap was below
30 percent (Bulgaria, Croatia, Lithuania, Luxembourg, Malta, and Romania).
The largest part of the Exemption Gap is composed of exemptions on services that cannot be taxed
in principle, such as imputed rents, the provision of public goods by the government, or financial
services. The remaining level of the so-called “Actionable” Exemption Gap is about 3.5 percent,
on average.
The Actionable Policy Gap – a combination of the Rate Gap and the Actionable Exemption Gap –
is 13.00 percent on average. This figure shows the combined reduction of Ideal Revenue due to
reduced rates (9.52%) and exemptions (3.46%) which could theoretically be removed. In other
words, VAT revenue would increase by 13 percent of the Notional Ideal Revenue (equivalent to
33% of the actual collections in 2017) if MS applied the Standard Rate of VAT on the goods and
services without exemptions that could be subject to such a rate. However, the room for
manoeuvre differs substantially between Member States, from under one percent in Bulgaria and
Denmark to more than 20 percent in Spain, Cyprus, Luxembourg and Poland.
The estimates of some components of the Exemption Gaps, like Financial Services Gap for Cyprus,
are negative. It means that more revenue was levied by taxing their intermediate input than would
be generated if the output was taxed. Such a situation is possible in the case of large investments
or losses for a given year, but may also indicate inconsistencies in national accounts figures.

VAT Gap in the EU-28 Member States
page 53 of 79
Table 4.1. Policy Gap, Rate Gap, Exemption Gap, and Actionable Gaps
A B C D E F G H Policy Gap
(%) Rate Gap
(%) Exemption
Gap (%) o/w Imputed
Rents (%) o/w Public
Services (%) o/w Financial Services (%)
Actionable Exemption Gap (C - D - E - F) (%)
Actionable Policy Gap (G + B) (%)
BE 51.50 10.20 41.30 7.12 27.43 3.45 3.30 13.50 BG 29.47 3.88 25.59 10.05 16.66 2.56 -3.68 0.20 CZ 37.96 5.77 32.19 8.31 19.40 2.50 1.99 7.76 DK 41.59 0.77 40.82 7.48 27.94 5.23 0.18 0.95 DE 44.26 7.35 36.91 6.71 22.47 3.24 4.50 11.85 EE 35.01 2.91 32.10 7.00 19.96 2.57 2.57 5.48 IE 47.91 14.00 33.91 10.20 26.01 -0.89 -1.41 12.59 EL 46.03 8.20 37.83 9.20 18.91 1.90 7.82 16.02 ES 59.42 13.07 46.35 9.81 19.59 2.53 14.42 27.49 FR 53.78 11.84 41.94 9.37 25.15 3.61 3.81 15.65 HR 33.90 8.44 25.47 7.59 14.43 2.06 1.40 9.83 IT 53.81 12.75 41.06 10.87 20.44 1.35 8.40 21.15 CY 45.41 29.55 15.86 8.55 20.66 -5.66 -7.69 21.86 LV 40.29 3.12 37.17 9.90 19.62 1.98 5.66 8.78 LT 33.48 4.20 29.28 5.21 17.28 1.65 5.13 9.33 LU 39.49 12.14 27.35 8.78 4.71 2.59 11.27 23.41 HU 43.48 5.75 37.73 7.48 22.87 3.59 3.79 9.54 MT 43.70 16.46 27.23 4.31 19.72 2.84 0.37 16.83 NL 51.84 11.19 40.65 7.28 27.56 7.00 -1.19 10.00 AT 45.85 10.40 35.45 7.22 21.97 2.93 3.32 13.73 PL 48.36 14.61 33.74 3.82 18.40 3.81 7.71 22.32 PT 51.21 11.95 39.27 8.38 21.22 3.21 6.45 18.40 RO 34.00 8.37 25.63 9.75 15.07 0.12 0.70 9.07 SI 47.78 11.29 36.49 7.87 20.79 2.95 4.89 16.18 SK 38.29 2.44 35.85 6.71 20.83 3.79 4.52 6.96 FI 48.86 9.89 38.97 10.09 23.75 2.83 2.30 12.19 SE 46.45 7.95 38.50 5.42 30.59 3.94 -1.45 6.50 UK 53.50 9.18 44.32 11.72 21.23 4.00 7.37 16.56
EU-28 44.52 9.56 34.96 8.08 20.88 2.56 3.44 13.00

VAT Gap in the EU-28 Member States
page 54 of 79
V. Econometric Analysis of VAT Gap Determinants
The econometric analysis of VAT Gap determinants was first carried out in the 2018 Report.
Following the approach proposed therein, we apply it again having one more year of the VAT Gap,
2016. Some sections, in particular V.a and V.b, have been slightly shortened as they were already
included in the 2018 Report.
a. Introduction: The Incentives of the Agents Involved
Most of the literature on tax evasion has focused on personal taxes, where the taxpayer has to
submit his or her return with fiscal information. This dependence on the information provided by
the taxpayer, and given the probability the return is audited, creates incentives for the taxpayer
to misreport that information. This is well known, and the taxpayer’s behaviour is modelled under
the “deterrence model” (Allingham and Sandmo, 1972). Independently of the efforts carried out
by the tax administration to avoid misreporting, the literature on “tax morale” (see a recent survey
by Luttmer and Singhal, 2014) argues that taxpayers might have a “sense of civic duty” such that
taxpayers find intrinsic incentives not lo lie.
In contrast to the above framework, it is key to recall that in the EU, VAT is based on an invoicing
mechanism. In any transaction, the seller issues an invoice and charges the output tax to the
buyer. That amount of money minus the amount of VAT paid by the seller (input tax) has to be
transferred to the tax administration. This is the basis of the self-enforcement mechanism, which
a priori promotes voluntary tax compliance (Pomeranz, 2015);9 the seller has incentives to charge
the tax in order to get back the money from input taxes. An exception to this has to do with the
incentives of final consumers. As they will not be able to deduct the input tax, they face some
incentives to evade taxes. However, they require that the retailer accedes not to charge the
output tax (Fedeli and Forte, 1999). Hence, they both play a role in the decision to evade taxes.
This is a legal framework that departs from the standard theoretical models based on personal
income taxes.
Therefore, in order to estimate the determinants of the tax gap, we have to acknowledge this
particular context of the tax. In particular, to do so, we will account for the factors identifying the
incentives of final consumers. Given the existence of these incentives, we will also account for the
willingness of sellers to accept that demand from final consumers (basically, the share of retailers
in the economy). Finally, we will include in our empirical analysis the scale and nature of the means
of the tax administration to reduce the extent of the tax gap. Thus, the final consumers, sellers,
and tax administration are the three key players to take into account in the empirical analysis.
b. Variables to Explain Agents’ Incentives
Due to a sense of civic duty, individuals acting as final consumers may have an intrinsic incentive
to comply with the tax law. This can be picked up by Age structure (Age), as usually the literature
9 In fact, the theoretical literature has stressed this positive characteristic of the tax (i.e. self-enforcing mechanism) to justify its inclusion in the tax system despite the existence of a personal income tax (Boadway et al., 1994).
VAT Gap in the EU-28 Member States
page 55 of 79
assumes that older people are more aware of the benefits of adopting a prosocial behaviour.
Hence, we will include in the regression the percentage of people over 50 years old as a proxy of
tax morale.10 Other structural factors related to prosocial behaviour will be picked up by the fixed
effects in our regression model.
Taxpayers might suffer from liquidity constraints. If so, tax evasion could be interpreted as a risky
loan where the expected penalty rate is part of the financial cost (Andreoni, 1992). This constraint
could affect both businesses (either incorporated or not) and final consumers (see also Alm et al.,
2019). We will control for this potential impact through the unemployment rate (Unemp).11 The
incentive to free ride, and so to avoid paying taxes, can also be affected by the perception of how
well public revenues are spent or by the perception about the performance of the public sector,
as we explained earlier. In particular, as Godin and Hindriks (2015) indicate, the quality of the
government – that is, the degree of independence of the tax administration from political
pressures as well as the quality of policy formulation and implementation – affects the
effectiveness of the tax system. We will account for this potential impact by means of a country
variable of government effectiveness (Gov’t Effect), which was constructed by the World Bank.
Due to the presence of a final consumer, we expect that B2C transactions are those more prone
to tax incompliance. Thus, we include as explanatory variables the productive structure of the
country; in particular, we distinguish the following sectors: retail (Sellers), which could be the key
sector, along with other labour-intensive sectors; as well as real estate (Estate), construction
(Constr), industry (Ind), telecommunications (Teleco), and art (Art). The sum of all shares amounts
to 100 percent once we have excluded those sectors that are not subject to or are exempted from
VAT (such as health, education, or financial services).
The success of our empirical model lies in the fact that our explanatory variables are time variant
within a country; otherwise, the influence would be captured as a fixed effect. Unfortunately for
our purposes, statutory VAT tax rates do not change very often; hence, we will not be able to
estimate their impact on the Gap.12 Instead, we will control for the dispersion of tax rates (within
a country) (Disp) – that is, the standard deviation of tax rates given the potential existence of
reduced and super-reduced tax rates, apart from the standard tax rate. In this case, there is more
within-variation over time. We include this variable because of the potential effect that the
dispersion of rates has on the VAT Gap, as the wider the dispersion, the greater the benefits from
a misapplication of reduced and super-reduced rates.
Finally, as further controls in all regressions, we have included population (Pop) and GDP per capita
(GDPpc).
10 This range of age might be too wide, but we wanted to include taxpayers who are still active; otherwise, if we define it in a more restrictive way (for example, above 65 years old), we would be picking up retired people, for whom the nature of their most likely main source of income (pensions) is very peculiar. 11 See also Durán-Cabré et al. (2018) for an analysis of how tax enforcement evolves along the economic cycle. 12 Ideally, we would have liked to control for firm size as well. A priori, one could argue small firms are more likely (probably, due to relatively lower expected control from the tax administration) to accept the demand of final consumers not to charge the output tax. However, this variable does not show much within-variation over time. Thus, we have the same problem we found with VAT tax rates: we cannot identify its impact. Thus, this has to be left for future research.

VAT Gap in the EU-28 Member States
page 56 of 79
In accordance with the deterrence model, we will employ variables that promote voluntary tax
compliance. Hence, ceteris paribus, the greater the expected efforts of the administration, the
greater the level of voluntary tax compliance, and so the lower the tax gap. This is the hypothesis
we want to test with respect to the behaviour of the tax administration. In order to minimize the
risk of biased estimates due to endogeneity and to account for a potential delayed impact on the
Gap, these variables are lagged two periods.
In particular, we have used the following three variables:
- Scale of the Tax Administration (Scale), constructed as the ratio of total administrative costs divided by GDP;
- Information and Technology Expenditure (IT Exp), constructed as the share of information and technology expenditures over total administrative costs; and
- Public Deficit (Def), the tax administration might have greater incentives to close the tax gap and, in our case, to promote voluntary tax compliance when public finances are in a worse financial condition (Esteller-Moré, 2005), given the resources in hands of the tax administration picked up by the two previous variables.
The first variable is picking up the scale of the tax administration primarily through the number of
tax professionals in the administration, and the second one is picking up the nature of that
expenditure. In particular, we will test whether greater emphasis on information and technology
promotes voluntary tax compliance either as a deterrent to fraud or simply as a way to facilitate
the taxpayer to comply ex-ante with tax obligations.
c. Empirical Application
Descriptive Statistics and Sources
Table 5.1 shows the descriptive statistics of the variables used in the econometric model. For every
variable, we have the number of observations, the unity of measure, the mean, the standard
deviation, and the minimum and maximum values. There are 448 observations of VAT Gap. The
average value of these observations is 16.17 percent, with a standard deviation of 10.49, a
minimum value of -1.42 percent (Sweden, 2015), and a maximum of 49.28 percent (Romania,
2009). The ratio of total administrative costs divided by GDP (Scale) is available 316 times, with a
mean value of 0.25 percent, a standard deviation of 0.45, a minimum value of 0.04 percent (Malta,
2004), and a maximum value of 1.13 percent (Cyprus, 2004). Finally, for example, the share of
information and technology expenditures over total administrative costs (IT Exp), with 216
observations, has a mean value of 10.19 percent, a standard deviation of 7.01, a minimum value
of 0.1 percent (Malta, 2012), and a maximum value of 27.8 percent (Finland, 2012).

VAT Gap in the EU-28 Member States
page 57 of 79
Table 5.1. Descriptive Statistics and Data Sources
VARIABLES SOURCE OBS MEAN STD DEV
MIN MAX
VAT Gap (Vatgap)
2013, 2014, 2015, 2016, 2017, and 2018
Studies 448 0.16 0.11 -0.01 0.49
Retail sellers (Sellers)
Eurostat 476 0.30 0.05 0.13 0.44
Real estate (Estate)
Eurostat 476 0.14 0.04 0.05 0.28
Construction (Constr)
Eurostat 476 0.09 0.02 0.03 0.19
Industry (Ind)
Eurostat 448 0.30 0.07 0.08 0.55
Telecommunications (Teleco)
Eurostat 476 0.07 0.02 0.04 0.16
Art (Art)
Eurostat 476 0.05 0.02 0.01 0.21
Dispersion of tax rates within a country (Disp)
Own, based on DG TAXUD
464 0.07 0.03 0.00 0.12
Unemployment (Unemp)
Eurostat 476 0.09 0.04 0.02 0.28
Government effectiveness (Gov’t Effect)
World Bank 476 1.15 0.62 -0.37 2.35
Age structure/Old (Age)
Eurostat 476 0.35 0.03 0.26 0.43
Information and technology expenditure (IT Exp) (%)
OECD 216 10.19 7.01 1.00 27.8
Scale of the tax administration
(Scale) (%) OECD 316 0.25 0.11 0.04 1.13
Public deficit (Def)
Eurostat 441 -0.03 0.04 -0.32 0.07
Population (Pop) (x 10-7)
Eurostat 476 1.78 2.25 0.04 8.25
GDP per capita (GDPpc) (EUR
thousand & PPP) Eurostat 474 24.04 11.04 5.60 77.40
Source: own.
VAT Gap in the EU-28 Member States
page 58 of 79
Empirical Model
We estimate a fixed effects model in order to test the impact of the different actors on the VAT
Gap. Our endogenous variable runs from 2000 to 2016 for the EU-28 MS and comes from the most
recent vintages of the Study available.
A fixed effects model seems particularly appropriate, as one could argue some explanatory factors
like the efforts of the tax administration or institutional variables might be correlated with many
other factors that are not included in the regressions. As we suggested before, though, the
drawback is that we will not be able to interpret the estimates of the fixed effects, or to estimate
the impact of the variables that show little within-country variation, as for example, level of VAT
tax rates or firm size. This has to be explicitly acknowledged.
Analytically, the basic model we estimate is as follows:
𝑉𝐴𝑇 𝐺𝐴𝑃𝑖𝑡 = 𝛽1𝐴𝑔𝑒𝑖𝑡 + 𝛽2𝑈𝑛𝑒𝑚𝑝𝑖𝑡 + 𝛽3𝐺𝑜𝑣′𝑡 𝐸𝑓𝑓𝑒𝑐𝑡𝑖𝑡 +
+ 𝛽4𝑆𝑒𝑙𝑙𝑒𝑟𝑠𝑖𝑡 + 𝛽5𝐸𝑠𝑡𝑎𝑡𝑒𝑖𝑡 + 𝛽6𝐶𝑜𝑛𝑠𝑡𝑟𝑖𝑡 + 𝛽7𝐼𝑛𝑑𝑖𝑡 + 𝛽8𝑇𝑒𝑙𝑒𝑐𝑜𝑖𝑡 + 𝛽9𝐴𝑟𝑡𝑖𝑡 + 𝛽10𝐷𝑖𝑠𝑝𝑖𝑡 +
+𝛽11𝑆𝑐𝑎𝑙𝑒𝑖𝑡−2 + 𝛽12𝐼𝑇 𝐸𝑥𝑝𝑖𝑡−2 + 𝛽13𝐷𝑒𝑓𝑖𝑡−2 +
+ 𝛽14𝐺𝐷𝑃𝑝𝑐𝑖𝑡 + 𝛽15𝑃𝑜𝑝𝑖𝑡 + 𝛽16𝑃𝑜𝑝2𝑖𝑡 + 𝐹𝑖𝑥𝑒𝑑 𝐸𝑓𝑓𝑒𝑐𝑡𝑠 + 𝑇𝑖𝑚𝑒 𝐸𝑓𝑓𝑒𝑐𝑡𝑠 + 𝐸𝑟𝑟𝑜𝑟 𝑇𝑒𝑟𝑚𝑖𝑡
Our endogenous variable, VAT Gap of country i in year t, is explained by a set of covariates. In
particular, in the first row, there are the variables related to final consumers; in the second row,
we include the variables related to the behaviour of firms; in the third row, lagged two periods to
account for a likely sluggish and minimize probability of the endogeneity problem, there are the
variables related to the behaviour of the tax administration. Finally, in the fourth row, there are
the control variables, including fixed effects (a variable for each country that remains unchanged
along time), time effects (a common variable for all countries that varies along time), and the error
term with the usual statistical properties. The beta coefficients are the estimates of the impact of
a given variable on our endogenous variable. With the exception of population (Pop), we expect
the impact of all variables to be linear – that is, to be independent of the value of the
corresponding variable. However, due to its potential interest for policymakers, we will also test
whether the impact of the variables under direct control of the tax administration is non-linear.
This could imply that its impact holds from a given value of the explanatory variable onwards or
that its impact vanishes when the variable has reached a given threshold. We will be able to be
more precise about this later.
Empirical Results
We have proceeded parsimoniously – that is, we have tested one group of factors after another,
and in the end, we have tested all groups simultaneously. In all models, though, we control for
population (and its square), VAT tax rate dispersion, and GDP per capita. Next, we discuss the
results, which are shown in Table 5.2.
In column 1, we have tested the importance of only those factors picking up the impact of the tax
administration. As there are external data limitations for the tax administration variables and we
use second lags, we only have 190 observations. The estimates are statistically not significant,

VAT Gap in the EU-28 Member States
page 59 of 79
likely due to data limitations. However, in general, the greater the importance of the information
and technology expenditure and of the public deficit, the lower the level of the VAT Gap. On the
other hand, the greater the scale of the tax administration, the larger the VAT Gap. As this result
was unexpected, we also verify whether the impact is non-linear in its nature.13
These estimates have to be taken with caution, though, as we still have not included all variables
that might have an impact on the Gap. However, we can use the results of column 1 as an example
of how to quantitatively interpret the estimates. For example, when IT Exp increases by 0.1
percentage points (recall the pooled average of the sample of IT Exp is 10.19 percent over GDP),
the Gap decreases by 0.018 percentage points (pooled average of the Gap = 16.17 percent).
Similarly, in column 2, we have included only those factors that might explicitly affect seller
behaviour. In column 3, we have included only those explicitly affecting final consumers. In column
4, we have included both groups of factors, that is those affecting sellers and final consumers. In
column 5, we have included all factors simultaneously. Finally, in column 5 and column 6 we
included specifications that tested non-linearites of Scale.
Regarding the variables affecting firms’ behaviour, we see that the higher the dispersion of rates,
the higher the VAT Gap.14 Regarding the productive structure of the economy, results are not
clear-cut. The residual category is agriculture; hence, the estimates have to be interpreted as
whether the share in a given sector has an impact on VAT with respect to the impact of agriculture
Regarding the variables affecting individuals, we observe that the higher the unemployment rate
(as a proxy of “liquidity constraints”), the higher the level of the Gap (this estimate is statistically
significant also in columns 5 and 6).
Hence, liquidity constraints and the tax design play a role in the VAT Gap, but they cannot be
directly affected by the tax administration. In spite of this, the added value of this type of analysis
is making the tax administration aware of the exogenous constraints it faces on reducing the VAT
Gap. That is, efforts to reduce the tax gap should be larger when the economy suffers liquidity
constraints or when the tax is more difficult to administer.15
We think the most interesting results are those dealing with the impact of the variables under the
direct control of the tax administration. In this regard, there is a robust result regarding IT Exp,
namely – the greater the importance of this type of expenditure, the lower the Gap. Regarding
the scale of the tax administration, the estimation shown in column 6 suggests the impact is non-
linear. In particular, it has a favourable impact on the reduction of the Gap only for very high levels
of the Scale (around 0.77%). Hence, it seems that in order to promote tax compliance it is more
important the nature of the expenditure (IT Exp) than the size or scale of the administration.
Finally, note the impact of GDP per capita is not statistically significant. The impact of population
13 Note we are working with aggregate tax administration variables. Thus, the estimates do not specifically account for the impact of resources of the tax administration dedicated to promoting VAT compliance. In this regard, the estimate will be a combination of the importance of those resources and their productivity in promoting tax compliance. 14 In columns 5 and 6, we still have a positive sign for that variable but due to sample limitations statistical inference is not so precise. 15 Another potential explanatory variable – which we left for future research – would be the share of labour as an input factor at the aggregate level by country.
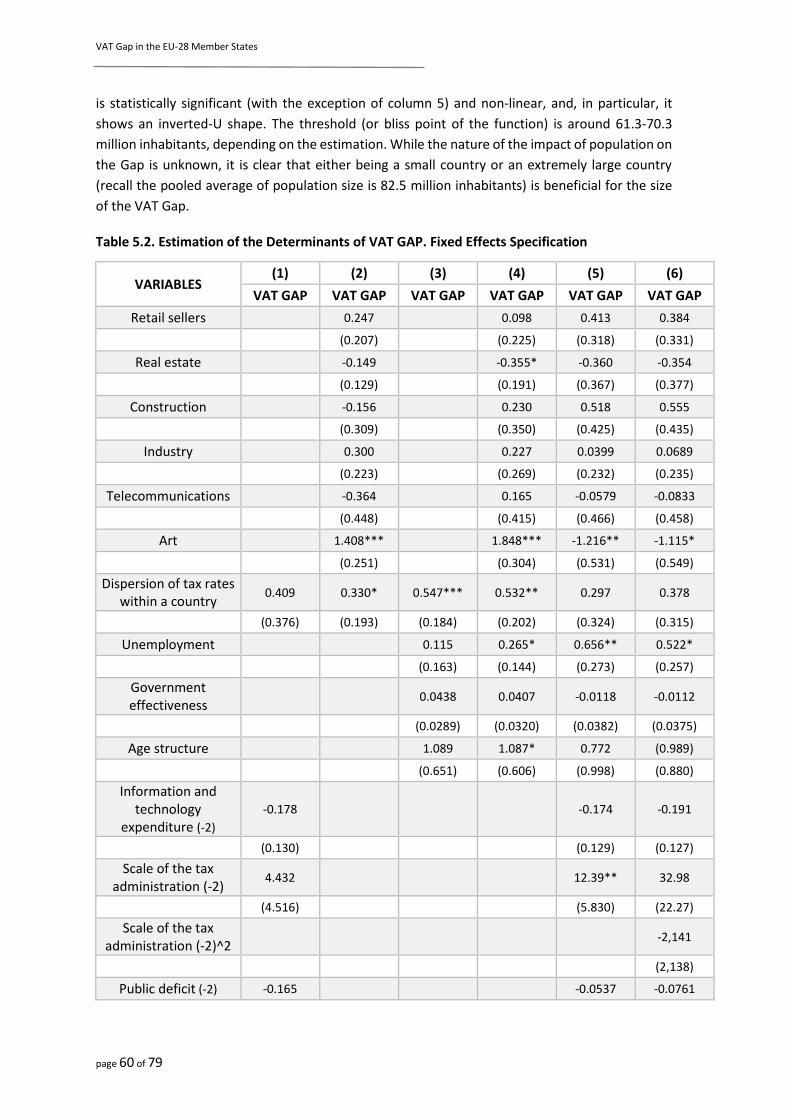
VAT Gap in the EU-28 Member States
page 60 of 79
is statistically significant (with the exception of column 5) and non-linear, and, in particular, it
shows an inverted-U shape. The threshold (or bliss point of the function) is around 61.3-70.3
million inhabitants, depending on the estimation. While the nature of the impact of population on
the Gap is unknown, it is clear that either being a small country or an extremely large country
(recall the pooled average of population size is 82.5 million inhabitants) is beneficial for the size
of the VAT Gap.
Table 5.2. Estimation of the Determinants of VAT GAP. Fixed Effects Specification
VARIABLES (1) (2) (3) (4) (5) (6)
VAT GAP VAT GAP VAT GAP VAT GAP VAT GAP VAT GAP
Retail sellers 0.247 0.098 0.413 0.384
(0.207) (0.225) (0.318) (0.331)
Real estate -0.149 -0.355* -0.360 -0.354
(0.129) (0.191) (0.367) (0.377)
Construction -0.156 0.230 0.518 0.555
(0.309) (0.350) (0.425) (0.435)
Industry 0.300 0.227 0.0399 0.0689
(0.223) (0.269) (0.232) (0.235)
Telecommunications -0.364 0.165 -0.0579 -0.0833
(0.448) (0.415) (0.466) (0.458)
Art 1.408*** 1.848*** -1.216** -1.115*
(0.251) (0.304) (0.531) (0.549)
Dispersion of tax rates within a country
0.409 0.330* 0.547*** 0.532** 0.297 0.378
(0.376) (0.193) (0.184) (0.202) (0.324) (0.315)
Unemployment 0.115 0.265* 0.656** 0.522*
(0.163) (0.144) (0.273) (0.257)
Government effectiveness
0.0438 0.0407 -0.0118 -0.0112
(0.0289) (0.0320) (0.0382) (0.0375)
Age structure 1.089 1.087* 0.772 (0.989)
(0.651) (0.606) (0.998) (0.880)
Information and technology
expenditure (-2) -0.178 -0.174 -0.191
(0.130) (0.129) (0.127)
Scale of the tax administration (-2)
4.432 12.39** 32.98
(4.516) (5.830) (22.27)
Scale of the tax administration (-2)^2
-2,141
(2,138)
Public deficit (-2) -0.165 -0.0537 -0.0761
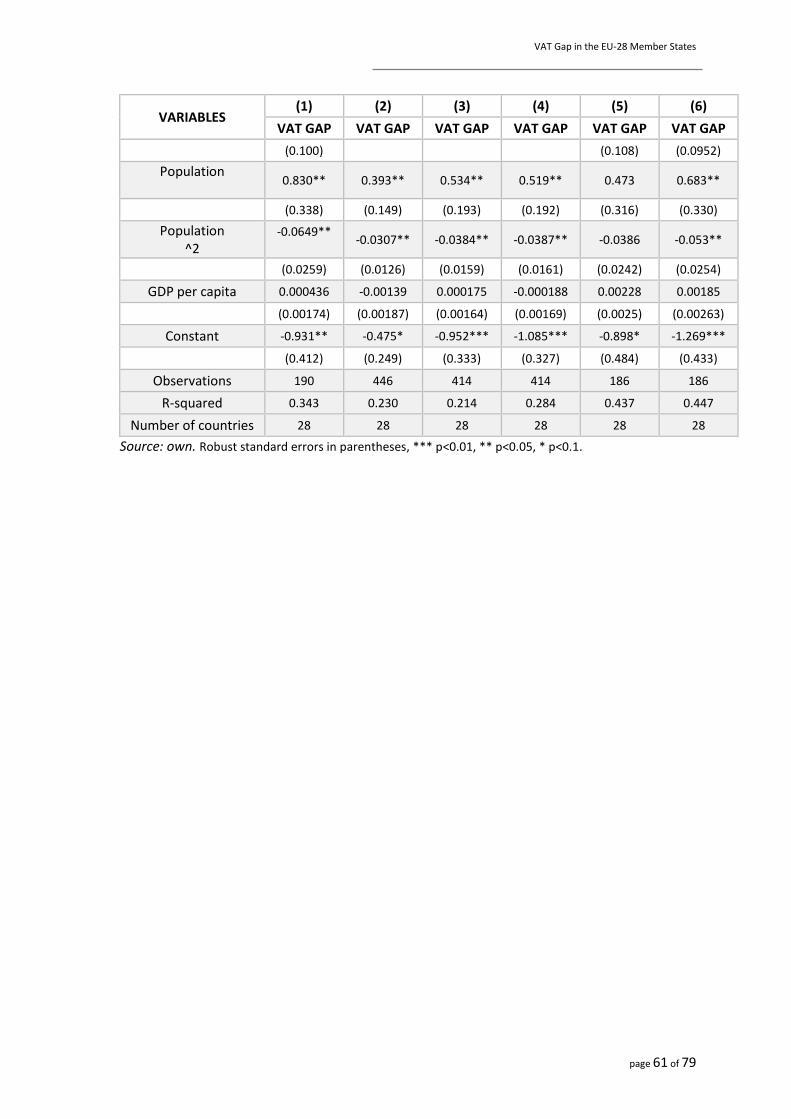
VAT Gap in the EU-28 Member States
page 61 of 79
VARIABLES (1) (2) (3) (4) (5) (6)
VAT GAP VAT GAP VAT GAP VAT GAP VAT GAP VAT GAP
(0.100) (0.108) (0.0952)
Population
0.830** 0.393** 0.534** 0.519** 0.473 0.683**
(0.338) (0.149) (0.193) (0.192) (0.316) (0.330)
Population ^2
-0.0649**
-0.0307** -0.0384** -0.0387** -0.0386 -0.053**
(0.0259) (0.0126) (0.0159) (0.0161) (0.0242) (0.0254)
GDP per capita 0.000436 -0.00139 0.000175 -0.000188 0.00228 0.00185
(0.00174) (0.00187) (0.00164) (0.00169) (0.0025) (0.00263)
Constant -0.931** -0.475* -0.952*** -1.085*** -0.898* -1.269***
(0.412) (0.249) (0.333) (0.327) (0.484) (0.433)
Observations 190 446 414 414 186 186
R-squared 0.343 0.230 0.214 0.284 0.437 0.447
Number of countries 28 28 28 28 28 28
Source: own. Robust standard errors in parentheses, *** p<0.01, ** p<0.05, * p<0.1.

VAT Gap in the EU-28 Member States
page 62 of 79
Annex A. Methodological Considerations
This section of the Annex is based to a large extent on the methodological considerations already
presented in earlier VAT Gap Reports. More detailed considerations regarding the approaches to
estimate the VAT Gap are presented in the seminal VAT Gap Report (Barbone et al., 2013) and the
European Commission (2016).
I. Source of Revisions of VAT Gap Estimates
Every year, the estimates of the VAT Gap are updated and revised backwards. There are three
different sources of such revisions, which are beyond our control at the moment of publication.
These are:
1) Updates in the underlying national accounts data published by Eurostat: updates in VAT
revenues, new supply and use tables, and revised industry specific growth rates, among others.
2) Updates in the estimated GFCF liability, based on the new information from the own resource
submissions (ORS) on taxable shares of GFCF by five sectors: households, government, NPISH, and
exempt financial and non-financial enterprises.
3) Revision of the parameters of the VTTL model: effective rates, pro-rata coefficients, and net
adjustments, either due to new information from ORS or due to correcting errors in the previous
computation.
In nominal terms, the most significant revisions in 2017 concerned the VTTL of the United Kingdom
and France. The revision of the VTTL in the United Kingdom resulted from the amended treatment
of the refunds that, contrary to the convention used by HMRC, are not deducted from the receipt
and thus do not decrease the VTTL. The revisions for France were possible thanks to detailed data
on household final consumption structure received from the French Authorities. These revisions
result from multiple meetings and exchanges, which picture a very good collaboration between
national tax administrations, CASE and the European Commission.
Another significant revision concerned Croatia, which substantially revised its national accounts
figures. Moreover, thanks to the information provided as of this year, we were able to accurately
account for the MOSS retention fee for the three MS16 receiving the non-negligible collection of
its revenue for providing electronic services abroad. In 2017, the MS of identification retains 15
percent (a decrease of 15 percentage points and, equivalently, half of the amount with respect to
2016) of the VAT payments to be transferred to the MS of consumption.
The estimates of the VAT Gap were also somewhat affected by the changes in the ESA standard
of compiling VAT revenue data, which currently include a change in the pace of VAT refunds.
Thanks to this amendment, the VTTL, which is estimated on the accrual basis, is now better aligned
with VAT collections figures. This improves the accuracy of estimates and eliminates one of the
sources of criticism of our method.
16 i.e. Cyprus, Luxembourg and Malta.
VAT Gap in the EU-28 Member States
page 63 of 79
II. Decomposition of VAT Revenue
As VAT Revenue (VR) is the difference between the VTTL and the VAT Gap ( 𝑉𝑅 = 𝑉𝑇𝑇𝐿 −
𝑉𝐴𝑇 𝐺𝑎𝑝) , and the VTTL is a product of the effective rate and the base ( 𝑉𝑇𝑇𝐿 =
𝑒𝑓𝑓𝑒𝑐𝑡𝑖𝑣𝑒 𝑟𝑎𝑡𝑒 × 𝑏𝑎𝑠𝑒), VAT revenue could be decomposed using the following formula:
𝑉𝑅 = 𝑉𝑇𝑇𝐿 × 𝑉𝐴𝑇 𝑐𝑜𝑚𝑝𝑙𝑖𝑎𝑛𝑐𝑒 = 𝑒𝑓𝑓𝑒𝑐𝑡𝑖𝑣𝑒 𝑟𝑎𝑡𝑒 × 𝑏𝑎𝑠𝑒 × (1 −𝑉𝐴𝑇 𝐺𝑎𝑝
𝑉𝑇𝑇𝐿)
Thus, the year-over-rear relative change in revenue is denoted as:
∆𝑉𝑅
𝑉𝑅=
∆(𝑒𝑓𝑓𝑒𝑐𝑡𝑖𝑣𝑒 𝑟𝑎𝑡𝑒)
𝑒𝑓𝑓𝑒𝑐𝑡𝑖𝑣𝑒 𝑟𝑎𝑡𝑒×
∆𝑏𝑎𝑠𝑒
𝑏𝑎𝑠𝑒×
∆ (1 −𝑉𝐴𝑇 𝐺𝑎𝑝
𝑉𝑇𝑇𝐿)
(1 −𝑉𝐴𝑇 𝐺𝑎𝑝
𝑉𝑇𝑇𝐿)
⁄
where ∆(𝑒𝑓𝑓𝑒𝑐𝑡𝑖𝑣𝑒 𝑟𝑎𝑡𝑒)
𝑒𝑓𝑓𝑒𝑐𝑡𝑖𝑣𝑒 𝑟𝑎𝑡𝑒 denotes change in effective rate,
∆𝑏𝑎𝑠𝑒
𝑏𝑎𝑠𝑒 denotes change in base, and
∆ (1 −𝑉𝐴𝑇 𝐺𝑎𝑝
𝑉𝑇𝑇𝐿)
(1 −𝑉𝐴𝑇 𝐺𝑎𝑝
𝑉𝑇𝑇𝐿)
⁄ denotes change in VAT compliance.
III. Data Sources and Estimation Method
The “top-down” method that is utilised for VAT Gap estimation relies on national accounts figures.
These figures are used to estimate the VAT liability generated by different sub-aggregates of the
total economy. The VTTL is estimated as the sum of the liability from six main components:
household, government, and NPISH final consumption; intermediate consumption; GFCF; and
other, largely country-specific, adjustments.
In the “top-down” approach, VTTL is estimated using the following formula:
𝑉𝑇𝑇𝐿 = ∑(𝑟𝑎𝑡𝑒𝑖 × 𝑉𝑎𝑙𝑢𝑒𝑖)
𝑁
𝑖=1
+ ∑(𝑟𝑎𝑡𝑒𝑖 × 𝑝𝑟𝑜𝑝𝑒𝑥𝑖 × 𝐼𝐶 𝑉𝑎𝑙𝑢𝑒𝑖)
𝑁
𝑖=1
+ ∑(𝑟𝑎𝑡𝑒𝑖 × 𝑝𝑟𝑜𝑝𝑒𝑥𝑖 × 𝐺𝐹𝐶𝐹 𝑉𝑎𝑙𝑢𝑒𝑖) +
𝑁
𝑖=1
𝑛𝑒𝑡 𝑎𝑑𝑗𝑢𝑠𝑡𝑚𝑒𝑛𝑡𝑠
Where:
Rate is the effective rate,
Value is the final consumption value,
IC Value is the value of intermediate consumption,
Propex is the percentage of output in a given sector that is exempt from VAT,
GFCF Value is the value of gross fixed capital formation, and
index i denotes sectors of the economy.
VAT Gap in the EU-28 Member States
page 64 of 79
To summarise, VTTL is a product of the VAT rates and the propexes multiplied by the theoretical
values of consumption and investment (plus country-specific net adjustments).
For the purpose of VAT Gap estimation, roughly 10,000 parameters are estimated for each year,
including the effective rates for each 2-digit CPA (i.e. 𝑟𝑎𝑡𝑒𝑖 in the VTTL formula presented above)
group of products and services and the percentage of output in a given sector that is exempt from
VAT for each type of consumption (i.e. propexi in the VTTL formula presented above). For instance,
for Education services (CPA no. 85) in Croatia, like for any other country and group of products
and services, we estimated effective rates in household, government, and NPISH final
consumption, as well as the percentage of output that is exempt from VAT. The main source of
information is national accounts data and Own Resource Submissions (ORS), i.e. VAT statements
provided by MS to the European Commission. In a number of specific cases where the ORS
information was insufficient, additional data provided by MS were used. As these data are not
official Eurostat publications, we decline responsibility for inaccuracies related to their quality.
A complete description of data and sources is shown in Table A1.
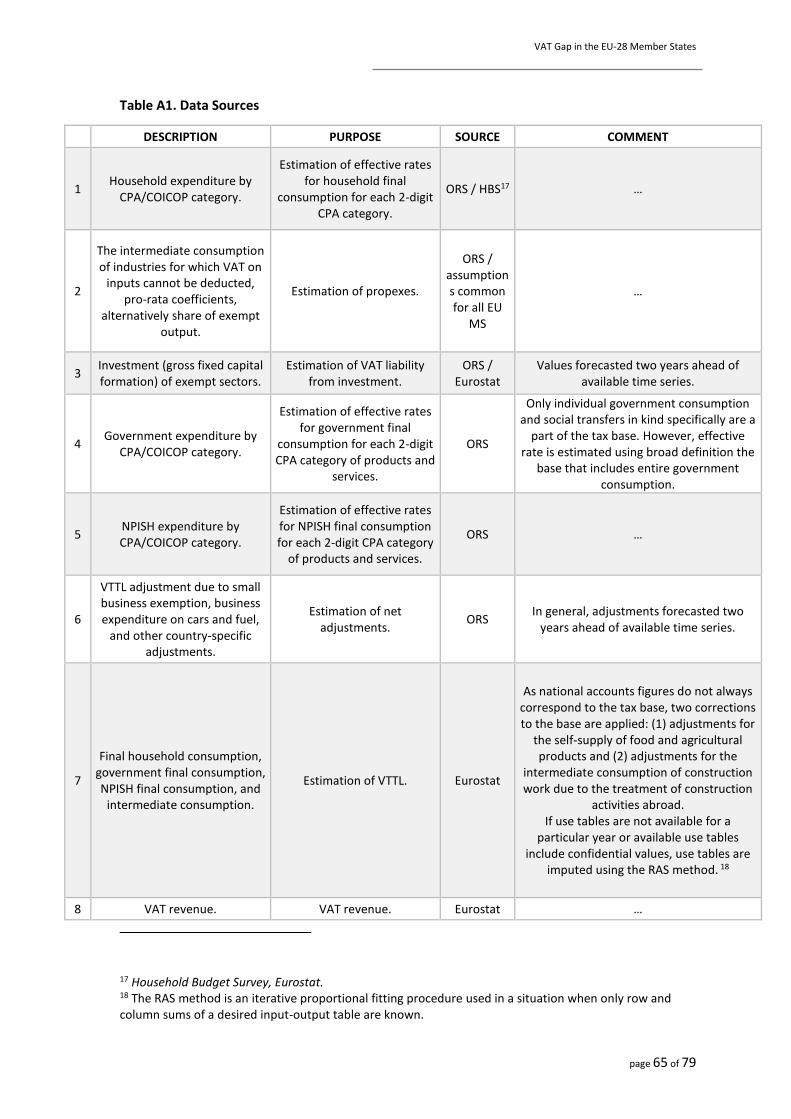
VAT Gap in the EU-28 Member States
page 65 of 79
Table A1. Data Sources
DESCRIPTION PURPOSE SOURCE COMMENT
1 Household expenditure by
CPA/COICOP category.
Estimation of effective rates for household final
consumption for each 2-digit CPA category.
ORS / HBS17 …
2
The intermediate consumption of industries for which VAT on
inputs cannot be deducted, pro-rata coefficients,
alternatively share of exempt output.
Estimation of propexes.
ORS / assumptions common for all EU
MS
…
3 Investment (gross fixed capital formation) of exempt sectors.
Estimation of VAT liability from investment.
ORS / Eurostat
Values forecasted two years ahead of available time series.
4 Government expenditure by
CPA/COICOP category.
Estimation of effective rates for government final
consumption for each 2-digit CPA category of products and
services.
ORS
Only individual government consumption and social transfers in kind specifically are a
part of the tax base. However, effective rate is estimated using broad definition the
base that includes entire government consumption.
5 NPISH expenditure by CPA/COICOP category.
Estimation of effective rates for NPISH final consumption for each 2-digit CPA category
of products and services.
ORS …
6
VTTL adjustment due to small business exemption, business expenditure on cars and fuel,
and other country-specific adjustments.
Estimation of net adjustments.
ORS In general, adjustments forecasted two
years ahead of available time series.
7
Final household consumption, government final consumption, NPISH final consumption, and
intermediate consumption.
Estimation of VTTL. Eurostat
As national accounts figures do not always correspond to the tax base, two corrections to the base are applied: (1) adjustments for
the self-supply of food and agricultural products and (2) adjustments for the
intermediate consumption of construction work due to the treatment of construction
activities abroad. If use tables are not available for a
particular year or available use tables include confidential values, use tables are
imputed using the RAS method. 18
8 VAT revenue. VAT revenue. Eurostat …
17 Household Budget Survey, Eurostat. 18 The RAS method is an iterative proportional fitting procedure used in a situation when only row and column sums of a desired input-output table are known.

VAT Gap in the EU-28 Member States
page 66 of 79
IV. Fast VAT Gap estimates
The methodology used to estimate the VTTL for 2018 differs markedly from the one employed to
estimate the VTTL for 2013-2017. The main simplifications and assumptions include:
1) Structure of household final consumption does not change with respect to 2017. In fact,
due to unavailability of up-to-date figures, it relies in most of the cases on a three-year
lagged series.
2) Non-deductible GFCF liability changes in line with the year-over-year change in
government GFCF published by AMECO.19
3) In the vast majority of cases where there are no significant changes in the statutory rates,
net adjustments and intermediate consumption liability are rescaled from 2017 using
growth rates for the entire tax base.
Due to the simplified methodology, the figures for 2018 are referred to as “fast estimates” or
“forecasts” since uncertainty around these numbers is substantially larger than for the full
estimates. For three Member States, namely Cyprus, Malta, and Luxembourg, where the
estimation error was exceptionally large due to the considerable role of country-specific
adjustments, these estimates need more refinement, therefore we decided not to publish them.
The accuracy of the fast estimates depends on the stability of the structure of the liability
components, which results, among others, from economic conditions and tax policies. In our
training period 2014-2017, the root of the mean squared error of the fast estimates was equal to
0.038. This translates to approximately 0.4 percentage point correction to the results derived
using full estimation procedure. However, in the case of sudden changes that may happen in the
future, the inaccuracy will likely be higher.
V. Derivation of the Policy Gap
This section of the Annex defines the concepts used in Chapter V for estimating foregone revenue
due to policies introduced and discusses some of the methodological considerations.
We begin with the Notional Ideal Revenue that, by definition, should indicate an upper limit of
VAT revenue (i.e. the revenue levied at a uniform rate in the environment of perfect tax
compliance). As shown in Figure A1, ideal revenue is larger than VTTL and subsequently larger
than VAT collection. However, due to the existence of exemptions, it does not capture the entire
VTTL and tax collection. If no exemptions were applied, neither intermediate consumption nor the
GFCF of the business sector would be the base for computing VTTL.
The problem arises when deciding whether investment by the non-business sector should be part
of the VAT base. According to the OECD (2014), Notional Ideal Revenue is defined as the standard
rate of VAT times the aggregate net final consumption. Multiplying the standard rate and final
consumption would yield, however, lower liability than in the case where a country applied no
exemptions, no reduced rates, and was able to enforce all tax payments. In real life, VTTL is
comprised partially from VAT liability from investment made by households, government, and
19 https://ec.europa.eu/info/business-economy-euro/indicators-statistics/economic-databases/macro-economic-database-ameco_en

VAT Gap in the EU-28 Member States
page 67 of 79
NPISH. In the case of the non-inclusion of this investment to the base, VTTL would be partially
extended beyond the ideal revenue despite “no exemptions” present in the system (see Figure A1
(c)).
Policymakers can see the upper limit of VAT revenue by considering all final use categories of the
household, non-profit, and government sectors. Thus, in this Report, Notional Ideal Revenue is
defined as the standard rate of VAT times the aggregate net final and net GFCF of the household,
non-profit, and government sectors, as recorded in the national accounts (interdependence
among the various concepts presented is shown in Figure A1).20
The Policy Gap is defined as one minus the ratio of the “legal” tax liability (i.e. the chunk of the
Notional Ideal Revenue that, in the counterfactual case of perfect tax compliance, is not collected
due to the presence of exemptions and reduced rates). The Policy Gap is denoted by the following
formula:
Policy Gap = (Notional Ideal Revenue – VTTL)/Notional Ideal Revenue
The Policy Gap could be further decomposed to account for the loss of revenue. Such components
are the Rate Gap and the Exemption Gap, which capture the loss in VAT liability due to the
application of reduced rates and the loss in liability due to the implementation of exemptions.
The Rate Gap is defined as the difference between the VTTL and what would be obtained in a
counterfactual situation, in which the standard rate, instead of the reduced, parking, and zero
rates, is applied to final consumption. Thus, the Rate Gap captures the loss in revenue that a
particular country incurs by adopting multiple VAT rates instead of a single standard rate (Barbone
et al., 2015).
The Exemption Gap is defined as the difference between the VTTL and what would be obtained in
a counterfactual situation, in which the standard rate is applied to exempt products and services,
and no restriction of the right to deduct applies.21 Thus, the Exemption Gap captures the amount
of revenue that might be lost because of exempted goods and services. Note that the Exemption
Gap is composed of the loss in the VAT on the value added of exempt sectors, minus the VAT on
their inputs, minus the VAT on GFCF inputs for these sectors. Thus, in principle, the Exemption
Gap might be positive or negative (if the particular sector had negative value added, or if it had
large GFCF expenditures relative to final consumption) (Barbone et al., 2015).
In algebraic terms, we have the following:
20 National accounts for most countries report final consumption on a gross (i.e. VAT-inclusive) basis. Net consumption is estimated on the basis of the gross consumption recorded in the use tables, from which VAT revenues are subtracted. 21 The additive decomposition of the Policy Gap into the Exemption and Rate Gap presented in this Report differs from that in Keen (2013). Keen (2013) defines the Rate Gap as the loss from applying reduced and zero rates to the final consumption liability, measured as a percentage of the Notional Ideal Revenue. The Exemption Gap measures unrecovered VAT accumulated in the production process as a percentage, on the contrary, of final consumption liability. Due to these definitions, the Policy Gap can be split multiplicatively into gaps attributable to reduced rates and exemptions. Since the numerator of the “[1 - Rate Gap]” and denominator of the “[1 - Exemption Gap]” are equal, multiplication of these two components yields – VAT revenue as a percentage of Notional Ideal Revenue, which equals “[1 - Policy Gap]” (Barbone et al., 2015).
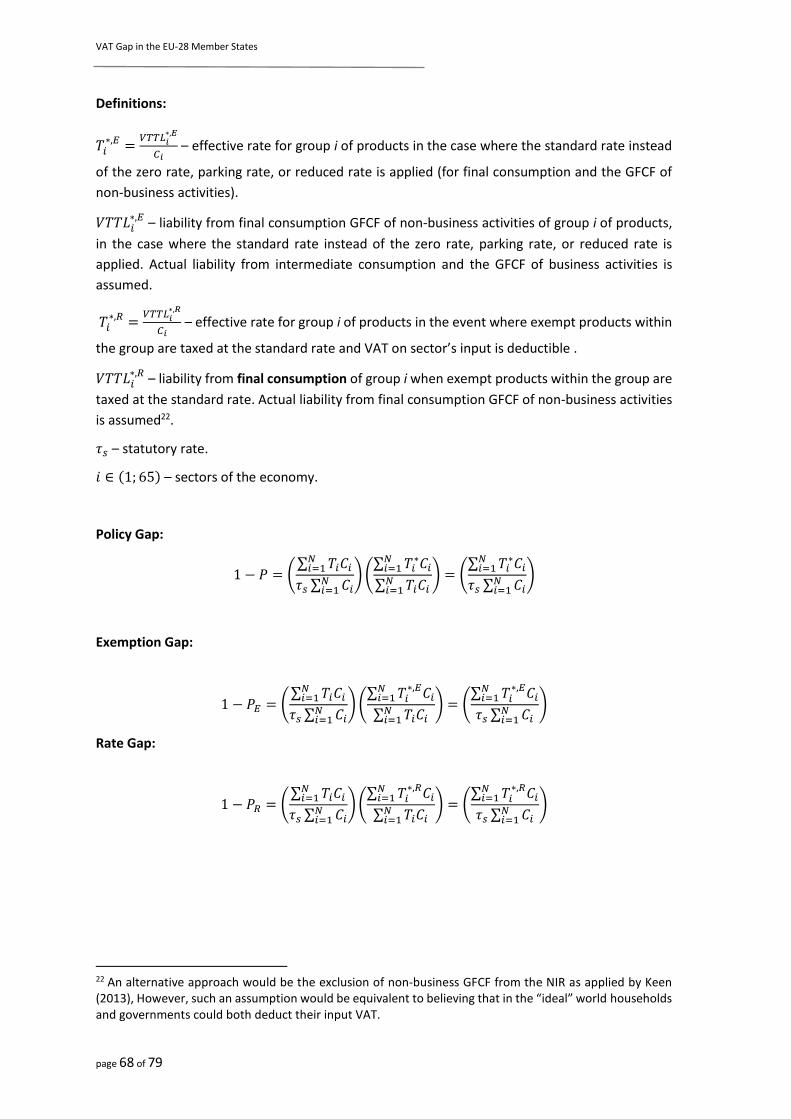
VAT Gap in the EU-28 Member States
page 68 of 79
Definitions:
𝑇𝑖∗,𝐸 =
𝑉𝑇𝑇𝐿𝑖∗,𝐸
𝐶𝑖 – effective rate for group i of products in the case where the standard rate instead
of the zero rate, parking rate, or reduced rate is applied (for final consumption and the GFCF of
non-business activities).
𝑉𝑇𝑇𝐿𝑖∗,𝐸 – liability from final consumption GFCF of non-business activities of group i of products,
in the case where the standard rate instead of the zero rate, parking rate, or reduced rate is
applied. Actual liability from intermediate consumption and the GFCF of business activities is
assumed.
𝑇𝑖∗,𝑅 =
𝑉𝑇𝑇𝐿𝑖∗,𝑅
𝐶𝑖 – effective rate for group i of products in the event where exempt products within
the group are taxed at the standard rate and VAT on sector’s input is deductible .
𝑉𝑇𝑇𝐿𝑖∗,𝑅 – liability from final consumption of group i when exempt products within the group are
taxed at the standard rate. Actual liability from final consumption GFCF of non-business activities
is assumed22.
𝜏𝑠 – statutory rate.
𝑖 ∈ (1; 65) – sectors of the economy.
Policy Gap:
1 − 𝑃 = (∑ 𝑇𝑖𝐶𝑖
𝑁𝑖=1
𝜏𝑠 ∑ 𝐶𝑖𝑁𝑖=1
) (∑ 𝑇𝑖
∗𝐶𝑖𝑁𝑖=1
∑ 𝑇𝑖𝐶𝑖𝑁𝑖=1
) = (∑ 𝑇𝑖
∗𝐶𝑖𝑁𝑖=1
𝜏𝑠 ∑ 𝐶𝑖𝑁𝑖=1
)
Exemption Gap:
1 − 𝑃𝐸 = (∑ 𝑇𝑖𝐶𝑖
𝑁𝑖=1
𝜏𝑠 ∑ 𝐶𝑖𝑁𝑖=1
) (∑ 𝑇𝑖
∗,𝐸𝐶𝑖𝑁𝑖=1
∑ 𝑇𝑖𝐶𝑖𝑁𝑖=1
) = (∑ 𝑇𝑖
∗,𝐸𝐶𝑖𝑁𝑖=1
𝜏𝑠 ∑ 𝐶𝑖𝑁𝑖=1
)
Rate Gap:
1 − 𝑃𝑅 = (∑ 𝑇𝑖𝐶𝑖
𝑁𝑖=1
𝜏𝑠 ∑ 𝐶𝑖𝑁𝑖=1
) (∑ 𝑇𝑖
∗,𝑅𝐶𝑖𝑁𝑖=1
∑ 𝑇𝑖𝐶𝑖𝑁𝑖=1
) = (∑ 𝑇𝑖
∗,𝑅𝐶𝑖𝑁𝑖=1
𝜏𝑠 ∑ 𝐶𝑖𝑁𝑖=1
)
22 An alternative approach would be the exclusion of non-business GFCF from the NIR as applied by Keen (2013), However, such an assumption would be equivalent to believing that in the “ideal” world households and governments could both deduct their input VAT.
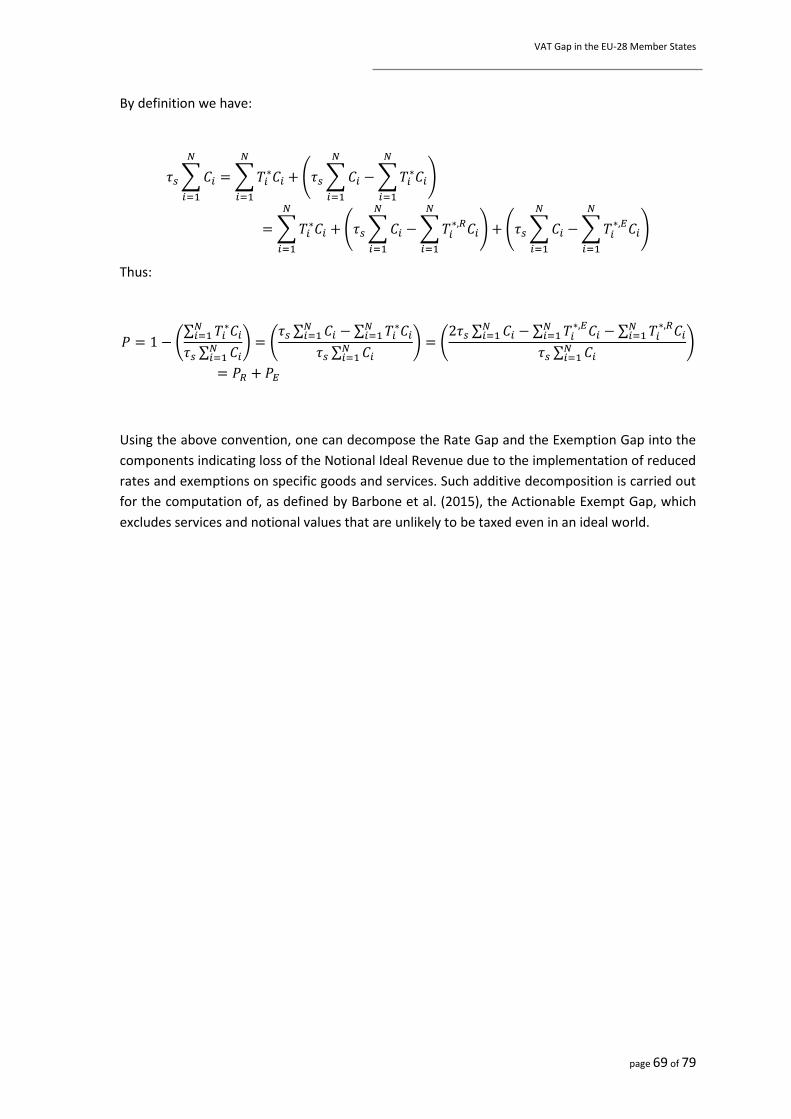
VAT Gap in the EU-28 Member States
page 69 of 79
By definition we have:
𝜏𝑠 ∑ 𝐶𝑖
𝑁
𝑖=1
= ∑ 𝑇𝑖∗𝐶𝑖
𝑁
𝑖=1
+ (𝜏𝑠 ∑ 𝐶𝑖
𝑁
𝑖=1
− ∑ 𝑇𝑖∗𝐶𝑖
𝑁
𝑖=1
)
= ∑ 𝑇𝑖∗𝐶𝑖
𝑁
𝑖=1
+ (𝜏𝑠 ∑ 𝐶𝑖
𝑁
𝑖=1
− ∑ 𝑇𝑖∗,𝑅𝐶𝑖
𝑁
𝑖=1
) + (𝜏𝑠 ∑ 𝐶𝑖
𝑁
𝑖=1
− ∑ 𝑇𝑖∗,𝐸𝐶𝑖
𝑁
𝑖=1
)
Thus:
𝑃 = 1 − (∑ 𝑇𝑖
∗𝐶𝑖𝑁𝑖=1
𝜏𝑠 ∑ 𝐶𝑖𝑁𝑖=1
) = (𝜏𝑠 ∑ 𝐶𝑖
𝑁𝑖=1 − ∑ 𝑇𝑖
∗𝐶𝑖𝑁𝑖=1
𝜏𝑠 ∑ 𝐶𝑖𝑁𝑖=1
) = (2𝜏𝑠 ∑ 𝐶𝑖
𝑁𝑖=1 − ∑ 𝑇𝑖
∗,𝐸𝐶𝑖𝑁𝑖=1 − ∑ 𝑇𝑖
∗,𝑅𝐶𝑖𝑁𝑖=1
𝜏𝑠 ∑ 𝐶𝑖𝑁𝑖=1
)
= 𝑃𝑅 + 𝑃𝐸
Using the above convention, one can decompose the Rate Gap and the Exemption Gap into the
components indicating loss of the Notional Ideal Revenue due to the implementation of reduced
rates and exemptions on specific goods and services. Such additive decomposition is carried out
for the computation of, as defined by Barbone et al. (2015), the Actionable Exempt Gap, which
excludes services and notional values that are unlikely to be taxed even in an ideal world.
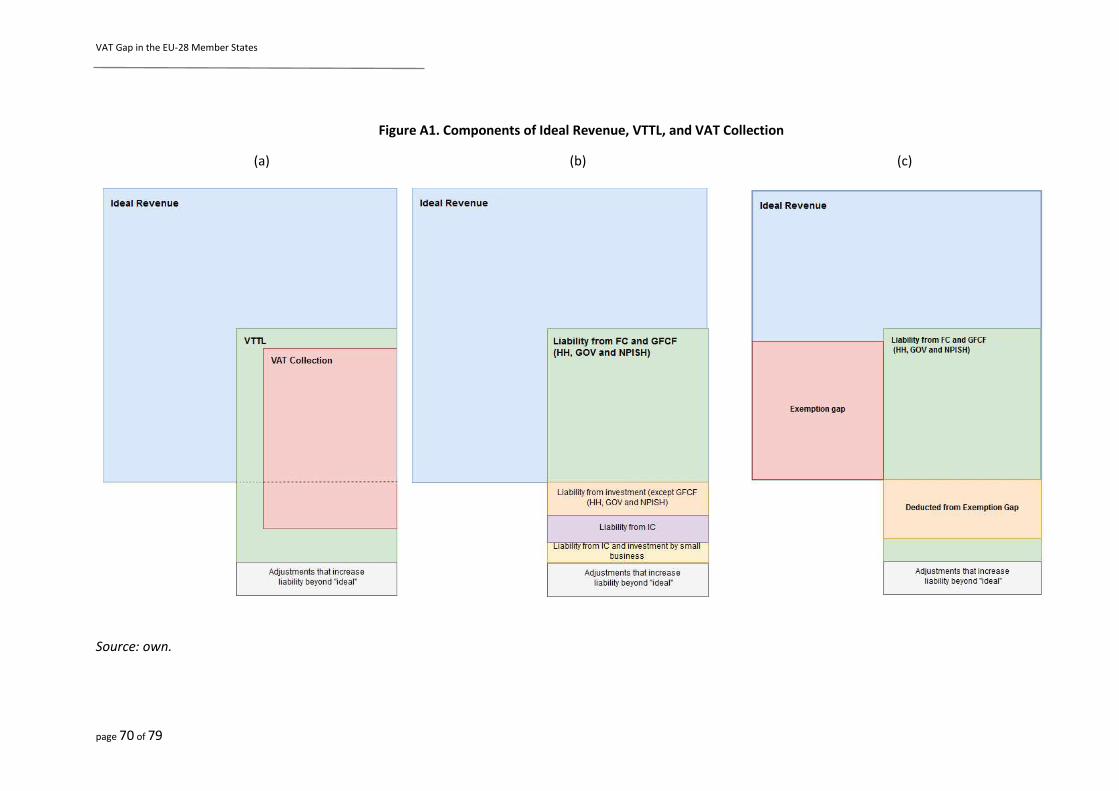
VAT Gap in the EU-28 Member States
page 70 of 79
Figure A1. Components of Ideal Revenue, VTTL, and VAT Collection
(a) (b) (c)
Source: own.
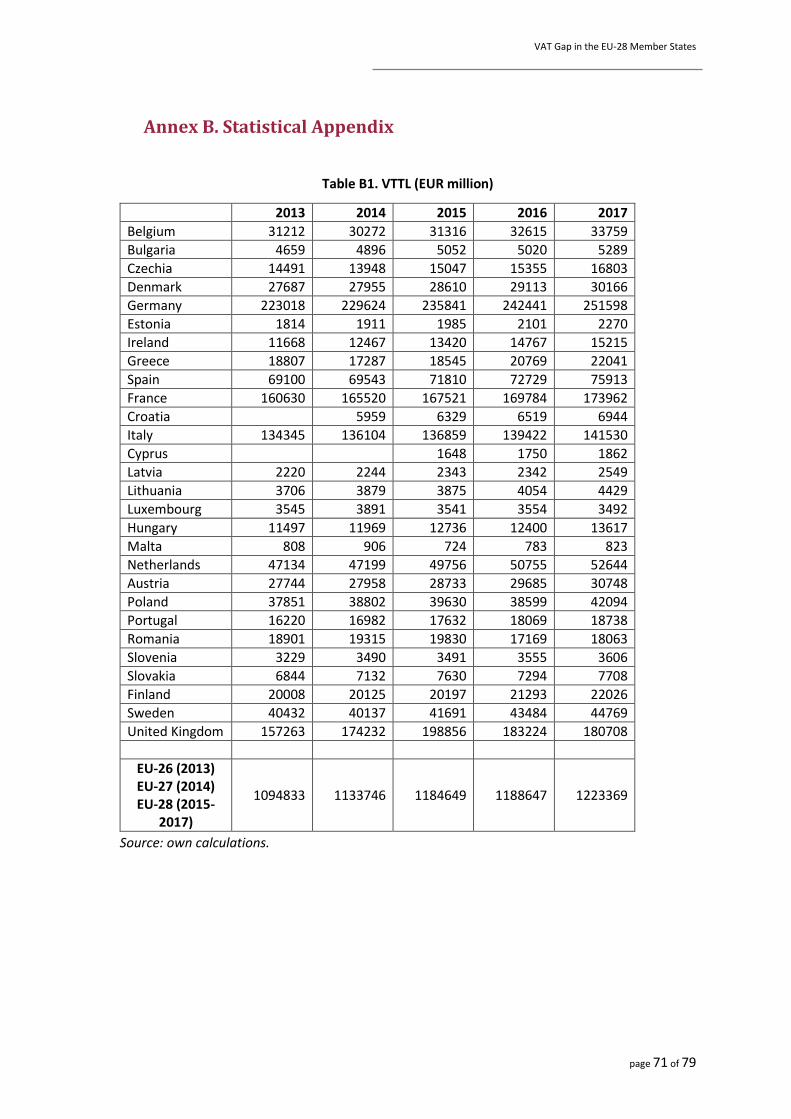
VAT Gap in the EU-28 Member States
page 71 of 79
Annex B. Statistical Appendix
Table B1. VTTL (EUR million)
2013 2014 2015 2016 2017
Belgium 31212 30272 31316 32615 33759
Bulgaria 4659 4896 5052 5020 5289
Czechia 14491 13948 15047 15355 16803
Denmark 27687 27955 28610 29113 30166
Germany 223018 229624 235841 242441 251598
Estonia 1814 1911 1985 2101 2270
Ireland 11668 12467 13420 14767 15215
Greece 18807 17287 18545 20769 22041
Spain 69100 69543 71810 72729 75913
France 160630 165520 167521 169784 173962
Croatia 5959 6329 6519 6944
Italy 134345 136104 136859 139422 141530
Cyprus 1648 1750 1862
Latvia 2220 2244 2343 2342 2549
Lithuania 3706 3879 3875 4054 4429
Luxembourg 3545 3891 3541 3554 3492
Hungary 11497 11969 12736 12400 13617
Malta 808 906 724 783 823
Netherlands 47134 47199 49756 50755 52644
Austria 27744 27958 28733 29685 30748
Poland 37851 38802 39630 38599 42094
Portugal 16220 16982 17632 18069 18738
Romania 18901 19315 19830 17169 18063
Slovenia 3229 3490 3491 3555 3606
Slovakia 6844 7132 7630 7294 7708
Finland 20008 20125 20197 21293 22026
Sweden 40432 40137 41691 43484 44769
United Kingdom 157263 174232 198856 183224 180708
EU-26 (2013) EU-27 (2014) EU-28 (2015-
2017)
1094833 1133746 1184649 1188647 1223369
Source: own calculations.
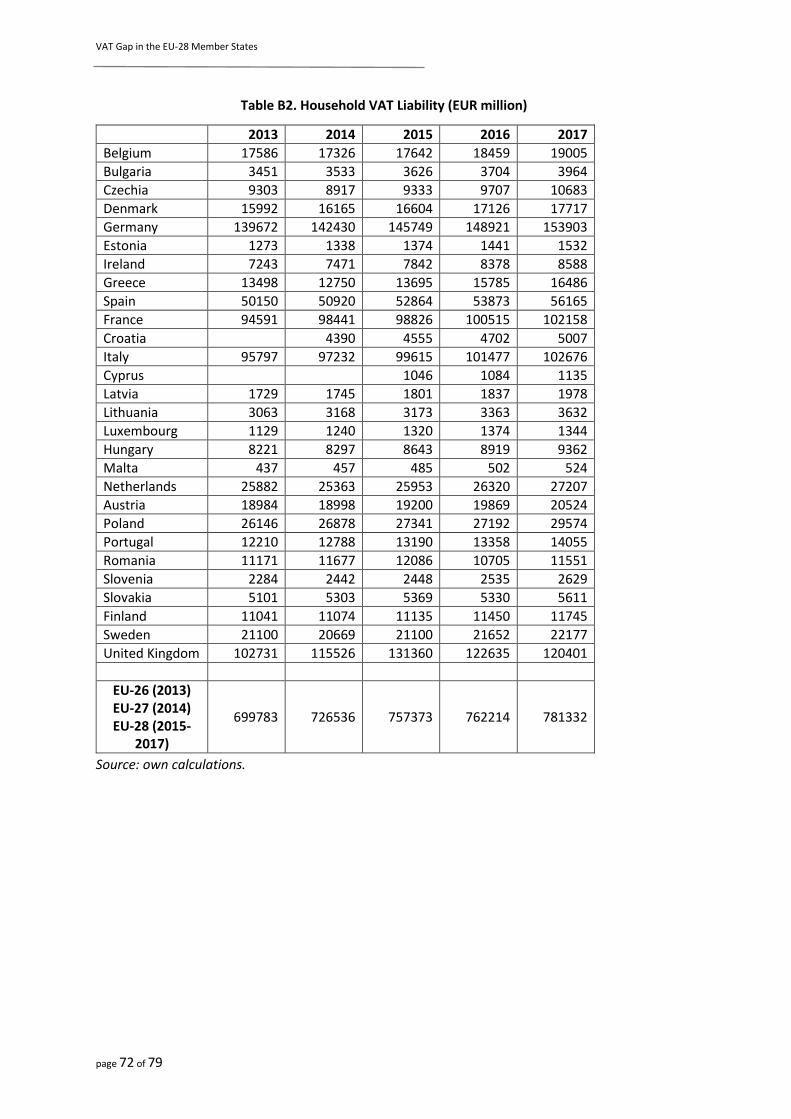
VAT Gap in the EU-28 Member States
page 72 of 79
Table B2. Household VAT Liability (EUR million)
2013 2014 2015 2016 2017
Belgium 17586 17326 17642 18459 19005
Bulgaria 3451 3533 3626 3704 3964
Czechia 9303 8917 9333 9707 10683
Denmark 15992 16165 16604 17126 17717
Germany 139672 142430 145749 148921 153903
Estonia 1273 1338 1374 1441 1532
Ireland 7243 7471 7842 8378 8588
Greece 13498 12750 13695 15785 16486
Spain 50150 50920 52864 53873 56165
France 94591 98441 98826 100515 102158
Croatia 4390 4555 4702 5007
Italy 95797 97232 99615 101477 102676
Cyprus 1046 1084 1135
Latvia 1729 1745 1801 1837 1978
Lithuania 3063 3168 3173 3363 3632
Luxembourg 1129 1240 1320 1374 1344
Hungary 8221 8297 8643 8919 9362
Malta 437 457 485 502 524
Netherlands 25882 25363 25953 26320 27207
Austria 18984 18998 19200 19869 20524
Poland 26146 26878 27341 27192 29574
Portugal 12210 12788 13190 13358 14055
Romania 11171 11677 12086 10705 11551
Slovenia 2284 2442 2448 2535 2629
Slovakia 5101 5303 5369 5330 5611
Finland 11041 11074 11135 11450 11745
Sweden 21100 20669 21100 21652 22177
United Kingdom 102731 115526 131360 122635 120401
EU-26 (2013) EU-27 (2014) EU-28 (2015-
2017)
699783 726536 757373 762214 781332
Source: own calculations.
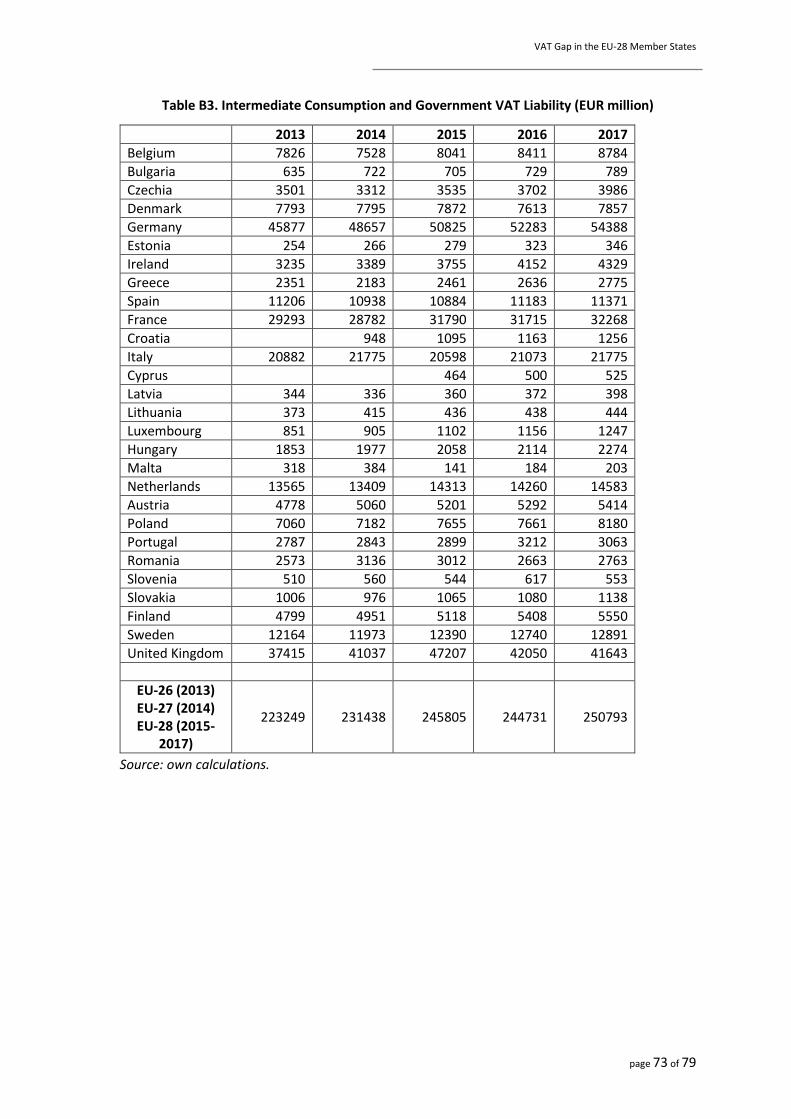
VAT Gap in the EU-28 Member States
page 73 of 79
Table B3. Intermediate Consumption and Government VAT Liability (EUR million)
2013 2014 2015 2016 2017
Belgium 7826 7528 8041 8411 8784
Bulgaria 635 722 705 729 789
Czechia 3501 3312 3535 3702 3986
Denmark 7793 7795 7872 7613 7857
Germany 45877 48657 50825 52283 54388
Estonia 254 266 279 323 346
Ireland 3235 3389 3755 4152 4329
Greece 2351 2183 2461 2636 2775
Spain 11206 10938 10884 11183 11371
France 29293 28782 31790 31715 32268
Croatia 948 1095 1163 1256
Italy 20882 21775 20598 21073 21775
Cyprus 464 500 525
Latvia 344 336 360 372 398
Lithuania 373 415 436 438 444
Luxembourg 851 905 1102 1156 1247
Hungary 1853 1977 2058 2114 2274
Malta 318 384 141 184 203
Netherlands 13565 13409 14313 14260 14583
Austria 4778 5060 5201 5292 5414
Poland 7060 7182 7655 7661 8180
Portugal 2787 2843 2899 3212 3063
Romania 2573 3136 3012 2663 2763
Slovenia 510 560 544 617 553
Slovakia 1006 976 1065 1080 1138
Finland 4799 4951 5118 5408 5550
Sweden 12164 11973 12390 12740 12891
United Kingdom 37415 41037 47207 42050 41643
EU-26 (2013) EU-27 (2014) EU-28 (2015-
2017)
223249 231438 245805 244731 250793
Source: own calculations.
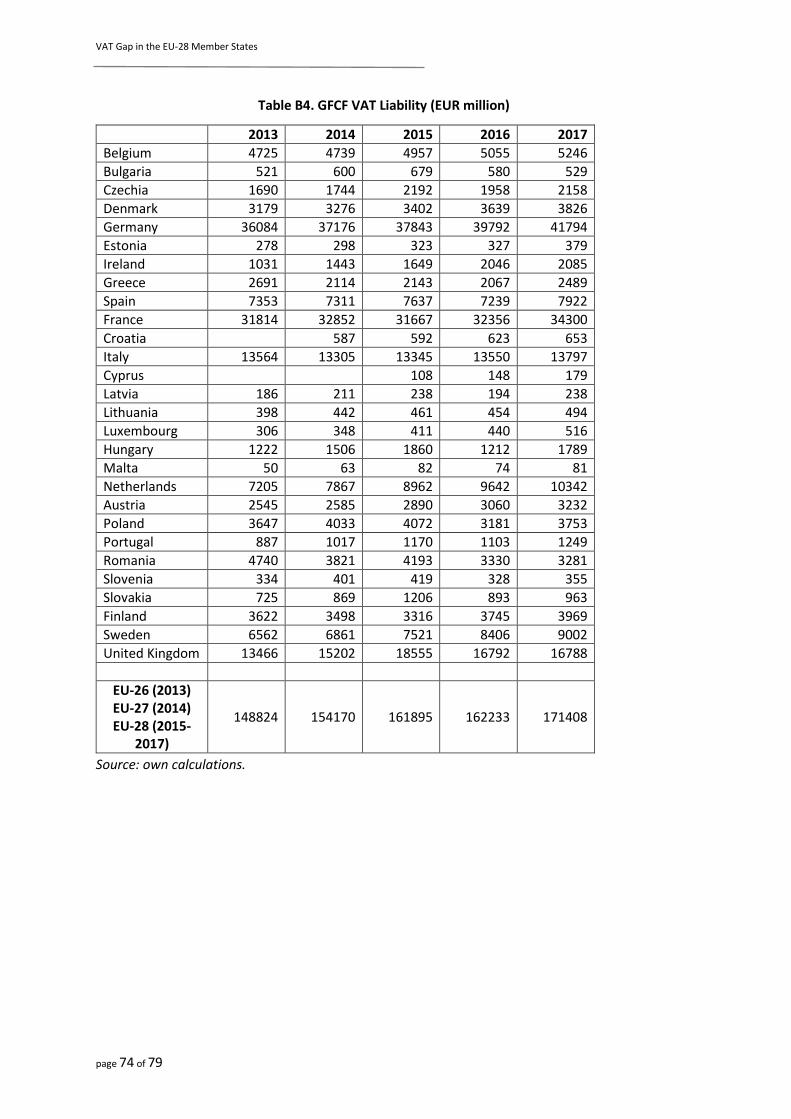
VAT Gap in the EU-28 Member States
page 74 of 79
Table B4. GFCF VAT Liability (EUR million)
2013 2014 2015 2016 2017
Belgium 4725 4739 4957 5055 5246
Bulgaria 521 600 679 580 529
Czechia 1690 1744 2192 1958 2158
Denmark 3179 3276 3402 3639 3826
Germany 36084 37176 37843 39792 41794
Estonia 278 298 323 327 379
Ireland 1031 1443 1649 2046 2085
Greece 2691 2114 2143 2067 2489
Spain 7353 7311 7637 7239 7922
France 31814 32852 31667 32356 34300
Croatia 587 592 623 653
Italy 13564 13305 13345 13550 13797
Cyprus 108 148 179
Latvia 186 211 238 194 238
Lithuania 398 442 461 454 494
Luxembourg 306 348 411 440 516
Hungary 1222 1506 1860 1212 1789
Malta 50 63 82 74 81
Netherlands 7205 7867 8962 9642 10342
Austria 2545 2585 2890 3060 3232
Poland 3647 4033 4072 3181 3753
Portugal 887 1017 1170 1103 1249
Romania 4740 3821 4193 3330 3281
Slovenia 334 401 419 328 355
Slovakia 725 869 1206 893 963
Finland 3622 3498 3316 3745 3969
Sweden 6562 6861 7521 8406 9002
United Kingdom 13466 15202 18555 16792 16788
EU-26 (2013) EU-27 (2014) EU-28 (2015-
2017)
148824 154170 161895 162233 171408
Source: own calculations.
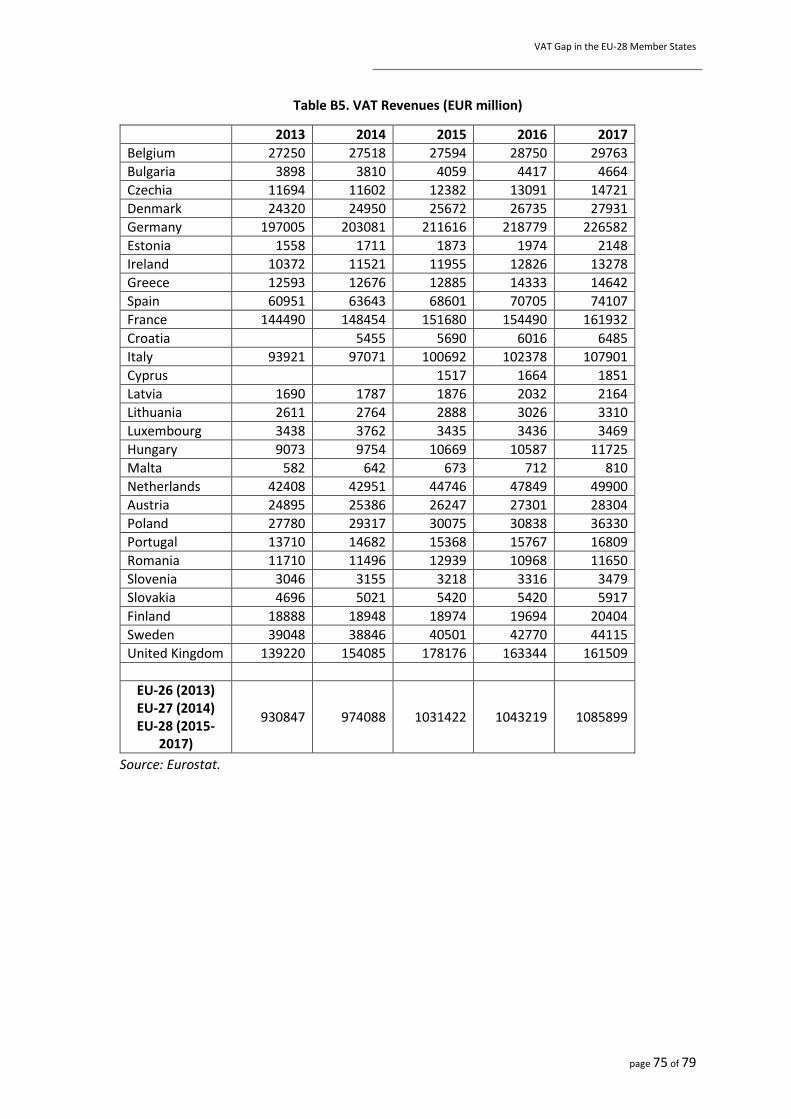
VAT Gap in the EU-28 Member States
page 75 of 79
Table B5. VAT Revenues (EUR million)
2013 2014 2015 2016 2017
Belgium 27250 27518 27594 28750 29763
Bulgaria 3898 3810 4059 4417 4664
Czechia 11694 11602 12382 13091 14721
Denmark 24320 24950 25672 26735 27931
Germany 197005 203081 211616 218779 226582
Estonia 1558 1711 1873 1974 2148
Ireland 10372 11521 11955 12826 13278
Greece 12593 12676 12885 14333 14642
Spain 60951 63643 68601 70705 74107
France 144490 148454 151680 154490 161932
Croatia 5455 5690 6016 6485
Italy 93921 97071 100692 102378 107901
Cyprus 1517 1664 1851
Latvia 1690 1787 1876 2032 2164
Lithuania 2611 2764 2888 3026 3310
Luxembourg 3438 3762 3435 3436 3469
Hungary 9073 9754 10669 10587 11725
Malta 582 642 673 712 810
Netherlands 42408 42951 44746 47849 49900
Austria 24895 25386 26247 27301 28304
Poland 27780 29317 30075 30838 36330
Portugal 13710 14682 15368 15767 16809
Romania 11710 11496 12939 10968 11650
Slovenia 3046 3155 3218 3316 3479
Slovakia 4696 5021 5420 5420 5917
Finland 18888 18948 18974 19694 20404
Sweden 39048 38846 40501 42770 44115
United Kingdom 139220 154085 178176 163344 161509
EU-26 (2013) EU-27 (2014) EU-28 (2015-
2017)
930847 974088 1031422 1043219 1085899
Source: Eurostat.
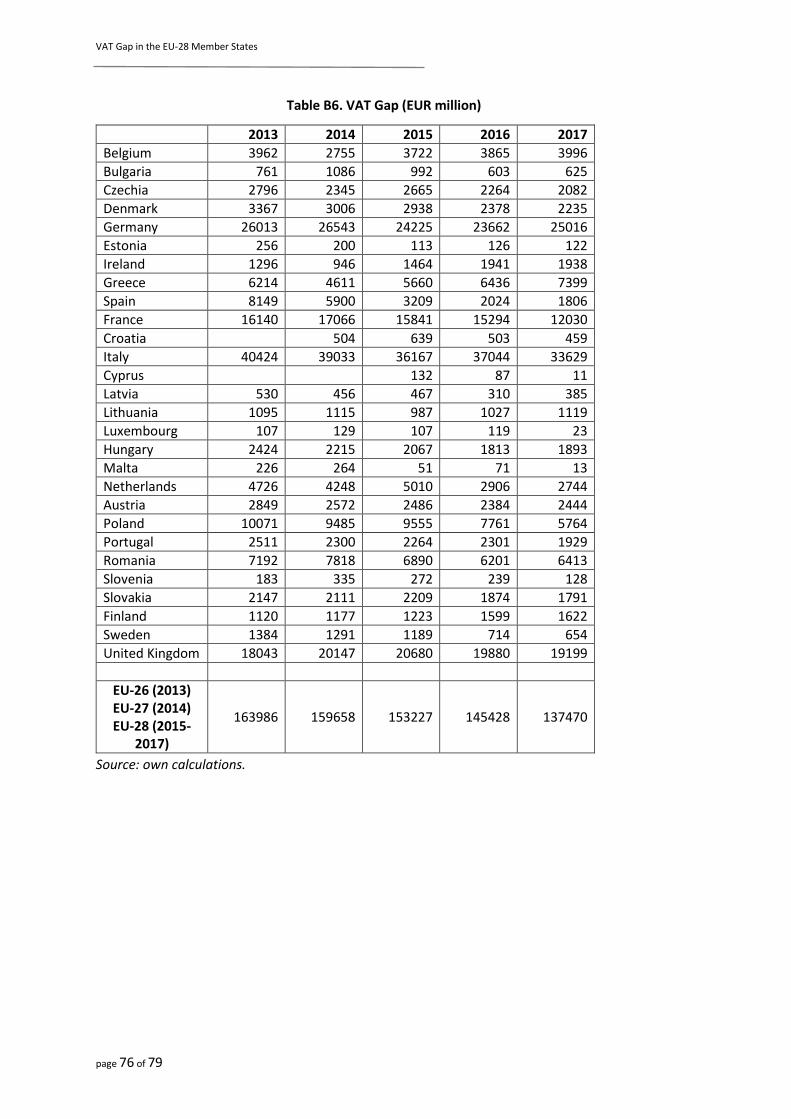
VAT Gap in the EU-28 Member States
page 76 of 79
Table B6. VAT Gap (EUR million)
2013 2014 2015 2016 2017
Belgium 3962 2755 3722 3865 3996
Bulgaria 761 1086 992 603 625
Czechia 2796 2345 2665 2264 2082
Denmark 3367 3006 2938 2378 2235
Germany 26013 26543 24225 23662 25016
Estonia 256 200 113 126 122
Ireland 1296 946 1464 1941 1938
Greece 6214 4611 5660 6436 7399
Spain 8149 5900 3209 2024 1806
France 16140 17066 15841 15294 12030
Croatia 504 639 503 459
Italy 40424 39033 36167 37044 33629
Cyprus 132 87 11
Latvia 530 456 467 310 385
Lithuania 1095 1115 987 1027 1119
Luxembourg 107 129 107 119 23
Hungary 2424 2215 2067 1813 1893
Malta 226 264 51 71 13
Netherlands 4726 4248 5010 2906 2744
Austria 2849 2572 2486 2384 2444
Poland 10071 9485 9555 7761 5764
Portugal 2511 2300 2264 2301 1929
Romania 7192 7818 6890 6201 6413
Slovenia 183 335 272 239 128
Slovakia 2147 2111 2209 1874 1791
Finland 1120 1177 1223 1599 1622
Sweden 1384 1291 1189 714 654
United Kingdom 18043 20147 20680 19880 19199
EU-26 (2013) EU-27 (2014) EU-28 (2015-
2017)
163986 159658 153227 145428 137470
Source: own calculations.
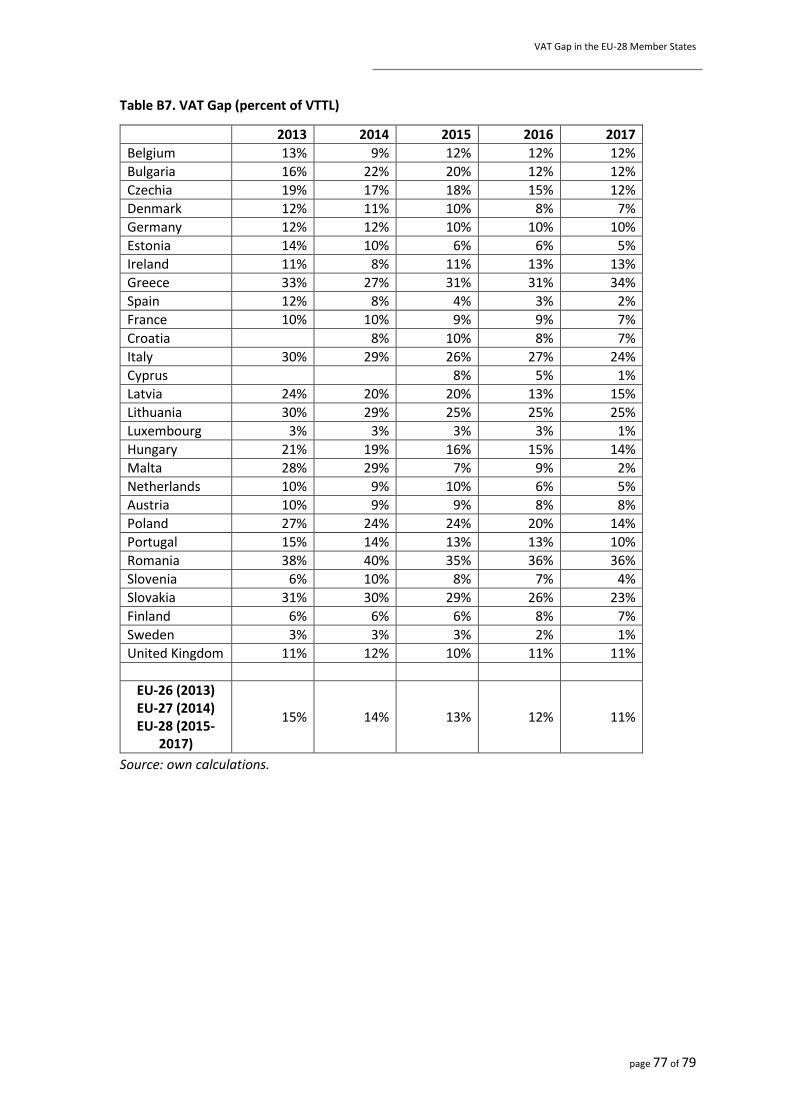
VAT Gap in the EU-28 Member States
page 77 of 79
Table B7. VAT Gap (percent of VTTL)
2013 2014 2015 2016 2017
Belgium 13% 9% 12% 12% 12%
Bulgaria 16% 22% 20% 12% 12%
Czechia 19% 17% 18% 15% 12%
Denmark 12% 11% 10% 8% 7%
Germany 12% 12% 10% 10% 10%
Estonia 14% 10% 6% 6% 5%
Ireland 11% 8% 11% 13% 13%
Greece 33% 27% 31% 31% 34%
Spain 12% 8% 4% 3% 2%
France 10% 10% 9% 9% 7%
Croatia 8% 10% 8% 7%
Italy 30% 29% 26% 27% 24%
Cyprus 8% 5% 1%
Latvia 24% 20% 20% 13% 15%
Lithuania 30% 29% 25% 25% 25%
Luxembourg 3% 3% 3% 3% 1%
Hungary 21% 19% 16% 15% 14%
Malta 28% 29% 7% 9% 2%
Netherlands 10% 9% 10% 6% 5%
Austria 10% 9% 9% 8% 8%
Poland 27% 24% 24% 20% 14%
Portugal 15% 14% 13% 13% 10%
Romania 38% 40% 35% 36% 36%
Slovenia 6% 10% 8% 7% 4%
Slovakia 31% 30% 29% 26% 23%
Finland 6% 6% 6% 8% 7%
Sweden 3% 3% 3% 2% 1%
United Kingdom 11% 12% 10% 11% 11%
EU-26 (2013) EU-27 (2014) EU-28 (2015-
2017)
15% 14% 13% 12% 11%
Source: own calculations.
VAT Gap in the EU-28 Member States
page 78 of 79
References
Allingham, M. G., A. Sandmo (1972), Income tax evasion: A theoretical analysis, Journal of Public
Economics, 1, 323-38.
Alm, J., B. R. Jackson, M. McKee (1993), Fiscal exchange, collective decision institutions, and tax
compliance, Journal of Economic Behavior & Organization, 22, 255-373.
Andreoni, J. (1992), IRS as loan shark tax compliance with borrowing constraints, Journal of Public
Economics, 49, 35-46.
Andreoni, J., B. Erard, J. Feinstein (1998), Tax compliance, Journal of Economic Literature, 36, 818-
860.
Barbone, L., M. Belkindas, L. Bettendorf, R. Bird, M. Bonch-Osmolovskiy, M. Smart (2013), Study
to quantify and analyse the VAT Gap in the EU-27 Member States, Final Report of project
TAXUD/2012/DE/316.
Barbone, L., M. Bonch-Osmolovskiy, G. Poniatowski (2014), 2012 Update Report to the Study to
quantify and analyse the VAT Gap in the EU-27 Member States, Report of project
TAXUD/2013/DE/321.
Barbone, L., M. Bonch-Osmolovskiy, G. Poniatowski (2015), 2013 Update Report to the Study to
quantify and analyse the VAT Gap in the EU Member States, Report of project
TAXUD/2013/DE/321.
Boadway, R., M. Marchand, P. Pestieau (1994), Towards a theory of the direct-indirect tax mix,
Journal of Public Economics, 55, 71-88.
Durán-Cabré J., Esteller-Moré, A, M. Mas-Montserrat, L. Salvadori (2018), La brecha fiscal:
estudio y aplicación a los impuestos sobre la riqueza, EB Working Paper N. 2018/15.
Esteller-Moré, A. (2005), Is there a connection between the tax administration and the political
power?, International Tax and Public Finance, 12, 639-63.
European Commission (2016), The Concept of Tax Gaps: Report on VAT Gap Estimations, FISCALIS
Tax Gap Project Group (FPG/041).
Fedeli, S., F. Forte (1999), Joint income-tax and VAT-chain evasion, European Journal of Political
Economy, 15, 391-415.
Godin, M., J. Hindriks (2015), A Review of critical issues on tax design and tax administration in a
global economy and developing countries, CRED-UNamur, Working Paper 7.
Keen, M. (2013), The Anatomy of the VAT, IMF Working Paper, WP/13/111, May.
Luttmer, E. F. P., M. Singhal (2014), Tax morale, Journal of Economic Perspectives, 28, 149-168.
OECD (2014), VAT Revenue Ratio (VRR), in Consumption Tax Trends 2014: VAT/GST and excise
rates, trends and policy issues, OECD Publishing, Paris.
VAT Gap in the EU-28 Member States
page 79 of 79
Pomeranz, D. (2015), No taxation without information: Deterrence and self-enforcement in the
value added tax, American Economic Review, 2539-69.
Poniatowski, G., M. Bonch-Osmolovskiy, M. Belkindas (2016), 2014 Update Report to the Study
to quantify and analyse the VAT Gap in the EU Member States, Report of project
TAXUD/2015/CC/131.
Poniatowski, G., M. Bonch-Osmolovskiy, A. Śmietanka (2017), Study and Reports on the VAT Gap
in the EU-28 Member States: 2017 Final Report, TAXUD/2015/CC/131.
Poniatowski, G., M. Bonch-Osmolovskiy, J. Durán-Cabré, A. Esteller-Moré A. Śmietanka (2018),
Study and Reports on the VAT Gap in the EU-28 Member States: 2018 Final Report,
TAXUD/2015/CC/131.
Slemrod, J., S. Yitzhaki (1987), The optimal size of a tax collection agency, Scandinavian Journal of
Economics, 89, 25-34.