Embed Size (px)
Citation preview

Study and Evaluation Of Balila Oil Field Vis-breaking plant
Item Type Theses and Dissertations
Authors Basheir ,Emam Mohammed
Download date 12/01/2022 02:11:56
Item License http://creativecommons.org/licenses/by-nc/3.0/
Link to Item http://hdl.handle.net/1834/4933
1
Study and Evaluation
Of Balila Oil Field Vis-breaking plant
By:
Emam Mohammed Basheir Ebrahim
B.Sc. Hones. Chemical Engineering
Red Sea University April, 2005
A Dissertation submitted
In partial Fulfillment for the requirements of the degree of
M.Sc in chemical Engineering
Department of Applied Chemistry and Chemical Technology
Faculty of Engineering and Technology
University of Gezira
Supervisor: Dr. Babiker Krama Abdalla Mohammed
Co. Supervisor: Dr. Fath Elrahman Abass Elshiekh
November, 2009
2
Dedication
I dedicate this work to:
The Soul of my mother
My father; Elshaikh / Mohammed ‘Noor’ Basheir
Anyone still searching for peace and crying to our beloved country, Sudan
3
Acknowledgement
I would like to thank my supervisor, Dr. Babiker Krama for his
continuous support, guidance and the valuable comments on my
research work, which made it possible for me to reach this point.
I extend my special thanks to Dr. Fath Elrahman Abass and Imad
Abdu Elmonem for their help and support during this study.
I am extremely grateful to Engineer Mohammed Zakarya
Mohammed in Petro-Energy Company for contributing of giving me
directions and assistance to complete this work.
Finally the most grateful thanks are extended to my family
anywhere.
4
Abstract
In this study the Vis-breaking plant of Balila crude oil which is
owned by Petro Energy Company was studied and the benefit in cost of this
plant was calculated. The improvement in crude oil quality was tested.
Besides investigating how Vis-breaking plant contributes in energy saving
hence minimize its consumption. The flow characteristics of crude in
pipeline were studied experimentally before and after Vis-breaking plant and
described mathematically.
Rheological models were developed to relate the shear stress to shear
rate. These models were used to describe the effects of oil viscosity on the
pressure required for pumping the oil through pipelines.
The result of present study shows that the rheological characteristics of
crude oil were improved from bulk Non- Newtonian to the Newtonian fluid
at testing temperature, although the vis-breaking plant used as upstream unit,
it has been never applied before.

5
=>;: ا89را45
NOP*+ 5 ا+BMم E 5FGHI 5*.*I JK;I-ب آ-د@Bن @? ه=ا ا+>;: 91 درا56 و34ة 01/.- ا+*(و'
4.: [X*\ ا+3را56 ا+K;S] ZY آ.B/Y 5.OهSI( , 5X-و اU-'? ا+P.V.5 ا+/HداU.5(و ا+Q+ R<S1 ?S-آ5
NOP+ا ^_BV` Z./;SI a+م وذHc-M+ة اBOVY d+م اBM+ا JKP+ 5Y3MS/X+5 اeBf+ا J.*K1 ?@ 34ةH+ا g=ه
UBF-6و hMi 5.*Xj J.k/1 ض-mI مBM+اn.IBUoط اHf` -<j h.
-./0S+3 و34ة اqIو J<e rs+ا ?Sf;Y 3Pj B.*XqY \/.e 3e 5*.*I مB` نBF-6 اصH` ان, \Ou9 وv
ر3MS6BI B.iBFام BqYدGت رH+HF'.5 وه=g ا+BqXدGت 3Y Z.<1ى vw1.- ا+*(و'S.uB` d*j 5? اBk'Gد
^K+3ل اqYو.
e 5.'H+HF-+اص اHM+ا+3را56 و'3 أن ا g=ه |_BSU ZYو34ة و J<e Bk.*j \UBآ BXY آ{.-ا \P/;1 3
-./0S+م , اBM+ا rs+ 5Y3MS/X+5 اeBf+ا ZY -.}آ d*j ظBO;+ا ?@ B3ورهI \XهB6 ?S+ط واHf` -<j
n.IBUGا ,?+BS+BI5 وKF-f+BI 5UرBKY 5 آ>.-ة</PI مBM+ا NOP+ا JKP+ 5FHP/+ا �.+B0S+ا J.*K1 d+ا
IB6 5Y3MS/X+ء و34ة 01/.- ا+*اBQUا J<e BK5'و), ZY 3q1 g=0/.- هS+أن و34ة ا ZY 9E-+ا d*j
NOP+ل اHK4 و34ات ZY �.+و+.5 و-S<+ت اBKSQX+ج اBSUض ا-mI 5Y3MS/X+ا NOP+ا ?@BVY و34ات
.اذ اBI BkUدرة +HkqY Z01 9دة J<e ZY, ا+BMم
6
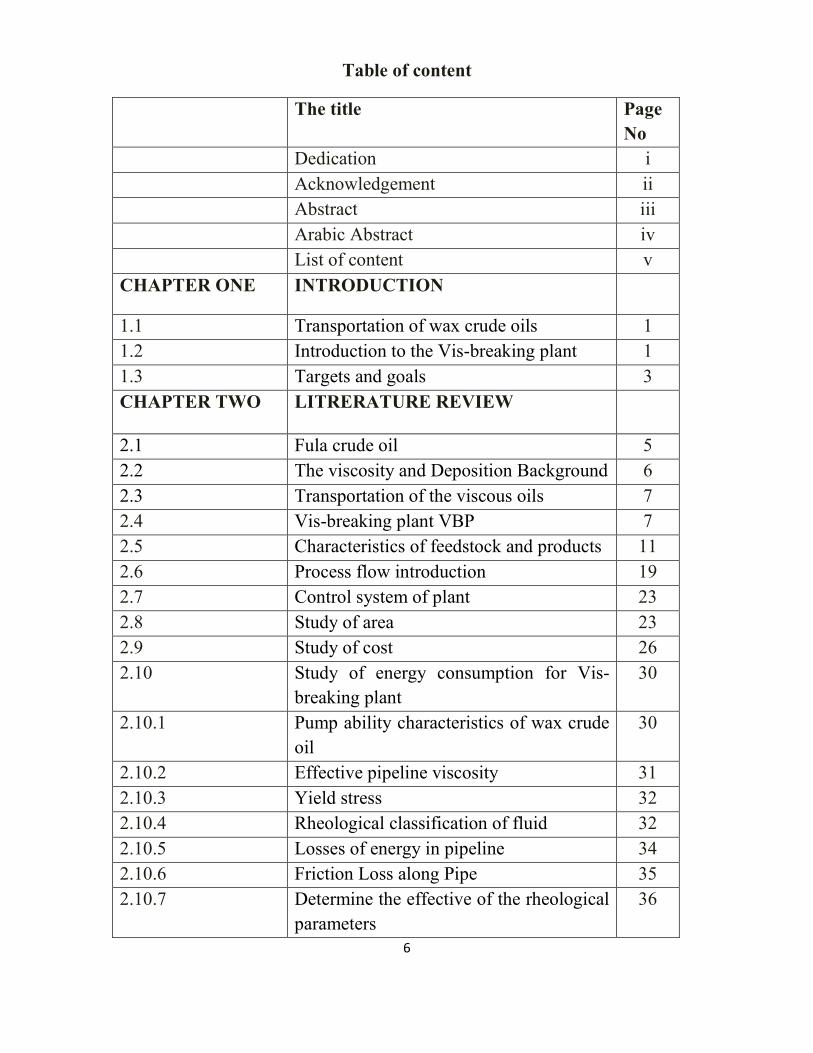
Table of content
The title Page No
Dedication i Acknowledgement ii Abstract iii Arabic Abstract iv List of content v
CHAPTER ONE INTRODUCTION
1.1 Transportation of wax crude oils 1 1.2 Introduction to the Vis-breaking plant 1 1.3 Targets and goals 3
CHAPTER TWO LITRERATURE REVIEW
2.1 Fula crude oil 5 2.2 The viscosity and Deposition Background 6 2.3 Transportation of the viscous oils 7 2.4 Vis-breaking plant VBP 7 2.5 Characteristics of feedstock and products 11 2.6 Process flow introduction 19 2.7 Control system of plant 23 2.8 Study of area 23 2.9 Study of cost 26 2.10 Study of energy consumption for Vis-
breaking plant 30
2.10.1 Pump ability characteristics of wax crude oil
30
2.10.2 Effective pipeline viscosity 31 2.10.3 Yield stress 32 2.10.4 Rheological classification of fluid 32 2.10.5 Losses of energy in pipeline 34 2.10.6 Friction Loss along Pipe 35 2.10.7 Determine the effective of the rheological
parameters 36

7
The title Page No
CHAPTER THREE
MATERIAL AND METHOD
3.1 Chemicals 40 3.2 Apparatus 40
3.3 Procedure for chemical and physical analysis
42
3.4 Calculation data 44 3.5 Calculation Procedure 47
CHAPTER FOUR RESULT AND DISCUSSION
4.1 Result 49 4.2 Discussion 54 CHAPTER FIVE CONCLUSION AND
RECOMENDATION
5.1 Conclusion 56 5.2 Recommendation: 56 References 57
8
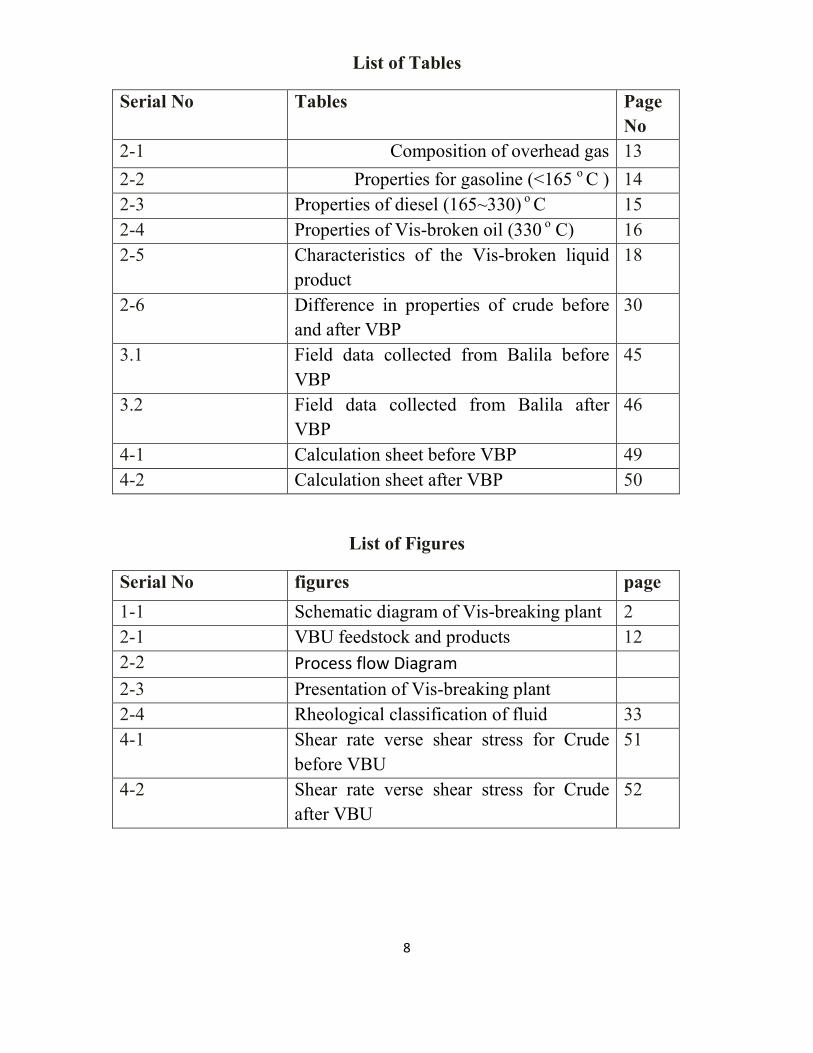
List of Tables
Serial No Tables Page No
2-1 Composition of overhead gas 13
2-2 Properties for gasoline (<165 o C ) 14 2-3 Properties of diesel (165~330) o C 15 2-4 Properties of Vis-broken oil (330 o C) 16 2-5 Characteristics of the Vis-broken liquid
product 18
2-6 Difference in properties of crude before and after VBP
30
3.1 Field data collected from Balila before VBP
45
3.2 Field data collected from Balila after VBP
46
4-1 Calculation sheet before VBP 49 4-2 Calculation sheet after VBP 50
List of Figures
Serial No figures page
1-1 Schematic diagram of Vis-breaking plant 2 2-1 VBU feedstock and products 12 2-2 Process flow Diagram
2-3 Presentation of Vis-breaking plant 2-4 Rheological classification of fluid 33 4-1 Shear rate verse shear stress for Crude
before VBU 51
4-2 Shear rate verse shear stress for Crude after VBU
52

9
Chapter one
Introduction

10
1.1 Transportation of wax crude oils
Crude oil contains a mixture of high and heavy hydrocarbons.
Typically, stabilized oil may contain paraffinic, naphthenic and aromatic
components as heavy as C60 .in addition, poolers and asphalting may also
present. The wax crystals usually lead to higher viscosity with increased
energy consumption for pumping and decreased capacity .in addition, may
also case problem of restarting the pipeline. [1]
1.2 Introduction to the Vis-breaking plant
Passing through long-distance pipeline(730 kilometers), crude oil
exploited from Sudan Block 6 in western Kordofan state – Balila; is
transported to coking unit in Khartoum Refinery Company Sudan
(hereinafter refer to as KRC) for processing. Considering the high viscosity,
which can’t satisfy the requirements on long-distance pipeline
transportation, the crude oil in Block 6 will be Vis-broken before exporting
to pipeline.
The output of the Oil Field (phase I) and the current pipeline transferring
capacity is matched with the processing capacity of coking unit in KRC
(phase I), the output of the Oil Field (phase II) will match with the
processing capacity of coking unit in KRC (phase II). After finishing
construction of Oil Field (phase II) and coking unit (phase II) in KRC, the
pipeline transferring capacity must reach 40000BOPD, that is, the viscosity
of crude must be decreased to 1600mPa.s at29⁰C, so the Vis breaking Plant
shall be built to process part of crude with result in the viscosity of the
mixed crude (Vis-broken crude and crude) is lower than 1600mPa.s at29⁰C,
which meets the pipeline transferring requirements. [2]
11
1.2.1 Feedstock and products
The feedstock of Vis-breaking Plant is Sudan fula-north-2B crude. Product
of this plant is:
Vis-broken oil: Comprise following products
A - Gasoline at temperature < 165 o C
B - Diesel at temperature (165-330 o C)
C – Vis-broken oil at temperature above 330 o C
By-product: Vis-breaking overhead gas is used as a fuel Vis-breaking
furnace.
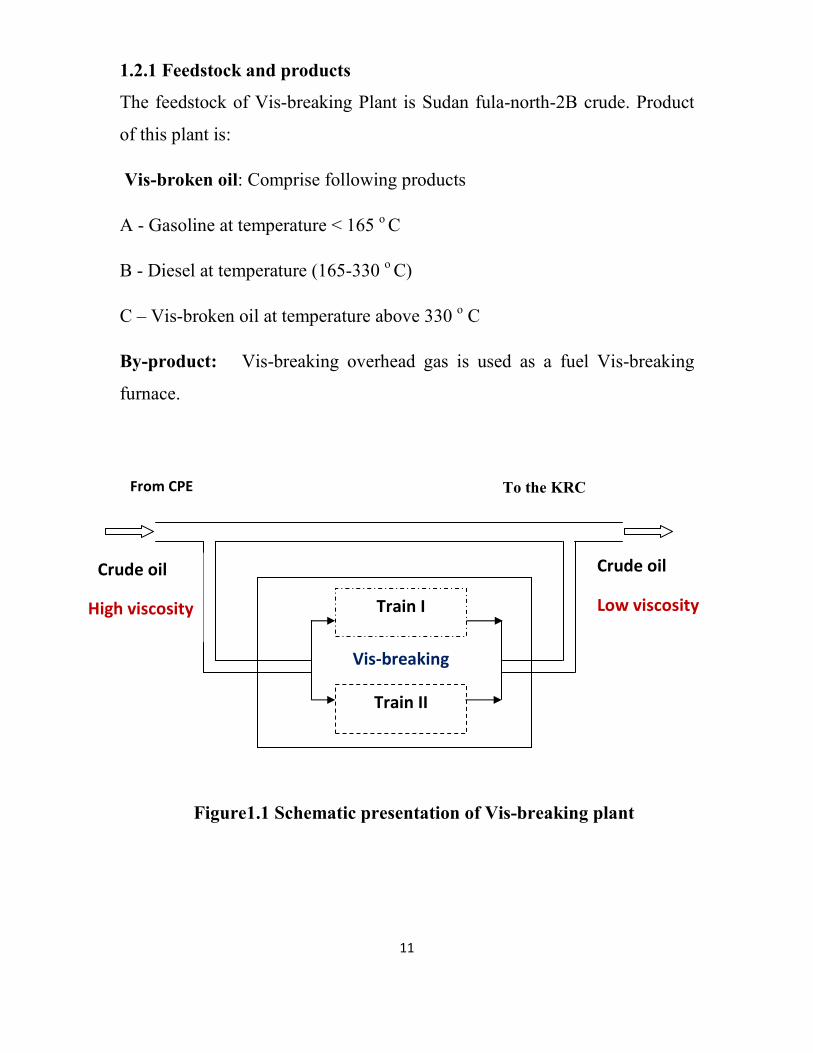
To the KRC
Figure1.1 Schematic presentation of Vis-breaking plant
Train I
Vis-breaking
Train II
From CPE
Crude oil
Low viscosity
Crude oil
High viscosity
12
1.3 Research objectives
1- Did the Vis-breaking plant meet the expectations?
2- How to balance between cost minimization and process optimization
in the Vis-breaking plant?
3- Did the Vis-breaking plant contribute in power saving and
minimize the power consumption?
4- Vis-breaking plant produces diesel within its process then it mixed
with oil, can we design unit use for cracked diesel after treating?

13
Chapter two
Literature Review
14
2.1 Fula crude oil
Fula crude oil was produced in Western Kordofan region in Almoglad
basin; the field had an area of 38468 Sq. km. Since 1995 the Chinese
National Petroleum Company (CNPC) had worked at the field and exploded
some new fields in Fula North, Fula West, Mega, Hadida, Naha, Kaikan and
Sifan, which contain over 60 wells that form Fula mix crude.
The proposed production rate was 40,000 bpd. The expected reserve from
the reservoir was 115 BPD of crude oil with a recovery factor (15-20) %.
The field facilities were made to cater production rate up to 40000 bpd, for
the processing unit at size up to 200000 bpd for the pipeline to Khartoum
refinery, these facilities were:
1. Central processing facilities (CPF) 40,000 BPD
2. Main storage tank 125,000 BPD
3. Pipe line (from Fula field to Khartoum) 723 km
2.1.1Fula crude oil general properties
High total acid number content
The treatments of crude oil depend on its characteristics and
properties. Fula crude was classified as heavy crude oil. Heavy crude from
geologically young formation have the highest naphthenic acids content
while paraffinic crude usually have low acid content.
High calcium content
The high calcium content in Fula crude caused lots of fouling and scale
problems, that increase the operation and maintenance cost. Under certain
conditions, the naphthenic acids present in acidic crude oil will precipitate
with calcium ions (Ca++) that present in co-produced water and form
calcium naphthenate and, to a lesser extent form other metal naphthenates.

15
High viscosity and high density
Fula Crude was heavy crude, its density is near to that of water, and
this would reduce the driving force of settlement defined by Stoke slaw, so
the desalting and dehydration required well adapted operation conditions.
The high viscosity means that very high temperature should be kept
throughout the whole processing operation, and this is expensive from the
standpoint of cost.
2.2 The Viscosity and Deposition Background
Deposition of complex and heavy organic compounds, which exist in
petroleum crude and heavy oil, the wax crystals change the flow behavior of
crude oil from Newtonian to non-Newtonian which leads to higher viscosity,
can cause a number of severe problems. If the temperature of the oil falls
below the wax appearance point (WAP) or wax appearance temperature
(WAT), paraffin generally deposition the pipeline wall. Decreased pipe
diameters are a major concern ,e.g. to oil transportation companies as they
represent a major increase in pumping costs, not to mention the loss of
throughput and quality of oil. In extreme cases of deposition, routine
shutdown has to be scheduled to pig the pipeline or to apply a short-timed,
dramatic pressure increase to restart the pipeline, which stresses the pipeline
construction.
Diffusion of dissolved wax has long been recognized to be highly causative
in deposit formation, very prominently evident at high heat fluxes.
2.2.1 Method of viscosity reduction due to paraffin removal
There are three common methods employed by the oil industry to
combat paraffin removal, these methods are:
1- Thermal method (vis-breaking).
2- Chemical method (the use of PPD).
16
3- Mechanical method
In many cases, a combination of two or more method utilized the
relationship between temperature and paraffin cloud point and solubility is
the logic behind the removal of paraffin deposits from down whole tubular
and piping equipment using the hot oiling method. [3]
2.3 Methods for pipeline transportation of the viscous oils
One of the following methods for pipelining waxy crude oil may be
considered: [4]
1- Conditioning the crude oil before pipelining to change the wax crystal
structure and reduce pour point and viscosity.
2- Adding hydrocarbon diluents such as ales waxy crude or light
distillate.
3- Use of pour point depressants, flow improvers”.
4- Combination of the above methods.
5- Some other methods.
2.4 Vis-breaking plant VBP
Vis-breaking is the one of the thermal cracking applications which is
widely used to process vacuum distillation residue to produce more Diesel,
i.e. Vis-breaking usually used as downstream process within refinery
processes. In this application Vis-breaker was used as upstream process.
Crude oil of Sudan Block Six needs to be treated in Coking Unit of
Khartoum Refinery by 730 km long pipeline transferring. For the high
viscosity of crude oil can cause difficulties to pipeline transferring, the crude
oil will be Vis-broken, In order to meet the need of pipeline transportation.
Chinese National Petroleum Company (CNPC) and Sudan government,
now called “petro Energy company” agreed to build a Vis-breaking unit, to
reduce the viscosity from 5000 mpa.s 29°c to 1600 mpa.s at29°c or less to
meet the transporting condition of the pipeline,[6]. The Vis-breaking Plant
17
was built to process part of crude with result in the viscosity of the mixed
crude (Vis-broken crude and crude) is lower than 2000mPa.s at29oC which
meets the pipeline transferring requirements. [2]
2.4.1 Production process and energy utilization
A- Crude desalting & decalcifying
For Sudan Balila -fula-north-2B crude, the content of salt is
683mgNaCl/l(data analyzed in Khartoum Refinery is 10ppm), the calcium
content is 1652ppm(data analyzed in Khartoum Refinery is 1100ppm),
calcium content is higher, so desalting and decalcifying must be done to
avoid the corrosion caused by salt and calcium fouling in equipment and
pipelines. According to the desalting and decalcifying process design
scheme and considering its actual running situation of coking unit in
Khartoum Refinery, crude Vis-breaking Plant adopt three-stage desalting
process, the result is the salt content equal or lower than 5mg/l Crude
decalcifying is the emphases and nod us of this plant, they shall be carefully
studied and treated in the further. The design keep decalcifying devices, but
decalcifying chemical will be chosen by owner in the future.
B- Crude Vis-breaking Plant
Crude Vis-breaking Plant, SOAKER Vis-breaking process of Petro-
chemical Scientific Research Institute is adopted, it is the process that liquid
phase reaction, which will stay for a long time under lower temperature,
shall be main, its characteristics is lower reaction temperature and pressure
which is beneficial for cracking reaction, and coking reaction is slow.). So
the plant will has long producing period and good stable of product quality,
as well as lower investment. With high acid number (up to 13.82mgKOH/g),
which is rare in local and overseas, the equipment and pipelines of plant
18
might be seriously corroded if it is treated improperly. The plant, otherwise,
must run long period to meet the requirement of pipeline transportation.
Fuel of plant shall be overhead gas recovered by crude Vis-breaking Plant,
the excess heat of plant shall be used for CPF’s thermal source of crude
entering station.
2.4.2 Utilities and auxiliary facilities
For this plant, steam system and cooling water system shall be self-
matched; the other utilities shall depend upon supply from CPF. Steam
system include a set of water softening device (soft water production is 20
m3/hour) and two sets of 1.0 MPa low-pressure steam boiler(steam
production is 2t/h); 1000m3/h, cooling water system shall be built, two
500m3/h cooling water towers shall be used therein.
2.4.3 Design review
The Vis-breaking plant can be divided two main sections: Vis-
breaking units and utilities, they will be divided further into many sub
systems for:
1) Vis-breaking unit
2) Water Injection System
3) Chemical Injection System
4) Cooling water system
4) Instrument Air /Plant Air System
5) Fuel Gas System (include natural gas and overhead gas)
6) Start-up Diesel and instrument flushing oil System
7) Raw Water & Soft Water Distribution System

19
8) Steam system
9) Cooling water system
10) Relief Gas System
11) Oily water system (open drain system)
12) Slop Oil System (Close Drain System)
13) Fire Fighting System (fire water system)
2.4.3.1 Scope of design
The work scope of detail design was limited to crude Vis-breaking
Plant; Crude Vis-breaking Plant includes Vis-breaking unit (two trains crude
Vis-breaking production line, each of lines is matched with a set of crude
electric desalting equipment which included three desolaters) and auxiliary
steam system and cooling water system, and warehouse etc.
2.4.3.2 Capacity and design life of plant
- The design processing capacity of crude Vis-breaking Plant is
16000(8000×2) BOPD (the capacity of crude desalting equipment is
also 16000(8000×2) BOPD).
- Steam generation capacity of steam system is 4 ton/hour (The rated
soft water output of water softening equipment is 20t/h).
- Cooling water treatment capacity of cooling water system is 1000
m3/hour.
- Annual operation time of the plant is 8400 hours.
- The plant capacity margin is 0.8-1.2 times.
- The plant design life is 15 years.
20
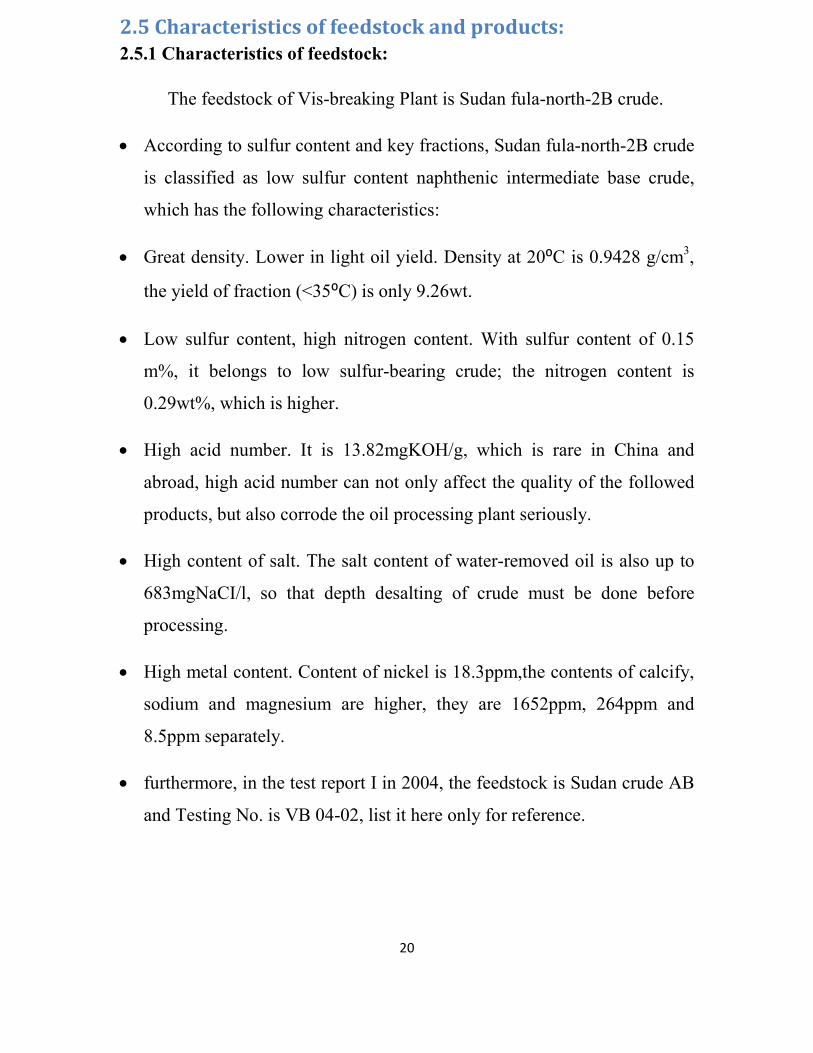
2.5 Characteristics of feedstock and products:
2.5.1 Characteristics of feedstock:
The feedstock of Vis-breaking Plant is Sudan fula-north-2B crude.
• According to sulfur content and key fractions, Sudan fula-north-2B crude
is classified as low sulfur content naphthenic intermediate base crude,
which has the following characteristics:
• Great density. Lower in light oil yield. Density at 20⁰C is 0.9428 g/cm3,
the yield of fraction (<35⁰C) is only 9.26wt.
• Low sulfur content, high nitrogen content. With sulfur content of 0.15
m%, it belongs to low sulfur-bearing crude; the nitrogen content is
0.29wt%, which is higher.
• High acid number. It is 13.82mgKOH/g, which is rare in China and
abroad, high acid number can not only affect the quality of the followed
products, but also corrode the oil processing plant seriously.
• High content of salt. The salt content of water-removed oil is also up to
683mgNaCI/l, so that depth desalting of crude must be done before
processing.
• High metal content. Content of nickel is 18.3ppm,the contents of calcify,
sodium and magnesium are higher, they are 1652ppm, 264ppm and
8.5ppm separately.
• furthermore, in the test report I in 2004, the feedstock is Sudan crude AB
and Testing No. is VB 04-02, list it here only for reference.
21
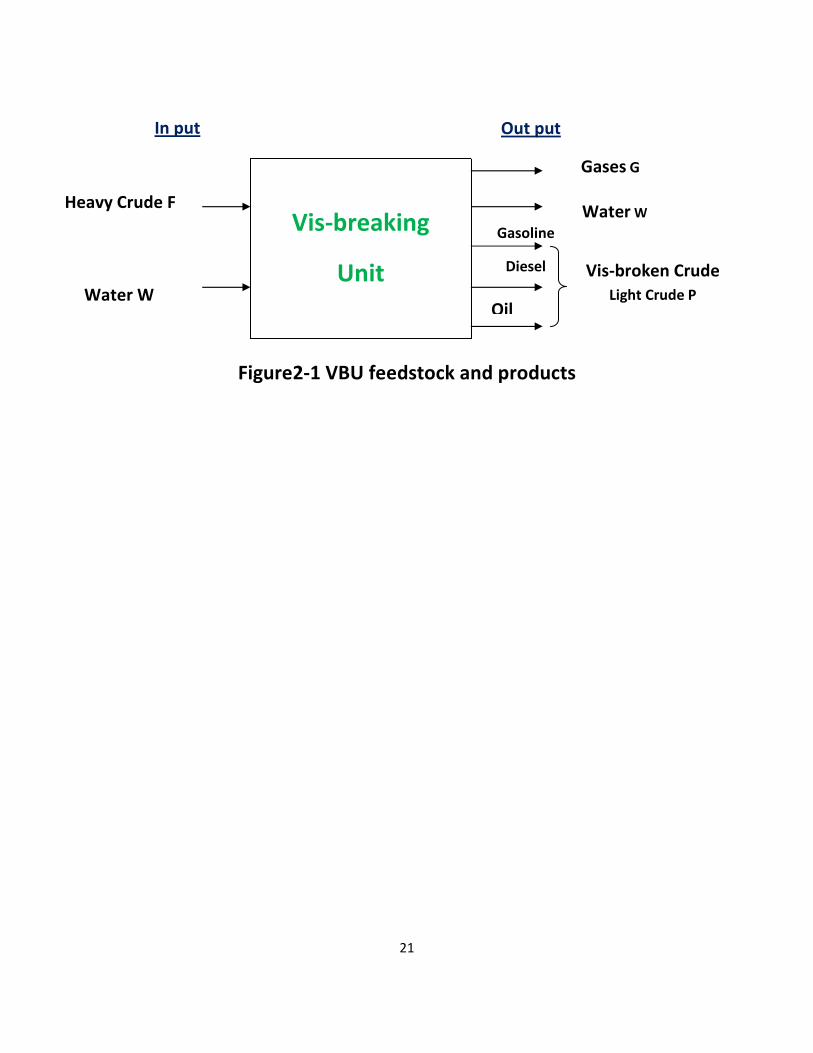
Figure2-1 VBU feedstock and products
Vis-breaking
Unit
In put Out put
Gases G
Water W
Gasoline
Diesel
Water W
Heavy Crude F
Oil
Vis-broken Crude
Light Crude P

22
2.5.2 Characteristics of Sudan Block 6Crude (Balila Crude)
2.5.3Characteristics of Vis-broken liquid product and by-product
Liquid product of Vis-breaking Plant is Vis-broken oil, by-product is
overhead gas.
Table 2-1 Composition of overhead gas
Testing No. VB 02-07 VB 04-02
Composition w% φ% w%
Hydrogen 0.28 4.69 0.31
Methane 21.23 38.11 20.31
Ethane 17.57 19.34 19.33
Ethene 3.04 2.93 2.74
Propane 19.11 13.21 19.37
Propene 10.55 6.54 9.16
Butane 16.47 9.34 18.06
Butene 11.75 5.61 10.46
1,3 butadiene 0.02 0.03
H2S , mg/m3 2770 0.21 0.23
Mean molecular weight 30.01 30.01
23
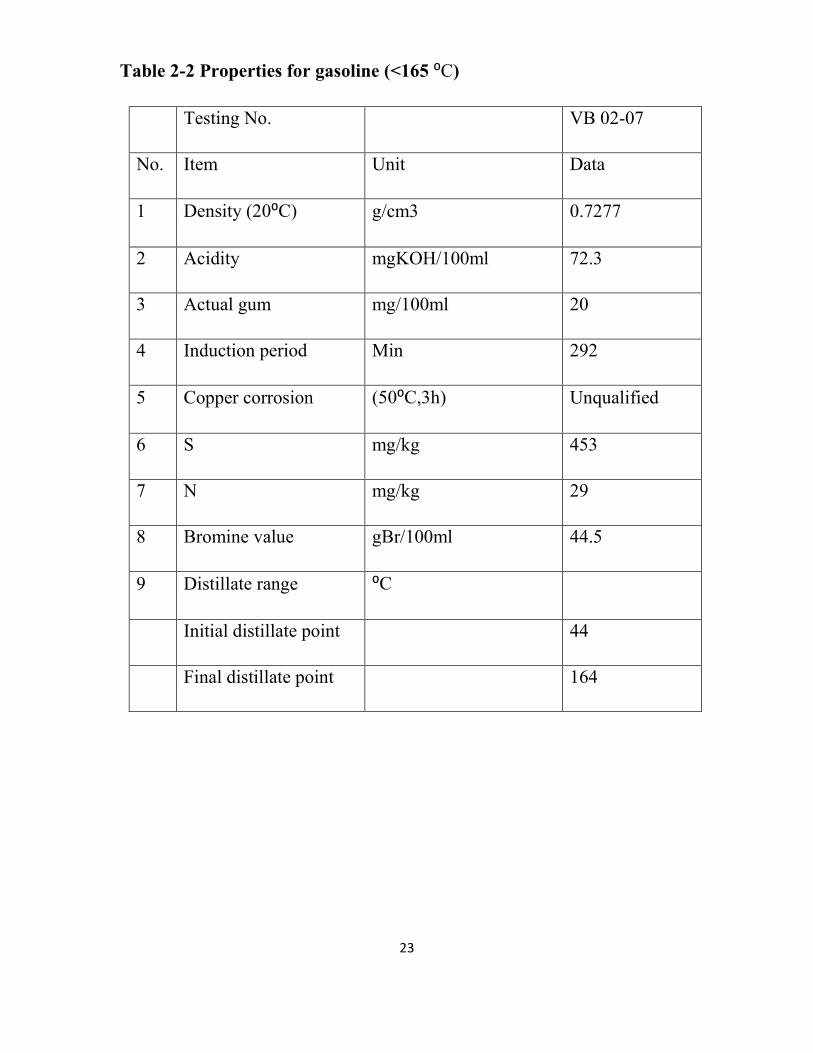
Table 2-2 Properties for gasoline (<165 ⁰C)
Testing No. VB 02-07
No. Item Unit Data
1 Density (20⁰C) g/cm3 0.7277
2 Acidity mgKOH/100ml 72.3
3 Actual gum mg/100ml 20
4 Induction period Min 292
5 Copper corrosion (50⁰C,3h) Unqualified
6 S mg/kg 453
7 N mg/kg 29
8 Bromine value gBr/100ml 44.5
9 Distillate range ⁰C
Initial distillate point 44
Final distillate point 164
24
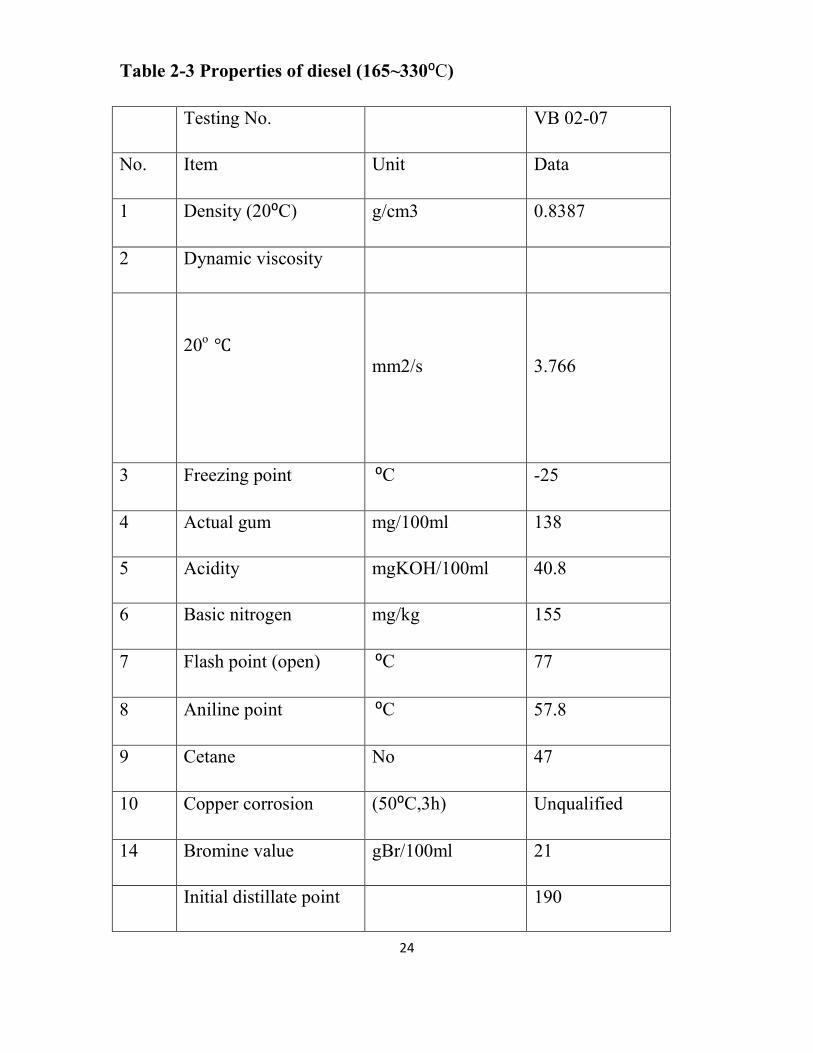
Table 2-3 Properties of diesel (165~330⁰C)
Testing No. VB 02-07
No. Item Unit Data
1 Density (20⁰C) g/cm3 0.8387
2 Dynamic viscosity
20o
℃ mm2/s 3.766
3 Freezing point ⁰C -25
4 Actual gum mg/100ml 138
5 Acidity mgKOH/100ml 40.8
6 Basic nitrogen mg/kg 155
7 Flash point (open) ⁰C 77
8 Aniline point ⁰C 57.8
9 Cetane No 47
10 Copper corrosion (50⁰C,3h) Unqualified
14 Bromine value gBr/100ml 21
Initial distillate point 190

25
Final distillate point 345
26
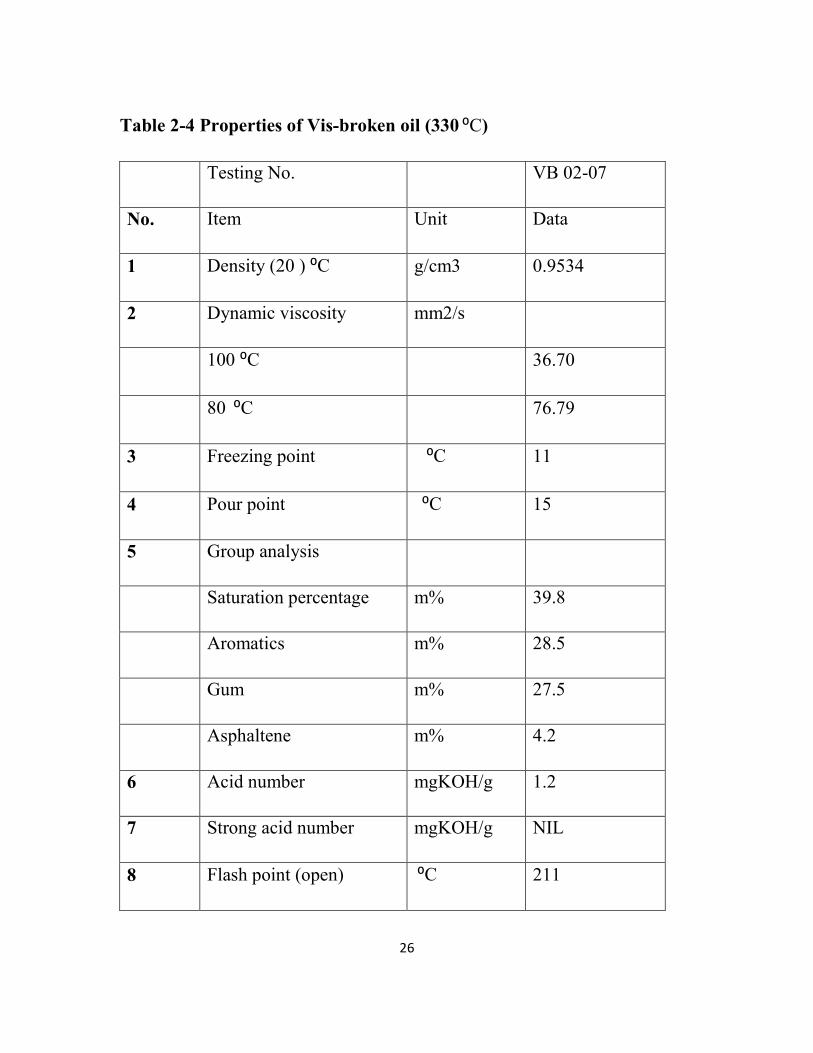
Table 2-4 Properties of Vis-broken oil (330 ⁰C)
Testing No. VB 02-07
No. Item Unit Data
1 Density (20 ) ⁰C g/cm3 0.9534
2 Dynamic viscosity mm2/s
100 ⁰C 36.70
80 ⁰C 76.79
3 Freezing point ⁰C 11
4 Pour point ⁰C 15
5 Group analysis
Saturation percentage m% 39.8
Aromatics m% 28.5
Gum m% 27.5
Asphaltene m% 4.2
6 Acid number mgKOH/g 1.2
7 Strong acid number mgKOH/g NIL
8 Flash point (open) ⁰C 211

27
9 Flash point (closed) ⁰C 121
10 Ash m% 0.48
11 CCR m% 12.0
12 Heat value Cal/g 9786
13 C m% 87.09
14 H m% 11.41
15 S m% 0.17
16 N m% 0.32
17 Distillate range ⁰C
Initial point 296
5% 339
10% 360
30% 434
50% 519
18 Stability in grade 1.5
28
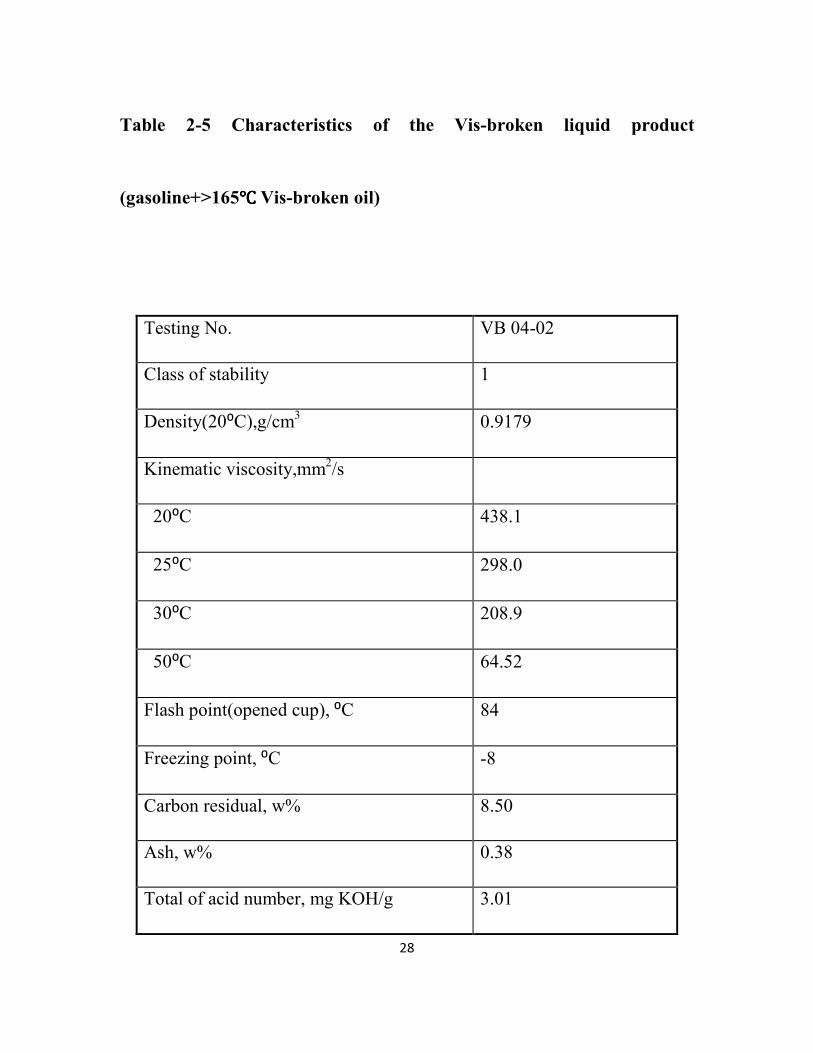
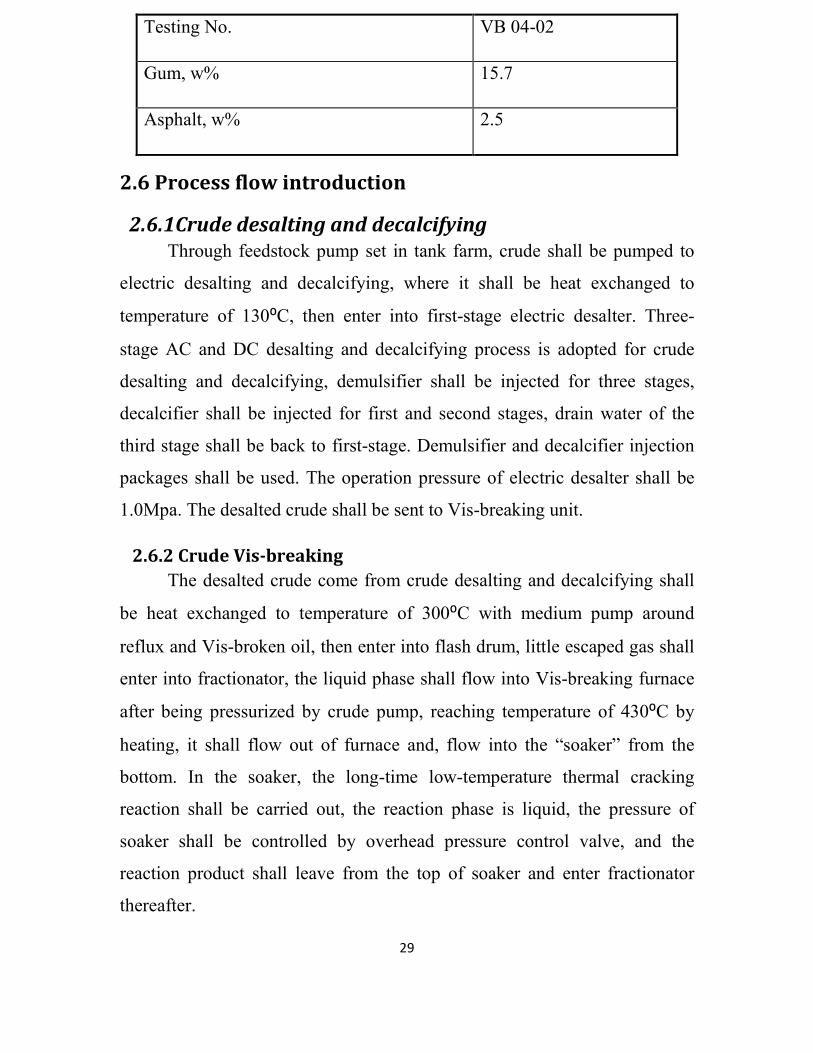
Table 2-5 Characteristics of the Vis-broken liquid product
(gasoline+>165℃℃℃℃ Vis-broken oil)
Testing No. VB 04-02
Class of stability 1
Density(20⁰C),g/cm3 0.9179
Kinematic viscosity,mm2/s
20⁰C 438.1
25⁰C 298.0
30⁰C 208.9
50⁰C 64.52
Flash point(opened cup), ⁰C 84
Freezing point, ⁰C -8
Carbon residual, w% 8.50
Ash, w% 0.38
Total of acid number, mg KOH/g 3.01
29
Testing No. VB 04-02
Gum, w% 15.7
Asphalt, w% 2.5
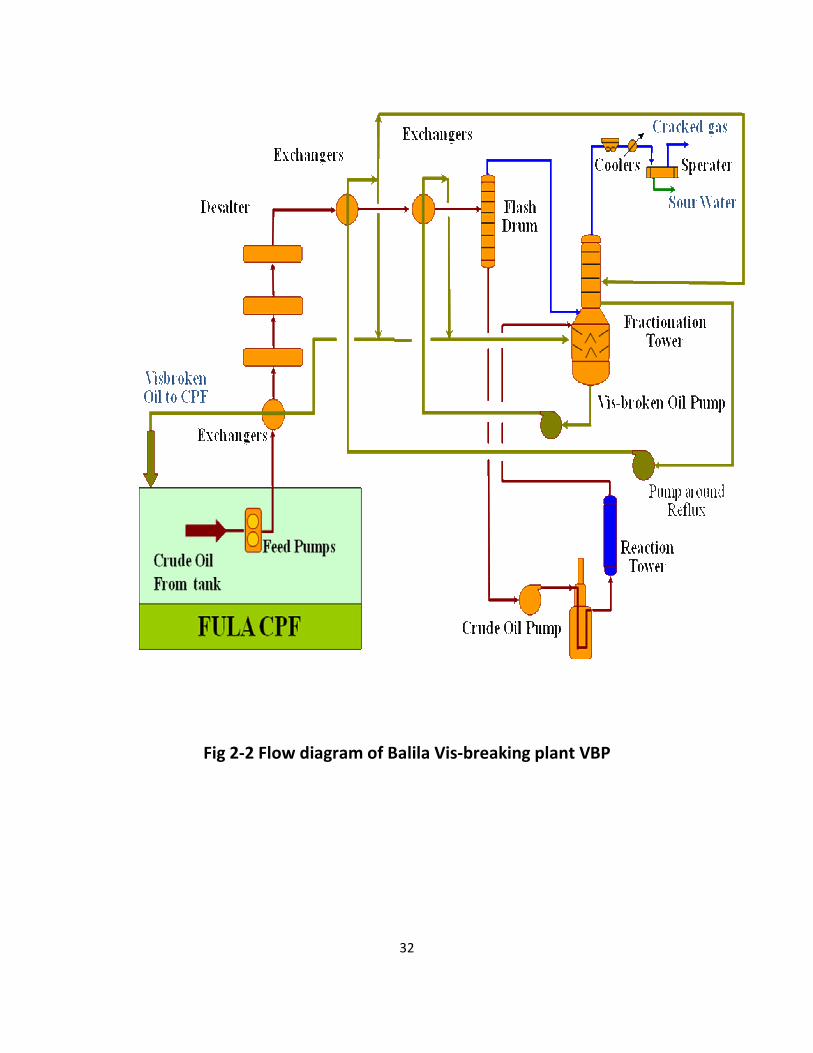
2.6 Process flow introduction
2.6.1Crude desalting and decalcifying
Through feedstock pump set in tank farm, crude shall be pumped to
electric desalting and decalcifying, where it shall be heat exchanged to
temperature of 130⁰C, then enter into first-stage electric desalter. Three-
stage AC and DC desalting and decalcifying process is adopted for crude
desalting and decalcifying, demulsifier shall be injected for three stages,
decalcifier shall be injected for first and second stages, drain water of the
third stage shall be back to first-stage. Demulsifier and decalcifier injection
packages shall be used. The operation pressure of electric desalter shall be
1.0Mpa. The desalted crude shall be sent to Vis-breaking unit.
2.6.2 Crude Vis-breaking
The desalted crude come from crude desalting and decalcifying shall
be heat exchanged to temperature of 300⁰C with medium pump around
reflux and Vis-broken oil, then enter into flash drum, little escaped gas shall
enter into fractionator, the liquid phase shall flow into Vis-breaking furnace
after being pressurized by crude pump, reaching temperature of 430⁰C by
heating, it shall flow out of furnace and, flow into the “soaker” from the
bottom. In the soaker, the long-time low-temperature thermal cracking
reaction shall be carried out, the reaction phase is liquid, the pressure of
soaker shall be controlled by overhead pressure control valve, and the
reaction product shall leave from the top of soaker and enter fractionator
thereafter.
30
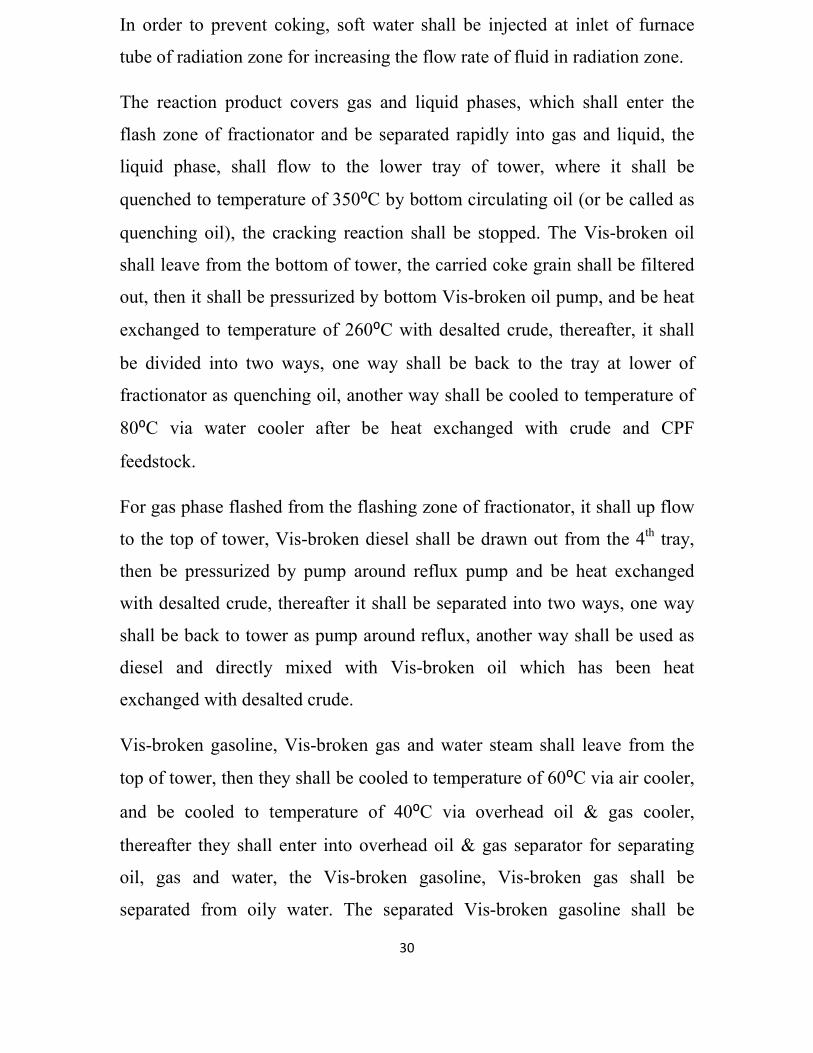
In order to prevent coking, soft water shall be injected at inlet of furnace
tube of radiation zone for increasing the flow rate of fluid in radiation zone.
The reaction product covers gas and liquid phases, which shall enter the
flash zone of fractionator and be separated rapidly into gas and liquid, the
liquid phase, shall flow to the lower tray of tower, where it shall be
quenched to temperature of 350⁰C by bottom circulating oil (or be called as
quenching oil), the cracking reaction shall be stopped. The Vis-broken oil
shall leave from the bottom of tower, the carried coke grain shall be filtered
out, then it shall be pressurized by bottom Vis-broken oil pump, and be heat
exchanged to temperature of 260⁰C with desalted crude, thereafter, it shall
be divided into two ways, one way shall be back to the tray at lower of
fractionator as quenching oil, another way shall be cooled to temperature of
80⁰C via water cooler after be heat exchanged with crude and CPF
feedstock.
For gas phase flashed from the flashing zone of fractionator, it shall up flow
to the top of tower, Vis-broken diesel shall be drawn out from the 4th tray,
then be pressurized by pump around reflux pump and be heat exchanged
with desalted crude, thereafter it shall be separated into two ways, one way
shall be back to tower as pump around reflux, another way shall be used as
diesel and directly mixed with Vis-broken oil which has been heat
exchanged with desalted crude.
Vis-broken gasoline, Vis-broken gas and water steam shall leave from the
top of tower, then they shall be cooled to temperature of 60⁰C via air cooler,
and be cooled to temperature of 40⁰C via overhead oil & gas cooler,
thereafter they shall enter into overhead oil & gas separator for separating
oil, gas and water, the Vis-broken gasoline, Vis-broken gas shall be
separated from oily water. The separated Vis-broken gasoline shall be
31
pumped out by gasoline pump, one section of them shall be back to top of
tower as overhead reflux, and the other section shall be blended with Vis-
broken oil after leaving plant. The separated Vis-broken gas shall be used as
fuel of Vis-breaking furnace.
Process flow Diagram
The following fig(2-2)shows process flow Diagram:
32
Fig 2-2 Flow diagram of Balila Vis-breaking plant VBP

33
2.7 Control system of plant
According to scope and sensitivity of central processing facilities With
the accurate instrument equipment, advanced computer program, the control
theory and the auto-control level of this unit will reach the advanced level in
the world; it can realize the high efficiency, safety and long time stable
running with less personnel.
The control system is the new distributed control system (DCS) all the
key process parameters will be inputted into DCS to conduct the real time
control, real time display and alarm of the operating period together with
creating various reporting forms(such as about operation, management and
alarm).
Emergency shutting down system (ESD) separated from DCS shall be
equipped for furnace to ensure the safety of operation.
2.8 Study of area
Balila crude oil field one of the most oil producing area in Sudan.
The basin located in western Kordofan state belongs to the Fula town.
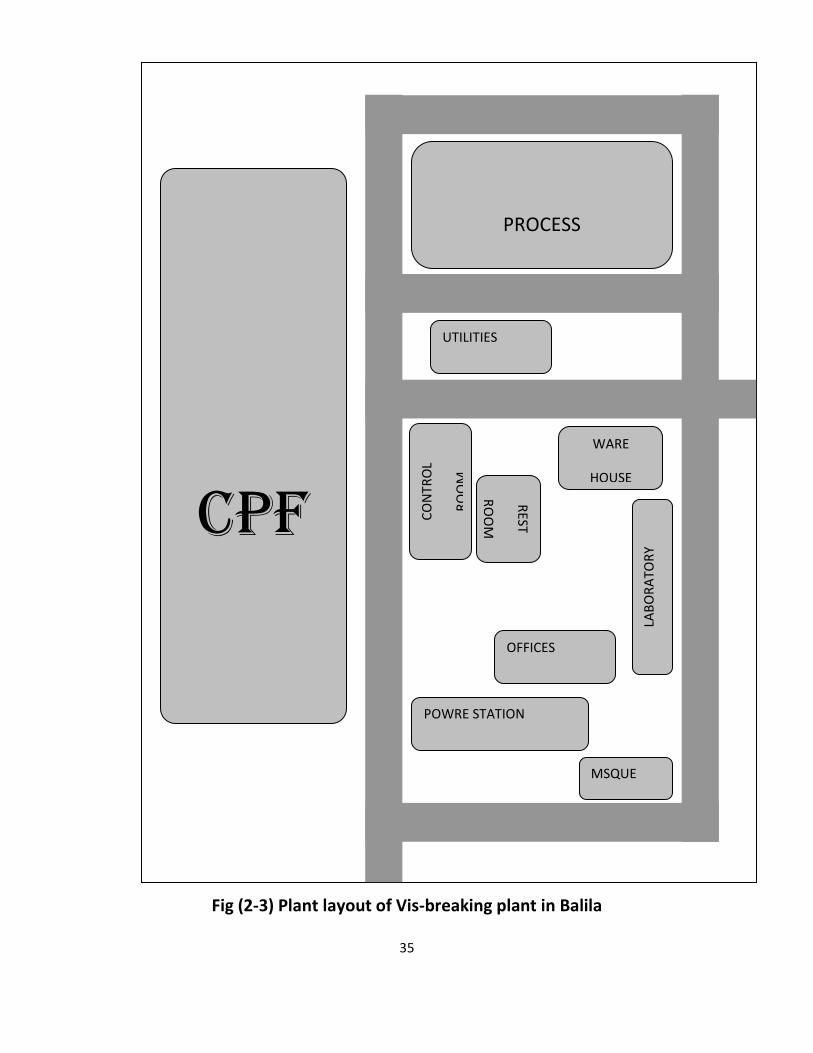
2.8.1Address and occupied area
Crude Vis-breaking Plant locates at the northeast of CPF, CPF tank farm
locates to west of plant, CPF utilities locates to the south of plant.
The appropriate site for the Vis-breaking unit is in a heavy crude oil CPF,
before the first pump station, and Almoglad basin with its heavy crude oil is
a perfect site.
CPF unit is composed of heat exchangers, diesel tanks, gas package
treatment system, light crude oil & natural gas treatment facilities, produced

34
water treatment system, Vis-breaking unit, pump station 1 and tanks. The
occupied area of this plant is 120m×94m=11280 m2.
2.8.2 Climate and vegetation
The study area pass semi arid to semi tropical region in the south,
there are seasonal variation in the rain falls temperature and wind.
Generally the area is characterized by eight month of dry weather in which
the wind blows from north east followed by four month of rainy season. The
ambient temperature for the region ranges between 18-23oc during
November-March and 34-37oc during hot net period of April to September.
The majority of rain fall is during July, August and September.
2.8.3 Plant layout of Vis-breaker in Balila
From the Balila lay out location of the offices, laboratory, control
room and rest room is down wind, and there is no fire station but there is a
fire fighting system for each unit, there is no medical unit but there is a first
aid unit in the offices.
Following Fig (2-3) shows Balila vis-breaking plant:
35
Fig (2-3) Plant layout of Vis-breaking plant in Balila
UTILITIES
PROCESS
LAB
OR
AT
OR
Y
WARE
HOUSE
RE
ST
RO
OM
POWRE STATION
OFFICES
CO
NT
RO
L
RO
OM
MSQUE
CPF

36
2.9 Economical analyses
2.9.1Transportation cost
2.9.1.1 Past transportation cost
The estimation of transporting for Balila crude oil before established
the Vis-breaking plant depends on:
- Cost of pipeline.
- Cost of pump station
- Heat station and heat tracing.
- Cost of chemical, but we don’t have information about the chemical
use or cost of this operation. So is use chemical which cost 2.8$ per
liter and for every 1,000,000 bbl of crude we need 1900 liter of
chemical. For40000bpd need 76 liter of chemical
Then the cost per year = 76*44*4.546*2.8*365
=15536264.13$
Labors cost per year:
Two operator in each heating station, the system its shift work
= 940*2*2*6*12
=270720$
Then the total past cost per year = 15806984.13$
Marshal& Swift Index value at 2004 = 1178.5
37
Marshal& Swift Index value at 2009 = 1489.6
Cost per year at 2009 = 15806984.13 *1489.6
1178.5
= 19979706.03$
2.9.2 Estimation of the benefit
Vis-breaking plant can be decrease the cost of transportation by
elimination the cost of chemical and thermal station& coil which use heat
tracing.
If we want estimate the benefit must be calculate the total capital investment
TCI & production cost by year.
2.9.2.1 Estimation of capital investment
Total capital investment comprise direct and indirect cost, various
methods can be employed for estimating capital investment. The choice of
any one depends upon the amount of detailed information available and
accuracy desired. One of this method is the percentage method which based
on the delivered equipment cost, or we can use modify from the percentage
method, which based on type of process plant gives rise to delivered
equipment ratio factor method DERE.
Based on DERE , that is by found purchased equipment, then the calculated
value of the TCI in year 2008 it’s equal to 33.00732 M$
Marshal& Swift Index value at 2008 = 1438.5
Marshal& Swift Index value at 2009 = 1489.6
38
By using Marshal& Swift cost index as shown below:
Present cost (Ct) =
Original cost (C0)* index value at present year (Yt) …… [2-1]
Index value at original year (Y0)
Cost at 2009 = 33007320*1489.6
1438.5
= 34179843$
2.9.2.2Estimation of total production cost
The total production cost TPC involves the following;
1- Manufacturing cost, comprise fixed cost & variable cost.
2- General expense.
The calculated value of the TPC in year 2009 it’s equal to
= 11901612$
2.9.2.3 Benefit by year
= past transportation cost per year – production cost per year
= 19979706.03 - 11901612
= 8078094.03$

39
Payback period for Vis-breaking investment plant
= capital investment ………….. [2-2]
Benefit per year
= 34179843
8078094.03
= 4.23 year
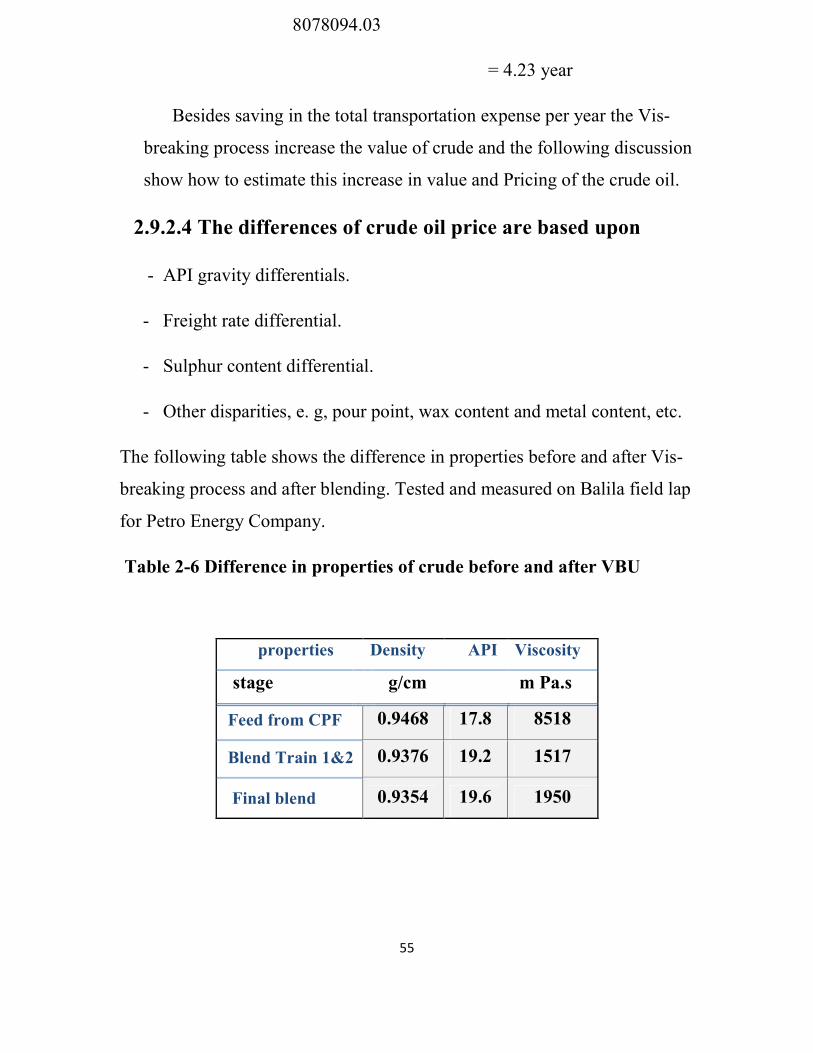
Besides saving in the total transportation expense per year the Vis-
breaking process increase the value of crude and the following discussion
show how to estimate this increase in value and Pricing of the crude oil.
2.9.2.4 The differences of crude oil price are based upon
- API gravity differentials.
- Freight rate differential.
- Sulphur content differential.
- Other disparities, e. g, pour point, wax content and metal content, etc.
The following table shows the difference in properties before and after Vis-
breaking process and after blending. Tested and measured on Balila field lap
for Petro Energy Company.
40
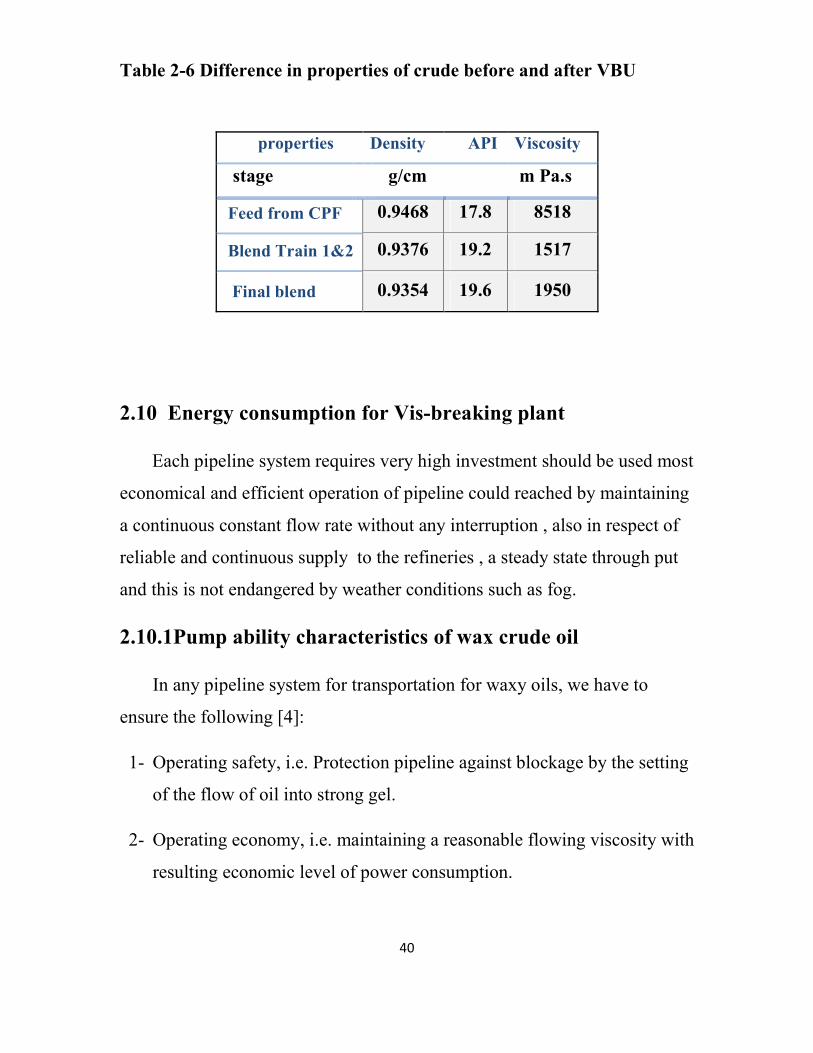
Table 2-6 Difference in properties of crude before and after VBU
2.10 Energy consumption for Vis-breaking plant
Each pipeline system requires very high investment should be used most
economical and efficient operation of pipeline could reached by maintaining
a continuous constant flow rate without any interruption , also in respect of
reliable and continuous supply to the refineries , a steady state through put
and this is not endangered by weather conditions such as fog.
2.10.1Pump ability characteristics of wax crude oil
In any pipeline system for transportation for waxy oils, we have to
ensure the following [4]:
1- Operating safety, i.e. Protection pipeline against blockage by the setting
of the flow of oil into strong gel.
2- Operating economy, i.e. maintaining a reasonable flowing viscosity with
resulting economic level of power consumption.
properties Density API Viscosity
stage g/cm m Pa.s
Feed from CPF 0.9468 17.8 8518
Blend Train 1&2 0.9376 19.2 1517
Final blend 0.9354 19.6 1950
41
As already explained, the viscous crude oils show complex rheological
relationships. The pumping and restarting condition of the pipeline require
physical properties of the crude oil which represent the actual condition in
the pipeline, these properties should be easy to determine and have good
reproducibility.
2.10.2 Effective pipeline viscosity
For determining pressure gradients in the pipeline, effective pumping
viscosities have to be determined. Using these viscosities, the conventional
formulae can be use for calculation of pressure drop.
The effective pipeline viscosity for calculating frictional pressure drop at
various flow rates and temperature, and this is lead as to estimate the total
cost of crude oil transportation due to determined cost of energy
consumption of the main part of the transportation system. (5)
Main parts of the transportation system are the pipeline and the pump
stations. If the oil is to transport to a place located at a relatively small
distance, then one pump station at the head end point may prove to be
sufficient. If , however , the pipeline is long then the building of several ,
so-called booster pump stations is required formerly, at the booster stations
, also cylindrical and vertical storage tanks of atmospheric pressure were
used. The pump station in the head end of pipeline section transported
crude to the tanks of the tail end point, and from these tanks the pump of
station sucked oil and transmitted into the next section.
42
2.10.3 Yield stress
It measures the ability of fluid to restart its flow after shutdown of the
transportation system. The yield stress of an oil, at given temperature is
defined as the shear stress required to initiate flow. [4]
2.10.4 Rheological classification of fluid
There exists a rate of shear and shear stress at each point in a flowing fluid:
1 - Newtonian fluids
A Newtonian fluid is one whose viscosity at given temperature is
independent of the rate of shear. There is a linear relationship between the
shear stress and the rate of shear. [4]
2 – Non-Newtonian fluid
Is one whose viscosity at given temperature is dependent on the
rate of shear.
3 – Pseudo-plastic fluid
In pseudo-plastic fluids, the viscosity decreases with increase in the
rate of shear, fluid may be Newtonian.
4 - Dilatent fluids
In the dilatent fluid, the viscosity increases with increase in the rate of
shear.
5 - Bingham-plastic fluids
43
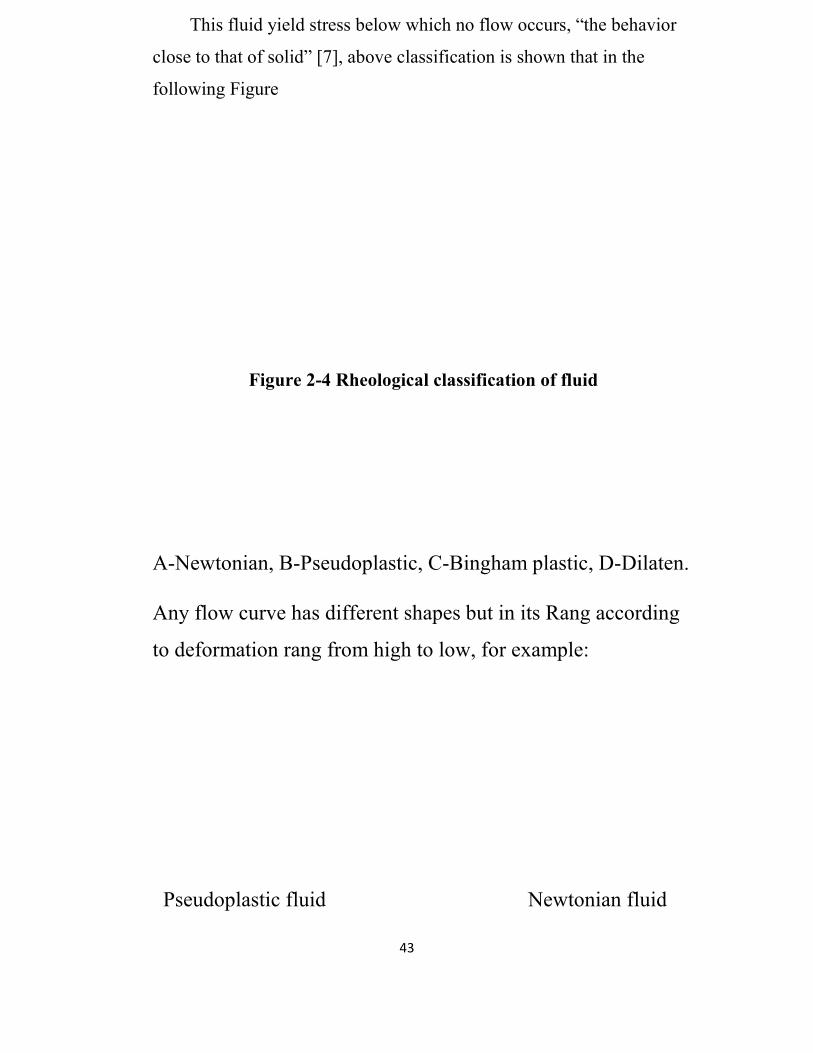
This fluid yield stress below which no flow occurs, “the behavior
close to that of solid” [7], above classification is shown that in the
following Figure
Figure 2-4 Rheological classification of fluid
A-Newtonian, B-Pseudoplastic, C-Bingham plastic, D-Dilaten.
Any flow curve has different shapes but in its Rang according
to deformation rang from high to low, for example:
Pseudoplastic fluid Newtonian fluid
44
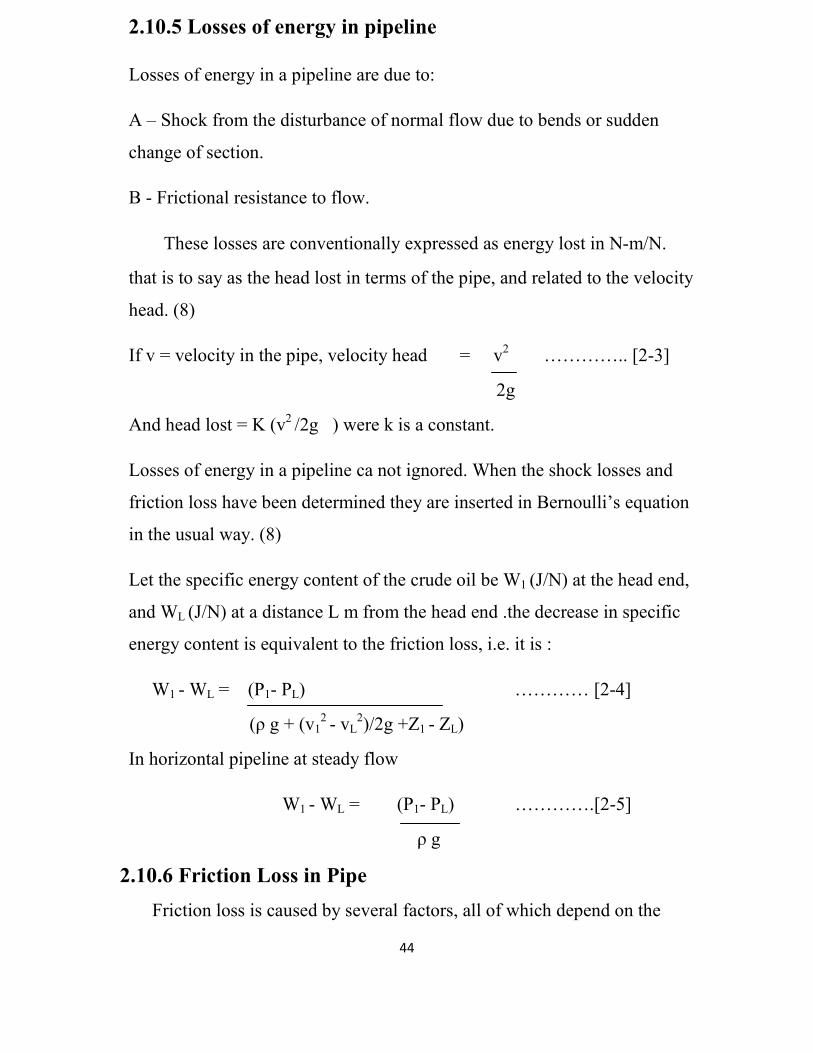
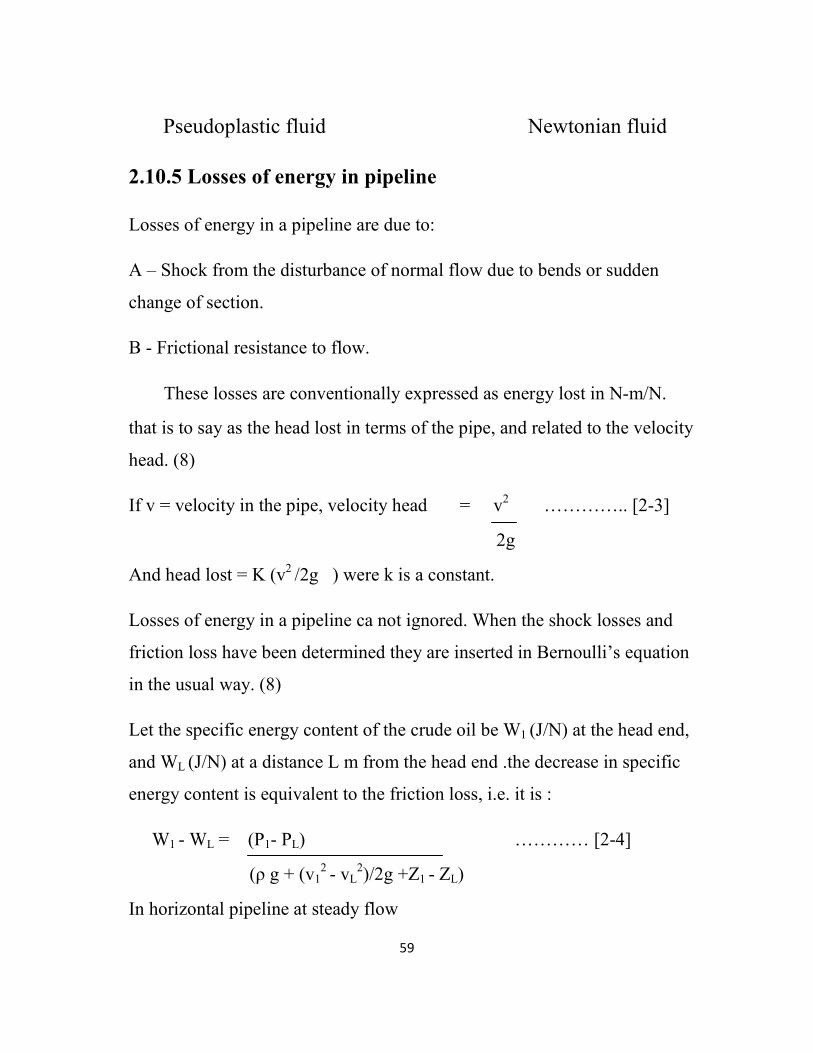
2.10.5 Losses of energy in pipeline
Losses of energy in a pipeline are due to:
A – Shock from the disturbance of normal flow due to bends or sudden
change of section.
B - Frictional resistance to flow.
These losses are conventionally expressed as energy lost in N-m/N.
that is to say as the head lost in terms of the pipe, and related to the velocity
head. (8)
If v = velocity in the pipe, velocity head = v2 ………….. [2-3]
2g
And head lost = K (v2 /2g ) were k is a constant.
Losses of energy in a pipeline ca not ignored. When the shock losses and
friction loss have been determined they are inserted in Bernoulli’s equation
in the usual way. (8)
Let the specific energy content of the crude oil be W1 (J/N) at the head end,
and WL (J/N) at a distance L m from the head end .the decrease in specific
energy content is equivalent to the friction loss, i.e. it is :
W1 - WL = (P1- PL) ………… [2-4]
(ρ g + (v12 - vL
2)/2g +Z1 - ZL)
In horizontal pipeline at steady flow
W1 - WL = (P1- PL) ………….[2-5]
ρ g
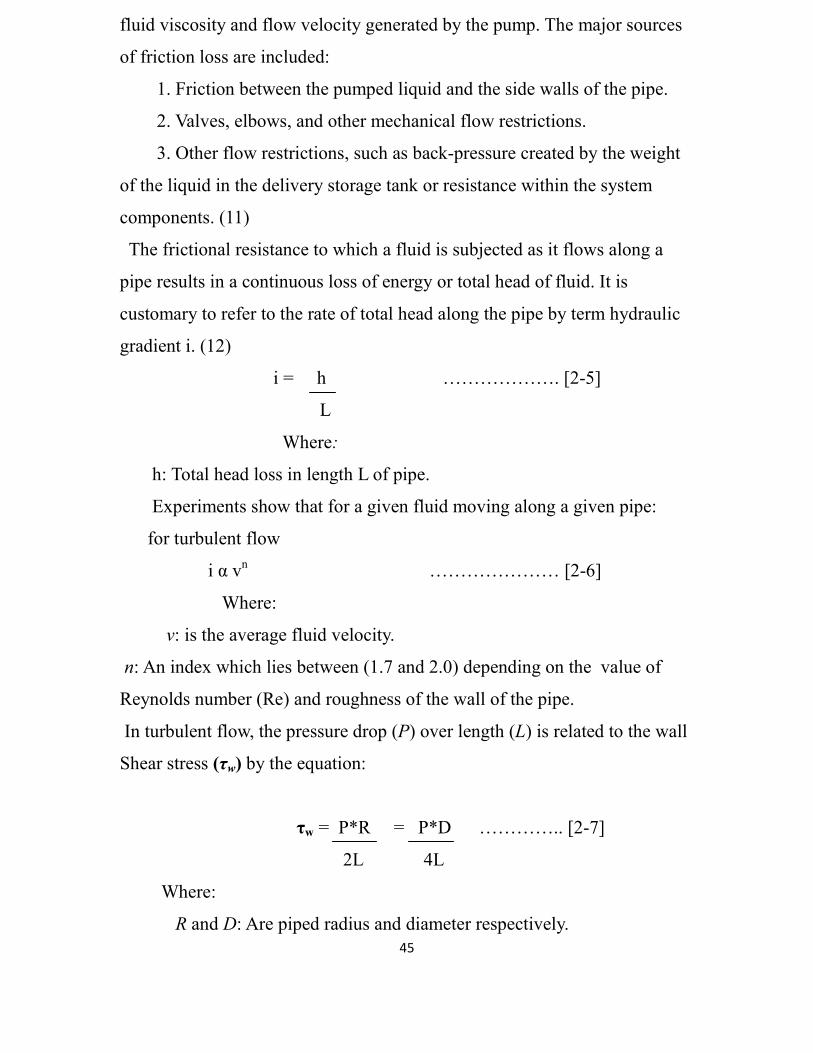
2.10.6 Friction Loss in Pipe
Friction loss is caused by several factors, all of which depend on the
45
fluid viscosity and flow velocity generated by the pump. The major sources
of friction loss are included:
1. Friction between the pumped liquid and the side walls of the pipe.
2. Valves, elbows, and other mechanical flow restrictions.
3. Other flow restrictions, such as back-pressure created by the weight
of the liquid in the delivery storage tank or resistance within the system
components. (11)
The frictional resistance to which a fluid is subjected as it flows along a
pipe results in a continuous loss of energy or total head of fluid. It is
customary to refer to the rate of total head along the pipe by term hydraulic
gradient і. (12)
i = h ………………. [2-5]
L
Where:
h: Total head loss in length L of pipe.
Experiments show that for a given fluid moving along a given pipe:
for turbulent flow
i α vn ………………… [2-6]
Where:
v: is the average fluid velocity.
n: An index which lies between (1.7 and 2.0) depending on the value of
Reynolds number (Re) and roughness of the wall of the pipe.
In turbulent flow, the pressure drop (P) over length (L) is related to the wall
Shear stress (τw) by the equation:
τw = P*R = P*D ………….. [2-7]
2L 4L
Where:
R and D: Are piped radius and diameter respectively.
46
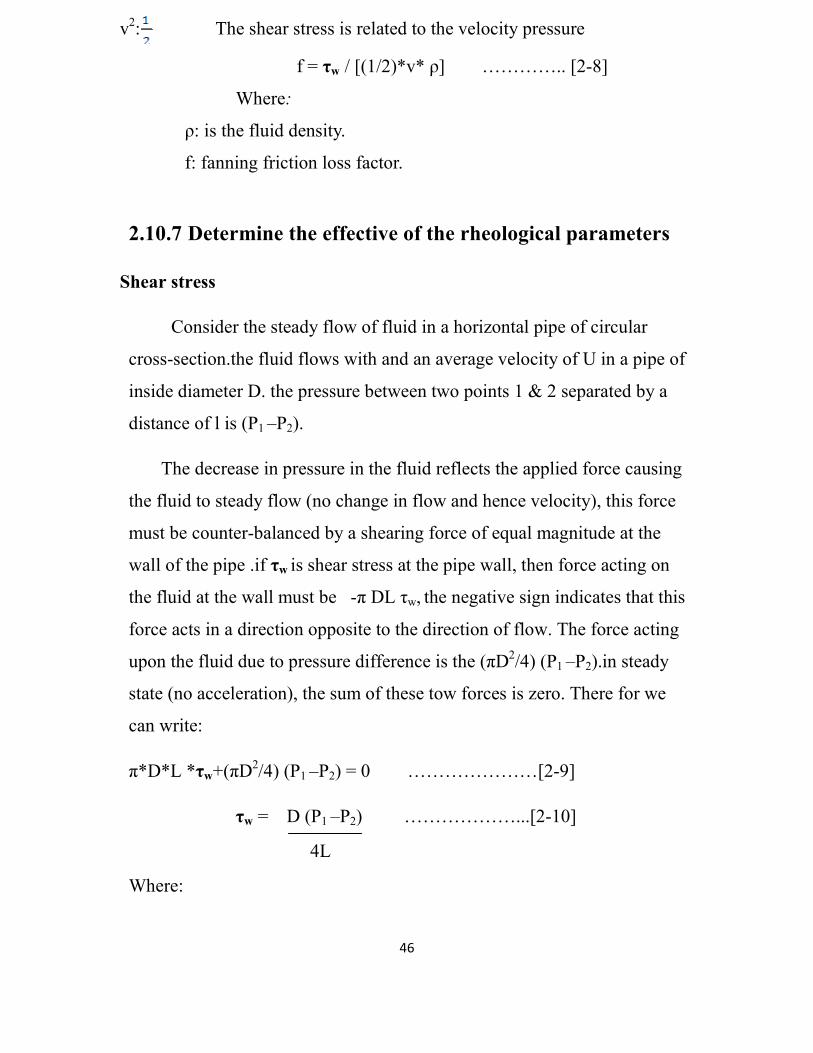
The shear stress is related to the velocity pressure v2:
f = τw / [(1/2)*v* ρ] ………….. [2-8]
Where:
ρ: is the fluid density.
f: fanning friction loss factor.
2.10.7 Determine the effective of the rheological parameters
Shear stress
Consider the steady flow of fluid in a horizontal pipe of circular
cross-section.the fluid flows with and an average velocity of U in a pipe of
inside diameter D. the pressure between two points 1 & 2 separated by a
distance of l is (P1 –P2).
The decrease in pressure in the fluid reflects the applied force causing
the fluid to steady flow (no change in flow and hence velocity), this force
must be counter-balanced by a shearing force of equal magnitude at the
wall of the pipe .if τw is shear stress at the pipe wall, then force acting on
the fluid at the wall must be -π DL τw, the negative sign indicates that this
force acts in a direction opposite to the direction of flow. The force acting
upon the fluid due to pressure difference is the (πD2/4) (P1 –P2).in steady
state (no acceleration), the sum of these tow forces is zero. There for we
can write:
π*D*L *τw+(πD2/4) (P1 –P2) = 0 …………………[2-9]
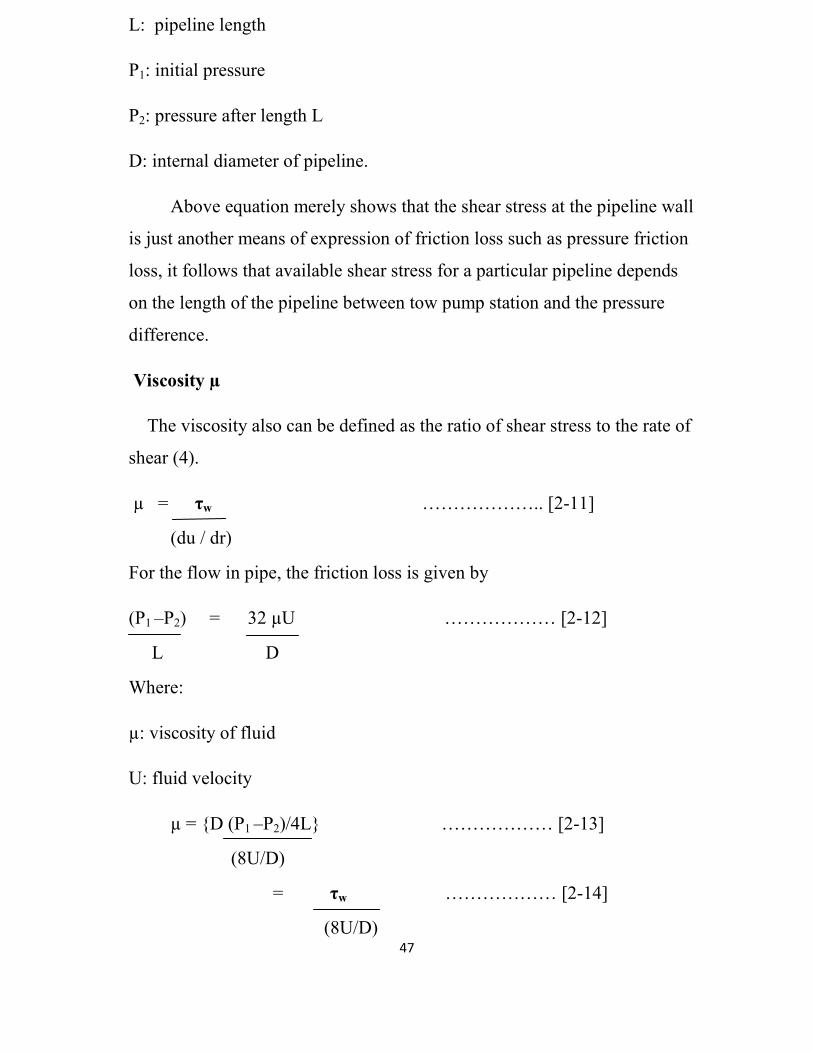
τw = D (P1 –P2) ………………...[2-10]
4L
Where:
47
L: pipeline length
P1: initial pressure
P2: pressure after length L
D: internal diameter of pipeline.
Above equation merely shows that the shear stress at the pipeline wall
is just another means of expression of friction loss such as pressure friction
loss, it follows that available shear stress for a particular pipeline depends
on the length of the pipeline between tow pump station and the pressure
difference.
Viscosity µ
The viscosity also can be defined as the ratio of shear stress to the rate of
shear (4).
µ = τw ……………….. [2-11]
(du / dr)
For the flow in pipe, the friction loss is given by
(P1 –P2) = 32 µU ……………… [2-12]
L D
Where:
µ: viscosity of fluid
U: fluid velocity
µ = {D (P1 –P2)/4L} ……………… [2-13]
(8U/D)
= τw ……………… [2-14]
(8U/D)
48
Then the relation between viscosity & shear stress:
µ = τw ……………… [2-15]
(8U/D)
Rate of shear (τ)
τ = (8U/D) ……………… [2-16]
µ = τw ………………. [2-17]
τ

49
Chapter Three
Material
And
Method

50
2.7 Control system of plant
According to scope and sensitivity of central processing facilities With
the accurate instrument equipment, advanced computer program, the control
theory and the auto-control level of this unit will reach the advanced level in
the world; it can realize the high efficiency, safety and long time stable
running with less personnel.
The control system is the new distributed control system (DCS) all the
key process parameters will be inputted into DCS to conduct the real time
control, real time display and alarm of the operating period together with
creating various reporting forms(such as about operation, management and
alarm).
Emergency shutting down system (ESD) separated from DCS shall be
equipped for furnace to ensure the safety of operation.
2.9 Study of area
Balila crude oil field one of the most oil producing area in Sudan.
The basin located in western Kordofan state belongs to the Fula town.
2.8.1Address and occupied area
Crude Vis-breaking Plant locates at the northeast of CPF, CPF tank farm
locates to west of plant, CPF utilities locates to the south of plant.
The appropriate site for the Vis-breaking unit is in a heavy crude oil CPF,
before the first pump station, and Almoglad basin with its heavy crude oil is
a perfect site.
CPF unit is composed of heat exchangers, diesel tanks, gas package
treatment system, light crude oil & natural gas treatment facilities, produced
51
water treatment system, Vis-breaking unit, pump station 1 and tanks. The
occupied area of this plant is 120m×94m=11280 m2.
2.8.2 Climate and vegetation
The study area pass semi arid to semi tropical region in the south,
there are seasonal variation in the rain falls temperature and wind.
Generally the area is characterized by eight month of dry weather in which
the wind blows from north east followed by four month of rainy season. The
ambient temperature for the region ranges between 18-23oc during
November-March and 34-37oc during hot net period of April to September.
The majority of rain fall is during July, August and September.
2.8.3 Plant layout of Vis-breaker in Balila
From the Balila lay out location of the offices, laboratory, control
room and rest room is down wind, and there is no fire station but there is a
fire fighting system for each unit, there is no medical unit but there is a first
aid unit in the offices.
Following Fig (2-3) shows Balila vis-breaking plant:

52
2.9 Economical analyses
2.9.1Transportation cost
2.9.1.1 Past transportation cost
The estimation of transporting for Balila crude oil before established
the Vis-breaking plant depends on:
- Cost of pipeline.
- Cost of pump station
- Heat station and heat tracing.
- Cost of chemical, but we don’t have information about the chemical
use or cost of this operation. So is use chemical which cost 2.8$ per
liter and for every 1,000,000 bbl of crude we need 1900 liter of
chemical. For40000bpd need 76 liter of chemical
Then the cost per year = 76*44*4.546*2.8*365
=15536264.13$
Labors cost per year:
Two operator in each heating station, the system its shift work
= 940*2*2*6*12
=270720$
Then the total past cost per year = 15806984.13$
Marshal& Swift Index value at 2004 = 1178.5
Marshal& Swift Index value at 2009 = 1489.6

53
Cost per year at 2009 = 15806984.13 *1489.6
1178.5
= 19979706.03$
2.9.2 Estimation of the benefit
Vis-breaking plant can be decrease the cost of transportation by
elimination the cost of chemical and thermal station& coil which use heat
tracing.
If we want estimate the benefit must be calculate the total capital investment
TCI & production cost by year.
2.9.2.1 Estimation of capital investment
Total capital investment comprise direct and indirect cost, various
methods can be employed for estimating capital investment. The choice of
any one depends upon the amount of detailed information available and
accuracy desired. One of this method is the percentage method which based
on the delivered equipment cost, or we can use modify from the percentage
method, which based on type of process plant gives rise to delivered
equipment ratio factor method DERE.
Based on DERE , that is by found purchased equipment, then the calculated
value of the TCI in year 2008 it’s equal to 33.00732 M$
Marshal& Swift Index value at 2008 = 1438.5
Marshal& Swift Index value at 2009 = 1489.6
By using Marshal& Swift cost index as shown below:
Present cost (Ct) =
54
Original cost (C0)* index value at present year (Yt) …… [2-1]
Index value at original year (Y0)
Cost at 2009 = 33007320*1489.6
1438.5
= 34179843$
2.9.2.2Estimation of total production cost
The total production cost TPC involves the following;
3- Manufacturing cost, comprise fixed cost & variable cost.
4- General expense.
The calculated value of the TPC in year 2009 it’s equal to
= 11901612$
2.9.2.3 Benefit by year
= past transportation cost per year – production cost per year
= 19979706.03 - 11901612
= 8078094.03$
Payback period for Vis-breaking investment plant
= capital investment ………….. [2-2]
Benefit per year
= 34179843
55
8078094.03
= 4.23 year
Besides saving in the total transportation expense per year the Vis-
breaking process increase the value of crude and the following discussion
show how to estimate this increase in value and Pricing of the crude oil.
2.9.2.4 The differences of crude oil price are based upon
- API gravity differentials.
- Freight rate differential.
- Sulphur content differential.
- Other disparities, e. g, pour point, wax content and metal content, etc.
The following table shows the difference in properties before and after Vis-
breaking process and after blending. Tested and measured on Balila field lap
for Petro Energy Company.
Table 2-6 Difference in properties of crude before and after VBU
properties Density API Viscosity
stage g/cm m Pa.s
Feed from CPF 0.9468 17.8 8518
Blend Train 1&2 0.9376 19.2 1517
Final blend 0.9354 19.6 1950
56
2.11 Energy consumption for Vis-breaking plant
Each pipeline system requires very high investment should be used most
economical and efficient operation of pipeline could reached by maintaining
a continuous constant flow rate without any interruption , also in respect of
reliable and continuous supply to the refineries , a steady state through put
and this is not endangered by weather conditions such as fog.
2.10.1Pump ability characteristics of wax crude oil
In any pipeline system for transportation for waxy oils, we have to
ensure the following [4]:
3- Operating safety, i.e. Protection pipeline against blockage by the setting
of the flow of oil into strong gel.
4- Operating economy, i.e. maintaining a reasonable flowing viscosity with
resulting economic level of power consumption.
As already explained, the viscous crude oils show complex rheological
relationships. The pumping and restarting condition of the pipeline require
physical properties of the crude oil which represent the actual condition in
the pipeline, these properties should be easy to determine and have good
reproducibility.
2.10.2 Effective pipeline viscosity
For determining pressure gradients in the pipeline, effective pumping
viscosities have to be determined. Using these viscosities, the conventional
formulae can be use for calculation of pressure drop.
The effective pipeline viscosity for calculating frictional pressure drop at
various flow rates and temperature, and this is lead as to estimate the total
57
cost of crude oil transportation due to determined cost of energy
consumption of the main part of the transportation system. (5)
Main parts of the transportation system are the pipeline and the pump
stations. If the oil is to transport to a place located at a relatively small
distance, then one pump station at the head end point may prove to be
sufficient. If , however , the pipeline is long then the building of several ,
so-called booster pump stations is required formerly, at the booster stations
, also cylindrical and vertical storage tanks of atmospheric pressure were
used. The pump station in the head end of pipeline section transported
crude to the tanks of the tail end point, and from these tanks the pump of
station sucked oil and transmitted into the next section.
2.10.3 Yield stress
It measures the ability of fluid to restart its flow after shutdown of the
transportation system. The yield stress of an oil, at given temperature is
defined as the shear stress required to initiate flow. [4]
2.10.4 Rheological classification of fluid
There exists a rate of shear and shear stress at each point in a flowing fluid:
1 - Newtonian fluids
A Newtonian fluid is one whose viscosity at given temperature is
independent of the rate of shear. There is a linear relationship between the
shear stress and the rate of shear. [4]
2 – Non-Newtonian fluid
Is one whose viscosity at given temperature is dependent on the
rate of shear.

58
3 – Pseudo-plastic fluid
In pseudo-plastic fluids, the viscosity decreases with increase in the
rate of shear, fluid may be Newtonian.
4 - Dilatent fluids
In the dilatent fluid, the viscosity increases with increase in the rate of
shear.
5 - Bingham-plastic fluids
This fluid yield stress below which no flow occurs, “the behavior
close to that of solid” [7], above classification is shown that in the
following Figure
Figure 2-4 Rheological classification of fluid
A-Newtonian, B-Pseudoplastic, C-Bingham plastic, D-Dilaten.
Any flow curve has different shapes but in its Rang according
to deformation rang from high to low, for example:
59
Pseudoplastic fluid Newtonian fluid
2.10.5 Losses of energy in pipeline
Losses of energy in a pipeline are due to:
A – Shock from the disturbance of normal flow due to bends or sudden
change of section.
B - Frictional resistance to flow.
These losses are conventionally expressed as energy lost in N-m/N.
that is to say as the head lost in terms of the pipe, and related to the velocity
head. (8)
If v = velocity in the pipe, velocity head = v2 ………….. [2-3]
2g
And head lost = K (v2 /2g ) were k is a constant.
Losses of energy in a pipeline ca not ignored. When the shock losses and
friction loss have been determined they are inserted in Bernoulli’s equation
in the usual way. (8)
Let the specific energy content of the crude oil be W1 (J/N) at the head end,
and WL (J/N) at a distance L m from the head end .the decrease in specific
energy content is equivalent to the friction loss, i.e. it is :
W1 - WL = (P1- PL) ………… [2-4]
(ρ g + (v12 - vL
2)/2g +Z1 - ZL)
In horizontal pipeline at steady flow
60
W1 - WL = (P1- PL) ………….[2-5]
ρ g
2.10.6 Friction Loss in Pipe
Friction loss is caused by several factors, all of which depend on the
fluid viscosity and flow velocity generated by the pump. The major sources
of friction loss are included:
1. Friction between the pumped liquid and the side walls of the pipe.
2. Valves, elbows, and other mechanical flow restrictions.
3. Other flow restrictions, such as back-pressure created by the weight
of the liquid in the delivery storage tank or resistance within the system
components. (11)
The frictional resistance to which a fluid is subjected as it flows along a
pipe results in a continuous loss of energy or total head of fluid. It is
customary to refer to the rate of total head along the pipe by term hydraulic
gradient і. (12)
i = h ………………. [2-5]
L
Where:
h: Total head loss in length L of pipe.
Experiments show that for a given fluid moving along a given pipe:
for turbulent flow
i α vn ………………… [2-6]
Where:
v: is the average fluid velocity.
n: An index which lies between (1.7 and 2.0) depending on the value of
Reynolds number (Re) and roughness of the wall of the pipe.
In turbulent flow, the pressure drop (P) over length (L) is related to the wall
Shear stress (τw) by the equation:
61
τw = P*R = P*D ………….. [2-7]
2L 4L
Where:
R and D: Are piped radius and diameter respectively.
The shear stress is related to the velocity pressure v2:
f = τw / [(1/2)*v* ρ] ………….. [2-8]
Where:
ρ: is the fluid density.
f: fanning friction loss factor.
2.10.8 Determine the effective of the rheological parameters
Shear stress
Consider the steady flow of fluid in a horizontal pipe of circular
cross-section.the fluid flows with and an average velocity of U in a pipe of
inside diameter D. the pressure between two points 1 & 2 separated by a
distance of l is (P1 –P2).
The decrease in pressure in the fluid reflects the applied force causing
the fluid to steady flow (no change in flow and hence velocity), this force
must be counter-balanced by a shearing force of equal magnitude at the
wall of the pipe .if τw is shear stress at the pipe wall, then force acting on
the fluid at the wall must be -π DL τw, the negative sign indicates that this
force acts in a direction opposite to the direction of flow. The force acting
upon the fluid due to pressure difference is the (πD2/4) (P1 –P2).in steady
state (no acceleration), the sum of these tow forces is zero. There for we
can write:
62
π*D*L *τw+(πD2/4) (P1 –P2) = 0 …………………[2-9]
τw = D (P1 –P2) ………………...[2-10]
4L
Where:
L: pipeline length
P1: initial pressure
P2: pressure after length L
D: internal diameter of pipeline.
Above equation merely shows that the shear stress at the pipeline wall
is just another means of expression of friction loss such as pressure friction
loss, it follows that available shear stress for a particular pipeline depends
on the length of the pipeline between tow pump station and the pressure
difference.
Viscosity µ
The viscosity also can be defined as the ratio of shear stress to the rate of
shear (4).
µ = τw ……………….. [2-11]
(du / dr)
For the flow in pipe, the friction loss is given by
(P1 –P2) = 32 µU ……………… [2-12]
L D
Where:
µ: viscosity of fluid
63
U: fluid velocity
µ = {D (P1 –P2)/4L} ……………… [2-13]
(8U/D)
= τw ……………… [2-14]
(8U/D)
Then the relation between viscosity & shear stress:
µ = τw ……………… [2-15]
(8U/D)
Rate of shear (τ)
τ = (8U/D) ……………… [2-16]
µ = τw ………………. [2-17]
τ

64
Chapter Three
Material
And
Method
3. Material and Method

65
In this study evaluates and analyses sample collected from petro-
energy Company before and after the Vis-breaking plant, through
measurement of physical and rheological properties. And the general
parameters of the pump stations, to study; Did the Vis-breaking plant
contribute in power saving and minimize the power consumption?,
through conditioning the crude oil according to the pipeline
transportation requirement, due to effect of friction loss , shear stress as
a function of viscosity.
3.1 Chemicals
The chemicals should be subjected to the analyses are:
1- Balila crude oil “high viscosity”, before VBU.
2- Vis-broken crude oil “low viscosity”, after VBU.
3.2 Apparatus
3.2.1 Viscosity apparatus
Front view
1-Temperature adjust knob
2-temprature display
3-press to adjust button
4-locking screw
5-holes for viscometers
6-heating element
7-stirrer
66
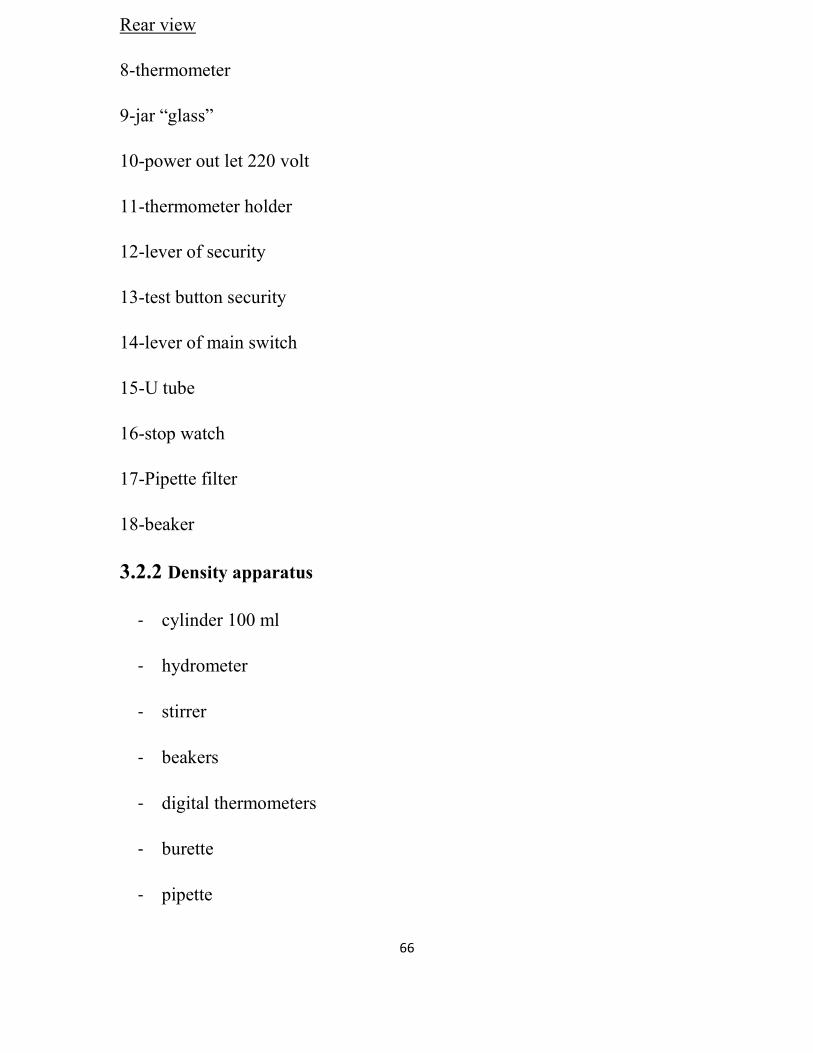
Rear view
8-thermometer
9-jar “glass”
10-power out let 220 volt
11-thermometer holder
12-lever of security
13-test button security
14-lever of main switch
15-U tube
16-stop watch
17-Pipette filter
18-beaker
3.2.2 Density apparatus
- cylinder 100 ml
- hydrometer
- stirrer
- beakers
- digital thermometers
- burette
- pipette
67
3.2.3Velocity
- Pipeline with inside diameter and outside diameter
- Carriers
- Lamp
- Stop watch
3.3 Procedure for chemical and physical analysis
The following procedures were to determine the properties the sample.
3.3.1 Viscosity µ
The viscosity of oil is a measure of its resistance to internal flow and it’s
an indication of its oiliness in lubrication of surface, in the centimeter-gram.
Second (cm. g/s), the unit of viscosity is the poise or centipoises.
The viscosity is determined by measuring the time it takes for crude to flow
through a capillary tube of a given length at a precise temperature .this is
called the kinematic viscosity, expressed in mm2/s. it is defined by standards
American Society for testing and measuring (ASTM D-445).Viscosity can
also be determined by measuring of time it takes for the oil to flow through
calibrated orifice, standard ASTM D-88. It is expressed in say bolt second.
Some conversion tables for the different units are used and standardized
(ASTM D-2161, 1999).
3.3.2 Density ρ &“specific gravity”
Density is the mass of liquid per unit volume at 15oc;and the specific
gravity is the same as the relative density.
68
In the most commonly used method (ASTM D-1298, 1999), the sample
is brought to the prescribed temperature and transferred to cylinder at
approximately the same temperature. The appropriate Hydrometer is
lowered into the sample and allowed to settle, and, after temperature
equilibrium has been reached, the Hydrometer is read and the temperature of
the sample is noted.
Another test determines density and specific gravity by means of a digital
dens-meter (ASTM D-4052). In the test, a small volume (approximately .8
ml) of liquid sample is introduced into an oscillating frequency caused by
the change in mass of the tube is used in conjunction with calibration data to
determine the density of the sample. This test is usually applied to the crude
oil “petroleum”, petroleum distillates and petroleum products.
API gravity is a measure of the lightness or heaviness of petroleum that is
related to density and specific gravity by the following equation:
API = (141.5/sp.gr @ 60oF) – 131.5
3.3.3 Velocity v:
Distance per time.
If:
“Q” is the pipeline discharge and “A” across sectional area.
V = Q /A
= 4*Q /π*d2
Where: d is internal diameter.
3.4 Calculation data
69
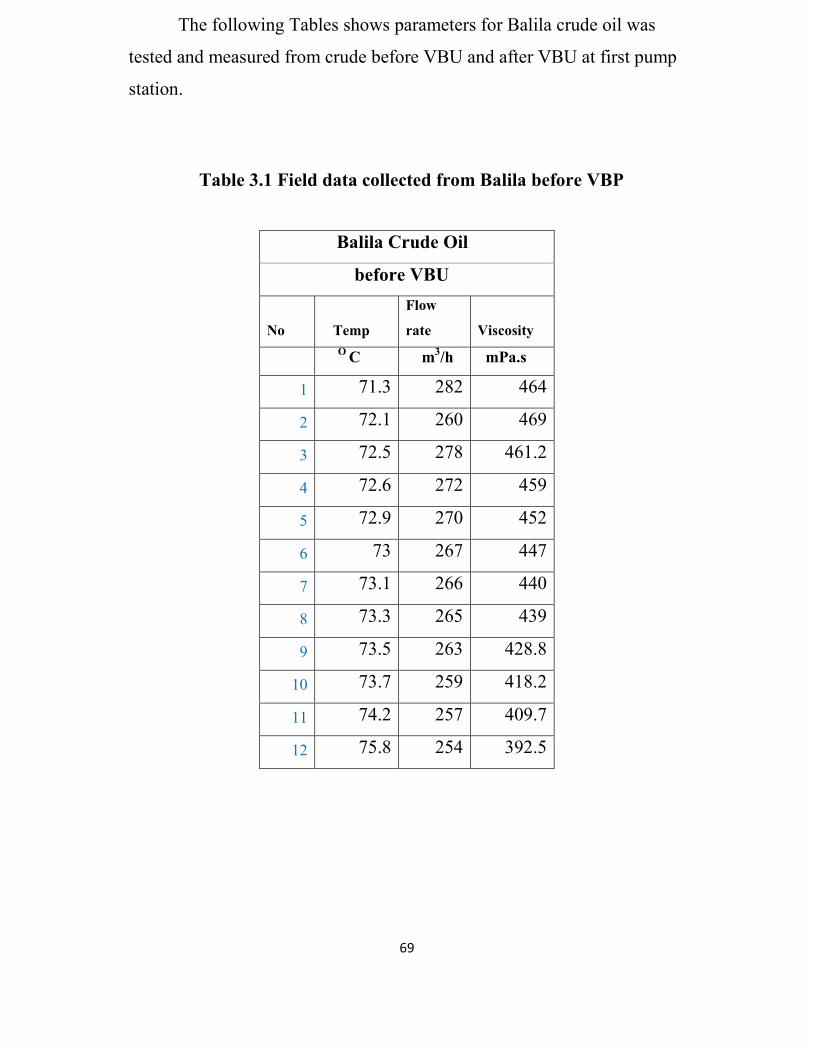
The following Tables shows parameters for Balila crude oil was
tested and measured from crude before VBU and after VBU at first pump
station.
Table 3.1 Field data collected from Balila before VBP
Balila Crude Oil
before VBU
No Temp
Flow
rate Viscosity
O C m3/h mPa.s
1 71.3 282 464
2 72.1 260 469
3 72.5 278 461.2
4 72.6 272 459
5 72.9 270 452
6 73 267 447
7 73.1 266 440
8 73.3 265 439
9 73.5 263 428.8
10 73.7 259 418.2
11 74.2 257 409.7
12 75.8 254 392.5
70
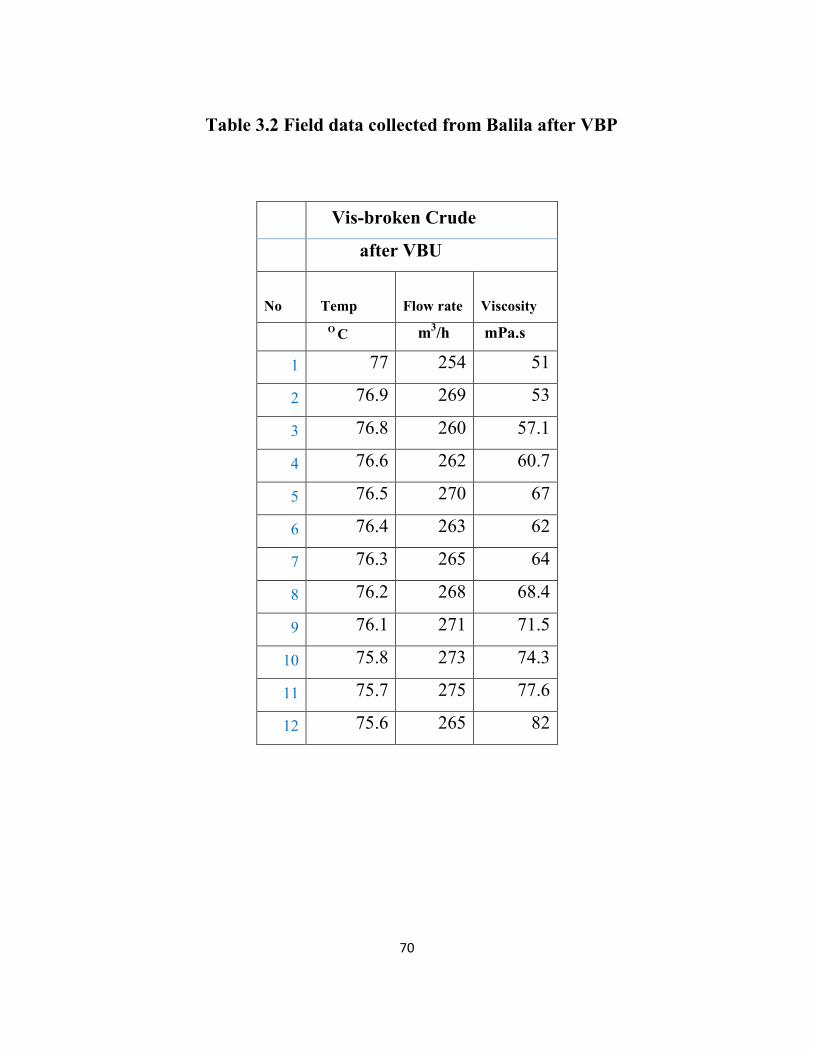
Table 3.2 Field data collected from Balila after VBP
Vis-broken Crude
after VBU
No Temp Flow rate Viscosity
O C m3/h mPa.s
1 77 254 51
2 76.9 269 53
3 76.8 260 57.1
4 76.6 262 60.7
5 76.5 270 67
6 76.4 263 62
7 76.3 265 64
8 76.2 268 68.4
9 76.1 271 71.5
10 75.8 273 74.3
11 75.7 275 77.6
12 75.6 265 82
71
3.5 Calculation Procedure
Used an excel program as the software, that by inter above value of data
insisted variable and inter mathematical models insisted empty cells at
different columns.
Plotting procedure:
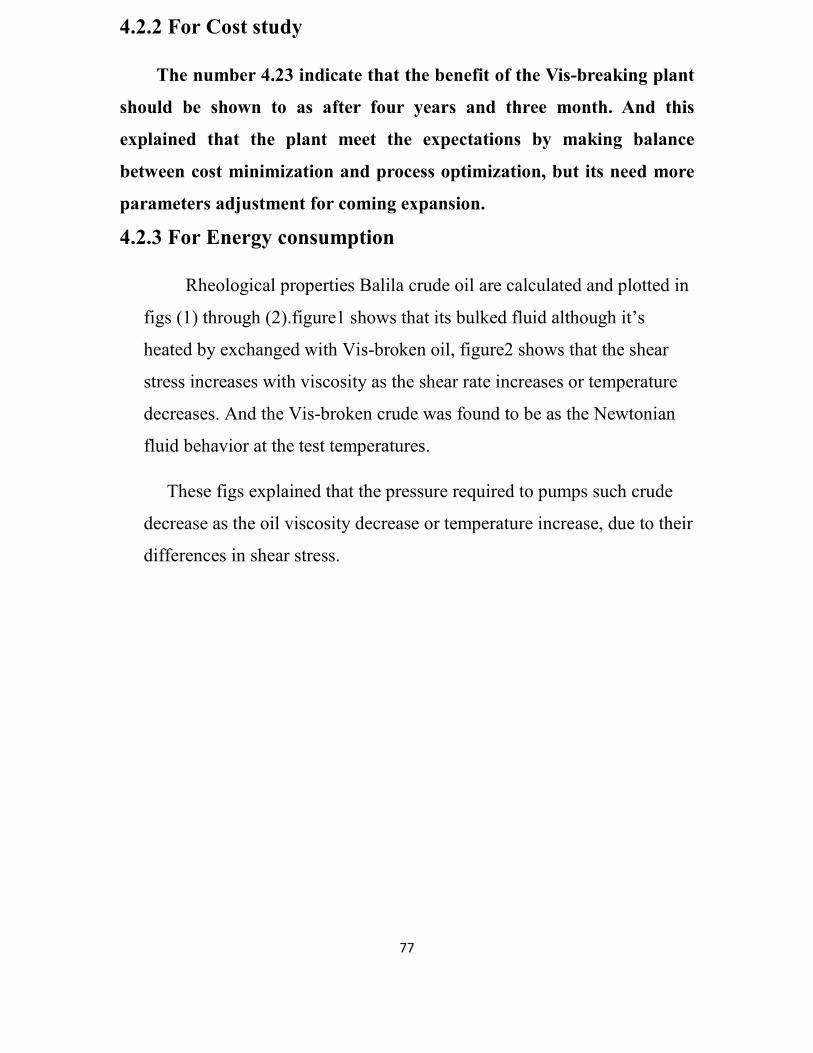
3.5.1 Plotting with MATLAB
MATLAB; formerly used by specialists in signal processing and
numerical analysis. MATLAB in recent years has chived wide-spread and
acceptance throughout the Engineering community.
MATLAB contains many powerful functions for easily creating plots of
several different types, such as rectilinear, logarithmic, surface and counter
plots. MATLAB has other useful function are title, grid and etc. MATLAB
can create figures that contain an array of plots, called subplots. These are
useful when we want to compare the same data plotted with different axis,
can use the subplot command to obtain several smaller subplots in the same
figure.

72
Chapter four
Result
And
Discussion
73
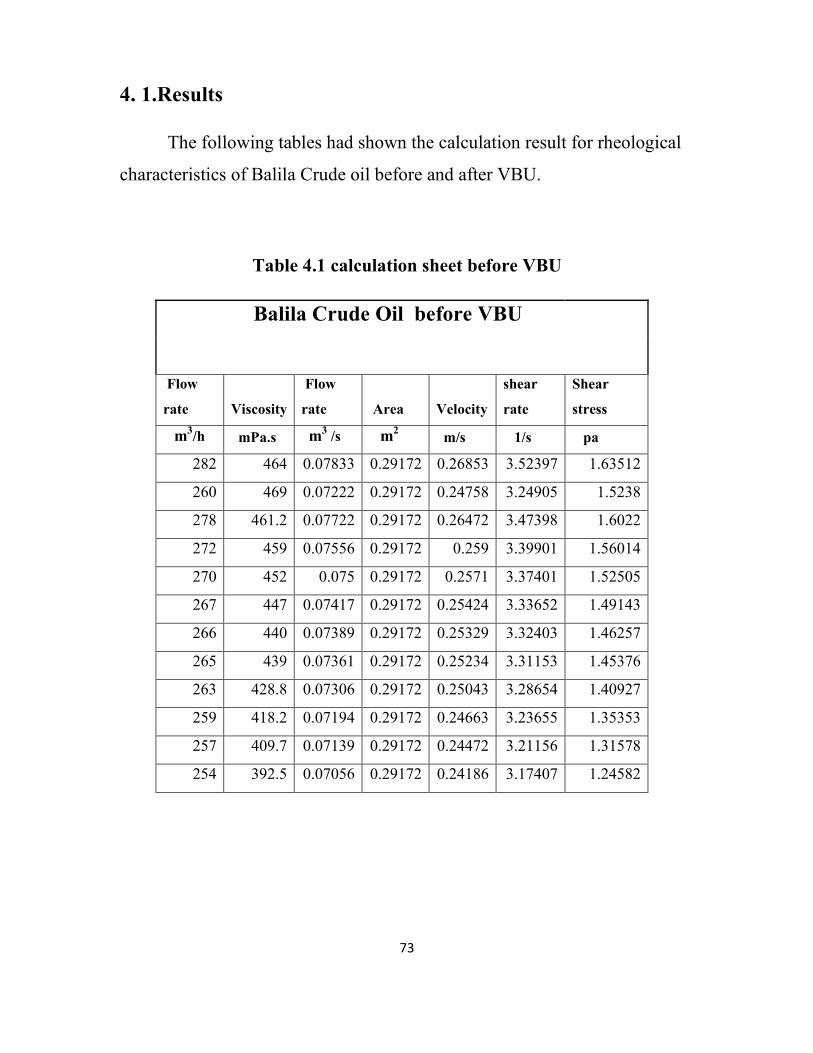
4. 1.Results
The following tables had shown the calculation result for rheological
characteristics of Balila Crude oil before and after VBU.
Table 4.1 calculation sheet before VBU
Balila Crude Oil before VBU
Flow
rate Viscosity
Flow
rate Area Velocity
shear
rate
Shear
stress
m3/h mPa.s m3 /s m2 m/s 1/s pa
282 464 0.07833 0.29172 0.26853 3.52397 1.63512
260 469 0.07222 0.29172 0.24758 3.24905 1.5238
278 461.2 0.07722 0.29172 0.26472 3.47398 1.6022
272 459 0.07556 0.29172 0.259 3.39901 1.56014
270 452 0.075 0.29172 0.2571 3.37401 1.52505
267 447 0.07417 0.29172 0.25424 3.33652 1.49143
266 440 0.07389 0.29172 0.25329 3.32403 1.46257
265 439 0.07361 0.29172 0.25234 3.31153 1.45376
263 428.8 0.07306 0.29172 0.25043 3.28654 1.40927
259 418.2 0.07194 0.29172 0.24663 3.23655 1.35353
257 409.7 0.07139 0.29172 0.24472 3.21156 1.31578
254 392.5 0.07056 0.29172 0.24186 3.17407 1.24582
74
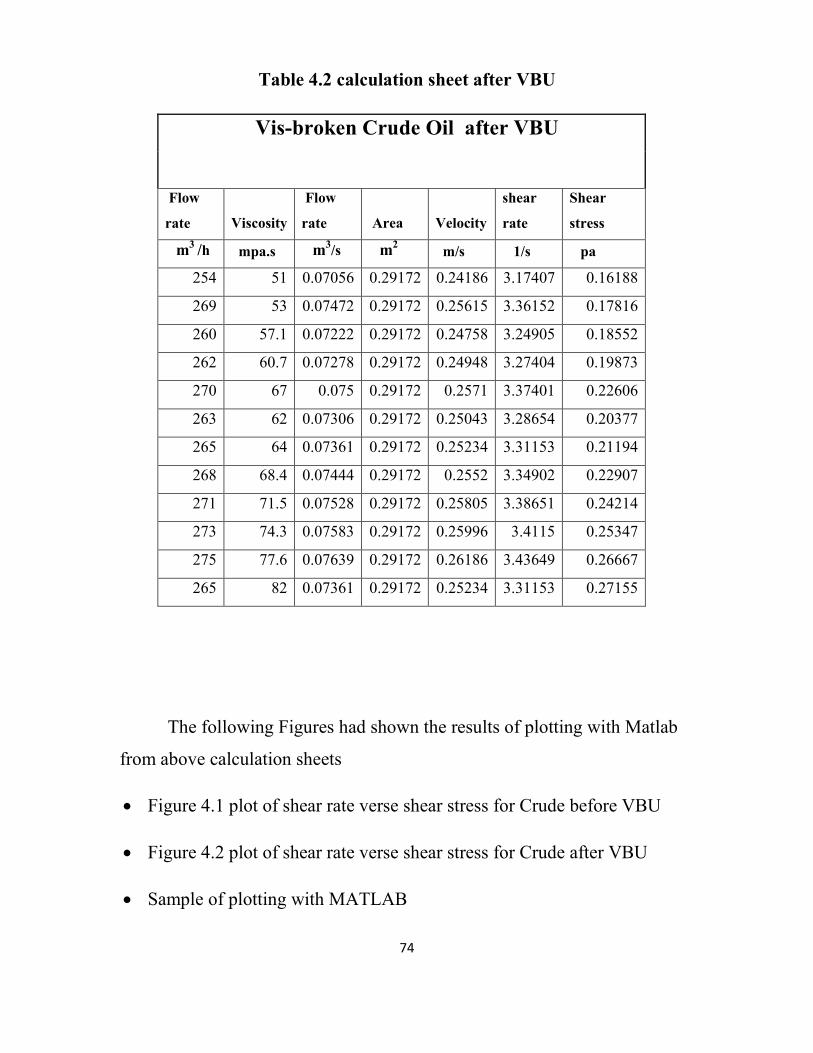
Table 4.2 calculation sheet after VBU
Vis-broken Crude Oil after VBU
Flow
rate Viscosity
Flow
rate Area Velocity
shear
rate
Shear
stress
m3 /h mpa.s m3/s m2 m/s 1/s pa
254 51 0.07056 0.29172 0.24186 3.17407 0.16188
269 53 0.07472 0.29172 0.25615 3.36152 0.17816
260 57.1 0.07222 0.29172 0.24758 3.24905 0.18552
262 60.7 0.07278 0.29172 0.24948 3.27404 0.19873
270 67 0.075 0.29172 0.2571 3.37401 0.22606
263 62 0.07306 0.29172 0.25043 3.28654 0.20377
265 64 0.07361 0.29172 0.25234 3.31153 0.21194
268 68.4 0.07444 0.29172 0.2552 3.34902 0.22907
271 71.5 0.07528 0.29172 0.25805 3.38651 0.24214
273 74.3 0.07583 0.29172 0.25996 3.4115 0.25347
275 77.6 0.07639 0.29172 0.26186 3.43649 0.26667
265 82 0.07361 0.29172 0.25234 3.31153 0.27155
The following Figures had shown the results of plotting with Matlab
from above calculation sheets
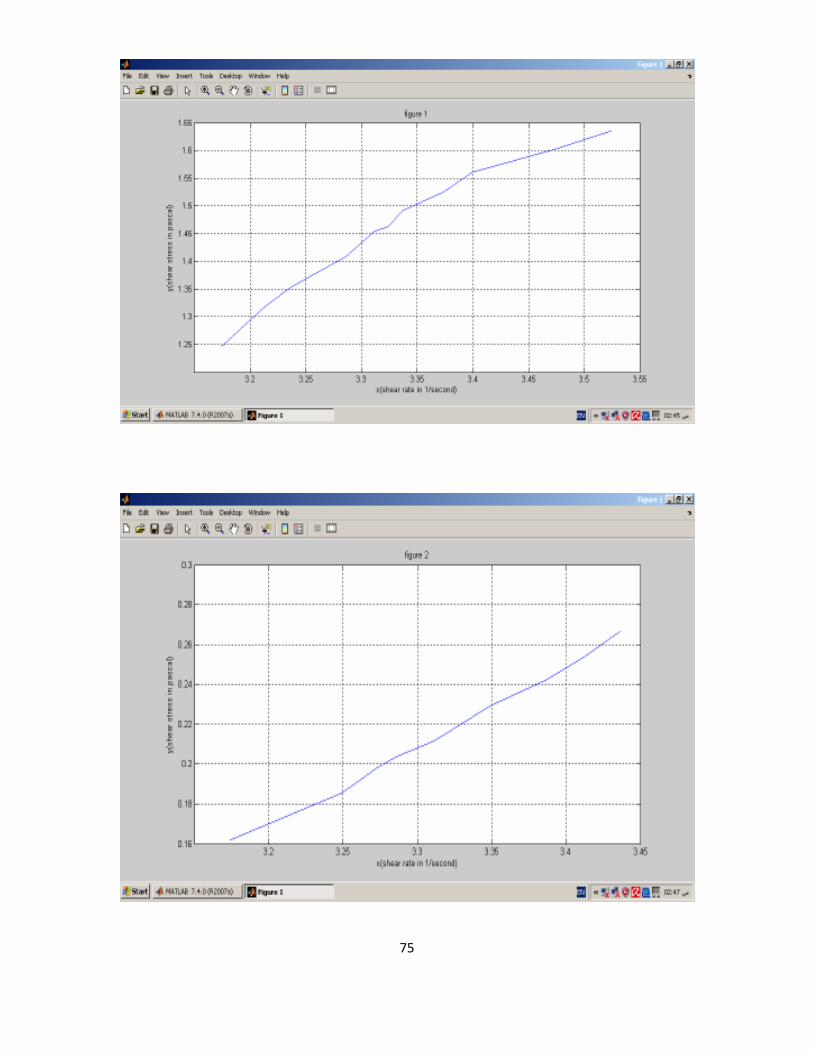
• Figure 4.1 plot of shear rate verse shear stress for Crude before VBU
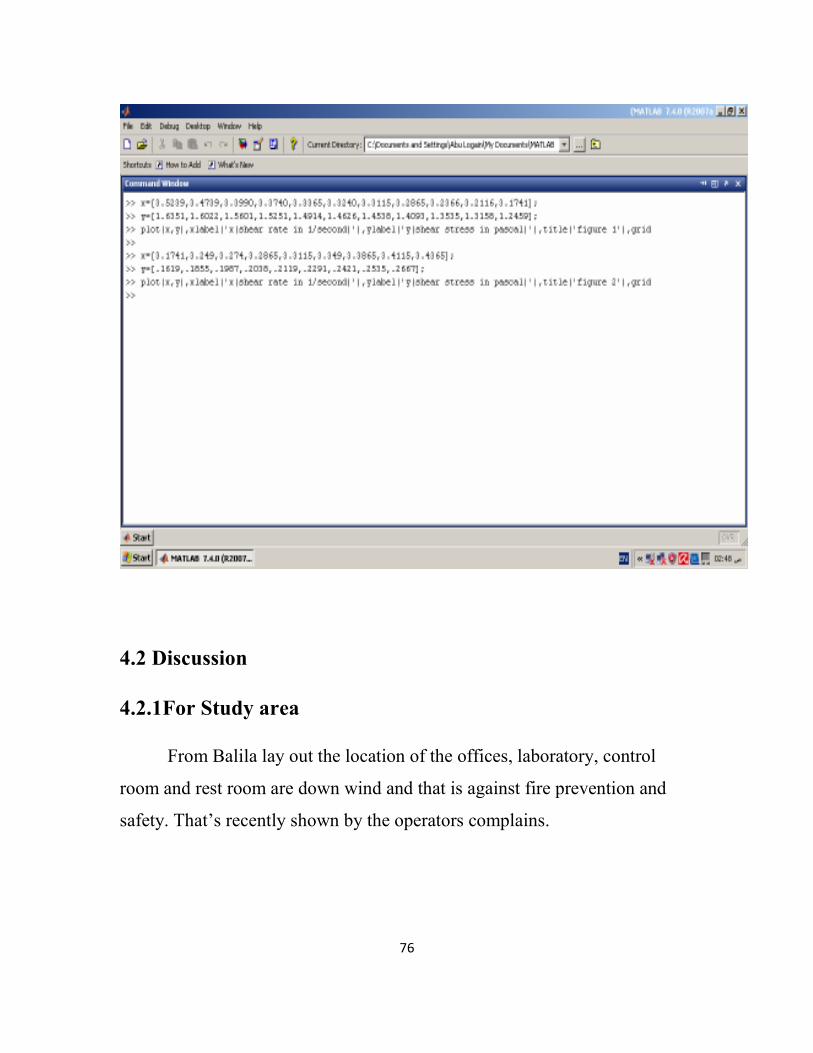
• Figure 4.2 plot of shear rate verse shear stress for Crude after VBU
• Sample of plotting with MATLAB
75
76
4.2 Discussion
4.2.1For Study area
From Balila lay out the location of the offices, laboratory, control
room and rest room are down wind and that is against fire prevention and
safety. That’s recently shown by the operators complains.
77
4.2.2 For Cost study
The number 4.23 indicate that the benefit of the Vis-breaking plant
should be shown to as after four years and three month. And this
explained that the plant meet the expectations by making balance
between cost minimization and process optimization, but its need more
parameters adjustment for coming expansion.
4.2.3 For Energy consumption
Rheological properties Balila crude oil are calculated and plotted in
figs (1) through (2).figure1 shows that its bulked fluid although it’s
heated by exchanged with Vis-broken oil, figure2 shows that the shear
stress increases with viscosity as the shear rate increases or temperature
decreases. And the Vis-broken crude was found to be as the Newtonian
fluid behavior at the test temperatures.
These figs explained that the pressure required to pumps such crude
decrease as the oil viscosity decrease or temperature increase, due to their
differences in shear stress.

78
Chapter Five
Conclusion
And
Recommendations
79
5.1 Conclusion
The Vis-breaking treating at the present study led to significant
improvement in the rheological properties of the blends, including lower
dynamic viscosity, pour point and yield stress for viscous crude, in order
to prevent transportation pipeline cannot be re-stared within the pump
capacity and minimize the wax deposition on the wall of pipeline.
Technical study showed that, the capacity of Vis-breaking plant may be
increased to cover more than transportation requirement; however there
is possibility of producing diesel and gasoline for local consumption.
5.2 Recommendation
1 - Any work must be subjected to the cost study and process
optimization and to make the competition between deference methods
before constructions and not vice versa; to reach to the power saving.
2 - Safety and environmental impact assessment should be considerate
more and more to prevent the community and its environment to keep the
natural resource clean for coming generation.
80
References
1. Sutton, G. D., and Roberts, Sep, (1974) “Paraffin Precipitation during
Fracture,” J. Pet. Technology.
2. Vis-breaking plant operating manual; Petro Energy Oil Company; (2006)
3. Nenniger, J. and Nenniger, (1990).SPE Paper CIM/SPE 90-57
“Optimizing Hot Oiling /Watering Jobs to Minimize Formation Damage,”
presented at the International Technical Meeting in Calgary,
4. Ram Prasad- Khnna puplishers, Petroleum Refining technology.
5. Copyright (1998), Offshore Technology Conference, this paper was
prepared for presentation at the (4–7 May 1998) Offshore Technology
Conference held in Houston, Texas.
6. Dr. Iftikhar A Crude evaluation for pricing (1990); JOWFE oil technology
Libya.
7. Professor A.P.Szilas; (1995) Production and transportation of oil and gas;
second edition, part A. Oxford, Amsterdam.
8. Liods. Marks, Editor; (1951) late Gordon Mc kay; Standard Hand Book
for Mechanical Engineering- seventh addition.
9. Doglas, Fluid Mechanics-solving problems in fluid mechanics vol; third
addition-south bank university, London ;( 2002).
10. Szilas-(1986), Production and transport of oil and gas-part A,
Amesterdam- Newyourk.

81
11. Caslon, JF Richardson and Harker and Backhurst, (1996); Chemical
Engineering, Volume1.fifth edition; Great Britain.
12. Mc cab & Julinac smith; (1983), Unit Operation of Chemical
Engineering. Third edition; London.
Thanks