Embed Size (px)
Citation preview


Study & Master
Karen Morrison • Karen Press

University Printing House, Cambridge CB2 8BS, United Kingdom
One Liberty Plaza, 20th Floor, New York, NY 10006, USA
477 Williamstown Road, Port Melbourne, VIC 3207, Australia
314–321, 3rd Floor, Plot 3, Splendor Forum, Jasola District Centre, New Delhi – 110025, India
79 Anson Road, #06–04/06, Singapore 079906
The Water Club, Beach Road, Granger Bay, Cape Town 8005, South Africa
Cambridge University Press is part of the University of Cambridge.
It furthers the University’s mission by disseminating knowledge in the pursuit of education, learning and research at the highest international levels of excellence.
www.cambridge.org Information on this title: www.cambridge.org/9781107381285
© Cambridge University Press 2013, 2020
This publication is in copyright. Subject to statutory exception and to the provisions of relevant collective licensing agreements, no reproduction of any part may take place without the written permission of Cambridge University Press.
First published 2013Reprinted 2018Updated 2020
ISBN 978-1-107-38128-5
Editor: Clarice Smuts, Louna LamprechtTypesetters: Karlie Hadingham, Maryke Garifallou, Anne EvansIllustrators: Sue Beattie, Karlie Hadingham, Anne Evans, Maryke GarifallouPhotographs: Mike van der Wolk pp. 213, 221Cover image: aaifotostock……………………………………………………………………………………………………………
Cambridge University Press has no responsibility for the persistence or accuracy of URLs for external or third-party internet websites referred to in this publication, and does not guarantee that any content on such websites is, or will remain, accurate or appropriate. Information regarding prices, travel timetables and other factual information given in this work are correct at the time of first printing but Cambridge University Press does not guarantee the accuracy of such information thereafter.……………………………………………………………………………………………………………
n o t i c e t o t e a c h e r s
The photocopy masters in this publication may be photocopied or distributed [electronically] free of charge for classroom use within the school or institution which purchases the publication. Worksheets and copies of them remain in the copyright of Cambridge University Press and such copies may not be distributed or used in any way outside the purchasing institution.……………………………………………………………………………………………………………
If you want to know more about this book or any other Cambridge University Press publication, phone us at +27 21 4127800, fax us at +27 21 419-8418 or send an e-mail to [email protected]
CONTENTS
Section 1: Introduction 5
Section 2: Planning and assessment 17
Section 3: Unit-by-unit 29
Section 4: Resources 193A. Photocopiable additional activities 195
B. Additional activities: solutions 233C. Multiplication tables 238D. Transparencies 241
Section 5: Documents 247
(Measurement and Finance assignments and investigations)

5S e c t i o n 1 • I n t r o d u c t I o n
INTRODUCTION
SECTION 1
Study & Master Mathematical Literacy Grade 12 is based on the Curriculum and Assessment Policy Statement (CAPS) issued by the Department of Basic Education in December 2011. The CAPS is an amended version of the National Curriculum Statement Grades R–12, and replaces the 2002 National Curriculum Statement Grades R–9 and the 2004 National Curriculum Statement Grades 10–12.
The general aims of the South African curriculum as stated in the CAPS:a. The Curriculum and Assessment Policy Statement gives expression to
what are regarded to be knowledge, skills and values worth learning. It will ensure that learners acquire and apply knowledge and skills in ways that are meaningful to their lives. In this regard, the curriculum promotes the idea of grounding knowledge in local contexts, while being sensitive to global imperatives.
b. The Curriculum and Assessment Policy Statement serves the purposes of:• equipping learners, irrespective of their socio-economic background,
gender, physical ability or intellectual ability, with the knowledge, skills and values necessary for self-fulfilment, and meaningful participation in society as citizens of a free country
• providing access to higher education• facilitating the transition of learners from education institutions to the
workplace• providing employers with a sufficient profile of a learner’s
competences.c. The Curriculum and Assessment Policy Statement is based on the
following principles:• social transformation: ensuring that the educational imbalances of
the past are redressed, and that equal educational opportunities are provided for all sections of our population
• active and critical learning: encouraging an active and critical approach to learning, rather than rote and uncritical learning of given truths
• high knowledge and high skills: the minimum standards of knowledge and skills to be achieved at each grade are specified and they set high, achievable standards in all subjects
• progression: the content and context of each grade show progression from simple to complex
• human rights, inclusivity, environmental and social justice: the principles and practices of social and environmental justice and human rights as defined in the Constitution of the Republic of South Africa are included.
d. The Curriculum and Assessment Policy Statement (General) is sensitive to issues of diversity such as poverty, inequality, race, gender, language, age, disability and other factors:• valuing indigenous knowledge systems: acknowledging the rich
history and heritage of this country as important contributors to nurturing the values contained in the constitution
6 S e c t i o n 1 • I n t r o d u c t I o n
• credibility, quality and efficiency: providing an education that is comparable in quality, breadth and depth to those of other countries.
e. The Curriculum and Assessment Policy Statement aims to produce learners who are able to:• identify and solve problems and make decisions using critical and
creative thinking• work effectively as individuals and with others as members of a team• organise and manage themselves and their activities responsibly and
effectively• collect, analyse, organise and critically evaluate information• communicate effectively using visual, symbolic and/or language skills
in various modes• use science and technology effectively and critically showing
responsibility towards the environment and the health of others• demonstrate an understanding of the world as a set of related systems
by recognising that problem-solving contexts do not exist in isolation.f. Inclusivity should become a central part of the organisation, planning and
teaching at each school. This can only happen if all teachers have a sound understanding of how to recognise and address barriers to learning, and how to plan for diversity.
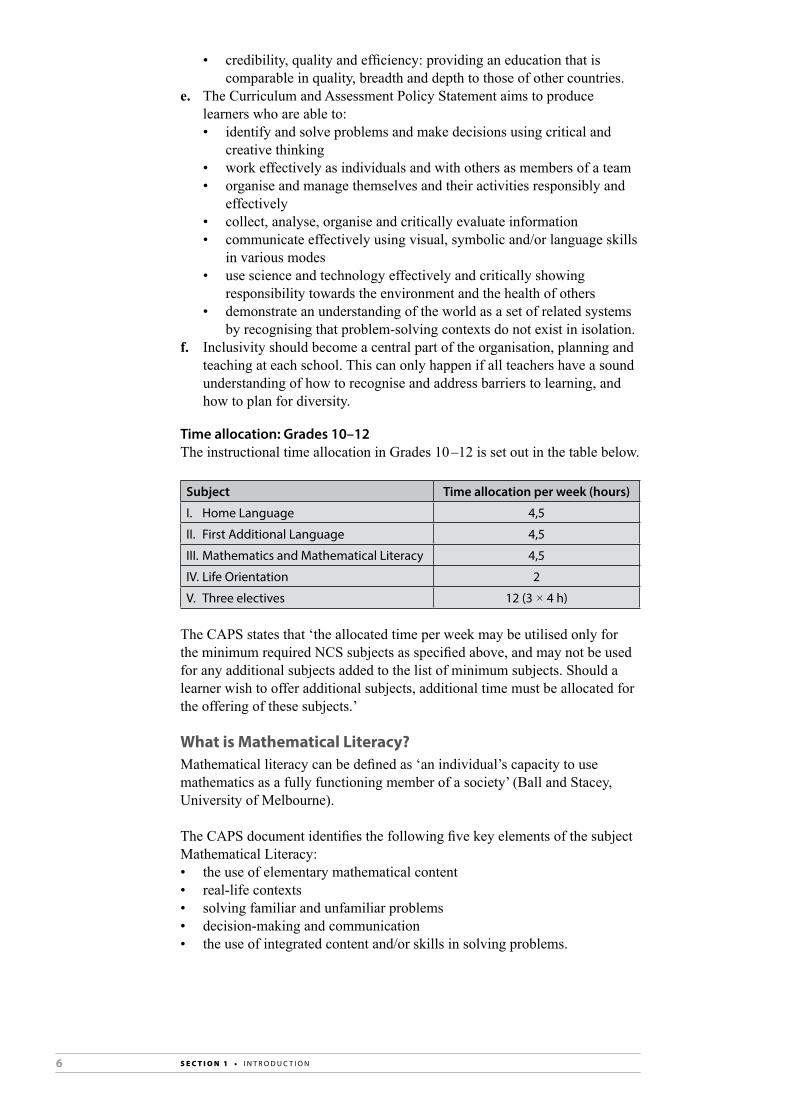
Time allocation: Grades 10–12The instructional time allocation in Grades 10 –12 is set out in the table below.
Subject Time allocation per week (hours)
I. Home Language 4,5
II. First Additional Language 4,5
III. Mathematics and Mathematical Literacy 4,5
IV. Life orientation 2
V. three electives 12 (3 × 4 h)
The CAPS states that ‘the allocated time per week may be utilised only for the minimum required NCS subjects as specified above, and may not be used for any additional subjects added to the list of minimum subjects. Should a learner wish to offer additional subjects, additional time must be allocated for the offering of these subjects.’
What is Mathematical Literacy?Mathematical literacy can be defined as ‘an individual’s capacity to use mathematics as a fully functioning member of a society’ (Ball and Stacey, University of Melbourne).
The CAPS document identifies the following five key elements of the subject Mathematical Literacy:• the use of elementary mathematical content• real-life contexts• solving familiar and unfamiliar problems• decision-making and communication• the use of integrated content and/or skills in solving problems.

7S e c t i o n 1 • I n t r o d u c t I o n
In other words, the subject Mathematical Literacy aims to produce learners who have:• a sense of self-worth and who are able to control aspects of their life
related to mathematical understanding• the skills and understanding to play a responsible role in our society• the ability to calculate, estimate and use measuring instruments• developed strategies and decision-making skills that allow them to be
innovative and flexible in their approach to solving problems• the ability to communicate results and explanations and the skills to work
effectively and collaboratively with others• the ability to draw sensible conclusions from information presented
graphically and apply skills in data-handling and interpretation.
What does it mean to be mathematically literate?Mathematical literacy is more than the ability to do basic arithmetic. It also includes:• working confidently and competently with numbers, measures and
diagrams in a range of real and realistic contexts• choosing and applying a range of techniques and skills, including the use
of technology (calculators and computers)• understanding how numbers and measurements are collected, organised
and displayed in tables, graphs and other forms• developing and using decision-making and problem-solving strategies that
suit both the problem and the context• communicating results and solutions in appropriate ways.
The flow diagram below breaks down the steps that a mathematically numerate person will follow and details what is involved in each step.
• daily life – decisions – school – home• community• finance – money
• find information• interpret
information• act on given
information• communicate
information
• number• shape and space• patterns• data• probability• measurement
• numbers and symbols
• pictures• shapes• formulae• tables• graphs• maps• words/text
A mathematically literate person is able to …
Solve problems in real contexts
by deciding how to respond
to information involving
mathematical ideas
represented in different ways
Mathematics and Mathematical Literacy are not the sameMathematics is an abstract subject that is often theoretical and that requires specific language, skills and methods to deal with subject-specific problems.
Mathematical Literacy takes mathematical knowledge and skills and applies them to everyday situations and problems. Mathematical Literacy is contextual and useful. When learners take processes and ideas from mathematics and apply them in contexts that are specific to their lives (such as choosing a cellphone contract), they are mathematically literate. The following table shows differences between Mathematics and Mathematical Literacy. It also shows how the content and context are interconnected when you are developing mathematical literacy.

8 S e c t i o n 1 • I n t r o d u c t I o n
Mathematical Literacy Mathematics
Task and context Content
doubling a recipe Equivalent fractionsMultiplying and adding fractions
reading instruments such as a thermometer, rain gauge or barometer
Measurement and unitsunderstanding a scale
deciding which cellphone contract is the most affordable
Equations in two variables that represent a relationshipSolving simultaneous equations (graphically or algebraically)
Administering medicine reading a table of values to find amounts that correspond to given conditions (such as the age or mass of a patient)ratio and calculation
Mixing plaster (for building) ratio and proportionMeasuring amount in units for volume and mass
Mixing solutions (fertilisers or pesticides)
calculating area and using ratio and proportion to mix necessary amounts
Planning a trip time–distance–speed relationshipsusing ratio and proportion or algebraBudgeting for petrol, meals, accommodation and other expensescalculating with time (non-decimal amounts)
Financial literacyFinancial literacy is a large part of mathematical literacy and it has become increasingly important in modern life. Our society needs citizens who are able to understand the value of money and manage money in appropriate and responsible ways. When learners leave school and enter the world of work, they will have to engage actively with complex and specialised financial services just to manage their own money affairs. In addition, they will need to be aware of consumer issues and make plans for their longer-term financial wellbeing.
In recent times there have been many changes in our society including:• technological developments (autobanking, internet banking, chip and pin
card services)• increased competition in financial markets (more banks want your money)• a rise in questionable financial practices, including unethical loans, unfair
interest rates and hire purchase (HP) terms that include large balloon payments
• changes in personal finances, including rising household debts• changes in demographics (more poorer households that may not use
formal banking systems, more young people having to make financial decisions without the guidance of older family members)
• increased consumer responsibility as younger people have access to banking services and debit and credit cards, which in turn leads to increased chance of being a victim of fraud.
These and other changes that are likely to occur in the future make it even more important that we produce learners who are financially literate.
Our approach to teaching Mathematical LiteracyOur approach is that learners develop understanding by making connections between what they are learning and their lives.

9S e c t i o n 1 • I n t r o d u c t I o n
Here is a summary of the steps in this process and how they are developed in the course:Step 1: Learning basic skills (for example, how to carry out operations with
fractions).Step 2: Practising what you have learnt (for example, naming fractions of a
whole, adding simple fractions)Step 3: Using and applying learning in everyday contexts (for example,
dividing an amount of money into different fractions, drawing pie graphs using fractions)
Step 4: Understanding the larger social and cultural uses of specific mathematics (for example, discussing the ways in which different societies have used fractions and how Egyptian fractions differ from those used today)
Step 5: Critically engaging with what you have learnt (for example, examining how fractions and percentages can be used in the media to mislead consumers)
This course offers a carefully planned and contextualised approach to the subject that allows teachers to:• help learners see how mathematics can be valuable and useful in their
lives, develop confidence and a sense of personal achievement and encourage ongoing interest and a willingness to find creative solutions to problems
• develop skills, concepts, understandings and attitudes that help learners handle the mathematical contexts they have to manage in their lives
• ensure the learners develop and employ a range of problem-solving methods and grow their ability to think and reason logically and sensibly
• make sure learners have the levels of mathematical literacy they need to be able to cope in an increasingly technology-reliant and information-rich society
• equip learners with the tools and skills they will need and use as they enter the world of work
• give learners the skills and confidence to use their own language and ways of expressing mathematical ideas and also grow their ability to make sense of mathematical ideas presented to them in various formats and ways.
Interpreting and communicating answers and calculationsStudy & Master Mathematical Literacy offers a complete course that provides learners with the tools and opportunities to:• construct their own knowledge and understanding rather than passively
listening to the teacher (transmitted or received knowledge) by solving real-life problems, using real documents and investigating real issues, on their own, with a partner and in groups
• integrate and connect their learning, including connecting topics, content, procedures and ideas, as well as actively promoting connections to their life experiences and ideas by applying skills in different contexts, integrating what they have learnt in one context with what they are doing in others
• solve authentic, real-life (rather than contrived) problems, which are matched to the content of the course by using real documents, published case studies and statistics from the real world
• develop mathematical thinking, including communication and the representation of answers and ideas, and moving towards more abstract and creative thinking by working in different ways, finding their own methods of recording their thinking, and using their own language

10 S e c t i o n 1 • I n t r o d u c t I o n
together with the language and notation of mathematics where appropriate to make their communication as clear and simple as possible.
The CAPS topic, interpreting and communicating answers and calculations, is built into the course and applies across both the basic skills and application topics. As they work through the material, learners will be expected to:• make sense of their own strategies and solutions• share their observations and solutions and understand other learners’
observations and solutions.
Making sense of their own strategies and solutionsThe habit of estimate–solve–check is developed and reinforced throughout the course. Learners are expected to estimate before they try to find solutions and check their solutions against their estimates to make sure they are sensible and correct. Strategies for doing this are presented in examples, and are reinforced as learners work through the application topics in all four terms.
In addition, learners are expected to give explanations, justify and explain their methods and communicate their findings and answers to others, both formally and informally as they work through the course.
Sharing observations and solutions and understanding others’ observations and solutionsThrough taking part in pair, group and class discussions, learners will find that the ways in which they have communicated their workings and solutions are not always clear to others. Discussions with others, and seeing and discussing modelled solutions in their books (and in this teacher’s guide) will help them see that better use of mathematical conventions and symbols, as well as more systematic presentation of results, will improve their communication of ideas and reduce ambiguity and confusion. This will help them to better understand solutions and ideas presented to them by others.
In addition, Study & Master Mathematical Literacy aims to point out very clearly to learners that there are several ways to approach mathematical problems and encourage them to be creative when they are doing and using mathematics in everyday contexts.
Your role as the teacherTeaching Mathematical Literacy effectively means focusing on process skills in context rather than on straight mathematical content. This means that your classroom practice will revolve around:• problem-solving, reasoning and decision-making• communicating and representing ideas• identifying relevance and making connections.
Teaching Mathematical Literacy effectively means that you cannot just use the textbook and ask learners to memorise facts, learn rules for doing things and then write formal tests. Effective teachers of Mathematical Literacy need to approach the subject from a real-life contextual angle, where the mathematics is derived from actual situations or realistic models and learners can work through activities, investigations and problems in their own ways.

11S e c t i o n 1 • I n t r o d u c t I o n
Making sure all learners are includedMany learners fail to reach their potential because they do not see how mathematical ideas are relevant to their lives and because they are not encouraged to connect what they are learning about mathematics to their existing experiences, skills and knowledge. This is a particular problem for learners who see the contexts in the textbook as irrelevant or inappropriate in their own situations.
In Mathematical Literacy, context is the driver for learning. When real-life situations are used, the learning becomes relevant and the educational value of the experience is increased. However, contexts are unique and you may find that some of the contexts offered in the course are not relevant or appropriate for some of the learners. In these cases, you may need to adapt the given activities to better suit your own situation.
The CAPS document details what the learners need to learn and suggests contexts for teaching. However, you can adapt this to meet specific needs by asking yourself what the learners already do or are interested in. Once you have established this, you can work out what to teach them by asking what the learner has to know to be able to do the thing they are interested in.
This Grade 12 course builds on the mathematical literacy skills and concepts learners have acquired in Grades 10 and 11. They should by now have a strong grasp of the basic methods used to do activities in each content area of Mathematical Literacy – finance, measurement, maps, plans and other representations of the physical world, and data handling. In Grade 12 learners will develop their mathematical literacy further by doing more complex practical activities involving problem-solving, assignments and investigations, using the methods and tools they already know – see the Resources section that starts on page 193. A summary of the main calculation methods needed for these activities is also given in the Reference section at the back of the Learner’s Book.
The focus on workplace and small business situations exposes learners to planning, problem-solving and financial monitoring insights and skills they need to develop to deal with real-life experiences such as:• reading quotations from businesses• budgeting before giving quotations to customers• preparing invoices and receipts• calculating cost price and setting selling price• budgeting for projected expenditure• budgeting for inflation• reading payslips• travel allowance claims• understanding UIF.
Finding information and resourcesAn important aspect of mathematical literacy is knowing how to find the information needed to solve a problem or carry out a project – for example, doing an internet search and collecting information from local businesses or government offices. In Grades 10 and 11 the information learners needed to do activities was generally provided as part of the activities. In Grade 12 some of the activities will require learners to do this research, and to choose information for solving the problem that is most suitable to their context.

12 S e c t i o n 1 • I n t r o d u c t I o n
In all cases where this is so, you should adapt tasks to suit the available local sources of information, expert advice, and so on. For example, many activities in the measurement section ask learners to consult a local builder or building supply store for information about schedules, materials and costs involved in building a house. You may want to identify some specific local builders or stores that will be willing to respond to learners’ queries.
Another essential mathematical literacy skill is being able to make sense of newspaper articles, TV news reports and other everyday sources of information about our world, when these items include numerical information. In this course learners will spend some time reading and interpreting news and feature articles that present this kind of information to develop their ability to use numerical information, graphs and other data in their daily lives. You can augment these activities with articles from local newspapers (for example, a report on the 2011 National Census or articles about the performance of learners on national assessment tests), and other documents that provide interesting information about the South African and international context.
You can help learners to apply their mathematical literacy skills to a broad range of contexts simply by bringing newspaper articles on diverse topics to class for discussion and analysis. Learners need to be able to apply the skills they are developing in the classroom to a general understanding of the social, economic and political information that surrounds them in everyday life. They can gain the confidence to do this by paying detailed attention to examples of daily news reports that include graphs, statistics and financial information. For example, the group of maps on the left that appeared in a Sunday newspaper in early 2012 contains information that learners could find interesting, but that they might not bother to read because it is presented in ‘mathematical’ language. Ask learners to find their own examples of such items in newspapers, on the internet and from other sources, and spend class time exploring and discussing the information they contain.
You will find other suggestions for alternative contexts in this Teacher’s Guide and in the CAPS document.
Overcoming maths anxietyMany learners who opted for Mathematical Literacy in Grade 10 will have experienced some form of maths anxiety. They may believe they are not capable of doing maths or that it is too difficult for them. Or, they may have experienced failure in mathematics classes and this might make them feel anxious about anything to do with maths. Or they may just have internalised attitudes and perceptions about mathematics that make it difficult for them to see how they will ever be able to succeed at anything mathematical – these
Central Region*
KwaZulu-Natal
Gauteng
Eastern Cape
Northern region**
Western Cape
64,6%of people in the province
report for treatment citing alcohol as their primary
substance of abuse
73,1%of young people (under
20 years) report for treatment citing alcohol
as their primarysubstance of abuse
73,1%
23,3%
44,4%
13,2%
44,1%
6,3%
35,7%
7,7%
29,8%
6,9%
total alcohol abuse rate alcohol abuse rateof people youngerthan 2010 percentage points
Alcohol is the most abused substance in themajority of privinces. The exception is theWestern Cape, where tik is the drug ofchoice and Mpumalanga and Limpopo, where cannabis is abused most frequently
Alcohol abuse in South Africa
*Free State, Northern Cape and North West** Mpumalanga and LimpopoSacendu data only reflect substance use among people who have managed to access available treatment services and is not representative of substance abuse trends in the general populationSource: 2010 Monitoring Alcohol and Drug Abuse Trends in South Africa report, compiled by the South African Community Epidemiology Network on Drug Use (Sacendu)

13S e c t i o n 1 • I n t r o d u c t I o n
include perceptions such as ‘girls can’t do maths’ and ‘my father was no good at maths and neither am I’.
One of your roles as a teacher of Mathematical Literacy is likely to be helping to reduce the levels of anxiety that learners feel and encouraging them to see that they already carry out tasks quite easily in everyday life that require them to apply mathematical thinking. Using context rather content is one of the first steps to helping learners consider and talk about the informal mathematics they use without really thinking about it, and this in turn can empower them and boost their confidence and motivation.
There are things that you can say and behaviour that you can encourage to help learners to overcome anxiety about mathematics:• Don’t give up immediately if you don’t understand something.• It does not matter if you get the wrong answer.• You can work slowly – we are not in a race.• If you get stuck on one part, move on and come back to it later.• Ask another learner for help.• Don’t immediately think you are wrong.• Ask for another explanation if you don’t understand at first.• Work in a group to solve the problem.• Make sure you can explain how and why you got the answer.• Listen to the questions that other learners ask because it might be about
something you don’t understand either.• Make sure you understand the concept you are working on before you
move on.• Refer to the basic skills section at the back of the Learner’s Book when
you forget how to do something.
Using resources to enhance learningCalculatorsThe calculator is an important learning tool that learners can use to develop, explore and consolidate new ideas. Calculators are very useful when you want learners to investigate and discover number facts and patterns and make generalisations. Using a calculator allows the learners to focus on finding ways of solving a problem rather than on routine mechanical operations that can detract from the real point of a problem, particularly in learners who are not good at mathematics and who lack confidence in their own abilities.
Learners should have access to a simple calculator and be encouraged to use it for all the activities in this course.
Measuring equipmentThere is no doubt that using real tools and apparatus can help learners develop and clarify their understandings of mathematics, particularly in the areas of measurement. Using tools and measuring instruments allows the learners to develop abstract ideas and form concepts from practical experience. This is just as important in Grade 12 as in lower grades.

14 S e c t i o n 1 • I n t r o d u c t I o n
Navigating the textbookWe have organised the content of the course to follow the sequence of topic sections set out in the CAPS Suggested work schedule for Grade 12. The learners work term by term through sections of the applications topics as sequenced in the suggested work schedule. In Term 4 they will plan a revision programme and work through example exam papers to prepare for the final exams.
To help learners who are not sure about the calculation methods, formulae and other mathematical methods that were covered in Grade 10 and 11, this material is included in the Learner’s Book in the skills reference section. Learners are directed to relevant parts of this section, where they will find explanations and examples of techniques they need to use in a specific problem-solving context.
The application topics use real-life South African as well as international examples as far as possible to provide appealing and interesting contexts that will interest and engage Grade 12 learners. Information is presented in many different forms, so that learners become familiar with the many ways in which content that they need to understand can be structured. You should supplement the examples in the Learner’s Book with as many locally relevant examples as possible (such as accounts from local shops and your local municipality and maps of the region, city or neighbourhood where you live).
Examples of information in different forms in the Learner’s Book:
Information in graphs and charts
Information on diagrams

15S e c t i o n 1 • I n t r o d u c t I o n
Information on documents
Information in tariff tables
TOLL ROAD TARIFFSN4: Pretoria – Lobatse (Botswana border) Operator Class I Class II Class III Class IVQuagga Main line Magalies eastern section Intertoll R3,00 R5,50 R8,00 R11,00Pelindaba Main line Magalies western section Intertoll R4,00 R7,50 R11,00 R14,00Doornpoort Main line Pretoria – Brits Bakwena R10,00 R25,00 R29,00 R35,00K99 Interchange Ramp Local destinations Bakwena R10,00 R25,00 R29,00 R35,00Brits Main line Brits - Mooinooi Bakwena R10,00 R35,00 R39,00 R46,00Buffelspoort Ramp Local destinations Bakwena R10,00 R24,50 R27,00 R32,00Marikana Main line Mooinooi – Rustenburg Bakwena R15,00 R36,00 R41,00 R49,00Kroondal Ramp Local destinations Bakwena R10,00 R24,50 R27,00 R32,00Swartruggens Main line Rustenburg – Zeerust Bakwena R71,00 R177,00 R215,00 R253,00
Account Details as at 19/01/2019 A/C No 146893715 Page 2 of 2
PROPERTY RATES (Period 21/12/2018 to 19/01/2019) 30 Days
WATER (Period 14/12/2018 to 17/01/2019 - 35 Days (Actual Reading)
REFUSE (Period 21/12/2018 to 19/01/2019) 30 Days
SEWERAGE (Period 14/12/2018 to 17/01/2019 - 35 Days (Actual Reading)
R C R C
>>>>> 91555146893715
AT 59 RIVER STREET, KOMMETJIE, 7975 / ERF 4489# Total ValueFrom 21/12/2018: R1 475 500.00 @ 0.0053000 ÷ 365 x 30# Statutory Rebate CRFrom 21/12/2018: R15 000.00 @ 0.0053000 ÷ 365 x 30# Additional Rebate CRFrom 21/12/2018: R185 000.00 @ 0.0053000 ÷ 365 x 30
AT 59 RIVER ST, KOMMETJIE / ERF 4489Meter No: ZUK788 / Consumption 37.000 kl / Daily Average 1.957 klConsumption charge (Dom)(1) 6.9040 l; Free (2) 5.1780 kl @ R3.9900(3) 10.9320 kl @ R8.5100 (4) 13.9860 kl @ R12.6100
*
*
*
AT 59 RIVER ST, KOMMETJIE / ERF 4489Disposal Charge (1 x 240 l BIN x 1 Removals)
AT 59 RIVER ST, KOMMETJIE / ERF 4489Disposal Charge(1) 4.833 kl Free (2) 3.6250 kl @ R4.6700(3) 76520 kl @ R9.9400 (4) 9.7900 kl @ R10.8700
Add 15% VAT on Amounts marked with * above0% VAT on Amounts marked with # above
642.75
6.53 -
80.59 -555.53
290.05290.05
75.4475.44
199.41199.4184.74
METER DETAILS/PROPERTY VALUES OLD READINGS NEW READINGS UNITS USED
WATER ZUK788/001 3515.000 kl (Actual) 3552.000 kl (Actual) 37.000 kl
LATEST ACCOUNT TOTAL DUE R 1 205.17
Page 1 of 2
Due date 14/02/2020Account summary as at 19/01/2020At 59 River Street, Kommetijie, 7975/Erf 1234
SMIT MR F R59 RIVER STREETKOMMETJIE7975
Previous Account Balance 176.13
Less payments (07/12/2019) Thank you 176.13-
Latest account = see overleaf 169.28
Civic Centre,12 Hertzog Boulevard, 8001PO Box 655, Cape Town, 8000VAT Registration number4500193497
THIS CITY WORKS FOR YOU
BUSINESS PARTNERNUMBER
10000446771
DISTRIBUTIONCODE
ACCOUNTNUMBER 146893715
CUSTOMER VATREGISTRATION NUMBER
TAX INVOICENUMBER
106001787658
Tel: 086 010 3089 - Fax: 086 010 3090Tel: overseas clients +17 21 401 4701E-mail: [email protected]: Director: Revenue, PO Box 655, Cape Town 8000Web address: www.capetown.gov.za
0.00
169.28
169.28Total (a) + (b)169.28
(a)
Current amount due (b) Payable by 14/02/2020
Total liability 169.28 Electricity is expensive. Saving is simple.For top electricity tips, visit www.SavingElectricity.org.za

16 S e c t i o n 1 • I n t r o d u c t I o n
Information in text form
Cross-referencingAs learners work through the course, they are directed to other places in the book by link boxes in the shoulder. These links tell the learners where to find the maths skill they need to apply to solve a problem. These boxes link to the basic skills reference section and to places in the application topics where a particular skill was taught or used.
Use real distances to calculate measurements on a planUse the steps below to make a scale drawing or map.Step 1: Find or measure the real lengths Step 2: Decide how big your drawing will be as this will help you
work out a scale
How to work out equivalent ratios is covered on page 513 in the Learner’s Book.
17S e c t i o n 2 • P L A n n I n G A n d A S S E S S M E n t
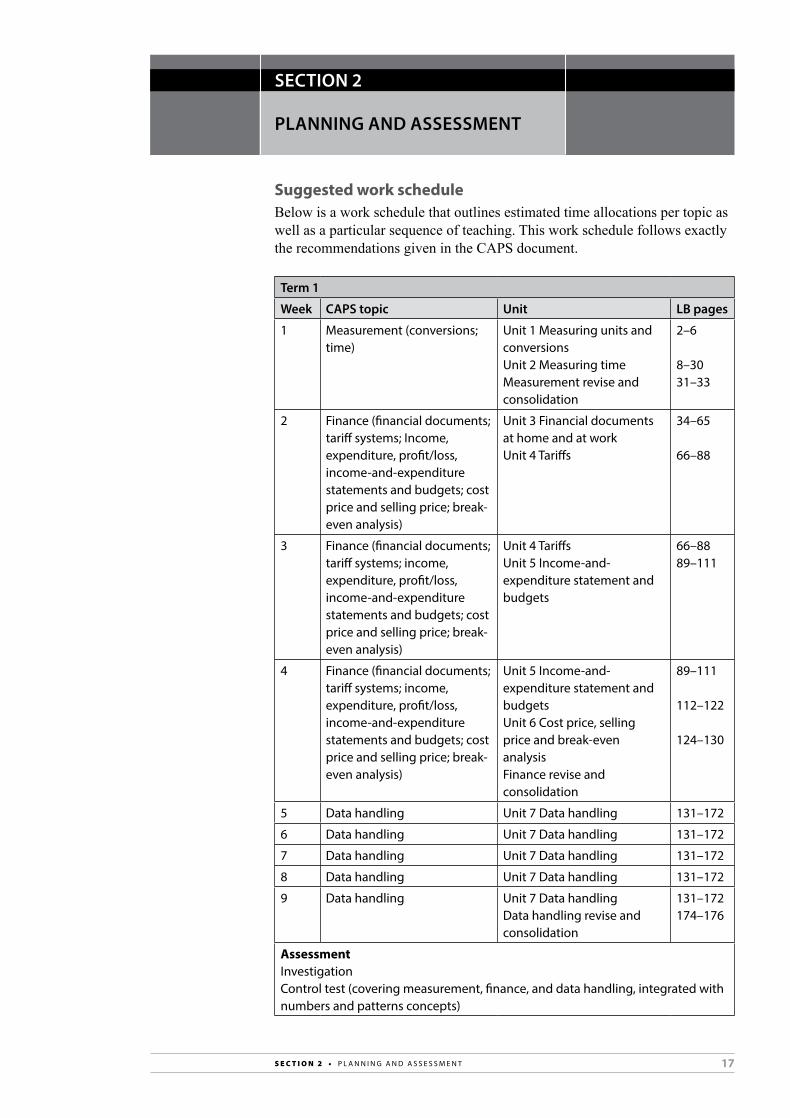
Suggested work scheduleBelow is a work schedule that outlines estimated time allocations per topic as well as a particular sequence of teaching. This work schedule follows exactly the recommendations given in the CAPS document.
Term 1
Week CAPS topic Unit LB pages
1 Measurement (conversions; time)
unit 1 Measuring units and conversionsunit 2 Measuring time Measurement revise and consolidation
2–6
8–30 31–33
2 Finance (financial documents; tariff systems; Income, expenditure, profit/loss, income-and-expenditure statements and budgets; cost price and selling price; break-even analysis)
unit 3 Financial documents at home and at workunit 4 tariffs
34–65
66–88
3 Finance (financial documents; tariff systems; income, expenditure, profit/loss, income-and-expenditure statements and budgets; cost price and selling price; break-even analysis)
unit 4 tariffsunit 5 Income-and-expenditure statement and budgets
66–8889–111
4 Finance (financial documents; tariff systems; income, expenditure, profit/loss, income-and-expenditure statements and budgets; cost price and selling price; break-even analysis)
unit 5 Income-and-expenditure statement and budgetsunit 6 cost price, selling price and break-even analysis Finance revise and consolidation
89–111
112–122
124–130
5 data handling unit 7 data handling 131–172
6 data handling unit 7 data handling 131–172
7 data handling unit 7 data handling 131–172
8 data handling unit 7 data handling 131–172
9 data handling unit 7 data handlingdata handling revise and consolidation
131–172174–176
AssessmentInvestigationcontrol test (covering measurement, finance, and data handling, integrated with numbers and patterns concepts)
PLANNING AND ASSESSMENT
SECTION 2

18 S e c t i o n 2 • P L A n n I n G A n d A S S E S S M E n t
Term 2
Week CAPS topic Unit Pages
1 Finance (interest; banking; inflation)
unit 1 Interest and interest ratesunit 2 Banking, loans and investments
178–203
204–230
2 Finance (interest; banking; inflation)
unit 2 Banking, loans and investmentsunit 3 Inflation
204–230
231–244
3 Maps, plans and other representations of the physical world (scale and map work)
unit 4 Scaleunit 5 Maps
251–258 259–278
4 Maps, plans and other representations of the physical world (scale and map work)
unit 5 Maps 259–278
5 Measurement (measuring length, measuring weight, measuring volume, measuring temperature; calculating perimeter, area and volume)
unit 6 Measuring length and distance unit 7 Measuring mass
283–300
301–319
6 Measurement (measuring length, measuring weight, measuring volume, measuring temperature; calculating perimeter, area and volume)
unit 7 Measuring massunit 8 Measuring volume
301–319 320–333
7 Measurement (measuring length, measuring weight, measuring volume, measuring temperature; calculating perimeter, area and volume)
unit 9 Measuring temperatureunit 10 calculating perimeter, area and volume
334–339
340–366
8 Measurement (measuring length, measuring weight, measuring volume, measuring temperature; calculating perimeter, area and volume)
unit 10 calculating perimeter, area and volume
340–366
9 revise and consolidate FinanceMapworkMeasurement
246–250280–282369–372
AssessmentAssignmentMid-year examinations (2 papers; 2 hours each; 100 marks each)(Finance, maps and measurement, integrated with numbers and patterns concepts)

19S e c t i o n 2 • P L A n n I n G A n d A S S E S S M E n t
Term 3
Week CAPS topic Unit Pages
1 Finance (taxation; exchange rates)
unit 1 taxation 374–399
2 Finance (taxation; exchange rates)
unit 1 taxation 374–399
3 Finance (taxation; exchange rates)
unit 2 Exchange rates 400–409
4 Maps, plans and other representations of the physical world (scale and plans)
unit 3 Scale and plans 418–427
5 Probability unit 4 Probability 430–445
6 Probability unit 4 Probability 430–445
7 Maps, plans and other representations of the physical world (models)
unit 5 using models to investigate shape and space
448–451
8 Maps, plans and other representations of the physical world (models)
unit 5 using models to investigate shape and space
448–451
9 revise and consolidate FinanceMaps and plansProbabilityMaps and plans – using models
411–417428–429446–447452–454
Assessmentcontrol test (covering data handling and/or probability, integrated with numbers and patterns concepts)trial examinations (2 papers; 3 hours each; 150 marks each) (covering all topics in the curriculum)
Term 4
Week CAPS topic Unit Pages
All revision unit 1 Structuring your revision programmeunit 2: Preparing for the final Mathematical Literacy examination papersunit 3: Examination-style questions and examination papers
456–495
AssessmentEnd-of-year examinations (2 papers; 3 hours each; 150 marks each) (covering all topics in the curriculum)

20 S e c t i o n 2 • P L A n n I n G A n d A S S E S S M E n t
Programme of assessmentThe programme of assessment (POA) for Grade 12 Mathematical Literacy should consist of seven formal assessment tasks that are assessed internally. Six of these tasks are undertaken and assessed during the school year, and they comprise 25% of the total mark for Mathematical Literacy. The seventh task is the end-of-year examination, which comprises 75% of the total mark.
The programme of assessment must include assignments, investigations and control tests, and these should be planned so that all topics and sections of the Grade 12 course are addressed throughout the year. A possible programme of assessment for Grade 12 is given below with the suggested weighting of each item. Remember though that internal formal assessment (including at least one examination) accounts for only 25% of the overall mark for Mathematical Literacy, the end of year external examinations account for the other 75%.
Programme of assessmentTerm 1: One investigation (10%) AND one control test (15%)Term 2: One assignment (10%) AND one internal examination at the end
of the term (25%)Term 3: One control test (15%) AND one examination (25%)
If a school choses to have only one examination at the end of Term 2 or Term 3, the other one must be replaced by an end of term control test that counts for 25% of the internal formal assessment marks.
Activities that can be used by teachers for control tests, assignments and investigations have been included in both the Learner’s Book and this Teacher’s Guide.
Control testsIn control tests, learners are given all the information required to complete a task. These tests are carried out under examination conditions. They will help prepare learners for their final examination. The Learner’s Book includes activities that require learners to apply a method that was taught in a unit to a new set of information. These activities can be used as part of a control test or repeated for the test with new information supplied by the teacher.
You will find advice for setting control test and examination questions on pages 25 and 26 of this Teacher’s Guide.
Assignments and investigationsIn Grade 12 learners are expected to complete one investigation (in Term 1) and one assignment (in Term 2). This Teacher’s Guide provides a wide variety of assignments and investigations from which you can choose to fulfil this requirement.
Assignments are structured tasks that give learners clear guidelines about how to carry out a task, and where there is a well-defined solution to the task. The content and context of an assignment should be based on work already covered in the course, and it should allow learners to apply a method or approach that they have already learnt to use. There are activities throughout the Learner’s Book that can be used as assignments for assessment purposes and also activities in the Resources section in this Teacher’s Guide (these activities may be photocopied and they may be used as replacements for Learner’s Book activities). They are indicated in the table on pages 22 to 24.

21S e c t i o n 2 • P L A n n I n G A n d A S S E S S M E n t
InvestigationsInvestigations are tasks in which learners go through a series of steps that involve guided discovery to achieve an understanding of a concept and/or a method, and apply their mathematical literacy skills in new situations. An important aspect of this type of task is that learners should use insight and understanding of the context to make an appropriate decision based on their investigative work. There are extended investigative activities throughout the Learner’s Book and also in the Resources section in this Teacher’s Guide that can be used for assessment purposes. They are indicated in the table on pages 22 to 24.
Note that an assignment or an investigation may cover more than one topic or section, and it can be used to assess concepts and methods that have been learnt in both/all these sections. For example, an investigation that involves comparing the costs of different cellphone options can be used to assess learners’ understanding and skills relating to patterns, relationships and representations (working with two or more relationships) and finance (tariff systems).
22 S e c t i o n 2 • P L A n n I n G A n d A S S E S S M E n t
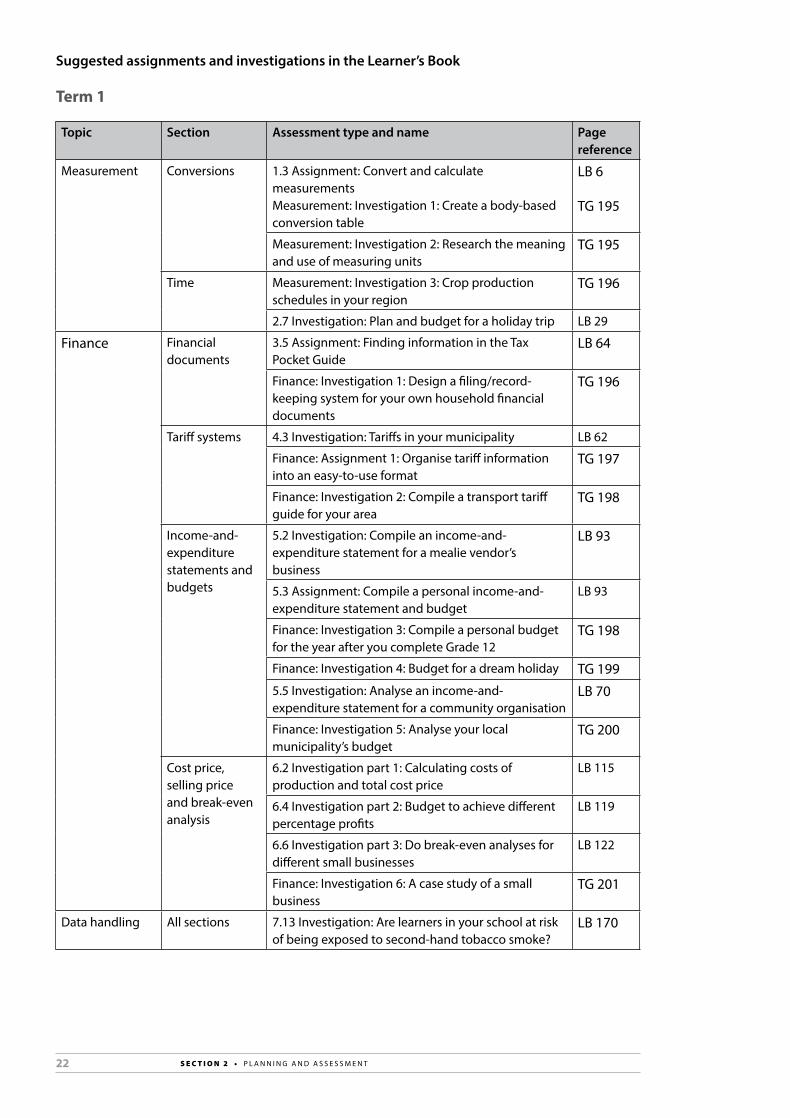
Suggested assignments and investigations in the Learner’s Book
Term 1
Topic Section Assessment type and name Page reference
Measurement conversions 1.3 Assignment: convert and calculate measurements Measurement: Investigation 1: create a body-based conversion table
LB 6
tG 195
Measurement: Investigation 2: research the meaning and use of measuring units
tG 195
time Measurement: Investigation 3: crop production schedules in your region
tG 196
2.7 Investigation: Plan and budget for a holiday trip LB 29
Finance Financial documents
3.5 Assignment: Finding information in the tax Pocket Guide
LB 64
Finance: Investigation 1: design a filing/record-keeping system for your own household financial documents
tG 196
tariff systems 4.3 Investigation: tariffs in your municipality LB 62
Finance: Assignment 1: organise tariff information into an easy-to-use format
tG 197
Finance: Investigation 2: compile a transport tariff guide for your area
tG 198
Income-and-expenditure statements and budgets
5.2 Investigation: compile an income-and-expenditure statement for a mealie vendor’s business
LB 93
5.3 Assignment: compile a personal income-and-expenditure statement and budget
LB 93
Finance: Investigation 3: compile a personal budget for the year after you complete Grade 12
tG 198
Finance: Investigation 4: Budget for a dream holiday tG 1995.5 Investigation: Analyse an income-and-expenditure statement for a community organisation
LB 70
Finance: Investigation 5: Analyse your local municipality’s budget
tG 200
cost price, selling price and break-even analysis
6.2 Investigation part 1: calculating costs of production and total cost price
LB 115
6.4 Investigation part 2: Budget to achieve different percentage profits
LB 119
6.6 Investigation part 3: do break-even analyses for different small businesses
LB 122
Finance: Investigation 6: A case study of a small business
tG 201
data handling All sections 7.13 Investigation: Are learners in your school at risk of being exposed to second-hand tobacco smoke?
LB 170
23S e c t i o n 2 • P L A n n I n G A n d A S S E S S M E n t
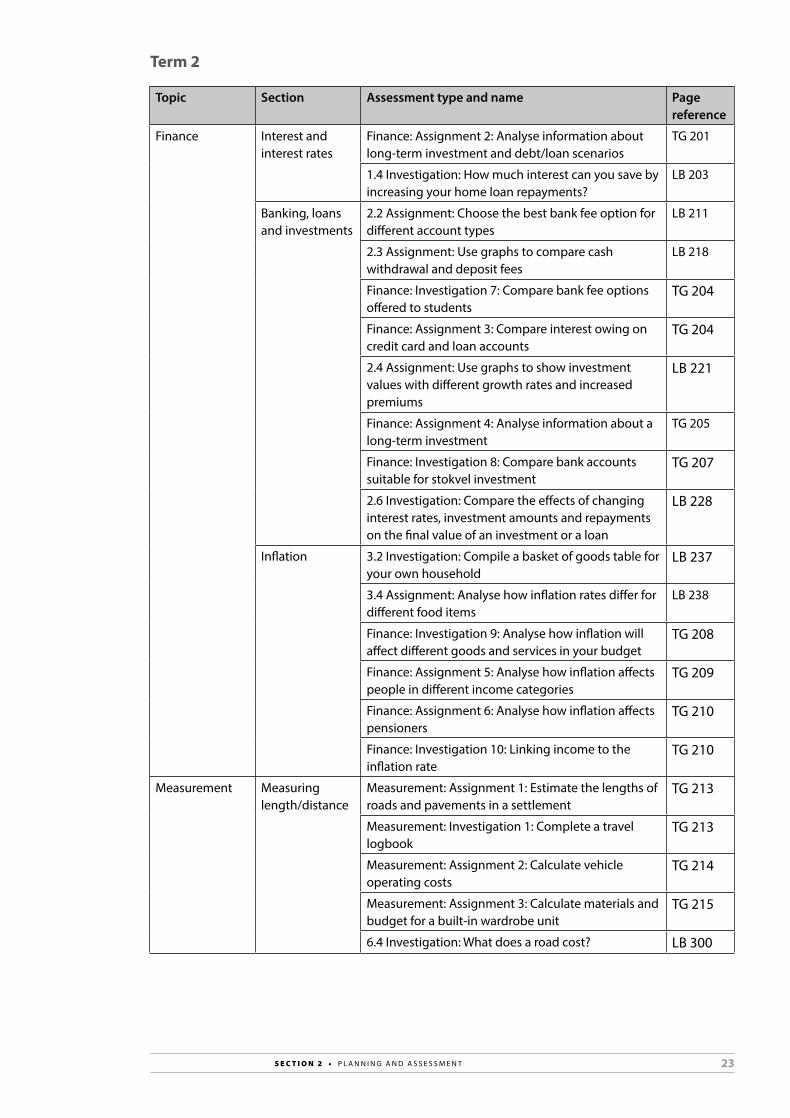
Term 2
Topic Section Assessment type and name Page reference
Finance Interest and interest rates
Finance: Assignment 2: Analyse information about long-term investment and debt/loan scenarios
tG 201
1.4 Investigation: How much interest can you save by increasing your home loan repayments?
LB 203
Banking, loans and investments
2.2 Assignment: choose the best bank fee option for different account types
LB 211
2.3 Assignment: use graphs to compare cash withdrawal and deposit fees
LB 218
Finance: Investigation 7: compare bank fee options offered to students
tG 204
Finance: Assignment 3: compare interest owing on credit card and loan accounts
tG 204
2.4 Assignment: use graphs to show investment values with different growth rates and increased premiums
LB 221
Finance: Assignment 4: Analyse information about a long-term investment
tG 205
Finance: Investigation 8: compare bank accounts suitable for stokvel investment
tG 207
2.6 Investigation: compare the effects of changing interest rates, investment amounts and repayments on the final value of an investment or a loan
LB 228
Inflation 3.2 Investigation: compile a basket of goods table for your own household
LB 237
3.4 Assignment: Analyse how inflation rates differ for different food items
LB 238
Finance: Investigation 9: Analyse how inflation will affect different goods and services in your budget
tG 208
Finance: Assignment 5: Analyse how inflation affects people in different income categories
tG 209
Finance: Assignment 6: Analyse how inflation affects pensioners
tG 210
Finance: Investigation 10: Linking income to the inflation rate
tG 210
Measurement Measuring length/distance
Measurement: Assignment 1: Estimate the lengths of roads and pavements in a settlement
tG 213
Measurement: Investigation 1: complete a travel logbook
tG 213
Measurement: Assignment 2: calculate vehicle operating costs
tG 214
Measurement: Assignment 3: calculate materials and budget for a built-in wardrobe unit
tG 215
6.4 Investigation: What does a road cost? LB 300

24 S e c t i o n 2 • P L A n n I n G A n d A S S E S S M E n t
Measurement Measuring mass (weight)
Measurement: Investigation 2: Growth patterns in children aged 2 to 20
tG 215
7.7 Assignment: compile a table of medicine dosages for paracetamol
LB 319
Measuring volume
8.4 Assignment: calculate the run-off rate of rain for a whole neighbourhood
LB 328
Measurement: Assignment 4: Prepare a set of instructions about E coli and water purification
tG 218
Measuring temperature
9.2 Investigation: use temperature information to plan a journey
LB 336
Measurement: Assignment 5: collect information about temperatures in your home fridge and plan your food storage accordingly
tG 219
calculating perimeter, area and volume
Measurement: Investigation 3: tiling a given area tG 220Measurement: Investigation 4: What is the replacement cost of your home?
tG 221
10.5 Assignment: update a construction budget for a house
LB 362
Measurement: Investigation 5: Quantities and costs of materials for a low-cost house
tG 223
10.6 Investigation: Housing density where you live LB 365
Term 3
Topic Section Assessment type and name Page reference
Finance taxation Finance: Assignment 7: calculate personal income tax for an employee
tG 224
Exchange rates 2.2 Assignment: Prepare a budget estimate for a foreign trip
LB 403
Finance: Assignment 8: Plan a holiday in southern Africa
tG 225
Maps and plans Scale and plans, measurements and costs
3.1 Assignment: Work with floor plans and assembly diagrams
LB 419
3.5 Assignment: draw scaled elevation plans and use them to calculate measurements and costs
LB 426
Probability All sections 4.7 Assignment: determining and interpreting probabilities for Lotto numbers
LB 442
Maps, plans and other representations of the physical world
Models 5.2 Assignment: containers and how much they hold LB 4495.3 Investigation: the best shape and size for boxes LB 4495.5 Investigation: use 3d and 2d scaled models to decide on placement of furniture and fixtures for a fund-raising event
LB 451

25S e c t i o n 2 • P L A n n I n G A n d A S S E S S M E n t
Formal assessment: Examinations In Grade 12, at least one of examination papers should be set, marked and moderated internally unless provincial education departments instruct otherwise.
Time and mark allocationIn Grade 12, one of the tasks in Term 2 or Term 3 may be an internal examination. A nationally set external examination will be written at the end of Term 4. For each examination, learners will write two papers. The papers assess the same content in different ways and the cognitive demands of the papers differ (according to the levels of the assessment taxonomy). The time and mark allocations for the papers are given in the table.
Examinations Paper 1 Paper 2
June examinationsEnd of Term 2
2 hours100 marks
2 hours100 marks
September examinationsEnd of Term 3
3 hours150 marks
3 hours150 marks
November examinationsEnd of Term 4
3 hours150 marks
3 hours150 marks
The main differences between the two papers
Paper 1 Paper 2
• It assesses basic skills in familiar contexts.
• It assesses the ability to apply concepts in familiar and unfamiliar contexts.
• Questions are mainly at levels 1 and 2 (60% of marks at level 1; 35% at level 2).
• Questions are mainly at levels 3 and 4 (35% of marks at level 3; 40% of marks at level 4).
• there are a small number of multi-step procedures (level 3; 5% of marks).
• there are a small number of routine procedures (25% of marks) included to help learners make sense of the contexts in which problems are set.
• contexts are limited to what is specified in the curriculum outline section of cAPS.
• contexts may not be familiar to learners, in other words, they are not limited to those specified in the curriculum outline section of cAPS.
Setting internal examinationsSetting an examination paper is a fairly demanding task for most teachers. For this reason, teachers often choose to work together to set different questions/sections of the paper. We recommend that teachers try as far as possible to work cooperatively to set papers. Where this is not possible at a school, it may be possible to work with other teachers in the district to produce a collection of questions that can be used in examinations at different schools.
When you set an examination (or test) question, you need to keep track of: • the topics being assessed• the content/skills being assessed• the proportion of marks allocated to different taxonomy levels.

26 S e c t i o n 2 • P L A n n I n G A n d A S S E S S M E n t
A table such as the one below can help you organise and keep track of all the different things you need to consider. This is an exemplar for one question of a Paper 1 examination.
Question details Content/skills Taxonomy level Total
Num
ber
Cont
ext
Part
Fina
nce
Mea
sure
men
t
Map
s an
d pl
ans
Dat
a
1 (6
0%)
2 (3
5%)
3 (5
%)
4 (0
%)
Subt
otal
1 take-away business (familiar)
1.11.21.3 1.4
✗
✗✗
✗
3
4
23
42
5364
18
100
Once the table is completed for all questions, you can add up the marks per taxonomy level to check that you have more or less the correct percentage for each level. If not, you can see from the table which levels have too many or too few marks and you can adjust the questions accordingly.
Selecting contexts When you set examinations, you have to decide on a context for the questions.
For Paper 1, you can select documents, tables, graphs and diagrams from the Learner’s Book to use in the examinations. You can then set different questions related to each context. This may be as simple as changing the values used in the Learner’s Book to make a new question.
For Paper 2 questions, you need to include some contexts that are familiar (these can again be drawn from the Learner’s Book) and some that are not familiar. The media is a good source of new contexts. (Remember that truly mathematically literate adults are able to read and make sense of articles, advertisements, graphs and other mathematical information they come across in daily life). We suggest that teachers keep a file of interesting articles, tables of data, graphs and other mathematically oriented materials they find through the year to use when setting examination questions. For example, during events such as the Comrades Marathon and Two Oceans Marathon, there may be different maps and statistics published in the newspapers. These can be used to set questions based on familiar concepts. Other sporting events, such as the Cape Argus Cycle Tour, the PSL Soccer Finals and even the Olympic Games can be used as the context for questions that are not familiar to the learners.
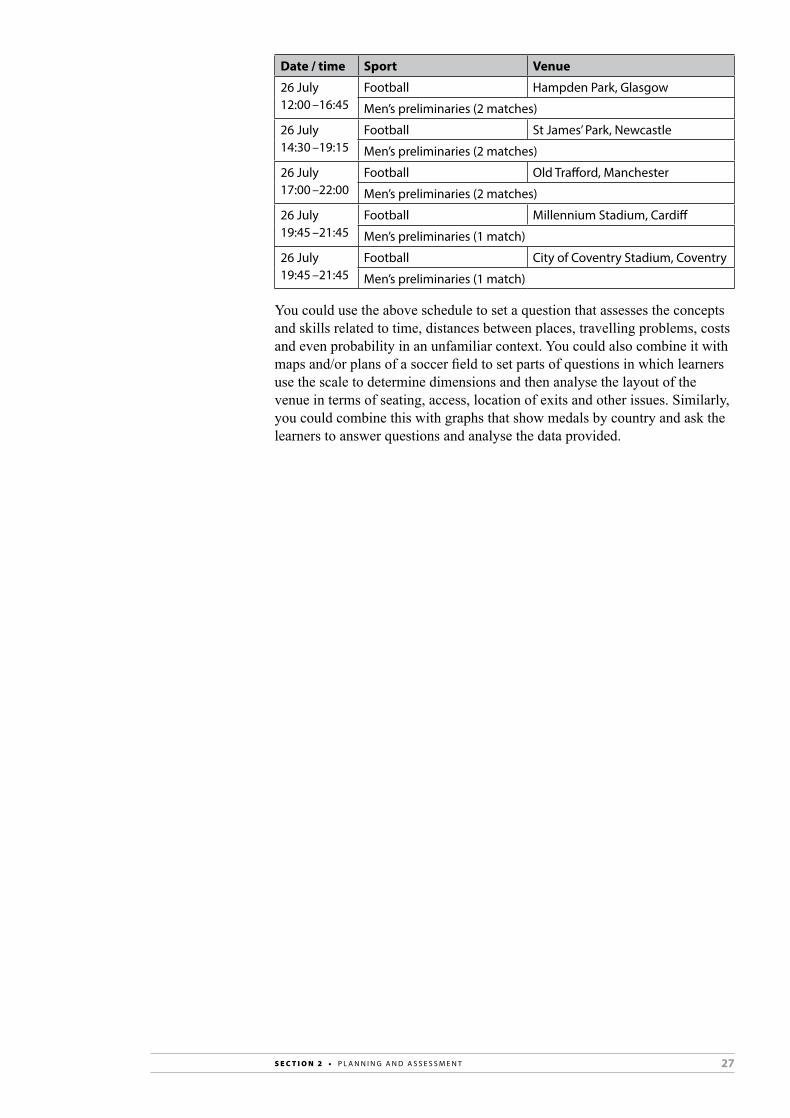
Below is a section of the schedule of events for the 2012 London Olympics.
Date / time Sport Venue
25 July 16:00 –20:45
Football Millennium Stadium, cardiff
Women’s preliminaries (2 matches)
25 July 17:00 –21:45
Football city of coventry Stadium, coventry
Women’s preliminaries (2 matches)
25 July 17:00 –21:45
Football Hampden Park, Glasgow
Women’s preliminaries (2 matches)
27S e c t i o n 2 • P L A n n I n G A n d A S S E S S M E n t
Date / time Sport Venue
26 July 12:00 –16:45
Football Hampden Park, Glasgow
Men’s preliminaries (2 matches)
26 July 14:30 –19:15
Football St James’ Park, newcastle
Men’s preliminaries (2 matches)
26 July 17:00 –22:00
Football old trafford, Manchester
Men’s preliminaries (2 matches)
26 July 19:45 –21:45
Football Millennium Stadium, cardiff
Men’s preliminaries (1 match)
26 July 19:45 –21:45
Football city of coventry Stadium, coventry
Men’s preliminaries (1 match)
You could use the above schedule to set a question that assesses the concepts and skills related to time, distances between places, travelling problems, costs and even probability in an unfamiliar context. You could also combine it with maps and/or plans of a soccer field to set parts of questions in which learners use the scale to determine dimensions and then analyse the layout of the venue in terms of seating, access, location of exits and other issues. Similarly, you could combine this with graphs that show medals by country and ask the learners to answer questions and analyse the data provided.

29S e c t i o n 3 • u n I t - B y - u n I t
UNIT-BY-UNIT
SECTION 3
Dealing with different levels in the Mathematical Literacy assessment taxonomyCAPS provides an assessment taxonomy framework to help teachers make sure their assessment meets different levels of cognitive demand. Some tasks and questions require only the recall of basic facts or simple calculations while others require learners to analyse and make sense of unfamiliar contexts and use varied methods and skills to solve problems.
The four levels of cognitive demand are:Level 1: KnowingLevel 2: Applying routine procedures in familiar contextsLevel 3: Applying multi-step procedures in a variety of contextsLevel 4: Reasoning and reflecting.
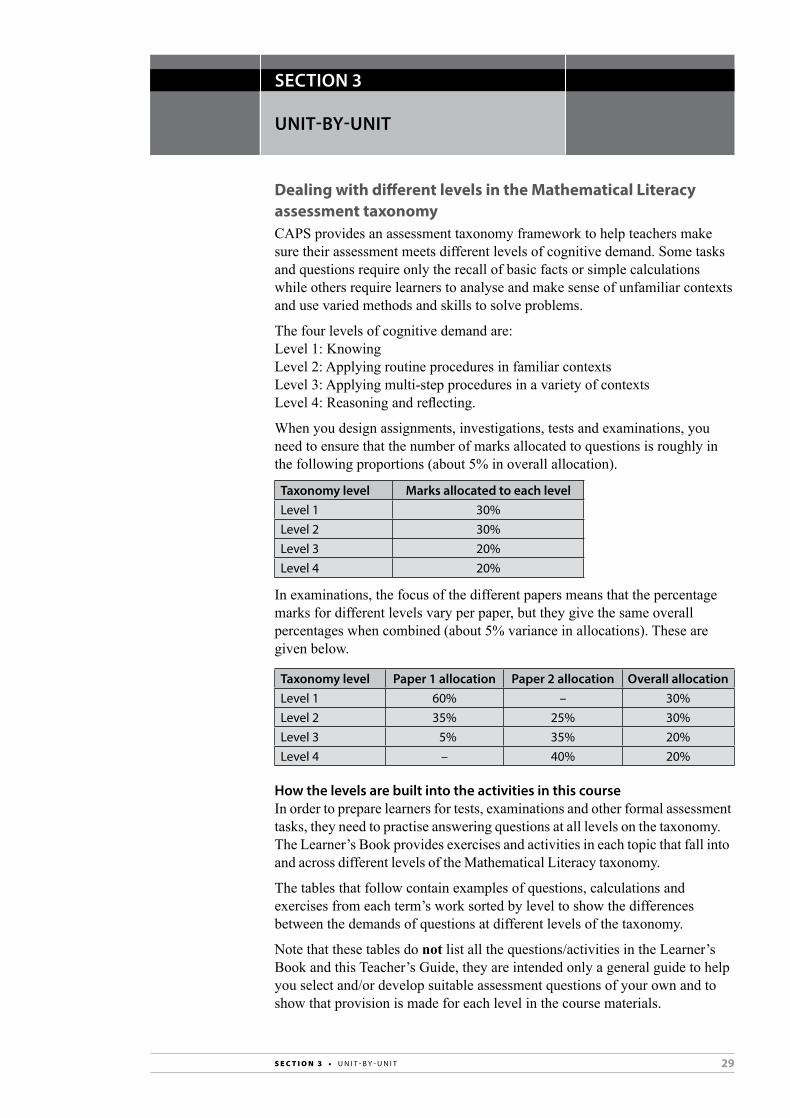
When you design assignments, investigations, tests and examinations, you need to ensure that the number of marks allocated to questions is roughly in the following proportions (about 5% in overall allocation).
Taxonomy level Marks allocated to each levelLevel 1 30%Level 2 30%Level 3 20%Level 4 20%
In examinations, the focus of the different papers means that the percentage marks for different levels vary per paper, but they give the same overall percentages when combined (about 5% variance in allocations). These are given below.
Taxonomy level Paper 1 allocation Paper 2 allocation Overall allocation Level 1 60% – 30%Level 2 35% 25% 30%Level 3 5% 35% 20%Level 4 – 40% 20%
How the levels are built into the activities in this courseIn order to prepare learners for tests, examinations and other formal assessment tasks, they need to practise answering questions at all levels on the taxonomy. The Learner’s Book provides exercises and activities in each topic that fall into and across different levels of the Mathematical Literacy taxonomy.
The tables that follow contain examples of questions, calculations and exercises from each term’s work sorted by level to show the differences between the demands of questions at different levels of the taxonomy.
Note that these tables do not list all the questions/activities in the Learner’s Book and this Teacher’s Guide, they are intended only a general guide to help you select and/or develop suitable assessment questions of your own and to show that provision is made for each level in the course materials.

30 S e c t i o n 3 • u n I t - B y - u n I t
Term
1: M
easu
rem
ent
Uni
t Le
vel 1
: Kno
win
g Le
vel 2
: App
lyin
g ro
utin
e pr
oced
ures
in fa
mili
ar c
onte
xts
Leve
l 3: A
pply
ing
mul
ti-s
tep
proc
edur
es in
a v
arie
ty o
f con
text
sLe
vel 4
: Rea
soni
ng a
nd re
flect
ing
Uni
t 1M
easu
ring
uni
ts
and
conv
ersi
ons
conv
ert b
etw
een
met
ric u
nits
1.
1 qu
estio
ns 1
–22
conv
ert f
rom
impe
rial t
o m
etric
un
its
1.1
ques
tions
1–2
2
Mak
e a
scal
ed d
raw
ing
and
enla
rge
it us
ing
an a
ppro
pria
te c
onve
rsio
n fa
ctor
1.2
ques
tion
2
des
ign
a bo
oksh
elf,
sele
ctin
g ap
prop
riate
sca
le a
nd u
nits
1.3
ques
tions
1–4
cr
eate
a c
onve
rsio
n ta
ble
base
d on
bo
dy-m
easu
rem
ents
M
easu
rem
ent:
Inve
stig
atio
n 1:
qu
estio
ns 1
–5
Uni
t 2Ti
me
read
val
ues
and
use
them
to re
cord
an
d ca
lcul
ate
time
2.1
ques
tions
1–3
Inte
rpre
t tim
e va
lues
on
a tim
etab
le
and
answ
er q
uest
ions
rela
ted
to
times
2.2
ques
tions
1–2
Mea
sure
men
t: In
vest
igat
ion
3:
ques
tions
1–4
Perf
orm
tim
e ca
lcul
atio
ns a
nd re
late
th
em to
oth
er tr
avel
reso
urce
s in
or
der t
o pl
an a
trip
2.
4 qu
estio
ns 1
–2
2.7
ques
tions
1–3
Term
1: F
inan
ce
Uni
t Le
vel 1
: Kno
win
g Le
vel 2
: App
lyin
g ro
utin
e pr
oced
ures
in fa
mili
ar c
onte
xts
Leve
l 3: A
pply
ing
mul
ti-s
tep
proc
edur
es in
a v
arie
ty o
f con
text
sLe
vel 4
: Rea
soni
ng a
nd re
flect
ing
Uni
t 3Fi
nanc
ial
docu
men
ts a
t ho
me
and
at
wor
k
read
info
rmat
ion
from
fina
ncia
l do
cum
ents
3.2
ques
tion
1 3.
4 qu
estio
ns 1
–3
Show
how
the
tota
l due
was
ca
lcul
ated
on
an a
ccou
nt
3.2
ques
tion
2
Find
rele
vant
info
rmat
ion
in th
e ta
x Po
cket
Gui
de a
nd u
se it
to a
nsw
er
ques
tions
rela
ted
to ta
x lia
bilit
ies
3.5
ques
tions
1–1
4
Inte
rpre
t inf
orm
atio
n on
diff
eren
t fin
anci
al d
ocum
ents
and
mak
e se
nse
of te
rms
and
cond
ition
s 3.
4 qu
estio
ns 1
–3
des
ign
a fil
ing
and/
or re
cord
-ke
epin
g sy
stem
for fi
nanc
ial
docu
men
ts
Fina
nce:
Inve
stig
atio
n 1:
qu
estio
ns 1
–2

31S e c t i o n 3 • u n I t - B y - u n I t
Uni
t 4Ta
riff
sre
ad ta
bles
of d
iffer
ent t
ariff
s 4.
1 qu
estio
n 1
4.2
ques
tion
1
calc
ulat
e co
sts
and
tariff
s us
ing
give
n in
form
atio
n4.
1 qu
estio
ns 2
, 44.
2 qu
estio
n 1
com
plet
e a
tabl
e of
tariff
s us
ing
give
n in
form
atio
n 4.
3 qu
estio
n 1
Fina
nce:
Ass
ignm
ent 1
: que
stio
n 1
dra
w g
raph
s to
repr
esen
t and
co
mpa
re d
iffer
ent t
ariff
s 4.
6 qu
estio
n 1–
2
choo
se a
ppro
pria
te s
trat
egie
s (in
clud
ing
usin
g ta
ble
and
draw
ing
grap
hs) t
o co
mpa
re th
e co
sts
of
serv
ices
and
tariff
s in
diff
eren
t co
ntex
ts4.
1 qu
estio
n 3
Fina
nce:
Inve
stig
atio
n 2:
qu
estio
ns 1
–4
Uni
t 5In
com
e-an
d-ex
pend
itur
e st
atem
ents
and
bu
dget
s
clas
sify
item
s on
an
inco
me-
and-
expe
nditu
re s
tate
men
t 5.
1 qu
estio
n 1
5.6
ques
tions
1–2
calc
ulat
e am
ount
s on
sta
tem
ents
5.
2 qu
estio
ns 2
–8
Prep
are
an in
com
e-an
d ex
pend
iture
st
atem
ent
5.2
ques
tion
1
Prep
are
an in
com
e-an
d-ex
pend
iture
st
atem
ent
5.3
ques
tions
1–5
Ana
lyse
an
inco
me-
and-
expe
nditu
re
stat
emen
t for
a s
mal
l bus
ines
s 5.
4 qu
estio
n 3
Prep
are
a bu
dget
for a
sin
gle
even
t Fi
nanc
e: In
vest
igat
ion
4: q
uest
ion
1
Ana
lyse
a b
udge
t and
mak
e re
com
men
datio
ns to
impr
ove
finan
ces
5.5
ques
tions
1–3
5.6
ques
tions
1–3
Uni
t 6Co
st p
rice
, se
lling
pri
ce
and
brea
k ev
en
anal
ysis
Iden
tify
diffe
rent
type
s of
cos
ts
6.1
ques
tions
1–2
Find
the
cost
pric
e of
an
item
by
addi
ng a
ll th
e co
mpo
nent
cos
ts
6.2
ques
tions
1–4
calc
ulat
e br
eak-
even
val
ues
in th
e co
ntex
t of a
giv
en p
robl
em
6.5
ques
tion
1
com
pare
cos
t and
sel
ling
pric
e an
d ca
lcul
ate
the
mar
k up
6.
3 qu
estio
ns 1
–5
read
val
ues
from
gra
phs
to fi
nd
the
brea
k-ev
en p
oint
and
ans
wer
qu
estio
ns a
bout
it6.
5 qu
estio
n 2
Inve
stig
ate
vario
us c
osts
and
dec
ide
on a
n ap
prop
riate
sel
ling
pric
e 6.
4 qu
estio
ns 1
–2
calc
ulat
e se
lling
pric
es b
ased
on
vario
us p
rofit
leve
ls a
nd d
ecid
e w
hich
is re
ason
able
6.
4 qu
estio
ns 3
–5
dra
w g
raph
s to
com
pare
opt
ions
an
d ta
riffs
6.6
ques
tion
2
cond
uct m
arke
t res
earc
h an
d us
e th
e re
sults
to s
ugge
st a
nd d
efen
d th
e se
lling
pric
e of
an
item
Fi
nanc
e: In
vest
igat
ion
6:
ques
tions
1–3

32 S e c t i o n 3 • u n I t - B y - u n I t
Ter
m 1
: Dat
a ha
ndlin
g
Uni
t Le
vel 1
: Kno
win
g Le
vel 2
: App
lyin
g ro
utin
e pr
oced
ures
in fa
mili
ar c
onte
xts
Leve
l 3: A
pply
ing
mul
ti-s
tep
proc
edur
es in
a v
arie
ty o
f con
text
sLe
vel 4
: Rea
soni
ng a
nd re
flect
ing
Uni
t 7D
ata
hand
ling
read
info
rmat
ion
from
a ta
ble
of
resu
lts
1.1
ques
tion
1
read
dat
a fr
om a
giv
en fr
eque
ncy
tabl
e 7.
1 qu
estio
n 2
7.4
ques
tion
1
Loca
te v
alue
s on
box
-and
-whi
sker
pl
ots
7.8
ques
tions
1–2
read
val
ues
dire
ctly
from
gra
phs
7.2
ques
tion
37.
8 qu
estio
ns 1
–3
dec
ide
whe
ther
a s
ampl
e is
re
pres
enta
tive
7.2
ques
tion
1
com
plet
e a
tabl
e to
sum
mar
ise
data
co
llect
ed d
urin
g a
surv
ey
7.4
ques
tion
2
calc
ulat
e th
e m
ean,
med
ian,
mod
e ra
nge
and
inte
rqua
rtile
rang
e 7.
5 qu
estio
ns 1
–27.
7 qu
estio
ns 1
–2
dra
w a
nd la
bel g
raph
s 7.
9 qu
estio
n 3
dec
ide
on a
ppro
pria
te q
uest
ions
to
incl
ude
on a
que
stio
nnai
re a
nd th
en
cond
uct t
he s
urve
y 7.
2 qu
estio
n 2
7.11
que
stio
n 1
use
raw
dat
a to
dra
w u
p a
grou
ped
freq
uenc
y ta
ble
and
answ
er
ques
tions
bas
ed o
n th
e ta
ble
7.4
ques
tion
3
choo
se th
e m
ost a
ppro
pria
te fo
rm
of g
raph
to re
pres
ent d
iffer
ent s
ets
of d
ata,
giv
ing
reas
ons
for c
hoic
es
7.9
ques
tion
1–3
7.11
que
stio
n 1
criti
que
the
ques
tions
and
pos
ted
resu
lts o
f a s
urve
y 7.
3 qu
estio
n1 1
–2
Ana
lyse
mea
sure
s of
spr
ead
and
cent
ral t
ende
ncy
to m
ake
dedu
ctio
ns a
bout
tren
ds in
the
data
7.
6 qu
estio
ns 1
–3
Ana
lyse
gra
phs
and
mak
e de
duct
ions
abo
ut tr
ends
in th
e da
ta
and
pred
ictio
ns fo
r the
futu
re
7.9
ques
tions
1–5
Inte
rpre
t and
crit
ical
ly a
naly
se d
ata
pres
ente
d in
the
form
of d
iffer
ent
grap
hs
7.10
que
stio
ns 1
–47.
11 q
uest
ion
2

33S e c t i o n 3 • u n I t - B y - u n I t
Term
2: F
inan
ce
Uni
t Le
vel 1
: Kno
win
g Le
vel 2
: App
lyin
g ro
utin
e pr
oced
ures
in fa
mili
ar c
onte
xts
Leve
l 3: A
pply
ing
mul
ti-s
tep
proc
edur
es in
a v
arie
ty o
f con
text
sLe
vel 4
: Rea
soni
ng a
nd re
flect
ing
Uni
t 1In
tere
st a
nd
inte
rest
rate
s
read
and
cal
cula
te in
tere
st ra
tes
1.1
ques
tion
1–2
calc
ulat
e si
mpl
e in
tere
st ra
tes
and
mon
thly
repa
ymen
ts
1.1
ques
tion
3Fi
nanc
e: A
ssig
nmen
t 2:
ques
tions
1–2
Perf
orm
com
poun
d in
tere
st
calc
ulat
ions
ove
r mul
tiple
tim
e pe
riods
1.1
ques
tion
6
use
tabl
es to
mod
el d
iffer
ent
inte
rest
opt
ions
and
ans
wer
qu
estio
ns b
ased
on
the
resu
lt Fi
nanc
e: A
ssig
nmen
t 2:
ques
tion
3–4
Inve
stig
ate
and
mod
el th
e eff
ect o
f di
ffere
nt in
tere
st ra
tes
on p
aym
ents
an
d to
tal c
ost o
f loa
ns
1.2
ques
tions
1, 2
1.
3 qu
estio
ns 1
–3
Uni
t 2Ba
nkin
g, lo
ans
and
inve
stm
ents
Iden
tify
fees
and
cos
ts o
n ba
nk
docu
men
ts
2.1
ques
tions
1–2
calc
ulat
e th
e va
lue
of a
n in
vest
men
t Fi
nanc
e: A
ssig
nmen
t 4:
ques
tions
3–6
use
gra
phs
to s
how
and
com
pare
co
ntrib
utio
ns a
nd p
aym
ents
2.5
ques
tions
1–2
com
plet
e a
tabl
e/gr
aph
to c
ompa
re
bank
fee
optio
ns
Fina
nce:
Ass
ignm
ent 7
: qu
estio
n 1–
4
calc
ulat
e an
d co
mpa
re in
tere
st o
n cr
edit
card
and
loan
acc
ount
s Fi
nanc
e: A
ssig
nmen
t 3:
ques
tions
1–3
com
pare
fee
optio
ns a
nd
inve
stig
ate
the
best
one
for a
pa
rtic
ular
per
son
2.1
ques
tion
2–3
2.2
ques
tion
1
choo
se th
e be
st b
anki
ng o
ptio
n fo
r a
busi
ness
and
just
ify c
hoic
es
2.1
ques
tion
4
Mak
e de
cisi
ons
rega
rdin
g in
vest
men
t opt
ions
with
out
scaff
olde
d or
gui
ded
ques
tions
2.
4 qu
estio
ns 1
–4

34 S e c t i o n 3 • u n I t - B y - u n I t
Uni
t 3In
flati
on
calc
ulat
e pr
ice
chan
ges
and
rate
s of
ch
ange
3.
1 qu
estio
ns 1
–2
3.3
Que
sito
ns 1
–3
Show
by
calc
ulat
ion
how
the
pric
e of
an
item
cha
nges
whe
n it
is
affec
ted
by in
flatio
n 3.
1 qu
estio
ns 3
–4
read
and
inte
rpre
t gra
phs o
f infl
atio
n ra
tes t
o an
swer
que
stio
ns a
bout
them
3.5
ques
tions
1–4
Show
by
calc
ulat
ion
how
the
pric
e of
an
item
mig
ht c
hang
e if
affec
ted
by in
flatio
n ov
er m
ultip
le ti
me
perio
ds
3.4
ques
tions
1–6
Fi
nanc
e: In
vest
igat
ion
10:
ques
tion
3
com
pile
a b
aske
t of g
oods
inde
x ta
ble
for a
hou
seho
ld
3.2
Inve
stig
atio
n
Term
2: M
aps,
pla
ns a
nd o
ther
repr
esen
tatio
ns o
f the
wor
ld
Uni
t Le
vel 1
: Kno
win
g Le
vel 2
: App
lyin
g ro
utin
e pr
oced
ures
in fa
mili
ar c
onte
xts
Leve
l 3: A
pply
ing
mul
ti-s
tep
proc
edur
es in
a v
arie
ty o
f con
text
sLe
vel 4
: Rea
soni
ng a
nd re
flect
ing
Uni
t 4Sc
ale
Expl
ain
the
mea
ning
of a
giv
en s
cale
4.
1 qu
estio
n 1
use
a g
iven
sca
le to
det
erm
ine
actu
al m
easu
rem
ents
4.
1 qu
estio
ns 2
–3
4.2
ques
tions
1–2
use
real
mea
sure
men
ts to
de
term
ine
scal
e of
a p
lan/
map
4.4
ques
tions
1–3
use
real
dis
tanc
es to
cal
cula
te
mea
sure
men
ts o
n a
plan
4.3
ques
tions
1–2
use
a g
iven
or d
eter
min
ed s
cale
to
geth
er w
ith m
easu
rem
ents
on
a pl
an to
det
erm
ine
leng
th a
nd o
ther
di
men
sion
s4.
5 qu
estio
ns 1
–3
Mak
e de
cisi
ons
abou
t cos
ts a
nd
mod
es o
f tra
nspo
rt b
ased
on
info
rmat
ion
avai
labl
e 4.
5 qu
estio
n 3
Uni
t 5M
aps
des
crib
e th
e po
sitio
n of
obj
ects
on
a m
ap
5.1
ques
tions
1–3
read
an
inde
x to
find
the
loca
tion
of
stre
ets
5.1
ques
tions
2–4
Inte
rpre
t and
follo
w a
giv
en s
et
of d
irect
ions
and
pro
vide
a s
et o
f di
rect
ions
bet
wee
n tw
o pl
aces
5.
2 qu
estio
ns 1
–3
5.5
ques
tions
1–5
calc
ulat
e tim
e, d
ista
nce
and
spee
d ba
sed
on m
aps
5.2
ques
tion
4
use
diff
eren
t map
s an
d di
rect
ions
to
find
poss
ible
rout
es b
etw
een
plac
es
5.6
ques
tions
1–3
Iden
tify
a ro
ute
betw
een
plac
es o
n a
map
, mea
sure
the
dist
ance
and
us
e th
e sc
ale
to e
stim
ate
dist
ance
be
twee
n pl
aces
5.4
ques
tions
1–8
Mak
e de
cisio
ns a
bout
stop
ping
poi
nts
and
mod
es o
f tra
nspo
rt o
n a
jour
ney
base
d on
info
rmat
ion
avai
labl
e 5.
5 qu
estio
ns 1
–4
5.7
ques
tions
1–8
com
pare
mar
atho
n ro
utes
usin
g a
map
and
an
elev
atio
n m
ap a
nd
answ
er q
uest
ions
rela
ted
to th
e ro
utes
5.8
ques
tions
1–7
revi
sion
que
stio
n 4
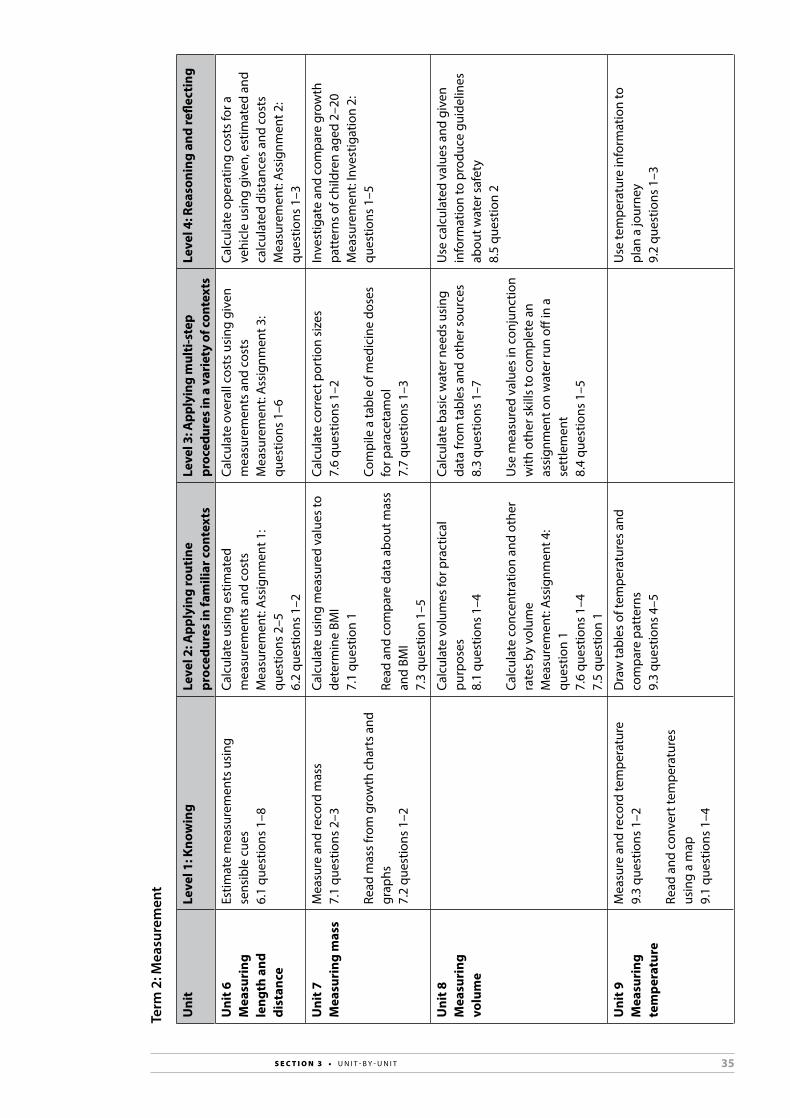
35S e c t i o n 3 • u n I t - B y - u n I t
Term
2: M
easu
rem
ent
Uni
t Le
vel 1
: Kno
win
g Le
vel 2
: App
lyin
g ro
utin
e pr
oced
ures
in fa
mili
ar c
onte
xts
Leve
l 3: A
pply
ing
mul
ti-s
tep
proc
edur
es in
a v
arie
ty o
f con
text
sLe
vel 4
: Rea
soni
ng a
nd re
flect
ing
Uni
t 6M
easu
ring
le
ngth
and
di
stan
ce
Estim
ate
mea
sure
men
ts u
sing
se
nsib
le c
ues
6.1
ques
tions
1–8
calc
ulat
e us
ing
estim
ated
m
easu
rem
ents
and
cos
tsM
easu
rem
ent:
Ass
ignm
ent 1
: qu
estio
ns 2
–5
6.2
ques
tions
1–2
calc
ulat
e ov
eral
l cos
ts u
sing
giv
en
mea
sure
men
ts a
nd c
osts
M
easu
rem
ent:
Ass
ignm
ent 3
: qu
estio
ns 1
–6
calc
ulat
e op
erat
ing
cost
s fo
r a
vehi
cle
usin
g gi
ven,
est
imat
ed a
nd
calc
ulat
ed d
ista
nces
and
cos
tsM
easu
rem
ent:
Ass
ignm
ent 2
: qu
estio
ns 1
–3
Uni
t 7M
easu
ring
mas
sM
easu
re a
nd re
cord
mas
s 7.
1 qu
estio
ns 2
–3
read
mas
s fr
om g
row
th c
hart
s an
d gr
aphs
7.
2 qu
estio
ns 1
–2
calc
ulat
e us
ing
mea
sure
d va
lues
to
dete
rmin
e BM
I7.
1 qu
estio
n 1
read
and
com
pare
dat
a ab
out m
ass
and
BMI
7.3
ques
tion
1–5
calc
ulat
e co
rrec
t por
tion
size
s7.
6 qu
estio
ns 1
–2
com
pile
a ta
ble
of m
edic
ine
dose
s fo
r par
acet
amol
7.
7 qu
estio
ns 1
–3
I nve
stig
ate
and
com
pare
gro
wth
pa
tter
ns o
f chi
ldre
n ag
ed 2
–20
Mea
sure
men
t: In
vest
igat
ion
2:
ques
tions
1–5
Uni
t 8M
easu
ring
vo
lum
e
calc
ulat
e vo
lum
es fo
r pra
ctic
al
purp
oses
8.
1 qu
estio
ns 1
–4
calc
ulat
e co
ncen
trat
ion
and
othe
r ra
tes
by v
olum
e M
easu
rem
ent:
Ass
ignm
ent 4
: qu
estio
n 1
7.6
ques
tions
1–4
7.
5 qu
estio
n 1
calc
ulat
e ba
sic
wat
er n
eeds
usi
ng
data
from
tabl
es a
nd o
ther
sou
rces
8.
3 qu
estio
ns 1
–7
use
mea
sure
d va
lues
in c
onju
nctio
n w
ith o
ther
ski
lls to
com
plet
e an
as
sign
men
t on
wat
er ru
n off
in a
se
ttle
men
t 8.
4 qu
estio
ns 1
–5
use
cal
cula
ted
valu
es a
nd g
iven
in
form
atio
n to
pro
duce
gui
delin
es
abou
t wat
er s
afet
y 8.
5 qu
estio
n 2
Uni
t 9M
easu
ring
te
mpe
ratu
re
Mea
sure
and
reco
rd te
mpe
ratu
re9.
3 qu
estio
ns 1
–2
read
and
con
vert
tem
pera
ture
s us
ing
a m
ap
9.1
ques
tions
1–4
dra
w ta
bles
of t
empe
ratu
res
and
com
pare
pat
tern
s9.
3 qu
estio
ns 4
–5
use
tem
pera
ture
info
rmat
ion
to
plan
a jo
urne
y9.
2 qu
estio
ns 1
–3

36 S e c t i o n 3 • u n I t - B y - u n I t
Uni
t 10
Calc
ulat
ing
peri
met
er, a
rea
and
volu
me
Mea
sure
acc
urat
ely
10.1
que
stio
ns 1
-4
Iden
tify
from
a g
iven
tabl
e w
hich
fo
rmul
a ar
e ne
eded
for d
iffer
ent
calc
ulat
ions
10
.2 q
uest
ions
1–2
calc
ulat
e pe
rimet
er a
nd a
rea
by
subs
titut
ing
valu
es in
to fo
rmul
ae10
.2 q
uest
ion
3
use
form
ulae
to fi
nd s
urfa
ce a
rea
and
volu
me
10.2
que
stio
n 4
Brea
k co
mpo
site
sha
pes
into
mor
e fa
mili
ar p
iece
s an
d fin
d th
e ar
ea o
f ea
ch in
ord
er to
find
the
area
of t
he
who
le
10.3
que
stio
ns 1
–6
Wor
k ou
t the
dim
ensio
ns y
ou n
eed
to
find
the
surf
ace
area
and
vol
ume
of a
n irr
egul
ar so
lid a
nd th
en u
se th
ese
to
find
the
surf
ace
area
and
vol
ume
10.4
que
stio
ns 1
–2
use
per
imet
er, a
rea
and
volu
me
calc
ulat
ions
to c
ompl
ete
a la
rger
pr
ojec
t with
out b
eing
told
wha
t ca
lcul
atio
ns a
re n
eede
d 10
.4 q
uest
ions
3–6
M
easu
rem
ent:
Inve
stig
atio
n 4
Term
3: F
inan
ce
Uni
t Le
vel 1
: Kno
win
g Le
vel 2
: App
lyin
g ro
utin
e pr
oced
ures
in fa
mili
ar c
onte
xts
Leve
l 3: A
pply
ing
mul
ti-s
tep
proc
edur
es in
a v
arie
ty o
f con
text
sLe
vel 4
: Rea
soni
ng a
nd re
flect
ing
Uni
t 1Ta
xati
onre
ad V
At in
form
atio
n fr
om a
tabl
e 1.
1 qu
estio
n 2
read
info
rmat
ion
from
a p
ay s
lip
1.1
ques
tion
3
calc
ulat
e VA
t an
d in
clus
ive
pric
es
1.1
ques
tion
1
use
tax
tabl
es a
nd fo
rmul
ae
1.2
ques
tions
1–3
calc
ulat
e u
IF fo
r diff
eren
t tim
e pe
riods
1.
1 qu
estio
ns 4
–6
calc
ulat
e ta
xabl
e in
com
e an
d ta
x pa
yabl
e 1.
3 qu
estio
ns 1
–4
Ana
lyse
tax
docu
men
ts a
nd a
nsw
er
ques
tions
rela
ted
to in
com
e ta
x1.
4 qu
estio
ns 1
–4
com
plet
e a
tax
retu
rn fo
rm a
nd
calc
ulat
e in
com
e ta
x fo
r an
empl
oyee
Fina
nce:
Ass
ignm
ent 7
: qu
estio
ns 1
–3
Uni
t 2Ex
chan
ge ra
tes
use
giv
en e
xcha
nge
rate
s to
de
term
ine
the
valu
e of
one
cur
renc
y fo
r a g
iven
val
ue o
f ano
ther
1.
1 qu
estio
ns 1
–21.
2 qu
estio
ns 1
–4
Perf
orm
cur
renc
y co
nver
sion
ca
lcul
atio
ns re
late
d to
the
buyi
ng
pow
er o
f the
cur
renc
y 2.
3 qu
estio
ns 1
–3
Expl
ain
how
a s
tron
g or
wea
k cu
rren
cy a
ffect
s pr
ices
in d
iffer
ent
coun
trie
s 2.
4 qu
estio
ns 1
–7
Plan
and
bud
get f
or a
trip
usi
ng
curr
ency
exc
hang
e ra
tes
and
othe
r tr
avel
-rel
ated
sou
rces
Fina
nce:
Ass
ignm
ent 8

37S e c t i o n 3 • u n I t - B y - u n I t
Term
3: M
aps,
pla
ns a
nd o
ther
repr
esen
tatio
ns o
f the
wor
ld
Uni
t Le
vel 1
: Kno
win
g Le
vel 2
: App
lyin
g ro
utin
e pr
oced
ures
in fa
mili
ar c
onte
xts
Leve
l 3: A
pply
ing
mul
ti-s
tep
proc
edur
es in
a v
arie
ty o
f con
text
sLe
vel 4
: Rea
soni
ng a
nd re
flect
ing
Uni
t 3Sc
ale
and
plan
sre
ad v
alue
s an
d di
men
sion
s fr
om a
di
agra
m a
nd/o
r des
ign
draw
ing
3.1
ques
tion
1
read
inst
ruct
ions
on
an a
ssem
bly
diag
ram
3.1
ques
tion
3
use
giv
en in
form
atio
n to
iden
tify
the
num
bers
of d
iffer
ent f
eatu
res
on
a pl
an
3.2
ques
tions
1–4
3.3
ques
tions
1–5
use
pla
ns in
con
junc
tion
with
oth
er
info
rmat
ion
to d
eter
min
e m
ater
ials
ne
eded
and
/or c
osts
3.
5 qu
estio
ns 2
–3
des
crib
e ite
ms
repr
esen
ted
on a
pl
an
3.1
ques
tion
2
dec
ide
on a
n ap
prop
riate
sca
le in
w
hich
to d
raw
a p
lan
and
then
dra
w
it 3.5
ques
tion
1
Term
3: P
roba
bilit
y
Uni
t Le
vel 1
: Kno
win
g Le
vel 2
: App
lyin
g ro
utin
e pr
oced
ures
in fa
mili
ar c
onte
xts
Leve
l 3: A
pply
ing
mul
ti-s
tep
proc
edur
es in
a v
arie
ty o
f con
text
sLe
vel 4
: Rea
soni
ng a
nd re
flect
ing
Uni
t 4Pr
obab
ility
u
se te
rms
asso
ciat
ed w
ith
prob
abili
ty c
orre
ctly
4.
1 qu
estio
n 1
Iden
tify
all p
ossi
ble
outc
omes
for a
n ev
ent u
sing
a tr
ee d
iagr
am
4.6
ques
tion
1
Expr
ess
prob
abili
ty in
per
cent
ages
an
d nu
mbe
rs
4.2
ques
tions
1–6
4.5
ques
tions
2–3
calc
ulat
e th
e od
ds o
f an
even
t4.
3 qu
estio
ns 1
–2
Iden
tify
valu
es fr
om a
tabl
e an
d us
e th
em to
exp
ress
the
prob
abili
ty o
f ce
rtai
n ev
ents
4.
6 qu
estio
n 2
4.7
ques
tions
1–2
use
a ta
ble
of p
roba
bilit
ies
to a
sses
s th
e ch
ance
of d
iffer
ent o
utco
mes
an
d co
mm
ent o
n th
e re
sults
5.
7 qu
estio
ns 1
and
4–6
criti
cally
ass
ess
the
use
of
prob
abili
ty v
alue
s in
med
ia s
ourc
es
and
adve
rtis
emen
ts
4.4
ques
tion
2 4.
6 qu
estio
ns 3
–54.
7 qu
estio
ns 1
–2

38 S e c t i o n 3 • u n I t - B y - u n I t
Term
3: M
aps,
pla
ns a
nd o
ther
repr
esen
tatio
ns o
f the
wor
ld
Uni
t Le
vel 1
: Kno
win
g Le
vel 2
: App
lyin
g ro
utin
e pr
oced
ures
in fa
mili
ar c
onte
xts
Leve
l 3: A
pply
ing
mul
ti-s
tep
proc
edur
es in
a v
arie
ty o
f con
text
sLe
vel 4
: Rea
soni
ng a
nd re
flect
ing
Uni
t 5U
sing
mod
els
to in
vest
igat
e sh
ape
and
spac
e
dra
w th
e ne
t of a
cub
oid
5.1
ques
tion
1Bu
ild a
mod
el o
f a c
onta
iner
5.1
ques
tion
25.
2 qu
estio
n 1
Build
a m
odel
of a
sim
ple
build
ing
give
n a
net a
nd d
imen
sion
s5.
4 qu
estio
ns 1
–4
Build
a m
odel
and
use
to s
olve
pr
oble
ms
5.1
ques
tions
3–6
5.
2 qu
estio
ns 2
–4
5.3
ques
tions
1–3
use
a m
odel
to a
naly
se th
e sp
ace
avai
labl
e an
d m
ake
a de
cisi
on a
bout
th
e be
st p
lace
men
t of i
tem
s to
m
axim
ise
avai
labl
e sp
ace
5.5
ques
tions
1–2

39T E R M 1 • U N I T 1
TERM 1
WORKED ANSWERS
You may want to reorganise the pages in this file so that the tables with taxonomy levels for assessment are next to the worked solutions for each term. Remember though that the tables contain examples of activities that fall into each level of the taxonomy and they do not contain a definitive or complete list.
Unit 1Measuring units and conversionsLearner’s Book pages 2–6
Teaching tips• This unit revises work on measuring units and conversions done in
Grades 10 and 11, and provides activities in which learners apply conversion skills to various practical activities in real-world contexts. Adapt and extend these activities to suit the interests of learners and the needs of their local environment, where relevant. The conversion tables that learners need to use for the activities are given in the Learner’s Book.
• Learners should also be given further practice in reading measurements off the scales used on measuring instruments. Try to provide a range of instruments in the classroom that would be used for different practical purposes – for example, a builder’s tape measure and a medical syringe.
• A section on digital information (computer) measuring units is included in the unit because, in practical situations, it is often necessary to judge whether a computer hard drive, memory stick, CD and so on have enough space to store a digital file. It is also necessary to understand units such as megabytes (MB) and gigabytes (GB) when taking out a cellphone contract that includes an internet function.
• The section on measuring food energy will give learners insight into how measuring units (kJ and calories) are used in the popular media and in medical reports to describe healthy and unhealthy diet options.
• Some activities in this and later measurement units can be turned into real-world projects for the benefit of the learners and the local community.
Solutions1.1 Test your conversion skills Learner’s Book page 2
1. Conversion of 9 553 m a. 955,3 cm b. 9 553 mm c. 31,34 ft d. 376,1 in.2. Conversion of 450 yards a. 0,41 km b. 409,5 m c. 0,26 miles d. 1 350 ft3. Conversion of 0,06 m a. 6 cm b. 60 mm c. 2.36 in. d. 0,2 ft

40 S E C T I O N 3 • W O R K E D A N S W E R S
4. Conversion of 726,12 mm a. 72,612 cm b. 0,72612 m c. 28,58734 in. d. 0,79147 yd5. Conversion of 79,4 km a. 79 400 m b. 86 832,9 yd c. 49,34 miles6. Conversion of 12 000 miles a. 21 120 000 yd b. 19 312,13 km c. 19 312 128 m d. 2,04269 × 10⁻⁹
alternatively: 0,064 light seconds or 10 427 nautical miles
7. Conversion of 833 g a. 0,833 kg b. 833 000 mg c. 29,383 oz d. 1,836 lb8. Conversion of 555,045 kg of water a. 555 045 g b. 0,555045 tonnes c. 1 223,65 lb d. 555,045 ℓ9. Conversion of 0,035 g of water a. 35 mg b. 0,00123 oz c. 0,035 ml10. Conversion of 467 210 mg of water a. 467,21 g b. 0,46721 kg c. 0,46721 ℓ11. Conversion of 17,54 t (metric ton (tonnes)) 17,54 (short ton) a. 17 540 kg 15 912,29 kg b. 38 669,08 lb 35 080,59 lb c. 17,26298 ton (Imp)* 15.6607 ton (Imperial)* * An Imperial ton is also called a long ton.12. Conversion of 41 067,85 kg a. 41 067 850 g b. 1 448 625,78 lb c. 40,41925 tons (Imp) = 41,068 t (metric)13. Conversion of 0,05 ℓ a. 50 ml b. 1,6907 US fl.oz. = 1,7598 UK fl.oz. c. 0,10567 US pints or 0,08799 UK pints14. Conversion of 664 500 ml a. 664,5 ℓ b. 0,6645 kl c. 175,542 (US) gal. = 146,17 gal. (UK)15. Conversion of 950,12 ℓ a. 0,95012 kl b. 950 120 ml c. 2 007,9612 US pints or 1 671,97746 UK pints16. Conversion of 0,6905 kl a. 690,5 ℓ b. 690 500 ml c. 23 348,5827 fl.oz. (US) or 24 302,2026 UK fl.oz.17. Conversion of 3 030 cm2
a. 0,3030 m2 b. 303 000 mm2
c. 469,651 in.2
18. Conversion of 0,5 m2
a. 5 000 cm2 b. 500 000 mm2
c. 775,002 in.2
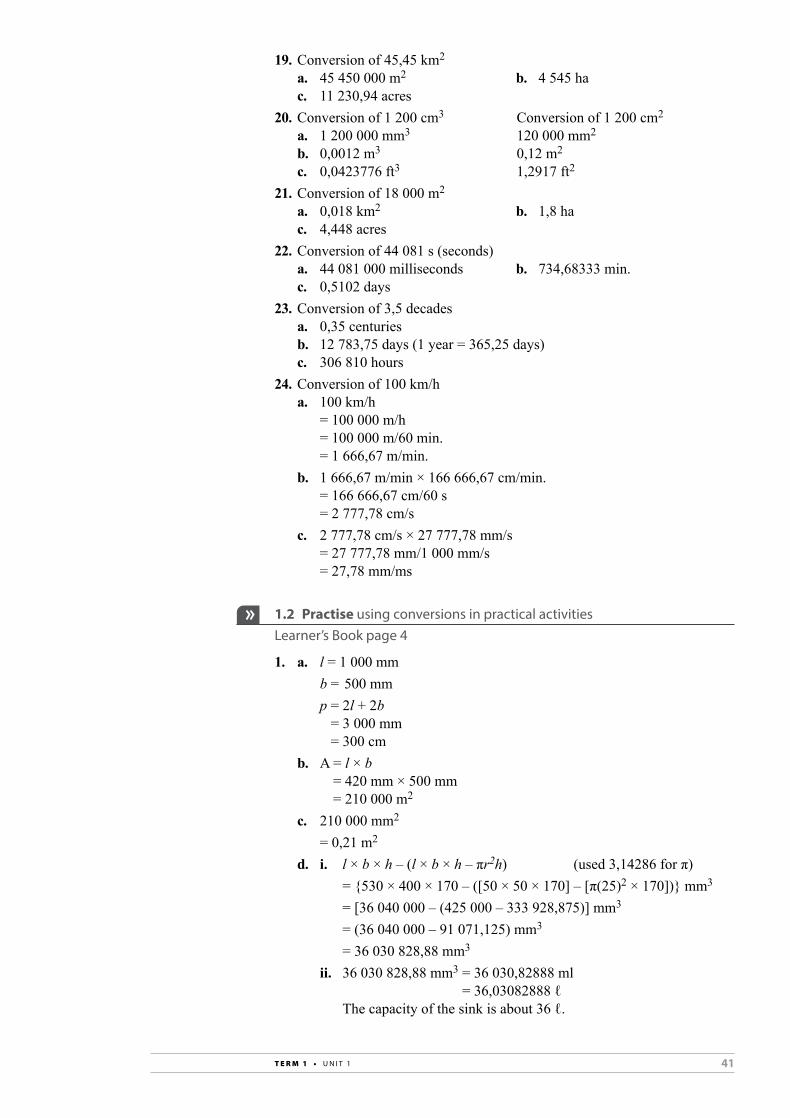
41T E R M 1 • U N I T 1
19. Conversion of 45,45 km2
a. 45 450 000 m2 b. 4 545 ha c. 11 230,94 acres20. Conversion of 1 200 cm3 Conversion of 1 200 cm2
a. 1 200 000 mm3 120 000 mm2
b. 0,0012 m3 0,12 m2
c. 0,0423776 ft3 1,2917 ft2
21. Conversion of 18 000 m2
a. 0,018 km2 b. 1,8 ha c. 4,448 acres22. Conversion of 44 081 s (seconds) a. 44 081 000 milliseconds b. 734,68333 min. c. 0,5102 days23. Conversion of 3,5 decades a. 0,35 centuries b. 12 783,75 days (1 year = 365,25 days) c. 306 810 hours24. Conversion of 100 km/h a. 100 km/h = 100 000 m/h = 100 000 m/60 min. = 1 666,67 m/min. b. 1 666,67 m/min × 166 666,67 cm/min. = 166 666,67 cm/60 s = 2 777,78 cm/s c. 2 777,78 cm/s × 27 777,78 mm/s = 27 777,78 mm/1 000 mm/s = 27,78 mm/ms
1.2 Practise using conversions in practical activities Learner’s Book page 4
1. a. l = 1 000 mm b = 500 mm p = 2l + 2b
= 3 000 mm = 300 cm
b. A = l × b = 420 mm × 500 mm = 210 000 m2
c. 210 000 mm2
= 0,21 m2
d. i. l × b × h – (l × b × h – πr2h) (used 3,14286 for π) = {530 × 400 × 170 – ([50 × 50 × 170] – [π(25)2 × 170])} mm3
= [36 040 000 – (425 000 – 333 928,875)] mm3
= (36 040 000 – 91 071,125) mm3
= 36 030 828,88 mm3
ii. 36 030 828,88 mm3 = 36 030,82888 ml = 36,03082888 ℓ
The capacity of the sink is about 36 ℓ.

42 S E C T I O N 3 • W O R K E D A N S W E R S
2. a. Plan with imperial measurements b. Enlargements c. Total plot area = 0,5 ha
= 5 000 m2
Number of households = 55 Size of RDP house = 20 m2
Number of households × size of house = area required 1 100 m2 < 5 000 m2
There is sufficient space for each household to have a house. d. 5 000 m2 ÷ 55 households = 90,91 m2
Each household can have a plot of 90,91 m2 comprising the house (20 m2) and a yard of 70,91 m2 (assuming no area is required for roads and/or services).
1.3 Assignment: convert and calculate measurements Learner’s Book page 6
1. Instructions in metric measurementsWe made the case out of materials available at most building supply dealers and lumberyards, including 25 mm × 51 mm, 25 mm × 102 mm and 25 mm × 254 mm common pine and 6,4 mm thick plywood. Assembly is quick and easy with glue and nails, and when you’re done with construction you have the option of a painted or clear finish.
The specifications that follow will produce a bookcase with overall dimensions of 273 mm deep × 864 mm wide × 1 219 mm tall. While the depth of the case is directly tied to the 25 mm × 254 mm standard plank, you can vary the height, width and shelf spacing to suit your needs. Keep in mind, though, that extending the width of the cabinet may require the addition of central shelf supports.
2. Sizes in metric unitsWe made the case out of materials available at most building supply dealers and lumberyards, including 32 mm × 44 mm, 32 mm × 94 mm and 32 mm × 300 mm planed all round pine planks and 6 mm-thick plywood (in 2 440 mm × 1 220 boards). Assembly is quick and easy with glue and nails, and when you're done with construction you have the option of a painted or clear finish.
The specifications that follow will produce a bookcase with overall dimensions of 306 mm deep × 964 mm wide × 1 200 mm tall. While the depth of the case is directly tied to the 32 mm × 300 mm standard plank, you can vary the height, width and shelf spacing to suit your needs. Keep in mind, though, that extending the width of the cabinet may require the addition of central shelf supports.Dimensions of bookcase according to newDepth: 300 mm width of plank plus 6 mm plywood backing = 306 mmLength: 900 mm of plank + 2 × 43 mm width of plank (for each side)
= 964 mmHeight: 1 200 mm length of plank
3. Wood requiredNote: The 32 mm × 44 mm and 32 mm × 94 mm planks were not used.SidesTwo sides are required per bookcase.Length required per side is 1 200 mm (adjusted from US plan) for the height of the bookcase.

43T E R M 1 • U N I T 1
Plank required: 32 mm depth × 300 mm width × 2 400 mm lengthOne plank gives two side lengths with no offcuts.Therefore, one plank is required per bookcase.Therefore, 14 planks are required to build 14 bookcases.ShelvingNo number of shelves is specified.To make three shelves for each bookcase,four lengths of shelving are required (three shelves and the top plank) for each bookcase.Length of bookcase required: 964 mm (adjusted from US plan)Length of plank required: 900 mmPlank required: 32 mm depth × 300 mm width × 1 800 mm lengthOne plank gives two shelves with no offcuts.Therefore, two planks are required per bookcase.Therefore, 28 planks are required to build 14 bookcases.Plywood for backing6 mm thick plywood in 2 400 mm × 1 220 sheets can be used.Dimensions per bookcase: 964 mm wide × 1 200 mm lengthMatch the height of the bookcase (1 200 mm) to the width of the plywood sheet (1 220 mm).Number of bookcases per sheet: 2 440 mm
_______ 964 mm = 2,531 bookcases per sheet
14 bookcases ___________ 2,531 bookcases per sheet gives 5,53 bookcases
Therefore six sheets of plywood are required.4. Leftover wood
PlanksNo 32 mm depth × 300 mm width planks are left over from the sides or the shelves.PlywoodSix sheets of 2 400 mm × 1 220 mm plywood (with a thickness of 6 mm) are required.Total: 17 860 800 mm2 plywoodPlywood used: 1 200 mm × 964 mm × 14 bookcases
= 16 195 200 mm2 plywoodUnused plywood: 17 860 800 mm2 – 1 665 600 mm2 of plywood
= 1,6656 m2 of plywood
1 219 mm
25 mm 25 mm864 mm
25 mm
27,99
mm
25 mm
27,99
mm
25 mm
27,99
mm
27,99
mm
25 mm
25 mm

44 S E C T I O N 3 • W O R K E D A N S W E R S
Unit 2Measuring timeLearner’s Book pages 7–33
Teaching tips• In this unit, learners focus first on recording elapsed time, and then on
interpreting timetables that are used in a wide range of practical contexts. These skills will be applied as well in units in the finance topic that involves planning travel activities.
• The section on speed and average speed revises calculating average speed (which was covered in Grade 10 and Grade 11) before applying this method to sporting and transport situations.
• A table is provided in the Learner Book with guidelines for using timetables to budget for a trip. Learners can use this table to help them with the activities in later units that involve planning journeys. The travel investigation in this unit applies to South African destinations, and will help learners to prepare for later investigations that involve travel to foreign destinations.
• The last section of the unit focuses on time zones, and the activities in this section give learners the opportunity to think about how to plan travel and communication between places in different time zones.
Solutions2.1 Test your ability to read time formats and calculate elapsed time Learner’s Book page 9
1 a. Clock A: 05:12 b. Clock C: 13:59 Clock B: 21:47 Clock A: 05:12 21 h – 5 h = 16 h (5 + 24) – 13 47 min. – 12 min. = 35 min. = 29 – 13 Elapsed time: 16:35 = 16 h (12 + 60) – 59 = 13 min. Elapsed time: (16 – 1):13 = 15:13 c. Clock F: 23:01 d. Clock I: 02:53 h Clock D: 01:01 Clock J: 17:16 min. (1 + 24) – 23 = 2 h 17 – 2 = 15 1 – 1 = 0 min. (60 + 16) – 53 = 23 Elapsed time: 2:00 Elapsed time: (15 – 1):23 = 14:23 e. Clock E: 15:23 Clock H: 06:12 (06 + 24) – 15 = 15 h (12 + 60) – 23 = 49 min. Elapsed time: (15 – 1):49 = 14:492. a. Clock A: 05:12 Clock J: 17:16 17 – 5 = 12 h 16 – 12 = 4 min. Elapsed time: 12:04 Clock C: 13:59 Clock E: 15:23 15 – 13 = 2 h (23 + 60) – 59 = 24 min. Elapsed time: (2 – 1):24 = 1:24 Total elapsed time: 12:04 + 1:24 = 13:28

45T E R M 1 • U N I T 2
b. Clock G: 18:44 Clock H: 06:12 (06 + 24) – 18 = 12 h (12 + 60) – 44 = 28 min. Elapsed time: (12 – 1):28 = 11:28 Clock B: 21:47 Clock G: 18:44 (18 + 24) – 21 = 21 h (44 + 60) – 47 = 57 min. Elapsed time: (21 – 1):57 = 20:57 Total elapsed time: 11:28 + 20:57 = 32:25 c. Clock I: 02:53 Clock C: 13:59 13 – 2 = 11 h 59 – 53 = 6 min. Elapsed time: 10:06 Clock D: 01:01 Clock A: 05:12 5 – 1 = 4 h 12 – 1 = 11 min. Elapsed time: 4:11 Total elapsed time: 10:06 + 4:11 = 15:17 d. Clock F: 23:01 Clock I: 02:53 (02 + 24) – 23 = 3 h 53 – 01 = 52 min. Elapsed time: 3:52 Clock E: 15:23 Clock B: 21:47 21 – 15 = 6 h 47 – 23 = 24 min. Elapsed time: 6:24 Total elapsed time: 3:52 + 6:24 = 9 h + 76 min.
= 10 h + 16 min. = 10:16
e. Clock A: 05:12 Clock B: 21:47 h 21 – 5 = 16 min. 47 – 12 = 35 Elapsed time: 16:35 Clock C: 13:59 Clock D: 01:01 (24 + 1) – 13 = 12 h (1 + 60) – 59 = 2 min. Elapsed time: (12 – 1):11 = 11:11 Clock E: 15:23 Clock F: 23:01 23 – 15 = 8 h (60 + 1) – 23 = 38 min. Elapsed time: (8 – 1):38 = 7:38 Clock G: 18:44 Clock H: 06:12 (06 + 24) – 18 = 12 h (12 + 60) – 44 = 28 min. Elapsed time: (12 – 1):28 = 11:28

46 S E C T I O N 3 • W O R K E D A N S W E R S
Elapsed time Clock A and B 116:35 Clock C and D 11:02 Clock E and F 7:38 Clock G and H 11:28 46:433. Clock Start time Finish time Duration Ranking
A 12:29:00 14:12:08 1:43:08 7
B 15:02:00 16:19:21 1:17:21 4
c 15:02:00 16:07:30 1:05:30 1
d 12:29:00 14:17:16 1:48:16 8
E 15:02:00 16:07:30 1:05:30 1
F 12:29:00 14:11:53 1:42:53 6
G 15:02:00 16:08:02 1:06:02 3
H 12:29:00 14:09:44 1:40:44 5
2.2 Practise finding information on transport timetables Learner’s Book page 11
1. a. The schedule was published on 1 February 2011 for the U2 concert that was held on 13 February 2011.
b. The schedule is only valid for 13 February 2011. c. Six train journeys are set out in the schedule. d. The train arrives at and departs from each station at the times
indicated. A passenger would use the time to know when to be at a station to be in time for its departure, to know when the train will arrive at and depart from Nasrec where the concert will take place, and when the train is scheduled to arrive at the station the passengers are going to. When trains stop at a station, they only stop for a minute before departing.
e. The inward journey’s duration is the same as the outward journey’s duration.
Springs – Nasrec 1 h 45 min. Nasrec – Springs 1 h 45 min. Randfontein – Nasrec 1 h 13 min. Nasrec – Randfontein 1 h 13 min. f. The scheduled arrival time of the inbound trains to Nasrec arrive at
16:15 (Springs train) and 16:28 (Randfontein). These trains arrive before the start of the concert. The trains are scheduled to depart after midnight when the concert has finished.
2. a. There are flights from Accra to Johannesburg on the second and fifth days of the week.
b. The flight from Accra lands at Johannesburg at 06:35 local time on the next day.
c. There will only be one scheduled flight per week from Bulawayo to Johannesburg – on the Sunday.
d. Yes, SAE536 departs Bloemfontein at 17:30 and arrives at Durban at 18:35.
e. All seven days are indicated on the schedule for flights between Bloemfontein and Johannesburg.

47T E R M 1 • U N I T 2
f. Flight departure (local time): 17:55 Arrival time (South African time): 08:10 South Africa is five hours ahead of Buenos Aires. Duration of flight = (24:00 – 17:55) + 08:10 – 05:00 = 06:05 + 08:10 – 05:00 = 14:15 – 05:00 = 09:15 The duration of the flight is 9 hours and 15 minutes. g. Five times per week (Wednesday to Sunday) h. There is no time difference between Cairo and Johannesburg. Departure time: 23:00 Arrival time: 07:05 Duration: 01:00 + 07:05 = 08:05 The duration of the flight is 8 hours and 5 minutes. i. No you cannot fly from Bujumbura to Johannesburg on a Tuesday. There are only direct flights from Bujumbura to Johannesburg on
Mondays, Wednesdays and Saturdays. To fly on a Tuesday from Bujumbura to Johannesburg, you would
have to fly to Kigali on SA088 and then fly to Johannesburg. j No, you can only fly economy class from Bulawayo to Johannesburg.
2.3 Practising reading and interpreting production timetables Learner’s Book page 17
1. October–December is the best time to harvest coffee beans in Yemen.2. The best time to harvest coffee beans in Ethiopia varies between
November and February.3. Kenya has two crops per year: A main crop between October and March
and a second crop (fly crop) between May and August.4. November to February is the best time to ship coffee beans from Tanzania
to Uganda.5. The harvest period in Zimbabwe is from July to October.
2.4 Practise completing and drawing up production schedules Learner’s Book page 18
1. Answers will differ.
2. Task Preparing soil for planting
Sow seeds for different crops
Apply fertiliser (state type)
Harvest crop
Month
August
September ✔
October ✔ sow all seeds ✔ 2:3:4 (30)
November ✔ LAn
December
January Harvest gem squash and butternut
February Harvest Hubbard squash and pumpkin

48 S E C T I O N 3 • W O R K E D A N S W E R S
Task Preparing soil for planting
Sow seeds for different crops
Apply fertiliser (state type)
Harvest crop
March
April
May
June
July
2.5 Practise reading and comparing tide timetables Learner’s Book page 21
1. Answers will differ.2. 26 and 27 January would be the best time to photograph the moon's
reflection on the calm ocean water as it is full moon at the time.3. The spring tide was on 13 January. High tide was at 04:43. Other suitable
days are 14 and 15 January and 27 to 31 January.4. Learners discuss and motivate their answers.
2.6 Practise calculating average speeds Learner’s Book page 23
1. a. Record the departure and arrival times and measure the distance travelled by each vehicle over a typical period of time, such as a typical month or week. The owner could then determine the average speed for each vechicle for the period.
b. Car deliveries
Delivery 1 2 3 4 5
Start delivery 08:31 09:56 14:48 10:12 15:25
Complete delivery 09:14 11:14 16:50 13:37 16:09
Elapsed time 43 min. 1 h 18 min. 2 h 2 min. 3 h 25 min. 44 min.
Distance (km) 9,3 km 44,7 km 51,0 km 156,2 km 12,3 km
Speed (km/h) 13 34,4 25,1 45,7 16,8
Average speed: 27 km/h
Bakkie deliveries
Delivery 1 2 3 4 5
Start delivery 09:15 11:37 13:20 08:26 14:10
Complete delivery 10:05 12:58 15:19 11:12 14:58
Elapsed time 50 min. 1 h 21 min. 1 h 59 min. 2 h 46 min. 48 min.
Distance (km) 68,3 49,1 81,6 137,2 31,0
Speed (km/h) 82 36,4 41,1 49,6 38,8
Average speed: 49,58 km/h rounded off to 50 km/h

49T E R M 1 • U N I T 2
Bicycle deliveries
Delivery 1 2 3 4 5
Start delivery 8:12 09:29 12:18 16:02 10:05
Complete delivery 8:48 10:12 13:01 16:48 10:47
Elapsed time 36 min. 43 min. 43 min. 46 min. 42 min.
Distance (km) 7,9 9,8 8,2 3,0 8,6
Speed (km/h) 13,2 13,7 11,4 3,9 12,3
Average speed: 10,9 km/h rounded off to 11 km/h Motorcycle deliveries
Delivery 1 2 3 4 5
Start delivery 9:45 11:21 13:09 15:37 8:24
Complete delivery 10:38 12:23 13:46 16:48 11:18
Elapsed time 53 min. 1 h 2 min. 37 min. 1 h 11 min. 2 h 54 min.
Distance (km) 22,9 38,6 11,5 53,8 149
Speed (km/h) 25,9 37,4 18,6 45,5 51,4
Average speed: 35,76 km/h rounded off to 36 km/h c. The two most efficient vehicles are the bakkie (with an average speed
of 50 km/h) and the motorcycle (with an average speed of 36 km/h). d. The owner should consider the capacity of each vehicle (the bakkie
can carry the largest load), the typical size of goods that are delivered (large or small), where goods need to be delivered (are goods couriered within the city/town centre where traffic is heavy), and the distance of the deliveries (the average distance of the bakkie’s deliveries are 73,44 km, the car is 54,7 km, the average for the motorcycle is 55,16 km and the average for the bicycle is only 7,5 km).
2. a Athlete Event Average speed
usain Bolt 100 m 37,38 km/h
usain Bolt 200 m 37,31 km/h
Wayde van niekerk 400 m 33,47 km/h
david rudisha 800 m 28,54 km/h
noah ngeny 1 500 m 25,46 km/h
Kenenisa Bekele 5 000 m 23,14 km/h
Kenenisa Bekele 10 000 m 22,21 km/h
Samuel Wanjin Marathon* 20,01 km/h
b. Athlete Event Average speed
Florence Griffith-Joyner 100 m 33,90 km/h
Florence Griffith-Joyner 200 m 33,74 km/h
Marie-José Pérec 400 m 29,84 km/h
nadezhda olizarenko 800 m 25,39 km/h
Paula Ivan 1 500 m 23,08 km/h
Vivian Jepkemoi cheruiyot 5 000 m 20,78 km/h
Almaz Ayana 10 000 m 20,48 km/h
tiki Gelana Marathon* 17,69 km/h
* The marathon is 42,195 km.

50 S E C T I O N 3 • W O R K E D A N S W E R S
c. Class discussion.3. Event Average speed
of men’s record (km/h)
Average speed of women’s record (km/h)
Average speed of the women’s record as a percentage of average speed of men’s record
100 m 37,38 33,90 33,9 ____ 37,38 = 91%
200 m 37,31 33,74 33,74 ____ 37,31 = 90%
400 m 33,47 29,84 29,84 ____ 33,47 = 89%
800 m 28,54 25,39 25,39 ____ 28,54 = 89%
1 500 m 25,46 23,08 23,08 ____ 25,46 = 91%
5 000 m 23,14 20,78 20,78 ____ 23,14 = 90%
10 000 m 22,21 20,48 20,48 ____ 22,21 = 92%
Marathon 20,01 17,69 17,69 ____ 20,01 = 88%
The average speed of the women’s record is approximately 90% of the average speed of the men’s record. This may be because men – on average – have more muscle on their bodies than women. The average speed of the men’s record is often similar to the average speed of the women’s record in the preceding events (for example, the average speed of the men’s 400 m and the women’s 200 m is approximately 33 km/h, the average speed of the men’s 1 500 m and women’s 800 m is about 25 km/h).
2.7 Investigation: Plan and budget for a holiday trip Learner’s Book page 29
Answers will differ.
Revise and consolidate Learner’s Book page 31
1. a. 60 ℓ = 15,85 gallons b. Average car’s fuel economy: 10 km/ℓ Capacity of petrol tank: 60 ℓ 60 ℓ × 10 km/ℓ = 600 km c. Distance on one tank of petrol = 600 km Distance required = 400 miles
= 643,72 km 643,72 km > 600 km Mrs Khumalo will not have enough petrol and will have to fill up.
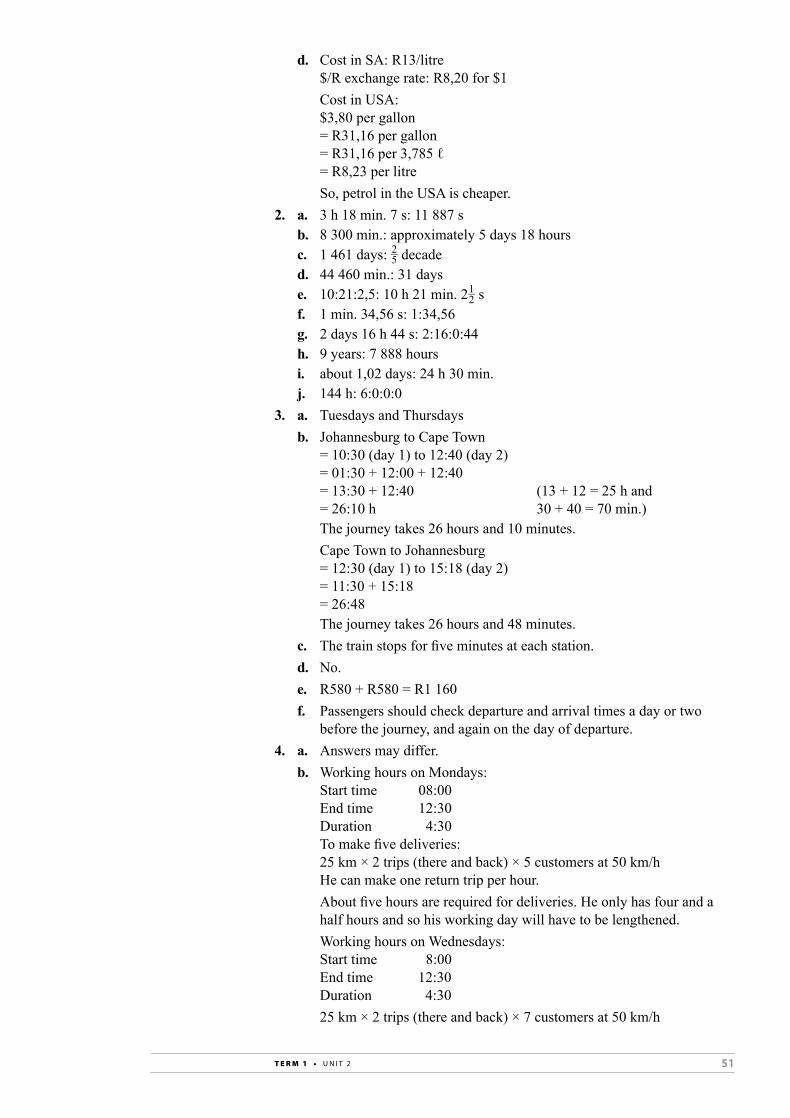
51T E R M 1 • U N I T 2
d. Cost in SA: R13/litre $/R exchange rate: R8,20 for $1 Cost in USA: $3,80 per gallon = R31,16 per gallon = R31,16 per 3,785 ℓ = R8,23 per litre So, petrol in the USA is cheaper.2. a. 3 h 18 min. 7 s: 11 887 s b. 8 300 min.: approximately 5 days 18 hours c. 1 461 days: 2
_ 5 decade d. 44 460 min.: 31 days e. 10:21:2,5: 10 h 21 min. 2 1
_ 2 s f. 1 min. 34,56 s: 1:34,56 g. 2 days 16 h 44 s: 2:16:0:44 h. 9 years: 7 888 hours i. about 1,02 days: 24 h 30 min. j. 144 h: 6:0:0:03. a. Tuesdays and Thursdays b. Johannesburg to Cape Town = 10:30 (day 1) to 12:40 (day 2) = 01:30 + 12:00 + 12:40 = 13:30 + 12:40 (13 + 12 = 25 h and = 26:10 h 30 + 40 = 70 min.) The journey takes 26 hours and 10 minutes. Cape Town to Johannesburg = 12:30 (day 1) to 15:18 (day 2) = 11:30 + 15:18 = 26:48 The journey takes 26 hours and 48 minutes. c. The train stops for five minutes at each station. d. No. e. R580 + R580 = R1 160 f. Passengers should check departure and arrival times a day or two
before the journey, and again on the day of departure.4. a. Answers may differ. b. Working hours on Mondays: Start time 08:00 End time 12:30 Duration 4:30 To make five deliveries: 25 km × 2 trips (there and back) × 5 customers at 50 km/h He can make one return trip per hour. About five hours are required for deliveries. He only has four and a
half hours and so his working day will have to be lengthened. Working hours on Wednesdays: Start time 8:00 End time 12:30 Duration 4:30 25 km × 2 trips (there and back) × 7 customers at 50 km/h

52 S E C T I O N 3 • W O R K E D A N S W E R S
He can make one return trip per hour. About 7 hours are required for deliveries. His working day will again
have to be lengthened. Working hours on Saturdays: Start time 9:00 End time 12:00 Duration 3:00 25 km × 2 trips (there and back) × 8 customers at 50 km/h He can make one return trip per hour. So, 8 hours are required and he has only 3 hours available. They will
have to lengthen the driver’s working day or find another solution.
Unit 3Financial documents at home and at workLearner’s Book pages 34–65
Teaching tips• In Grade 10 and Grade 11, learners were introduced to the financial
documents they need to understand and work with in this course. To ensure that they can apply this knowledge to a wide range of relevant contexts in their lives, collect documents that cover all the types listed in the Learner’s Book, and extend the activities given to cover documents in your collection.
• The terminology in financial documents should be familiar to all learners. They will need to practise using these terms in verbal explanations and written work to become competent at recognising their meanings in all contexts. The glossary activity is a way for learners to use their own understanding to express the meanings of the terms – you can use this activity as baseline assessment of terms and concepts that are fully understood or terms may need to be revised in more detail while teaching this unit.
• Learners need to understand how financial documents are used in practical situations and be able to solve problems such as misunderstood contract agreements and late payments. Relate the examples given in the Learner’s Book to similar situations that may have been reported in local newspapers (community newspapers often report problems that consumers have experienced with payments, contracts and so on), and invite learners to report experiences that they or their families have had with such situations.
• Understanding how to analyse a contract before signing it is an important consumer skill that all learners should develop. Banks, cellphone service providers, property managers and other organisations that issue contracts will generally not make blank contracts available for learners to study. To help your learners understand the terminology used in contracts, try to obtain a few examples of contracts that are commonly used in this context. Examples include rental agreements for flats or houses and cellphone contracts. Delete the personal details of contract holders before showing copies to the class. The main focus should be on the responsibilities that a person agrees to when signing a contract (such as paying a monthly amount), and the penalties for not doing so.

53T E R M 1 • U N I T 3
• The focus of the section on income tax in this unit is understanding the terminology and the concepts. Learners will analyse the practical process of calculating tax and completing tax returns in detail in Term 3.
Solutions3.1 Revise different financial documents Learner’s Book page 34
Answers will differ.
3.2 Revise what you know about financial documents Learner’s Book page 38
1. a. A: current account statement B: credit card statement C: 32-day notice deposit statement b. The current account and credit card statements record expenditure. c. The statements for the current account (a deposit of R2 400) and the
32-day notice deposit (interest capitalised) show income. d. Current account statement: 2 September to 1 October 2019 Credit card statement: 24 May to 24 June 2020 32-day notice deposit statement: 1 October to 31 December 2018 e. According to the credit card statement, the account holder owes
R19 050,06. The minimum payment due is R952,49. f. The credit card statement shows a debit balance interest rate of
18,50%. The 32-day notice deposit statement shows an interest rate of 3,75%. g. Current account: credit balance of R85 883,14 Credit card: a debt balance of R19 050,06 32-day notice deposit: credit balance of R6 331,182. a. The document is a payslip. b. Gross salary plus commission: R30 000 + R2 000 = R32 000 c. Net pay equals gross pay minus total deductions. Total deductions
consist of pension, PAYE, tax, UIF contribution and medical aid. d. No, the employee’s net pay each month will depend on the
commission paid.
3.3 Practise choosing documents needed in different situations Learner’s Book page 45
1. To open a savings account and apply for a credit card you will need: • proof of identification (for example, a green barcoded ID book) • proof of address (for example, a utilities bill) • proof of earnings (last three months’ salary slips)2. To open a current account at the same bank: • proof of address • proof of identification.3. Zanele can take the faulty computer, the original receipt, her ID book,
and the warranty document if there was one to the customer services department of the supermarket chain’s Kimberly branch. The computer is still under warranty.

54 S E C T I O N 3 • W O R K E D A N S W E R S
4. Achmat must show the faulty television set, the original receipt (cash slip), both warranty documents (particularly the one for the extended cover) and his ID to the shop.
5. An adult member of the family can take the accounts for the last few months (including the one that is very high) to the municipality to check if it is correct and to request that the amount be corrected if it is not correct.
6. Nandi could ask to see the owner or manager. She must state that the price label did not state that it cost R45 per slice and that when she placed the order, she was not told that the cake would cost R240. Nandi is not under obligation to purchase the cake. In future, Nandi should confirm the price of an item. If she were to purchase another cake, she could ask the counter assistant if the price is for the whole cake.
7. Jeremy must confirm his FICA status by taking proof of identification (such as a green, barcoded ID book) and proof of address, such as a recent utilities bill to the bank.
8. Pieter must RICA the phone to unlock it. To do this, he must take proof of identification (his green barcoded ID book), proof of residence (a recent utilities bill) and the cellphone to a cellphone shop (such as the local branch of his network provider). A shop assistant will use Pieter’s documents to register him for RICA.
3.4 Practise reading and interpreting terms and conditions Learner’s Book page 51
1. a. Yes, a buyer can apply for finance by telephone or online. He or she does not need to go to a branch of the bank.
b. The required documents for a SA citizen are: • An SA green barcoded ID book • Driver’s licence • Proof of residence (for example, a utility bill) • Latest payslip or three month’s bank statement if the applicant is
not an FNB client • If the applicant earns commission, six months’ pay slips and bank
statements are required. Non-resident applicants need to show their: • passport • work permit • international driver’s license • latest payslip • proof of residence • contract of employment. c. Yes, you can apply for the loan if you only earn commission and
do not earn a basic wage or salary. You have to supply 6 months of payslips and bank statements.
d. No, you cannot apply for a loan if you are unemployed. e. Non-SA citizens can apply for a loan. f. Costs are: Inspection fee R513 Facilitation fee R2 100 Agent service fee R820 Total R3 433

55T E R M 1 • U N I T 3
g. The bank will investigate the document history of the car to ensure it can be title-cleared. The bank will arrange a vehicle inspection. The bank will review the inspection and HPI report to ensure the vehicle has not been rebuilt, is roadworthy, and the condition of the vehicle complies with FNB’s quality requirements.
h. You must produce the original roadworthy certificate and original NATIS registration.
i. Yes, there are terms and conditions not listed in the brochure.2. a. The letter states the minimum repayment required on Standard Bank
credit was reduced from 5% to 3% of the balance owing. b. If a person owed R1 000 on their credit card and only paid the
minimum amount, they would now only have to pay R30 (3% of the balance) instead of R50 (5% of the balance) at the end of the month.
c. The bank made the change because of the current economic climate. Customers can repay less on their credit cards and not get into arrears.
d. An APO is an automatic payment order. e. Clients can specify whether the APO pays: • the full amount for the month • the minimum amount for the month • a fixed amount (provided it is greater than the minimum amount). f. The cardholder has an outstanding balance of R19 050,06. If the
cardholder specifies the APO to be for the full amount, then the entire R19 050,06 will be transferred from the nominated account in payment of the balance on the credit card.
If the accountholder specifies the minimum amount then the minimum amount specified on the statement, for example, R952,49, will be transferred from the nominated account to the credit card account.
If the accountholder specifies a fixed amount, such as R2 000, then the APO will transfer the R2 000 from the nominated account in payment. In this case, the specified amount is greater than the minimum amount. However, if it is less the APO will transfer the minimum amount to the credit card account
g. If you keep additional funds in a credit card, you can usually earn more interest on the amount than in a current account. You can also purchase an item on your credit card that is more than your credit limit. For example, if you wanted to purchase a R7 000 aeroplane ticket but only had available credit of R5 000 on your credit card you would need to put an additional R2 000 in your credit card account before you buy the ticket.
h. If the client’s repayments were smaller, the client would take longer to repay the amount owing, and will have to pay more interest to the bank. Therefore, the bank will benefit from receiving more income from the interest charged on credit card balances.
3. a. You can borrow between R1 000 and R140 000. b. An interest rate of 21% was used in the calculations. (However, the
payments in the table also include a monthly service fee of R57 and an initiation fee of R1 140.)
c. No, you would pay a higher interest rate, depending on the amount and duration of the loan. For example, if you borrowed R1 000 over 12 months, the effective interest rate would be 99%. If you borrowed R20 000 over 12 months, the effective interest rate would be 22%.

56 S E C T I O N 3 • W O R K E D A N S W E R S
d. You would have to pay a monthly service fee of R57 and a once-off initiation fee of R1 140.
e. The interest rate charged on your loan would be determined by your risk profile and may vary from the rate illustrated in the table. Fees were current at 1 August 2010 and were subject to change. You would need to be formally employed and earning R1 000 or more to apply for the loan. Loan applications were subject to credit approval.
f. No, other terms and conditions not specified on the brochure also apply. g. It does not say who the bank is and how to contact them. h. A more detailed table with a breakdown of costs and the effective
interest rate should be involved.4. Mahlophe needs to show his financial records and the duplicates of the
invoices and receipts he issued during the tax year to prove his income was below the threshold amount for paying income tax. Masophe should also take copies of his bank statement over the tax year as additional proof that his income was below the threshold amount.
5. If Ragmat keeps a logbook of all the deliveries she has made (recording the date and distance travelled) she should use this to claim. She should also use all the petrol slips, and the invoices/receipts for servicing and repairs to the car.
3.5 Assignment: Finding information in the Pocket tax Guide Learner’s Book page 64
(All information is taken from the 2012 tax year SARS Pocket Tax guide.)
1. There are six income tax brackets for individuals and special trusts: • 0–160 000 • 160 001–250 000 • 250 001–346 000 • 346 001–484 000 • 484 001–617 000 • 617 001 and above.2. People in the lowest bracket earn R160 000 or less per year and pay
income tax of 18% on their taxable income. People in the highest bracket earn R617 001 or more per year and pay
R178 940 plus 40% of the taxable income over R617 000.3. Taxpayers who are over 75 years of age have a rebate of R19 960. (They
are entitled to the primary, secondary and tertiary tax rebates.)4. A taxpayer who is 68 years old and earns R87 400 in the tax year, is
entitled to the first and secondary rebates and will pay: 18% × R87 400 – (11 440 + 6 390) = R15 732 – R17 830 = R2 098 ∴ The taxpayer will not pay income tax.5. Any person who earns income other than remuneration or an allowance or
advance payable by the person’s principal must pay provisional tax.6. The following people are except from paying provisional tax: • individuals below the age of 65 who do not run a business and whose
taxable income does not exceed the tax threshold for the tax year or whose taxable income from interest, dividends and rental is R20 000 or less for a tax year
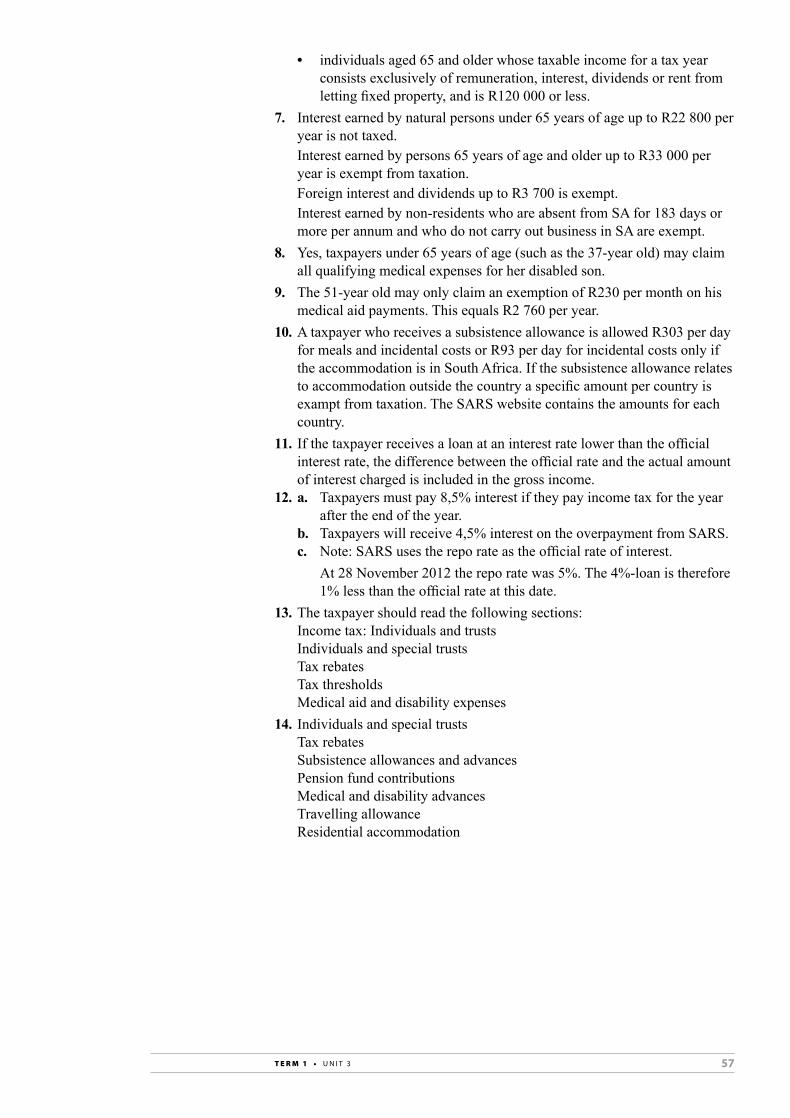
57T E R M 1 • U N I T 3
• individuals aged 65 and older whose taxable income for a tax year consists exclusively of remuneration, interest, dividends or rent from letting fixed property, and is R120 000 or less.
7. Interest earned by natural persons under 65 years of age up to R22 800 per year is not taxed.
Interest earned by persons 65 years of age and older up to R33 000 per year is exempt from taxation.
Foreign interest and dividends up to R3 700 is exempt. Interest earned by non-residents who are absent from SA for 183 days or
more per annum and who do not carry out business in SA are exempt.8. Yes, taxpayers under 65 years of age (such as the 37-year old) may claim
all qualifying medical expenses for her disabled son.9. The 51-year old may only claim an exemption of R230 per month on his
medical aid payments. This equals R2 760 per year.10. A taxpayer who receives a subsistence allowance is allowed R303 per day
for meals and incidental costs or R93 per day for incidental costs only if the accommodation is in South Africa. If the subsistence allowance relates to accommodation outside the country a specific amount per country is exampt from taxation. The SARS website contains the amounts for each country.
11. If the taxpayer receives a loan at an interest rate lower than the official interest rate, the difference between the official rate and the actual amount of interest charged is included in the gross income.
12. a. Taxpayers must pay 8,5% interest if they pay income tax for the year after the end of the year.
b. Taxpayers will receive 4,5% interest on the overpayment from SARS. c. Note: SARS uses the repo rate as the official rate of interest. At 28 November 2012 the repo rate was 5%. The 4%-loan is therefore
1% less than the official rate at this date.13. The taxpayer should read the following sections: Income tax: Individuals and trusts Individuals and special trusts Tax rebates Tax thresholds Medical aid and disability expenses14. Individuals and special trusts Tax rebates Subsistence allowances and advances Pension fund contributions Medical and disability advances Travelling allowance Residential accommodation

58 S E C T I O N 3 • W O R K E D A N S W E R S
Unit 4TarrifsLearner’s Book pages 66–88
Teaching tips• In Grade 10 and Grade 11, learners developed the skills to read and
interpret tariffs for municipal, transport, telephone and bank services, and to use calculations and graphs to choose a suitable tariff options in different situations. The activities in this unit build on these core skills, with more complex tariff situations and with tariff information that learners must research.
• Tariffs for many public services are available via internet websites; for example, websites for municipalities, Eskom, Telkom and cellphone networks. You can apply the structure of the activities in the Learner’s Book to updated tariff information that learners research on the internet, to give them more practice in tariff calculations.
• Remind learners that when comparing tariffs for different services, they should analyse other reasons a person might have for choosing a particular service even if it does not have the most inexpensive tariff. For example, a cellphone with a higher call tariff may have more features on the phone that comes with the package, or a train season ticket may cost more than a bus season ticket, but the passenger would not have to walk as far to and from the train station as to and from the bus terminus.
• Link the tariff calculation activities in this unit to work that learners do with financial documents in Unit 3 this term (reading tariffs set out in documents), and also to the calculation of tariff costs for use in income and expenditure statements, budgets, profit-and-loss analyses, bank accounts, travel costs, and so on in later units.
Solutions4.1 Practise doing tariff calculations and comparisons Learner’s Book page 66
1. a. A City of Cape Town electricity account B Telkom telephone account C City of Cape Town municipal rates account b. A Electricity account: 20/12/2019–19/01/2020 B Telephone account: 17/05/2020–16/06/2020 C Rates account: property rates: 21/12/2018–19/01/2019
water: 14/12/2018–17/01/2019 refuse: 21/12/2018–19/01/2019 sewerage: 14/12/2018–17/01/2019
c. Electricity account: kWh used Telephone account: call units Rates account: Property rates: value of the house water: water consumption (kilolitres) refuse: number of bins and removals sewerage: water consumption (kilolitres) d. A Not shown – shown overleaf on account B Not shown – shown overleaf on account C Tariffs (and applicable rebates) shown for property rates, water,
refuse and sewerage
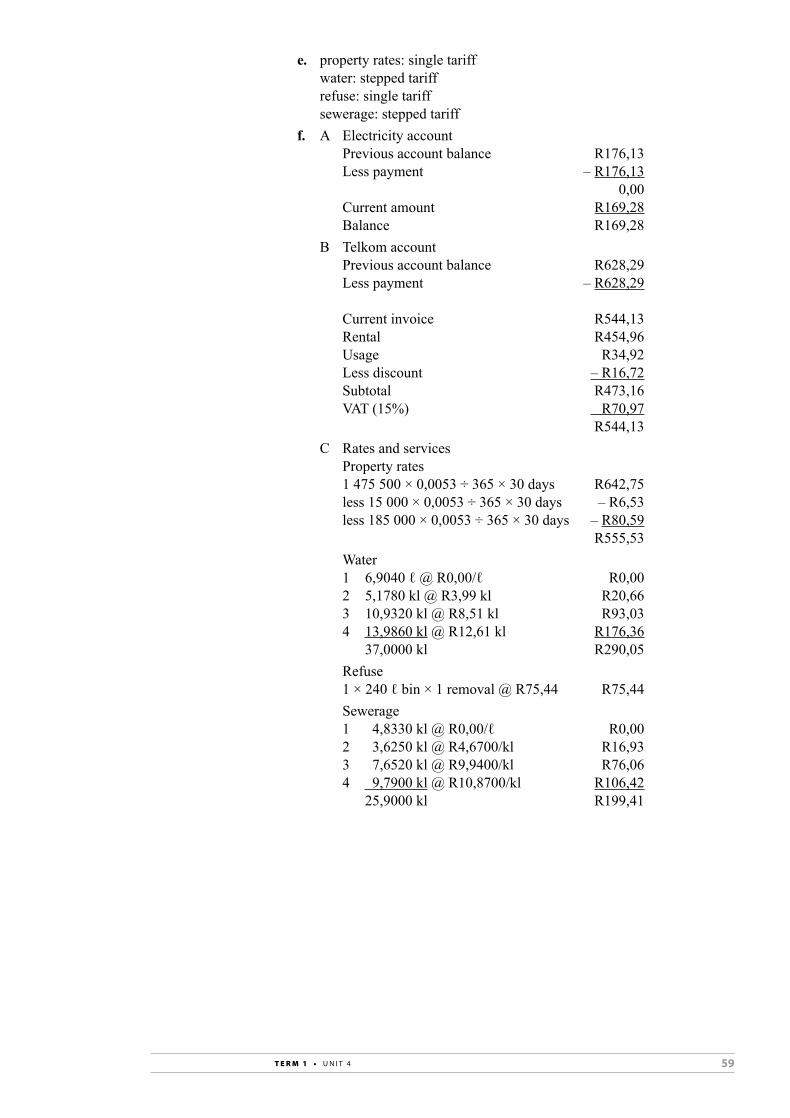
59T E R M 1 • U N I T 4
e. property rates: single tariff water: stepped tariff refuse: single tariff sewerage: stepped tariff f. A Electricity account Previous account balance R176,13 Less payment – R176,13 0,00 Current amount R169,28 Balance R169,28 B Telkom account Previous account balance R628,29 Less payment – R628,29 Current invoice R544,13 Rental R454,96 Usage R34,92 Less discount – R16,72 Subtotal R473,16 VAT (15%) R70,97 R544,13 C Rates and services Property rates 1 475 500 × 0,0053 ÷ 365 × 30 days R642,75 less 15 000 × 0,0053 ÷ 365 × 30 days – R6,53 less 185 000 × 0,0053 ÷ 365 × 30 days – R80,59 R555,53 Water 1 6,9040 ℓ @ R0,00/ℓ R0,00 2 5,1780 kl @ R3,99 kl R20,66 3 10,9320 kl @ R8,51 kl R93,03 4 13,9860 kl @ R12,61 kl R176,36 37,0000 kl R290,05 Refuse 1 × 240 ℓ bin × 1 removal @ R75,44 R75,44 Sewerage 1 4,8330 kl @ R0,00/ℓ R0,00 2 3,6250 kl @ R4,6700/kl R16,93 3 7,6520 kl @ R9,9400/kl R76,06 4 9,7900 kl @ R10,8700/kl R106,42 25,9000 kl R199,41

60 S E C T I O N 3 • W O R K E D A N S W E R S
2. Contract options
Basic tariff per month
Number of off-peak minutes per month
Tariff per off-peak minute
Data bundle included
Extra features included
Monthly tariff includes VAT
Sony Ericsson Xperia neo
r169 120 minutes per month for 24 months
not given 100 MB data per month for 3 months
Hd Video recoarding (720 pixels)Built-in HdMI8.1 megapixel camera
Included
nokia n8 Smartphone
r189 120 minutes per month for 24 months
not given 100 MB data per month for 3 months
3.5 G Full touch smartphone12 megapixel cameraHd video recordingGPS with free lifetime voice-guided navigation
Included
Sony Ericsson Xperia Play
r199 120 minutes per month for 24 months
not given 100 MB data per month for 3 months
Google Mobile Serviceconsole-like gamingSuper-fast graphics
Included
Blackberry curve 9360 Smartphone
r229 120 minutes per month for 24 months
not given Includes Blacberry Internet Service (BIS)
new Blackberry & oSdisplay HVGA + (480 × 360) 246 dPIdimensions: 60 × 109 × 11 mm
Included
3. Answers will differ. Examples are given below. a. The Sony Ericsson Xperia Neo is the cheapest of the four smartphones
(at R169,00) for the student. b. The Sony Ericsson Xperia Play – the musician can download music
and play games while on tour using the smartphone’s console-like gaming feature.
c. The Blackberry Curve 9360 – the teenager can use the Blackberry Internet Service to surf the web and the Blackberry Messenger to chat with friends.
d. The Nokia N8 Smartphone has the best quality camera (12 megapixel) with HD video recording. The journalist can use the phone to record interviews, take photographs and even record videos. The journalist can also use the cellphone’s GPS and voice-guided navigation to get to interviews and events without getting lost.
4. a. Monthly fee: R55,00 Transactions not included: 35 – 10 = 25 Fee per transaction: R6,00 Transaction fees: R150 Total average monthly fee: R205 b. Monthly fee: R85,00 Transactions not included: 28 – 15 = 13 Fee per transaction: R5,50 Transaction fees: R71,50 Total average monthly fee: R156,50 c. Monthly fee: R85,00 Transactions not included: 25 – 15 = 10 Fee per transaction: R5,50 Transaction fees: R55,00 Total average monthly fees: R140,00

61T E R M 1 • U N I T 4
d. Islamic Cheque Option 1 Monthly fee: R110,00 Transactions not included: 40 – 25 = 15 Fee per transaction: R10,00 Transaction fees: R150,00 Total average monthly fees: R260,00 Islamic Cheque Option 2 Monthly fees: R150,00 Transactions not included: 40 – 35 = 5 Fee per transaction: R10,00 Transaction fees: R50,00 Total average monthly fees: R200,00 The Islamic Cheque Option 2 account would be better for the Muslim
customer.
4.2 Practise calculating costs of using different municipal services Learner’s Book page 72
1. a. Hire of stadium (12:00–18:00): R350,00 18 matches per season R350,00 × 18 = R6 300 b. i. Cost of use of stadium There is a minimum cost of R2 650 to use the stadium. ii. Deposits and electricity Deposit R6 580,00 Kitchen appliciances deposit R475,00 Key deposit R126,00 R7 181,00 Electricity R40,00 p/h @ 11 hours = R440,00 R7 181 + R440 = R7 621 iii. Crockery 2 500 people are expected to attend the event for some part of
the day. Meals provided: lunch, supper, afternoon and morning drinks Lunch and supper (example) 2 meals × 2 items of crockery × 1 250 people × R0,33 per item of
dirty crockery = R1 650,00 Afternoon and morning drinks (example) 2 drinks × 1 item of crockery × R1 250 people × R0,33 per item of
dirty crockery = R825 R1 650 + R825 = R2 475 c. Use of stadium Two full days use and one evening use (2 hours) 2 × R870 + R500 = R2 240 Electronic timing system R790 per day × 2 = R1 580 Deposit on athletics equipment R790,00 Deposit for stadium use R790,00 Key deposit R126,00 Total: R2 240 + R1 580 + R790 + R790 + R126,00 = R5 526,00

62 S E C T I O N 3 • W O R K E D A N S W E R S
2. Rehearsal Use of hall (amateur/educational rate) R765,00 Dress rehearsals (twice) Use of hall for dress rehearsal R383 × 2 R766,00 Lighting technician R37,50/h × 8 h R300,00 Sound operator R37,50/h × 8 h R300,00 Sound system rental (per day) (50%) R113,75 Smoke machine rental (per day) (50%) R47,50 Slide projector (per day) (50%) R27,50 R1 554,75 Performance Use of hall (amateur/educational rate) R765,00 Lighting technician R37,50/h × 4 h R150,00 Sound operator R37,50/h × 4 h R150,00 Sound system (per day) R227,50 Slide projector (per day) R55,00 Smoke machine (per occasion) R95,00 Use of foyer for exhibition of photographs R195,00 R1 637,00 Total costs for using the theatre Deposit (refundable) R960,00 R765,00 + R1 554,75 + R1 637,00 + R960,00 R4 917,253. a. Daily rate Pensioner daily rate: R7,00 Average usage per month: Four times per week × 4 weeks = 16 Total cost = R7,00 × 16 = R112,00 Monthly tariff – pensioners: R185,00 It is cheaper for the pensioner to pay the daily entrance tariff. b. Adult seasonal rate: R246,00 Daily rate: R8,00 R246 ÷ 8 = R30,75 If the adult uses the pool 31 times or more, then the season tariff is
more economical than the daily rate. c. Grade Number of
learnersDay Rate
4 48 Monday r245,00
5 62 tuesday r373,00
6 36 Wednesday r245,00
7 53 thursday r373,00
Total R1 236,00
10 weeks of lessons in Term 1 (assuming no public holidays): Total cost for Term 1: R1 236 × 10 = R12 360,00
4.3 Investigation: Look at tariffs in your municipality Learner’s Book page 76
Answers will differ.
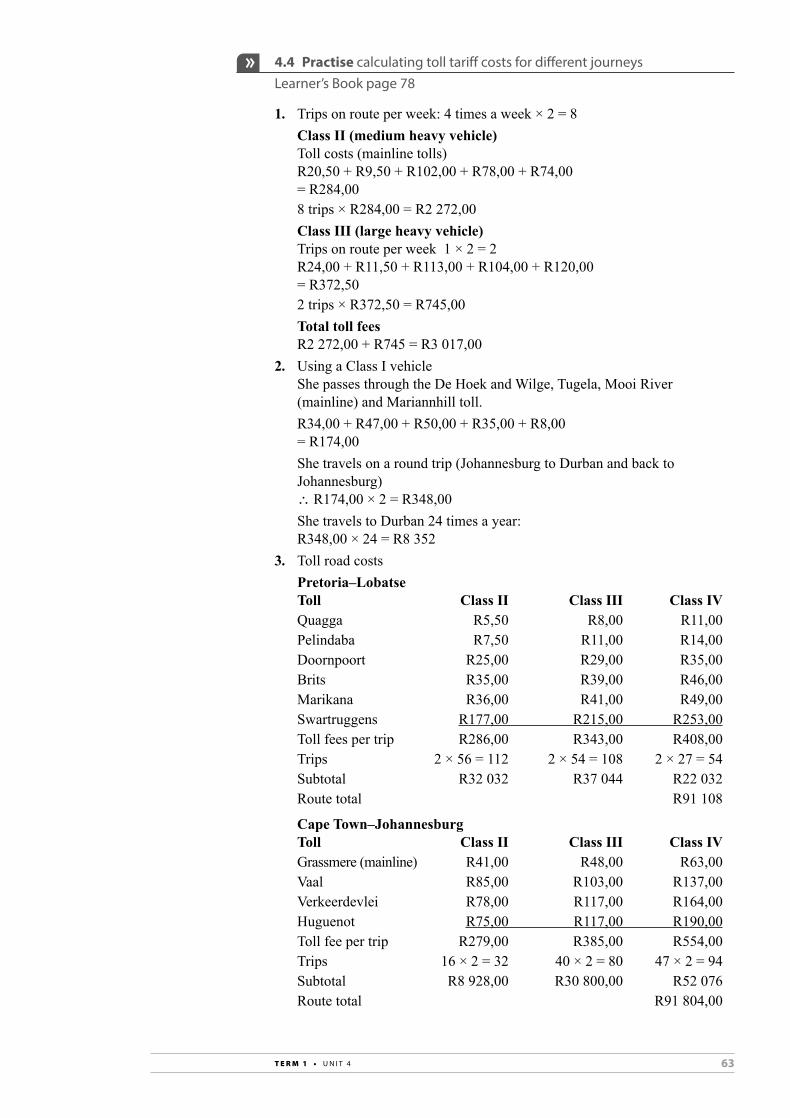
63T E R M 1 • U N I T 4
4.4 Practise calculating toll tariff costs for different journeys Learner’s Book page 78
1. Trips on route per week: 4 times a week × 2 = 8 Class II (medium heavy vehicle) Toll costs (mainline tolls) R20,50 + R9,50 + R102,00 + R78,00 + R74,00 = R284,00 8 trips × R284,00 = R2 272,00 Class III (large heavy vehicle) Trips on route per week 1 × 2 = 2 R24,00 + R11,50 + R113,00 + R104,00 + R120,00 = R372,50 2 trips × R372,50 = R745,00 Total toll fees R2 272,00 + R745 = R3 017,002. Using a Class I vehicle She passes through the De Hoek and Wilge, Tugela, Mooi River
(mainline) and Mariannhill toll. R34,00 + R47,00 + R50,00 + R35,00 + R8,00 = R174,00 She travels on a round trip (Johannesburg to Durban and back to
Johannesburg) ∴ R174,00 × 2 = R348,00 She travels to Durban 24 times a year: R348,00 × 24 = R8 3523. Toll road costs Pretoria–Lobatse Toll Class II Class III Class IV Quagga R5,50 R8,00 R11,00 Pelindaba R7,50 R11,00 R14,00 Doornpoort R25,00 R29,00 R35,00 Brits R35,00 R39,00 R46,00 Marikana R36,00 R41,00 R49,00 Swartruggens R177,00 R215,00 R253,00 Toll fees per trip R286,00 R343,00 R408,00 Trips 2 × 56 = 112 2 × 54 = 108 2 × 27 = 54 Subtotal R32 032 R37 044 R22 032 Route total R91 108
Cape Town–Johannesburg Toll Class II Class III Class IV Grassmere (mainline) R41,00 R48,00 R63,00 Vaal R85,00 R103,00 R137,00 Verkeerdevlei R78,00 R117,00 R164,00 Huguenot R75,00 R117,00 R190,00 Toll fee per trip R279,00 R385,00 R554,00 Trips 16 × 2 = 32 40 × 2 = 80 47 × 2 = 94 Subtotal R8 928,00 R30 800,00 R52 076 Route total R91 804,00

64 S E C T I O N 3 • W O R K E D A N S W E R S
Pretoria–Maputo Toll Class II Class III Class IV Diamond Hill (mainline) – R67,00 R111,00 Middelburg – R140,00 R183,00 Machado – R256,00 R366,00 Nkomazi – R141,00 R203,00 Moamba Toll fees per trip R604,00 R863,00 Trips 0 30 × 2 = 60 38 × 2 = 76 Subtotal – R36 240 R65 588 Route total R101 828,00
Durban–Empangeni Toll Class II Class III Class IV Tongaat (mainline) R16,00 R21,00 R31,00 Mvoti R26,00 R35,00 R52,00 Mtunzini R61,00 R72,00 R108,00 Toll fees per trip R103,00 R128,00 R191,00 Trips 2 × 126 = 252 2 × 102 = 204 2 × 83 = 166 Subtotal R25 956,00 R26 112,00 R31 706,00 Route total R83 774,00
Route Cost Cape Town–Johannesburg 91 804,00 Pretoria–Lobatse 91 108,00 Pretoria–Maputo 101 828,00 Durban–Empangeni 83 774,00 368 514,004. a. February January total: R1 080,00 Discount rate: 50% February discount = January total × discount rate
= R1 080 × 50% = R540,00
So, February cost: R1 080 – R540 = R540 b. March February total: R540,00 Discount rate: 15,0% March discount = February total × discount rate
= R540,00 × 15% = R81,00
March cost: R540,00 – R81,00 = R459,00 c. April March total: R459,00 Dicount rate: 15% April discount = March total × discount rate
= R459,00 × 15% = R68,85
April cost: R459,00 – R68,85 = R390,15

65T E R M 1 • U N I T 4
4.5 Practise using graphs to compare tariff options Learner’s Book page 84
1. a. Graphs will differ. b. Examples: At 5 kl of consumption, City 2 is the best (cheapest). At 15 kl of consumption, City 1 is the best. At 30 kl of consumption, City 1 is the cheapest. c. The cost is approximately for cities 2 and 3 between 6 kl and 7 kl
per month.2. For example, the company wants double-sided A4 flyers on 80 gsm
white bond paper. a.
b. There is no break-even point. c. i. Wizards 8 000 A4 sheets: R5 + (7 999 A4 sheets × R0,60)
= R4 804,00 SA flyers 8 000 A4 sheets R2 800 At cost per 5 000 A4 sheets So, it is cheaper to use SA flyers. ii. Wizards R5 + (4 499 A4 sheets at R0,70) = R3 504,30 SA flyers 5 000 A4 sheets at R2 800 (At cost per 5 000 A4 sheets) So, it is cheaper to use SA flyers.3. Answers will differ.
1 000
1 000 2 000 3 000 4 000 5 000 6 000 7 000 8 000 9 000 10 000
2 000
3 000
4 000
5 000
6 000Co
st (R
)
Number of double-sided A4 sheets
SA �yers as a �xed cost
SA flyers
Wizards

66 S E C T I O N 3 • W O R K E D A N S W E R S
Unit 5Income-and-expenditure statements and budgetsLearner’s Book pages 89–111
Teaching tips• The work that learners did in Grade 10 and Grade 11 with income-
and-expenditure statements and budgets is extended in Grade 12 from household and small business statements and budgets to those that are used in bigger organisations (from businesses to national governments). Learners must be able to read and do simple calculations with big money values (millions and billions of rand) as set out in these statements.
• They should also learn to interpret what an organisation’s income and expenditure shows about the kinds of activity that are prioritised in the organisation. For example, if a charity spends more money on its staff salaries than on activities designed to help the people it aims to serve, this would indicate that the organisation’s expenditure pattern does not reflect its charitable aims and vision.
• As in other units, learners must demonstrate that they can understand and use the terminology found in income-and-expenditure statements and budgets. The first activity in the unit is an opportunity for them to revise this knowledge. It also allows learners to practise an important type of calculation they will use when analysing income-and-expenditure statements and budgets – calculating percentage increases and decreases.
• In Grade 12, learners are expected to do research to identify items that would be listed in income-and-expenditure statements and budgets for individuals, households and small businesses, and their costs, as well as working with the examples in the Learner’s Book. Some activities are based on learners’ research for this purpose; you can adapt these to suit the local context in which learners live by, for example, asking them to prepare an income-and-expenditure statement for a local vendor or service provider who is willing to share information with the class, instead of doing the investigation of the mealie vendor’s costs and income in the Learner’s Book.
• Some activities in this unit are also designed to help learners plan for real-life situations once they leave school. Help the learners find information and share ideas about the real opportunities, expenses and other factors that they will encounter after Grade 12, and discuss with them how they will plan for these situations.
• Use the internet to obtain up-to-date budgets for local, provincial and national government, to add to the resources in the Learner’s Book. For the investigation in which learners analyse the local municipal budget, try to arrange for an official to visit the class and discuss the questions learners are asked to investigate – this would be more efficient than having many small groups of learners trying to set up separate appointments with the municipality to obtain the information they need.

67T E R M 1 • U N I T 5
Solutions
5.1
Assignment: Practise interpreting a business income-and-expenditure statement
Learner’s Book page 91
(All amounts are given in thousands of rand (R'000).)
1. a. R3 059 648 ________ R73 810 469 = 4,15% ≈ 4%
b. i. R3 059 648 > R3 002 589 Furniture sales in 2020 was higher than in 2019. R3 059 648 000 – R3 002 589 000 = R57 059 000
ii. 57 059 _______ 3 002 589 × 100 = 1,9%
2. a. Supermarkets in RSA R58 726 485 Supermarkets outside RSA R7 316 698 R66 043 183 b. i. Supermarkets in RSA R58 726 485
________ R66 043 183 = 88,9% ≈ 89%
ii. Supermarkets outside RSA R7 316 698
________ R66 043 183 = 11,1% ≈ 11%
3. Total supermarket income for 2019 R54 733 352 + R7 163 977 = R61 897 329
income 2020 – income 2019 __________________ income 2019
R66 043 183 – R61 897 329 __________________ R61 897 329 = R4 145 854
________ R61 897 329
= 6,7% ≈ 7% Supermarket income (for RSA and non-RSA stores) increased by 7% for
2019 and 2020.4. a. Total expenditure on salaries and wages = R5 514 459 (R’000s) = R5 514 459 000
b. R5 514 459 – R4 961 705 ________________ R4 961 705 = 11,1% ≈ 11%
5. a. 2019
R5 996 ________ R5 524 683
= 0,109%
b. 2020
post-retirement medical benefits
____________________ total employee benefits = R3 760 ________ R6 089 252
= 0,062%6. a. R26 489 (R’000s) = R26 489 000 b. R26 489 < R28 899 So, the auditors’ renumeration decreased from 2019 to 2020. R26 489 – R28 899
____________ R29 899 = –8,34% ≈ –8%
c. R164 725 (R’000s) = R164 725 000

68 S E C T I O N 3 • W O R K E D A N S W E R S
d. R164 725 – R214 000 ______________ R214 000 = –23,03% ≈ 23%
Outside service fees decreased by 23% from 2019 to 2020. e. Fees paid for outside services decreased from 2019 to 2020 because
administrative fees decreased by R15 941 million and technical fees decreased by R33,705 million while secretarial fees only increased by R0,371 million.
7. a. Employee benefits: R6 089 252 Total income: R73 810 469 R6 089 252
________ R73 810 469 = 8,25% ≈ 8%
b. Operational costs Auditors’ remuneration R26 489 Fees paid for outside services R164 725 Total R191 214 R191 214
_______ 73 810 469 = 0,26%
8. a. Employee benefits: R5 524 683 Total income: R68 768 621 R5 524 683
________ R68768 621 = 8,03% ≈ 8%
b. Operational costs Auditors’ remuneration R28 899 Fees paid for outside services R214 000 Total R242 899 R242 899
________ R68 768 621 = 0,35%
Employee benefits as a percentage of total income increased from 8,03% in 2019 to 8,25% in 2020.
Operating costs as a percentage of total income decreased from 0,35% in 2019 to 0,26% in 2020.
5.2
Assignment: compile an income-and-expenditure statement for a mealie vendor's business
Learner’s Book page 93
Answers will differ. 5.3
Assignment: compile a personal income-and-expenditure statement and budget
Learner’s Book page 93
Answers will differ.
5.4
Assignment: Practise reading and interpreting income-and-expenditure statements for an organisation
Learner’s Book page 97
1. a. 2011 revenue (R millions) 581,1 2007 revenue (R millions) 223,3 581,1 – 223,3 = 357,8
b. 581,1 – 223,3
_________ 223,3 = 160,23% ≈ 160%

69T E R M 1 • U N I T 5
c. Broadcast revenue was the main source of income in 2008. 27,5 mm
______ 47 mm × 490,9 ≈ R287,2
d. 27,5 mm
______ 52,5 mm = 52,38% ≈ 52%
e. Broadcast revenue 27 mm
_____ 56 mm = 48,2%
Sponsorship revenue 23 mm
_____ 56 mm = 41,1%
Broadcast revenue is a more important source of income in 2011 than sponsorship income. Broadcast income accounts for 48% of total income, while sponsorship accounts for 41%.
2. Learners discuss answers.3. Learners discuss answers.4. a. i. Main sources of income in 2010/11 Trusts: R13 865 000 Communications and resource development: R5 613 000 Bequests: R5 474 000 ii. Main sources of income in 2009/10 Communications and resource development: R5 019 000 Bequests: R4 882 000 Hospital: R2 527 000 b. i. 2010/2011 Trusts: R13 685
______ R35 790 = 38,7% ≈ 39%
Communications and resource development: R5 613
______ R35 790 = 15,7% ≈ 16%
Bequests: R5 474 ______ R35 790 = 15,3% ≈ 15%
ii. 2009/2010 Communications and resource development: R5 019
______ R19 201 = 26,1% ≈ 26%
Bequests: R4 882 ______ R19 201 = 25,4% ≈ 25%
Hospital: R2 527 ______ R19 201 = 13,2% ≈ 13%
c. i. 2010/2011
Expense Cost (R’000)
Boarding and adoptions r2 653
Horse care unit r868
Mobile clinics r492
Wildlife r336
Hospital r4 712
total r9 061
R9 061 ______ R23 694 = 38,2% ≈ 38%

70 S E C T I O N 3 • W O R K E D A N S W E R S
ii. 2009/2010
Expense Cost (R’000)
Boarding and adoptions r2 550
Horse care unit r750
Mobile clinics r346
Wildlife r304
Hospital r4 683
total r8 633
R8 633 ______ R18 735 = 46,1% ≈ 46%
d. Increase in total income 2010 to 2011 R35 790 – R19 201
____________ R19 201 = 86,4% ≈ 86%
Income increased by 86% from 2010 to 2011.
Increase in total expenses from 2010 to 2011 R23 694 – R18 735
____________ R18 735 = 26,5% ≈ 27%
Expenses increased by 27% from 2010 to 2011.
Therefore, income did not increase by the same percentage as the total expenditure from 2010 to 2011. Income increased at a higher rate (86%) compared to expenditure (which increased by 27%).
5.5
Investigation: Analyse an income-and-expenditure statement for a community organisation
Learner’s Book page 101
Answers will differ.
5.6 Practise reading and interpreting government budget documents Learner’s Book page 109
Leaners compare and discuss answers.1. a. The service charge for electricity is the biggest source of income. R8 971 405
________ R23 880 441 = 37,6% of total revenue
b. Property rates: R5 030 753 000 R5 030 753
________ R23 880 441 = 21,1% of total revenue
c. Service charges (R’000)
Electricity r8 971 405
Water r2 085 289
Sanitation r1 144 122
Refuse r896 924
Other r233 940
r13 331 680
R13 331 680 ________ R23 880 441 = 55,8% ≈ 56%
d. Employee-related costs: R7 690 260 000 e. Interest earned – outstanding debtors = R236 797 000 R23 797 000
________ R23 880 441 = 0,99% ≈ 1%

71T E R M 1 • U N I T 5
f. Projected income R23 880 441 Projected expenditure R24 341 212 –R460 771 There is a projected shortfall of R460 771 000 for the 2012 budget.2. a. Revenue b.
National allocation(95%) Provincial own revenue
(5%)
c. Comprehensive HIV and Aids grants: R1 278 billion R1,278 billion
__________ R13,728 billion = 9,31% ≈ 9%
d. Conditional grant Percentage of total budget*
Integrated Housing & Human Settlements Grant 27,48
national tertiary Services Grant 18,66
other grants 12,97
Public transport operations Grant 10,90
comprehensive HIV and Aids Grant 9,31
Provincial Infrastructure Grant 6,93
Hospital revitalisation Grant 5,82
Health Professionals training and development 4,75
Gautrain 3,19
* Total budget is R13,728 billion. e. Vehicle licences (58% of the province’s own revenue) f. i. If fewer people owned cars, the province’s own revenue would
be reduced significantly. However, this would reduce the total net revenue for the province by 1% or 2%.
ii. If there were fewer casinos in Gauteng, this would reduce the province’s own revenue. However, this would reduce the province’s total net revenue by less than 1%
(The province’s own revenue is 5% of total net revenue. 58% of 5% is 2,9% of the total budget. 21% of 5% is 1,05%.)
g.
health and social development
(37%)
other(9%)
local government & housing (7%)
roads & transport (10%)
National allocation
education(37%)

72 S E C T I O N 3 • W O R K E D A N S W E R S
h. Eduction : roads and transport R22,468 billion : R6,179 billion 3,6397 : 1 The budget for education is 3,64 times bigger than the budget for
roads and transport.3. a. Source 2011/2 2012/3 Change
Personal income tax 34,1% 34,6% +0,5%
Excise duties 3,4% 3,5% +0,1%
corporate income tax 19,4% 20,3% +0,9%
customs duties 4,0% 4,4% +0,4%
VAt 27,1% 25,4% –1,7%
Fuel levies 5,0% 5,2% +0,2%
other 7,0% 6,7% –0,3%
Alternatively, as amounts
Source 2011/2 Rm 2012/3 Rm Change
Personal income tax r257 500 r287 200 +r29 700
Excise duties r25 700 r29 100 +r3 400
corporate income tax r146 500 r168 500 +r22 000
customs duties r30 200 r36 500 +r6 300
VAt r204 600 r210 900 +r6 300
Fuel levies r37 800 r43 200 +r5 400
other r52 900 r55 600 +r2 700
b. Personal income tax c. Department 2011
(R million)2012(R million)
Percentage change
Education r172,713 r195,483 13,18
Health r102,522 r113,796 11,00
Social protection r139,113 r144,693 4,01
Housing and community amenities
r102,061 r107,482 5,31
Public order and safety r84,050 r90,544 7,73
defence r33,958 r52,068 13,00
General public services r51,325 r38,367 1,45
Economic affairs r140,319 r134,571 –4,1
d. Note: Most the budgets for departments increase/decrease by 5%. Agriculture, forestry and fisheries 15,8% increase Environmental protection 58,3% increase Economic affairs 6,1% increase Fuel and energy 21,5% decrease Transport 14% increase Communication 21,9% decrease Other general services 48,7% decrease Executive and legislative & finance affairs 28,3% increase State debt cost 16,7% increase International relations and cooperation 29,2% increase

73T E R M 1 • U N I T 5
Defence 8,1% increase Police 7,1% increase Public order and safety 7,8% increase Prisons 8,5% increase Law courts 10,2% increase Recreation and culture 34,4% increase Local government and community development 9,6% increase Water supply 20,5% decrease Provincial hospitals 9,3% increase Administration and other health services 8,8% increase Central hospital services 67,61% increase Health infrastructure 21,4% decrease HIV/Aids and TB 18,8 increase Health 8,3% increase Social services 6,7% increase Social protection 7,4% increase Old age 7,4% increase Child support 7,3% increase Social security 19,5% increase Disability grant 7,9% increase Other grants 7,9% increase Policy oversight 15% decrease Provincial welfare 7% increase Education 9,4% increase Tertiary education 20,4% increase FET and adult education 132,3% increase Education administration 17,9% decrease Contingency reserve 41,5% increase
e. 2010/11 consolidated total expenditure: 897 376 2011/12 consolidates total expenditure: 972 547 972 547 – 897 376
____________ 897 376 = 8,38%
4. a. Budgeted expenditure for 2012 on all sections of education: Education for 2012: R207,3 bn Increase of 9,5% for 2013: R207,3 bn + R19,69 bn = R226,99 bn ≈ R227 bn Basic education for 2012: R152,1 bn Increase of 9,5% for 2013: R152,1 bn + R14,45 bn = R166,55 bn Tertiary education for 2012: R31,3 bn Increase of 9,5% for 2013: R31,3 bn + R2,97 bn = R34,27 bn Vocational and continuing education training for 2012: R14,4 bn Increase of 9,5% for 2013: R14,4 bn + R1,37 bn = R15,77 bn

74 S E C T I O N 3 • W O R K E D A N S W E R S
Education administration for 2012: R9,6 bn Increase of 9,5% for 2013: 9,6 bn + R0,91 bn = R10,51 bn
Budgeted expenditure for 2012 on all sections of social protection: Social protection for 2012: R157,9 bn Provincial welfare services for 2012: R12,3 bn Increase of 9,5% for 2013: R12,3 bn + R0,52 bn = R12,82 bn Social security fund benefits for 2012: R29,4 bn Decrease of 0,55% for 2013: R29,4 bn – R0,16 bn = R29,24 bn Old age grants for 2012: R39,3 bn Increase of 1,75% for 2013: R39,3 bn + R0,69 bn = R39,99 bn Housing and community amenities for 2012: R120,1 bn Decrease of 2,05% for 2013: R120,1 bn – R2,46 bn = R117,64 bn Health for 2012: R121,9 bn Increase of 3,45% for 2013: R121,9 bn + R4,21 bn = R126,11 bn b. Total amount that the government had to budget for social services
for 2013: Education (all sections) R227,00 bn Social protection: Provincial welfare services R12,82 bn Social security fund benefits R29,24 bn Old age grants R39,99 bn Disability grants R19,20 bn Child support grants R38,20 bn Policy oversight and grant and benefits administration R11,30 bn Other grants R8,20 bn Housing and community amenities R117,64 bn Health (all sections) R126,11 bn Total R629,70 bn
5. a. Percentage increase on budget for social services from 2012 to 2013:
R629,70 bn – R615,7 bn
_______________ R615,7 bn × 100 ___ 1
= R2,27% Therefore, total budget amount for social services for 2014: R629,7 bn + R2,27% = R643,99 bn b. Total budgeted amount for social services for 2015: R643,99 bn + 2,27% = R658,61 bn
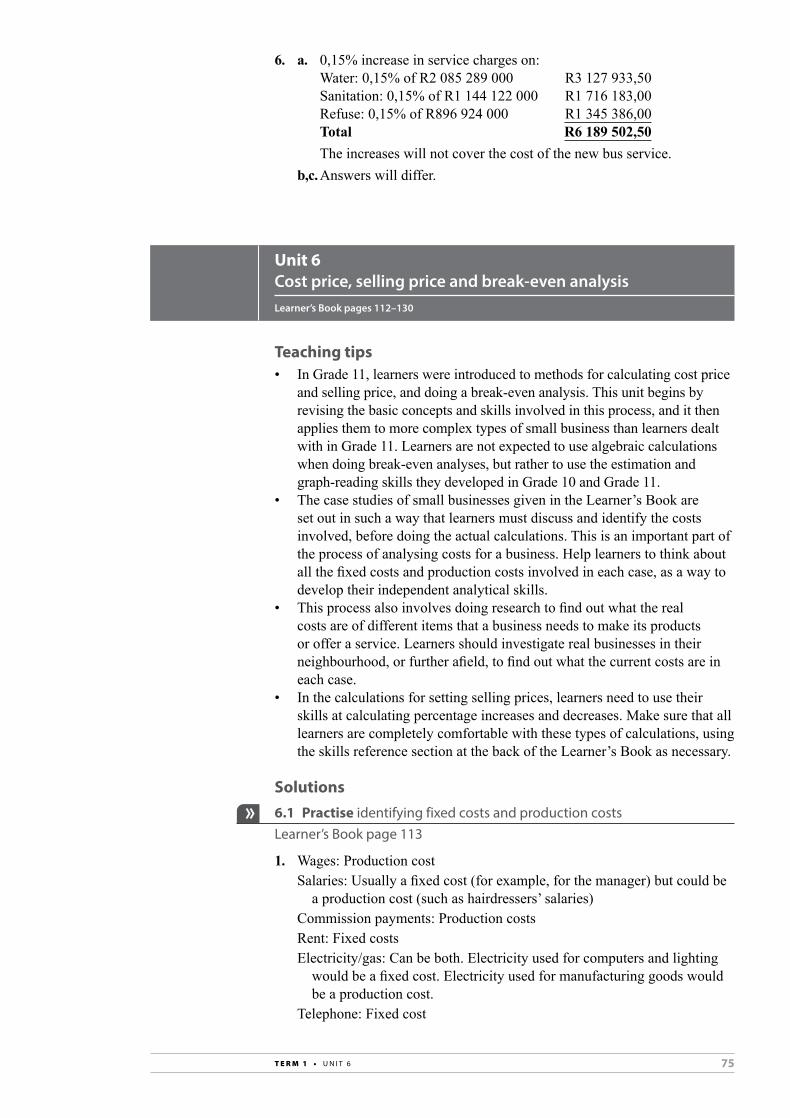
75T E R M 1 • U N I T 6
6. a. 0,15% increase in service charges on: Water: 0,15% of R2 085 289 000 R3 127 933,50 Sanitation: 0,15% of R1 144 122 000 R1 716 183,00 Refuse: 0,15% of R896 924 000 R1 345 386,00 Total R6 189 502,50 The increases will not cover the cost of the new bus service. b,c. Answers will differ.
Unit 6Cost price, selling price and break-even analysisLearner’s Book pages 112–130
Teaching tips• In Grade 11, learners were introduced to methods for calculating cost price
and selling price, and doing a break-even analysis. This unit begins by revising the basic concepts and skills involved in this process, and it then applies them to more complex types of small business than learners dealt with in Grade 11. Learners are not expected to use algebraic calculations when doing break-even analyses, but rather to use the estimation and graph-reading skills they developed in Grade 10 and Grade 11.
• The case studies of small businesses given in the Learner’s Book are set out in such a way that learners must discuss and identify the costs involved, before doing the actual calculations. This is an important part of the process of analysing costs for a business. Help learners to think about all the fixed costs and production costs involved in each case, as a way to develop their independent analytical skills.
• This process also involves doing research to find out what the real costs are of different items that a business needs to make its products or offer a service. Learners should investigate real businesses in their neighbourhood, or further afield, to find out what the current costs are in each case.
• In the calculations for setting selling prices, learners need to use their skills at calculating percentage increases and decreases. Make sure that all learners are completely comfortable with these types of calculations, using the skills reference section at the back of the Learner’s Book as necessary.
Solutions6.1 Practise identifying fixed costs and production costs Learner’s Book page 113
1. Wages: Production cost Salaries: Usually a fixed cost (for example, for the manager) but could be
a production cost (such as hairdressers’ salaries) Commission payments: Production costs Rent: Fixed costs Electricity/gas: Can be both. Electricity used for computers and lighting
would be a fixed cost. Electricity used for manufacturing goods would be a production cost.
Telephone: Fixed cost

76 S E C T I O N 3 • W O R K E D A N S W E R S
Water: Can be both: water used for producing goods or providing a service (such as washing hair for a hairdresser) is a production cost and water
for tea, coffee, washing and toilets is a running/fixed cost. Office stationery: Fixed cost/running cost Computers: Fixed cost/running cost Office cleaning materials: Fixed cost/running cost Bank charges: Fixed cost/running cost Loan interest: Fixed cost/running cost Employee taxes: Fixed cost/running cost UIF contributions for staff: Fixed cost/running cost Materials to make goods: Production cost Equipment needed to make goods: Production cost Equipment maintenance and repair: Fixed cost/running cost Advertising: Fixed cost/running cost Petrol, license fees, repairs and insurance used by the business: Fixed cost/
running cost2. Answers will differ.
6.2 Investigation part 1: calculating costs of production and total cost price
Learner’s Book page 115
Learners discuss answers.
6.3 Practise calculating appropriate selling prices Learner’s Book page 117
1. a. R425,50 + (15% × 425,50) = R425,50 + R63,83 = R489,33 b. R425,50 + (45% × 425,50) = R425,50 + R191,48 = R616,98 c. R425,50 + (100% × 425,50) = R425,50 + R425,50 = R851,002. Cost to produce 20 ℓ ice cream: R120,00 Cost to produce 220 ml 220 ml = 0,22 ℓ = R120 ÷ 20 ℓ × 0,22 ℓ = R1,32 a. R1,32 b. R1,32 + (60% × R1,32) = R1,32 + R0,79 = R2,11 c. R1,32 + (180 × R1,32) = R1,32 + R2,88 = R3,70

77T E R M 1 • U N I T 6
3. a. i. 14 650 + (22% of 14 650)
________________ 6
= 14 650 + 3 223 __________ 6
= 17 873 _____ 6
= R2 978,83 per vehicle per month excluding VAT ii. Assuming the vehicle can be rented out every day of the month: 365 ÷ 12 = 30,42 ≈ 30 R2 978,83 ÷ 30 = R99,29 per vehicle per day excluding VAT
b. i. 14 650 + (60% of 14 650)
________________ 6
= 14 650 + 8 790 __________ 6
= 23 440 _____ 6
R3 906,67 per vehicle ii. Assuming 30 days per month: R3 906,67 ÷ 30 = R130,22 per vehicle per day
c. i. 14 650 + (100% of 14 650) ________________ 6
= 29 300 _____ 6
= R4 883,33 per vehicle per month ii. Assuming 30 days per month: R4 883,33 ÷ 30 = R162,784. CP = cost price SP = selling price P = profit rate
CP = SP ÷ (100 + P)
______ 100
a. CP = R8,55 ÷ (100 + 10)
_______ 100
= R8,55 ÷ 110 ___ 100
= R7,77 b. P = 33 CP = SP ÷ (100 + P)
______ 100
= R8,55 ÷ (100 + 33)
_______ 100
= R8,55 ÷ 133 ___ 100
= R6,43
c. P = 200 CP = R8,55 ÷ (100 + 200)
________ 100
= R8,55 ÷ 300 ___ 100
= R2,855. a. Assuming occupancy of three nights per week: R495 × 2 × 4 × 3
_ 7 × 365 × (100% + 30% profit) = R805 294,29 b. R495 × 2 × 4 × 3
_ 7 × 365 × (100% + 70% profit) = R1 053 077,14 c. R495 × 2 × 4 × 3
_ 7 × 365 × (100% + 150% profit) = R1 548 642,86

78 S E C T I O N 3 • W O R K E D A N S W E R S
6.4 Investigation part 2: Budget to achieve different percentage profits Learner’s Book page 119
Answers will differ.
6.5 Practise doing break-even analyses Learner’s Book page 122
1. a. i. R0,80 × x = R485 × 3 + (R0,80 × 5%)x 0,8x = R1 455 + 0,04x 0,76x = R1 455 x = 1 914,47 Round off to 1 915 downloads of any of the three songs. Note: The break-even analysis does not need to be calculated for
each song. It only needs to be calculated for the total number of downloads.
ii. R0,80 × x = R485 × 5 + (R0,80 × 5%) × x 0,80x = R2 425 + 0,04x x = 3 190,79 Round off to 3 191 The band would need 3 191 downloads of any of the five tracks to
break even. b.
1 000
1 000 2 000 3 000 4 000 5 000 6 000 7 000 8 000 9 000 10 000
Total income(R0,80 per download)
Total income(R0,65 per download; 3 tracks)
(R0,50 per download; 5 tracks)
Total cost; 5 tracks)
Total cost: 3 tracks)2 000
3 000
4 000
5 000
6 000
7 000
8 000
9 000
Amou
nt (R
)
Number of downloads
Break-even points If they sell individual songs at 0,80 each If they record 3 songs: approximately 2 050 downloads If they record 5 songs: approximately 3 500 downloads If they sell three songs at R0,65 each If they record 3 songs: 2 600 dowloads If they record 5 songs: 4 400 downloads If they sell 5 songs at R0,50 each; they must record 5 songs: this is
approximately 6 200 downloads.2. a. Total income = total costs R30 × x = R4 800 × 2 + R2 200 30x = R11 800 x = 393,33 Round off to 394. The barbers need to give 394 haircuts per month to break even (they
each need to give 197 haircuts to break even).

79T E R M 1 • U N I T 6
b. Assuming 4 weeks per month: Profit per month = price of haircut × 2 barbers × number of haircuts
per week × 4 weeks per month – total costs per month Profit = R30 × 2 × (15 × 5 + 10) × 4 – (R4 800 × 2 + R2 200) = R30 × 2 × 85 × 4 – R11 800 = R20 400 – 11 800 = R8 600 The barbers make a profit of R8 600 per month. c. i. One barber Total income = total costs R30 × x = R4 800 × 2 + R3 800 + R2 200 30x = R15 600 x = 520 haircuts per month to break even The barber needs to give 520 haircuts per month to break even. ii. Two barbers R30 × x = R4 800 × 2 + R3 800 + R2 200 30x = R19 400 x = 646,67 Round off to R647. The barbers would need to give 647 haircuts per month to break
even. d. i. Two permanent barbers (each gives 15 haircuts on weekdays and
10 haircuts on Saturdays) and one new barber (gives 15 haircuts each weekday):
Monthly profit = (price × number of haircuts per week × 4 weeks) – costs = {R30 × [4(3 × 15 × 5) + 2(10)]} – [2(R4 800) + R3 800 +
R2 200] = [R30 × [4(225 + 20] – (R9 600 + R3 800 + R2 200) = R30 × 4(245) – R15 600 = R30 × 980 – R15 600 = R29 400 – R15 600 = R13 800 ii. Two permanent barbers (each gives 15 haircuts per day and 10 on
Saturdays) and two new barbers (each gives 15 haircuts on each weekday):
Monthly profit = (price × number of haircuts per week × 4 weeks) – costs = {R30 × [4(4 × 15 × 5) + 2(10)]} – [2(R4 800) + 2(R3 800) +
R2 200] = [R30 × [4(300 + 20] – (R9 600 + R7 600 + R2 200) = R30 × 4(320) – R19 400 = R30 × 1 280 – R19 400 = R38 400 – R19 400 = R19 000
6.6 Investigation part 2: do break-even analyses for different small businesses
Learner’s Book page 122
Answers will differ.

80 S E C T I O N 3 • W O R K E D A N S W E R S
Revision and consolidation Learner’s Book page 124
1. a. The bank requires the following from the applicant: • identity document • original proof of residential address • latest salary • three months’ bank statements b. A multi-loan is a loan of up to R4 000 that is only for one month. It is
repayable in full each month. The amount requested is transferred to the person’s transaction or savings account using an ATM, cellphone or internet banking. Interest and fees are only charged when the money is transferred to the savings or transaction account. A loan can be as much as R230 000 over a period of 2 to 84 months. It is repayable in fixed monthly repayments.
c. The compound interest method is used. d. If you are retrenched, the insurance company will repay the amount
owing on the loan. You will not be required to pay back the loan. You will not be blacklisted by the credit agencies and it will be easier to cover your expenses without having to pay back the loan.
e. In addition to interest, you pay one initiation fee and a monthly service fee. (There is no credit life insurance.)
2. a. Yes, the 26-year-old must submit an ITR12. You must submit an ITR12 if you are under 65 years of age and received an income of more than R59 750 from one or more part-time jobs. The 26-year-old earns R95 850 from the two part-time jobs.
b. Yes, you must submit an ITR12 if you earned an income by letting property.
c. You need a working email address and access to a computer with internet access to submit your ITR12 by eFiling.
d,e. If you go to a SARS branch to file an ITR 12 electronically, you will need the following:
• your original ID or passport, a certified copy of the ID or passport; in the absence of an ID/Passport, an affidavit together with a temporary ID/passport
• original bank statement with bank stamp that is not older than three months
• original proof of address not older than three months with your name and residential address
• medical aid certificates and receipts • retirement annuity certificates • IRP5/IT3a certificates received from your employer • if you receive a travel allowance, your travel logbook • tax certificates in respect of investment income IT3(b) • if applicable, a completed confirmation of disability (ITR-00) • if applicable, information relating to capital gains transactions • if applicable, the approved voluntary disclosure programme
(VDP) agreement between yourself and SARS for years prior to 17 February 2010
• if applicable, financial statements for business income • any other documentation relating to income you received or
deductions you want to claim.

81T E R M 1 • U N I T 6
3. a. 8 × R75,44 = R603,52 (excl. VAT) per month R603,52 + 15% = R694,048 ≈ R694,05 (incl. VAT) per month Paid in total in 2018/19: R694,05 × 12 = R8 328,58 (incl. VAT) b. 5,5% c. R278,26 + 15% = 319,999 ≈ R320,00 (incl. VAT) per month for three
removals per week Weekly cost to a business with three containers that were emptied
once a week in 2019/20 (assuming four weeks per month): Cost per container per week: R95,11 ÷ 4 ≈ R23,78 Cost for three containers per week: R23,78 × 3 = R71,34 (excl. VAT) = R71,34 + 15% ≈ R82,04 (incl. VAT) d. Solid waste removal expenses for: 16 ordinary containers: Monthly costs for five removals per week of one container: R451,87 Monthly costs for the removal of 16 such containers: R451,87 × 16 = R7 229,92 Annual costs for the removal of 16 such containers: R7 229,92 × 12 = R86 759,04 Annual costs including VAT: R86 759,04 × 115% = R99 772,90 Three lockable containers: Monthly costs for removal of one container: R95,11 Monthly costs for the removal of three containers: R95,11 × 3 = R285,33 Weekly costs for removal of three such containers five times per week
(assuming four weeks per month): R71,33 × 5 = R356,65 Annual costs for the removal of three such containers: R356,65 × 52 weeks = R18 545,80 per year Annual costs including VAT: R18 545,80 × 115% = R21 327,67 Total waste removal expense for all containers: R99 772,90 + R21 327,67 = R121 100,57 (including VAT)4. a. i. Referees’ basic fees
R1 993 850 – R1 291 780 ________________ R1 291 780 × 100% = 54,35% ≈ 54%
Referees’ basic fees increased by 54%.
ii. Referees’ match fees
R4 505 320 – R4 897 475 ________________ R4 897 475 × 100% = –8,01% ≈ –8%
Referees’ match fees decreased by 8%. b. Gate-taking expenses
21 760 954 – 11 441 230 ________________ 11 441 230 × 100% = 90,2% ≈ 90%
Gate-taking expenses increased by 90%.

82 S E C T I O N 3 • W O R K E D A N S W E R S
c. The gate-taking fees did not change by the same percentage for all the competitions. The fees for the NFD playoffs decreased by almost 96%.
The fees for the premiership increased by over 19 564%, the Telkom Charity Cup increased by 421%, the MTN8 increased by almost 195%, and the Nedbank Cup increased by almost 51%.
d. The prize money for the Nedbank Cup decreased by R100 000. e. The three biggest expenses for 2011: Prize money: R79 150 000 Gate-taking expenses: R21 760 954 Board placements: R7 232 129 The main focus of PSL expenditure for competitions relates to the prize
money for the winners of competitions (which are sponsored), the costs incurred for gate-takings and for placing sponsorship boards at the grounds. Sponsors are therefore an important priority for the PSL.
5. a. Money distributed to clubs in: 2011: R300 million (19,5 ÷ 21 × 100 ≈ R93 million) 2007: R93 million Difference: R207 million The PSL distributed R207 million more as grants in 2011 than in 2007. b. 2011 prize money: 13,5 ÷ 21 × R100 ≈ R62 million 2010 prize money: 13 ÷ 21 × R100 ≈ R62 million 2009 prize money: 13 ÷ 21 × R100 ≈ R62 million 2008 prize money: 12 ÷ 21 × R100 ≈ R57 million 2007 prize money: 6,5 ÷ 21 × R100 ≈ R31 million 2007–2008: (57 – 31) ÷ 31 × 100% = 83,87% ≈ 84% 2008–2009: (62 – 57) ÷ 57 × 100% = 8,77% ≈ 9% 2009–2010: (62 – 62) ÷ 62 × 100% = 0% 2010–2011: (64 – 62) ÷ 62 × 100% = 3,23% ≈ 3% c. Total distribution to clubs in 2010: 71 million i. Grants
5,5 mm
_____ 71 mm × 100% = 77,46% ≈ 77%
ii. Prize money
13 mm _____ 71 mm × 100% = 18,31% ≈ 18%
iii. Participation fees
3 mm _____ 71 mm × 100% = 4,23% ≈ 4%
d. 2011 78,5 mm
______ 21 mm × R100 million
= R373,8 million ≈ R374 million
2007 27 mm _____ 21 mm × R100 million
= R128,57 million ≈ R129 million R374m – R179m
___________ R129m = R189,9%

83T E R M 1 • U N I T 7
6. a. R30 289 billion – R27 230 billion _____________________ R27 230 billion × 100%
= R3 059 billion _________ R27 230 × 100%
= 11,2% ≈ 11% b. i. Projected income for electricity (2012/2013): 11% of R8 971 405,00 = R8 971 405,00 + R986 854,55 = R9 958 259,55 ii. Projected income for water (2012/2013): 15,08% of R2 085 289,00 = R2 085 289 + R314 461,58 = R2 399 750,58 iii. Projected income for sanitation (2012/2013): 15,08% of R1 144 122,00 = R1 144 122,00 + R172 533,60 = R1 316 655,607. a. Answers should include: Expenses: fuel, oil, repairs, maintenance, fines Income: taxi fares, rentals for groups b. Answers will differ. Learners should include taxi fares for your town
or city.8,9. Learners discuss their answers.
Unit 7Data handlingLearner’s Book pages 131–176
Teaching tips• This unit revises the steps in a statistical investigation. Refer learners to
the flow diagram on page 131 in the Learner’s Book and discuss how the steps fit together – they should remember this from earlier grades. Make sure learners understand that the process is cyclical: in reality, the investigation does not stop after the results have been interpreted and analysed because the conclusions often lead to new questions.
• A key skill in statistics is the ability to ask the right questions. Learners need practice in learning to be very specific in the way they frame a research question. You could give them a few imaginary research questions and ask them to explain how the questions might be unclear or inappropriate.
• The tools that learners choose to use to collect data should fit the type of data they are collecting and the question they are asking. Surveys and questionnaires need to be carefully planned and designed if they are to be useful. Spend as much time as necessary looking at examples of questionnaires (printed ones and those designed by learners), critically discuss these to determine which elements are clear and useful and which are not.

84 S E C T I O N 3 • W O R K E D A N S W E R S
• Learners need to be able to organise the data they collect in order to make it easy to work with. Use the results from the national census carried out in 2011 as an example to illustrate how an investigation might result in masses of data. (For example, the census collected the gender, age and education levels of over 50 million South Africans.) Organising the data into frequency tables and representing it on graphs helps researchers to make sense of, and analyse, the data. You can find census data and publications from StatsSA at www.statssa.gov.za/census2011.
• Summary statistics should be familiar to the learners by now. Make sure they are able to calculate these statistics using tables as most of the examples they work with from now on are likely to involve multiples sets of data that are grouped in intervals.
• This year, learners will also divide the data into four equal groups (quartiles) and they will use the upper and lower quartile values to find the interquartile range of the data. This is a measure of how spread out the middle 50% of the data values are and it gives a more useful measure of spread because it is not affected by extreme values (outliers).
• Once learners understand the concepts related to quartiles, you can introduce them to box-and-whisker plots. These diagrams provide a five-figure summary of a set of data (they show the highest and lowest values and the quartiles) as well as any outliers. The shape of a box-and-whisker diagram also shows how the data is distributed. Learners do not have to construct box-and-whisker diagrams, but they must be able to read them and compare two or more sets of data presented in this way.
• Percentiles are also introduced in this topic. Here learners are introduced to the concept and shown how percentiles are used. They will need to use these concepts later when they work with growth charts that use percentiles in the measurement topics.
• Learners should be comfortable working with pie charts, bar graphs, histograms, line graphs and scatter plots. If they are uncertain about any of these representations, revise the basic skills using examples from the skills section before proceeding.
• This year, learners will work with multiple sets of data at the same time so they need to use graphs that can show many sets of data.
• Use the summary table on pages 159 and 160 in the Learner’s Book to highlight the advantages and disadvantages of different kinds of graph and encourage learners to use this to help them decide which type of graph is best suited to different sets of data that they collect and/or work with.
• Learners need to interpret and analyse data that they collect, but they also need to be able to critically interpret data that is presented by other people. One of the aims of the work in this unit is to help learners realise that data can be manipulated to give a misleading impression.
• Learners need to become critical consumers and informed citizens and one element of this is being critical when presented with statistics. Businesses often use statistics for marketing purposes to sell their products and they try to present them in ways that will convince as many customers as possible to buy their products. This is not to say organisations are dishonest, it is just to point out that the way you present something can affect how people see it. You may want to refer to some of the claims used in the probability section to illustrate this, but here is another example: A mattress company advertisement that was published in a South African newspapers in 2011 made the following claims:

85T E R M 1 • U N I T 7
• Point out to learners that the claims are interesting because they sound very mathematical and scientific. However, what do they actually mean? How do you measure, for example, that you are the fastest growing bedding brand in the world? Also, what does that mean – if your competitors increased their sales by 1% to earn $1 million and you increased your sales by 100% to earn $20 000 which is the faster growth? Also, ask questions such as: Why is it the only mattress to be endorsed? Did the mattress company pay for the endorsement? Did they sponsor the research? Incidentally, an internet search shows the research was carried out in 1993 (more than 20 years ago) and that it investigated spinal zone technology and not specific mattresses. These are all important pieces of information that can help you avoid accepting meaningless statistical claims.
• The investigation at the end of this topic involves collecting data and comparing it to data collected nationally. Learners must collect, organise, display and analyse data they collected before comparing it with national data and drawing conclusions about their investigation. They are expected to compile a report at the end of their investigation. You may want to allow the learners to work in small groups to do this investigation.
Solutions7.1 Practise developing questions and collecting data Learner’s Book page 133
1. a. Children less than two years of age are not included in the table. b. 6 782 children are included in the sample. The total is included in the
bottom of the table. c. The health services are classified as:
• public hospitals• private hospitals• public clinics or doctors• private clinics or doctors• others.
d. Traditional healers, homeopaths, alternative healers e. Public clinic or doctor (62,9%) f. 20,4% g. Neither; most children regardless of age go to a public clinic or doctor.2. a. Answers will differ. b. Examples of answers include: • What are the statistics for children aged 0 to 2? • What are statistics for children for the different age groups living
in urban, suburban and rural areas and informal settlements?
– The world’s fastest growing bedding brand – Clinical study proves you’ll sleep better:
▪ 29% improved sleep quality ▪ 34% reduced back pain ▪ 96% reduced back stiffness.
– Research results were documented in two separate scientific studies conducted by the Director of the Exercise Physiology and Human Performance Laboratory at XYZ University.
– The only mattress to be endorsed by the ABC chiropractors association.

86 S E C T I O N 3 • W O R K E D A N S W E R S
c. The general health of most South African children is very positive. 95,3% of females are rated as good or excellent. Only 0,6% of females are rated as poor. 92,2% of males are rated as good or excellent. Only 0,9% of males are rated as poor.
d. A greater proportion of male children aged 5 to 11 suffer from poor health (1,5%) than female children in the same age group (0,5%). A greater proportion of male children in this age group is considered to have fair health (7,3%) compared to female children of the same age.
In general, female children have much lower rates at fair health (4,2%) and poor health (0,6%) compared to male children (6,9% fair health and 0,9% poor health).
e. Children aged 12 to 14 is the healthiest age group with 95,3% of children at excellent and good health.
Sex Health status Sample size Percentage Quantity
Male Excellent 599 42,3 273
Good 599 53,0 298
Female Excellent 646 42,3 273
Good 646 53,0 342
total 1 245 1 186
1 185 ____ 1 245 × 100% = 95,3%
Simple average method
Age group (years)
Health status
Excellent Good Total
2–4 37,8% 56,3% 94,1%
5–11 33,7% 59,5% 93,1%
12–14 43,9% 51,4% 95,3%
15–18 46,6% 46,5% 93,1%
7.2 Practise planning an investigation and selecting a sample Learner’s Book page 135
1. You could get the statistics for road deaths and accidents for the past two years from the Ministry of Transport and provincial departments of transport. You could also get information from Arrive Alive about the frequency of their advertisements on television, radio and in the printed media.
In this case, the focus is on secondary data rather than gathering primary data. You could also collect data from motorists on their awareness of the Arrive Alive campaign and Ministry of Transport advertisements. To do this, you would need to select a sample of major routes, a representative series of days to carry out the survey (for example, weekdays and weekends) and a sample of vehicles that stop at the service stations on the routes.
2. a. For example, if the US dollar to rand exchange rate increases, how does the price of petrol in South Africa change?
• If the US dollar/rand rate goes up, does the petrol price go up? • If the US dollar/rand rate goes down, does the petrol price go
down?

87T E R M 1 • U N I T 7
b. Mandla could get the petrol price from the government (Department of Transport) or the Automobile Association (AA).
Dollar/rand exchange rates are available from the Ministry of Finance and the Reserve Bank. Economic monitoring agencies or organisations also provide this information, possibly at a cost.
3. a. The exchange rate for the rand/US dollar from January 2012 to July 2012 b. Four decimal places are given. c. January 2012: R7,80 to US$1 February 2012: R7,64 to US$1 March 2012: R7,66 to US$1 April 2012: R7,74 to US$1 May 2012: R8,40 to US$1 June 2012: R8,45 to US$1 July 2012: R8,20 to US$1 d. The rand price of the
US dollar decreases from January to early March. It then increases to the end of May and then decreases again in June and July; it forms an S curve.
e. You would expect to see a similar graph for the petrol price if there was a correlation between the rand/US dollar exchange rate and the petrol price.
7.3 Practise evaluating and designing a questionnaire Learner’s Book page 136
1. a. Learners discuss how to answer questions. b. The question is open-ended. The insured passengers need to give
specific answers. There are also instructions for the interviewer, such as prompts for the passenger to give the nearest landmark.
c. The passenger provides confidential information that could be used to prosecute the driver and that could put the passenger in danger.
2. Learners discuss suitable questions and a suitable methodology for a survey.
7.4 Practise working with frequency tables Learner’s Book page 140
1. a. i. 0 + 13 + 149 + 97 = 259 passenger vehicles ii. 14 + 11 + 9 + 3 + 3 + 1 = 41 passenger vehicles b. 2 + 4 + 2 + 1 + 1 + 0 = 13 minibus taxis and buses were breaking the
speed limit.
c. vehicles travelling over 100 km/h _____________________ total vehicles × 100% ÷ (total passenger vehicles + total minibus taxis and buses + total trucks and other heavy vehicles) × 100%
= 7 + 2 + 9 ______ 540 × 100%
= 3,33% ≈ 3%
January March May July
Price
Month
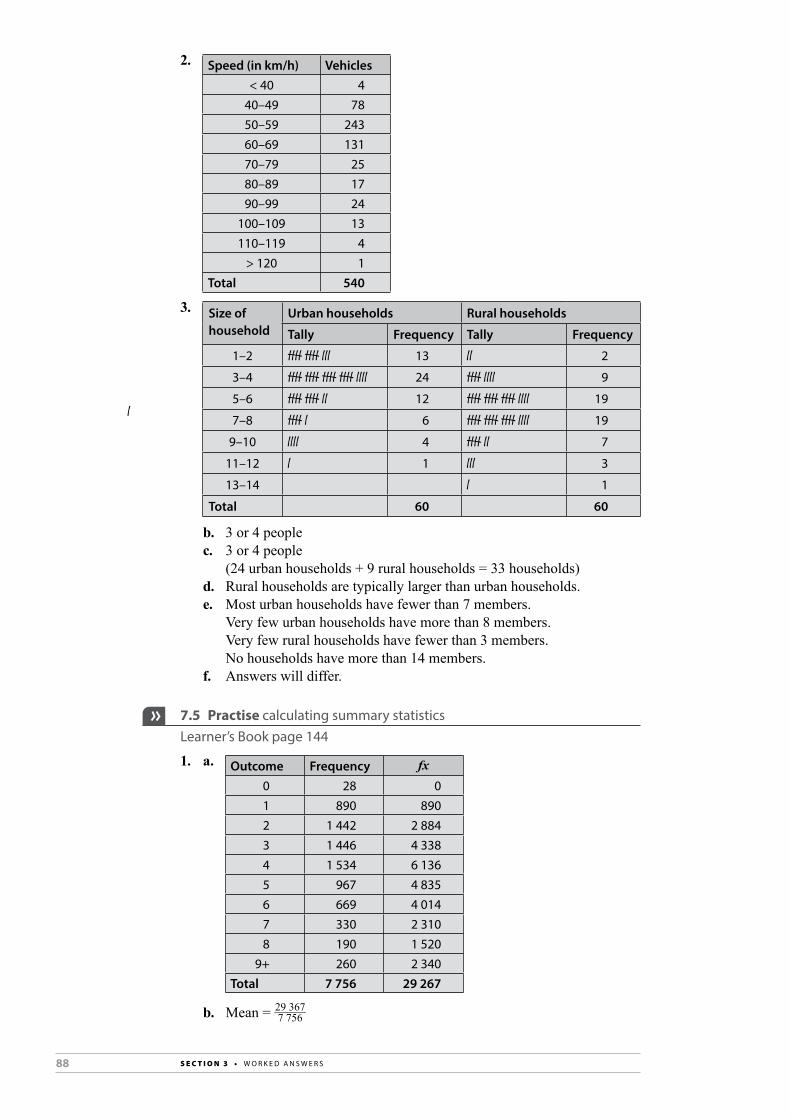
88 S E C T I O N 3 • W O R K E D A N S W E R S
2. Speed (in km/h) Vehicles< 40 4
40–49 7850–59 24360–69 13170–79 2580–89 1790–99 24
100–109 13110–119 4
> 120 1Total 540
3. Size of household
Urban households Rural households
Tally Frequency Tally Frequency
1–2 13 2
3–4 24 9
5–6 12 19
7–8 6 19
9–10 4 7
11–12 1 3
13–14 1
Total 60 60
b. 3 or 4 people c. 3 or 4 people
(24 urban households + 9 rural households = 33 households) d. Rural households are typically larger than urban households. e. Most urban households have fewer than 7 members. Very few urban households have more than 8 members. Very few rural households have fewer than 3 members. No households have more than 14 members. f. Answers will differ.
7.5 Practise calculating summary statistics Learner’s Book page 144
1. a. Outcome Frequency fx0 28 01 890 8902 1 442 2 8843 1 446 4 3384 1 534 6 1365 967 4 8356 669 4 0147 330 2 3108 190 1 520
9+ 260 2 340Total 7 756 29 267
b. Mean = 29 367 _____ 7 756

89T E R M 1 • U N I T 7
= 3,773 persons per household c. The mode is four persons per household.
d. Total median position: 7 756 ____ 2 = 3 878
28 + 890 + 1 442 + 1 446 = 3 806 28 + 890 + 1 442 + 1 446 + 1 534 = 5 340 Therefore, the median falls in the category with four persons per
household.2. a. i. US dollar ($): R7,90680 ii. British pound (£): R12,5205 iii. euro (€): R10,29959 b. i. US dollar ($): R7,48405 – R8,51880 ii. British pound (£): R11,90110 – R13,12244 iii. euro (€): R10,07290 – R10,53344 c. i. US dollar ($): R8,51880 – R7,48405 = 1,03475 ii. British pound (£): R13,12244 – R11,90110 = 1,22134 iii. euro (€): R10,53344 – R10,07290 = 0,46054 The British pound/rand exchange rate fluctuated the most. d. i. US dollar ($): (R7,78087 + R7,80125) ÷ 2 = R7,79106 ii. British pound (£): (R12,32411 + R12,63419) ÷ 2 = R12,47915 iii. euro (€): (R10,30327 + R10,31074) ÷ 2 = R10,30701 e. There are no values that are the same for all currencies.
7.6 Practise interpreting and analysing averages Learner’s Book page 145
1. Answers will differ.2. a. Africa 57,67 Europe 79,71 South/Central America 74,58 Asia 74,04 b. Africa 51,4 Europe 81,4 South/Central America 77,0 Asia 65,4 c. Africa 52,8 Europe 80,7 South/Central America 74,4 Asia 74,2 d. Africa 48,2 – 74,8 Europe 74,0 – 81,8 South/Central America 66,6 – 79,1 Asia 65,4 – 83,4 e. 48,2 to 83,4 f. Africa: The median is the most representative, as some countries have
very low life expectancies. Europe: The mean is the most representative, as there are not extreme
highs or lows. South/Central America: The median is the most representative, as
there is one extremely low value (Bolivia’s life expectancy). Asia: The median is the most representative, as there are two values
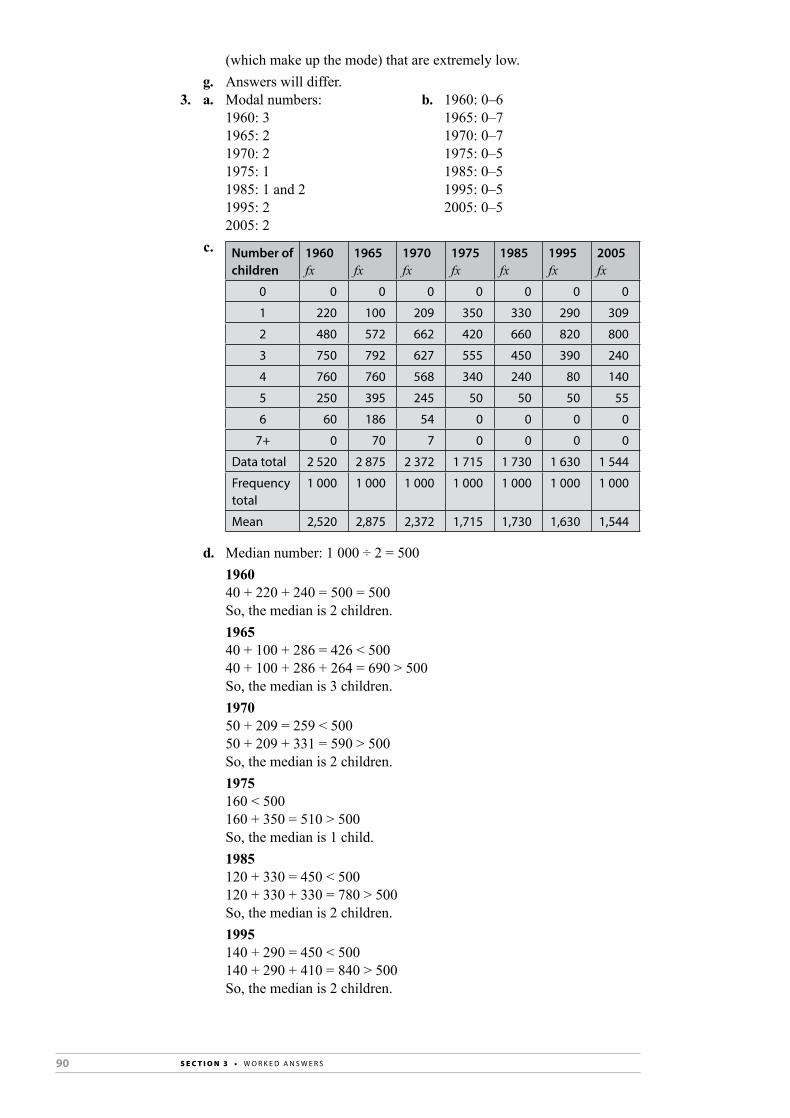
90 S E C T I O N 3 • W O R K E D A N S W E R S
(which make up the mode) that are extremely low. g. Answers will differ.3. a. Modal numbers: b. 1960: 0–6 1960: 3 1965: 0–7 1965: 2 1970: 0–7 1970: 2 1975: 0–5 1975: 1 1985: 0–5 1985: 1 and 2 1995: 0–5 1995: 2 2005: 0–5 2005: 2 c. Number of
children1960 fx
1965 fx
1970 fx
1975 fx
1985 fx
1995 fx
2005 fx
0 0 0 0 0 0 0 0
1 220 100 209 350 330 290 309
2 480 572 662 420 660 820 800
3 750 792 627 555 450 390 240
4 760 760 568 340 240 80 140
5 250 395 245 50 50 50 55
6 60 186 54 0 0 0 0
7+ 0 70 7 0 0 0 0
data total 2 520 2 875 2 372 1 715 1 730 1 630 1 544
Frequency total
1 000 1 000 1 000 1 000 1 000 1 000 1 000
Mean 2,520 2,875 2,372 1,715 1,730 1,630 1,544
d. Median number: 1 000 ÷ 2 = 500 1960 40 + 220 + 240 = 500 = 500 So, the median is 2 children. 1965 40 + 100 + 286 = 426 < 500 40 + 100 + 286 + 264 = 690 > 500 So, the median is 3 children. 1970 50 + 209 = 259 < 500 50 + 209 + 331 = 590 > 500 So, the median is 2 children. 1975 160 < 500 160 + 350 = 510 > 500 So, the median is 1 child. 1985 120 + 330 = 450 < 500 120 + 330 + 330 = 780 > 500 So, the median is 2 children. 1995 140 + 290 = 450 < 500 140 + 290 + 410 = 840 > 500 So, the median is 2 children.

91T E R M 1 • U N I T 7
2005 165 + 309 = 474 < 500 165 + 309 + 400 = 874 > 500 So, the median is 2 children. e,f. Answers will differ.
7.7 Practise working with quartiles and the interquartile range Learner’s Book page 148
1. a. Pumi scored in the bottom 25% of learners in her grade in the examinations.
b. The difference between the highest and lowest marks in Mathematical Literacy in the country was 85%. The range for the middle 50% of learners – the 25% of learners below the median and the 25% of learners above the median was only 20%.
c. Nabu was in the top 25% of learners in her grade last year. d. The median mark for Math Literacy was 71%. e. 25% of learners scored below 50% for Mathematical Literacy. f. The interquartile range includes only the middle 50% of the values
and it does not include the very high or very low values (outliers).2. a. Median number = 300 ÷ 2 = 150 (average of values 150 and 151) b. Q1: 150 ÷ 2 = 75 (values 75 and 76) Q3: 150 ÷ 2 + 150 = 225 (values 225 and 226) c. Q1: 500 learners: 11 + 34 + 12 + 19 = 76 Q3: 800 learners: 11 + 34 + 12 + 19 + 33 + 80 + 63 = 226 d. 1 000 – 200 = 800 e. Q3 – Q1 = 800 – 500 = 300
f. 11 + 43 + 12 + 19 ___________ 300 × 100% = 25,33%
≈ 25% g. 25%
h. 63 + 43 + 5 ________ 300 × 100% = 111
___ 300 × 100% = 37%
3. a. 93 – 34 = 59 b. 57,1 c. 34; 49; 51; 54; 55; 56; 59; 59; 61; 93
55 + 56 _____ 2 = 111
___ 2 = 55,5
d. Q1: 5 ÷ 2 = 2,5 This is values 2 and 3.
49 + 51 _____ 2 = 100
___ 2 = 50
Q3: 5 ÷ 2 + 5 = 7,5 This is values 7 and 8.
59 + 59 _____ 2 = 59
e. 59 – 50 = 9 f. The interquartile range of only 9 compared to a range of 59 indicates
that Maryam’s scores include high and low outliers (the scores of 34% and 93%). She typically scores between 50% and 59% in tests.

92 S E C T I O N 3 • W O R K E D A N S W E R S
7.8 Practise locating values on box-and-whisker plots Learner’s Book page 151
1. a. 4 years b. 25% c. 25% d. 23 – 0 = 23 e. 12 – 2 = 10 f. Answers will differ. g. 25% of 2 600 = 650 650 teachers have between two and four years’ teaching experience.2. a. There is an outlier that is very low. This represents a technical college
with few students enrolled in diploma courses. b. 1 200 – 360 = 840 c. 750 d. 1 200 e. 880 – 600 = 240 f. The median is 750 students so the minister’s statement is correct.
More than half of the technical colleges have 700 or more students. g. Yes. Q1 is equal to 600 students. The 25% of technical colleges in the
lowest quartile (Q1) have fewer than 600 students.
7.9 Practise interpreting box-and-whisker plots Learner’s Book page 153
1. a. Median: 27,1 Range: 32 – 22,4 = 9,6 (9 minutes 36 seconds) Interquartile range: 27,8 – 25,6 = 2,2 (2 minutes 12 seconds) b. The distribution has a negatively skewed distribution, although there
is a long tail on the right of the distribution graph.2. a. The median is approximately 63,1 (or 64%). b. 95% – 34% = 61% c. Learners discuss the answer. 3. a. 1,65 m b. 1,6 m c. Girls: 1,875 – 1,5 m = 0,375 m Boys: 1,810 – 1,48 m = 0,33 m The girls have a larger range. d. Girls: 1,69 – 1,61 = 0,08 m Boys: 1,65 – 1,55 = 0,1 m The boys have a slightly larger interquartile range at 10 cm compared
to the girls, at 8 cm. Comments will differ. e. Answers will differ. 4. a. Test 1 The median: 78%. The range: 87% – 74% = 13% The first quartile (Q1): 77% The third quatile (Q2): 82% The interquartile range: 5% The distribution is positively skewed.
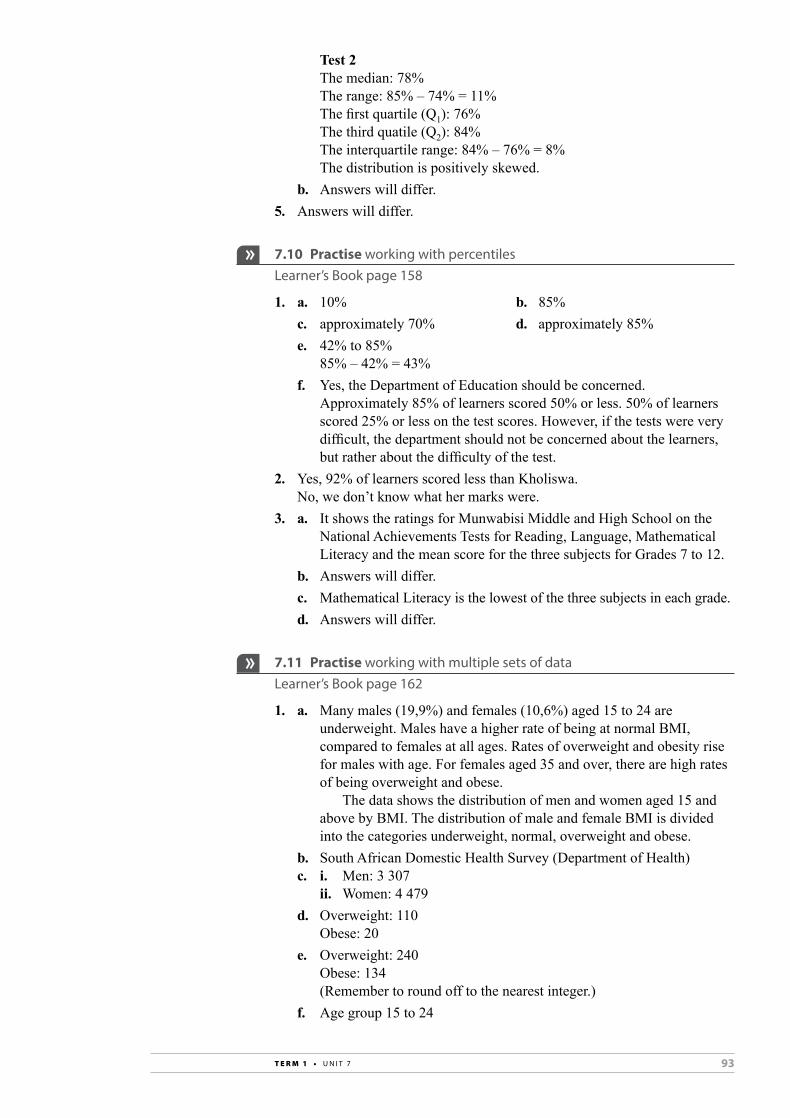
93T E R M 1 • U N I T 7
Test 2 The median: 78% The range: 85% – 74% = 11% The first quartile (Q1): 76% The third quatile (Q2): 84% The interquartile range: 84% – 76% = 8% The distribution is positively skewed. b. Answers will differ. 5. Answers will differ.
7.10 Practise working with percentiles Learner’s Book page 158
1. a. 10% b. 85% c. approximately 70% d. approximately 85% e. 42% to 85% 85% – 42% = 43% f. Yes, the Department of Education should be concerned.
Approximately 85% of learners scored 50% or less. 50% of learners scored 25% or less on the test scores. However, if the tests were very difficult, the department should not be concerned about the learners, but rather about the difficulty of the test.
2. Yes, 92% of learners scored less than Kholiswa. No, we don’t know what her marks were.3. a. It shows the ratings for Munwabisi Middle and High School on the
National Achievements Tests for Reading, Language, Mathematical Literacy and the mean score for the three subjects for Grades 7 to 12.
b. Answers will differ. c. Mathematical Literacy is the lowest of the three subjects in each grade. d. Answers will differ.
7.11 Practise working with multiple sets of data Learner’s Book page 162
1. a. Many males (19,9%) and females (10,6%) aged 15 to 24 are underweight. Males have a higher rate of being at normal BMI, compared to females at all ages. Rates of overweight and obesity rise for males with age. For females aged 35 and over, there are high rates of being overweight and obese.
The data shows the distribution of men and women aged 15 and above by BMI. The distribution of male and female BMI is divided into the categories underweight, normal, overweight and obese.
b. South African Domestic Health Survey (Department of Health) c. i. Men: 3 307 ii. Women: 4 479 d. Overweight: 110 Obese: 20 e. Overweight: 240 Obese: 134 (Remember to round off to the nearest integer.) f. Age group 15 to 24

94 S E C T I O N 3 • W O R K E D A N S W E R S
g. Ages 45–54 and 65+ h.
2. a. Year Mpumalanga KZN
2005 3 077 1 220
2006 4 558 1 236
Total 7 635 2 456
b. No, the statistics are not the same for sources A and B for Mpumalanga and KZN. Source A uses different time periods: 2004/5, 2005/6 and 2006/7.
c. There are more fatalities when there are more cases of malaria infection. However, there is no direct proportion between the two statistics. Reasons will differ.
d. Learners’ graphs may vary in terms of scale, but they should all follow the general pattern shown in the graph below.
e. In KwaZulu-Natal, the malaria cases were very high to start with, these dropped rapidly from 1999 to 2002 before rising slightly in 2003, however, they dropped again after that to a low level. In Mpumulanga, the number of cases was lower to start with. The number of cases dropped in 2004 before rising slightly in 2005. Since 2001, the number of cases in Mpumulanga has been slightly higher than the number of cases in KZN (except for the 2003 season in KZN).
f. Learners could either choose a compound bar graph or a multiple line graph to show this data. A graph they could draw is given on the next page
x
y
Underweight Normal Overweight Obese
10
0
20
30
40
50
60
70
Graph to compare the percentages of men and womenaged 15–24 in di�erent BMI categories
Category
Perce
ntag
e
MenWomen
x
y
1999–2000
2000–2001
2001–2002
2002–2003
2003–2004
2004–2005
2005–2006
2006–2007
20
10
0
40
30
50
Malaria season
Num
ber o
f cas
es (t
hous
ands
)
Key:KwaZulu-NatalMpumalanga
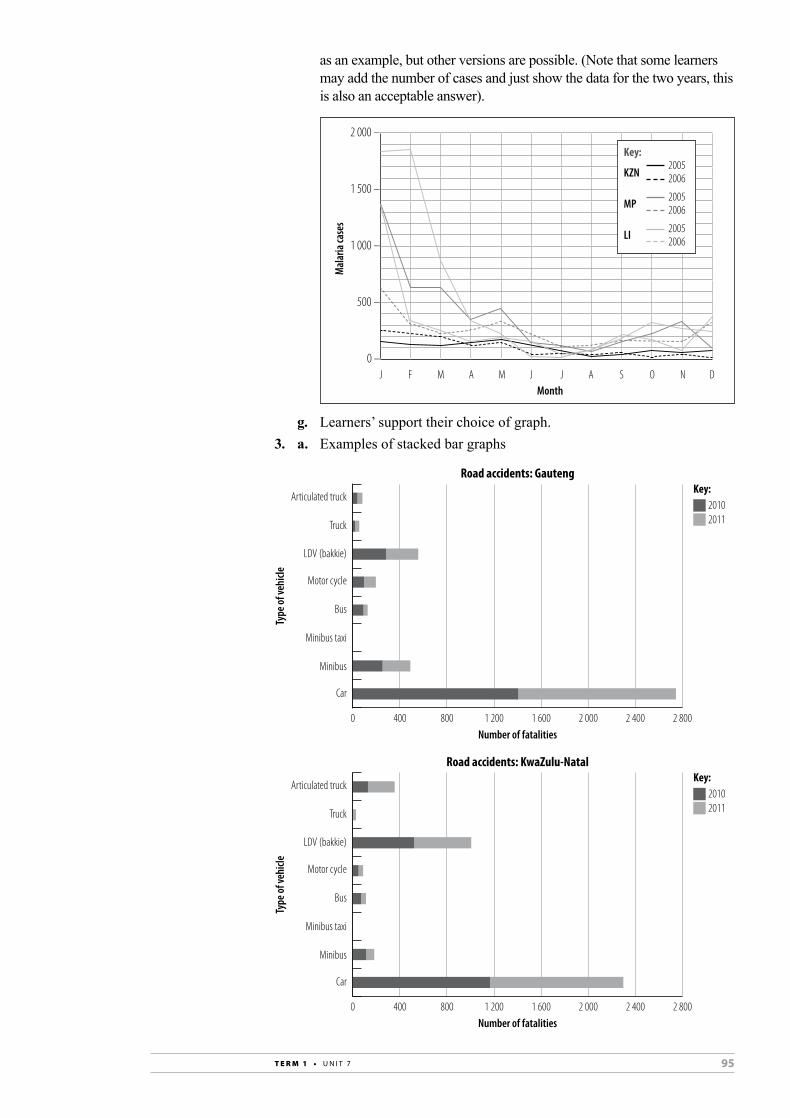
95T E R M 1 • U N I T 7
as an example, but other versions are possible. (Note that some learners may add the number of cases and just show the data for the two years, this is also an acceptable answer).
Mal
aria
case
s
2 000 –
1 500 –
1 000 –
500 –
0 –J F M A M J J A S O N D
Month
KZN20052006
MP 20052006
LI 20052006
Key:
g. Learners’ support their choice of graph.3. a. Examples of stacked bar graphs
0 400 800 1 200Number of fatalities
Type
of ve
hicle
1 600 2 000 2 400 2 800
Road accidents: Gauteng
Articulated truck
Truck
LDV (bakkie)
Motor cycle
Bus
Minibus taxi
Minibus
Car
Key:20102011
0 400 800 1 200Number of fatalities
Type
of ve
hicle
1 600 2 000 2 400 2 800
Road accidents: KwaZulu-Natal
Articulated truck
Truck
LDV (bakkie)
Motor cycle
Bus
Minibus taxi
Minibus
Car
Key:20102011
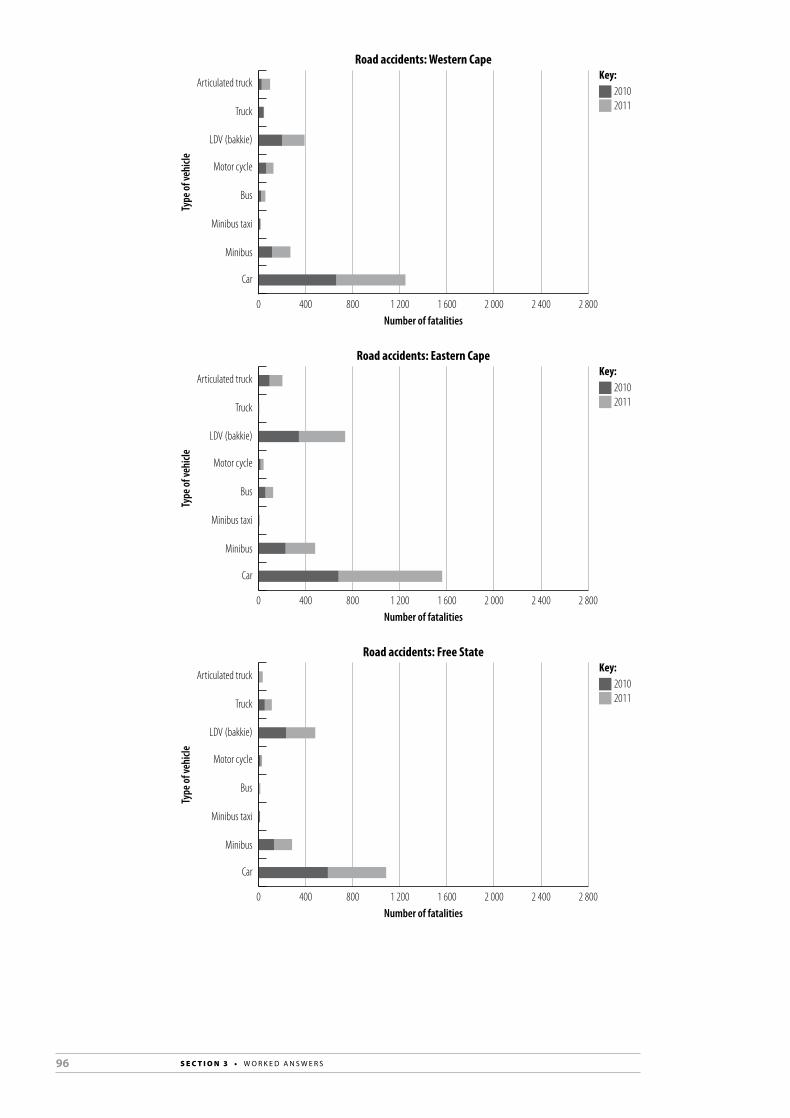
96 S E C T I O N 3 • W O R K E D A N S W E R S
0 400 800 1 200Number of fatalities
Type
of ve
hicle
1 600 2 000 2 400 2 800
Road accidents: Western Cape
Articulated truck
Truck
LDV (bakkie)
Motor cycle
Bus
Minibus taxi
Minibus
Car
Key:20102011
0 400 800 1 200Number of fatalities
Type
of ve
hicle
1 600 2 000 2 400 2 800
Road accidents: Eastern Cape
Articulated truck
Truck
LDV (bakkie)
Motor cycle
Bus
Minibus taxi
Minibus
Car
Key:20102011
0 400 800 1 200Number of fatalities
Type
of ve
hicle
1 600 2 000 2 400 2 800
Road accidents: Free State
Articulated truck
Truck
LDV (bakkie)
Motor cycle
Bus
Minibus taxi
Minibus
Car
Key:20102011

97T E R M 1 • U N I T 7
0 400 800 1 200Number of fatalities
Type
of ve
hicle
1 600 2 000 2 400 2 800
Road accidents: Mpumalanga
Articulated truck
Truck
LDV (bakkie)
Motor cycle
Bus
Minibus taxi
Minibus
Car
Key:20102011
0 400 800 1 200Number of fatalities
Type
of ve
hicle
1 600 2 000 2 400 2 800
Road accidents: Northwest
Articulated truck
Truck
LDV (bakkie)
Motor cycle
Bus
Minibus taxi
Minibus
Car
Key:20102011
0 400 800 1 200Number of fatalities
Type
of ve
hicle
1 600 2 000 2 400 2 800
Road accidents: Limpopo
Articulated truck
Truck
LDV (bakkie)
Motor cycle
Bus
Minibus taxi
Minibus
Car
Key:20102011

98 S E C T I O N 3 • W O R K E D A N S W E R S
b. The size of learners’ pie charts will vary, but the angles should be the same as the one below.
Articulated truck
Truck
LDV (bakkie)
Motor cycleBus
Minibus taxiMinibus
Car
OtherSouth Africa: fatalities by type of vehicle
c. Learners’ bar graphs will vary depending on the scale they use and whether they use a vertical or horizontal bar graph. The general trend should be similar to the one below.
0 400 800 1 200Number of fatalities
Type
of ve
hicle
1 600 2 000 2 400 2 800
Road accidents: Northern Cape
Articulated truck
Truck
LDV (bakkie)
Motor cycle
Bus
Minibus taxi
Minibus
Car
Key:20102011
0
500
1 000
1 500
2 000
Road accidents in 2004
Num
ber o
f fat
aliti
es
Key:LDV (bakkie)MinibusCar
GA KZN WC EC FS MP NW LI NC
Province

99T E R M 1 • U N I T 7
d. Learners’ double bar graphs will vary depending on the scale they use and whether they use a vertical or horizontal bar graph. The general trend should be similar to the one below.
4 a.
Reac
tion t
ime (
s)
3
2
1
0 0,1 0,2 0,3 0,4 0,5 0,6 0,7 0,8Blood alcohol (g/100ml)
b. There is a strong positive correlation. The more you drink, the longer the reaction time.
c. i. Between 0,27 g/100 ml and 0,37 g/100 ml ii. No, reaction times at that level are almost double the safe reaction
time. iii. Answers may differ. This could depend on religious and other
opinions. However, statistically, a blood alcohol level of 0,2 g/100 ml would meet the criteria for safe reaction times. This is the legal limit in some countries, although other countries (such as the United Kingdom) have a limit of 0,8 g/100 ml with higher restrictions (no alcohol at all) on certain types of driver (for example, those who drive public transport, ambulances or police vehicles).
7.12 Practise critically interpreting and analysing data Learner’s Book page 67
1. a. The number of cases of malaria The intervals on the axis are in 10 000s. b. The number of deaths from malaria The intervals are in 50s.
0
500
1 000
1 500
2 000
2 500
Province
3 000
Road accidents: total fatalities in 2010 and 2011
KZNGA WC EC FS MP NW LI NC
Key:20102011
Num
ber o
f fat
aliti
es
100 S E C T I O N 3 • W O R K E D A N S W E R S
c. i. 1971: fewer than 1 000 ii. 2000: 62 000 iii. 2007: about 8 000 d. i. 1971: fewer than 10 ii. 2000: about 425 iii. 2007: about 55 e. The number of cases and deaths from malaria were low from 1971 to
1995. With the introduction of synthetic pyrethroids in 1996, malaria cases and deaths increased rapidly and peaked in 2000 when DDT was reintroduced in South Africa. The number of cases and deaths then declined rapidly, and from 2001 to 2007 levelled off although at a higher rate than prior to 1997.
f. No, it was not successful. The numbers of cases of malaria and deaths as a result of malaria increased after the introduction of synthetic pyrethroids.
g. There may have been more mosquitoes in 1999 and 2000 as a result of the rain. More mosquitoes (which lay their eggs in stagnant water) would mean a greater chance of malaria being spread.
h. The number of malaria cases declined from a peak of over 60 000 in 2000 to 15 000 cases in 2002, and 49 incidences between 2002 and 2007.
i. i. The death rate looks very high as a different scale (on the right of the graph) is used.
ii, iii. Answers will differ. Learners should motivate their answers clearly.
j. Answers will differ.2. a. KZN (from 1988 to 2001) In 2002 and 2003, KZN had the lowest rates. b. KZN: approximately 41 000 Limpopo: approximately 9 000 Mpumalanga: approximately 13 750 c. Approximately 63 750 d. Answers will differ. e. The trend is similar to that of the graph in question 1. However, the
increase in incidents from 1997 to 1999 is not as apparent as shown in the graph in question 1.
3. a. The number of cases of malaria infection in KZN b. The number of deaths (fatalities) from malaria infection in KZN c. 0,5% fatalities d. 0,9% e. 0,9% × 2 000 cases = 18 f. The case fatality rate has risen. A possible reason is drug-resistant
malaria that does not respond well to treatment.4. a. The proportion of people in each regional continent who is at risk and
at high risk from malaria infection b. The Americas c. Malaria is not found in Europe. d. Suspected cases of malaria infection and probable and confirmed cases
of malaria e. Learners complete copies of table and discuss their answers.

101T E R M 1 • U N I T 7
f. Americas Reasons will differ.
7.13 Investigation: Are learners at your school at risk of being exposed to second-hand tobacco smoke?
Learner’s Book page 170
Investigations will differ.
Revise and consolidate Learner’s Book page 199
1. a. Mode b. A bar graph c. A box-and-whisker diagram d. Percentile2. a. The range is the difference between the highest and lowest values
in the data set. The interquartile range is the range between the first quartile (Q1) and the third quartile (Q3). This measures the middle 50% of values and excludes outliers.
b. A quartile of a set of data is the 25th, 50th or 75th percentile. The lower quartile is the value that has the lowest quarter (25%) of values in the data set below it. The upper quartile has 75% of the values below it.
3. a. 68 b. The score of 141 is an outlier: an extreme score. c. 99 d. lower quartile: 91 upper quartile: 107 interquartile range: 107 – 91 = 16 e. i. 99 ii. 91 iii. 105 to 1274. a. 95% of persons in his age group are shorter than Malusi. b. Sindi scored more than 80% of the other students in her music exam.
Sindi scored in the top 20% of students.5. a. Sum of all scores: 2 655 Data set: 60 Mean: 44,25 b. Highest value: 70 Lowest value: 32 Range: 70 – 32 = 38
c. Ear length Tally Frequency
26–30 0
31–35 6
36–40 15
41–45 22
46–50 9
51–55 7

102 S E C T I O N 3 • W O R K E D A N S W E R S
Ear length Tally Frequency
56–60 0
61–65 0
70 1
Total 60
d.
26–30 31–35 36–40 41–45 46–50 51–55 56–60 61–65 66–700
5
10
15
20
Freq
uenc
y
Ear length (mm)x
y
6. a,b. Answers will differ.7. a. Male: 25,64% Female: 16,32% b. 4 949 × 25,64% = 1 269 5 148 × 16,32 = 840 c.
d–f. Answers will differ.8. a. The first graph shows the racial distribution (by percentage) of
different levels of education. The second graph shows the level of education (by percentage) for
black Africans, coloureds, Indians/Asians and whites. b. Answers will differ.
M M
Perce
ntag
e of l
earn
ers
60
70
50
40
30
20
10
0M F M F M F M F M F M F M F M F M FEastern
CapeFreeState
Gauteng KwaZulu-Natal
Province
Limpopo Mpuma-langa
NorthernCape
NorthWest
WesternCape
Learners who have taken part in, watched or tried to stop a �ght at school
Key:MaleFemale

103T E R M 2 • U N I T 1
3. a. Answers will differ.
c. 17,15 c
d. 17,15 d
TERM 2
WORKED ANSWERS
The concepts, methods and scenarios in Unit 1 (Interest and interest rates) and Unit 2 (Banking, loans and investments) are closely related. You may choose to work through the examples and activities in the order in which they are given in each unit, or to select sections of the units for learners to do together – for example, interest rate calculations in Unit 1 and related activities in Unit 2 that have to do with a particular investment or loan scenario.
Unit 1Interest and interest ratesLearner’s Book pages 178–203
Teaching tips• In Grade 10 and Grade 11, learners were introduced to the concepts of
simple interest or compound interest, and they learned how to use given interest rates to calculate interest on loans and investments (savings). This unit begins by revising the main methods involved in these calculations, as well as the terminology used to talk about interest. You can use these revision activities as a form of baseline assessment of learners’ knowledge and skills in this section.
• Learners need to be able to analyse scenarios that involve changing interest rates and changing balances in savings or investment accounts. The ability to calculate balances and interest amounts is important, but so is the ability to explain verbally and/or in writing which changes are involved in each situation – encourage learners to discuss and report on the activities so that you can check that they have grasped each concept fully.
• Using graphs to show and compare interest scenarios will draw on learners’ skill at drawing and interpreting graphs, as taught in Grade 10 and Grade 11 and developed further this year. Link the activities in this section to other work with graphs that learners do, and add more scenarios that are relevant if learners need further practice.
• All the major South African banks have websites that provide descriptions of loan and investment accounts, with examples of the payments or earnings involved. You will find additional source material for activities on these websites if you think learners need more practice in developing their calculation and analysis skills.
• In the section relating to long-term investments, encourage learners to debate the value of a special product such as a funeral plan, as compared to a savings or investment account. They should consider whether the special product offers benefits that are different from a bank account (for example, helping people to be disciplined enough to save, by committing them to a regular monthly amount) or disadvantages (for example, perhaps the financial benefit would be greater in an investment account).

104 S E C T I O N 3 • W O R K E D A N S W E R S
• In the section on long-term debt, learners should consider the benefits and disadvantages of being committed to long-term loan agreements such as a hire purchase (HP) or a home loan. They need to understand that the real cost of a debt may be much higher than the initial loan amount, and discuss how a person can plan for such a scenario if they have to take out this type of loan. The example in the unit of repaying a home loan with bigger monthly repayments is an important way to illustrate how personal financial discipline can be of benefit in the long run.
Solutions1.1 Practise calculating simple and compound interest Learner’s Book page 186
1. Investor Principal Interest rate (p.a.)
Term Closing balance
Bongani r12 000 14,0% 48 months r18 720,00
Steven r4 720 9,2% 12 years r9 930,88
nazim r2 800 6,35% 5 years r3 689,00
Francois r1 765 10,1% 30 months r2 210,66
Kgomotso r1 350 8,0% 18 months r1 512,00
thobeka r1 000 7,75% 2 years r1 155,00
Jocelyn r800 4,2% 8 years r1 068,80
Wandi r530 22,5% 3 years r887,75
2. a. Compound interest rate: 4,85% Month 1 R170 000 + (R170 000 × 4,85% × 1
__ 12 ) = R170 000 + R687,08 = R170 687,08 Month 2 R170 687,08 + (R170 687,08 × 4,85% × 1
__ 12 ) = R170 687,08 + R689,86 = R171 376,94 Month 3 R171 376,94 + (R171 376,94 × 4,85% × 1
__ 12 ) = R171 376,94 + R692,65 = R172 069,59 Month 4 R172 069,59 + (R172 069,59 × 4,85% × 1
__ 12 ) = R172 069,59 + 695,45 = R172 765,04 Month 5 R172 765,04 + (R172 765,04 × 4,85% × 1
__ 12 ) = R172 765,04 + R698,26 = R173 463,30 Month 6 R173 463,30 + (R173 463,30 × 4,85% × 1
__ 12 ) = R173 463,30 + R701,08 = R174 164,38

105T E R M 2 • U N I T 1
Month 7 R174 164,38 + (R174 164,38 × 4,85% × 1
__ 12 ) = R174 164,38 + R703,91 = R174 868,29 Month 8 R174 868,29 + (R174 868,29 × 4,85% × 1
__ 12 ) = R174 868,29 + R706,76 = R175 575,05 b. Capital amount R45 000,00 Period 18 months Interest rate 4,65% Final amount R48 244,30 c. Loan I Capital R75 000 Period 3 years (36 months) Interest rate 5,35% Final amount R88 025,93 Interest payments R88 025,93 – R75 000 = R13 025,93 Loan II Capital R175 000 Period 3 months Interest rate 4,40% Final amount R176 932,07 Interest payments R176 932,07 – R175 000 = R1 932,07 The first loan will cost more in interest payments for 36 months. d. The loans of R60 000 for 18 months – if allowed by the bank – would
be cheaper, because the interest rate would only be 4,8% p.a. The total interest charged for the two loans would be R8 940,12. The interest rate charged for the loan of R120 000 for 18 months would be 5,15% (which is greater than 4,8%). The total interest charged for this loan would be R9 616,03.
3. a. Month Income Opening balance
35% added to savings account
Interest earned
Closing balance
Jan r5 449,00 0 r1 907,15 r11,52 r1 918,67
Feb r5 212,00 r1 918,67 r1 824,20 r22,61 r3 765,48
Mar r6 830,00 r3 765,48 r2 390,50 r37,19 r6 193,17
Apr r5 926,00 r6 193,17 r2 074,10 r49,95 r8 317,22
May r7 256,00 r8 317,22 r2 539,60 r65,59 r10 922,41
Jun r6 784,00 r10 922,41 r2 374,40 r80,33 r13 377,14
Jul r5 937,00 r13 377,14 r2 077,95 r93,37 r15 548,46
Aug r6 088,00 r15 548,46 r2 130,80 r106,81 r17 786,07
Sep r6 375,99 r17 786,07 r2 231,60 r120,94 r20 138,61
oct r7 253,00 r20 138,61 r2 538,55 r137,01 r22 814,17
nov r7 794,00 r22 814,17 r2 727,90 r154,32 r25 696,39
dec r5 201,00 r25 696,39 r1 820,35 r166,25 r27 682,99
Note: Interest is calculated as follows: (opening balance + 35% of deposit) × interest rate × 1
__ 12

106 S E C T I O N 3 • W O R K E D A N S W E R S
b. Closing balance R27 682,99 Total deposits – R26 637,10 Interest earned R1 045,894. a. 10 July 2010 b. Statement A: 31 August 2011 Statement B: 29 February 2012 c. 8,5% p.a. d. The closing balance for statement A (31 August 2011) is the opening
balance for statement B (29 February 2012). The closing balance for statement B equals the opening balance plus the interest earned at a rate of 8,5% p.a. on the capital amount (the opening balance) for the six months September 2011 to February 2012.
e. 31 August 2011 to 29 February 2012: 6 months R4 080,55 × 8,5% × 6
__ 12 = R173,42
5. a. R564,20 × 0,25% × 1 __ 12 = R0,12
b. Month Opening balance
Deposit Interest earned
Interest rate*
Closing balance
Feb. r37 450,65 – r15,60 0,50% r37 466,25
Mar. r37 466,25 – r15,61 0,50% r37 481,96
Apr. r37 481,86 r5 400,00 r17,87 0,50% r42 899,73
May r42 899,73 – r17,87 0,50% r42 917,60
Jun. r42 917,60 – r17,88 0,50% r42 935,48
Jul. r42 935,48 – r17,89 0,50% r42 953,37
* Credit balance
c. Month Balance Interest charged
Interest rate*
Closing balance
May r7 226,80 r108,40 18% r7 335,20
June r7 335,20 r110,03 18% r7 445,23
July r7 445,23 r111,68 18% r7 556,91
* Debit balance She would own R7 556,91 at the end of July. d. Interest calculated at the end of the month on the closing balance
Statement period
Opening balance
Purchases Payments Subtotal Interest paid
Interest rate
Closing balance
Mar.–Apr. – 984,30 800,00 184,30 2,76 18% 187,06
Apr.–May 187,06 1 278,45 1 000,00 465,51 6,98 18% 472,49
May.–Jun. 472,49 3 400,20 2 000,00 1 872,69 28,09 18% 1 900,78
Jun.–Jul. 1 900,78 621,85 800,00 1 722,63 25,84 18% 1 748,47
Jul.–Aug. 1 748,47 733,90 800,00 1 702,37 25,24 18% 1 727,61
Aug.–Sep. 1 727,61 4 260,56 3 000,00 2 988,17 44,82 18% 3 032,99
Interest paid: R133,73 e. A debit balance of R3 032,99 on 8 September

107T E R M 2 • U N I T 1
6. a. Robert pays 6,6% interest.
Month Opening balance Interest Closing balance
Jun. 2 500,00 13,75 2 513,75
Jul. 2 513,75 13,83 2 527,58
Aug. 2 527,58 13,90 2 541,48
Sep. 2 541,48 13,98 2 555,46
oct. 2 555,46 14,06 2 569,52
nov. 2 569,52 14,13 2 583,65
dec. 2 583,65 15,50 2 599,15
Jan. 2 599,15 15,59 2 614,74
Feb. 2 614,74 15,69 2 630,43
Interest paid: R130,43 b. Wandile receives 4,7% interest.
Year Capital Interest rate Interest Closing balance
1 30 000,00 4,8% 1 440,00 31 440,00
2 31 440,00 4,8% 1 509,12 32 949,12
3 32 949,12 4,8% 1 581,56 34 530,68
4 34 530,68 4,8% 1 657,47 36 188,15
5 36 188,15 4,8% 1 737,03 37 925,18
6 37 925,18 4,2% 1 592,86 39 518,04
7 39 518,04 4,2% 1 659,76 41 177,80
8 41 177,80 4,2% 1 729,46 42 907,26
9 42 907,26 4,2% 1 802,11 44 709,37
10 44 709,37 4,2% 1 877,79 46 587,16
Interest earned: R16 587,16
1.2 Practice using graphs to show and compare interest growth Learner’s Book page 192
1. a.
b. The interest on the loans from Uncle Thomas and Pumezo are the cheapest.
c. Answers will differ. 2. Answers will differ.
0
10 000
20 000
30 000
40 000
50 000
60 000
70 000
80 000
90 000
1 3 5 7 9 11 13 15 17 19Time period (months)
Amou
nt (R
)
21 23 25 27 29 31 33 35 37
Uncle ThomasPumezo
Aunt Lulama
Moelatsi

108 S E C T I O N 3 • W O R K E D A N S W E R S
1.3 Practice calculating real costs of long-term loans Learner’s Book page 202
1. a. Real cost Deposit + total instalments R287 500 × 10% + R8 100 × 36 months = R28 750 + R291 600 = R320 350 Interest paid HP price – cash price R320 350 – R287 500 = R32 850
b. Real cost Deposit + total instalments = R12 000 + R5 650 × 24 months = R12 000 + R135 600 = R147 600 Interest paid HP price – cash price = R147 600 – R128 250 = R19 350
c. Real cost Deposit + total instalments = R337 900 × 12% + R9 200 × 36 months = R40 548 + R331 200 = R371 748 Interest paid HP price – cash price R371 748 – (R337 900 – 5% × R337 900) = R371 748 – R321 005 = R50 743
2. a. Real cost of the house Amount borrowed = R355 000 × 90% = R319 500 Bank A Monthly payments × 10 years R4 047,29 × 10 × 12 months = R485 674,80 Bank B R3 146,24 × 15 × 12 months = R566 323,20 Bank C R2 834,29 × 18 × 12 months = R612 206,64
b. Bank A R485 674,80 – R319 500,00 = R166 174,80 Bank B R566 323,20 – R319 500,00 = R246 823,20 Bank C R612 206,74 – R319 500,00 = R292 706,64

109T E R M 2 • U N I T 1
3. Option 1 (14% compounded annually)
Year Capital Interest Amount due
1 92 000,00 12 880,00 104 880,00
2 104 880,00 14 683,20 119 563,20
3 119 563,20 16 738,85 136 302,05
4 136 302,05 19 082,29 155 384,34
5 155 384,34 21 753,81 177 138,15
6 177 138,15 24 799,34 201 937,49
7 201 937,49 28 271,25 230 208,74
8 230 208,74 32 229,22 262 437,96
Option 2 (18% interest compounded annually)
Year Capital Interest Amount due
1 92 000,00 16 560,00 108 560,00
2 108 560,00 19 540,80 128 100,80
3 128 100,80 23 058,14 151 158,94
4 151 158,94 27 208,61 178 367,55
5 178 367,55 32 106,16 210 473,71
6 210 473,71 37 885,27 248 358,98
Option 3 (interest 18%) Monthly payments: R1 420,48 Payments: 8 × 12 months = 96 months Total payment: R1 420,48 × 96 = R136 366,08 Option 4 (interest of 10%) Monthly payments: R971,82 Payments: 15 × 12 months = 180 months Total payment: R174 927,60
a. Option 1 2 3 4
total amount r262 427,96 r248 358,98 r136 366,08 r174 927,60
capital amount
r92 000,00 r92 000,00 r92 000,00 r92 000,00
Interest paid r170 427,96 r156 358,98 r44 366,08 r82 927,60
Option 3’s loan of over eight years at 10,5% is the cheapest. b. Answers will differ.
1.4 Investigation: How much interest can you save by increasing your home loan repayments? Learner’s Book page 203
Learners discuss the findings of their investigations.

110 S E C T I O N 3 • W O R K E D A N S W E R S
Unit 2Banking, loans and investmentsLearner’s Book pages 237–269
Teaching tips
• In this unit, learners revise their knowledge of different types of bank account and they analyse the accounts to find which ones are most suitable for people with different needs. Understanding the terminology used to describe the features of these accounts is an important core skill. Check that all learners can easily explain these features and give examples of how they apply in practical situations.
• Calculating, graphing and comparing bank fee options is an opportunity for learners to apply their calculation and graphing skills while demonstrating their ability to analyse bank tariff documents.
• The analysis of long-term savings products will help learners develop a critical understanding of long-term interest growth and projected growth as described by financial service providers. These are concepts learners should discuss in relation to their own financial planning for their future.
• The section on stokvels presents an important approach to savings that is used in many South African communities, and it provides opportunities to people who would not be eligible to open their own bank investment accounts. Encourage learners to consider how the stokvel approach to savings could be applied in their lives. If possible invite members of a few different stokvel clubs to visit the class and explain how their clubs operate.
• Micro-loans are analysed in the unit, as a type of loan that sometimes functions differently to a bank loan. These loans can be useful in certain situations, but they can also lead people into debt trap situations. Help learners recognise the pitfalls of taking out micro-loans, and encourage them to discuss alternative options that they could take if they needed to borrow money.
• The discussion of Islamic banking can be used to raise the question of whether the usual approach to banking used in South Africa is normal in all societies. Learners can consider why it is not permitted to charge or earn interest in the Islamic banking system, and discuss what benefits and drawbacks such a system might have. If possible, invite an expert on Islamic banking to explain in more detail to the class how investments and loans work in this type of banking system.
Solutions2.1 Practice choosing suitable bank accounts for different purposes Learner’s Book page 206
1. a. Debit card account b. Loan account (bond) c. Savings account d. Credit card account e. Current account f. Fixed deposit account2. She could open a debit card/current account for day-to-day transactions
and a savings account for her to save money. Other answers could also be correct.
3. Answers will differ.

111T E R M 2 • U N I T 2
4. Example answers are given below. Business A could open a current account or savings account for daily
transactions. Profits could be included in the savings account. Business B could open a current account for daily transactions. The
business could use a savings account for short-term savings or a fixed deposit for long-term savings.
Business C could open a current account for daily business transactions, a business credit card for credit transactions and even to pay for fuel for a delivery vehicle (if required), and a fixed deposit for long-term savings.
2.2 Assignment: choose the best bank fee option for different accounts Learner’s Book page 211
Answers will differ.
2.3 Assignment: use graphs to compare cash withdrawal and deposit fees Learner’s Book page 218
Answers will differ.
2.4 Assignment: use graphs to show investment values with different growth rates and increased premiums Learner’s Book page 221
Answers will differ.
2.5 Practise using graphs to show contributions and payouts in a stokvel Learner’s Book page 223
1. Thembeka’s stokvel contributions and payments
Valu
e (R)
600-
500-
400-
300-
200-
100-
0- 1 2 3 4 5 6 7 8 9 10 11 12 13 14 15 16 17 18 19 20 21 22 23 24
–100-Week
2. a. Learners compare graphs. b. Stokvel contribution of R150 per person. R75 is paid out to each member in turn. R75 is deposited into the bank account. Interest rate: 4,5% p.a. R75 deposit per member × 12 members = R900 per month deposited into stokvel account

112 S E C T I O N 3 • W O R K E D A N S W E R S
Month Opening balance
Deposit Interest earned
Closing balance
1 0 r900 r3,38 r903,38
2 r903,38 r900 r6,67 r1 810,14
3 r1 810,14 r900 r10,16 r2 720,30
4 r2 720,30 r900 r13,58 r3 633,88
5 r3 633,88 r900 r17,00 r4 550,88
6 r4 550,88 r900 r20,44 r5 471,32
7 r5 471,32 r900 r23,89 r6 395,21
8 r6 395,21 r900 r27,36 r7 322,57
9 r7 322,57 r900 r30,83 r8 253,40
10 r8 253,40 r900 r34,33 r9 187,73
11 r9 187,73 r900 r37,83 r10 125,56
12 r10 125,56 r900 r41,35 r11 066,91
c. Henette receives R22,24 of interest (a 1 __ 12 share of the interest earned).
2.6 Investigation: compare the effects of changing interest rates, investment amounts and repayments on the final value of an investment or a loan Learner’s Book page 228
Answers will differ.
Unit 3InflationLearner’s Book pages 231–250
Teaching tips
• The work done on inflation in this unit should be linked to work learners did in Term 1 on income-and-expenditure statements and budgets. You can use some of the statements and budgets in the activities in Term 1 as additional resources for calculating the impact of inflation – for example, ask learners to recalculate a given provincial or municipal budget if the inflation rate is 3% or 8,5%.
• In doing calculations in this unit, ask learners to analyse and explain how price rises due to inflation affect the purchasing power of the people or businesses concerned. In this way, learners can develop their understanding of how a financial process such as inflation affects many aspects of people’s daily lives, ability to plan for the future and so on.
• The concept of an average is important in the section on average price increases. Check that learners understand what an average tells us about a situation – it gives a general picture of the size of an increase in prices, although an item or a service may change by a percentage that differs from the average price increase due to inflation. By comparing inflation rates for different goods and services, learners will get a better understanding of this concept. Here, as in earlier units, a key calculation skill that learners must have is the ability to calculate percentage increases.

113T E R M 2 • U N I T 3
• Let learners compile a list of their households basket of goods as a basis for tracking the effect of inflation on their lives. They can then repeat this activity by focusing on different groups of people to see how inflation affects certain sectors of society. For example, a basket of goods for babies and young children may have an inflation rate that differs from that for teenagers; people who are chronically ill may experience inflation more severely than people who do not need to buy medicine or special foods on a regular basis.
• The inflation graphs in the Learner’s Book give learners the opportunity to develop their graph-reading skills. These graphs are also resources for analysing increasing inflation rates and declining/decreasing inflation rates. The graphs show that a decrease in the inflation rate is not a decrease in prices – it is a smaller increase in prices. You will find graphs that give up-to-date inflation rates and trends in the business sections of newspapers and on the internet.
• The last section of the unit links inflation to investment accounts and interest rates. Learners can research the current average inflation rate and compare various investment account options offered by banks in the same period to see which accounts could let long-term savings grow at an interest rate that is higher than inflation.
Solutions3.1 Practise calculating changes in purchasing power because of inflation Learner’s Book page 234
1. Year 1 Income Expenditure
Fixed salary r6 600 Home loan repayment r2 150,00
train fare r826,00
Groceries and food r2 500,00
clothing account r750,00
cellphone contract r159,00
total r6 385,00
credit balance r215,00
End of year Amount
Fixed salary r6 600,00
Home loan (r2 150 + 0,5%) r2 160,75
train fare (r826 + 7,5%) r887,95
Groceries and food (r2 500 + 6,2%) r2 655,00
clothing account r750,00
cellphone contract r159,00
R6 612,70
debit balance r12,70
At the start of the year, Fikile’s salary covered 100% of his expenses, with a credit balance left over.
At the end of the year, his salary covered R6 600 _______ R6 612,70 × 100% = 99,81 of his
expenses. b. Year 2 Salary: R6 600 + 5% increase = R6 930,00 Expenditure: R6 612,30 Fikile’s salary now covers all his expenses, with a credit balance of
R6 930 – R6 612,30 = R317,70 left over.

114 S E C T I O N 3 • W O R K E D A N S W E R S
2. a. Saving of R1 500 per month × 10 = R15 000 cost of new equipment R15 000 + 12% increase = R16 800 Jocelyn needs to save an extra R1 800. b. Jocelyn will need to save for an extra two months to afford the
equipment at the new price. c. The price of the equipment will increase again in the next two months.3. a. Weekly wage: R25,60 per hour is about the same as his income × 35
= R896,00 His expenditure is about the same as his income (R896,00). R896 + 7,5% = R963,20 Increase in weekly wage: R963,20 ÷ 35 = R27,52 His pay must increase by R27,52 per hour. b. R963,20 ÷ R25,60 per hour = 37,625 Rounded up to 38 hours per week Zuban will need to work an extra three hours.
3.2 Investigation: compile a basket of goods table for your household Learner’s Book page 237
Answers will differ.
3.3 Practice comparing rates of price change Learner’s Book page 238
1. Item Old price New price Percentage increase
Rank (lowest to highest)
a. Electricity tariff
r0,6160/kWh r0,8194/kWh 33,02 5
b. taxi fare r5 per trip r5,50 per trip 10 3
c. Flat screen television
r4 599 r4 299 –6,52 2
d. Movie ticket r12,50 r16,50 32 4
e. Apples r11,25 per kg r6,80 per kg –39,56 1
2. a. June to September: R15,40 − R12,10
___________ R12,10 × 100% = 27,3%
b. January to June: R12,10 − R14,50
___________ R14,50 × 100% = −16,6%
June to December: R18,64 − R12,10
___________ R12,10 × 100% = 54,1%
From June to December there was the highest increase.
c. January to April: R9,95 − R14,50
__________ R14,50 × 100% = −31,38%
3. January to December: R18,65 − R14,50
___________ R14,50 × 100% = 28,6%
3.4 Assignment: Analyse how inflation rates differ for different food items Learner’s Book page 238
Answers will differ.

115T E R M 2 • U N I T 3
3.5 Practice reading graphs of inflation Learner’s Book page 241
1. a. September 2010 to January 2012 b. Administered prices has the highest rate of inflation for the period. c. Public transport d. Public transport e. Food f. i. February 2011 ii. June 20112. a. Answers will differ. b. January 1992 to September 1993, January 1995 to January 1996,
January 1997 to January 1998, January 1999 to January 2000 c. Answers will differ. d. i. Most different: January 1991 to January 1996 ii. Most similar: January 1997 to September 20013. a. The annual inflation rate and the growth rate for house prices are
compared. b. Answers will differ. c. About 37% In 1981, house prices were growing at an annual rate of 37% p.a. d. The rate of inflation for house prices declined for the period 2004
to 2008. e. 1992: R450 000 1993: R450 000 + 5% = R472 500 1994: R472 500 + 7% = R505 575 The house would have been worth between R472 500 and R505 575 if
sold in 1994. f. Answers will differ. 4. a. i. Jan 2009: R5,70 Oct 2011: R10,24
R10,24 − R5,70
__________ R5,70 × 100% = 79,649% ≈ 80%
ii. Jan 2009: R6,40 Oct 2011: R9,45
R9,45 − R6,40
__________ R6,40 × 100% = 47,66% ≈ 48%
b. Jan 2010: R7,78 June 2010: R8,00
R8,00 − R7,78
__________ R7,78 × 100% = 2,83% ≈ 3%
c. Jan 2010: R6,76 June 2010: R7,49
R7,49 − R6,76
__________ R6,76 × 100% = 10,80% ≈ 11% The diesel price rose at a higher rate over the period. d. Answers will differ.

116 S E C T I O N 3 • W O R K E D A N S W E R S
Revise and consolidate Learner’s Book page 246
1. Single loan
Year Capital amount Interest Closing balance
1 r36 000,00 r3 024,00 r39 024,00
2 r39 024,00 r3 278,02 r42 302,02
3 r42 302,02 r3 553,37 r45 855,39
Total interest paid: R9 855,39 Three separate loans (fully paid back at end of each year)
Year Capital Interest Closing balance
1 r12 000 r1 008 r13 008
2 r10 500 r882 r11 382
3 r13 500 r1 134 r14 614
R39 024
Total interest paid: R3 024 The three separate loans option is a much cheaper option for Luvuyo.2. a. 35 months b. i. between 16,7% and 30% ii. between R143 185 and R170 139 c. R1 000 d. Answers will differ. 3. a. Interest calculated monthly/quarterly/half-yearly b,c. Answers will differ. 3. d. Interest
calculatedInterest rate Interest
earnedClosing balance
Monthly 4,20% (0,35% per month) r2 186,73 r27 186,73
Quarterly 4,20% (1,05% per quarter) r2 178,82 r27 178,82
Half-yearly 4,20% (2,1% per half-year) r2 185,80 r27 167,08
Annually 4,28% r2 185,80 r27 185,80
on expiry 4,37% r1 092,50 r26 092,50
Investing the R25 000 at a rate of 4,2% with interest calculated monthly, or at a rate of 4,28% with interest calculated annually will give the largest closing balance.
e. Interval at which interest is compounded (months)
Growth of first investment (R16 000) with interest compounded quarterly at 4,4% p.a
Growth of second investment (R16 000) with interest compounded annually at 4,48% p.a.
0 r16 000,00 r16 000,00
3 r16 176,00
6 r16 353,94
9 r16 533,83
12 r16 715,70 r16 716,80
15 r16 899,57
18 r17 085,47
21 r17 273,41

117T E R M 2 • U N I T 3
Interval at which interest is compounded (months)
Growth of first investment (R16 000) with interest compounded quarterly at 4,4% p.a
Growth of second investment (R16 000) with interest compounded annually at 4,48% p.a.
24 r17 463,42 r17 465,71
27 r17 655,52
30 r17 849,73
33 r18 046,07
36 r18 244,58 r18 248,18
The second investment of R16 000, where interest is compounded annually, grows slightly better than the first investment of R16 000 where interest is compounded quarterly.
4. If Mervyn invests the money in a fixed deposit, reinvests the money every 36 months (and takes a one-year investment in the final year), he would receive a total of R224 000,18 (assuming interest rates for the fixed deposit remain unchanged).
The amount is less than the minimum amount given for the retirement annuity.
R39 700 × ( 100 + 6,4 ______ 100 ) 27
× ( 100 + 5,69
_______ 100 ) = R224 000,185. a. She pays back the whole debit balance three days after the due date.
Month Opening balance
Purchases Payments Interest Closing balance
June – 5 997,52 112,45 6 109,97
July 6 109,97 12 962,38 6 109,97 243,04 13 205,42
August 13 205,42 5 601,05 13 205,42 105,02 5 706,07
September 5 706,07 11 778,55 5 706,07 220,85 11 999,40
b. She pays 75% of the debit balance by the due date.
Month Opening balance
Purchases Payments Interest Closing balance
June – 5 997,52 4 498,14 28,11 1 527,49
July 1 527,49 12 962,38 10 867,40 67,92 3 690,39
August 3 690,39 5 601,05 6 968,58 43,55 2 366,41
September 2 366,41 11 778,55 10 608,72 66,30 36 602,54
c. She pays off the whole debit balance every second month.
Month Opening balance
Purchases Payments Interest Closing balance
June – 5 997,52 112,45 6 109,97
July 6 109,97 12 962,38 19 072,35 0 –
August – 5 601,05 105,02 5 706,07
September 5 706,07 11 778,55 17 484,62 0 –
6. a. The stokvel consists of 11 people who each contribute R60 a month. Each member, therefore, contributes R660 in one year and receives this amount at the end of the year.

118 S E C T I O N 3 • W O R K E D A N S W E R S
b. Month Opening balance
Contribution Interest earned
Closing balance
1 0 r600 r1,60 r601,50
2 r601,60 r600 r3,20 r1 204,80
3 r1 204,80 r600 r4,81 r1 809,61
4 r1 809,61 r600 r6,43 r2 416,04
5 r2 416,04 r600 r8,04 r3 024,08
6 r3 024,08 r600 r9,66 r3 633,74
7 r3 633,74 r600 r11,29 r4 245,03
8 r4 245,03 r600 r12,92 r4 857,95
9 r4 857,95 r600 r14,55 r5 472,50
10 r5 472,50 r600 r16,19 r6 088,69
11 r6 088,69 r600 r17,84 r6 706,53
12 r6 706,53 r600 r19,48 r7 326,01
c. R7 326,01 ÷ 10 members = R732,607. a. A homeowner could increase the monthly bond repayments and
reduce the rate of interest. b. Answers will differ. 8. a. R6 990,98 b. Total interest (20 years): R927 835,20 Total interest (15 years): R659 704,20 The homeowner would save: R927 835,20 – R659 704,20 = R268 131,00 in interest c. Total cost of loan at 9,2% over 15 years: R1 385 368,20 Total cost of loan at 9,2% over 20 years: R1 642 732,809. a. Year Consumer price
indexFood price index Difference:
CPI – FPI
2007 7,1% 10,4% –3,3%
2008 11,5% 16,7% –5,2%
2009 7,1% 9,3% –2,2%
2010 4,3% 0,8% 3,5%
2011 5,0% 7,2% –2,2%
b.
0
Mar.
2007
222018161412
2468Pe
rcent
age
Month
10
Jun.
2007
Sep.
2007
Dec.
2007
Jun.
2008
Sep.
2008
Dec.
2008
Mar.
2008
Mar.
2009
Jun.
2009
Sep.
2009
Dec.
2009
Jun.
2010
Sep.
2010
Dec.
2010
Mar.
2010
Mar.
2011
Food price indexConsumer price index (CPI)
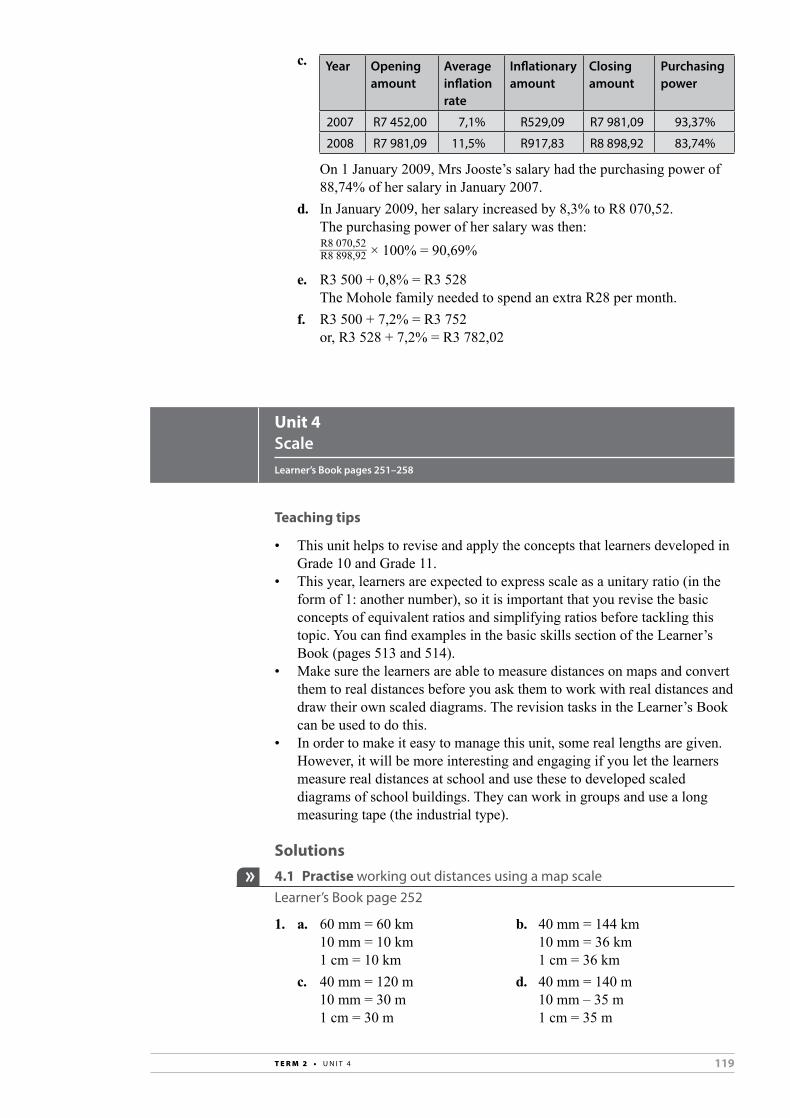
119T E R M 2 • U N I T 4
c. Year Opening amount
Average inflation rate
Inflationary amount
Closing amount
Purchasing power
2007 r7 452,00 7,1% r529,09 r7 981,09 93,37%
2008 r7 981,09 11,5% r917,83 r8 898,92 83,74%
On 1 January 2009, Mrs Jooste’s salary had the purchasing power of 88,74% of her salary in January 2007.
d. In January 2009, her salary increased by 8,3% to R8 070,52. The purchasing power of her salary was then: R8 070,52
_______ R8 898,92 × 100% = 90,69%
e. R3 500 + 0,8% = R3 528 The Mohole family needed to spend an extra R28 per month. f. R3 500 + 7,2% = R3 752 or, R3 528 + 7,2% = R3 782,02
Unit 4ScaleLearner’s Book pages 251–258
Teaching tips
• This unit helps to revise and apply the concepts that learners developed in Grade 10 and Grade 11.
• This year, learners are expected to express scale as a unitary ratio (in the form of 1: another number), so it is important that you revise the basic concepts of equivalent ratios and simplifying ratios before tackling this topic. You can find examples in the basic skills section of the Learner’s Book (pages 513 and 514).
• Make sure the learners are able to measure distances on maps and convert them to real distances before you ask them to work with real distances and draw their own scaled diagrams. The revision tasks in the Learner’s Book can be used to do this.
• In order to make it easy to manage this unit, some real lengths are given. However, it will be more interesting and engaging if you let the learners measure real distances at school and use these to developed scaled diagrams of school buildings. They can work in groups and use a long measuring tape (the industrial type).
Solutions4.1 Practise working out distances using a map scale Learner’s Book page 252
1. a. 60 mm = 60 km b. 40 mm = 144 km 10 mm = 10 km 10 mm = 36 km 1 cm = 10 km 1 cm = 36 km c. 40 mm = 120 m d. 40 mm = 140 m 10 mm = 30 m 10 mm – 35 m 1 cm = 30 m 1 cm = 35 m

120 S E C T I O N 3 • W O R K E D A N S W E R S
2. a. 120 000 mm = 120 m b. 3 cm = 30 mm × 120 000 mm = 3 600 000 mm = 3,6 km c. 12,5 cm × 120 000 = 1 500 000 cm = 15 km d. 38,25 cm × 120 000 = 4 590 000 cm = 45,9 km3. a. 29 mm × 150 = 4 350 mm = 4,35 m = 0,00435 km b. 29 mm × 1 500 = 43 500 mm = 43,5 m = 0,0435 km c. 29 mm × 15 000 = 435 000 m = 435 m = 0,0435 km d. 29 mm × 150 000 = 4 350 000 mm = 4,35 km e. 29 mm × 1 500 000 = 43 500 000 mm = 43,5 km f. 29 mm × 15 000 000 = 435 000 000 mm = 435 km g. 29 mm × 150 000 000 = 4 350 000 000 mm = 4 350 km4. a. Length: 68 mm ÷ 10 mm × 0,8 m = 5,44 m (internal measurement) Width: 49 mm ÷ 10 mm × 0,8 m = 3,92 m (internal measurement) b. 13 mm ÷ 10 mm × 0,8 m = 1,04 m = 104 cm c. Diameter = 14 mm 14 mm ÷ 10 mm × 0,8 m = 1,12 m = 112 cm d. 33 mm10 mm
A
D
C
B
6 mm 27 mm
8,5 mm
22 m
m10
mm
10 mm
10 mm
16 m
m6 m
m
Length of rectangle A: 33 mm ÷ 10 mm × 0,8 m = 2,64 m Length of rectangle B: 22 mm ÷ 10 mm × 0,8 m = 1,76 m Width of rectangles A and B: 10 mm ÷ 10 mm × 0,8 m = 0,8 m

121T E R M 2 • U N I T 4
Length of sides of square C: 10 mm ÷ 10 mm × 0,8 m = 0,8 m Height of triangle D: 6 mm ÷ 10 mm × 0,8 m = 0,48 m Base of triangle D: 6 mm ÷ 10 mm × 0,8 m = 0,48 m
Surface area of desk: Area of A + area of B + area of C + area of D = (2,64 × 0,8 m) + (1,76 × 0,8 m) + (0,8 × 0,8 m) + 1
_ 2 (0,48 × 0,48 m) = 2,112 + 1,408 + 0,64 + 0,1152 = 4,2752 m2
4.2 Practise measuring map distances and working with scale Learner’s Book page 252
1. Answers will differ. 2. a. Distance on map: 10 mm 10 mm × 15 000 000 = 150 000 000 mm = 150 km b. 4 mm × 15 000 000 = 60 000 000 mm = 60 km c. 23 mm × 15 000 000 = 345 000 000 mm = 345 km d. 17 mm × 15 000 000 = 255 000 000 mm = 255 km

122 S E C T I O N 3 • W O R K E D A N S W E R S
4.3 Practise using real distances to calculate measurements on a plan Learner’s Book page 254
1. a. 1 : 200
42,50 m
23,75 m

123T E R M 2 • U N I T 4
b. 1 : 500 c. 1 : 1000
2. Answers will differ.
4.4 Practise determining scale in the form of a ratio Learner’s Book page 255
1. a. 15 mm = 10 m b. 13 mm = 1 km 15 mm = 10 000 mm 13 mm = 1 000 000 mm Map scale: 1 : 667 1 = 76 923,07 Map scale: 1 : 76 9232. a. 6,1 cm = 312 cm b. 6,7 cm = 1,68 m 1 = 51,15 6,7 cm = 168 cm Scale: 1 : 51 1 = 25,07 Scale: 1 : 25 c. 98 mm = 3 714 mm 1 : 37,89 Scale: 1 : 383. 65 mm = 48,75 km 65 mm = 48 750 000 mm 1 : 750 000
4.5 Practise determining scale and using it to determine dimensions Learner’s Book page 257
1. (Using suggestion for scale) a. 90 mm = 900 m 90 mm = 900 000 mm 1 : 10 000 b. 98 mm × 10 000 = 980 000 mm
= 0,98 km c. 32 mm + 12,5 + 5 = 49,5
≈ 50 mm 50 mm × 10 000 = 500 000 mm
= 0,5 km
42,50 m
23,75 m
42,50 m
23,75 m

124 S E C T I O N 3 • W O R K E D A N S W E R S
d. 50 mm × 10 000 = 500 000 m = 0,5 km
Approximately 550 m e. Leaners discuss estimations.2. a. 1 cm = 20 km 1 cm = 2 000 000 cm 1 : 2 000 000
b. Distance in centimetres (cm) on map
Distance in km
Start – Station 1 4 80
Station 1–2 3,3 66
Station 2–3 2 40
Station 3–4 5,7 114
Station 4–5 5,7 114
Station 5–6 2,5 50
Station 6–7 2 40
Station 7–8 5,5 110
Station 8 – finish 5,8 116
c. 730 km
d. Time = distance ______ speed
= 730 km ______ 45 km/h
= 16,22 hours = 16 hours 13 minutes 12 seconds3. a. 730 km ÷ 6 km/ℓ = 121,67 ℓ b. 121,67 ÷ 90 ℓ = 1,35 The vehicle would need 2 tanks of petrol. c. Answers will differ.
Unit 5MapsLearner’s Book pages 259–282
Teaching tips
• In this unit, learners are expected to apply and combine the skills they already have to work with a range of plans and maps in different contexts. Much of the learning is assumed and you may need to check that learners remember how to read and interpret different types of map and other information before you introduce them to the tasks.
• Learners have worked with floor plans and simple maps before. In this unit, they will work with the same kinds of maps in different contexts. They will also learn how to read and interpret street maps with an index and grid system, maps that show larger areas (maps of South Africa) and elevation maps (also called cross sections).
• It will be useful to have floor plans of local shopping centres. You may find such floor plans at the information kiosks at the centres. Use these

125T E R M 2 • U N I T 5
floor plans to revise the basic skills of locating places on a map. Working with maps of places that are familiar to the learners can help them formalise their spatial and mapping abilities.
• Street maps books of your province are also a useful classroom resource as they have maps of small areas and they also contain a detailed index to place names that you can refer to as you work through the unit. Learners can make up activities for each other to complete using local area maps.
• At this level learners are expected to work with compass directions when they are giving or interpreting directions. This topic should not be difficult for learners at all as they have previously used compass directions (also in Social Studies and last year when working with elevations).
• At the very least, you should have an atlas available in class for the learners to use. Remind them that atlas maps tend to show north at the top and that they can work out the other directions when they know where north is.
• The most common use of road maps is probably to find your way while driving. Make sure the learners understand how to read the distance indicators on these maps. They may be presented in different ways by different publishers.
• If someone has access to a GPS system, use it to show the class how maps and routes appear on these systems. The distances given by the GPS are exact, and it could be a fun activity to compare these with distances given on a map.
• Make sure that learners remember and understand that a profile or elevation map is like a line graph that shows distance (in kilometres) on the horizontal axis and height (in metres usually) on the vertical axis. The height (or altitude) is often given on both sides of the graph to make it easier to read the values.
Solutions5.1 Practise describing the positions of places on a map Learner’s Book page 259
1. a. Add the number of seats in one long row. 19 + (9 × 23) – [17 – (7 + 1) + 17 – (6 + 1)] = 19 + 207 – (9 + 10) = 207 seats b. Starting at entrance 2, go to the fourth row from the back. This is
row G. Seat G19 is the fifth seat from the right. c. The sound and lighting box is positioned at the back of the theatre
between seats I7 and J6 on the left and I17 and J17 on the right. d. G1 e. Rows A, I and J have fewer seats. Rows I and J have fewer seats because of the position of the sound
and ligting box. There are fewer seats in row A so that the audience in this row can see more of the stage.
f. Seat number 12 or less for rows B to J. Seats 10 or less for row A.2. Instructions will differ. Learners can check each other’s work.3. a. The suburb Silvamonte is shown on grid DU 109 on page 58 of the
map book. b. Grid EB86, page 126

126 S E C T I O N 3 • W O R K E D A N S W E R S
c. There are two Similane Streets on page 176 with similar grid references (EN 113 for Ncala and EM 113 for Skozona).
d. Simmonds Street runs across Park Central, Braamfontein and Johannesburg.
e. Yes. Germiston and Simmerfield is at grid DX 115 on page 111 and Simmerfield is also on grid DX 113 on the same page.
4. a. It is located in DU 100 between Simmonds Street and Loveday Street. b. The Civic Centre c. Botswana d. The National School of the Arts is at the T-junction where Simmonds
Street joins Hoofd Street. e. The Witwatersrand University’s East Campus is northeast of the
Joburg Theatre on Jan Smuts Avenue. f. i. DS 100 ii. DU 99 iii. DS 99 g. Escombe Avenue h. i. 4 ii. M1 iii. Parktown Boys’ High School i. No, Nisha cannot take the first right into Hoofdt Street. It is a one-way
street.
5.2 Practise using a street map Learner’s Book page 263
1. Drive south on Jan Smuts Avenue. Turn left into Ameshoff Street. Continue along Ameshoff Street and turn left in to Simmonds Street. The Joburg Theatre is on your right.
2. Sandile should walk north along Rissik Street. He should turn left into Viljoen Street and turn right into Station Street. Rosebank College is on the right.
3. Sandile should walk west along Kotze Street. He should turn left into Joubert Street and follow it as it turns to the right and become De Korte Street. Sandile should walk north along Rissik Street. He should turn left into Viljoen Street and turn right into Station Street. Rosebank College is on the right.
4. a. Approximately 8 000 m b. Approximately 7,3 km c. 200 m × 100 m = 20 000 m2
(The scale is approximately 10 cm : 1 km, thus 1 : 10 000.)
5.3 Practise working with compass directions Learner’s Book page 265
1. a. North b. West c. East d. North and then west along Kudu Crescent, and turning south into the
parking area2. a. If the shops are on Main Street, then Andile is facing south. If the
shops across Ndlovu Drive are to Andile’s right, he is facing north. b. East

127T E R M 2 • U N I T 5
c. From To Direction
Post office Petrol station East
Petrol station Mosque north
Mosque School Southwest
School community health centre northeast
church Post office Southeast
4. Answers will differ. 5. a. Paul Roux b. Excelsior
c. From To Direction
Armenia dam Allemanskraal dam north
Allemanskraal dam Erfenis dam Southwest
Bethlehem Buthu-Buthe South
Maseru Bethlehem northeast
Verkeerdevlei Brandfort northwest
5.4 Practise reading and making sense of different maps Learner’s Book page 267
1. 50 mm = 2 850 km 1 mm = 57 km 1 mm = 57 000 000 mm 1 : 57 000 000
2. s = d _ t 3 h 50 min. = 3,833 h
= 2 850 km ______ 3,833 h
= 743,5 km/h3. East-southeast (ESE)4. 1 cm = 5 km 1 cm = 500 000 cm 1 : 500 0005. The map of Africa6. The map of Mauritius7. a. Southeast b. Approximate distance: 3 cm on map So, 15 km
c. Time = distance ______ speed
= 15 km ______ 45 km/h
= 0,33 h = 18 min.8. a. Departure time – 2 h – time to travel to the airport 9:15 a.m. – 2 h – 18 min. = 6:57 a.m. b. Departure time 9:15 (Mauritius time) Flight duration 3:50 Arrival time 13:05 (Mauritius time) Arrival time 11:05 (SA time)

128 S E C T I O N 3 • W O R K E D A N S W E R S
5.5 Practise planning and budgeting for a trip Learner’s Book page 268
1. a. 7 532 × 3,5569 = 26 790,57 rupees b. 26 790,57 + (26 790,57 × 0,26%) = 26 790,57 + 69,66 = 26 860,23 c. 0,28114 : 12. a. Durban is much cheaper than the other cities. b. About $111 per day c. $111 × R8,64 = R959,04 d. R959,04 × 3,5569 = 3 411,21 rupees3. a. (4 × 3) + (16 × 4) = 76 seats b. rows 5–20 c. seats 5A–5D d. 5A or 5D e. Answers will differ. 4. a. Seat 9D is 12 rows from the back, where the toilet (lavatory) is
located. Seat 9D is on the starboard side of the plane (on the right when facing forward). The bathroom is at the back on the port (left side when facing forward).
b. Seat 9D is in the 9th row from the front of the aeroplane. c. The nearest emergency exits are located on either side of the aircraft at
the front of the cabin.
5.6 Practise working with directions and distances Learner’s Book page 270
1. a–c. Answers will differ. d. South2. a. 29,1 km b. 23 min. c. 0,3 km d. 12 km3. a. The ICC is west of Snell Road. b. Pierre will see the beach front and the ocean. c. • Head south on Snell Road. • Take first right into OR Tambo Parade. • At the roundabout, turn left into KE Masinga Road. • Turn left into Sylvester Ntuli Road. • Turn right in Bram Fisher Road. • Carry on straight along Bram Fisher Road. • The hotel is on the right. d. Drive in an easterly direction past the Sahara stadium, Kingsmead on
your left. Turn right into Florence Nzama Street and right into Bram Fisher Road. The ICC is on your left.
5.7 Practise working with strip maps Learner’s Book page 273
1. a–c. Answers will differ. d. Map A2. a. 130 km b. 545 km – 210 km = 335 km c. 439 km d. Kokstad; Brook’s Nek

129T E R M 2 • U N I T 5
3. a. Durban–Port Shepstone 280 km Port Shepstone–Port St Johns 251 km Port St Johns–N2 112 km Umtata–East London 245 km East London–PE 259 km 1 147 km b. Time = distance
______ speed
= 1 147 km ______ 95 km/h
= 12,07 h = 12 h 4 min. 12 s c. Departs Durban 5:00 Duration to East London* 9:21 Coffee break 0:30 Lunch break 1:15 16:06 * Time to get to East London: 1 147 km – 259 km = 888 km 888 km
______ 95 km/h = 9,35 h = 9 h 21 min.
Pierre arrives in East London at 16:06.
d. 259 km ______ 100 km/h = 2,59 h
= 2 h 35 min. 24 s4. a. 1 147 km ÷ 12,5 km/ℓ = 91,76 ℓ b. 91,76 ℓ × R11,85/ℓ = R1 087,36 c. R297 × 2 = R5945. Renting a car Rental R594,00 Petrol R1 087,36 R1 681,36 Return flight: R3 294 ÷ 2 = R1 647 for a single ticket Travelling by car R1 681,36 Travelling by aeroplane R1 647,00 R34,36 It costs R34,36 more to travel from Durban to Port Elizabeth in a hired car.6. a. Arrival 14:55 Departure 13:35 Flight duration 1:20
687 km _____ 1,333 = 515,38 km/h
1 h 20 min. = 1,333 hours b. Driving distance along the N2: 964 km Flying distance: 687 km The flying distance is 277 km shorter than the driving distance. The driving distance as calculated for question 3(a): 1 147 km The flying distance is also 460 km shorter than the distance of 1 147 km.7. Answers will differ.
5.8 Practise interpreting route and elevation maps Learner’s Book page 276
1. a. Answers will differ. It is about 1 : 250 000. b. Answers will differ. It is about 60 km. c. Answers will differ. It would take about 3 h 20 min. if the route is 60 km.

130 S E C T I O N 3 • W O R K E D A N S W E R S
2. Answers will differ. 3. a. 113 km b. 350 m c. Answers will differ. 4. a. Mostly level b. Uphill c. There are three pairs of uphill and downhill sections. d. Mostly level5. Answers will differ. 6. Answers will differ. 7. a. Answers may differ, the example is based on the answer to
question 1(b) and a distance of 60 km. Pierre: 60 km
______ 13 km/h = 4,615 ≈ 4 h 36 min. 54 s ≈ 4 h 37 min.
Cousin: 60 km _______ 13,5 km/h = 1,905 ≈ 1 h 54 min. 20 s
b. Pierre’s cousin would finish first. She would wait almost two hours and 43 minutes for Pierre to finish.
c. The example answer is based on a distance of 60 km. 2 h 29 min. = 2,483 h Speed = 60 km
____ 2,48 h = 24,16 km/h
This is slower than the cousin’s speed; it is quite slow.
Revise and consolidate Learner’s Book page 280
1. a. 30 mm b. 15 mm c. 40 mm d. 45 mm e. 10 mm2. a. a. 100 km b. a. 37,5 km b. 50 km b. 18,75 km c. 133,33 km c. 50 km d. 150 km d. 56,25 km e. 33,33 km e. 12,5 km c. a. 90 000 mm = 90 m d. a. 9 000 000 mm = 9 km b. 45 000 mm = 45 m b. 4 500 000 mm = 4,5 km c. 120 000 mm = 120 m c. 12 000 000 mm = 12 km d. 135 000 mm = 135 m d. 13 500 000 mm = 13,5 km e. 30 000 mm = 30 m e. 3 000 000 mm = 3 km3. a. i. 67,5 km ii. 290 km b. i. North east ii. South west4. 40 mm : 150 km 40 mm : 150 000 000 mm 1: 3 750 000 a. approximately 260 km b. 2 h 45 min. = 2,75 h ( 45
__ 60 = 3 _ 4 = 0,75)
260 km _____ 2,75 h = 95 km/h

131T E R M 2 • U N I T 6
c. Answers will differ. Using the distance estimated in question 4(a): 260 km ÷ 8 km/ℓ = 32,5 ℓ d. R11,85 × answer from question 4(c): R11,85 × 32,5 ℓ = R385,135. a. Answers depends on answer in question 4(c). An example is given below. 6,68 × R11,85 + 19,25c + 9,35c = 79,158c/km + 28,6c/km = 107,758c/km ≈ 108c/km b. Answers will differ. An example is R1,08/km. c. Answers will differ. An example is R1,08 + 12,5% × R1,08 = R1,21/km. d. Answers will differ. 6. a. Elevation maps b. Route 1: 9 km Route 2: 19 km7. a. 506 m b. 558 m c. 510 m d. 558 m – 506 m = 52 m8. a. Going uphill b. Cycling on level ground c. Going downhill d. Going uphill
Unit 6Measuring length and distanceLearner’s Book pages 283–300
Teaching tips
• Learners have been developing their skills at length and distance measurement throughout their schooling, so in this Grade 12 unit, the emphasis is on more complex applications of these skills in a variety of contexts.
• The first section of the unit focuses on estimation skills – learners should develop a systematic approach to length estimation, rather than relying on random guesses in different situations. The examples set out in the Learner’s Book can be augmented or replaced with appropriate examples from a local context. For example, the estimation of street length can be replaced by an estimation of a given distance between two landmarks on a street, farm or other familiar environment.
• Estimation, calculation and costs are also linked in this unit. Learners will do many activities in later measurement units that involve costing materials needed for building projects. The practice work they do in this unit to estimate and calculate the costs of different lengths or distances will give them an opportunity to revise skills they will need to apply later in the course.
• Compiling a travel logbook and a travel budget for tax or business purposes is an opportunity to revise content that was first introduced in

132 S E C T I O N 3 • W O R K E D A N S W E R S
Grade 11, and that is referred to again in later measurement units and also in relation to income tax in the unit on taxation in Term 3.
• There are various opportunities in this unit for learners to practise and extend their skills at reading diagrams and plans, in order to calculate materials needed for construction projects. Reading maps is also involved in the interpretation of information relating to contexts such as distances travelled and internet connections.
Solutions6.1 Practise estimating lengths and costs Learner’s Book page 289
1,2. Answers will differ. 3. a. Estimated gap between trees: 146,4 m ÷ (16 + 2 trees) = 8,13 m per tree 1 000 m ÷ 8,13 m = 123 trees b. 2 400 ÷ 8,13 m = 295,20 ≈ 295 trees c. (295 trees × 90 minutes per tree ÷ 60 minutes × R100/h)
+ (R349,99 per tree × 295 trees) = R44 250 + R103 247,05 = R147 497,054. 146,4 m ÷ 10 m = 14,64 = 14 benches5–8. Answers will differ.
6.2 Practise estimating and calculating lengths Learner’s Book page 295
1. a. Length: 29 cm Width: 39 cm b. Leg lengths: 70 cm (height) + 5 cm (handles) – 5 cm (height of castors)
= 70 cm Height of castors: 5 cm c. 39 cm d. Sides must be 29 cm apart. Length of supporting bars: 28 cm e. Legs: 70 cm each Side bars: 28 cm each Handles: 38 mm each (4 × 70) + (6 × 28) + (2 × 38) = 280 + 168 + 76 = 524 cm f,g. Answers will differ. 2. a. Section Cupboard Width
Solid panel 1 and 2 250 mm
Solid panel 3 200 mm
Glass doors 2 250 mm
Solid doors 1 350 mm
Solid doors 2 and 4 250 mm
Solid doors 3 300 mm

133T E R M 2 • U N I T 7
b. i. Wood for cupboard doors: (350 mm + 4 × 250 mm) length × 500 mm width = 1 350 mm × 500 mm piece of wood Cupboard panels: 4 panels × 250 mm width × 500 mm height = 1 000 mm × 500 mm
or 2 500 mm × 2 000 mm piece of wood ii. Glass doors: 250 mm width × 500 m height × 3 doors
= 500 mm × 750 mm sheet of glass c–g. Answers will differ.
6.3 Practise reading and interpreting information about Internet connections around Africa Learner’s Book page 298
1. It connects Melkbosstrand and Mtunzini. It is larger than the other cables.2–4. Learners discuss and explain their answers.5. Terabits/gigabits6–8. Learners discuss their answers.
6.4 Investigation: What does a road cost? Learner’s Book page 300
Answers will differ.
Unit 7Measuring massLearner’s Book pages 301–319
Teaching tips
• In this unit, learners continue the work they did in Grade 10 and Grade 11 using a variety of scales to measure small and large masses. A focus of this unit is the body mass of adults and children, and learners do a variety of activities to monitor body mass in relation to accepted norms of adult and child health.
• The body mass index (BMI) weight status categories are the focus of a group of activities that involve gathering and organising mass data for adults. Learners calculate the BMI of a few adults, and then monitor and compare the weight status of different groups of adults, based on the BMI data collected for people in each group.
• The body mass of children is monitored with reference to the Road to health chart for very young children and BMI charts for older children. Learners read and interpret these charts, using their skills at reading graphs. They then do an investigation to monitor the growth patterns of children using data they collected.
• Mass measurement is related to health concerns in the section on food, nutrient mass and body mass. Learners interpret information about mass given on food packaging, and critically assess a news report about food and body mass.

134 S E C T I O N 3 • W O R K E D A N S W E R S
• Calculating the cost of food portions by mass is the focus of the next section. Learners calculate the costs of food portions and the prices that must be set to give a desired percentage profit. They apply these methods to developing a healthy daily diet for young children and calculating the cost of such a diet.
• The relationship between mass and cost is also investigated in the contexts of postal and air freight tariffs for parcel transport.
• Choosing a combination of masses to achieve a target mass is the focus of the section on packing for lightweight travel.
• The skills of calculating correct dosage in relation to mass are applied in the contexts of medicine dosage and pest control ingredients.
Solutions7.1 Practise using the BMI to determine weight status Learner’s Book page 302
1. Name Average mass (kg)
Height (m) BMI Weight status
a. Lucien 72,3 1,76 23,34 normal
b. tshepiso 61,5 1,55 25,60 overweight
c. noor 69,2 1,89 19,37 normal
d. Hein 58,5 1,48 26,71 overweight
e. Zodwa 54,6 1,70 18,89 normal
2–4. Answers will differ.
7.2 Practise reading and interpreting charts for young children Learner’s Book page 305
1. a. Length: 51 cm Weight: 3,2 kg b. 25% c. True d. Yes, Zuki’s height is within the curves on the chart, even though she is
very tall for her age. e. Answers will differ. f. 8,4 kg g. Zuki is tall and thin. She is the 90th percentile for height, but below
the 25th percentile for weight.2. a. Maria has a low birth weight. Her birth weight is in the 10th percentile. Reason: Answers will differ. b. Her growth rate in the first six months was slow, growing at a rate
equal to that of the bottom two percentiles. c. Her weight declined and is now outside of the normal curves. d. No, she is not developing normally. Her height and weight are below
the length-for-age and weight-for-age percentiles.
7.3 Practise reading and interpreting data about body mass and BMI Learner’s Book page 309
1. a. 15,6 BMI b. 15,3 BMI
2. a. 46,4 kg
_______ (1,54 cm)2 = 46,4
_____ 2,3716 = 19,56

135T E R M 2 • U N I T 7
b. He is above the median for his age (17,8) and is close to the 75th percentile for his age. His BMI is greater than average for his age.
3. a. Anita is close to the 90th percentile. Her BMI is more than that of almost 90% of the girls in her age group.
b. She is overweight and needs to lose some weight.4. 25th percentile
5. Learner Gender Age Height (m)
Mass (kg)
BMI Classification
Selina F 12 1,38 25 13,13 underweight
Bhuthi M 18 1,49 61 27,47 overweight
Koos M 15 1,47 46 21,29 normal
nomi F 15 1,47 46 21,29 normal
naadira F 16 1,54 72 30,36 obese
thabiso M 16 1,72 72 24,34 normal
Andrea F 18 1,65 66 24,24 normal
7.4 Practise reading information about nutrients in lists and tables Learner’s Book page 314
1. Egg yolk (6 g in one large egg)2. You should include eggs in a sugar-free diet. They do not contain sugar.3. There is no cholesterol in egg white. Egg yolk is high in cholesterol.4. Percentage of protein in chicken × weight of piece of chicken = 30% × 100 g = 30 g A 100 g slice of chicket contains 30 g of protein.5. Pork6. Chicken7. Cheese per
100 gper 200 g
Percentage of RDA of 44%
Percentage of RDA of 88% (200 g)
Energy 1 660 kJ 3 320 kJ
Protein 24,8 g 49,6 g 93% 186%
carbohydrates 1,4 g 2,8 g 5% 10%
total fat 33 g 66 g 125% 250%
total dietary fibre
0 g 0 g 0% 0%
Sodium 574 mg 1,148 g 0,0002% 0,0004%
8. Cheese
7.5 Practise reading and interpreting a report about body mass Learner’s Book page 314
1. Regular chocolate consumption was correlated to lower BMI.2. It is the composition of the calories, not the number of calories, that is
more important.3,4. Answers will differ.

136 S E C T I O N 3 • W O R K E D A N S W E R S
7.6 Practise calculating costs of portions of food Learner’s Book page 317
1. a. Ingredient Cost/kg Mass per portion Cost per portion
Hake r39,95 150 g r5,99
Potatoes r12,30 180 g r2,21
cooking oil r18,90 75 g r1,42
Total R9,62
b. Ingredient Cost/kg Mass per portion Cost per portion
Pizza dough r21,45 200 g r4,29
cheese r56,20 80 g r4,50
tomatoes r15,85 120 g r1,90
Total R10,69
c. Ingredient Cost/kg Mass per portion Cost per portion
Frozen peas r32,00 75 g r2,40
onions r8,45 10 g r0,08
Mint leaves r42,60 5 g r0,21
dried vegetable stock
r14,80 10 g r0,15
Total R2,84
2. a. i. Fish and chips ii. Pizza margherita Cost + 12% × cost R10,69 + 12% × R10,69 = R9,62 + 12% × R9,62 = R11,97 = R10,77 iii. Pea soup R2,84 + 12% × R2,84 = R3,18 b. i. Fish and chips ii. Pizza margherita Cost + 22,5% × cost R10,69 + 22,5% × R10,69 = R9,62 + 22,5% × R9,62 = R13,10 = R11,78 iii. Pea soup R2,84 + 22,5% × R2,84 = R3,48 c. i. Fish and chips ii. Pizza margherita R9,62 + 60% × R9,62 R10,69 + 60% × R10,69 = R15,39 = R17,10 iii. Pea soup R2,84 + 60% × R2,84 = R4,543. VAT rate = 15% a. i. Fish and chips ii. Pizza margherita R10,77 + 15% × R10,77 R11,97 + 15% × R11,97 = R12,39 = R13,77 iii. Pea soup R3,18 + 15% × R3,18 = R3,66
137T E R M 2 • U N I T 8
b. i. Fish and chips ii. Pizza margherita R11,78 + 15% × R11,78 R13,10 + 15% × R13,10 = R13,55 = R15,07 iii. Pea soup R3,48 + 15% × R3,48 = R4,00 c. i. Fish and chips ii. Pizza margherita R15,39 + 15% × R15,39 R17,10 + 15% × R17,10 = R17,70 = R19,67 iii. Pea soup R4,54 + 15% × R4,54 = R5,22
7.7 Assignment: compile a table of medicine dosages for paracetamol Learner’s Book page 319
Answers will differ.
Unit 8Measuring volumeLearner’s Book pages 320–333
Teaching tips
• In this unit, learners apply methods they learned in previous grades to a range of contexts in which volumes must be calculated, measured and combined in different ratios.
• In the context of craft activities, they must read instructions involving ratios, volumes and costs to calculate the quantities and costs of materials for different projects.
• In the context of environmental concerns about water consumption, learners interpret and critically compare research data about the volume of household water consumption. They then use data about dam capacity to calculate the volume of water available per person in a South African city. You can augment or adapt this activity by using data from your region about the volume of water in the dams that serve this region. Local dam volumes and capacities are given in newspapers from time to time, or you can consult the website of the Department of Water Affairs (www.dwa.gov.za).
• Learners calculate the run-off rate of rainwater in a whole neighbourhood – this is an extension of an activity done in Grade 11 to calculate run-off rates for individual roofs.
• The last section of the unit focuses on monitoring concentrations of substances in liquids. Learners interpret information about the E coli bacterium, and do calculations using information about how to disinfect water that may be contaminated with E coli. They also use communication skills to prepare a set of instructions about this disinfection method for people who do not speak English, or are not able to read English easily.

138 S E C T I O N 3 • W O R K E D A N S W E R S
Solutions8.1 Practise calculations with volumes and the costs of materials Learner’s Book page 324
1. a. She needs 0,5 ℓ. 5 ℓ = 20 m2
ratio: 1 ℓ : 4 m2 0,5 ℓ : 2 m2 0,125 ℓ : 0,5 m2 = 125 ml : 0,5 m2
i. Transparent glaze
Item Parts Quantity
transparent enamel 2 2 _ 4 × 125 ml = 62,5 ml
Purified linseed 1 1 _ 4 × 125 ml = 31,25 ml
turpentine oil 1 1 _ 4 × 125 ml = 31,25 ml
Artist’s oil paint A few squeezes
ii. Scumble glaze
Item Parts Quantity
Eggshell enamel 2 2 _ 5 × 125 ml = 50 ml
Boiled linseed oil 2 2 _ 5 × 125 ml = 50 ml
Mineral turpentine 1 1 _ 5 × 125 ml = 25 ml
tinter’s/artist’s oil paint A few squeezes
iii. Water-based glaze
Item Parts Quantity
PVA paint 2 2 _ 5 × 125 ml = 50 ml
Water 2 2 _ 5 × 125 ml = 50 ml
commercial glazing coat 1 1 _ 5 × 125 ml = 25 ml
iv. Milk varnish
Item Parts Quantity
Matt varnish 1 1 _ 2 × 125 ml = 62,5 ml
Mineral 1 1 _ 2 × 125 ml = 62,5 ml
White eggshell enamel A small amount
b. Living room size: 20 m2
Scumble glaze required: 5 ℓ

139T E R M 2 • U N I T 8
Item Parts Quantity
Eggshell enamel 2 2 _ 5 × 5 ℓ = 2 ℓ
Boiled linseed oil 2 2 _ 5 × 5 ℓ = 2 ℓ
Mineral turpentine 1 1 _ 5 × 5 ℓ = 1 ℓ
tinter’s/artist’s oil paint A small quantity
c. Bedroom size: 7,5 m2
Transparent glaze required: 1,875 ℓ
Item Parts Quantity
transparent enamel 2 2 _ 4 × 1 875 ml = 937,5 ml
Purified linseed 1 1 _ 4 × 1 875 ml = 468,75 ml
turpentine oil 1 1 _ 4 × 1 875 ml = 468,75 ml
Artists’ oil paint A small quantity
d. Answers will differ. 3. Answers will differ. 4. a. 400 ml mug + 10% × 400 ml = 440 ml Aysha can round off the size of the mug to 450 ml. b. 750 ml bowl + 10% × R750 ml = 825 ml Aysha can round off the size of the bowl to 850 ml. c. i. 6 mugs × 450 ml capacity per mug ÷ 1 000 ml × 500 g clay = 1 350 g clay = 1,35 kg clay ii. 6 bowls × 850 ml capacity per bowl ÷ 1 000 ml × 500 mg clay = 2 550 g clay = 2,55 kg clay
8.2 Practise interpreting statistics about water consumption Learner’s Book page 326
1–3. Answers will differ.
8.3 Practise calculating volumes of water available per person in a city Learner’s Book page 327
1. 898 300 Ml (megalitre)2. 898 200 000 000 ℓ ÷ 3 750 000 people = 239 546,67 ℓ3,4. Answers will differ.

140 S E C T I O N 3 • W O R K E D A N S W E R S
5. Dam Capacity Percentage capacity Actual volume of water
1 58 644 Ml 49,4 28 970,1 Ml
2 33 517 Ml 42,3 14 177,7 Ml
3 31 767 Ml 49,7 15 788,2 Ml
4 164 122 Ml 45,1 74 019 Ml
5 480 250 Ml 54,1 259 815,3 Ml
6 130 000 Ml 59,7 77 610 Ml
6. 470 380,3 Ml7. 470 380 300 000 ℓ ÷ 3 750 000 people = 125 434,7 ℓ
8.4 Assignment: calculate the run-off rate of rainwater for a whole neighbourhood Learner’s Book page 328
Answers will differ.
8.5 Practise using information about concentrations of liquids Learner’s Book page 332
1. a. Safe b. Safe c. 500 parts per 1 000 ℓ d. Unsafe = 50 parts per 100 ml This mixture is safe. e. 1 000 000 parts per kl = 1 000 000 parts per 1 000 ℓ = 1 000 000 parts per 1 000 000 ml = 1 part per 1 ml The mixture is safe.2. a. 50 ℓ container × 1 drop per litre (7% to 10% chlorine in the bleach) = 50 drops of bleach 50 ℓ of water are required. b. 50 ℓ container × 10 drops of bleach per litre = 500 You need 500 drops of bleach. c. 50 ℓ container × 1 drop per litre = 50 You need 50 drops of bleach. d. 35 ℓ × 10 drops of bleach per litre = 350 You need 350 drops of bleach. e. 35 ℓ × 10 drops of bleach per litre × 2 = 700 You need 700 drops of bleach. f. It will take 30 minutes for the water that is brown to be purified.

141T E R M 2 • U N I T 9
Unit 9Measuring temperatureLearner’s Book pages 334–339
Teaching tips
• This unit begins with calculations with temperature information, and converting between temperatures in degrees Fahrenheit and degrees Celsius in the context of weather. Learners then use temperature information to plan a journey; this involves using other available information to judge whether a given temperature is given in Celsius or Fahrenheit.
• The next section of the unit, focuses on interpreting temperature information concerning the safe storage of food. Measurement: Assignment 5 gives learners the opportunity to measure temperatures in their home fridges, and plan food storage accordingly. If there are learners in your class who do not have fridges at home, adapt the activity as a whole so that the class measures temperatures in a fridge at the school or in a suitable home environment (to avoid causing embarrassment among learners whose homes are not suitably equipped for the activity).
Solutions9.1 Practise calculating with temperature information Learner’s Book page 335
1. Temperatures for Los Angeles and Mexico City are in Fahrenheit; the rest are in Celsius.
2. a. summer b. winter3,4. Temperatures are rounded off to the nearest integer. 48 °F = 9 °C 55 °F = 13 °C 77 °F = 25 °C 86 °F = 30 °C
9.2 Investigation: use temperature information to plan a journey Learner’s Book page 336
Answers will differ.
9.3 Practise interpreting information about freezer storage of foods Learner’s Book page 339
1. Type of food Number of months food item can be stored in freezer
cooked food 1–2
Ice cream 1–2
Puddings 1–2
Fish 3–4
Bread 3–4
cheese 5–6
Vegetables (onions) 5–6

142 S E C T I O N 3 • W O R K E D A N S W E R S
Type of food Number of months food item can be stored in freezer
Processed or convenience food 5–6
Lamb 7–8
Pizza 7–8
duck 7–8
chicken 9–10
Vegetables (mushrooms, carrots) 9–10
rabbit 9–10
2. Answers will differ.
Unit 10Calculating perimeter, area and volumeLearner’s Book pages 340–372
Teaching tips
• The first section revises concepts and methods for finding perimeter, area and volume using accurate measurement and estimation. Learners should already be familiar with the methods used, and in this section, they practise achieving accuracy in measurements to levels suitable for different contexts.
• They then revise methods for using formulae to calculate perimeter, area and volume, and apply these methods to composite shapes.
• The next sections of the unit apply these methods in diverse practical contexts to find the quantities of materials needed and calculate the costs of these materials. Contexts include laying carpeting on a floor, tiling a given area, finding the surface area of a roof, and calculating quantities of material needed for small structures used on farms.
• Throughout these sections, learners build up a set of methods that they apply later in the unit to more complex investigations into the quantities and cost of building materials for a small house and a budget for a children’s play park.
• The section on housing density introduces learners to this concept, and guides them through a calculation of housing density in the area where they live. In the investigation in this section, you should decide on a suitable location for learners to study. They should be able to go door to door in a street collecting data, and also make contact with local municipal planning officers who can talk to them about housing density policy in the area they investigate.
Solutions10.1 Practise accurate measurements to millimetre, centimetre and metre accuracy levels Learner’s Book page 345
1–4. Answers will differ.

143T E R M 2 • U N I T 1 0
10.2 Practise measuring and calculating perimeter, area, surface area and volume Learner’s Book page 350
1. a. i. P = (2 × w) + ( 1 _ 4 × 2πr) + r + l
= (2 × 0,5 m) + ( 1 _ 4 × 2 × 3,142 × 2 m) + 2 m + 2 m
= 1 m + 3,142 m + 4 m = 8,142 m
ii. A = (l × b) + ( πr2
___ 4 ) = (2 m × 0,5 m) + ( 3,142 × 2 m2
________ 4 )
= 1 m2 + 3,142 m2
= 4,142 m2
b. i. P = ( 3 _ 2 πr) + (2s)
= 3 _ 2 (3,142 × 74 cm) + 2(74 cm)
= 348,762 cm + 148 cm = 496,762 cm
ii. A = 3 _ 4 πr2 + s2
= 3 _ 4 × 3,142 × (74 cm)2 + (74 cm)2
= 12 904,194 cm2 + 5 476 cm2
= 18 380,194 cm2
c. i. P = 3 _ 2 πr + 9,9 cm
= 3 _ 2 × 3,142 × 7 cm + 9,9 cm
= 42,891 cm
ii. A = 3 _ 4 πr2 + 1
_ 2 h × b
= ( 3 _ 4 × 3,142 × 72) + ( 1
_ 2 × 7 × 7) = 115,4685 + 24,5 = 139,9685 cm2
d. i. P = 4( 1 _ 2 × 2πr) + (8 × 9)
= 4( 1 _ 2 × 2 × 3,142) + 72
= 113,112 + 72 = 185,112 m
ii. A = s2 – 2πr2
= 362 – 2 × 3,142 × 92
= 1 296 – 509,004 = 786,996 m2
2. a. i. V = lbh = 82 cm × 16 cm × 40 cm = 52 480 cm3
ii. Surface area = 2lh + 2lb + 2hb = 2 × 82 × 40 + 2 × 82 × 16 + 2 × 16 × 40 = 10 464 cm2
b. i. V = lbh + 1 _ 2 lbh
= 6,2 × 2,1 × 2,9 + 1 _ 2 × 6,2 × 2,9 × (3,4 – 2,1)
= 49,445 m3

144 S E C T I O N 3 • W O R K E D A N S W E R S
ii. Surface area
2,9
2,9
2,9
3,4
1,3
1,3
6,2
2,1
2,1
2,1
2,1
x
x
x
x
2,9
2,1
x
1,32,1
3,4
2,92 + 1,32 = x2
8,41 + 1,69 = x2
10,1 = x2
3,178 = xx = 3,178
Surface area = 2,1 × 6,2 + 2,9 × 6,2 + 3,4 × 6,2 + 6,2 × 3,178 + 2(2,9 × 2,1
+ 1 _ 2 × 1,3 × 2,9)
= 13,02 + 17,98 + 21,08 + 19,7036 + 2(6,09 + 1,885) = 71,7836 + 15,95 = 87,7336 cm2
c. i. r = 58 ÷ 2 = 29 cm V = πr2h = 3,142 × (29)2 × 5 = 13 212,11 cm3
ii. Surface area = 2πr (r + h) = 2 × 3,142 × 29 × (29 + 5) = 182,236 × 34 = 6 196,024 cm2
d. i. r = 2,5 ÷ 2 = 1,25
V = 1 _ 2 πr2h
= 1 _ 2 × 3,142 × 1,252 × 7,9
= 19,392 m2
ii. Surface area = 1 _ 2 2πr (r + h)
= 1 _ 2 × 2 × 3,142 × 1,25 × (1,25 + 7,9)
= 3,9275 × (9,15) = 35,94 m2
3. a. Surface areas of 4 sides = 2(2 × 0,08) + 2(1 × 0,08) = 4,8 m2
b. Small triangle on top, a circle, a square, a long triangle below Each square = 100 cm2: 10 cm × 10 cm 12 blocks per row in each square ∴ the sides of each block are 10 cm ÷ 12 = 0,833 cm
Surface area = 1 _ 2 lh + πr2 + s2 + 1
_ 2 lh
= ( 1 _ 2 [4 × 0,833] × [2 × 0,833]) + [3,142 × (2 × 0,833)2]
+ (4 × 0,833)2 + [ 1 _ 2 (4 × 0,833 × 6 × 0,833)]
= (1,666 × 1,666) + 8,720797 + 11,102224 + 8,3266668 = 30,925245 cm2

145T E R M 2 • U N I T 1 0
c. Surface area of inner diamond: 2 × 1
_ 2 × 4 × 0,833 × 2 × 0,833 = 5,551112 cm2
Total surface area 30,925245 cm2
Blue tiles 5,551112 cm2
Green tiles 25,374133 cm2
d,e. If 10 cm blocks: 1 m ÷ 10 cm = 100 cm ÷ 10 cm = 10 blocks If 8 cm blocks × 0,833 blocks = 6,664 cm 1 m ÷ 6,664 cm = 15,006 blocks ≈ 15 blocks There are 15 patterns along the short side of the fishpond. Along the side with a length of 2 m: 2 m ÷ 6,664 = 30 There are 30 patterns along the side of the pond. f–h. Answers will differ. 4. Answers will differ.
10.3 Practise finding perimeter, area, surface area and the volume of real objects with composite shapes Learner’s Book page 352
Answers will differ.
10.4 Practise calculating quantities and costs of materials Learner’s Book page 358
1. a.
2 m
1,5 m
5,5 m
3 m
4,5 m
2 m3,5 m
Single piece of carpet A = l × b = 5,5 m × 4,5 m = 24,75 m2
Unused area of carpet A = 2 m × 1,5 m = 3 m2
Two pieces of carpet; no wasted carpet A = l × b + l × b = 5,5 m × 3 m + 3,5 m × 1,5 m = 16,5 m2+ 5,25 m2
= 21,75 m2

146 S E C T I O N 3 • W O R K E D A N S W E R S
If a customer wants a single piece of carpet: Options: Coir @ R330/m2
Acrylic @ R194/m2
The area is 24,75 m2
The unused area is 3 m2
Cost of coir: 24,75 m2 × R330/m2 = R8 167,50 Cost of unused carpet: 3 m2 × R330/m2 = R990 Cost of acrylic: 24,75 m2 × R194 m2 = R4 801,50 Cost of unused carpet: 3 m2 × R194/m2 = R582 If the customer accepts having a join in the carpeting Area of carpeting: 21,75 m2
Cost of sisal: R295/m2 × 21,75 m2 × R6 416,25 Cost of coir: R330/m2 × 21,75 m2 = R7 177,50 Cost of acrylic: R194/m2 × 21,75 m2 = R4 219,50 Cost of wool: R359/m2 × 21,75 m2 = R7 808,25 b. Mrs Jojobe can afford a single piece of acrylic carpet that will fit the
whole room. It will cost R4 801,50. The unused piece of carpeting required costs R582,00.
2. a. 5 mm is added to some of the lengths and widths so that material can be folded over the edge of the container (three edges of the box and three edges of the lid) when a folded box is covered. The width of the flaps is estimated to be 8 mm. If the box is folded and glued before it is covered, it is not necessary to include all the flaps when the amount of material is calculated – only the flaps of the lid need to be included. Calculations are then done as follows:
Surface area of rectangle A (no need for flaps on the short side): 110 mm × (32 mm + 5 mm) = 4 070 mm2
Surface area of rectangle B: 110 mm × 70 mm = 7 700 mm2
Surface area of rectangle C: 110 mm × 32 mm = 3 520 mm2
Surface area of rectangle D: [110 mm + 2(8 mm + 5 mm)] × (70 mm + 8 mm + 5 mm) = 11 288 mm2
Surface area of rectangles E and F: 70 mm × (32 mm + 5 mm) = 2 590 mm2
Total surface area of box (including three flaps and six sides where 5 mm of the velvet will be folded over the edges):
= 4 070 mm2 + 7 700 mm2 + 3 520 mm2 + 11 288 mm2 + 2(2 590) mm2
= 31 758 mm2
= 317,58 cm2
(To make the calculation even more accurate, you could subtract 338 mm2 from the surface area of 31 758 mm2 (for the square corners of the flaps on the length of the lid as they will be cut off). This will make the total surface area 31 420 mm2 and change the answer to question 2(b) to 222 boxes and that for question 2(c) to R1,26.)
If the net of the box is covered before it is folded, all the flaps will be covered at the same time. (The flaps are seen as rectangular.) However, if the short sides of some flaps will be diagonal, they can be cut like this before the flaps are covered – this would be four very small surface areas and so the material can simply be folded over these diagonal sides. It is not necessary to subtract these areas from the total amount of velvet that is needed. Calculations for working in this way are as follows:
Surface area of rectangle A: 110 mm × (32 mm + 5 mm) = 4 070 mm2
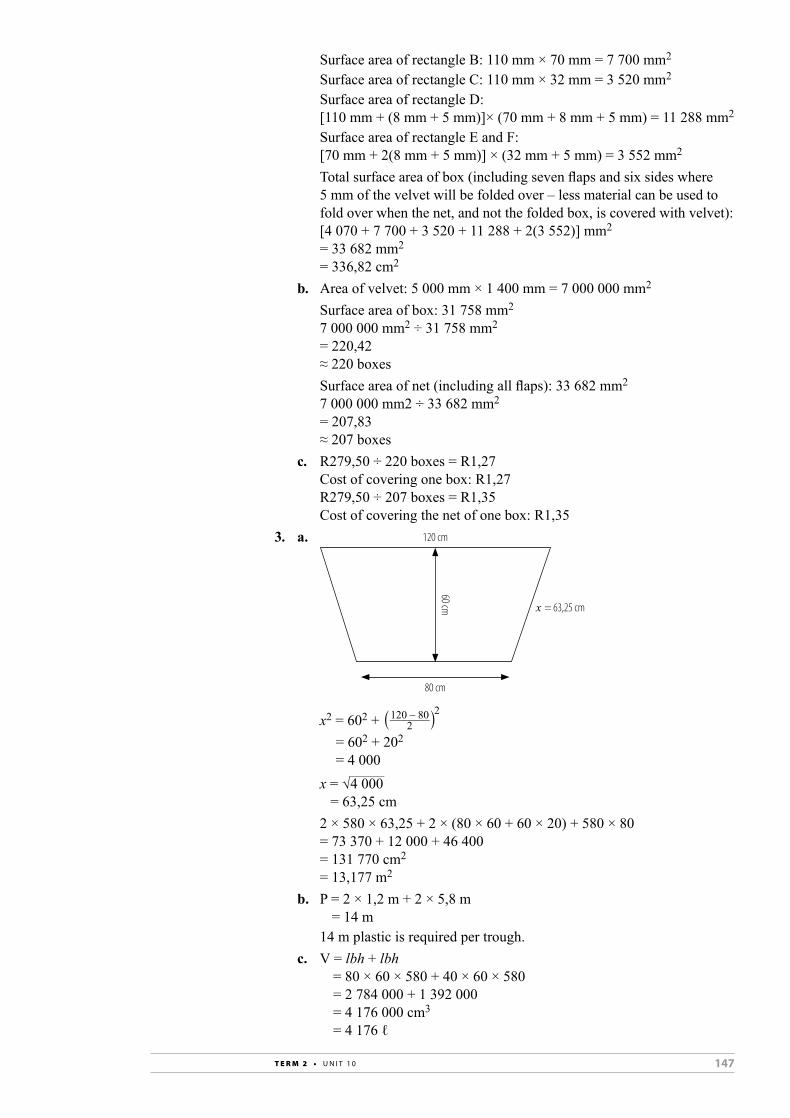
147T E R M 2 • U N I T 1 0
Surface area of rectangle B: 110 mm × 70 mm = 7 700 mm2
Surface area of rectangle C: 110 mm × 32 mm = 3 520 mm2
Surface area of rectangle D: [110 mm + (8 mm + 5 mm)]× (70 mm + 8 mm + 5 mm) = 11 288 mm2
Surface area of rectangle E and F: [70 mm + 2(8 mm + 5 mm)] × (32 mm + 5 mm) = 3 552 mm2
Total surface area of box (including seven flaps and six sides where 5 mm of the velvet will be folded over – less material can be used to fold over when the net, and not the folded box, is covered with velvet):
[4 070 + 7 700 + 3 520 + 11 288 + 2(3 552)] mm2
= 33 682 mm2
= 336,82 cm2
b. Area of velvet: 5 000 mm × 1 400 mm = 7 000 000 mm2
Surface area of box: 31 758 mm2
7 000 000 mm2 ÷ 31 758 mm2 = 220,42 ≈ 220 boxes Surface area of net (including all flaps): 33 682 mm2
7 000 000 mm2 ÷ 33 682 mm2 = 207,83 ≈ 207 boxes c. R279,50 ÷ 220 boxes = R1,27 Cost of covering one box: R1,27 R279,50 ÷ 207 boxes = R1,35 Cost of covering the net of one box: R1,353. a. 120 cm
80 cm
60 cm x = 63,25 cm
x2 = 602 + ( 120 – 80 ______ 2 )
2
= 602 + 202
= 4 000 x = √
_____ 4 000
= 63,25 cm 2 × 580 × 63,25 + 2 × (80 × 60 + 60 × 20) + 580 × 80 = 73 370 + 12 000 + 46 400 = 131 770 cm2
= 13,177 m2
b. P = 2 × 1,2 m + 2 × 5,8 m = 14 m 14 m plastic is required per trough. c. V = lbh + lbh = 80 × 60 × 580 + 40 × 60 × 580 = 2 784 000 + 1 392 000 = 4 176 000 cm3
= 4 176 ℓ

148 S E C T I O N 3 • W O R K E D A N S W E R S
d. 3 480 ℓ ÷ (4 ℓ per day × 15 animals) = 69,6 The farmer can refill once every 69 days.4. a. Rods: 7 × 10,8 m = 75,6 m Semicircle: P = πr = 3,142 × (6 m ÷ 2) = 9,426 m Total length requried: 75,6 m + 2 × 9,426 m = 94,452 m b. A = 1
_ 2 × 2πr (r + h) + 10% ( 1 _ 2 × πr2)
= 3,142 × 3(3 + 10,8) + 10% ( 1 _ 2 × 3,142 × 32)
= 130,0788 + 1,4139 = 131,4927 m2
c–e. Answers will differ. 5. a. Side view
Front/back
2,8 m
9,2 m
b. Area of side wall: 12,6 m × 2,8 m = 35,28 m2
Convert to cm2
= 352 800 cm2
Area of brickface: 25 cm × 5,5 cm = 137,5 cm2
352 800 cm2 = 137,5 cm2
= 2 565,82 = 2 566 bricks Area of front/back wall: 9,2 m × 2,8 m = 25,76 m2
Convert to cm: 257 600 cm2 ÷ 137,5 cm2
= 1 873,45 = 1 874 bricks Bricks required: 2 × 2 566 + 2 × 1 874 bricks = 8 880 bricks
2,8 m
12,6 m

149T E R M 2 • U N I T 1 0
c,d. Answers will differ. e. Learners are not expected to redo the calculations in questions 5(b)
and (d) to include the mortar, but you could add this as an activity for revision or assessment at a later stage.
6. Answers will differ. 7. a. R802 b. R610 + R802 = R1 412 c. Answers will differ.
10.5 Assignment: update a construction budget for a house Learner’s Book page 362
You may want to choose one of the two activities for the class to do; the assignment is a less complex approach than the investigation of the same topic of new house construction costs (Measurement: Investigation 5).
10.6 Investigation: Housing density where you live Learner’s Book page 365
Answers will differ.
Revise and consolidate Learner’s Book page 369
1. a. Running cost calculation (assume petrol price is R11,70): Fuel factor + service and repair costs + tyre costs 6,91 × R11,70/ℓ + 17,18 + 9,57 = 107,507 ≈ 108c = R1,08 Fixed cost element: 94c Total operating cost: R1,08 + 94c = R2,02 b. Running cost: 8,26 × R11,70/ℓ + 19,23 + 16,32 ≈ 132,192c = R1,32 Fixed cost element: 134c Total operating cost: R1,32 + R1,34 = R2,66 c. Running cost: 6,91 × R11,70/ℓ + 17,09 + 9,57 = 107,507c = 108c ≈ R1,08 Fixed cost element: 116c Total operating cost: R1,08 + R1,16 = R2,242. Running costs (assume petrol price is R11,70 per litre): Fuel factor + service and repair costs + tyre costs = 8,26 + R11,7/ℓ + 19,23 + 16,32 = 132,19c = R1,32 Total operating costs: = R1,32 + 4,09 = R5,41
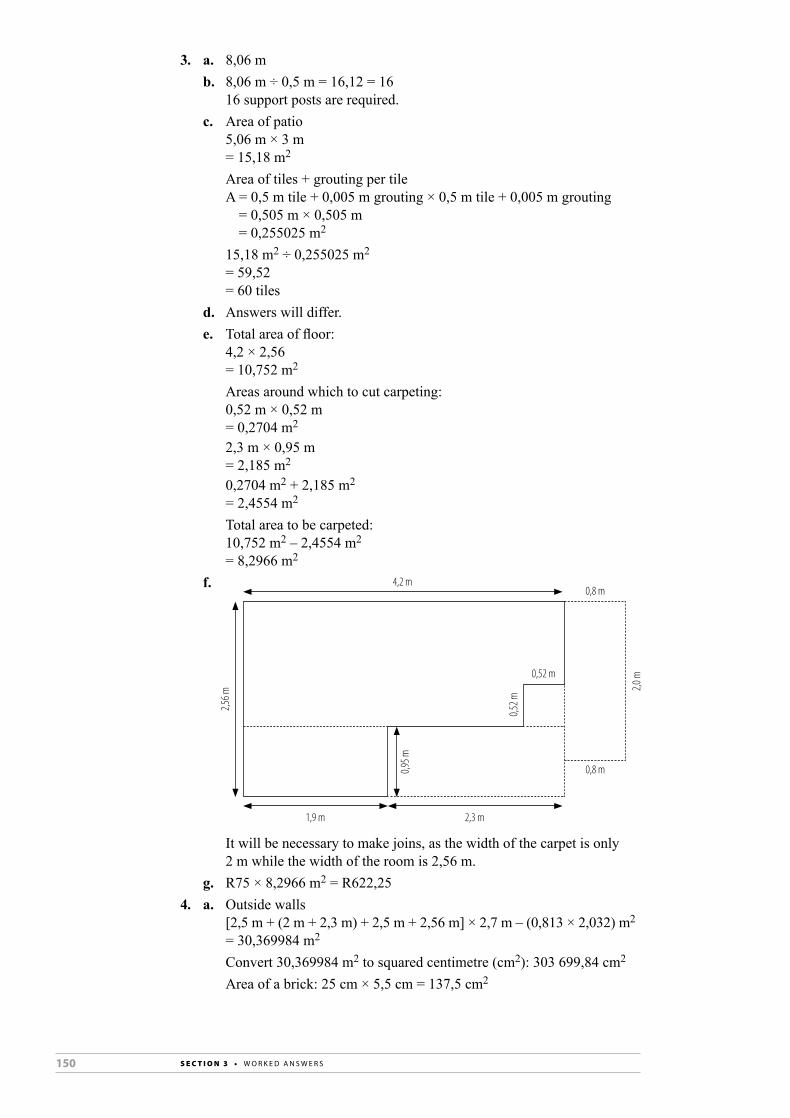
150 S E C T I O N 3 • W O R K E D A N S W E R S
3. a. 8,06 m b. 8,06 m ÷ 0,5 m = 16,12 = 16 16 support posts are required. c. Area of patio 5,06 m × 3 m = 15,18 m2
Area of tiles + grouting per tile A = 0,5 m tile + 0,005 m grouting × 0,5 m tile + 0,005 m grouting = 0,505 m × 0,505 m = 0,255025 m2
15,18 m2 ÷ 0,255025 m2
= 59,52 = 60 tiles d. Answers will differ. e. Total area of floor: 4,2 × 2,56 = 10,752 m2
Areas around which to cut carpeting: 0,52 m × 0,52 m = 0,2704 m2
2,3 m × 0,95 m = 2,185 m2
0,2704 m2 + 2,185 m2
= 2,4554 m2
Total area to be carpeted: 10,752 m2 – 2,4554 m2
= 8,2966 m2
f. 4,2 m0,8 m
0,52 m
0,52 m
0,8 m
2,3 m1,9 m
0,95 m
2,56 m
2,0 m
It will be necessary to make joins, as the width of the carpet is only 2 m while the width of the room is 2,56 m.
g. R75 × 8,2966 m2 = R622,254. a. Outside walls [2,5 m + (2 m + 2,3 m) + 2,5 m + 2,56 m] × 2,7 m – (0,813 × 2,032) m2
= 30,369984 m2
Convert 30,369984 m2 to squared centimetre (cm2): 303 699,84 cm2
Area of a brick: 25 cm × 5,5 cm = 137,5 cm2

151T E R M 2 • U N I T 1 0
303 699,84 cm2 ÷ 137,5 cm2
= 2 208,726 = 2 209 bricks b. Inside walls (4,2 m + 2,5 m) × 2,7 – 2(0,813 m × 2,032 m) = 18,09 m2 – 3,304032 m2
= 14,785968 m2
Convert 14,785968 m2 to squared centimetre (cm2): 147 859,68 cm2
147 859,68 cm2 ÷ 137,5 = 1 075,34 = 1 076 bricks5. Learners compare answers.6. a. V = πr2h = 3,142 × 45 cm × 160 cm = 22 622,4 cm3
b. Convert to litres: 22 622,4 cm3 ÷ 1 000 cm3 = 22,6224 ℓ 22,6224 ℓ × 780 g = 17 645,472 g = 17,645472 kg c. 2πr (r + h) 2 × 3,142 × 45 cm (45 cm + 160 cm) = 57 969,9 cm2
= 5,79699 m2
d. The barrel must be coated inside and outside: 5,7699 m2 × 2
_________ 40 m2 = 0,29 packets e. 0,29 × R849 = R246,21 But the coating is sold in packets of 15 kg at R849 per packet. So, the
waterproofing will cost R849.7. a. Normal weight b. Obese c. Normal weight d. Normal weight8. a. 4 + 4 + 4 + 3 + 1 = 16 parts 5 kg = 5 000 g Mass of each part: 5 000 g ÷ 16 = 312,5 g Linseeds: 4 parts × 312,5 g = 1 250 g Pumpkin seeds: 4 parts × 312,5 g = 1 250 g Sunflower seeds: 4 parts × 312,5 g = 1 250 g White sesame seeds: 3 parts × 312,5 g = 937,5 g Black sesame seeds: 1 part × 312,5 g 312,5 g b. 5 000 g seed mix × 30 ml olive or avocado oil ÷ 500 g seed mix = 300 ml olive or avocado oil9. a. Fahrenheit b. 4,4 °C to 15,56 °C Item should be refrigerated or kept cool.10. You can cook the fish pie at about 195 °C for 25 minutes and then at
215 °C for 5 minutes to 10 minutes to make the crust crispy (cook at approximately 15 °C hotter).
11. a. 1 920 m2 = 0,192 ha One dwelling can be built on 0,192 ha.

152 S E C T I O N 3 • W O R K E D A N S W E R S
b. 16 ÷ 0,192 = 83,33 dwellings/ha The housing density is 83 dwellings per hectare. c. 16 houses × 5 people = 80 people per 0,192 ha 80 ÷ 0,192 = 416,67/ha The housing density is 416 people per hectare.12. a. 500 houses ÷ 4,4 ha = 113,64 dwellings per hectare A density of 113,64 dwellings per household is fewer than the
municipal limit of 120 dwellings per hectare. However, the development does not satisfy the municipaly’s housing policy.
Explanations will differ. b. Answers will differ.

153T E R M 3 • U N I T 1
TERM 3
WORKED ANSWERS
Unit 1TaxationLearner’s Book pages 374–399
Teaching tips• In this unit, learners work with three forms of taxation: value-added tax
(VAT), contributions to the Unemployment Insurance Fund (UIF), and employee and personal income tax.
• Learners also worked with VAT and UIF in Grade 10 and Grade 11. You can use the first activity to assess their ability to calculate VAT, prices that include VAT and ones that exclude VAT, and understand and calculate the employee and employer contributions to the UIF.
• The VAT rate in South Africa has changed from 14% to 15%. If learners are using older editions of the Learner Book, you will need to guide them to use the new VAT rate in their calculations, instead of the old rate given in the Learner Book.
• The remainder of the unit focuses on employee income tax and personal income tax.
Learners should be able to calculate employee tax, personal income tax and net pay based on information given about gross pay, PAYE, deductions, tax credits and so on. The Learner’s Book gives a flow chart and a detailed example to help learners follow the steps in the calculation process. Encourage them to use these guidelines when they do the calculation activities. If they follow the example step by step, they will arrive at the correct tax calculation in each case.
• Learners should also be able to work with weekly, fortnightly and monthly tax tables, as well as the table of tax brackets and formulae to calculate the tax payable on different amounts of taxable remuneration. Detailed examples of these calculations are given in the Learner’s Book. You can download the full tax tables for the current year from the SARS website (www.sars.gov.za). You could print a few pages from the different tables (or let learners access the tables online) and ask the learners to practise reading off values for different remuneration amounts and payment periods. You will also find more recent tables of tax brackets and formulae on the SARS website (www.sars.gov.za); use these to keep the examples in the activities up to date.
• Learners need to be able to analyse information about income tax on IRP5 forms provided by employers, as well as the SARS IRP5/3T(a) return for employee tax and the ITR12 return for personal income tax. The Learner’s Book works through examples of these forms. (The forms can be downloaded directly from the SARS website (www.sars.gov.za).) You can use blank forms to give learners further practice in analysing the forms by filling in details you give them for other examples of employee pay and deductions.

154 S E C T I O N 3 • W O R K E D A N S W E R S
• Understanding tax return terminology is an important prerequisite for working with these documents. The terms used on income tax forms are explained in the Learner’s Book, and then used to discuss the methods of calculating income tax. Make sure that learners can interpret and use these terms accurately in the activities in this section.
• Once learners understand how to calculate tax payable on a given amount of taxable income, they should investigate how an increase in pay can affect the amount of tax payable. Ensure that they understand not only the basic calculation method for the new amount of pay, but also the concept that income tax can increase at a higher rate (percentage) than a pay increase, if the pay increase pushes the new taxable income into a higher tax bracket. This is explained in the unit, with reference to examples. If necessary, work though more examples with the learners before they do the activities, to ensure that they grasp this concept fully.
Solutions1.1 Practise doing VAt and uIF calculations Learner’s Book page 377
1. a. R682,61 b. R117,75 c. R902,75 d. R102,39 e. R15 586,96 f. R17 925 g. R103 913,04 h. R137 425

155T E R M 3 • U N I T 1
2. a. Month Gross sales income (R)
Income from zero-rated goods (R)
Income from taxable goods (R)
VAT (R)
April 884 301,25 190 445,25 693 856,00 90 502,96
May 901 308,67 198 300,78 703 007,89 91 696,68
June 852 549,40 175 400,35 677 149,05 88 323,79
July 934 210,32 210 207,45 724 002,87 94 435,16
August 912 767,35 187 744,65 725 022,70 94 568,18
September 895 335,20 203 358,30 691 976,90 90 257,86
Total 5 380 472,19 549 784,63
The supermarket must pay R549 784,63 VAT. b. Net sales = gross sales income – VAT payable = R5 380 472,19 – R549 784,63 = R4 830 687,563. a. R11 430 × 1% = R114,30 b. R8 005 × 1% = R80,05 c. R29 660 × 1% = R296,604. a. R678 × 1% = R6,78 b. R712,50 × 1% = R7,13 R7,13 – R6,78 = R0,35 Lesego’s UIF increased by 35c per week.5. a. Wage of R1 588,50 × 4 weeks × 1% UIF dedution = R63,54 (for each employee) Fortnight’s wage of R4 550 × 2 fortnights per month × 1% UIF = R91 Salary of R15 436,80 × 1% UIF = R154,37 b. 2 × R63,54 + R91 + R154,37 = R372,45 c. Zwelethu’s UIF contributions for one year: (2 × R15,88 × 52 + R45,50 × [52 ÷ 2] + R154,37 × 12) = R4 686,96 Employer’s contribution: R4 686,96 Total UIF contributions = 2 × R4 686 ,96 = R9 373,926. Maximum UIF rate: 58% R4 355,40 × 58% = R2 526,13 (Every two weeks for a maximum of 288 days.) Alternative calculation: A fortnight’s wage of R4 335,40, means a monthly wage of R8 710,80. 58% of R8 710,80 = R5 052,26 per month for a maximum of 7,9 months
(238 days ÷ 30 days). The maximum UIF benefit she could receive is about R3 992,85 per
month for a period of 238 days. Or, using the fortnightly wage of R4 335,40: R4 335,40 ÷ 14 = R311,10 per day 58% × R311,10 = R180,44 per day She received R180,44 per day for 238 days.

156 S E C T I O N 3 • W O R K E D A N S W E R S
1.2 Practise using tax tables, tax brackets and formulae Learner’s Book page 386
1. a. R341 b. R311 c. R317 d. R2732. a. The 72-year-old pays more PAYE per month. A 65-year-old who earns R25 725 per month will pay R4 258 tax
per month. A 72-year-old who earns R25 966 per month will pay R4 335 tax
per month. b. The 27-year-old will have more PAYE deducted from the monthly salary. The 44-year-old who earns R27 928 will have R5 449 PAYE deduced
from the salary. The 27-year-old who earns R29 005 will have R5 778 PAYE deducted
from the montly salary. c. The 68-year-old will have more PAYE deducted from the monthly
salary. The 51-year-old who earns R24 412 per month will have R4 393
PAYE deducted from the salary. The 68-year-old who earns R26 412 per month will have R4 457
PAYE deducted from the salary.3. a. R75 401 × 18% = R13 572,18 b. R28 800 + 25% × (R189 833 – R160 000) = R36 258,25 c. R128 400 + 38% × (R608 071 – R484 000) = R175 546,98 d. R128 400 + 38% × (R494 775 – R484 000) = R132 494,50 e. R51 300 + 30% × (R282 369 – 250 000) = R61 010,70 f. R80 100 + 35% × (R399 000 – R346 000) = R98 6504. a. Thabong’s monthly taxable income of R27 500 is equivalent to an
annual taxable income of R330 000. His new monthly taxable income of R28 883 is equivalent to an
annual taxable income of R346 596. i. Difference: R346 596 – R330 000 = R16 596 ii. Percentage increase: 5,03% Income tax payable on a monthly taxable income of R27 500
(or R330 000 p.a.): R51 300 + 30% of (R330 000 – R250 000) = R75 300 Income tax payable on an increased monthly taxable income of
R28 883 (or R346 596 p.a.): R80 100 + 35% of (R346 596 – R346 000) = R80 308,60 i. Difference in income tax payable: R80 308,60 – R75 300,00 = R5 008,60 ii. Percentage increase in income tax payable:
5 008,60
_______ 75 300,00 × 100 ___ 1 = 6,65%

157T E R M 3 • U N I T 1
b. Dorothy’s monthly taxable income of R20 325 is equivalent to an annual taxable income of R243 900.
Her new monthly taxable income of R22 459 is equivalent to an annual taxable income of R269 508.
i. Difference: R25 608 ii. Percentage increase:10,5% Income tax payable on a monthly taxable income of R20 325
(or R243 900 p.a.): R28 800 + 25% of (R243 900 – R160 000) = R49 775 Income tax payable on an increased monthly taxable income of
R22 459 (or R269 508 p.a.): R51 300 + 30% of (R269 508 – R250 000) = R57 152,40 i. Difference in income tax payable: R57 152,40 – R49 775,00 = R7 377,40 ii. Percentage increase in income tax payable:
7 377,40
_______ 49 775,00 × 100 ___ 1 = 14,8%
c. Jan-Hendrik’s monthly taxable income of R51 287 is equivalent to an annual taxable income of R615 444.
His new monthly taxable income of R52 000 is equivalent to an annual taxable income of R624 000.
i. Difference: R8 556 ii. Precentage increase: 1,39% Income tax payable on a monthly taxable income of R51 287
(or R615 444 p.a.): R128 400 + 38% of (R615 444 – R484 000) = R178 348,72 Income tax payable on an increased monthly taxable income of
R52 000 (or R624 000 p.a.): R178 940 + 40% of (R624 000 – R617 000) = R181 749 i. Difference in income tax payable: R181 740,00 – R178 348,72 = R3 391,28 ii. Percentage increase in income tax payable:
3 391,28
_______ 178 348,72 × 100 ___ 1 = 1,9%
1.3 Practise calculating taxable income and income tax payable Learner’s Book page 389
1. a. Gross income
Annual salary (r34 800 × 12) r417 600
Interest on bank account r15 500
car allowance from employer (r500 × 12) r6 000
total gross income r439 100
uIF contribution (1% of gross salary) r4 176
Pension fund contribution (r300 × 12) r3 600
total non-taxable deductions r7 776
taxable income r431 324

158 S E C T I O N 3 • W O R K E D A N S W E R S
b. R80 100 + 35% (R431 324 – R346 000) = R109 963,40 c. Total tax payable (according to tax table) R109 963,40 Subtract primary tax rebate – 10 755,00 99 208,40 PAYE deducted by employer 12 × R7 100 –85 200,00 Balance owed by Laureen R14 008,40
2. taxable income r463 068,00
total tax payable as per tax tables: r80 100 + 35% (463 068 – 346 000)
r121 073,80
Subtract tax rebate
Primary tax rebate r10 755,00
Secondary tax rebate r6 012,00
Subtract tax credits
Medical aid for Moeletsi and his wife (r230 each) r5 520,00
total tax payable r98 763,80
PAyE deducted by employer (12 × 3 250) r39 000,00
Balance tax payable r59 786,80
3. a. Gross income for year
Annual salary (r9 450 × 12) r113 400,00
Housing subsidy from employer (r750 × 12)
r9 000,00
total gross income r122 400,00
Pension fund contribution (r450 × 12) r5 400,00
Employee uIF contribution (1% of gross salary)
r1 134,00
total non-taxable deductions r6 534,00
taxable income r115 866,00
b. 18% × R115 866 = R20 855,88 c. Total tax payable on taxable income R20 855,88 Subtract primary tax rebate – R5 700 Total tax payable R15 155,88 d. R834 × 12 = R10 008 e. R5 147,884. a. Gross income for the year
rental income (r16 000 × 12) r192 000
Interest on investments r9 800
total gross income r201 800
rental expenses (r3 560 × 12) r42 720
total non-taxable deduction r42 720
taxable income r159 080
b. R159 080 × 18% = R28 634,40

159T E R M 3 • U N I T 1
c. Tax rebate
Primary tax rebate r9 900
tax credits
Medical aid for Josiah and his dependants
Josiah: r200 × 12 r2 400
First dependant: r200 × 12 r2 400
Second dependant: r144 × 12 r1 728
third dependant: r144 × 12 r1 728
Fourth dependant: r144 × 12 r1 728
total tax credits r9 984
d. Total tax payable on taxable income R28 634,40 Subtract primary tax rebate – R9 900 Subtract tax credits Subtract medical aid tax credit – R9 984 Total tax payable R8 750
1.4 Practise analysing tax forms Learner’s Book page 398
1. a. 2011 b. Price Davidson Accountants (Pty) Ltd c. 12 months of the tax year d. 12 e. R417 420 f. Pension fund R31 306 Medical aid R16 710 g. R89 037,73 h. R96 456,372. Answers will differ. 3. a. Gift from daughter to the value of R25 000 and a foreign pension of
R87 950 b. No c. R42 366 d. 16 182 km e. Fuel and oil of R7 330 + maintenance and repairs of R1 296 +
insurance and licence fees of R6 832 + wear and tear of R12 000 = R27 4584. a. R12 569 b. Provisional tax c. R7 740 d. R572 499 e. R180 124,60 f. R151 405 g. Answers will differ.

160 S E C T I O N 3 • W O R K E D A N S W E R S
Unit 2Exchange ratesLearner’s Book pages 400–417
Teaching tips• This unit consolidates and extends what learners learned in Grade 11
about the exchange rates that are used to buy foreign currency. The Learner’s Book gives a range of examples of exchange rate tables, as published in daily newspapers, on websites and in the foreign currency sections of banks. If possible bring current versions of these tables to class for the learners to use – they can compare the rates in current tables with those in the Learner’s Book, and discuss whether the currencies have become stronger or weaker relative to the rand.
• Learners need to be able to use estimation to convert foreign currencies into rand, and rand into different foreign currencies – they do not need to use algebra or accurate calculations to many decimal places. They can do estimation by rounding off an exchange rate to the nearest whole number, or to two decimal places if prices are being given in, for example, dollars and cents. Help learners to develop their estimation skills by doing rapid mental estimations with rates: for example, if US$1 is about R8,50, approximately what does it cost to buy US$10, US$50, and so on?
• Budgeting with foreign currency involves checking how the exchange rate changes for the foreign currency you want to use – learners should develop the habit of comparing exchange rates they used in a previous activity with the exchange rate for the same currency that they find at a later time to see if the currency now costs more or fewer rand. The Learner’s Book assignment on preparing a budget for a foreign trip can be used as a preparatory task before learners tackle the bigger assignment, Finance: Assignment 8, which involves a more extended exercise in budgeting to pay for travel costs and accommodation.
• To understand strong and weak currencies, let learners discuss a range of examples of goods that are imported from foreign countries (for example, CDs, clothes, computers and cars) and where the strength of the foreign currency affects whether the price in rand will increase or decrease. Examples of this are given in the Learner’s Book, and learners can research further examples by looking at the prices of goods in dollars, pounds, euros and so on on the internet, and converting these prices to rand using the daily exchange rate for a few days. They will soon see whether the rand becomes stronger (if the price of the item decreases) or weaker (if the price of the item increases).
• To understand the concept of the buying power of a currency, learners need to think about the cost of goods in that currency for the people who live in that country (for example, the price of goods in US$ for people who live in the USA) relative to the amount of money people earn in the same country. The table in the Learner’s Book that shows the number of hours needed to earn enough money to buy 1 kg of bread, 1 kg of flour, a Big Mac or an iPod nano is a concrete way to express the buying power of a currency when compared to other currencies. Learners may need help to see how this concept works in practice. If necessary give more examples of goods that can be used to compare buying power (for example, how many months or years a South African who earns R10 000 per month must work to afford a car that costs R250 000 and how many months or years

161T E R M 3 • U N I T 2
German who earners €2 500 per month must work to afford the same car that costs €17 000 in Germany).
• Finance: Assignment 8, Plan a holiday in southern Africa, brings together a number of concepts and methods that learners have worked with during this course. They must use exchange rate tables to estimate the costs of transport and accommodation and use these estimates to draw up a budget; they must read tariff tables to find the costs of different sections of the journey; they must interpret maps and transport timetables to find information about the time taken to cover the different possible routes, and which scheduled trains or buses to catch; and they must combine all this information to create a travel schedule that fits into the available number of days (21), stays within the budget limit (R10 000), and covers at least three countries.
Solutions2.1 Revise using estimations of currency values Learner’s Book page 401
1. a. Nigerian naira 1 960,33 b. R261,96 c. 550 Algerian dinar ÷ 81,5549 = $6,74 3 000 Zambian Kw ÷ 4 727,5 = $0,63 550 Algerian dinar cost more. d. R750 = 554,33 Egyptian pound You do not have enough to afford the room. e. Angola kw: 795 ÷ 11,6316 = R68,35 Mozambican metical: 280 ÷ 3,4088 = R82,14 The Angolan price is better.2. a. 30 400 Angolan kwanza = R2 613,57 b. 72 600 Tanzanian shillings = R377,90 c. 1 600 Kenyan shilings = R156,73 d. 30 000 Zambian kwacha = R52,14 e. 95 Namibian dollars = R94,95
2.2 Assignment: Prepare a budget estimate for a foreign trip Learner’s Book page 403
Answers will differ.
2.3 Practise comparing stronger and weaker currencies Learner’s Book page 485
1. a. March 2009: £1 = R14,5361; £1 = R14,54 May 2010: £1 = R11,2282; £1 = R11,23 April 2011: £1 = R10,5008; £1 = R10,50 July 2012: £1 = R12,5275; £1 = R12,53 b. The pound became weaker against the rand because it decreased in
value from £1 : R14,54 to £1 : R11,23. c. Answers will differ. d. March 2009: €1 = R12,92 May 2010: €1 = R9,25 April 2011: €1 = R9,57 July 2012: €1 = R9,84

162 S E C T I O N 3 • W O R K E D A N S W E R S
e. May 2010 f,g. Answers will differ. 2. a. i. April 2011 ii. US$10,99 × R6,5711/$ = R72,22 b. i. April 2011 ii. £12,50 × R10,5008/£ = R131,26 c. i. May 2010 ii. €328,90 × R9,2515/€ = R3 042,823. a. May 2010: R7 500 ÷ R11,2282/£ = £667,96 July 2012: R7 500 ÷ R12,5275/£ = £598,68 She would save £69,28 if she bought the painting in July 2012. b. March 2009: R189,95 per pair × 2 000 pairs ÷ R12,9248/€ = €29 393,10 April 2011: R189,95 per pair × 2 000 pairs ÷ R9,5663/€ = €39 712,32 April 2001 €39 712,32 March 2009 €29 393,10 Difference €10 319,22 c. €70 × R9,5663/€ = R669,64 $65 × R6,5711/US$ = R427,12 d. i. €70 + 5% = €73,50 €65 + 5% = €68,25 ii. $73,50 × R9,8369/$ = R723,01 $68,25 × R8,0136/$ = R546,93 Euro tariff: R723,01 − R669,64 ______________ R669,64 × 100% = 7,97%
US dollar tariff: R546,93 − R427,12
_____________ R427,12 × 100% = 28,05%
2.4 Practise analysing an article about the buying power of different currencies Learner’s Book page 407
1. Answers will differ. 2. The Netherlands3. Amsterdam, Berlin, Dubai, London, New York, Sydney, Tokyo and Zurich4. a. Amsterdam, Berlin, Dubai, Johannesburg, London, New York,
Singapore, Sydney, and Zurich b. London, New York, Zurich5. Answers will differ. 6. False. The less time it takes to earn the money to buy an iPod, the greater
the buying power of the currency compared to our countries.7. Answers will differ.

163T E R M 3 • U N I T 2
Revise and consolidate Learner’s Book page 411
1. a. R249 550 × 15% = R37 432,50 b. 60 kg × 89,98/10 kg × 15% = R80,98 c. 150 ℓ at R230/30 ℓ inclusive of VAT 150 ℓ × R230/30 ℓ ÷ 115 × 15 = R150,002. a. R899,99 ÷ 115 × 100 = R782,60 b. R3 450 ÷ 115 × 100 = R3 000,00 c. R350 (VAT inclusive) for 10 light bulbs R35 (VAT inclusive) for 1 light bulb R35 ÷ 115 × 100 = R30,433. a. 200 bags at R10,50/bag = R2 100 (zero-rated) b. (R1 650 ÷ 4) + 15% = R474,38 per tyre (inclusive)
4. Details Total sales income (VAT incl.) (R)
Sales of zero-rated goods (R)
Sales of taxable goods (R)
VAT amount (R)
January 12 688 944,32 994 782,16 11 694 162,16 1 525 325,50
February 14 067 881,17 1 338 157,98 12 729 723,19 1 660 398,68
VAT payable 3 185 724,18
March 14 993 015,46 1 655 981,53 13 337 033,93 1 739 613,12
April 13 872 172,06 894 716,33 12 977 455,73 1 692 711,62
VAT payable 3 432 324,74
May 15 221 954,34 2 672 841,95 12 549 112,39 1 636 840,75
June 15 008 925,17 2 115 390,88 12 893 534,29 1 681 765,34
VAT payable 3 318 606,09
5. i. a. R20,45 per week ii. a. R20,45 per week b. R92,33 per fortnight b. R92,33 per fortnight c. R392,28 per month c. R392,28 per month d. R4 257,78 per year d. R4 257,78 per year6. a. R13 674 b. R136,74 c. R14 439,74 d. R144,407. a. R1 135 ÷ 7 = R162,14 per day 58% of R162,14 = R94,04 per day b. Learners dicuss answers.8. a. R75 250 + 35% × (R390 235 – R325 000) = R98 082,25 b. R168 250 + 40% × (R1 200 345 – 580 000) = R416 388 c. R127 720 × 18% = R22 989,60 d. R128 750 + 38% × (R43 566 – R455 000) = R139 605,08 e. R27 000 + 25% × (R228 300 – R150 000) = R46 575 f. R27 000 + 25% × (R198 038 – R150 000) = R39 009,509. a. Taxable income R16 503 × 12 = R198 036

164 S E C T I O N 3 • W O R K E D A N S W E R S
Tax payable R27 000 + 25% × (R198 036 – R150 000) = R39 009 Taxable income after increase R17 196 × 12 = R206 352 Tax payable after increase R27 000 + 25% × (R206 352 – R150 000) = R41 088 b. Taxable income: R40 297 × 12 = R483 564 Tax payable: R128 750 + 38% × (R483 564 – R455 000) = R139 604,32 Taxable income after increase: R43 561 × 12 = R522 732 Tax payable after increase: R128 750 + 38% × (R522 732 – R455 000) = R154 488,16 c. Taxable income: R100 029 × 12 = R1 200 348 Tax payable: R168 250 + 40% × (R1 200 348 – R580 000) = R416 389,20 Taxable income after increase: R112 032 × 12 = R1 344 384 Tax payable: R168 250 + 40% × (R1 344 384 – R580 000) = R474 003,60 d. Taxable income: R19 025 × 12 = R228 300 Tax payable: R27 000 + 25% × (R228 300 – R150 000) = R46 575 Taxable income after increase: R23 591 × 12 = R283 092 Tax payable: R48 250 + 30% × (R283 092 – 235 000) = R62 677,6010. a. i. Annual taxable income
Gross income
Annual salary (r19 450 × 12) 233 400
Additional income (r16 000 × 12) 192 000
total gross income 425 400
Business expenses (r2 150 × 12) 25 800
Pension contribution (295 × 12) 3 540
uIF 2 334
Subtract total non-taxable deductions 31 674
taxable income 393 726
ii. Total tax payable according to tax tables (R75 250 + 35% (R393 726 – R325 000)) 99 304,10 Subtract primary tax rebate – 10 755,00 PAYE deducted by employer (R2 217,50 × 12) – 26 610,00 Balance owing R61 339,10
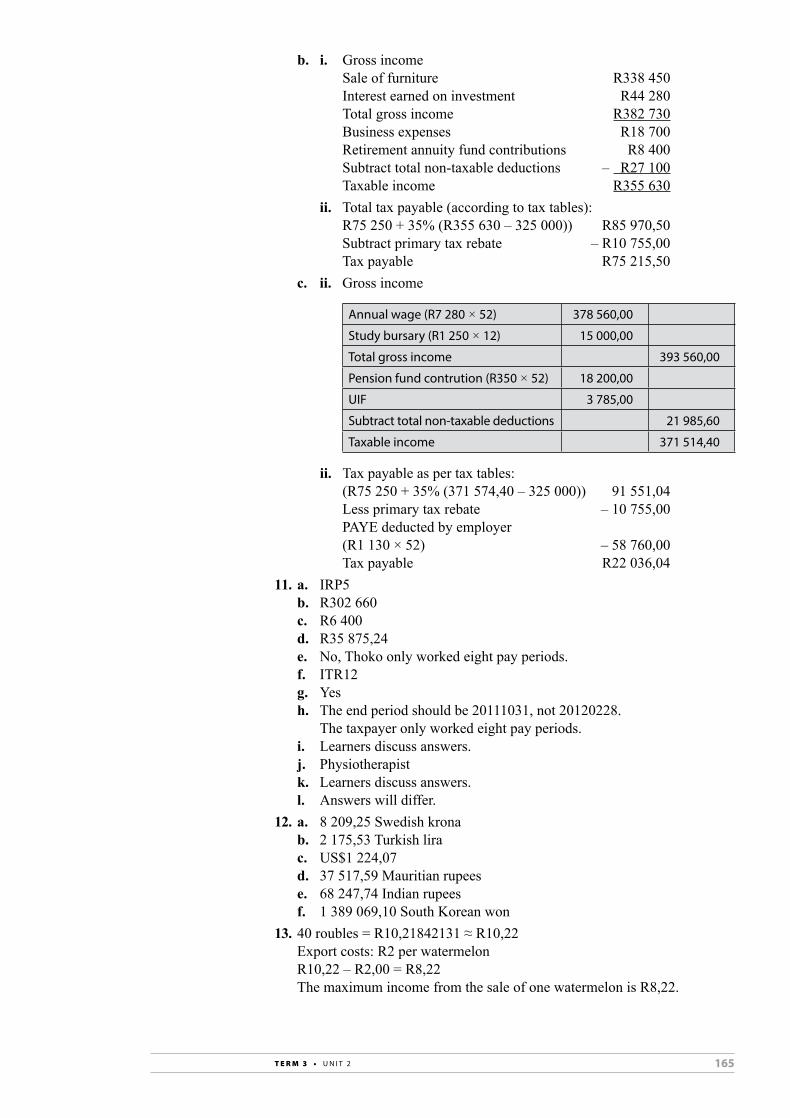
165T E R M 3 • U N I T 2
b. i. Gross income Sale of furniture R338 450 Interest earned on investment R44 280 Total gross income R382 730 Business expenses R18 700 Retirement annuity fund contributions R8 400 Subtract total non-taxable deductions – R27 100 Taxable income R355 630 ii. Total tax payable (according to tax tables): R75 250 + 35% (R355 630 – 325 000)) R85 970,50 Subtract primary tax rebate – R10 755,00 Tax payable R75 215,50 c. ii. Gross income
Annual wage (r7 280 × 52) 378 560,00
Study bursary (r1 250 × 12) 15 000,00
total gross income 393 560,00
Pension fund contrution (r350 × 52) 18 200,00
uIF 3 785,00
Subtract total non-taxable deductions 21 985,60
taxable income 371 514,40
ii. Tax payable as per tax tables: (R75 250 + 35% (371 574,40 – 325 000)) 91 551,04 Less primary tax rebate – 10 755,00 PAYE deducted by employer (R1 130 × 52) – 58 760,00 Tax payable R22 036,0411. a. IRP5 b. R302 660 c. R6 400 d. R35 875,24 e. No, Thoko only worked eight pay periods. f. ITR12 g. Yes h. The end period should be 20111031, not 20120228.
The taxpayer only worked eight pay periods. i. Learners discuss answers. j. Physiotherapist k. Learners discuss answers. l. Answers will differ. 12. a. 8 209,25 Swedish krona b. 2 175,53 Turkish lira c. US$1 224,07 d. 37 517,59 Mauritian rupees e. 68 247,74 Indian rupees f. 1 389 069,10 South Korean won13. 40 roubles = R10,21842131 ≈ R10,22 Export costs: R2 per watermelon R10,22 – R2,00 = R8,22 The maximum income from the sale of one watermelon is R8,22.
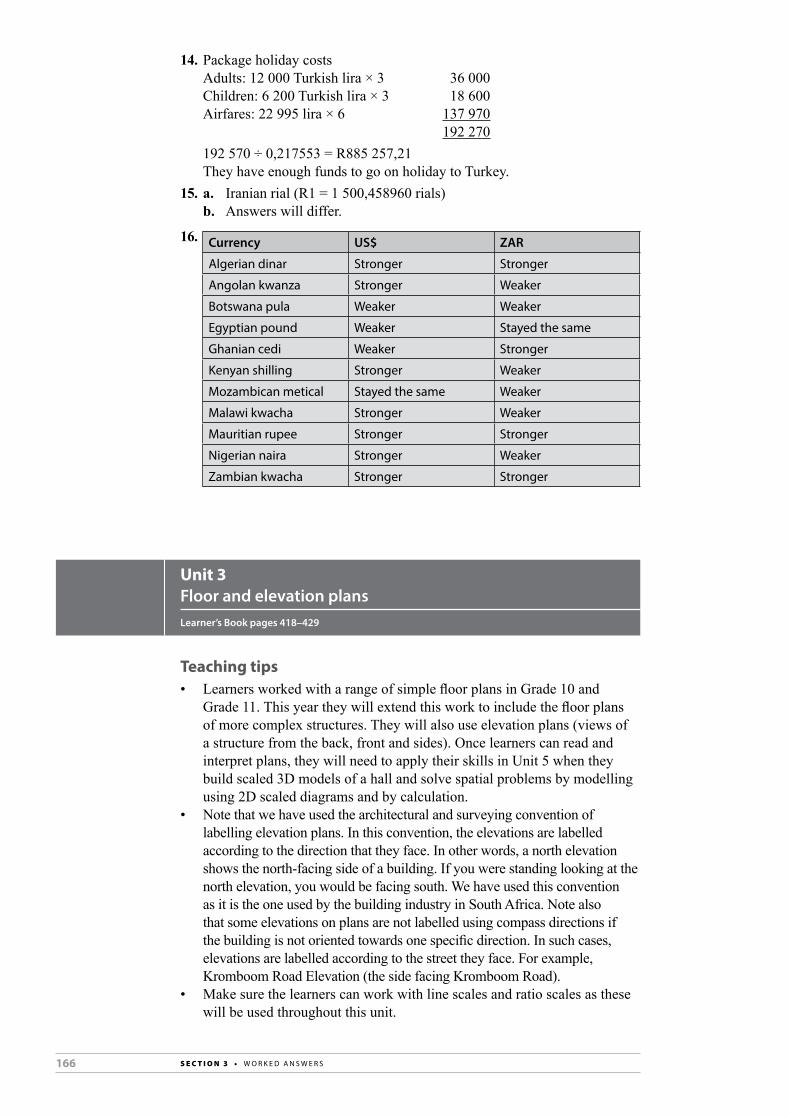
166 S E C T I O N 3 • W O R K E D A N S W E R S
14. Package holiday costs Adults: 12 000 Turkish lira × 3 36 000 Children: 6 200 Turkish lira × 3 18 600 Airfares: 22 995 lira × 6 137 970 192 270 192 570 ÷ 0,217553 = R885 257,21 They have enough funds to go on holiday to Turkey.15. a. Iranian rial (R1 = 1 500,458960 rials) b. Answers will differ.
16. Currency US$ ZAR
Algerian dinar Stronger Stronger
Angolan kwanza Stronger Weaker
Botswana pula Weaker Weaker
Egyptian pound Weaker Stayed the same
Ghanian cedi Weaker Stronger
Kenyan shilling Stronger Weaker
Mozambican metical Stayed the same Weaker
Malawi kwacha Stronger Weaker
Mauritian rupee Stronger Stronger
nigerian naira Stronger Weaker
Zambian kwacha Stronger Stronger
Unit 3Floor and elevation plansLearner’s Book pages 418–429
Teaching tips• Learners worked with a range of simple floor plans in Grade 10 and
Grade 11. This year they will extend this work to include the floor plans of more complex structures. They will also use elevation plans (views of a structure from the back, front and sides). Once learners can read and interpret plans, they will need to apply their skills in Unit 5 when they build scaled 3D models of a hall and solve spatial problems by modelling using 2D scaled diagrams and by calculation.
• Note that we have used the architectural and surveying convention of labelling elevation plans. In this convention, the elevations are labelled according to the direction that they face. In other words, a north elevation shows the north-facing side of a building. If you were standing looking at the north elevation, you would be facing south. We have used this convention as it is the one used by the building industry in South Africa. Note also that some elevations on plans are not labelled using compass directions if the building is not oriented towards one specific direction. In such cases, elevations are labelled according to the street they face. For example, Kromboom Road Elevation (the side facing Kromboom Road).
• Make sure the learners can work with line scales and ratio scales as these will be used throughout this unit.

167T E R M 3 • U N I T 3
Solutions3.1 Assignment: Work with floor plans and assembly diagrams Learner’s Book page 419
1. a. The floor plan of a single bedroom flat b. Answers will differ. c. Two windows d. Inwards e. Bath, toilet, sink and fittings, kitchen sink, oven, fridge f. When you enter the flat, you will see the kitchen on the left, the living
room straight ahead, with the bedroom to the right of the living room. The bathroom is on the right.
2. a, b, d.
c. Filing cabinet: Length: 6 mm
_____ 90 mm × 12 000 mm = 800 mm long
Width: 3,5 mm
_____ 90 mm × 12 000 mm = 467 mm wide
L-shaped desk: Length: 12 mm
_____ 90 mm × 12 000 mm = 1 600 mm
Width: 3,5 mm
_____ 90 mm × 12 000 mm = 467 mm
Length on 8 mm _____ 90 mm × 12 000 m = 1 067 mm
1 600 mm
1 133 mm
467 mm
600 mm
467 mm
1 067
mm
Chair: 5 mm
_____ 90 mm × 12 000 mm = 667 mm
A chair occupies a space of 667 mm × 667 mm.
D: deskC: cabinet
D D D
DD
D D D
DD
CC
C CC C
CCCC
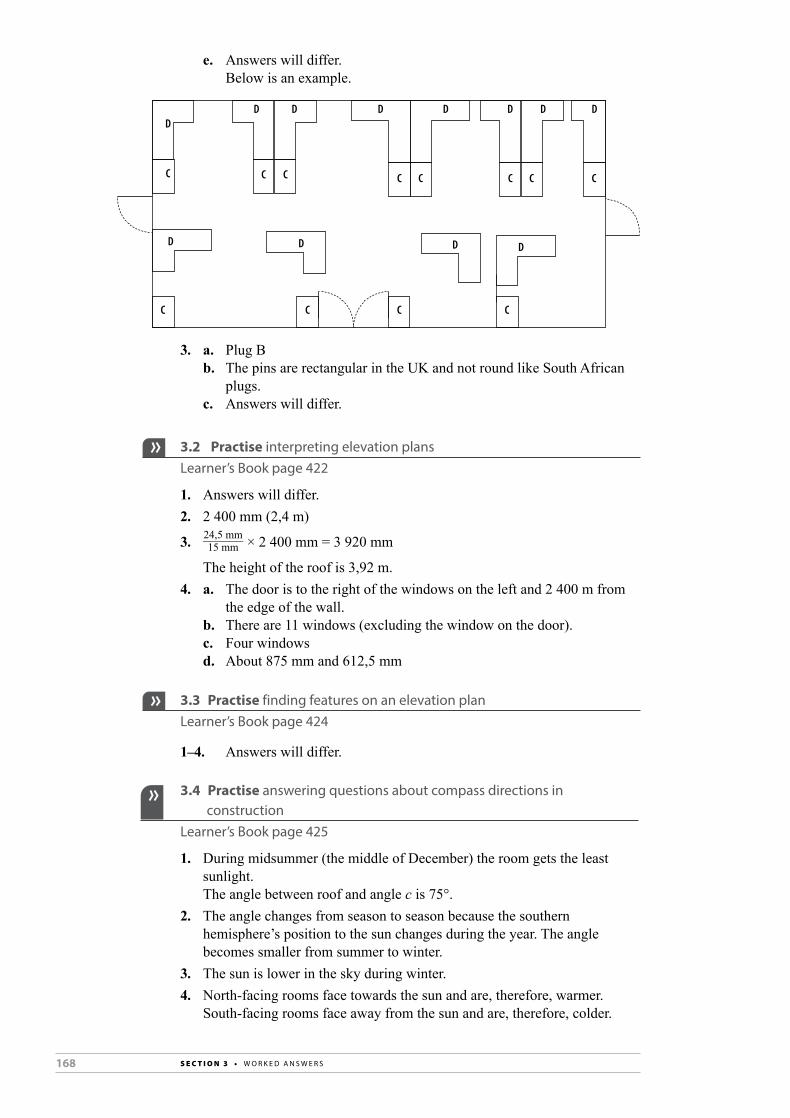
168 S E C T I O N 3 • W O R K E D A N S W E R S
e. Answers will differ. Below is an example.
3. a. Plug B b. The pins are rectangular in the UK and not round like South African
plugs. c. Answers will differ.
3.2 Practise interpreting elevation plans Learner’s Book page 422
1. Answers will differ. 2. 2 400 mm (2,4 m)
3. 24,5 mm
______ 15 mm × 2 400 mm = 3 920 mm
The height of the roof is 3,92 m.4. a. The door is to the right of the windows on the left and 2 400 m from
the edge of the wall. b. There are 11 windows (excluding the window on the door). c. Four windows d. About 875 mm and 612,5 mm
3.3 Practise finding features on an elevation plan Learner’s Book page 424
1–4. Answers will differ.
3.4 Practise answering questions about compass directions in construction Learner’s Book page 425
1. During midsummer (the middle of December) the room gets the least sunlight.
The angle between roof and angle c is 75°.2. The angle changes from season to season because the southern
hemisphere’s position to the sun changes during the year. The angle becomes smaller from summer to winter.
3. The sun is lower in the sky during winter.4. North-facing rooms face towards the sun and are, therefore, warmer.
South-facing rooms face away from the sun and are, therefore, colder.
DD D D
DD
D D D
DD
C C C C CC C C
CCCC
D

169T E R M 3 • U N I T 3
5. A slight roof overhang provides some shade in summer, but it lets in the sun during winter, so that a room is not cold.
6. a. Solar panels are installed on the north-facing side of a roof to face the sun as much as possible. This makes them more effective in trapping the energy from the sun.
b. You would install it at an incline facing the north to trap as much of the sun’s energy as possible.
3.5 Assignment: draw scaled elevation plans and use them to calculate measurements and costs Learner’s Book page 426
1.
7 300 mm
East elevation
2 700 mm
3 850
mm
3 850
mm
7 100 mm
North elevation
2 700 mm
7 100 mm
South elevation
3 850
mm
2 700 mm

170 S E C T I O N 3 • W O R K E D A N S W E R S
7 300 mm
West elevation
2 700 mm
3 850
mm
2. North elevation: 7 100 mm × 2 700 mm + 1
_ 2 × 7 100 mm × (3 850 mm – 2 700 mm) – (2 × 1 511 mm × 949 mm + 2 100 mm × 950 mm)
= 19 170 000 mm2 + 4 082 500 mm2 – (2 867 878 mm2 + 1 995 000 mm2) = 18 389 622 mm2
= 18,389622 m2
South elevation: 18 389 622 mm2 + 1 511 mm × 949 mm = 18 389 622 mm2 + 1 433 939 mm2
= 19 823 561 mm2
= 19,823561 m2
East elevation: 2 700 mm × 7 300 mm – (2 × 1 022 mm × 949 mm) = 19 710 000 mm2 – 1 939 756 mm2
= 17 770 244 mm2
= 17,770244 m2
West elevation: 2 700 mm × 7 300 mm = 19 710 000 mm2
= 19,710000 m2
Total surface area = 75,693427 m2
3. (R9,50 + R12,60) × 75,693427 m2
= R1 672,82
Revise and consolidate Learner’s Book page 428
1. a. 76 mm = 35 600 mm 1 mm = 468,42 40 mm : 19 500 mm 1 mm : 487,5 Approximately 1 : 480 b. About 1 m c. 10 080 mm ≈ 10 m d. 9,2 m × 9,5 m – 2 m × 2 m = 87,4 m2 – 4 m2
= 83,4 m2
e. 7,2 m × 3,4 m = 24,48 m2
1,5 m from side fence

171T E R M 3 • U N I T 4
f. Pool on plan: 10 mm × 15 mm × 1 500 mm = 4 800 mm × 7 200 mm × 1 500 mm Pool in real life: 4,8 m × 7,2 m × 1,5 m = 51,84 m3
2. a. Answers will differ. b. Bedroom: 7' × 30,5 cm = 213,5 cm 13' × 30,5 cm = 396,5 cm So, 2,135 m × 3,965 m = 8,465275 m2
Living room: 13' × 30,5 cm 396,5 cm 11'' × 2,5 cm 27,5 cm 424,0 cm 8' × 30,5 cm 244,0 cm 8'' × 2,5 cm 20,0 cm 264,0 cm So, 4,24 m × 2,64 m = 11,1936 m2
Porch: 8' × 30,5 cm 244,0 cm 12' × 30,5 cm 366,0 cm 6'' × 2,5 cm 15,0 cm 381,0 cm So, 2,44 m × 3,81 m = 9,2964 m2
Total: 14' × 30,5 cm = 427,0 cm 22' × 30,5 cm = 671,0 cm ∴ 4,27 m × 6,71 m = 28,6517 m2
c. South and west d. Answers will differ. e. 2 m × 0,3 m = 0,6 m2
(28,6517 m2 + 9,2964 m2) ÷ 0,6 = 63,25 = 64 They need 64 floor boards. f. 64 boards × 2 m × R39,65 + R487,80 = R5 563,00
Unit 4ProbabilityLearner’s Book pages 430–447
Teaching tips• Before you work through this topic, you may need to revise the basic
terminology used to talk about probability. You can use the list and the activity on pages 430 and 431 in the Learner’s Book to do this.
• In this unit, learners will continue to work with games that make use of coins and dice and weather predictions to revise and consolidate the

172 S E C T I O N 3 • W O R K E D A N S W E R S
concepts and terminology that were introduced last year. They will also continue to use two-way tables and tree diagrams to represent the sample space and outcomes of different events. Remember though that they do not need to use tree diagrams to calculate probability. They only use them to represent all the possible outcomes of one or more events.
• The contexts for teaching probability are extended in this unit to include lottery results and gambling. The aim is for learners to understand that the chances of winning in these contexts are very small, and for them to consider and evaluate some of the common statements about winning in these contexts critically.
• Learners will also work with a range of contexts where there is a chance of getting an incorrect result. Learners should be familiar with advertisements that make statistical claims (for example, 80% of teenagers who use this face wash reported fewer pimples). Now they will also investigate the concept of risk in terms of probability. For example, insurance companies charge higher premiums if a driver is below the age of 25 as young drivers have a higher risk of being involved in an accident. Similarly, some insurance companies charge women less than men as their studies show women have a lower risk profile and are less likely to be involved in an accident. Encourage learners to make a collection of these kinds of claim from print media and discuss them in class.
Solutions4.1 Practise revising probability terms Learner’s Book page 431
1. a. Naeem can take out a black, white, green or yellow sweet. b. An experiment c. An outcome d. Impossible e. Answers will differ. f. Getting a black sweet; there is a 12 in 35 chance (34%) of getting a
black sweet.2. Answers will differ.
4.2 Practise determining and estimating probability Learner’s Book page 432
1. a. 1 in 9 b. 1 in 6 × 6 = 1 in 36 c. 1 in 2 d. 1 in 2 e. 1 in 12 f. 1 in 62. a. 3 in 50 b. 7 in 50 c. 40 in 50 – 4 in 53. a. 1 in 13 b. 3 in 13 c. 9 in 134. An experiment is not likely to give the same results as calculating the
theoretical probability.5. a. 1 in 200 b. 199 in 200 c. 12 000 ÷ 200 = 60 babies will be obese out of 12 000.6. a. 23 in 1 000 are obese. 977 in 1 000 are not obese. 12 000/1 000 × 23 = 276 babies will be obese out of 12 000. b,c. Answers will differ.

173T E R M 3 • U N I T 4
4.3 Practise working out the odds Learner’s Book page 434
1. a. 0,000004% b. 2% c. 0,990099% ≈ 0,99% d. 10% e. 31,25%
2. a. 52,1% = 52,1
___ 100 = 1 ____ 1,919
1 in 1,919
47,9% = 47,9
___ 100 = 1 _____ 2,0877
1 in 2,0877
b. 25% = 25 ___ 100 = 1
_ 4 1 in 4 chance
c. 0,028% = 0,028
____ 100 = 28 ______ 100 000 = 1
_______ 3 571,428 1 in 3 571,43 chance
d. 50% = 50 ___ 100 = 1
_ 2 1 in 2 chance
e. 24,4% = 24,4
___ 100 = 244 ____ 1 000 = 1
____ 4,098 1 in 4,098 chance
4.4 Practise deciding which method to use to predict probability Learner’s Book page 436
1. a. Carry out a survey b. Experiment c. Historical d. Theoretical probability e. Theoretical (historical) f. Theoretical probability g. Historical/survey h. Theoretical probability2. a. A Women of average weight have a 50% higher chance of heart
attack than women who weigh 15% below average. B There is a 67% probability an earthquake of a magnitude of 6,7
or larger will strike in the greater Los Angeles area in the next 30 years.
There is a 63% probability that an earthquake of similar magnitude will strike in the San Francisco Bay area in the next 30 years.
The San Andreas fault has a probability of 59% or larger of generating an earthquake of 6,7 magnitude in the next 30 years.
C There is a 70% to 80% probability that the HIV virus sampled in four local women came from the same source.
D Smokers have a risk of getting heart disease that is two to four times that of non-smokers.
E Smokers have a 1 in 10 chance (10% probability) of contracting lung cancer. Non-smokers have a 1 in 100 chance (1% probability) of contracting lung cancer.
F The probability of a seat-belt failing is 0,015%. b. Answers will differ.

174 S E C T I O N 3 • W O R K E D A N S W E R S
4.5 Practise predicting probability based on data Learner’s Book page 437
1. a. 212 b. 89 pensioners c. 71 d. i. 62 out of 212 = 29,25% or 1 in 3,42 ii. 45 + 13 = 58 58 out of 212 = 27,36% or 1 in 3,66 iii. 23 + 45 = 68 68 out of 212 = 12,26% or 1 in 8,15 e. Adult female: 23
_____ 23 + 56 × 100% = 29,1%
Pensioner female: 45 _____ 45 + 26 × 100% = 63,4%
Adult male: 19 _____ 19 + 25 × 100% = 43,2%
Pensioner male: 13 _____ 13 + 15 × 100% = 72,2%
The male pensioner is most likely to buy yoghurt. f. The adult female group is least likely to buy yoghurt. g. Answers will differ. 2. a. 423
____ 1 000 × 100% = 42,3%
= 0,423 b. Answers will differ. 3. a, b. Answers will differ. c. 20 000 × 0,23 = 4 6004, 5. Answers will differ.
6. a. Type of accident Odds of dying in one year
Lifetime odds of dying
All transport accidents
0,000163371 ≈ 0,016% 0,012658227 ≈ 1,27%
Accidents involving a pedestrian
0,000020485 ≈ 0,002% 0,001594896
Bicycle incident 0,000003126 ≈ 0,0003% 0,000243249 ≈ 0,02%
Motorcycle accident 0,000014795 ≈ 0,001% 0,0011507 ≈ 0,12%
Motor vehicle accident
0,000049185 ≈ 0,005% 0,003831417 ≈ 0,38%
Aeroplane accident 0,000001989 ≈ 0,0002% 0,000154798 ≈ 0,02%
b. Accident involving a pedestrian c. No, she could be involved in an accident as a pedestrian or a
passenger. d. Yes, there is a much lower probability of dying in an aeroplane
accident than in a vehicle accident, or as a pedestrian in an accident.

175T E R M 3 • U N I T 4
4.6 Practise representing sample spaces for compound events Learner’s Book page 440
1. a.
female
femalefemale
female
female
female
female
male
male
male
male
male
malemale
b.
stop at traffic lights
stop at zebra crossing
don't stop
stop at traffic lights
stop at zebra crossing
don't stop
stop at traffic lights
stop at zebra crossing
don't stop
stop at traffic lights
stop at zebra crossing
don't stop
c.
male
gamble
gamble
not gamble
not gamble
female
2. a. Score on spinner 1
Score on spinner 1
Scor
e on
spi
nner
2 1 2 3 4 5
1 2 3 4 5 6
2 3 4 5 6 7
3 4 5 6 7 8
4 5 6 7 8 9
5 6 7 8 9 10

176 S E C T I O N 3 • W O R K E D A N S W E R S
b. The scores with the highest probability is 6 (6 is the mode of all the scores in the data set).
c. 15 in 25 chance = 3 in 5 chance or 60% probability3. a.
drug users
positive test
positive test
negative test
negative test
non-drug users
b. Yes, it is possible to have a false positive result. Errors in the laboratorium’s precedures, contaminated samples, and even other chemicals that produce similar results, may result in false positives.
4. a. Nine outcomes b. RR RA RG AR AA AG GR GA GG c. 1 in 9 chance = 11,11% ≈ 11% d. 4 in 9 chance = 44,44% ≈ 44%
4.7 Assignment: determining and interpreting the probability for Lotto numbers Learner’s Book page 442
1. a. 3,7 and 20 b. 48 c. i. 2 out of 48 chance ii. 28 out of 48 A 1 in 24 chance = 4,2% = 58,33% probability iii. 14 out of 48 chance iv. 10 out of 48 chance = 29,2% = 20,8%2. a. 1 out of 49 = 2,04% b. 24 out of 49 = 48,98% ≈ 49% c. 9 out of 49 = 18,37% d. 10 out of 49 = 20,41% ≈ 18% ≈ 20%3. Answers will differ. 4. a. 16 (drawn 200 times) b. 36 (drawn 138 times) c. 8 288 ÷ 49 balls = 169 times d–f. Answers will differ. 5. a. About 0,0000071% b. 0,0355% c–e. Answers will differ.

177T E R M 3 • U N I T 4
4.8 Practise interpreting results that may be wrong Learner’s Book page 445
1. a. There is a 2% probability that the test will give a false result. b. No, her brother might not be using drugs. However, it is 98% probable
that he is using drugs. c. No, her brother might be using drugs. However, it is 98% probable
that he is not using drugs.2. a.
use drugs
test positive
test positive
test negative
test negative
does not use drugs
b. Learner status Tests positive for drugs (fail test)
Tests negative for drugs (pass test)
Total
Learners who use drugs
274 6 280
Learners who do not use drugs
14 706 720
Total 288 712 1 000
c. 14 ___ 288 = 0,0486 = 4,86% ≈ 5%
There is a 5% chance that a learner who is not using drugs will fail the test.
d. 6 ___ 712 = 0,008426966
There is a 0,84% chance that a learner who is using drugs will pass the test.
e. Answers will differ.
Revise and consolidate Learner’s Book page 446
1. a. A 25% chance of winning b. A 100% chance the event will happen c. A greater than 50% chance of winning than losing d. The estimated chance that an event will happen e. Data that is an outcome of an experiment f. By chance and unplanned; not predetermined2. Answers will differ. 3. a. 2 out of 36 chance of winning = 0,0556 b. Unfair. There is a very low probability of winning the R10. c. 250 × R5 – 250 × R10 × 0,0556 = R1 250 – R139 = R1 111

178 S E C T I O N 3 • W O R K E D A N S W E R S
4.
male
malemale male
male
male
male
male
male
male
male
male
male
male
male
female
female
female
female
female
female
female
female
female
female
female
female
female
femalefemale
b. 6 in 16 = 0,375 c. 1 in 16 = 0,06255. a. 12 out of 17 500 are vaccinated but get the disease. There is a
0,0006857 probability of being vaccinated and getting disease. This is a 0,9993 probability that the vaccine is effective
(greater than 99%). b. 5,245 ≈ 5 children6. Answers will differ.
Unit 5Using models to investigate shape and spaceLearner’s Book pages 448–454
Teaching tips• Mathematical modelling is a very useful life skill. At a basic level, people
may draw diagrams of a room and use scaled versions of furniture to see how to arrange it. People may also make a model or prototype of an item (scaled or life size) to see how it will work and what it will look like. For example, architects often build scaled models of housing and/or office developments to show prospective buyers what they would get if they bought into a project. Engineering firms often make one version of an item and then use that as a template to manufacture many more. Jewellers make single items or they carve models out of wax and use these to make or case many more identical items.
• Learners will need to construct models in this unit. Make sure you have a supply of cardboard (such as old packaging containers or file covers), scissors and/or craft knives, adhesive tape and/or glue for learners to use.
Solutions
5.1 Practise modelling a container Learner’s Book page 448
1–6. Answers will differ.

179T E R M 3 • U N I T 5
5.2 Assignment: containers and how much they hold Learner’s Book page 449
1–6. Answers will differ.
5.3 Investigation: the best shape and size of boxes Learner’s Book page 449
Answers will differ.
5.4 Practise making and using a model of a building Learner’s Book page 450
Answers will differ.
5.5 Investigation: use scaled models to decide on the placement of furniture and fixtures for a fund-raising event Learner’s Book page 451
Answers will differ.
Revise and consolidate Learner’s Book page 452
1. a. Octagon b. 2 × 8 = 16 sets of doors c. 38 tables d. 12 chairs per table × 38 tables = 456 chairs 456 people can be seated at the tables. e. Answers will differ. 2. a. 84 mm × 500 = 42 000 mm = 42 m
b. 1 _ 2 × (54 mm × 500) × (66 × 500) × 8
= 1 _ 2 × (27 000 mm) × (33 000 mm) × 8
= 1 _ 2 × 27 m × 33 m × 8
= 3 564 m2
3. Area per stand: (6 mm × 500) × (7 mm × 500) = 3 000 mm × 3 500 mm = 3 m × 3,5 m = 10,5 m2
Number of stands: 61 61 × 10,5 m2 = 640,5 m2
area covered by stands
______________ total floor area = 640,5 m 2
______ 3 564 m 2 × 100%
= 18%4,5. Answers will differ.


181T E R M 4 • W O R K E D A N S W E R S
TERM 4
WORKED ANSWERSLearner’s Book pages 455–495
Exemplar Paper 1: MemorandumLearner’s Book pages 476–485
Total: 150 marks
Question 1 (33 marks)
1.1.1 3 _ 4 of √
_____ 9 673 – 0,5 (5,9352 + 2,16937)
= 73,763 558… – 4,052 285 = 69,711 273… ✓ ≈ 69,71 ✓1.1.2 22,25% of R136,00
= 22,25
____ 100 × R136 ✓ or 0,2225 × R136 ✓ = R30,26 ✓1.1.3 450 m = (450 ÷1 000) km = 0,45 km ✓1.1.4 5,34 million = 5,34 × 1 000 000 = 5 340 000 ✓
1.1.5 Price per egg = R7,92
____ 6 ✓ = R1,32 ✓1.1.6 Total number of days from January to July = 31 + 28 + 31 + 30 + 31 + 30 + 31 = 212 ✓ So, the 200th day is in July. ✓1.2.1 19:00 or 7 p.m. or 19h00 ✓ ✓
1.2.2 Wage = R18,00 × 12 × 2 1 _ 2 ✓
= R540 ✓1.3.1 Total income = profit + expenses = R135 400 + R235 656 ✓ = R371 056 ✓1.3.2 Sihle’s share = R135 400 – R54 160 = R81 240 ✓ Ratio = 54 160 : 81 240 ✓ = 2 : 3 or 1 : 1,5 ✓ or 27 080 : 40 620 or 13 540 : 20 310 or 5 416 : 8 1241.3.3 An increase of 8% implies 108% ✓
Profit in 2020 = 108 ___ 100 × R135 400 or 1,08 × R135 400
= R146 232 ✓

182 S E C T I O N 3 • W O R K E D A N S W E R S
or: Increased amount = 8
___ 100 × R135 400 or 0,08 × R135 400
= R10 832 ✓ Profit in 2020 = R135 400 + R10 832 ✓ = R146 232 ✓1.4.1 0; 24; 38; 38; 42; 50; 52; 56; 86 ✓1.4.2 38 ✓
1.4.3 Mean = 52+ 86 + 24 + 38 + 56 + 42 + 0 + 50 + 38 __________________________ 9
= 386 ___ 9 ✓
= 42,8888… ≈ 42,89 ✓1.5.1 Internet ✓1.5.2 Difference = 605% – 48,4% = 12,1% ✓1.5.3 Computers ✓1.5.4 Number of schools = 24,6
___ 100 × 2 500 ✓
= 0,246 × 2 500 = 615 ✓
Question 2 (32 marks)
2.1.1 A = R150 000(1 + 0,66)3 ✓ ✓ = R181 703,32 ✓2.1.2 R1,00 (ZAR) = ¥ (CNY) Amount = 15 000 × 0,89 ✓ = ¥13 350 CNY ✓2.2.1 a. Number of coloureds = 4 424 100 ✓ ✓ b. Number of white females = 2 277 400 ✓ ✓2.2.2 A = 24 329 000 – (19 314 500 + 646 600 + 2 243 000) ✓ = 2 124 900 ✓2.2.3 Difference = 19 324 500 – 18 901 000 ✓ = 413 500 ✓
2.2.4 Asian females: 652 300 _______ 25 662 300 ✓ × 100%
= 2,546% = 2,55 ✓2.2.5 Male increase = 460 300 ✓ Female increase = 210 500 ✓ So, there was the greatest increase for males. ✓2.3.1 R75 ✓ ✓ (Accept any amount between R73 and R77.)2.3.2 24 single trips ✓ ✓2.3.3 Number of single trips = 3 × 2 = 6 ✓ Cost = R45 ✓ ✓ (Accept any amount between R43 and R47.)
2.3.4 Cost of 22 single trips
______________ 22 return trips
= 2 × R165 ✓ = R330 ✓ (Accept any amount between R326 and R334.)

183T E R M 4 • W O R K E D A N S W E R S
Question 3 (36 marks)
3.1.1 Cost = 3 × R5,75 + 5 × R1,25 ✓ = R23,50 ✓
3.1.2 Number of carrots = R31,75 – (4 × R5,75)
______________ R1,25 ✓
= R8,75
____ R1,25
= 73.2.1 Area = 2,5 m × 1,5 m ✓ = 3,75 m2 ✓3.2.2 Volume = 2,5 m × 1,5 m × 7,5 cm ✓ = 2,5 × 1,5 × 0,075 ✓ = 0,28125 m3
= 0,28 m3 ✓3.3.1 a. A = 100% – (48% + 10,6% + 2,7% + 31,5%) ✓ = 7,2% ✓ b. Packets of cabbage seeds = 48% of 525 ✓ = 0,48 × 525 = 252 ✓3.3.2
Cucumbers10%
✓
Beans10%
✓
Tomatoes10%
✓
Pumpkin10%
✓✓
3.4.1 a. Volume = 3,14 × (0,988 m)2 × 2,398 m ✓ = 7,81238… m3
≈ 7,812 m3 ✓
b. Height = 80 ___ 100 × 2,498 m ✓
= 1,9984 m ≈ 1,998 m ✓3.4.2 Surface area of the tank = 3,14 × 1 m × (2 × 2,5 m + 1m) ✓ ✓ = 3,14 m × 6 m ✓ = 18,84 m2 ✓3.4.3 5 mm in 1 minute, so, average rate = 5 mm/min.
Time taken = 1 200 mm _______ 5 mm/min.
= 240 min. ✓ = 4 h ✓
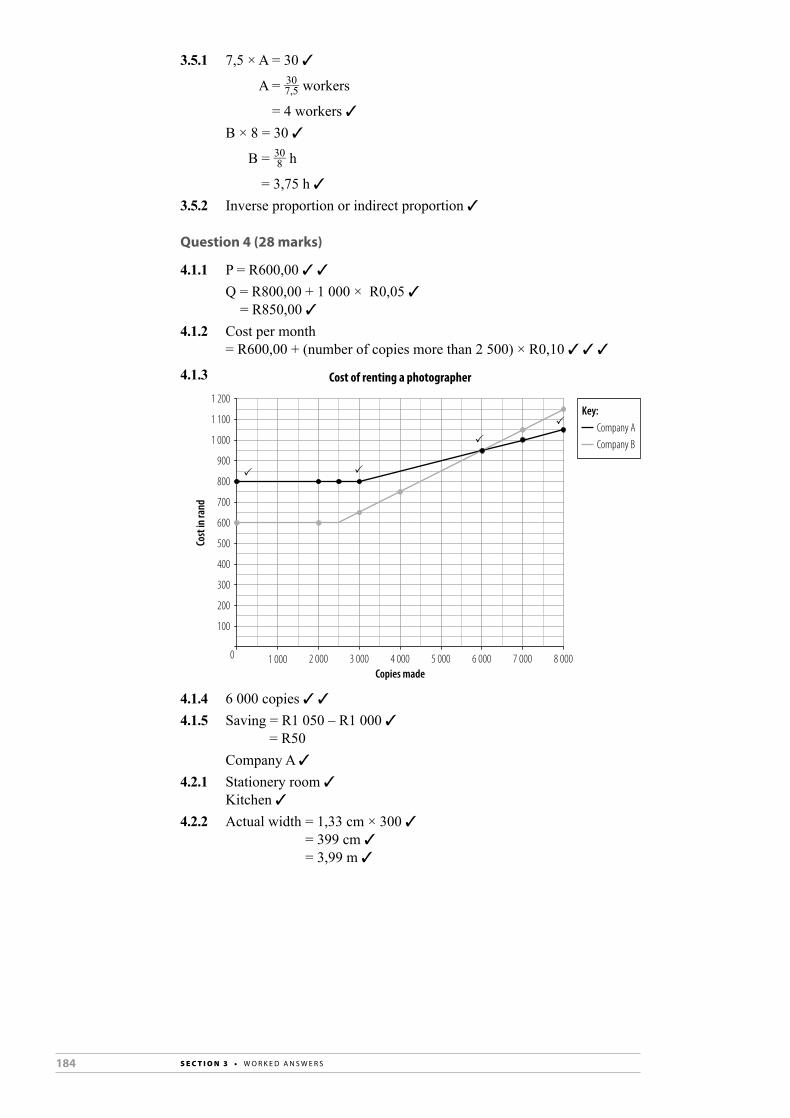
184 S E C T I O N 3 • W O R K E D A N S W E R S
3.5.1 7,5 × A = 30 ✓
A = 30 ___ 7,5 workers
= 4 workers ✓ B × 8 = 30 ✓
B = 30 __ 8 h
= 3,75 h ✓3.5.2 Inverse proportion or indirect proportion ✓
Question 4 (28 marks)
4.1.1 P = R600,00 ✓ ✓ Q = R800,00 + 1 000 × R0,05 ✓ = R850,00 ✓ 4.1.2 Cost per month = R600,00 + (number of copies more than 2 500) × R0,10 ✓ ✓ ✓
4.1.3
4.1.4 6 000 copies ✓ ✓4.1.5 Saving = R1 050 – R1 000 ✓ = R50 Company A ✓4.2.1 Stationery room ✓ Kitchen ✓4.2.2 Actual width = 1,33 cm × 300 ✓ = 399 cm ✓ = 3,99 m ✓
0 1 000 2 000 3 000 4 000Copies made
Cost
in ra
nd
Cost of renting a photographer
P P
P
P
5 000 6 000 7 000 8 000
100
200
300
400
500
600
700
800
900
1 000
1 100
1 200Key:
Company B
Company A

185T E R M 4 • W O R K E D A N S W E R S
4.3.1
0Mon. Tue. Wed. Thu.
Day of the week
Num
ber o
f cop
ies
Number of copies made
P
P
P
PP
P
Fri.
100
200
300
400
500
600
4.3.2 Wednesday ✓
Question 5 (21 marks)
5.1.1 2 tanks = 2 × 26 gallons = 52 gallons5.1.2 16 gallons ✓ ✓ (Accept values more than 15, but less than 175.)5.1.3 3 gallons ✓ ✓ (Accept any value from 3 to 5.)5.1.4 18 gallons = 18 × 4,546 ℓ = 81,83 ℓ ✓5.1.5 Cost = 15,76 ℓ × R9,92/ℓ ✓ = R156,34 ✓
5.1.6 Percentage decrease = 0,86
___ 9,92 × 100% ✓ ✓ = 9,66935…% ≈ 8,67%5.2.1 B2 or 2B ✓ ✓5.2.2 Karoo National Park ✓ Bontebok National Park ✓5.2.3 Northwest ✓ ✓5.2.4 Average speed = 153 km
_____ 1 _ 2 h ✓
= 306 km/h ✓(Source: Reproduced with permission from the Department of Basic Education)

186 S E C T I O N 3 • W O R K E D A N S W E R S
Exemplar Paper 2: Memorandum
Learner’s Book pages 486–495
Total: 150 marks
Question 1 (28 marks)
1.1.1 45 mm = 4,5 cm ✓ Scale 4,5 cm : 265 cm ✓ = 1 : 58,88 = 1 : 58,89 ✓1.1.2 6 m wide plastic He would have to buy 3 m (and would have a lot of material left over). Cost = 3 m × R44,99/m ✓ = R134,97 ✓ Cut to order plastic Area = 380 cm × 265 m ✓ = 10,07 m2 ✓ Cost (excl. VAT) = R10,07 m2 × R12,24/m2
= R123,26 ✓ Cost including VAT: 100% + 15% = 115% So, cost = 115
___ 100 × R123,26 = R141,75 ✓ The more economical way of buying the ground sheet is to buy the
6 m wide plastic sheeting. ✓1.2.1 9 hours ✓ ✓1.2.2 7 ºC ✓ 15:00 ✓1.2.3 Between 00:00 and 09:00 ✓1.2.4 Day 1: Range = 15ºC – (–4 ºC) ✓ = 19 ºC Day 2: Range = 1=7 ºC – (–1,6 ºC) ✓ = 8,6 ºC He should go on day 1. ✓ Although the day–night temperatures are
colder than on day 2, the daytime temperatures are higher and the temperature range is larger. ✓ ✓
Or, he should go on day 2. Although the daytime temperatures are colder than day 1, the nighttime temperatures are warmer.
1.3.1 1513; 912; 1513; 1003; 1052 ✓ 5 fish ✓1.3.2 median ✓ ✓
Question 2 (18 marks)
2.1.1 The profits for 2016 and 2018 were not plotted on graph B. ✓ ✓2.1.2 Graph B ✓ Graph B conceals the years where the annual profit went down or
where it remained the same, thus creating an impression that profits only increased every year. ✓ ✓

187T E R M 4 • W O R K E D A N S W E R S
2.2.1 Volume = 3,14 × (10 cm)2 × 35 cm ✓ ✓ = 10 990 cm3
= 10 990 ml ✓ Total volume of juice = 9 × 1 200 ml ✓ = 10 800 ml ✓ The container is big enough to mix the juice in. ✓2.2.2 40 servings of 200 ml = 40 × 200 ml = 8 000 ml ✓ Juice left after 40 servings = 10 800 ml – 8 000 ml ✓ ✓ = 2 800 ml
Number of 140 ml-servings = 2 800 ml ______ 140 ml
= 20 ✓2.2.3 Number of 140-ml servings
= 10 800 – 200 × x ___________ 140 ml ✓
Question 3 (30 marks)
3.1.1 Theft, using vulgar language and so on ✓ ✓
3.1.2 Percentage copying in Grade 10 = 156 ___ 559 × 100% ✓
= 27,91% ✓
Percentage copying in Grade 11 = 187 ___ 559 × 100%
= 33,45% ✓
Percentage copying in Grade 12 = 216 ___ 559 × 100%
= 38,64% ✓ Increase from Grade 10 to Grade 11 = 33,45% – 27,91% = 5,54% ✓ Increase from Grade 11 to Grade 12 = 38,64% – 33,45% = 5,19% ✓ Mr Khan was correct; the percentage does increase by more than 5%
in each grade. Reasons could include: • Senior learners are more stressed by the marks for assignments,
tests and examinations and they fall into the trap of copying. ✓ • The increase in copying could be attributed to the higher academic
demands in Grades 11 and 12. ✓3.1.3 In most types of offence, there has been a decrease/decline in the
number of offences from Grade 10 to Grade 12, except for copying that has increased. ✓
• The decline could be as a result of learners getting more mature as they grow. ✓
• Most prefects/team captains are in senior classes and they behave better as they are in leadership roles.
• In Grade 10 they do not know each other in their chosen subjects and they are not as tolerant of each other.
• The increase in copying could be attributed to the higher academic demands in Grades 11 and 12. ✓
(Any other relevant reason)

188 S E C T I O N 3 • W O R K E D A N S W E R S
3.1.4 He could have used a compound bar graph to represent the data. It would clearly show the comparison between the different offences and between the different grades. ✓ ✓
Or, he could have used three pie charts. Each pie chart could represent a grade and it would be easy to compare the sectors of the pie charts.✓
3.2 Percentage of learners who arrive late daily (12A) = 115
___ 50 × 100%
≈ 8,21% ✓ Percentage of learners wo arrive late daily (12B) = 172
___ 50 × 42 × 100%
≈ 8,19% ✓ Mr Abel’s claim is not valid as the number of learners who arrive late
daily is approximately the same for both classes. Mr Abel probably based his claim on the fact that more learners from
12B arrived late than learners from 12A. There are more learners is 12B than in 12A, so we could expect more
absentees in 12B than in 12A. ✓3.3.1 School starts at 07:35. Time for assembly and period 1 = 5 min. + 45 min. = 50 min. ✓ Time until the start of period 2 = 7 h 35 min. + 50 min. = 8 h 25 min. So, Tom arrived at 08:25. ✓3.3.2 Tom did not go to school. ✓ ✓ Or, Tom arrived at school after Mr Abel had left the school to attend a
workshop. ✓ ✓ Or, Mr Abel was teaching another class when Tom arrived. ✓ ✓3.3.3 Zara arrived at school late seven times. Total = (33 + 16 + 4 + 21 + 7 + 11) min. = 119 min. ✓
Zara’s mean = 119 ___ 7 min. ✓
= 17 min. ✓
Question 4 (32 marks)
4.1.1 Time to leave home = 8 h 15 min. (2 1 _ 2 h)
= 5 h 45 min. So, latest time to leave home is 05:45. ✓4.1.2 Cost of petrol = R650 × 4 ✓ = R2 600 ✓ Maintenance costs = 2 × 65 km × 22 × R0,35/km = R1 001 ✓ Colleague’s contribution = 4 × R330 = R1 320 ✓ Total expenses = R2 600 + R1 001 – R1 320 ✓ = R2 281 ✓
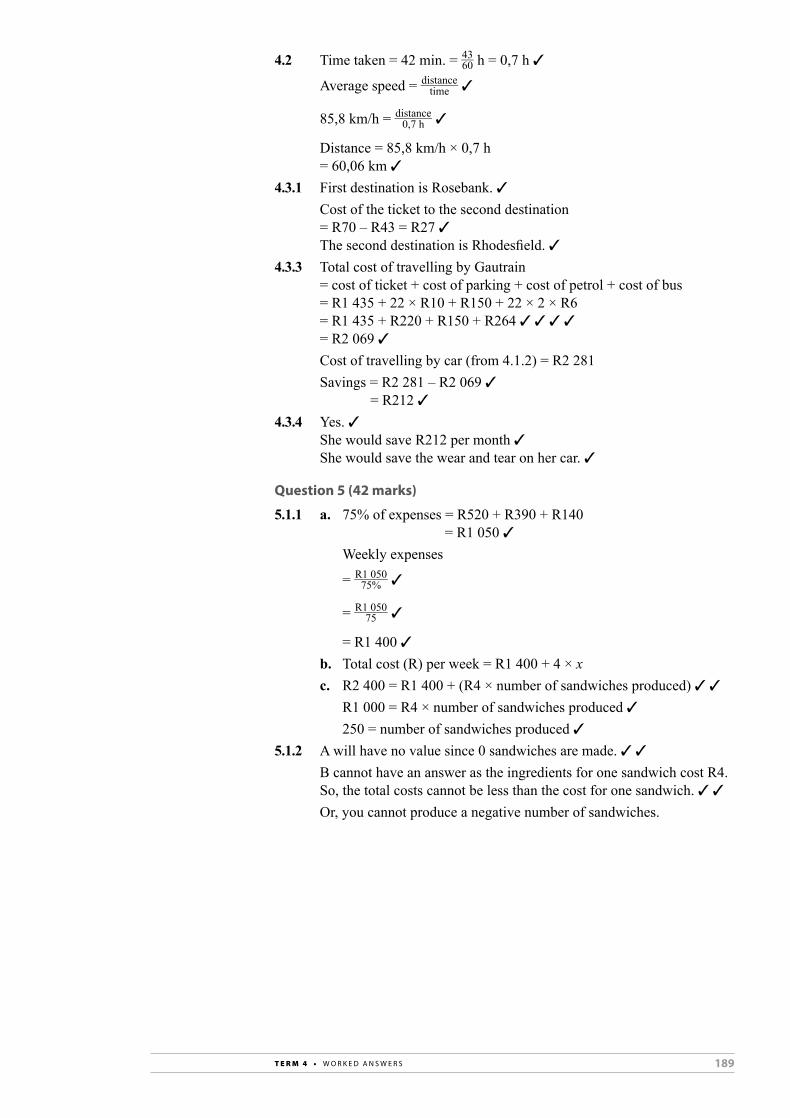
189T E R M 4 • W O R K E D A N S W E R S
4.2 Time taken = 42 min. = 43 __ 60 h = 0,7 h ✓
Average speed = distance ______ time ✓
85,8 km/h = distance ______ 0,7 h ✓
Distance = 85,8 km/h × 0,7 h = 60,06 km ✓4.3.1 First destination is Rosebank. ✓ Cost of the ticket to the second destination = R70 – R43 = R27 ✓ The second destination is Rhodesfield. ✓4.3.3 Total cost of travelling by Gautrain = cost of ticket + cost of parking + cost of petrol + cost of bus = R1 435 + 22 × R10 + R150 + 22 × 2 × R6 = R1 435 + R220 + R150 + R264 ✓ ✓ ✓ ✓ = R2 069 ✓ Cost of travelling by car (from 4.1.2) = R2 281 Savings = R2 281 – R2 069 ✓ = R212 ✓4.3.4 Yes. ✓ She would save R212 per month ✓ She would save the wear and tear on her car. ✓
Question 5 (42 marks)
5.1.1 a. 75% of expenses = R520 + R390 + R140 = R1 050 ✓ Weekly expenses
= R1 050 _____ 75% ✓
= R1 050 _____ 75 ✓
= R1 400 ✓ b. Total cost (R) per week = R1 400 + 4 × x c. R2 400 = R1 400 + (R4 × number of sandwiches produced) ✓ ✓ R1 000 = R4 × number of sandwiches produced ✓ 250 = number of sandwiches produced ✓5.1.2 A will have no value since 0 sandwiches are made. ✓ ✓ B cannot have an answer as the ingredients for one sandwich cost R4.
So, the total costs cannot be less than the cost for one sandwich. ✓ ✓ Or, you cannot produce a negative number of sandwiches.
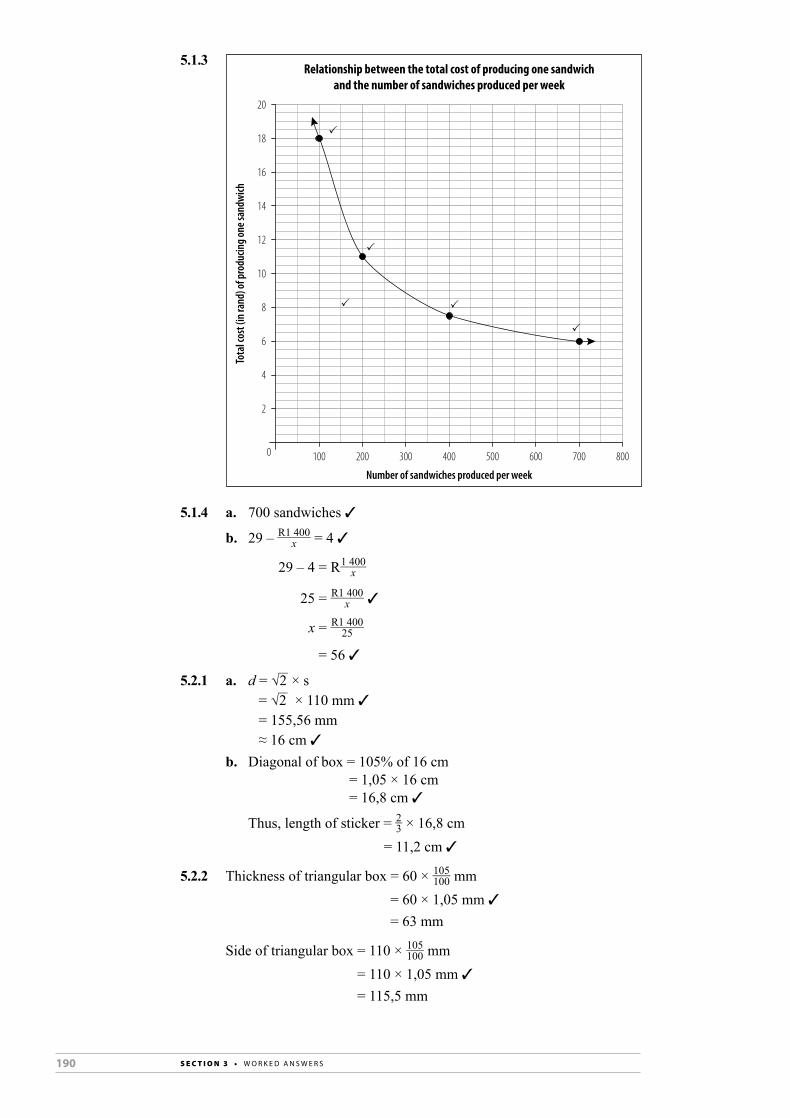
190 S E C T I O N 3 • W O R K E D A N S W E R S
5.1.3
5.1.4 a. 700 sandwiches ✓
b. 29 – R1 400 _____ x = 4 ✓
29 – 4 = R 1 400 ____ x
25 = R1 400 _____ x ✓
x = R1 400 _____ 25
= 56 ✓
5.2.1 a. d = √ __
2 × s = √
__ 2 × 110 mm ✓
= 155,56 mm ≈ 16 cm ✓ b. Diagonal of box = 105% of 16 cm = 1,05 × 16 cm = 16,8 cm ✓
Thus, length of sticker = 2 _ 3 × 16,8 cm
= 11,2 cm ✓
5.2.2 Thickness of triangular box = 60 × 105 ___ 100 mm
= 60 × 1,05 mm ✓ = 63 mm
Side of triangular box = 110 × 105 ___ 100 mm
= 110 × 1,05 mm ✓ = 115,5 mm
100 200 300 400 500 600 700 800
Number of sandwiches produced per week
Tota
l cos
t (in
rand
) of p
rodu
cing o
ne sa
ndwi
ch
Relationship between the total cost of producing one sandwichand the number of sandwiches produced per week
P
P
P P
P
20
18
16
14
12
10
8
6
4
2
0

191T E R M 4 • W O R K E D A N S W E R S
Sandwiches can be packed along the width or the length of the box.
breadth = 58 cm
lengt
h
Top view of the carton
Number of sandwiches along length = 946 mm _______ 115,5 mm ≈ 8 ✓
Number of sandwiches along width = 580 mm ______ 63 mm ≈ 9 ✓
Number of sandwiches on the bottom layer of the box = 8 × 9 × 2 = 144 sandwiches ✓
Number of layers = 360 mm _______ 115,5 mm ≈ 3 ✓
Number of sandwiches in box = 144 × 3 = 432 ✓
length = 94,6 cm
brea
dth
Top view of the carton
Number of sandwiches along length = 946 mm ______ 63 ≈ 15 ✓
Number of sandwiches along width = 580 mm _______ 115,5 mm ≈ 5
Number of sandwiches in bottom layer of box = 15 × 5 × 2 = 150 sandwiches ✓
Number of layers = 360 mm _______ 115,5 mm ≈ 3 ✓
Number of sandwiches in a box = 150 × 3 = 450 ✓ Maximum number of sandwiches is 450. ✓


193S E C T I O N 4 • R E S O U R C E S
RESOURCES
SECTION 4
A Photocopiable additional activities 195 (Measurement and Finance assignments and investigations)
B Additional activities: solutions 233
c Multiplication tables 238
d transparencies 241

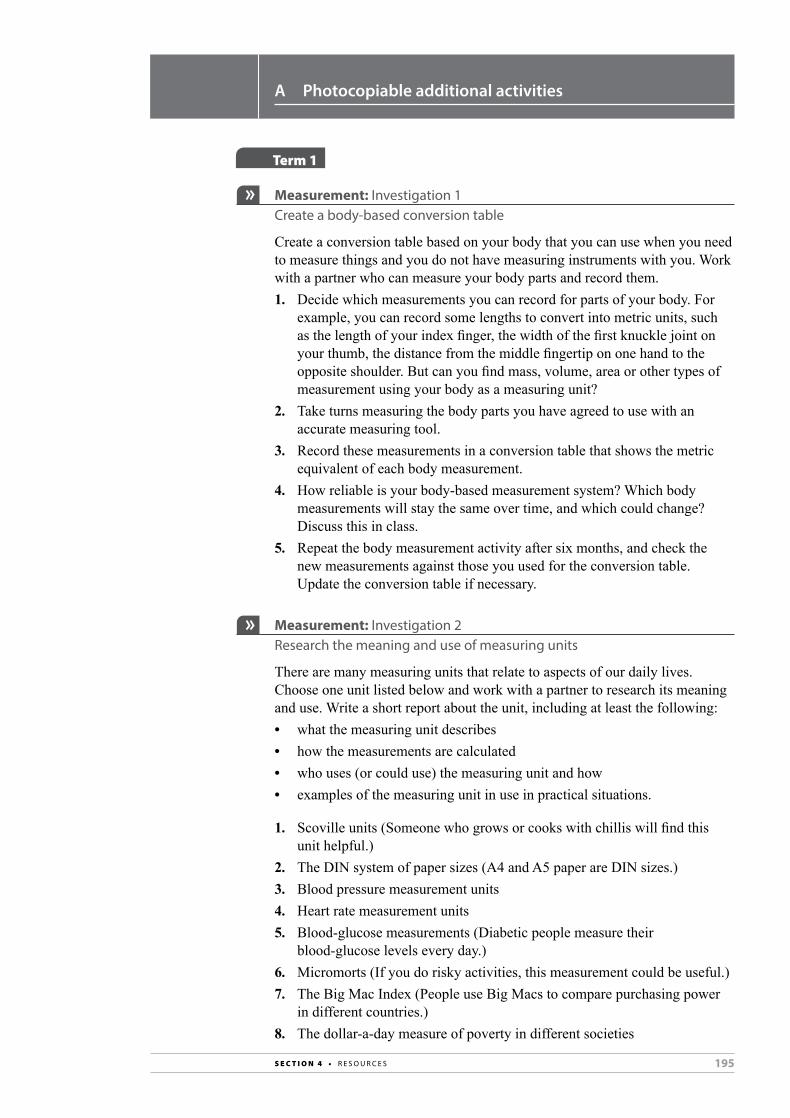
195S e c t i o n 4 • r E S o u r c E S
Measurement: Investigation 1 create a body-based conversion table
Create a conversion table based on your body that you can use when you need to measure things and you do not have measuring instruments with you. Work with a partner who can measure your body parts and record them.1. Decide which measurements you can record for parts of your body. For
example, you can record some lengths to convert into metric units, such as the length of your index finger, the width of the first knuckle joint on your thumb, the distance from the middle fingertip on one hand to the opposite shoulder. But can you find mass, volume, area or other types of measurement using your body as a measuring unit?
2. Take turns measuring the body parts you have agreed to use with an accurate measuring tool.
3. Record these measurements in a conversion table that shows the metric equivalent of each body measurement.
4. How reliable is your body-based measurement system? Which body measurements will stay the same over time, and which could change? Discuss this in class.
5. Repeat the body measurement activity after six months, and check the new measurements against those you used for the conversion table. Update the conversion table if necessary.
Measurement: Investigation 2 research the meaning and use of measuring units
There are many measuring units that relate to aspects of our daily lives. Choose one unit listed below and work with a partner to research its meaning and use. Write a short report about the unit, including at least the following:• what the measuring unit describes• how the measurements are calculated• who uses (or could use) the measuring unit and how• examples of the measuring unit in use in practical situations.
1. Scoville units (Someone who grows or cooks with chillis will find this unit helpful.)
2. The DIN system of paper sizes (A4 and A5 paper are DIN sizes.)3. Blood pressure measurement units4. Heart rate measurement units5. Blood-glucose measurements (Diabetic people measure their
blood-glucose levels every day.)6. Micromorts (If you do risky activities, this measurement could be useful.)7. The Big Mac Index (People use Big Macs to compare purchasing power
in different countries.)8. The dollar-a-day measure of poverty in different societies
term 1
A Photocopiable additional activities

196 S e c t i o n 4 • r E S o u r c E S
Measurement: Investigation 3 crop production schedules in your region
1. Interview a farmer in your area who produces any fruit, vegetable or grain crop, or a dairy farmer to find information about the production schedule for sowing, harvesting, packaging and distributing the farmer’s product. (Even if you live in an urban area, you should be able to find a small-scale farmer in the area.) You can use the coffee production schedule on page 16 in the Learner’s Book as a model, or design a timetable layout to record the information you collect.
2. Work with the rest of your class to combine the farm production schedules everyone collected from local farmers into one composite timetable that shows when all the crops grown in your area are sown, harvested and distributed to consumers in South Africa or to export markets.
3. Use this composite production schedule for a class discussion about the following questions:a. Which food crops will be affected by droughts, floods or other weather
crisis conditions in your region at different times of the year?b. If you were to eat only foods that are produced in your region, which
foods would you eat at different times of the year?
Finance: Investigation 1 opening a filing/record-keeping system for household financial documents
How does your household store important financial documents? Answer question 1 or question 2 and then take part in a class discussion about these topics.1. Investigate how financial documents are stored in your home, and how
easy or difficult it is to find a document when it is needed.a. Describe the system(s) your parents and/or other adults in the
household use. If you have your own system for storing personal financial documents, describe it as well.
b. Interview people in your home to find out if they have problems finding documents they need.
c. Write a short report on the strengths and weaknesses of the storage system(s) that are used in your household.
OR2. Find out how some organised and
efficient people you know store their documents. a. Report on some of their systems
or ideas for filing documents, keeping them safe from water and other hazards, and so on.
b. Write a short proposal for a storage system that could work in your home. Include suggestions for who should be responsible for the system and where the documents should be stored.
the bank statements for last year are in the third container from the left,
on the top shelf.

197S e c t i o n 4 • r E S o u r c E S
Finance: Assignment 1 organise tariff information into an easy-to-use format
Cities with bus rapid transport (BRT) systems need to educate passengers about the new type of tariff system that uses a smartcard. The MyCiti bus system in Cape Town has a website with information about tariffs, fare increases, loading money onto a smartcard. Passengers could get confused by all the different details on the website.
Study the website pages below, and decide which tariff information is most important for passengers to know. Organise this information into an easy-to-use format such as a table. Use examples to illustrate how many trips a passenger could take, if they loaded different amounts of money onto their smartcard.
Your examples could look like this one:If you load R65,00 onto your card, it will be allocated as follows: R63,37 (value load on the card) + R1,63 (bank fees of 2,5%) = R65,00. If your journey is on any route inside Table View, you will be able to use the card for 12 trips of R5 each, with R3,37 left on the card.
How it works
1. Get your card
Get a myconnect card for R23 from MyCiTi station kiosks orparticipating retailers and load it with money for travel. You willneed cash to both get your card and load money.
There is a fee of 2.5% (minimum R1.50) of the amount loadedat MyCiTi station kiosks and 3.5% (minimum R1.50) of theamount loaded at participating retailers. The load fee is onlycharged when you load money onto your card, and not whenyou tap to enter a station or bus. For more information aboutload fees click here.
You will be given a receipt for your myconnect card. If youstop using MyCiTi or leave Cape Town, take your myconnectcard and receipt to a MyCiTi station kiosk to have the moneyyou paid for the card refunded.
Please read the MyCiTi rules before getting a myconnect card.By accepting a card, you accept the rules. The full set of rules and terms and conditions for usingthe card are available at station kiosks and on the website by clicking here.
2. Tap your card
You will be charged a penalty if you enter a bus or station withouttapping your card or with insufficient money on your card to travel.
Tap in by holding your card against this symbol on the validatoras you board a MyCiTi bus or enter a station. Once the four greenlights on the validator have lit up, remove your card and wait forthe beep.
1 beep – transaction successful2 beeps – Warning, transaction successful but there is less thanR20 on your card. Top up as soon as possible.5 beeps – Error, transaction declined. Reasons could include thatyour card has not been properly read by the validator or there isinsufficient money available. Try tapping your card again or visita MyCiTi station kiosk for help.
3. Top up your card
Remember to top up your myconnect cardat MyCiTi station kiosks, participatingretailers or selected cash-accepting ATMsto ensure you always have enough moneyon your card to travel. You will not be ableto enter a station or bus if you do not haveenough money loaded on your card.
Absa bank customers can load money directly from their bank card to their myconnect card at anyAbsa ATM, for immediate use. Absa customers can also load money via internet banking althoughyou still need to visit an Absa ATM or MyCiTi station kiosk to have the money transferred to yourmyconnect card. Click here for more information about myconnect services available to Absacustomers.

198 S e c t i o n 4 • r E S o u r c E S
Fares
Please note that MyCiTi is a card-based system, except on the airport route.
Each passenger needs a myconnect card loaded with sufficient money for travel. Certaincontactless cards displaying this symbol are also accepted.
You need cash to get your myconnect card and load money, available at MyCiTi station kiosks andparticipating retailers. All MyCiTi users can also load money at selected cash-accepting Absa ATMsfor immediate use. Absa bank customers can load money directly from their bank card to theirmyconnect card, or via internet banking.
Click here to find out more about myconnect.
Paper tickets for the airport service are available at Civic Centre and Airport station kiosks forchildren and others using concessionary fares. Adults can either use their myconnect card or purchase a paper ticket for this service.
Airport service
myconnect cardR23
R5.30
R10.60
Free
F1 Gardens – Civic – WaterfrontF14 Big Bay – Table View – Parklands EastF15 Parklands East – Table View – Blouberg SandsF16 Marine Circle – Table View – Blouberg Sands
T1 Table View – Civic Centre
Children under 1 metre tall and under 4 years old
Civic Centre – Airport route (A1)R57
Civic Centre – Airport route (A1) for children 4–11 years oldR28.10
Children under 1 metre tall and under 4 years oldFree
Monthly ticket offering unlimited travel on the Airport – Civic Centre route (A1).This option works out cheaper if you travel between the Airport and Civic Centremore than 8 times a month. This ticket cannot be used by anyone else and musthave the name of the ticket holder on it. Write your name on the ticket as soon asyou buy it.
R449.50
Finance: Investigation 2 compile a transport tariff guide for your area
People who use public transport (trains, buses, taxis and BRT systems) need to know what all the tariffs are for these services, so that they can choose the most economical way to travel. For example, a person may always take the train, even though on weekends it could cost less to use a bus for the same journey.
Research the forms of public transport in your area, and the tariffs for each form of transport. Compile this information into a poster or booklet. Include the following information for each form of transport:• tariffs for weekdays, nights, weekends and public holidays• whether the transport travels on main routes, in suburbs, and so on• whether there are discounts available (season tickets), and what the
discount tariffs are.
Finance: Investigation 3 compile a personal budget for the year after you complete Grade 12
Do this investigation after you havecompleted 5.3 Assignment: Compile a personal income-and-expenditure statement andbudget on page 93 in the Learner’s Book.
1. What are your plans after you complete Grade 12 and leave school? Write a brief outline of what you intend to do next year – where you will live, what you will study or what work you will do, and so on.
2. Prepare a budget that covers your projected expenses for next year. Use suitable categories and be as specific as possible about your expenses.

199S e c t i o n 4 • r E S o u r c E S
For example, if study at college is in your outline for the year, list the college fees, costs of study materials, transport fees or residence fees, and so on. Do research to find the exact cost or a good estimate for each item.
3. Use your income-and-expenditure statement from 5.3 Assignment to calculate how much your living expenses for next year will be. Decide whether the expense items will stay the same, and whether the amount for each item will increase, stay the same or decrease.
4. If you will move out of home next year, do research to find out what the cost will be to stay in a residence, share a flat with friends, or rent a room in someone’s house.
5. Compile a list of all the sources of income you expect to have next year. Give accurate amounts or good estimates for each source of income.
6. Calculate whether you will have a surplus or a shortfall in your budget for the year.
7. If you will have a budget shortfall, write a brief explanation of how you could increase your income possibilities for the year, or reduce your expenses.
Finance: Investigation 4 Budget for a dream holiday
Prepare a budget for your dream holiday anywhere in the world. Do research on the internet and at travel agencies to collect accurate information about the cost of the holiday – all travel, accommodation, tours, passport and visa costs, insurance and any other expenses.
Your budget should include copies of all the documents you have used to find costs for the trip – travel brochures, visa forms, adverts for local tours and accommodation, and so on.
ZANZIBAR MINI-STAY
SWIM WITH DOLPHINS
3 DAYS, FR R2042
FULL DAY, FR R607
2 nights accommodation in Stone TownReturn transfers from Dar es Salaam1 Zanzibar Island activityDaily breakfast
If you’re short on time but don’t want tomissout on a visit to this incredible paradise, a‘mini-stay’ is the perfect option. We take care ofall your transport from Dar es Salaam (includingferries) so there is absolutely no hassles andyou can concentrate on relaxing. You’ll get anincluded activity in the package, choose froma Stone Town tour or Spice tour if you choose‘Basic’ accommodation and a Dhow Sailingcruise or Swimming with Dolphins if you choose‘Classic’ accommodation. Fill the rest of yourdays lazing up on the beach and swimming inthe turquoise sea. Please note this package is also available as a 4 day option.
From the village of Kizimkazi on the southcoast of Zanzibar, there’s the opportunity togo out in a local boat and swim with the largeresident pods of humpbacked and bottlenosedophins. Grab your flippers and hoist yourselfinto the warm Indian Ocean while your friendsstand ready with the camera. More than likelya friendly local will pop up next to you in thewaves – it’s easier than you think.

200 S e c t i o n 4 • r E S o u r c E S
Finance: Investigation 5 Analyse your local municipality’s budget
If you are able to access your municipality’s reports and budgets via the internet, complete part 1 of this investigation. If not, complete part 2 of the investigation. When you have done part 1 or part 2, complete part 3. Work with a partner.
Part 11. Do an internet search to find your municipality’s most recent budgets and annual reports. 2. Analyse the budget for two consecutive years, and write a short report in which you
explain what you noticed about the main items of income and expenditure in the budget, and how these increased, decreased or stayed the same from one year to the next.
3. If you are able to find an annual report that includes an income-and-expenditure statement for a specific year, compare this statement to the budget for the same year. List any income or expenditure items in the statement that are different from the budgeted amounts for the same items (for example, income from electricity service charges that was budgeted to be R20 billion, but that was actually R18 billion in the income and expenditure statement).
Part 21. Arrange a meeting with an official in your municipality who can give you information
about the budgets and income-and-expenditure statements for the municipality. 2. Prepare a few questions to ask the official about how they draw up a budget each year.3. Ask the official to show you examples of actual income and expenditure amounts that
were different from the amounts budgeted for that year. 4. Find out what the municipality does if the income received in a year is less than the
budgeted expenditure for that year.
Part 31. With your partner, make a list of the repair and maintenance work and new services
that are needed in your community and that you think the municipality should provide (for example, fixing leaking pipes on council property to save water, placing speed bumps on neighbourhood roads to slow the traffic, clearing a piece of open ground to make a public sports field).
2. Rank the items on your list in order from most needed to least needed.3. Estimate the cost of providing each item on your list. Your estimate can be a very
rough one, but it should include a note explaining how you did your calculations for the estimate.
4. Study the municipal budget documents you found. Could the items on your list fit in any of the categories in the budget? (For example, new speed bumps could fit into a category such as traffic control or road safety.)a. If each item could fit into an existing category, state what percentage increase
in funds would have to be budgeted for that category to provide for the costs of the item.
b. By what percentage would the total municipal budget have to increase to cover the costs of all the items on your list?
b. If there is any item on your list that does not fit into a category in the budget, in the budget, discuss ways in which you could persuade the municipality to budget for this item in future.

201S e c t i o n 4 • r E S o u r c E S
Finance: Investigation 6 A case study of a small business
Do this investigation with one or two learners in your class.1. Identify a small business in your neighbourhood and ask the owner/manager
if they are willing to share information about the business with you.2. Prepare a list of questions that will help you to get the following
information from the owner or manager:a. total business expenses for a month, grouped in the categories fixed
costs and running costsb. total sales for the month – how many of each item or service the
business sells per monthc. how the business sets the selling prices of its goods or servicesd. actual prices of the main goods or services offered by the business.
The owner or manager may not be able to give you exact totals for these amounts. Ask them to give you a reasonable estimate of each amount.
3. Using the information you gathered, write a short report about the business, with tables, equations and graphs where useful, to set out the following information:a. an income-and-expenditure statement for the yearb. a budget for total annual sales income from the different goods and
services offered, using the prices and sales quantities you foundc. a break-even analysis showing how many of all the items or services
combined must be sold for the business to reach break-even point for the year
d. the approximate percentage profit that the business could be making for the year, based on the information you found
e. any comments you want to make about whether the business could earn more sales income if it changed its selling price or cost price for any of the goods or services it sells.
Finance: Assignment 2 Analyse information about long-term investment and debt/loan scenarios
1. The table gives information about a retirement annuity. Use it to answer the questions.
Retirement annuity number 90013#21
Date on which annuity commences 01 September 1997
Date on which annuity holder retires 01 September 2025
Annuity payment R500,00
Payment frequency Monthly
Projected value on retirement – minimum R187 621,08
Projected value on retirement – maximum R389 131,95
a. Over how many years does the annuity holder pay for this retirement annuity?
b. What is the total of all his payments?c. What is i the highest ii the lowest amount of money he could expect to
have available for his retirement from this annuity?d. Could this amount of money be lower or higher than the amounts
given in the table?
term 2

202 S e c t i o n 4 • r E S o u r c E S
2. Use the funeral plan leaflet on page 195 in the Learner’s Book to answer these questions.a. A Standard Bank customer who is married with three children aged
6 months, 5 years and 15 years takes out a FuneralPlan with the bank. If he lives for another 40 years, give his total premium payments.
b. If the planholder dies two years after taking out the plan, what benefits will the bank pay to his family?
c. If the planholder decides to include his father, his mother and his wife’s mother in the plan, how much will he pay altogether as a monthly premium?
d. What benefits will the plan pay out to his parents and his wife’s mother, if he dies?
3. The table below sets out details of a funeral plan offered by another bank.
What are the benefits?
• The benefit is kept simple, giving you the choice of how to use it and therefore keeping you in control of your own plans• Up to R120 000 accidental death benefit for the plan holder and spouse• Whole life cover for children, as long as the plan remains in force• In the event of death of the plan holder, a memorial benefit of R5 000 is payable in addition to the cash benefit• 12 months free cover for the remaining members after the plan holder’s death• The plan pays out the cash benefit ranging from R5 000 to R60 000 in the event of death of any of the insured persons, including a R1 000 payout for stillborn for the plan holder or spouse (after the 26th week of pregnancy)• Quick payouts• No medicals required
The funeral plan provides flexibility by allowing you to choose who you want to cover as well as offering you differentcover amount options to choose from.
Cover
Cover
Cover Child fee
Extended Family fee Parents fee
Main member fee Spouse fee
R5 000
<65 >=65 >=65<65
R5 000 R34.00 R60.00 R55.00R30.00
R10 000 R60.00
R5 000 R3.00
R10 000 R6.00
R100.00 R90.00R55.00
R15 000 N/A N/A R130.00R80.00
R30.00 R13.00
R10 000 R40.00 R17.00
R15 000 R47.00 R22.00
R20 000 R55.00 R35.00
R30 000 R67.00 R44.00
R40 000 R79.00 R55.00
R50 000 R90.00 R64.00
R60 000 R102.00 R73.00
What are the options and what will they cost?
(Source: www.fnb.co.za/funeral-cover/funeral-plan.html)
a. In the Family Package, how much will it cost a planholder every month to buy funeral cover worth R20 000 for herself and R5 000 for her children?

203S e c t i o n 4 • r E S o u r c E S
b. How much extra will it cost if she wants to include six extra family members in the plan?
c. Which is the best package option for a single person who wants family cover for himself and his parents?
d. If the single man is 35 years old and he has a maximum of R100 to spend every month, how much funeral cover can he buy for himself and his parents?
e. Compare the packages offered by the bank above with the funeral plan set out on page 195 in the Learner’s Book. Which bank offers a better funeral plan? Explain your choice by giving examples of the different benefits and costs each plan offers.
4. The table below comes from a calculator tool offered by a bank to help people work out how much a home loan will cost them. Use it to answer the questions that follow.
Number of months of loan
Interest rate
Total amount of loan
1
2
3
4
5
6
7
8
9
10
11
12
Totals for year 1
You will spend R 103,543.20 for the whole yearR 7,543.20 will go towards INTERESTR 96,000.00 will go towards the CAPITAL
R1,136.00
R1,047.34
R957.63
R866.85
R775.01
R682.07
R588.04
R492.89
R396.62
R299.21
R200.64
R100.91
R7,492.60
R7,581.26
R7,670.97
R7,761.75
R7,853.59
R7,946.53
R8,040.56
R8,135.71
R8,231.98
R8,329.39
R8,427.96
R8,527.69
R88,507.40
R80,926.14
R73,255.16
R65,493.42
R57,639.82
R49,693.29
R41,652.73
R33,517.02
R25,285.04
R16,955.65
R8,527.69
R0.00
R8,638.60
R8,638.60
R8,638.60
R8,638.60
R8,638.60
R8,638.60
R8,638.60
R8,638.60
R8,638.60
R8,638.60
R8,638.60
R8,638.60
Payment no. Payment amount Interest amount Capital reduction Balance due
12
14.2 %
96,000.00
clear
calculate
a. What is i the interest rate ii the term iii the monthly instalment of this bond?
b. How much money will the bond make available towards the cost of a property?
c. How much interest will the borrower have paid altogether by the end of the term?
d. At the end of the seventh month, how much money will the borrower still owe the bank?
e. If the borrower paid off this amount in total at the end of the seventh month, how much interest would he save?
f. Which patterns do you notice in the interest amounts and the amounts of capital paid, month-by-month for the duration of the bond?

204 S e c t i o n 4 • r E S o u r c E S
Finance: Investigation 7 compare bank fee options offered to students
Most banks are keen to attract students to open accounts at their bank because, in general, people who have an account at one bank seldom change to another bank later in life. The bank that offers low fees and special deals to students knows that these students will spend more on bank fees, interest payments, and so on once they start earning an income, buying a house or doing other long-term bank transactions.1. Working with a partner, collect tariff lists and marketing brochures from at
least four banks about the student account options they offer. You will find this information on bank websites and at local branches of the banks.
2. Use this information to compare the different options. Your comparison should cover not only the fees charged per transaction, but also extra services offered by each bank – for example, free cellphone banking and a student loan account.
3. Use tables of values, graphs and any other suitable means to show examples of how one bank’s options are better or worse those that of another bank.
4. Decide which student account option you would choose if you were a college or university student, and write a short report in which you explain the reasons for your choice.
Finance: Assignment 3 compare interest owing on credit card and loan accounts
Mzwandile and Thobeka both have to spend R5 000 on textbooks and laboratory equipment for their university studies.
Mzwandile sees the advertisement on the next page, and decides to apply to this bank for a loan of R5 000 that is repayable after 12 months.
Thobeka has a credit card, and she decides to buy the books and equipment with her card instead of taking out a bank loan. She buys the books on 1 February, and plans to repay the R5 000 into her credit card account by 31 January of the following year. The debit interest rate on her credit card is 22,1% p.a., and the terms and conditions of this credit card state:
You will be liable to pay interest to us in respect of each transaction, calculated monthly on the daily balances as set out on your statement.
1. Use tables of values to calculate the real cost of the R5 000 for:a. Mzwandileb. Thobeka
2. Draw graphs of both tables of values on the same set of axes. 3. Is there any time during the 12-month period when the real cost of
Thobeka’s credit card debt will be lower than the real cost of Mzwandile’s loan up to that point, or Mzwandile’s loan up to that point will be lower than Thobeka's credit cared debt? Explain.

205S e c t i o n 4 • r E S o u r c E S
Get an Absa Personal or Micro-LoanJust like you, your Absa Loan has a birthday – but youget the gift! Take up a new Absa Personal or Micro-Loanand you’ll get 1% of your loan value back, every year.
Borrow from R3 000 to R150 0001
2
3
4
5
Get it paid into any bank account
Pay it back over 12 to 84 months*
Apply at any Absa branch, or using Absa Cellphoneor Internet Banking
Choose Credit Life Cover for added peace of mind
Simply bring the following documentation to finaliseyour application:
• Green bar-coded Identity Document
• Latest proof of income
• Proof of physical address (e.g. utility bill not older than 3 months)
• 3 months’ bank statements (not required for Absa customers)
*Terms and conditions apply. All loans are subject to credit assessment.
Absa Bank Ltd. Reg No 1986/004794/06.
Personal Loans
Authorised Financial Services Provider. Registered Credit Provicer. Reg No NCRCP7.
Apply now at your nearest Absa branch, logon towww.absa.co.za, call 0860 100 372 or apply from yourcellphone at www.absa.mobi
Bank on five more reasons to be with Absa:
Personal Loans
Mic
ro-L
oans
Rep
aym
ent T
able
Loan
Amou
ntIn
stal
men
tw
ithCr
edit
Life
Tota
lAm
ount
Repa
yabl
e
Inst
alm
ent
with
Cred
it Li
fe
Tota
lAm
ount
Repa
yabl
e
Inst
alm
ent
with
Cred
it Li
fe
Tota
lAm
ount
Repa
yabl
e
Inst
alm
ent
with
Cred
it Li
fe
Tota
lAm
ount
Repa
yabl
e
Inst
alm
ent
with
Cred
it Li
fe
Tota
lAm
ount
Repa
yabl
e
Term
12
R5 0
00R5
88R7
055
R354
R8 4
98R2
77R9
970
R239
R11
472
R217
R13
002
R10
000
R1 0
64R1
2 76
6R6
21R1
4 90
9R4
75R1
7 10
8R4
03R1
9 36
2R3
61R2
1 67
0
R15
000
R1 5
40R1
8 47
6R8
88R2
1 32
0R6
73R2
4 24
5R5
68R2
7 25
2R5
06R3
0 33
8
2436
4860

206 S e c t i o n 4 • r E S o u r c E S
1. Explain in your own words what the numbers along the horizontal axis of the graph represent.
2. Explain in your own words what the percentages along the vertical axis represent.
3. A child was born in March 2013. When she is born her parents decided to take out an education savings policy as a way to save money to pay for her education, which would start in 2018. They waited until she was six months old before they started paying monthly premiums on the policy. By what percentage must they increase their monthly contribution to still reach their investment goal by 2018?
4. If they wanted to pay R250 into the policy each month, how much must this amount increase to still meet their goal?
5. A first-year college student decided to start saving for a round-the-world trip five years later. She could afford to pay a monthly contribution of R500 into an investment account. Because of unexpected college expenses, she started making contributions two years later than she planned. How much must she contribute to the policy each month if she still wants to reach her savings target?
6. The article above assumes that investments are growing at 9% per year. If the investments are growing at a lower rate (for example, 6% per year) should you save more money or less money each month to be able to reach your target amount by the term of the policy?
The cost of waiting to saveWhether you want to save for your retirement, a child’s education or an overseas trip, starting now can significantly reduce the cost of reaching your goals. Each month that you put off saving in favour of spending either increases the amount that you will have to save in the remaining months, or it pushes the date at which you will reach your goal further into the future. Starting to save earlier allows you to gain maximum benefit from the power of compounding.
The black line on graph 1 shows that if investments are growing at 9% per year and you need to meet your objective (goal) in 10 years’ time, delaying saving for just 18 months will increase the amount you need to save per month by more than 25%. The lighter line on the graph shows that when your timeframe for reaching your objective is 5 years, an 18-month delay in starting to save means you will have to save 50% more per month to reach your target amount.
(Source: simplified extract from GrayIssue 6 July 2012, Issue no. 133, published by Allan Gray Pty Ltd.)
Delay before starting to save (months)
Graph 1 Delays can be costly
0%
20%
40%
60%
80%
100%
120%
140%
10 year objective 5 year objective
Requ
ired
incr
ease
s in
mon
thly
cont
ribut
ion
0 3 6 9 12 15 19 21 24 27 30
Finance: Assignment 4 Analyse information about a long-term investment
Financial service providers publish newsletters to advise their customers about how to invest. The article that follows offers advice about long-term savings. Use it to answer the questions that follow.

207S e c t i o n 4 • r E S o u r c E S
Finance: Investigation 8 compare bank accounts suitable for stokvel investment
Many banks now offer savings accounts aimed specifically at stokvels and other savings groups. The group is allowed to act as one collective accountholder, and the bank fees and interest rates are designed to be suitable for many small deposits made by members over time.
Working with a partner, investigate the investment options that three different banks offer to stokvels.
1. Describe each account’s main features.2. Explain how this account is (or is not) more suitable for a stokvel group
than an individual savings or investment account.3. Compare the different accounts you have analysed, and explain how they
are similar or differ from each other. Use examples of stokvel investment amounts to show how each account’s fees and/or interest rates will affect the stokvel’s money.
Contact
Bank Online
Prevx SafeOnline™ Reset access details
Apply online Now
Terms and Conditions Verify payments Register
LoginUser ID Password
FNB Online Assistance Fraud Prevention Home
Search our site
Home For Me For My Business Private Banking Rates & Pricing Contacts & Tools About FNB
Go
how can we help you?
Call me back
Phone087 575 9404
CONTACTus now
Stokvel AccountA book-based savings account for a group of individuals who wish to save together
Comes with a Debit Card
Just for Savings
Smart AccountFNB Savings AccountFluid AccountIslamic Youth Account
Easy AccountMzansi AccountIslamic Smart Account
Stokvel AccountSmart Save Account
Benefits
Free
• Groups can save for a common purpose• Personalised service at FNB branches• Better return on savings• Better interest rates
If you keep a balance of at least R5 000 in your Smart Save Account at ALL times during the month, you get 10 free transactions.
This excludes cash deposits, special instructions, and penalty fee and statement charges.
Absa Club AccountDesigned for groups, such as Stokvels or Burial Societies, that need a simple and convenient way to administer their collective savings. You need only R50,00 to open the account and no monthly administration fee is payable. With tiered interest rates, the more you save the greater your returns. Interest is calculated daily and paid into the account monthly, and your money is immediately available from any branch. A key bene�t of the Absa Club Account is that the �rst deposit per month is free of charge. This product is not card-based thus no card-type transactions are permitted.
Transaction Type Fee
No charge
Monthly Fees
Deposits
Cash Withdrawals
Purchases
Account Payments and Funds Transfers
Monthly Administration Fee
Cheque Deposit: Branch Counter
Cheque Deposit: Absa ATM
Cash Deposit: Absa ATM
Branch Counter
Absa ATM
Point-of-Sale (POS)
Absa-supported ATM
Saswitch ATM
Overseas ATM/POS
Post Of�ce Terminal
Prepaid Top-up at Absa ATM or POS
POS – Local
POS – Overseas
Account Payments
Debit and Stop Orders
Funds Transfers
CashSend (Absa ATM)TM
Branch CounterAbsa ATM
•
Internal Debit Orders•External Debit Orders•Stop Orders•
Branch Counter•Absa ATM•
•
Cash Deposit: Branch Counter
R11,00
No charge
N/A
R27,00 + R1,15/R100(max. R500)
N/A
N/A
N/A
N/A
N/A
N/A
N/A
N/A
N/A
N/A
R27,00N/A
R3,85R7,15
No charge
R27,00N/A
R485 + R1,15/R100
Transaction Type Fee
R2,45
Balance Enquiries
Statement Fees
Administration Fees
Other Fees
Branch Counter
N/AAbsa ATM
N/AAbsa-supported ATM
N/ASaswitch ATM
N/APOS
N/APost Of�ce Terminal
R8,00
R8,00
R36,00
R65,00
R65,00
R65,00
R30,00
Branch Counter Full Statement
N/AAbsa ATM Ministatement
N/A
N/A
Absa CAT Terminal Full Statement
Mailed Statement
No charge
No charge
eStatement(1)
Bank Cheque
Special Clearance
Debit Card Replacement Fee
Noti�cation Fee (SMS or E-mail)(2)
Dishonoured/Returned Payment
Returned Cheque Deposit
N/AN/AN/AN/AN/A
Declined Fee (Insuf�cient Funds)Absa ATMAbsa-supported ATMSaswitch ATMPOSPost Of�ce Terminal•
••
••
Stop Payment Instruction(Debit Orders/Bank Cheque)
R12,50R32,00
N/ACopies of Statements(per Statement)
Less than 4 months old4 months or older
••
South Africa
Personal
Savings andinvestment accounts
Banking
Feature Benefits Apply
Society scheme
You are here : Home » Personal » Banking » Savings and investment accounts » Society Scheme
Business Corporate & Institutions Private Clients About Us
AccessSave
PureSave
PlusPlan
E Plan
Society Scheme
MarketLink
MoneyMarket Call Account
Fixed Deposits
Notice Deposits
SharePlus
ContractSave
If you are part of an informal group that wants to save together then a Society Scheme isideal for you. It is the classic group savings account for diverse groups from stokvels andburial societies through social clubs to investment clubs.Funds can be withdrawn on demand and deposits can be made at any time. SocietyScheme is a book-based account so all transactions have to be done over the counter ata Standard Bank branch.Interest is paid on a tiered basis meaning that the interest rate steps up as the accountbalance increases. Interest calculated daily and paid monthly.For more information on interest rates click here.Your group must have at least five members and three or four members must be selected to act as account signatories on behalf of the group. All signatures must be present whenopening the account at a Standard Bank branch and they must:-
No credit reference checks are performed and no proof of employment or salary arerequired when opening a Society Scheme account. However,
It is recommended but not madatory for your group to have a constitution. All transactionsare branch based and, in this regard,• All cash and cheque deposits are free, and your group enjoys two free cash withdrawals and two free cheque withdrawals per month• Accounts with monthly balances kept at R5 000 or more are not charged the monthly service fee and enjoy two further free debit transactions per month• All withdrawal instructions must be signed by at least two signatories to protect the rest of the group against misappropriationFor convenient depositing and withdrawing, stop order and debit order payments can bemade into and out of the account. Branch inter-account transfers and branch accountpayments can also be made out of the account.
• be South African citizens aged 18 or older• present valid South African identity documents• make a minimum account opening deposit of R500
• Signatories have to consent to identity and fraud prevention checks and the sharing of information relating to their application through the South African Fraud Prevention Service.

208 S e c t i o n 4 • r E S o u r c E S
Finance: Investigation 9 Analyse how inflation will affect different goods and services in your budget
In Finance: Investigation 3, you compiled a personal budget for the year after you complete Grade 12. Update this budget by adjusting the cost of each item to allow for inflation. Use the table below as a guideline. It shows a breakdown of how certain items and groups of items could increase in price, based on past inflation rates for these items.
Product group Inflation rate for this product group
Inflation rates for items within the product group
Food +10,7% Prices show average inflation increases within the food group, although the price of meat, oils and fats increase at the fastest rate.
Housing and utilities
+6,6% Water: + 9,2%Electricity: + 17,4%
Transport +6,8% Petrol: + 21,6%Public transport: + 13%
Education +8,6% Primary, secondary and tertiary education show similar inflation rates.
(Source: adapted from www.lrs.org.za/docs/LRS%20Inflation%20Monitor%20January%202012%20at%20270212.pdf )

209S e c t i o n 4 • r E S o u r c E S
Finance: Assignment 5 Analyse how inflation affects people in different income categories
Read the paragraph and the table below and answer the questions that follow.
Food, housing and utilities, and transport are items that households, especially poorer households, cannot easily avoid. Poorer households spend a higher proportion of their total income on these items than more affluent households. This means that poorer households will feel the effect of inflation more strongly as they attempt to buy essential goods and services. This is also reflected in the fact that the inflation rate for poor households was almost 2% higher than the average national inflation rate of 6,3% in 2012.
The table below provides a picture of the inflation rate for different expenditure groups from the lowest income to highest income and the impact of inflation rate for these groups. The very low group experienced an inflation rate of 8,1%, higher than the national inflation rate of 6,3%, while the very high group had an inflation rate of 6,7%.
Income groups Monthly expenditure Inflation rateJanuary 2012
National average 6,3%
Very low Up to R1 213 per month 8,1%
Low R1 213 up to R1 939 per month 7,8%
Middle R1 940 up to R3 062 per month 7,4%
High R3 063 up to R6 596 per month 7,2%
Very high R6 596 and more 6,7%
1. The first row of the table shows that the national inflation rate for 2012 was 6,3%. Which income group experienced an inflation rate closest to the national average?
2. Which income group experienced the highest inflation rate for the year?3. If a family budgeted about R2 050 per month for household expenses, by
how much did this amount need to increase in 2012 so that they could buy everything in their budget?
4. If the inflation rate for people in the high income group was 7,2% in 2012, by how much did their purchasing power decrease in that year? (Give your answer in rand, not as a percentage.)
5. Give an example to explain the statement, ‘Poorer households spend a higher proportion of their total income on food than more affluent households’.
6. The table below sets out the government social grants paid to some South Africans in 2011 and 2012. a. Calculate the percentage increase in each grant from 2011 to 2012.b. Did the increases allow each type of grant to maintain the same
purchasing power in 2012 as it had in 2011? Explain.
Type of grant 2011 amount 2012 amount
old age pension (people over 75) r1 160,00 r1 220,00
disability grant r1 140,00 r1 200,00 (maximum)
child support grant r260,00 r280,00
Foster child grant r740,00 r770,00

210 S e c t i o n 4 • r E S o u r c E S
Finance: Assignment 6 Analyse how inflation affects pensioners
Read the article below and answer the questions that follow.
Pensioners spend a greater share of their income on housing and utilities than even the richest 20% of the general population does. Health-related costs make up 1,5% of the national CPI basket of goods, but 2,4% of the pensioners’ basket.
Inflation 2003 to 2011
Average pensioner inflation 6,0%Average general inflation rate 5,2%Difference 0,7%Difference compounded over 10 years 7,4%Difference compounded over 20 years 15,2%Difference compounded over 30 years 23,7%Additional savings required as percentage of savings 7,8%Additional savings required as percentage of salary 1,0%
1. Write a sentence in which you describe how the general inflation rate changed from 2009 to 2011.
2. Write a sentence in which you compare the changes in pensioners’ inflation to general inflation for the same period.
3. Was there any time when pensioners experienced lower inflation than the general public?
4. In the period from 2003 to 2011, by what percentage did employed people need to increase their savings so that they would have the same purchasing power in spite of inflation?
5. In this period, by what percentage did pensioners need to increase their savings to keep the same purchasing power in spite of inflation?
6. How easy is it for pensioners to increase the amount they save every month or every year? Explain your answer.
7. Why do pensioners tend to experience inflation rates that are different from the inflation experienced by the general population? Give an example to explain your answer.
Finance: Investigation 10 Linking income to the inflation rate
1. The extract from a news report below quotes a former South African Minister of Finance about how workers can protect themselves against inflation. Read the article and answer the questions that follow.
Inflation should not erode wages, says Manuel15 May 2008 – Staff Reporter South Africa’s Finance Minister Trevor Manuel said on Thursday that it was important to ensure that inflation did not erode workers’ salaries.
Manuel told journalists at the launch of South Africa’s 2008 tax season, ‘You can’t in an environment where inflation
is above 8% ask workers to take a 4% increase”. South Africa’s labour unions have indicated they would ask for double-digit wage increases this year to cushion workers against rising prices.
(Source: Adapted from www.mg.co.za/article/2008-05-15-inflation-should-not-erode-wages-says-manuel)

211S e c t i o n 4 • r E S o u r c E S
a. How do workers try to maintain the purchasing power of their wages and salaries when prices increase as a result of inflation?
b. If employers offer their staff a salary increase of 4% when the inflation rate is 8%, how will this affect the workers’ purchasing power? Included in your answers, give an example of how this would work.
c. Give an example of how a worker’s weekly wage would need to change so that an annual inflation rate of 7,2% did not damage the purchasing power of their wage.
d. Find out what percentage wage or salary increases workers in a local business have received over the past two years. Compare these increases with the inflation rate for the past two years, which you will find on the website of Stats SA (www.statssa.gov.za). Write a brief report in which you compare the workers’ rate of pay increase with the inflation rate for the same period.
2. Some people buy goods such as jewellery, art and property that increase in value over time. They hope that the value of the goods will increase at a higher rate than inflation. Then, if they need to sell the goods to get cash, they will get enough cash back so that they will have the same level of purchasing power as they had when they bought these items.
The graph compares the inflation rate of jewellery with the inflation rate for personal effects (all personal goods such as clothing, phones and cameras).
10
8
6
4
2
0Jan. 2008 Jul. 2008 Jan. 2009 Jul. 2009 Jan. 2010
The inflation rate for jewellery and general personal effects
Jul. 2010 Jan. 2011 Jul. 2011 Jan. 2012
Jewellery, clocks and watchesGeneral personal effects
Inflate
rate
(%)
a. Write a short paragraph in which you describe how the inflation rate for jewellery, clocks and watches compared with the inflation rate for general personal effects during the period 2008 to 2012.
b. If Pat bought a gold ring in July 2009 for R3 500, approximately how much would the same ring cost in January 2012?
c. If Ismael bought a pair of shoes for R1 500 in July 2009, approximately how much would the same pair of shoes cost in January 2012?
d. Collect information from a local jeweller about how prices have changed for certain items of jewellery over the last three years. Choose five or six specific items to compare (for example, a gold ring with one diamond and a pair of gold earrings) and compile a table of selling prices for three years. Calculate and draw a graph to show the average inflation rate for the jewellery items over this period.

212 S e c t i o n 4 • r E S o u r c E S
e. Collect information about the prices of five or six items of clothing, or electric/electronic goods, for the same three years. Calculate the average inflation rate for these goods and draw a graph of this rate on the same set of axes as the jewellery graph above.
f. Write a sentence in which you compare the two inflation rates.3. The graph of house prices on page 243 in the Learner’s Book shows
that property prices increase at rates that are not always the same as the general inflation rate. Over time most houses increase in value, because inflation means that it costs more and more to build a new house. But if you sell a house, there is no guarantee that the amount you receive will have enough purchasing power to match the higher cost of living caused by inflation.
This table sets out average changes in house prices in a few major South African metropolitan areas over a five-year period.
Annual percentage price change
City 2007 2008 2009 2010 2011
Pretoria 16,5 1,1 0,38 9,8 2,2
cape town 10,4 2,46 0,13 9,5 2,2
Greater Johannesburg 15,5 3.25 3,1 2,8 6,9
durban/Pinetown 14,9 0,07 6,5 8,7 9,6
East London 11,7 12,8 1,16 3,07 17,0
Bloemfontein 22,6 1,8 0,6 15,8 2,7
Port Elizabeth/uitenhage 12,7 3,07 8,8 9,9 4,1
a. Work out the average house price inflation rate across all these metropolitan areas in each of the five years.
b. Use these averages to draw a graph of house price inflation in South African metropolitan areas from 2007 to 2011.
c. Work out the average house price inflation rate in each metropolitan area for the same five-year period.
d. If the general inflation rate in South Africa over this five-year period was 6,3%, in which metropolitan areas would income from property sales have had the same (or more) purchasing power in 2011 as in 2007?
d. Consider a house in each metropolitan area that cost R1 000 000 in 2007. If that house were sold at the end of 2007, how much would the new owner have paid for it?
e. If the same house were sold again at the end of 2008, 2009, 2010 and 2011, what would the cost of the house have been at the end of 2011?
f. Find out how house prices have changed in your neighbourhood over the last five years. What has the average house price inflation rate been for this period? Is this greater or smaller than the average inflation rate in South Africa, for the same period?

213S e c t i o n 4 • r E S o u r c E S
Measurement: Assignment 1 Estimate the lengths of roads and pavements in a settlement
The street plan shows part of an informal settlement where the municipality plans to upgrade the roads. Use the scale bar on the plan to help you answer the questions.
Market Street
Mountain Road
Dolphin Road
MarketSquare
0N
40 80 m
(Source: ‘The Desmond and Leah Treatment Centre, Masiphumelele’, Digest of South African Architecture 2004/2005 p. 81)
1. Estimate the total length of all the roads marked on the plan. Explain how you worked out your estimation. How accurate do you think your estimated measurement is?
2. The municipality plans to create pavements along both sides of every road. What will the total estimated length of the pavements be?
3. The pavements will be edged with concrete kerbstones. If one kerbstone is 0,6 m long, how many kerbstones will be needed for this job?
4. If the kerbstones are priced at R750 per 500 m, what will the municipality have to pay for the total quantity of concrete kerbstones they need?
5. There is a chance that this part of the upgrading could be delayed by one to two years, even though it is in this year’s budget. How would you advise the municipality to adjust its budgeted amount for the kerbstones, in case there is a delay?
Measurement: Investigation 1 complete a travel logbook
1. Complete at least one month of travel information using a copy of the logbook on page 291 in the Learner’s Book. Also insert the vehicle details at the top of the logbook page. (Note that the dates are for Mondays. You may complete details for any four weeks – not only those listed in the logbook.)
The best way to complete the logbook will be for you to find a person who runs a small business and can help you fill in real distances travelled for business and personal reasons, week by week. If the person you ask does not keep a log of accurate distances, help them estimate at least one week’s distances.

214 S e c t i o n 4 • r E S o u r c E S
Base your estimate on:• the odometer reading at the start of the week• the odometer reading at the end of the week• a list of all the trips that the vehicle made for business and personal
reasons during the week.
If you cannot find a business manager or owner to help you, work with a partner in your class to estimate distances for at least one month of the logbook, for an imaginary business owner. For example, a young mother with three children, who runs a business from home that makes gift boxes and fancy stationery to sell to the public.
2. Use the details in your logbook to work out the average kilometres travelled by this vehicle, per month and per year, for business and for personal reasons. Add rows for all the weeks that have not been listed in the logbook.
3. Use the average annual distances travelled for business and personal reasons to work out what proportion of the total distance covered in a year is for business reasons, and what proportion is for personal reasons.
Measurement: Assignment 2 calculate vehicle operating costs
1. Use the average distance travelled in a year that you calculated in question 2 of Measurement: Assignment 1 above to work out the operating cost of the vehicle for which you gave information in the logbook. To do this use the method you learned to use in Grade 11:
Step 1Find out what the average petrol consumption is for this car (ask the owner, look it up on a website, or ask a dealer who sells this make of car). For example: a car has average petrol consumption of 7,8 ℓ/100 km. This means it uses about 7,8 ℓ to travel 100 km. So it uses 7,8 ÷ 100 = 0,078 ℓ to travel 1 km.
Step 2Use a rate calculation to work out how much petrol this vehicle uses to travel the average distance travelled in a year. For example: the car with average petrol consumption of 7,8 ℓ/100 km travels 47 350 km in a year.
The car uses 0,078 ℓ to travel 1 km. So it will use 0,078 × 47 350 to travel 47 350 km.0,078 × 47 350 = 3 693,3 ℓ (Use a calculator to make it easier to work with the decimal values.)
Step 3Use the current price of petrol to work out what 3 693,3 ℓ of petrol costs.
The changing price of petrol means this method will not give you a completely accurate cost. To get an idea of the total cost, either find out what the petrol price was in each month of the year and work out the average for the year, or make a reasonable estimate of an average price, based on the current petrol price.
2. Now use the method set out in the AA tool op pages 292 to 294 in the Learner’s Book to calculate operating costs for the same vehicle. You will need to find the purchase price and engine capacity of the vehicle from the owner. If you invented a vehicle for your logbook, decide what type of vehicle it is, how much it cost you, and what its engine capacity is.
3. Compare your answers to questions 1 and 2 above. What do they tell you about the benefits of using each method to calculate operating costs?

215S e c t i o n 4 • r E S o u r c E S
Measurement: Assignment 3 calculate materials and budget for a built-in wardrobe unit
When she leaves school, Lerato moves into a new loft room built into the roof of her parents’ house. The room has no furniture in it, and parts of the walls slope steeply because they follow the line of the roof. Lerato sees the drawing below in a magazine, and asks her father if he will pay a cabinetmaker to build something like this for her new living space. Her father says he will do so, if the whole unit can be built for less than R2 000.
1. The length of the wall where this unit will go is 3,2 m. The ceiling height at its top point is 2,1 m. Use these measurements to decide on lengths for all the parts of this wardrobe unit that match the proportions of the different sections as shown in the diagram.
2. Decide how deep the wardrobe unit should be – how far it should jut out into the room.
3. Use your measurements to calculate the total length of construction material that will be needed for the sides, top, shelves and drawer of the unit.
4. Do research to find out which materials would be suitable for this unit, and what the cost will be of each type of material. If the materials only come in standard sizes, will there be any wastage of unused materials once the unit is built?
5. Is it possible to construct the whole unit for under R2 000? Report on your findings.
6. Suggest ways in which the size of the unit sections could be changed to reduce the cost, or to use the material most effectively (with the least amount of unused material left over).
Measurement: Investigation 2 Growth patterns in children aged 2 to 20
The charts on the next two pages show the percentile curves for height (stature) and weight (mass) for both males and females aged 2 to 20. The scales are given in both metric and imperial units.
The mean weight (in kilograms) and height (in centimetres) of a representative sample of urban learners is given in the table that follows the two charts.

216 S e c t i o n 4 • r E S o u r c E S
2 to 20 years: BoysStature Weight-for-age percentiles-for-age and
NAMERECORD #
SOURCE: Developed b(2000).
y the National Center for Health Statistics in collaboration withthe National Center for Chronic Disease Prevention and Health Promotionhttp://www.cdc.gov/growthcharts
Published May 30, 2000 (modified 11/21/00).
WEIGHT
WEIGHT
STATURE
2 3 4 5 6 7 8 9 10 11 12 13 14 15 16 17 18 19 20
STATURE
74
76
72
70
68
66
64
62
60
in
lb
30
40
50
6070
8090
100
110120130
140150
160170
180
190
200
210
220
230
62
42
44
46
48
60
58
52
54
56
in
30
32
34
36
38
40
lb
30
40
50
6070
80
kg10
15
20
25
30
35
80
85
90
95
100
105
110
115
120
125
130
135
140
150
155
150
155
160
165
170
175
180
kg10
15
20
25
30
35
105
45
50
55
60
65
70
75
80
85
90
95
100
12 13 14 15 16 17 18 19 20
AGE (YEARS)
AGE (YEARS)
40
9590
75
50
25
105
95
90
75
50
25
105
cm 113 4 5 6 7 8 9 10
145
DateMother’s Stature Father’s Stature
Age Weight Stature BMI*
50
185
190
cm
160

217S e c t i o n 4 • r E S o u r c E S
SOURCE: Developed by the National Center for Health Statistics in collaboration withthe National Center for Chronic Disease Prevention and Health Promotion (2000).http://www.cdc.gov/growthcharts
2 to 20 years: GirlsStature Weight-for-age percentiles-for-age and
NAMERECORD #
Published May 30, 2000 (modified 11/21/00).
WEIGHT
WEIGHT
cm
150
155
160
165
170
175
180
185
190
lb
30
40
50
6070
8090
100
110120130
140150
160170
180
190
200
210
220
230
kg10
15
20
25
30
35
105
45
50
55
60
65
70
75
80
85
90
95
100
20
20
STATURE
40
lb
30
40
50
6070
80
STATURE
62
42
44
46
48
60
58
52
54
56
in
30
32
34
36
38
40
50
74
76
72
70
68
66
64
62
60
in
kg10
15
20
25
30
35
80
85
90
95
100
105
110
115
120
125
130
135
140
145
150
155
2 3 4 5 6 7 8 9 10 11 12 13 14 15 16 17 18 19
12 13 14 15 16 17 18 19
AGE (YEARS)
AGE (YEARS)
160
cm 113 4 5 6 7 8 9 10
95
90
75
50
25
105
9590
75
50
25
105
DateMother’s Stature Father’s Stature
Age Weight Stature BMI*

218 S e c t i o n 4 • r E S o u r c E S
Age (to nearest whole year) 12 13 14 15 16 17
Male learners
Mean weight (kg) 42,98 50,00 56,66 61,61 64,82 68,03
Mean height (cm) 152,3 159,8 166,7 171,4 174,3 175,5
Female learners
Mean weight (kg) 46,59 50,46 54,18 56,47 58,06 57,57
Mean height (cm) 155,2 158,8 161,4 162,2 162,7 162,9
1. Plot the data for each age group on the appropriate graph. 2. Comment on what you can learn about the sample group from this data. 3. Collect height and mass data from a sample of male and female learners in
each age group in your school or community. a. Calculate the mean mass and height for each age group. b. Plot the data on the appropriate graph (see the graphs above).c. Comment on what this graph shows. d. How does the data from your sample compare with the data given in
the table above? Suggest reasons for any differences. 4. Calculate the mean BMI for each age group using the data given in the table.
a. Use the BMI percentile graphs in this unit and plot the BMI for each group.
b. How does the plotted mean BMI for girls compare with the median BMI for each age group?
c. What percentage of 17-year old boys has a BMI above the mean for this sample group?
5. Use the given data together with the data you collected and write a short paragraph in which you compare the growth patterns and BMI findings for male and female learners.
Measurement: Assignment 4 Prepare a set of instructions about E coli and water purification
The people who are most at risk of E coli infection may not be able to read warnings and instructions in English. Follow the steps in this assignment to prepare an easy-to-use leaflet for them.
Step 1Plan a page of the leaflet on which you set out the information given on pages 330 to 332 in the Learner’s Book about E coli in a few pictures that tell the same story. (For example, you could include a picture of sewage spilling out of a broken pipe into a stream near a few houses, followed by a picture of a child playing in the river, with a big cross through this picture to show that children must not play in contaminated water.)
Step 2Design a clear sign that could be placed near any contaminated water, warning people not to use the water. The sign should include wording in at least two South African languages.
Step 3Convert the written guidelines for purifying water into a set of visual instructions (pictures) that show each step in the process. Use a few words or numbers where necessary to explain what must be done.

219S e c t i o n 4 • r E S o u r c E S
Step 4Translate the guidelines above into at least one other South African language, and present them in an easy-to-read leaflet. If you do not speak more than one language, find a partner in the class to work with you, or find someone in your neighbourhood who can translate the English text into another local language.
Measurement: Assignment 5 collect information about temperatures in your home fridge and plan your food storage accordingly
Use the cold storage guidelines on pages 338 and 339 in the Learner’s Book to analyse the temperatures in the fridge and/or freezer at home, and decide on the best ways to pack food into it. You will need a thermometer that shows temperatures between about 10 °C and –20 °C.
Take all the temperature readings in the same fridge, so that you can compare the changes. (Different fridges may have slightly different temperature ranges, because of wear and tear or different cooling mechanisms.) 1. On a specific date, take a reading of the temperature in the following parts
of the fridge. For each measurement, put the thermometer in position and leave it there for at least five minutes. It is not necessary to move the food in the fridge out of the way. Record your measurements for each position in the fridge.a. the top shelf, near the back b. the top shelf, near the frontc. the bottom shelf, near the back d. the bottom shelf, near the fronte. an inside rack of the doorf. one of the drawers at the bottom of the fridge
2. Empty the fridge and let it stand empty for half an hour and then repeat the measurements. (You may need to store some of the foods in a neighbour’s fridge for an hour.) Record your new measurements.
3. Repack the food in the fridge. Follow the guidelines in the table on page 338 in the Learner’s Book as far as possible. Leave the fridge like this for at least an hour, then repeat the measurements and record them.
4. Draw up a table to set out your three sets of measurements, so that you can easily compare how the temperatures did or did not change in each situation. The table could look like the one that follows.

220 S e c t i o n 4 • r E S o u r c E S
Fridge packed as usual
Fridge emptied Fridge repacked according to guidelines
Position Temperature in degrees Celsius (°C)
top shelf, near back
top shelf, near front
bottom shelf, near back
bottom shelf, near front
inside rack of door
drawer at bottom of fridge
5. Write a few sentences in which you give guidelines about where to pack different types of food in your fridge so that it maintains the most suitable temperatures for storage.
Measurement: Investigation 3 tiling a given area
Example 3 on pages 354 to 356 in the Learner’s Book sets out the basic method for calculating quantities and costs for a tiling project. It made allowance for grouting between tiles. Use this method, or any other method for this investigation.1. Choose an area in your house that could be tiled (for example, the wall
above the kitchen sink or the stove, a bathroom or kitchen wall or a floor in one of the rooms).
2. Measure the dimensions of this area accurately, and prepare a sketch diagram to show the shape of the area and all the measurements of its sides. Calculate the total area of the surface you want to tile.
3. Visit one or two tile suppliers and choose tiles that would be suitable. (Some tiles are only suitable for walls, as they are not strong enough to be used for floors.) Measure each tile accurately. Write down the price of each tile you choose and find out how the tiles are sold (how many tiles are in one box). Ask the assistant how much grouting and tile adhesive you would need for the area you want to cover, and calculate the costs.
Or, if there is no tile supplier near where you live, do research on the internet to find what different sizes of floor or wall tiles cost, how much grouting and adhesive are needed for different areas, and what these items cost. Or find a builder or home do-it-yourself person in your neighbourhood, and ask them to help you estimate costs and tile sizes for your project.
4. Using the information you collected above, work out how many tiles are needed to cover the area you chose for this investigation. Indicate if some tiles will need to be cut so that the whole area can be tiled.
5. Prepare a budget for this tiling project, including the following.a. the cost of tilesb. the cost of grouting and adhesivec. the total cost, including VAT
6. Calculate how many uncut tiles will be left over after the area has been tiled.
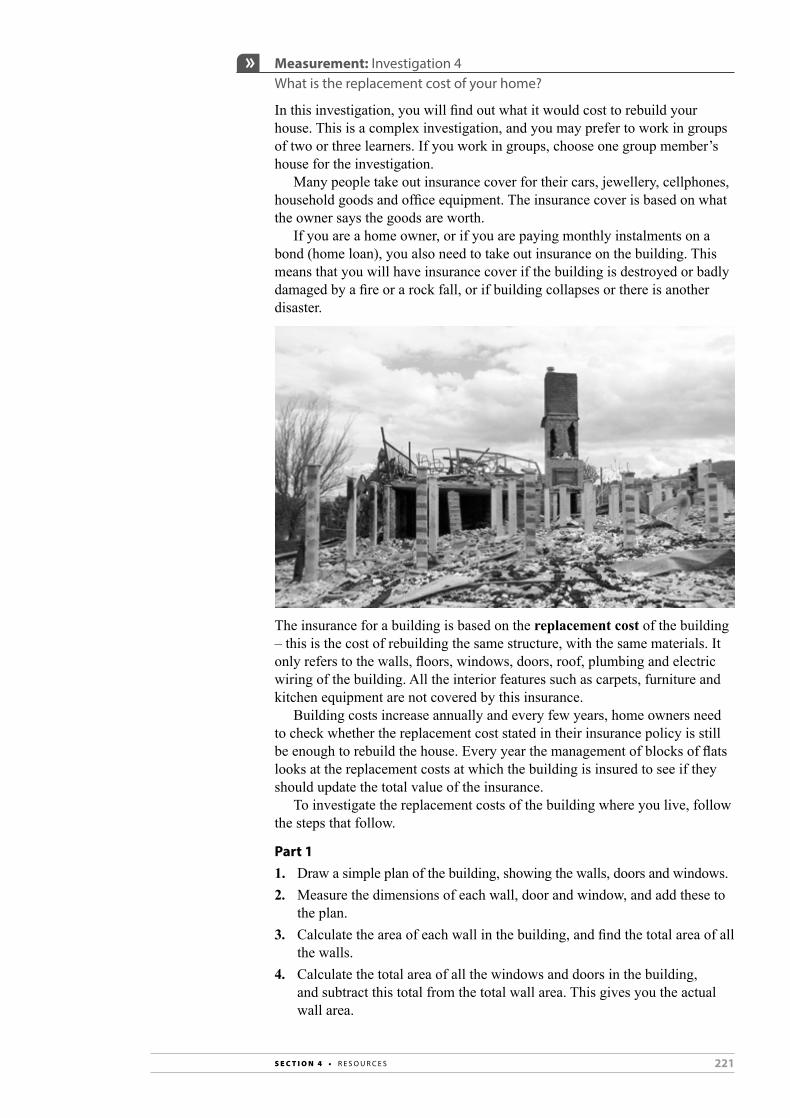
221S e c t i o n 4 • r E S o u r c E S
Measurement: Investigation 4 What is the replacement cost of your home?
In this investigation, you will find out what it would cost to rebuild your house. This is a complex investigation, and you may prefer to work in groups of two or three learners. If you work in groups, choose one group member’s house for the investigation.
Many people take out insurance cover for their cars, jewellery, cellphones, household goods and office equipment. The insurance cover is based on what the owner says the goods are worth.
If you are a home owner, or if you are paying monthly instalments on a bond (home loan), you also need to take out insurance on the building. This means that you will have insurance cover if the building is destroyed or badly damaged by a fire or a rock fall, or if building collapses or there is another disaster.
The insurance for a building is based on the replacement cost of the building – this is the cost of rebuilding the same structure, with the same materials. It only refers to the walls, floors, windows, doors, roof, plumbing and electric wiring of the building. All the interior features such as carpets, furniture and kitchen equipment are not covered by this insurance.
Building costs increase annually and every few years, home owners need to check whether the replacement cost stated in their insurance policy is still be enough to rebuild the house. Every year the management of blocks of flats looks at the replacement costs at which the building is insured to see if they should update the total value of the insurance.
To investigate the replacement costs of the building where you live, follow the steps that follow.
Part 11. Draw a simple plan of the building, showing the walls, doors and windows.2. Measure the dimensions of each wall, door and window, and add these to
the plan. 3. Calculate the area of each wall in the building, and find the total area of all
the walls. 4. Calculate the total area of all the windows and doors in the building,
and subtract this total from the total wall area. This gives you the actual wall area.

222 S e c t i o n 4 • r E S o u r c E S
5. Calculate the total floor area of the house.6. If you are investigating a house, estimate the area of the roof that covers
the house. (Hint: Compare the surface area of the roof with the total floor area of the building. Let the roof estimate be slightly more than the area of the floors.)
7. If you are investigating a flat, calculate the total area of all the ceilings in the flat. (Hint: Think about whether the ceilings are the same size as the floors in all the rooms.)
8. Measure the perimeter around all the walls in each room, excluding the doors. Add the perimeters to get a very rough estimate of how long the electric cables will be.
Part 2Now you have the measurements of the main elements, use each measurement to find the quantities and costs of materials needed to rebuild these elements.
Note: You can take your calculations of the walls, floors, roof, window and door sizes to a building supply store and ask the staff to help you if necessary.1. Find out how many bricks are needed to rebuild all the walls, and what
they will cost. 2. Find out what it will cost to replace the floors with new flooring of the
same type the house has now.3. Find out what doors and windows of the same sizes and types will cost.4. Investigate the types of roofing material that could be used to replace your
existing roof, and get an estimate of what this would cost.5. Ask an electrician to help you estimate the cost of rewiring a building
with the dimensions on your plan, and the perimeters of the walls you calculated.
Part 31. Use all the information you collected in part 2 and calculate the estimated
total cost for rebuilding your house.2. Find out what the current replacement cost is for your house as given in
the insurance policy. If your parents cannot give you this information, ask the home loans department at a bank to help you.
Or, if your house is not covered by building insurance, or you cannot find information about replacement costs for the building, ask a local builder to estimate what it would cost to rebuild your home (excluding labour costs). Compare this estimate with your calculations.
3. Write a short report about the information you found about the following:a. the replacement costs of the buildingb. the problems of trying to work out how much it will cost to replace a
building. How difficult was it to find out what materials cost? What problems did you experience when trying to measure the quantities of materials needed? Was it difficult to get help from the experts you approached?
4. Based on your report, take part in a class discussion about whether people ought to know what the replacement values of their houses are and how to help them get access to this information.

223S e c t i o n 4 • r E S o u r c E S
Measurement: Investigation 5 Quantities and costs of materials for a low-cost house
Below is the plan for a low-cost (RDP) house with a total floor area of 40 m2. The owners received a subsidy of R62 000 to construct the top structure (walls and roof, wiring and plumbing). Investigate whether the subsidy will cover all the construction costs.
990 × 1 205
5 000
Front elevation
990 × 1 2052 5
00790 × 1856
8 000
Side elevation
2 500
990 × 1 205790 × 1 856
5 000
Rear elevation
2 500
8 000
Side elevation
2 500
(Source: www.stumbelbloc.com/downloads/stumbelbloc-cottage-RDP-elevations)
1. Use the plan to work out the dimensions of the exterior walls, windows and doors of the house. All measurements on the plan are given in millimetres.
2. Find out from a building supply store which materials could be used for the walls, roof, doors and windows, and the costs of these materials. Ask the staff to advise you about the approximate quantities of bricks and roof tiles for a house of this size. If they cannot help you, consult a local builder for advice before you go back to the building supply store to find the costs of the materials.
3. Use this information to calculate the basic top structure cost. If there are different options for some materials (such as brick or timber for the walls, timber or steel for the window frames), calculate the costs for one or more combinations of materials that you think will be suitable.
4. Research the cost of installing basic plumbing and electrical wiring. To do this, you will need to show the plan to a plumber and an electrician who usually work on building projects, and ask how they estimate costs. Show them the plan above, and also the plan on the next page of the interior of the house.
5. Use the information you collected to draw up a budget for the construction of the house. Will the subsidy be enough to cover costs?

224 S e c t i o n 4 • r E S o u r c E S
990 × 1 205
790 × 856
790 × 856
600
BEDROOM 2BEDROOM 1
SITE PLAN
BATHRO
OM
KITCHENLIVING AREA
200200
200
200
200200200 4 000 3 6002 600
8 200
200200 5 800
2 8001 800
200200
2002 200
2 400
1 800
990 × 1 205
990 × 1 205
scale 1 : 50
(Source: www.stumbelbloc.com/downloads/stumbelbloc-RDP-plan-scale-1_50.pdf )
Finance: Assignment 7 calculate personal income tax for an employee
Below is the payslip received by Miriam Mufamadi at the end of January.
EMPLOYEE CODE 10 M. Mufamadi
Sales
ABC Clothing
65
Durban North
Gross salary 27 785.00
Use of motor vehicle 660.00
27 785.00
2 083.884 898.00
277.85
7 259.73
20 525.275
31/01/2012
233.44
DESIGNATION COST CENTRE
COMPANY NAMEPO Box DATE
RATE
DESCRIPTION
DESCRIPTIONPensionPAYE TaxUIF Contribution
0.000.000.00
BALANCE AMOUNT
INCOME
GROSS PAY
DEDUCTIONS
TOTAL DEDUCTIONSNET PAYLEAVE DAYS DUE
BENEFITS COMPANY CONTRIBUTIONS
QUANTITY RATE AMOUNT
PERIOD
EMPLOYEE NAME
1. Show how the tax amount on this payslip was calculated, using the following.a. the tax tables on the next page that apply to monthly remunerationb. tax brackets and formulae, as set out in the table in Term 3, Unit 1 in
the Learner’s Book.2. In June Miriam receives a salary increase: her new monthly gross income
is 29 452. How will this change the amount of PAYE deducted from her monthly pay?
3. Compare the amount of tax shown in the tax tables for Miriam’s gross income in April with the amount of tax payable that you calculate using tax brackets and formulae. Find reasons for any differences that you see in the two tax values.
term 3
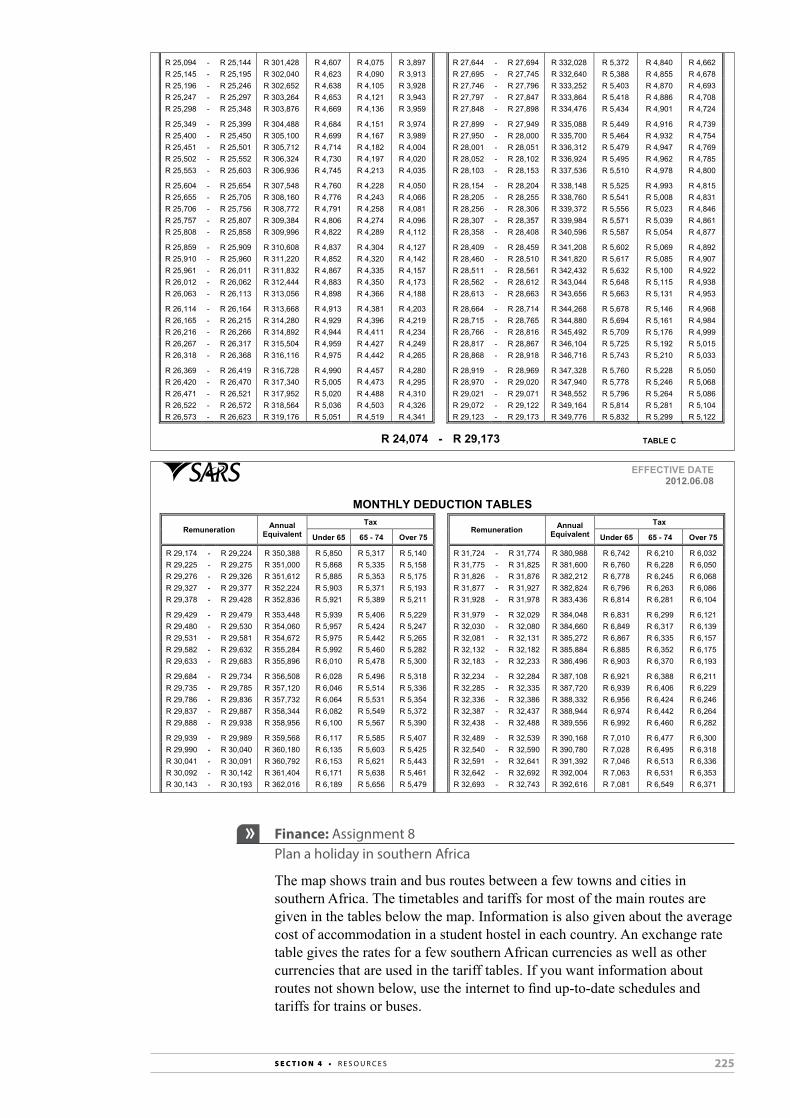
225S e c t i o n 4 • r E S o u r c E S
MONTHLY TAX DEDUCTION TABLES (2013 TAX YEAR) PAYE-GEN-01-G01-A03
Revision: 4 91 fo 21 egaP
R 24,074 - R 24,124 R 289,188 R 4,301 R 3,769 R 3,591 R 26,624 - R 26,674 R 319,788 R 5,066 R 4,534 R 4,356 R 24,125 - R 24,175 R 289,800 R 4,317 R 3,784 R 3,607 R 26,675 - R 26,725 R 320,400 R 5,082 R 4,549 R 4,372 R 24,176 - R 24,226 R 290,412 R 4,332 R 3,799 R 3,622 R 26,726 - R 26,776 R 321,012 R 5,097 R 4,564 R 4,387 R 24,227 - R 24,277 R 291,024 R 4,347 R 3,815 R 3,637 R 26,777 - R 26,827 R 321,624 R 5,112 R 4,580 R 4,402 R 24,278 - R 24,328 R 291,636 R 4,363 R 3,830 R 3,653 R 26,828 - R 26,878 R 322,236 R 5,128 R 4,595 R 4,418
R 24,329 - R 24,379 R 292,248 R 4,378 R 3,845 R 3,668 R 26,879 - R 26,929 R 322,848 R 5,143 R 4,610 R 4,433 R 24,380 - R 24,430 R 292,860 R 4,393 R 3,861 R 3,683 R 26,930 - R 26,980 R 323,460 R 5,158 R 4,626 R 4,448 R 24,431 - R 24,481 R 293,472 R 4,408 R 3,876 R 3,698 R 26,981 - R 27,031 R 324,072 R 5,173 R 4,641 R 4,463 R 24,482 - R 24,532 R 294,084 R 4,424 R 3,891 R 3,714 R 27,032 - R 27,082 R 324,684 R 5,189 R 4,656 R 4,479 R 24,533 - R 24,583 R 294,696 R 4,439 R 3,907 R 3,729 R 27,083 - R 27,133 R 325,296 R 5,204 R 4,672 R 4,494
R 24,584 - R 24,634 R 295,308 R 4,454 R 3,922 R 3,744 R 27,134 - R 27,184 R 325,908 R 5,219 R 4,687 R 4,509 R 24,635 - R 24,685 R 295,920 R 4,470 R 3,937 R 3,760 R 27,185 - R 27,235 R 326,520 R 5,235 R 4,702 R 4,525 R 24,686 - R 24,736 R 296,532 R 4,485 R 3,952 R 3,775 R 27,236 - R 27,286 R 327,132 R 5,250 R 4,717 R 4,540 R 24,737 - R 24,787 R 297,144 R 4,500 R 3,968 R 3,790 R 27,287 - R 27,337 R 327,744 R 5,265 R 4,733 R 4,555 R 24,788 - R 24,838 R 297,756 R 4,516 R 3,983 R 3,806 R 27,338 - R 27,388 R 328,356 R 5,281 R 4,748 R 4,571
R 24,839 - R 24,889 R 298,368 R 4,531 R 3,998 R 3,821 R 27,389 - R 27,439 R 328,968 R 5,296 R 4,763 R 4,586 R 24,890 - R 24,940 R 298,980 R 4,546 R 4,014 R 3,836 R 27,440 - R 27,490 R 329,580 R 5,311 R 4,779 R 4,601 R 24,941 - R 24,991 R 299,592 R 4,561 R 4,029 R 3,851 R 27,491 - R 27,541 R 330,192 R 5,326 R 4,794 R 4,616 R 24,992 - R 25,042 R 300,204 R 4,577 R 4,044 R 3,867 R 27,542 - R 27,592 R 330,804 R 5,342 R 4,809 R 4,632 R 25,043 - R 25,093 R 300,816 R 4,592 R 4,060 R 3,882 R 27,593 - R 27,643 R 331,416 R 5,357 R 4,825 R 4,647
R 25,094 - R 25,144 R 301,428 R 4,607 R 4,075 R 3,897 R 27,644 - R 27,694 R 332,028 R 5,372 R 4,840 R 4,662 R 25,145 - R 25,195 R 302,040 R 4,623 R 4,090 R 3,913 R 27,695 - R 27,745 R 332,640 R 5,388 R 4,855 R 4,678 R 25,196 - R 25,246 R 302,652 R 4,638 R 4,105 R 3,928 R 27,746 - R 27,796 R 333,252 R 5,403 R 4,870 R 4,693 R 25,247 - R 25,297 R 303,264 R 4,653 R 4,121 R 3,943 R 27,797 - R 27,847 R 333,864 R 5,418 R 4,886 R 4,708 R 25,298 - R 25,348 R 303,876 R 4,669 R 4,136 R 3,959 R 27,848 - R 27,898 R 334,476 R 5,434 R 4,901 R 4,724
R 25,349 - R 25,399 R 304,488 R 4,684 R 4,151 R 3,974 R 27,899 - R 27,949 R 335,088 R 5,449 R 4,916 R 4,739 R 25,400 - R 25,450 R 305,100 R 4,699 R 4,167 R 3,989 R 27,950 - R 28,000 R 335,700 R 5,464 R 4,932 R 4,754 R 25,451 - R 25,501 R 305,712 R 4,714 R 4,182 R 4,004 R 28,001 - R 28,051 R 336,312 R 5,479 R 4,947 R 4,769 R 25,502 - R 25,552 R 306,324 R 4,730 R 4,197 R 4,020 R 28,052 - R 28,102 R 336,924 R 5,495 R 4,962 R 4,785 R 25,553 - R 25,603 R 306,936 R 4,745 R 4,213 R 4,035 R 28,103 - R 28,153 R 337,536 R 5,510 R 4,978 R 4,800
R 25,604 - R 25,654 R 307,548 R 4,760 R 4,228 R 4,050 R 28,154 - R 28,204 R 338,148 R 5,525 R 4,993 R 4,815 R 25,655 - R 25,705 R 308,160 R 4,776 R 4,243 R 4,066 R 28,205 - R 28,255 R 338,760 R 5,541 R 5,008 R 4,831 R 25,706 - R 25,756 R 308,772 R 4,791 R 4,258 R 4,081 R 28,256 - R 28,306 R 339,372 R 5,556 R 5,023 R 4,846 R 25,757 - R 25,807 R 309,384 R 4,806 R 4,274 R 4,096 R 28,307 - R 28,357 R 339,984 R 5,571 R 5,039 R 4,861 R 25,808 - R 25,858 R 309,996 R 4,822 R 4,289 R 4,112 R 28,358 - R 28,408 R 340,596 R 5,587 R 5,054 R 4,877
R 25,859 - R 25,909 R 310,608 R 4,837 R 4,304 R 4,127 R 28,409 - R 28,459 R 341,208 R 5,602 R 5,069 R 4,892 R 25,910 - R 25,960 R 311,220 R 4,852 R 4,320 R 4,142 R 28,460 - R 28,510 R 341,820 R 5,617 R 5,085 R 4,907 R 25,961 - R 26,011 R 311,832 R 4,867 R 4,335 R 4,157 R 28,511 - R 28,561 R 342,432 R 5,632 R 5,100 R 4,922 R 26,012 - R 26,062 R 312,444 R 4,883 R 4,350 R 4,173 R 28,562 - R 28,612 R 343,044 R 5,648 R 5,115 R 4,938 R 26,063 - R 26,113 R 313,056 R 4,898 R 4,366 R 4,188 R 28,613 - R 28,663 R 343,656 R 5,663 R 5,131 R 4,953
R 26,114 - R 26,164 R 313,668 R 4,913 R 4,381 R 4,203 R 28,664 - R 28,714 R 344,268 R 5,678 R 5,146 R 4,968 R 26,165 - R 26,215 R 314,280 R 4,929 R 4,396 R 4,219 R 28,715 - R 28,765 R 344,880 R 5,694 R 5,161 R 4,984 R 26,216 - R 26,266 R 314,892 R 4,944 R 4,411 R 4,234 R 28,766 - R 28,816 R 345,492 R 5,709 R 5,176 R 4,999 R 26,267 - R 26,317 R 315,504 R 4,959 R 4,427 R 4,249 R 28,817 - R 28,867 R 346,104 R 5,725 R 5,192 R 5,015 R 26,318 - R 26,368 R 316,116 R 4,975 R 4,442 R 4,265 R 28,868 - R 28,918 R 346,716 R 5,743 R 5,210 R 5,033
R 26,369 - R 26,419 R 316,728 R 4,990 R 4,457 R 4,280 R 28,919 - R 28,969 R 347,328 R 5,760 R 5,228 R 5,050 R 26,420 - R 26,470 R 317,340 R 5,005 R 4,473 R 4,295 R 28,970 - R 29,020 R 347,940 R 5,778 R 5,246 R 5,068 R 26,471 - R 26,521 R 317,952 R 5,020 R 4,488 R 4,310 R 29,021 - R 29,071 R 348,552 R 5,796 R 5,264 R 5,086 R 26,522 - R 26,572 R 318,564 R 5,036 R 4,503 R 4,326 R 29,072 - R 29,122 R 349,164 R 5,814 R 5,281 R 5,104 R 26,573 - R 26,623 R 319,176 R 5,051 R 4,519 R 4,341 R 29,123 - R 29,173 R 349,776 R 5,832 R 5,299 R 5,122
R 24,074 - R 29,173 TABLE C
EFFECTIVE DATE2012.06.08
MONTHLY DEDUCTION TABLES
Remuneration Annual Equivalent
Tax Remuneration Annual
Equivalent Tax
57 revO 47 - 56 56 rednU 57 revO 47 - 56 56 rednU
R 29,174 - R 29,224 R 350,388 R 5,850 R 5,317 R 5,140 R 31,724 - R 31,774 R 380,988 R 6,742 R 6,210 R 6,032 R 29,225 - R 29,275 R 351,000 R 5,868 R 5,335 R 5,158 R 31,775 - R 31,825 R 381,600 R 6,760 R 6,228 R 6,050 R 29,276 - R 29,326 R 351,612 R 5,885 R 5,353 R 5,175 R 31,826 - R 31,876 R 382,212 R 6,778 R 6,245 R 6,068 R 29,327 - R 29,377 R 352,224 R 5,903 R 5,371 R 5,193 R 31,877 - R 31,927 R 382,824 R 6,796 R 6,263 R 6,086 R 29,378 - R 29,428 R 352,836 R 5,921 R 5,389 R 5,211 R 31,928 - R 31,978 R 383,436 R 6,814 R 6,281 R 6,104
R 29,429 - R 29,479 R 353,448 R 5,939 R 5,406 R 5,229 R 31,979 - R 32,029 R 384,048 R 6,831 R 6,299 R 6,121 R 29,480 - R 29,530 R 354,060 R 5,957 R 5,424 R 5,247 R 32,030 - R 32,080 R 384,660 R 6,849 R 6,317 R 6,139 R 29,531 - R 29,581 R 354,672 R 5,975 R 5,442 R 5,265 R 32,081 - R 32,131 R 385,272 R 6,867 R 6,335 R 6,157 R 29,582 - R 29,632 R 355,284 R 5,992 R 5,460 R 5,282 R 32,132 - R 32,182 R 385,884 R 6,885 R 6,352 R 6,175 R 29,633 - R 29,683 R 355,896 R 6,010 R 5,478 R 5,300 R 32,183 - R 32,233 R 386,496 R 6,903 R 6,370 R 6,193
R 29,684 - R 29,734 R 356,508 R 6,028 R 5,496 R 5,318 R 32,234 - R 32,284 R 387,108 R 6,921 R 6,388 R 6,211 R 29,735 - R 29,785 R 357,120 R 6,046 R 5,514 R 5,336 R 32,285 - R 32,335 R 387,720 R 6,939 R 6,406 R 6,229 R 29,786 - R 29,836 R 357,732 R 6,064 R 5,531 R 5,354 R 32,336 - R 32,386 R 388,332 R 6,956 R 6,424 R 6,246 R 29,837 - R 29,887 R 358,344 R 6,082 R 5,549 R 5,372 R 32,387 - R 32,437 R 388,944 R 6,974 R 6,442 R 6,264 R 29,888 - R 29,938 R 358,956 R 6,100 R 5,567 R 5,390 R 32,438 - R 32,488 R 389,556 R 6,992 R 6,460 R 6,282
R 29,939 - R 29,989 R 359,568 R 6,117 R 5,585 R 5,407 R 32,489 - R 32,539 R 390,168 R 7,010 R 6,477 R 6,300 R 29,990 - R 30,040 R 360,180 R 6,135 R 5,603 R 5,425 R 32,540 - R 32,590 R 390,780 R 7,028 R 6,495 R 6,318 R 30,041 - R 30,091 R 360,792 R 6,153 R 5,621 R 5,443 R 32,591 - R 32,641 R 391,392 R 7,046 R 6,513 R 6,336 R 30,092 - R 30,142 R 361,404 R 6,171 R 5,638 R 5,461 R 32,642 - R 32,692 R 392,004 R 7,063 R 6,531 R 6,353 R 30,143 - R 30,193 R 362,016 R 6,189 R 5,656 R 5,479 R 32,693 - R 32,743 R 392,616 R 7,081 R 6,549 R 6,371
R 30,194 - R 30,244 R 362,628 R 6,207 R 5,674 R 5,497 R 32,744 - R 32,794 R 393,228 R 7,099 R 6,567 R 6,389 R 30,245 - R 30,295 R 363,240 R 6,225 R 5,692 R 5,515 R 32,795 - R 32,845 R 393,840 R 7,117 R 6,585 R 6,407 R 30,296 - R 30,346 R 363,852 R 6,242 R 5,710 R 5,532 R 32,846 - R 32,896 R 394,452 R 7,135 R 6,602 R 6,425 R 30,347 - R 30,397 R 364,464 R 6,260 R 5,728 R 5,550 R 32,897 - R 32,947 R 395,064 R 7,153 R 6,620 R 6,443 R 30,398 - R 30,448 R 365,076 R 6,278 R 5,746 R 5,568 R 32,948 - R 32,998 R 395,676 R 7,171 R 6,638 R 6,461
R 30,449 - R 30,499 R 365,688 R 6,296 R 5,763 R 5,586 R 32,999 - R 33,049 R 396,288 R 7,188 R 6,656 R 6,478 R 30,500 - R 30,550 R 366,300 R 6,314 R 5,781 R 5,604 R 33,050 - R 33,100 R 396,900 R 7,206 R 6,674 R 6,496 R 30,551 - R 30,601 R 366,912 R 6,332 R 5,799 R 5,622 R 33,101 - R 33,151 R 397,512 R 7,224 R 6,692 R 6,514 R 30,602 - R 30,652 R 367,524 R 6,349 R 5,817 R 5,639 R 33,152 - R 33,202 R 398,124 R 7,242 R 6,709 R 6,532 R 30,653 - R 30,703 R 368,136 R 6,367 R 5,835 R 5,657 R 33,203 - R 33,253 R 398,736 R 7,260 R 6,727 R 6,550
R 30,704 - R 30,754 R 368,748 R 6,385 R 5,853 R 5,675 R 33,254 - R 33,304 R 399,348 R 7,278 R 6,745 R 6,568 R 30,755 - R 30,805 R 369,360 R 6,403 R 5,871 R 5,693 R 33,305 - R 33,355 R 399,960 R 7,296 R 6,763 R 6,586 R 30,806 - R 30,856 R 369,972 R 6,421 R 5,888 R 5,711 R 33,356 - R 33,406 R 400,572 R 7,313 R 6,781 R 6,603 R 30,857 - R 30,907 R 370,584 R 6,439 R 5,906 R 5,729 R 33,407 - R 33,457 R 401,184 R 7,331 R 6,799 R 6,621 R 30,908 - R 30,958 R 371,196 R 6,457 R 5,924 R 5,747 R 33,458 - R 33,508 R 401,796 R 7,349 R 6,817 R 6,639
R 30,959 - R 31,009 R 371,808 R 6,474 R 5,942 R 5,764 R 33,509 - R 33,559 R 402,408 R 7,367 R 6,834 R 6,657 R 31,010 - R 31,060 R 372,420 R 6,492 R 5,960 R 5,782 R 33,560 - R 33,610 R 403,020 R 7,385 R 6,852 R 6,675 R 31,061 - R 31,111 R 373,032 R 6,510 R 5,978 R 5,800 R 33,611 - R 33,661 R 403,632 R 7,403 R 6,870 R 6,693 R 31,112 - R 31,162 R 373,644 R 6,528 R 5,995 R 5,818 R 33,662 - R 33,712 R 404,244 R 7,420 R 6,888 R 6,710 R 31,163 - R 31,213 R 374,256 R 6,546 R 6,013 R 5,836 R 33,713 - R 33,763 R 404,856 R 7,438 R 6,906 R 6,728
R 31,214 - R 31,264 R 374,868 R 6,564 R 6,031 R 5,854 R 33,764 - R 33,814 R 405,468 R 7,456 R 6,924 R 6,746 R 31,265 - R 31,315 R 375,480 R 6,582 R 6,049 R 5,872 R 33,815 - R 33,865 R 406,080 R 7,474 R 6,942 R 6,764 R 31,316 - R 31,366 R 376,092 R 6,599 R 6,067 R 5,889 R 33,866 - R 33,916 R 406,692 R 7,492 R 6,959 R 6,782 R 31,367 - R 31,417 R 376,704 R 6,617 R 6,085 R 5,907 R 33,917 - R 33,967 R 407,304 R 7,510 R 6,977 R 6,800 R 31,418 - R 31,468 R 377,316 R 6,635 R 6,103 R 5,925 R 33,968 - R 34,018 R 407,916 R 7,528 R 6,995 R 6,818
R 31,469 - R 31,519 R 377,928 R 6,653 R 6,120 R 5,943 R 34,019 - R 34,069 R 408,528 R 7,545 R 7,013 R 6,835 R 31,520 - R 31,570 R 378,540 R 6,671 R 6,138 R 5,961 R 34,070 - R 34,120 R 409,140 R 7,563 R 7,031 R 6,853 R 31,571 - R 31,621 R 379,152 R 6,689 R 6,156 R 5,979 R 34,121 - R 34,171 R 409,752 R 7,581 R 7,049 R 6,871 R 31,622 - R 31,672 R 379,764 R 6,706 R 6,174 R 5,996 R 34,172 - R 34,222 R 410,364 R 7,599 R 7,066 R 6,889 R 31,673 - R 31,723 R 380,376 R 6,724 R 6,192 R 6,014 R 34,223 - R 34,273 R 410,976 R 7,617 R 7,084 R 6,907
Finance: Assignment 8 Plan a holiday in southern Africa
The map shows train and bus routes between a few towns and cities in southern Africa. The timetables and tariffs for most of the main routes are given in the tables below the map. Information is also given about the average cost of accommodation in a student hostel in each country. An exchange rate table gives the rates for a few southern African currencies as well as other currencies that are used in the tariff tables. If you want information about routes not shown below, use the internet to find up-to-date schedules and tariffs for trains or buses.

226 S e c t i o n 4 • r E S o u r c E S
1. Use this information to plan a holiday route that satisfies the following conditions:• It can be completed in three weeks.• It costs less than R10 000 in total. Use estimated costs based on
the included exchange rate table. (Where train or bus fares are not available for a section of your route, estimate these fares based on other fares given in the tables.)
• You will spend time in at least three countries.2. When you have planned the holiday, write a description of the route you
propose from start to finish, with a table of costs (in rand).
0 1 000 kmEast London
Pretoria
Dar esSalaam
Nairobi
KampalaKENYA
MALAWI
MO
ZAMBIQ
UE
TANZANIA
Port Elizabeth
Bloemfontein
Kimberley
Gaborone
Keetmanshoop
Walvis BaySwakopmund Windhoek
Bulawayo
Kitwe
Livingstone
Lusaka
SOUTHAFRICA
BOTSWANA
N AMIB IA
ANGOLAZAMBIA
DEMOCRATICREPUBL IC
OF THE CONGO
CONGO
Kigoma
Ndola
GABON
Karasburg
Lubatso
PietermaritzburgLadysmith
De Aar
UGANDA
ArushaMoshi
Tabora
Mpanda
Nakonde Mbeya
Kapiri Mpushi
Chiredzi
Polokwane
Johannesburg
Hwange
Musina
KomatipoortMaputo
Francistown
Mwanza
Kisumu
N
Passenger trains
Buses
Key
HarareMutare
Rutenga
Z IMBABWE
Mombasa
ChicualacualaBeitbridge
Durban
Cape Town
Train schedules and tariffsKENYA – trainsNairobi ►Kisumu Kisumu ►NairobiDays of running Monday & Friday Days of running Monday & Friday
Nairobi depart 18:30 Kisumu depart 18:30Naivasha arr/dep 22:30 Nakuru arr/dep 02:55Nakuru arr/dep 01:05 Naivasha arr/dep 04:55Kisumu arrive 09:00 Nairobi arrive 09:00
Fares1st class sleeper 3 010 Kenya shillings (£17/$32) per person sharing a 2-berth compartment including dinner &
breakfastChildren (aged 3–11) 1 925 Kenya shillings, children under 3 free
2nd class sleeper 2 210 Kenya shillings (£12/$24) per person sharing a 4-berth compartment including dinner & breakfast, or 1 685 shillings without dinnerChildren (aged 3–11) 1 525 Kenya shillings, children under 3 free
3rd class seat 500 Kenya shillings (£3/$5)Children (aged 3–11) 250 Kenya shillings, children under 3 free

227S e c t i o n 4 • r E S o u r c E S
KENYA – trainsNairobi ►Mombasa Mombasa ►Nairobi
Days of running Monday & Friday Days of running Monday & FridayNairobi depart 19:00 Mombasa depart 19:00Makindu arr/dep 23:15 Voi arr/dep 23:20Mtito Andei arr/dep 01:11 Mtito Andei arr/dep 01:50Voi arr/dep 04:00 Makindu arr/dep 03:50Mombasa arrive 10:00 Nairobi arrive 10:00
Fares1st class sleeper 4 405 Kenya shillings (£38/$60) per person sharing a 2-berth compartment including dinner
& breakfastThis is the ticket office price, if you prebook through a reliable agency the fare is usually around $75Children (aged 3–11) 2795 Kenya shillings, children under 3 free
2nd class sleeper 3 385 Kenya shillings (£29/$45) per person sharing a 4-berth compartment including dinner & breakfast, or 2 335 shillings without dinnerThis is the ticket office price, if you prebook through a reliable agency the fare is usually around $65Children (aged 3–11) 2 285 Kenya shillings, children under 3 free
3rd class seat 680 Kenya shillings (£4/$6)Children (aged 3–11) 340 Kenya shillings, children under 3 free
KENYA – UGANDA busesDeparture scheduleDay/Night From town To town Departure time Estimated arrival timeDay Nairobi via Busia Kampala 07:00 20:00Day Nairobi via Malaba Kampala 07:00 20:00Day Nairobi (Royal) Kampala 07:15 20:00Night Nairobi via Busia Kampala 19:30 09:30Night Nairobi via Malaba Kampala 21:30 11:00
KENYA – TANZANIA busesMOMBASA – DAR ES SALAAM (Tanzania) bus service...A daily bus leaves Mombasa at 08:00, arriving Dar es Salaam at 18:00. Northbound, it leaves Dar es Salaam at 08:00, arriving Mombasa 17:30. Fare 1 600 Kenyan shillings or 19 000 Tanzanian shillings (£13/$21).
NAIROBI – ARUSHA – DAR ES SALAAM (Tanzania) bus service...Akamba bus run a daily bus, departing Nairobi at 06:30 and arriving Dar es Salaam at 21:00. Fare in region of 3 200 Kenyan shillings or 38 000 Tanzanian shillings (£22/$38)
TANZANIA and TANZANIA – ZAMBIA trainsDar es Salaam ►Kigoma/MwanzaKm Towns 1st & 3rd class 1st, 2nd & 3rd class 0 Dar es Salaam depart 17:00 Tuesdays & Fridays 17:00 Tuesdays & Fridays 465 Dodoma 08:10 Wednesdays & Saturdays 08:10 Wednesdays & Saturdays 840 Tabora arrive 18:25 Wednesdays & Saturdays 18:25 Wednesdays & Saturdays 840 Tabora depart 20:10 Wednesdays & Saturdays 20:10 Wednesdays & Saturdays1 256 Kigoma arrive 07:25 Thursdays & Sundays -1 220 Mwanza arrive - 07:25 Thursdays & Sundays

228 S e c t i o n 4 • r E S o u r c E S
Kigoma/Mwanza ►Dar es SalaamKm Towns 1st & 3rd class 1st, 2nd & 3rd class 0 Mwanza depart 17:00 Thursdays & Sundays 18:00 Thursdays & Sundays 465 Kigoma depart 04:30 Fridays & Mondays - 840 Tabora arrive 18:25 Fridays & Mondays 18:25 Fridays & Mondays 840 Tabora depart 20:10 Fridays & Mondays 20:10 Fridays & Mondays1 256 Dodoma 07:25 Saturdays & Tuesdays 18:40 Fridays & Mondays1 220 Dar es Salaam arrive - 07:25 Saturdays & Tuesdays
Fares...One way per personDar es Salaam to Kigoma 80 000 shillings (£28/$45) 1st class sleeper
40 000 shillings (£20/$35) 2nd class sleeper19 900 shillings 3rd class seat
Dar es Salaam ►Mbeya ►Kapiri MposhiKm Towns Classes Mukuba or Kilimanjaro
express train1s, 2s, 2, 3, M or R
Mukuba or Kilimanjaro ordinary train1s, 2s, 2, 3, R
0 Dar es Salaam depart 15 50 Tuesdays 13:50 Fridays 849 Mbeya arrive
depart13:08 Wednesdays 13:23 Wednesdays
14:10 Saturdays14:40 Saturdays
969 Tunduma (frontier) arrivedepart
17:02 Wednesdays17:17 Wednesdays
18:38 Saturdays18:53 Saturdays
970 Nakonde arrivedepart
18:22 Wednesdays18:47 Wednesdays
17:59 Saturdays18:18 Saturdays
1 852 Kapiri Mposhi (new) arrive 09:26 Thursdays 13:37 Sundays
Kigoma/Mwanza ►Dar es SalaamKm Towns Classes Mukuba or Kilimanjaro
express train1s, 2s, 2, 3, M or R
Mukuba or Kilimanjaro ordinary train1s, 2s, 2, 3, R
0 Kapiri Mposhi (new) depart 18:00 Tuesdays 14:00 Fridays 882 Nakonde arrive
depart08:39 Wednesdays 09:09 Wednesdays
09:13 Saturdays09:23 Saturdays
883 Tunduma (frontier) arrivedepart
10:14 Wednesdays10:29 Wednesdays
10:30 Saturdays10:45 Saturdays
1 003 Mbeya arrivedepart
14:13 Wednesdays14:29 Wednesdays
14:32 Saturdays15:00 Saturdays
1 852 Dar es Salaam arrive 12:35 Thursdays 15:48 Sundays
Fares...One way per person. Express train fares. Ordinary train fares are around 20% lessDar es Salaam to Kapiri Mposhi 82 600 shillings (£28/$48) 1st class sleeper
52 800 shillings (£21/$35) 2nd class sleeperDar es Salaam to Mbeya 22 400 shillings (£13/$21) 1st class sleeper
23 800 shillings (£9/$16) 2nd class sleeperKapiri Mphoshi to Dar es Salaam
1st class sleeper, express = 261 400 Zambian kwacha (£33/$55)2nd class sleeper = 198 000 kwacha (£25/$50)2nd class seat = 171 600 kwacha (£23/$44)2rd class seat = 145 200 kwacha (£18/$35)
Kapiri Mphoshi to Mbeya 1st class sleeper, express = 118 8 Zambian kwacha (£14/$28)2nd class sleeper = 86 600 kwacha (£12/$24)2nd class seat = 79 100 kwacha (£11/$21)2rd class seat = 71 400 kwacha (£10/$20)
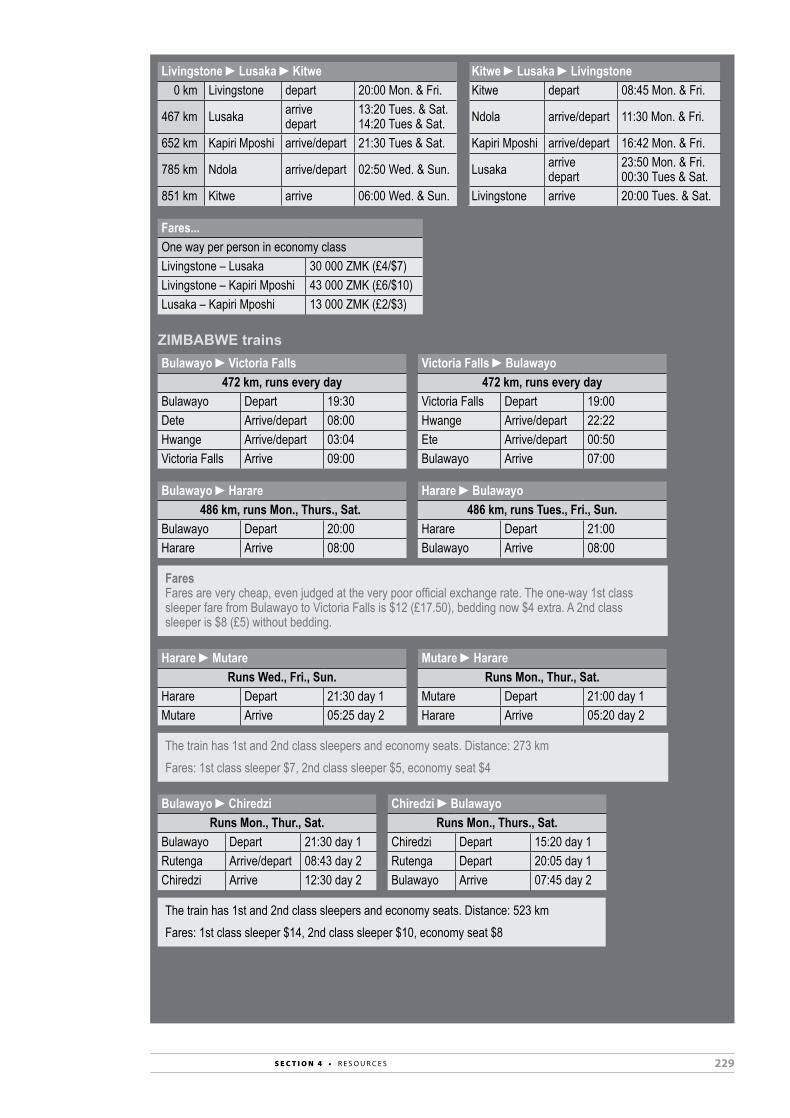
229S e c t i o n 4 • r E S o u r c E S
Livingstone ►Lusaka ►Kitwe Kitwe ►Lusaka ►Livingstone 0 km Livingstone depart 20:00 Mon. & Fri. Kitwe depart 08:45 Mon. & Fri.
467 km Lusaka arrivedepart
13:20 Tues. & Sat.14:20 Tues & Sat. Ndola arrive/depart 11:30 Mon. & Fri.
652 km Kapiri Mposhi arrive/depart 21:30 Tues & Sat. Kapiri Mposhi arrive/depart 16:42 Mon. & Fri.
785 km Ndola arrive/depart 02:50 Wed. & Sun. Lusaka arrivedepart
23:50 Mon. & Fri. 00:30 Tues & Sat.
851 km Kitwe arrive 06:00 Wed. & Sun. Livingstone arrive 20:00 Tues. & Sat.
Fares...One way per person in economy classLivingstone – Lusaka 30 000 ZMK (£4/$7)Livingstone – Kapiri Mposhi 43 000 ZMK (£6/$10)Lusaka – Kapiri Mposhi 13 000 ZMK (£2/$3)
ZIMBABWE trainsBulawayo ►Victoria Falls Victoria Falls ►Bulawayo
472 km, runs every day 472 km, runs every dayBulawayo Depart 19:30 Victoria Falls Depart 19:00Dete Arrive/depart 08:00 Hwange Arrive/depart 22:22Hwange Arrive/depart 03:04 Ete Arrive/depart 00:50Victoria Falls Arrive 09:00 Bulawayo Arrive 07:00
Bulawayo ►Harare Harare ►Bulawayo486 km, runs Mon., Thurs., Sat. 486 km, runs Tues., Fri., Sun.
Bulawayo Depart 20:00 Harare Depart 21:00Harare Arrive 08:00 Bulawayo Arrive 08:00
FaresFares are very cheap, even judged at the very poor official exchange rate. The one-way 1st class sleeper fare from Bulawayo to Victoria Falls is $12 (£17.50), bedding now $4 extra. A 2nd class sleeper is $8 (£5) without bedding.
Harare ►Mutare Mutare ►HarareRuns Wed., Fri., Sun. Runs Mon., Thur., Sat.
Harare Depart 21:30 day 1 Mutare Depart 21:00 day 1Mutare Arrive 05:25 day 2 Harare Arrive 05:20 day 2
The train has 1st and 2nd class sleepers and economy seats. Distance: 273 kmFares: 1st class sleeper $7, 2nd class sleeper $5, economy seat $4
Bulawayo ►Chiredzi Chiredzi ►BulawayoRuns Mon., Thur., Sat. Runs Mon., Thurs., Sat.
Bulawayo Depart 21:30 day 1 Chiredzi Depart 15:20 day 1Rutenga Arrive/depart 08:43 day 2 Rutenga Depart 20:05 day 1Chiredzi Arrive 12:30 day 2 Bulawayo Arrive 07:45 day 2
The train has 1st and 2nd class sleepers and economy seats. Distance: 523 kmFares: 1st class sleeper $14, 2nd class sleeper $10, economy seat $8

230 S e c t i o n 4 • r E S o u r c E S
Bulawayo ►Beitbridge (border with South Africa) Beitbridge ►BulawayoRuns Thursdays & Sundays Runs Mondays & Fridays
Bulawayo Depart 18:00 day 1 Beitbridge Depart 21:00 day 1Beitbridge Arrive 19:00 day 2 Bulawayo Arrive 08:45 day 2
The train has 1st and 2nd class sleepers and economy seats. Distance not known.You can take local transport across the Beitbridge-Musina border and take the Shosholoza Meyl train from Musina to Pretoria & Johannesburg
Bulawayo to Chicualacuala & Maputo (Mozambique)Bulawayo ►Chicualacuala Chicualacuala ►Bulawayo
Runs Wednesdays Runs WednesdaysBulawayo Depart 12:15 Wed. Maputo Depart 13:00 Wed.Chicualacuala (change trains)
ArriveDepart
13:00 Thurs. Chicualacuala(change trains)
ArriveDepart
03:42 Thurs.
Maputo Arrive 05:49 Fri. Bulawayo Arrive 03:52 Fri.
BOTSWANA trainsInternational trainsSouth Africa to Botswana by trainThere are no trains from Botswana to South Africa, as the daily train to Mafikeng and weekly train to Johannesburg were withdrawn in 1999. However, you can take a comfortable train between Cape Town and Johannesburg. Then there’s a daily bus between Johannesburg and Gaborone leaving Johannesburg at 14:30 and arriving Gaborone at 21:10. In the other direction, the bus leaves Gaborone daily at 08:30 and arrives in Johannesburg at 13:00. For times, fares and online booking see www.intercape.co.za.Zimbabwe to Botswana by trainIn 1999, the weekly Johannesburg–Gaborone–Bulawayo train was withdrawn and the daily Mafikeng–Gaborone–Bulawayo blue train was cut back to run purely within Botswana, Francistown–Gaborone–Lobatse. However, after an absence of six years, an international train service between Zimbabwe and Botswana restarted in June 2006, from Francistown to Bulawayo, three times a week.
Francistown ►Bulawayo Bulawayo ►FrancistownTowns Tuesday, Thursday, Saturday Towns Monday, Wednesday, FridayFrancistown Depart 09:00. Bulawayo Depart 11:00.Bulawayo Arrive 15:00 Francistown Arrive 16:30
NAMIBIA trains
StarLine passenger trainsRegular passenger trains marketed as StarLine are run by TransNamib, on the following routes:• Windhoek to Swakopmund & Walvis Bay, runs daily except Saturdays, departs 19:55, arrives next
day at Swakopmund 05:20 & Walvis Bay 07:15.• Walvis Bay & Swakopmund to Windhoek, runs daily except Saturdays, departs Walvis Bay 19:00,
Swakopmund 20:45, arrives Windhoek 07:00 next day.• Windhoek–Keetmanshoop, runs daily except Saturdays, departs 19:40, arrives at 07:00 next day.• Keetmanshoop–Windhoek, runs daily except Saturdays, departs 18:50, arrives 07:00 next day.• Keetmanshoop–Karasburg – see the StarLine timetable.• Windhoek–Tsumeb & Windhoek–Gobabis trains have been cancelled indefinitely as from
January 2009.
FaresWindhoek–Walvis Bay costs around N$80 (£5 or US$10), Windhoek–Keetmanshoop around N$87 (£5.50 or US$11), in economy class. Business class costs N$20 extra. However, fares vary from N80 – N$130 according to time of year and peak/off-peak. Children under 2 free, children 2, but under 12 half fare.

231S e c t i o n 4 • r E S o u r c E S
The Desert ExpressTransNamib also operates a weekly tourist-orientated train between Windhoek and Swakopmund called the Desert Express. The train has sleepers (with en suite shower/toilet), a restaurant, bar & lounge. • Departs Windhoek 12:00 (13:00 in summer) on Fridays, arrives Swakopmund 10:00 next day.• Departs Swakopmund 15:00 on Saturdays, arrives Windhoek 10:30 next day.
Fares: N$1 850 (£115 or US$230) sharing, N$2 400 (£150 or US$300) single occupancy.
MOZAMBIQUE – SOUTH AFRICA and MOZAMBIQUE – ZIMBABWE trains
Johannesburg & Pretoria ►Maputo1. Take a South Arrican train from Johannesburg to Komatipoort. This train is the Komati, run by Shosholoza Meyl. It currently runs three times a week and has economy seats
only, there are no sleepers.
Johannesburg Depart 18:10 Mon., Wed., Fri.Pretoria Depart 19:40 Mon., Wed., Fri.Nelspruit (for Kruger Park) Arrive/depart 04:15 next morningKaapmuiden Arrive/depart 05:15 next morningKomatipoort Arrive 06:38 next morning
2. Walk across the border from Komatipoort to Ressano Garcia. It’s only a few kilometres. The CFM train used to cross the border, but this proved too difficult for the customs
authorities, so now you must walk across.3. Take a CFM train from Ressano Garcia to Maputo. This train is run by CFM, the Caminhos de Ferro do Mozambique. It runs daily, and has 3rd class seats.
Ressano Garcia (Mozambique) Depart 12:10 on Mon.–Fri., 12:30 on Sat & Sun.Maputo (Mozambique) Arrive 16:40 on Mon.–Fri., 17:20 on Sat. & Sun.
Maputo ►Pretoria & Johannesburg1. Take a CFM train from Maputo to Ressano Garcia. This train is run by CFM, the Caminhos de Ferro do Mozambique. It runs daily, with 3rd class seats.
Maputo (Mozambique) Depart 07:45 on Mon.–Fri., 08:00 on Sat & Sun.
Ressano Garcia (Mozambique) Arrive 11:20 on Mon.–Fri., 11:35 on Sat. & Sun.2. Walk across the border from Ressano Garcia to Komatipoort. It’s only a few kilometres. The CFM train used to cross the border, but this proved too difficult for the customs
authorities, so now you must walk across.3. Take a CFM train from Komatipoort to Johannesburg. This train is the Komati, run by Shosholoza Meyl. It runs three times a week. It has economy seats only, there
are no sleepers.
Komatipoort Depart 18:00 Tues., Thurs., Sun.Kaapmuiden Arrive/depart 19:39 Tues., Thurs., Sun.Nelspruit (for Kruger Park) Arrive/depart 20:40 Tues., Thurs., Sun.Pretoria Arrive 04:50 next morningJohannesburg Arrive 06:16 next morning
Fares• Johannesburg to Komatipoort costs R170 (about £14 or US$21)• Ressano Garcia to Maputo costs 15MT (about 30p or less than $1)
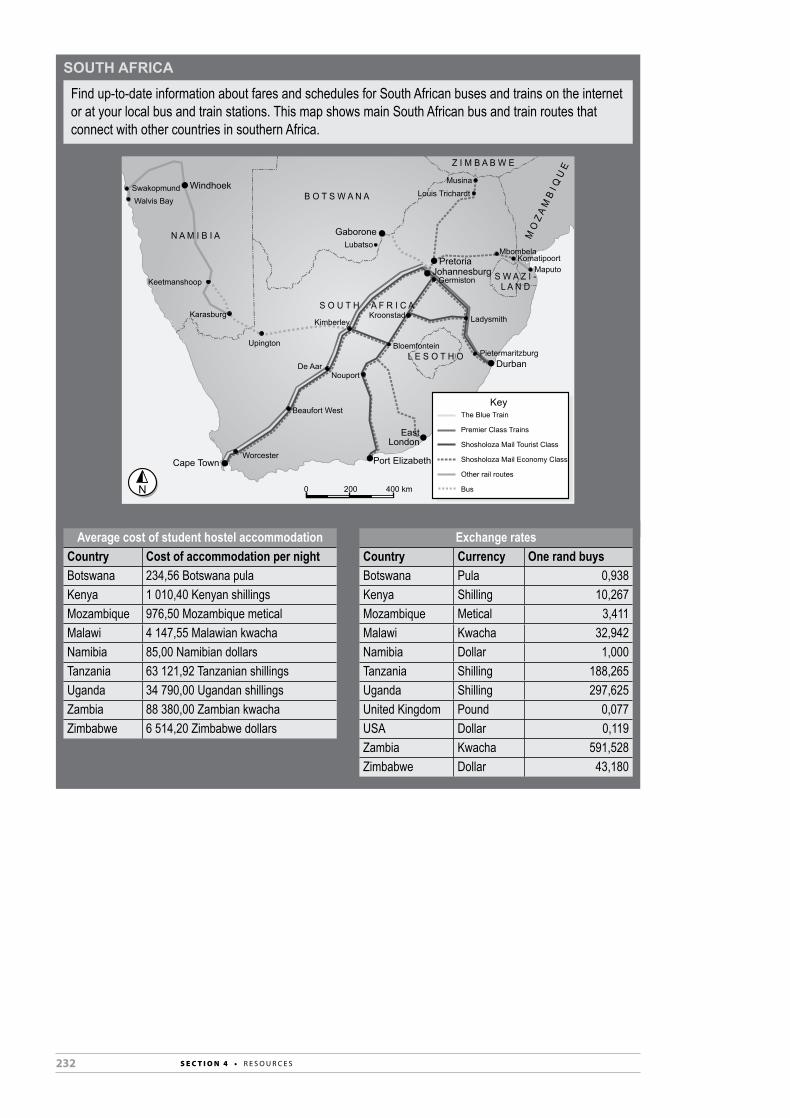
232 S e c t i o n 4 • r E S o u r c E S
SOUTH AFRICA
Find up-to-date information about fares and schedules for South African buses and trains on the internet or at your local bus and train stations. This map shows main South African bus and train routes that connect with other countries in southern Africa.
0 200 400 km
B O T S W A N A
N A M I B I A
Durban
PretoriaJohannesburg
Port Elizabeth
Bloemfontein
Cape Town
Kimberley
EastLondon
Upington
Z I M B A B W E
L E S O T H O
S W A Z I -L A N DKeetmanshoop
Walvis BaySwakopmund Windhoek
Karasburg
N
KomatipoortMaputo
Musina
GaboroneLubatso
De AarNouport
Louis Trichardt
Kroonstad
Beaufort West
Worcester
Pietermaritzburg
Ladysmith
Germiston
Mbombela
The Blue Train
Premier Class Trains
Shosholoza Mail Tourist Class
Shosholoza Mail Economy Class
Other rail routes
Bus
Key
S O U T H A F R I C A
Average cost of student hostel accommodationCountry Cost of accommodation per nightBotswana 234,56 Botswana pulaKenya 1 010,40 Kenyan shillingsMozambique 976,50 Mozambique meticalMalawi 4 147,55 Malawian kwachaNamibia 85,00 Namibian dollarsTanzania 63 121,92 Tanzanian shillingsUganda 34 790,00 Ugandan shillingsZambia 88 380,00 Zambian kwachaZimbabwe 6 514,20 Zimbabwe dollars
Exchange ratesCountry Currency One rand buysBotswana Pula 0,938Kenya Shilling 10,267Mozambique Metical 3,411Malawi Kwacha 32,942Namibia Dollar 1,000Tanzania Shilling 188,265Uganda Shilling 297,625United Kingdom Pound 0,077USA Dollar 0,119Zambia Kwacha 591,528Zimbabwe Dollar 43,180

233S E C T I O N 4 • R E S O U R C E S
B Additional activities: solutions
Most investigations and assignments depend on the topics learners choose and on local conditions. Learners should discuss their findings – if possible, in class discussions. Assignments and investigations included in this Teacher’s Guide are listed below. Solutions are given for certain assignments and investigations.
Measurement
Investigations 1 to 3
Finance
Investigations 1 to 6Assignment 1
Measurement
Assignments 1 to 5Investigations 1, 3, 5
Measurement: Investigation 2 Growth patterns in children aged 2 to 20 teacher’s Guide page 214
1. The data for the boys and girls has been plotted on the graphs on the next two pages.
2. Valid comments on the data:• The sample groups of boys all have mean weights slightly above the
median (the 50th percentile). As the group ages rise from 12 to 17, their mean weights come closer to the median. This indicates that the sample groups of boys tend towards a more normal weight for their age, as they get older.
• The sample groups of boys all have mean heights between the 50th and 75th percentiles – this indicates that they are all slightly taller than the median height for their age groups.
• The sample groups of girls all have mean weights slightly between the 50th and 75th percentiles – their weights are above the median for their age. As they get older, their mean weights came closer to the median – this indicates that they are becoming less overweight as they grow up.
• The sample groups of girls all have mean heights slightly above the median (the 50th percentile), and as they get older their heights come closer to the median. This suggests that some girls go through a phase of growing faster than normal when they are about 12 or 13 years old, but their heights tend to become more normal as they get into their late teens.
3–5. Answers will vary depending on the data collected from samples by the learners.
Term 1
Term 2

234 S E C T I O N 4 • R E S O U R C E S
Plotted data for girls
SOURCE: Developed by the National Center for Health Statistics in collaboration withthe National Center for Chronic Disease Prevention and Health Promotion (2000).http://www.cdc.gov/growthcharts
2 to 20 years: GirlsStature Weight-for-age percentiles-for-age and
NAMERECORD #
Published May 30, 2000 (modified 11/21/00).
WEIGHT
WEIGHT
cm
150
155
160
165
170
175
180
185
190
lb
30
40
50
6070
8090
100
110120130
140150
160170
180
190
200
210
220
230
kg10
15
20
25
30
35
105
45
50
55
60
65
70
75
80
85
90
95
100
20
20
STATURE
40
lb
30
40
50
6070
80
STATURE
62
42
44
46
48
60
58
52
54
56
in
30
32
34
36
38
40
50
74
76
72
70
68
66
64
62
60
in
kg10
15
20
25
30
35
80
85
90
95
100
105
110
115
120
125
130
135
140
145
150
155
2 3 4 5 6 7 8 9 10 11 12 13 14 15 16 17 18 19
12 13 14 15 16 17 18 19
AGE (YEARS)
AGE (YEARS)
160
cm 113 4 5 6 7 8 9 10
95
90
75
50
25
105
9590
75
50
25
105
DateMother’s Stature Father’s Stature
Age Weight Stature BMI*

235S E C T I O N 4 • R E S O U R C E S
Plotted data for boys
2 to 20 years: BoysStature Weight-for-age percentiles-for-age and
NAMERECORD #
SOURCE: Developed b(2000).
y the National Center for Health Statistics in collaboration withthe National Center for Chronic Disease Prevention and Health Promotionhttp://www.cdc.gov/growthcharts
Published May 30, 2000 (modified 11/21/00).
WEIGHT
WEIGHT
STATURE
2 3 4 5 6 7 8 9 10 11 12 13 14 15 16 17 18 19 20
STATURE
74
76
72
70
68
66
64
62
60
in
lb
30
40
50
6070
8090
100
110120130
140150
160170
180
190
200
210
220
230
62
42
44
46
48
60
58
52
54
56
in
30
32
34
36
38
40
lb
30
40
50
6070
80
kg10
15
20
25
30
35
80
85
90
95
100
105
110
115
120
125
130
135
140
150
155
150
155
160
165
170
175
180
kg10
15
20
25
30
35
105
45
50
55
60
65
70
75
80
85
90
95
100
12 13 14 15 16 17 18 19 20
AGE (YEARS)
AGE (YEARS)
40
9590
75
50
25
105
95
90
75
50
25
105
cm 113 4 5 6 7 8 9 10
145
DateMother’s Stature Father’s Stature
Age Weight Stature BMI*
50
185
190
cm
160
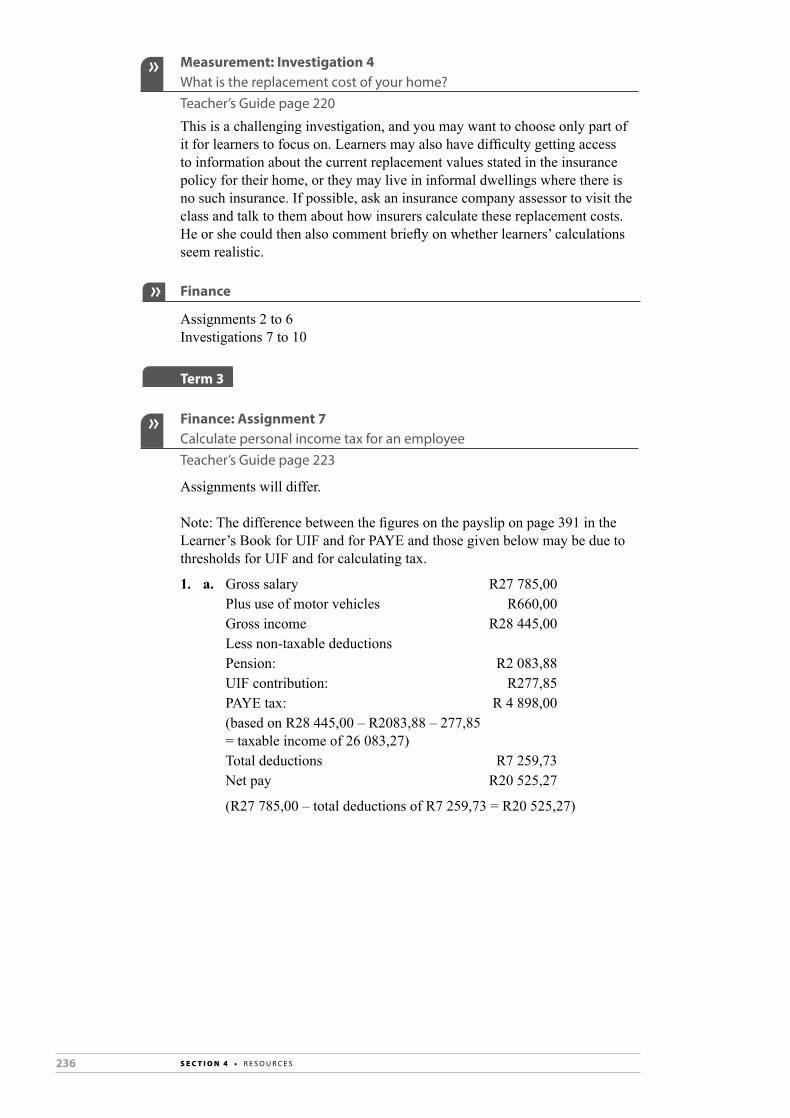
236 S E C T I O N 4 • R E S O U R C E S
Measurement: Investigation 4 What is the replacement cost of your home? teacher’s Guide page 220
This is a challenging investigation, and you may want to choose only part of it for learners to focus on. Learners may also have difficulty getting access to information about the current replacement values stated in the insurance policy for their home, or they may live in informal dwellings where there is no such insurance. If possible, ask an insurance company assessor to visit the class and talk to them about how insurers calculate these replacement costs. He or she could then also comment briefly on whether learners’ calculations seem realistic.
Finance
Assignments 2 to 6Investigations 7 to 10
Finance: Assignment 7 calculate personal income tax for an employee teacher’s Guide page 223
Assignments will differ.
Note: The difference between the figures on the payslip on page 391 in the Learner’s Book for UIF and for PAYE and those given below may be due to thresholds for UIF and for calculating tax.
1. a. Gross salary R27 785,00 Plus use of motor vehicles R660,00 Gross income R28 445,00 Less non-taxable deductions Pension: R2 083,88 UIF contribution: R277,85 PAYE tax: R 4 898,00 (based on R28 445,00 – R2083,88 – 277,85
= taxable income of 26 083,27) Total deductions R7 259,73 Net pay R20 525,27
(R27 785,00 – total deductions of R7 259,73 = R20 525,27)
Term 3

237S E C T I O N 4 • R E S O U R C E S
b. Gross income
Annual salary (r27 785 x 12 months) r 333 420,00
use of motor vehicle (r660 x 12 months) r 7 920,00
total gross income r 341 340,00
Pension (r2 083,88 x 12 months) r 25 006,56
uIF (1% of annual salary) r 3 334,20
Less total non-taxable deductions (r28 340,76)
taxable income r312 999,24
tax payable according to tax tables (r51 300 + 30% x (r312 999,24 – r250 000,00)
r70 199,77
Less primary tax rebate (r11 440,00)
tax payable r58 759,77
R58 759,77 divided by 12 months = R4 896,652. Gross salary R29 452,00 Plus use of motor vehicles R660,00 Gross income R30 112,00 Less non-taxable deductions Pension: R2 083,88 UIF contribution: R294,52 PAYE tax* R5 403,00 Total deductions R7 781,40 Net pay R21 670,60
(R29 452,00 – total deductions of R7 781,40 = R21 670,60) Based on a gross salary of R30 112,00 – R2083,88 – R294,52
= taxable income of R27 733,603. Answers will differ because the monthly tax tables give a single amount
for a monthly tax deduction for a range of incomes while the annual amount uses a formula to calculate the tax amount.
Finance
Assignment 8

238 S E C T I O N 4 • R E S O U R C E S
C Multiplication tables
The 1 times table 1 × 1 = 1 2 × 1 = 2 3 × 1 = 3 4 × 1 = 4 5 × 1 = 5 6 × 1 = 6 7 × 1 = 7 8 × 1 = 8 9 × 1 = 9 10 × 1 = 10 11 × 1 = 11 12 × 1 = 12
The 2 times table 1 × 2 = 2 2 × 2 = 4 3 × 2 = 6 4 × 2 = 8 5 × 2 = 10 6 × 2 = 12 7 × 2 = 14 8 × 2 = 16 9 × 2 = 18 10 × 2 = 20 11 × 2 = 22 12 × 2 = 24
The 3 times table 1 × 3 = 3 2 × 3 = 6 3 × 3 = 9 4 × 3 = 12 5 × 3 = 15 6 × 3 = 18 7 × 3 = 21 8 × 3 = 24 9 × 3 = 27 10 × 3 = 30 11 × 3 = 33 12 × 3 = 36
The 4 times table 1 × 4 = 4 2 × 4 = 8 3 × 4 = 12 4 × 4 = 16 5 × 4 = 20 6 × 4 = 24 7 × 4 = 28 8 × 4 = 32 9 × 4 = 36 10 × 4 = 40 11 × 4 = 44 12 × 4 = 48
The 5 times table 1 × 5 = 5 2 × 5 = 10 3 × 5 = 15 4 × 5 = 20 5 × 5 = 25 6 × 5 = 30 7 × 5 = 35 8 × 5 = 40 9 × 5 = 45 10 × 5 = 50 11 × 5 = 55 12 × 5 = 60
The 6 times table 1 × 6 = 6 2 × 6 = 12 3 × 6 = 18 4 × 6 = 24 5 × 6 = 30 6 × 6 = 36 7 × 6 = 42 8 × 6 = 48 9 × 6 = 54 10 × 6 = 60 11 × 6 = 66 12 × 6 = 72

239S E C T I O N 4 • R E S O U R C E S
The 7 times table 1 × 7 = 7 2 × 7 = 14 3 × 7 = 21 4 × 7 = 28 5 × 7 = 35 6 × 7 = 42 7 × 7 = 49 8 × 7 = 56 9 × 7 = 63 10 × 7 = 70 11 × 7 = 77 12 × 7 = 84
The 8 times table 1 × 8 = 8 2 × 8 = 16 3 × 8 = 24 4 × 8 = 32 5 × 8 = 40 6 × 8 = 48 7 × 8 = 56 8 × 8 = 64 9 × 8 = 72 10 × 8 = 80 11 × 8 = 88 12 × 8 = 96
The 9 times table 1 × 9 = 9 2 × 9 = 18 3 × 9 = 27 4 × 9 = 36 5 × 9 = 45 6 × 9 = 54 7 × 9 = 63 8 × 9 = 72 9 × 9 = 81 10 × 9 = 90 11 × 9 = 99 12 × 9 = 108
The 10 times table 1 × 10 = 10 2 × 10 = 20 3 × 10 = 30 4 × 10 = 40 5 × 10 = 50 6 × 10 = 60 7 × 10 = 70 8 × 10 = 80 9 × 10 = 90 10 × 10 = 100 11 × 10 = 110 12 × 10 = 120
The 11 times table 1 × 11 = 11 2 × 11 = 22 3 × 11 = 33 4 × 11 = 44 5 × 11 = 55 6 × 11 = 66 7 × 11 = 77 8 × 11 = 88 9 × 11 = 99 10 × 11 = 110 11 × 11 = 121 12 × 11 = 132
The 12 times table 1 × 12 = 12 2 × 12 = 24 3 × 12 = 36 4 × 12 = 48 5 × 12 = 60 6 × 12 = 72 7 × 12 = 84 8 × 12 = 96 9 × 12 = 108 10 × 12 = 120 11 × 12 = 132 12 × 12 = 144

240 S E C T I O N 4 • R E S O U R C E S
times tablesQuick reference chart
× 0 1 2 3 4 5 6 7 8 9 10 11 12
0 0 0 0 0 0 0 0 0 0 0 0 0 0
1 0 1 2 3 4 5 6 7 8 9 10 11 12
2 0 2 4 6 8 10 12 14 16 18 20 22 24
3 0 3 6 9 12 15 18 21 24 27 30 33 36
4 0 4 8 12 16 20 24 28 32 36 40 44 48
5 0 5 10 15 20 25 30 35 40 45 50 55 60
6 0 6 12 18 24 30 36 42 48 54 60 66 72
7 0 7 14 21 28 35 42 49 56 63 70 77 84
8 0 8 16 24 32 40 48 56 64 72 80 88 96
9 0 9 18 27 36 45 54 63 72 81 90 99 108
10 0 10 20 30 40 50 60 70 80 90 100 110 120
11 0 11 22 33 44 55 66 77 88 99 110 121 132
12 0 12 24 36 48 60 72 84 96 108 120 132 144

241S E C T I O N 4 • R E S O U R C E S
A
B
C
D
E
F
G
H
I J
K
L
M
N
O
P
Q
1 2 3 4 5 6 7 8 9 10
Alpha-numeric grid
D Transparencies

242 S E C T I O N 4 • R E S O U R C E S
GrafiekpapierGraph paper

243S E C T I O N 4 • R E S O U R C E S
SirkeldiagramPie chart

244 S E C T I O N 4 • R E S O U R C E S
| | | | | | | | | | | | | | | | | | | | | | | | | | | | | | | | | | | | | | | | | | | | || | | | || | | | || | | | || | | | || | | | || | | | || | | | || | | ||| | | | || ||||| ||||| ||||| |||||||||||||||||||||||||||||||||||||||||||||||||||||||||||||||||||||||||||
180 170 160 150140
130120
110100
9080
7060
50
4030
201000 10 20
3040
5060
7080
90100
110120
130
140150
160170180
Protractor

245S E C T I O N 4 • R E S O U R C E S
00
1
2
3
4
5
6
7
8
9
1011
1213
1415
1617
1819
2021
2223
2425
2627
2829
30
1020
3040
5060
7080
9010
011
012
013
014
015
016
017
018
019
020
021
022
023
024
025
026
027
028
029
030
0
mm
cmRuler

246 S E C T I O N 4 • R E S O U R C E S
2010 30 40 50 60 70 80 90 100 110 120 130 140 150 16
6015
014
013
012
011
010
090
8070
6050
4030
2010
0
Set square

247S E C T I O N 5 • D O C U M E N T S
DOCUMENTS
SECTION 5
Insert your own notes and documents, for example the CAPS document for Mathematical Literacy in this section.