Embed Size (px)
Citation preview

STUDIES ON THE TREATMENT OF EFFLUENTS FROMNATURAL RUBBER PROCESSING UNITS
A Thesis submitted to
the Cochin University of Science and Technology
in partial fulfilment of the requirements 'for the award of the degree ofDOCTOR OF PHILOSOPHYin the Faculty of Technology
W
G. MADHU
DEPARTMENT OF POLYMER SCIENCE AND RUBBER TECHNOLOGY
c0cHIN umvensnv OF SCIENCE AND TECHNOLOGYCOCHIN — 682 022. INDIA
JANUARY 1994

CERTIFICATE
This is to certify that the thesis entitled"STUDIES ON THE TREATMENT OF EFFLUENTS FROM NATURAL RUBBER
PROCESSING UNITS" being submitted by Shri G.MADHU in partial
fulfilment of the requirements for the award of the degree ofDoctor of Philosophy is a record of the bona fide researchwork carried out by him in the Department of Polymer Scienceand Rubber Technology, Cochin University of Science andTechnology under my supervision and guidance. No part of thework presented in this thesis has formed the basis of theaward of any other degree, diploma or other similar titlefrom any other institution.
’wU$7?7>
Dr.K.E. George(Supervising Teacher)
ReaderDepartment of Polymer ScienceCochin 682022 a“d R9bber.T°°“?°1°9YCochin University of24th January 1994 Science and Technology

DECLARATION
I hereby declare that the work presented in thisthesis is based on the original work done by me under thesupervision of Dr.K.E. George, Reader, Department of PolymerScience and Rubber Technology, Cochin University of Scienceand Technology. No part of this thesis has been presentedfor any other degree or diploma from any other institution.
Cochin 682022 (24th January 1994 G_ Madhu

ACKNOWLEDGEMENT
I wish to express my profound gratitude toDr.K.E. George, Reader, Department of Polymer Science andRubber Technology, Cochin University of Science andTechnology for his valuable guidance and encouragementthroughout the course of the research work.
I am greatly indebted to Dr.D.Joseph Francis,Professor and Head, Department of Polymer Science and RubberTechnology for his valuable suggestions and for providing thenecessary laboratory facilities.
I am grateful to my present employer, Fertilisersand Chemicals Travancore Ltd., Udyogamandal for permitting meto carry out the studies.
I wish to express my sincere thanks to themanagement and staff of Meenachil Rubber Marketing andProcessing Co—operative Society Ltd., Palai for providing thenecessary help in carrying out the investigations.
Finally I thank Mr.K.P.Sibiraj for neatly typingthis thesis.
G. Madhu

ERRAT%
May be correctedPage No. Line No. From To2 13 Organic compound Organic compounds18 4 of from 1 million from 1 millionmicron micron18 21 odourous Odorous21 1 from 60 to 70 60 to 70
26 10 higher the volume higher than the -29 16 Envrionment Environment30 Kjeldhal kjeldahl31 24 an anaerobic the anaerobic36 was were67 5 '2B.1.2 2B.1.1103 10 nitrogen efficiencies pitrogen removal 106 12 -do- -do122 21 (30) delete (30)123 13 those that131 7 paramound paramount14 5 9 850 mm 680 mm209 Table 4.5 sample Nos.1 and 2 may be added.227 5 (17) (13)268 17 Simpler and products simpler and produc273 14 delete the portion "which makes has a
number of advantages"Page Nos.279 and 280 to be interchanged.
Certified that the corrections suggested by theexaminers have been incorporated.
N11%/rm“Dr. K.E. George
Supervising Teacher

PREFACE
Agriculture and agro-based industries have playedan important role in the development of human civilization.Most of these industries cause environmental pollution.Natural rubber processing industry with a variety of productsis no exception in this regard. Natural rubber is harvestedfrom Hevea trees in the form of a liquid called latex whichcontains 30-40 per cent rubber hydrocarbon and smallquantities of carbohydrates, lipids, proteins etc. Therubber hydrocarbons are separated by acid coagulation for thepreparation of ribbed sheets, crepe and crumb. It is alsoprocessed in the form of latex concentrate by centrifugationand creaming. More than 90 per cent of the latex concentrateis obtained by centrifuging ammoniated field latex. In theabove processes, large quantity of water is used. The washwater loaded with organic compounds mentioned above andorganic and inorganic acids used in the process go to formthe effluents causing environmental pollution.
The pollution problems in rubber processing unitscaught the attention of researchers in Malaysia in the earlyseventies and a few systems have been developed for the
ii

treatment of rubber processing effluents. The growingenvironmental awareness among the people and the introductionof various environmental legislations have forced the rubberprocessing units in India, mostly situated in the SouthIndian states of Kerala, Tamilnadu and Karnataka, to adoptsome kind of effluent treatment systems. But the absence ofsimple, economic and effective methods of effluent treatmentcauses hardships to these units in the small-scale sector.The present study was undertaken to evaluate theeffectiveness of a few physico-chemical and biologicalmethods for the treatment of effluents from natural rubberprocessing units.
The overall objective of this study is to evaluatethe effectiveness of certain physico-chemical and biologicalmethods for the treatment of effluents from natural rubberprocessing units. A survey of the chemical characteristicsof the effluents discharged from rubber processing unitsshowed that the effluents from latex concentration units werethe most polluting. Hence the effluent samples from acentrifuge latex concentration unit were used for thetre ty studies. The treatment methods evaluated irthis study were tried successfully for waste waters fror
iii

process industries like distilleries, textile mills, foodprocessing etc. An attempt has been made to extend thesemethods for the treatment of effluents from a latexconcentration unit under Indian conditions.
iv

Chapter
Chapter
Chapter
Chapter
Chapter
Chapter
Chapter
CONTENTS
PREFACE
INTRODUCTION
EFFLUENT CHARACTERISTICS ANDTREATMENT WITH METAL COAGULANTS
PART A: EFFLUENT CHARACTERISTICS
PART B: TREATMENT WITH METAL COAGULANTS
POLYELECTROLYTES AS COAGULANTAND COAGULANT AID
BIOCHEMICAL OXIDATION KINETICS
WASTE STABILISATION POND METHOD
ANAEROBIC CONTACT FILTER
SUMMARY AND CONCLUSIONS
LIST OF PUBLICATIONS FROM THE PRESENT WORK
44
44
66
128
189
233
268
332
339

Chapter 1
INTRODUCTION
1.1 GENERAL
Natural rubber is one of the most versatile plantproducts of mother nature. The name ‘rubber’ is derivedfrom the quality of the material in rubbing black leadpencil marks out of paper. This important material has avariety of uses in our everyday life. Even before theadvent of technology for the manufacture of modern rubberproducts, it was in use in some form or other. In the last150 years, the demand for natural rubber has increasedconsiderably due to the several developments that has takenplace in the production, processing, compounding and use ofthis product.
Natural rubber is obtained from the latex ofvarious plants. Eventhough the latex of about 2000 speciesof plants contain rubber as a constituent, only a few ofthem have been exploited for the commercial production ofrubber. Among them, Hevea brasiliensis is the main sourceof natural rubber today. India is among the major rubbergrowing nations in the world. The other producers ofnatural rubber are Malaysia, Indonesia, Thailand and

Srilanka. In India, rubber has been traditionally grown inthe high lands of Southwest, predominantly in Kerala and insome parts of Tamil Nadu and Karnataka.
The crops harvested from rubber plantationsconsist of 75 per cent field latex and 25% field coagulumgenerally termed as scrap rubber. The field latex andfield coagulum harvested from plantations are not generallyused as such for the manufacture of rubber goods. Thisnecessitates the processing of crops into forms that alloweasy storage, transportation and utilisation bymanufacturing industries (1). During the processing ofnatural rubber latex large quantity of water is used. Thewaste water loaded with organic compound and organic andinorganic acids used in the process form the effluentscausing environmental pollution.
1.2 COMPOSITION OF NATURAL RUBBER LATEX
NR latex is mainly obtained as a white fluid fromthe bark of Hevea brasiliensis by the process of tapping.The rubber content of latex varies between 25 and 40 percent by weight and this variation is owing to factors suchas type of tree, tapping intensity, soil conditions and theseason. In addition to the rubber hydrocarbon, a large

number of non—rubber constituents are also present inlatex. The rubber hydrocarbon in latex is predominantlycis—l,4 polyisoprene and it occurs as molecular aggregatesin the form of discrete particles which are usuallyspherical with diameter ranging from about 0.02 to 3microns (2).
Hevea latex is a hydrosol or a weak lyophillicnegatively charged colloidal system of spherical or pearshaped rubber globules dispersed in an aqueous serum. Thedispersed rubber particles are strongly protected by acomplex film made of protein, neutral lipid and phospholipid (3). Excluding rubber and water, the substancespresent in latex are proteins, lipids, quebrachitol andinorganic salts. The total protein content (4) is about 12 per cent of which 20 per cent is absorbed on the surfaceof the rubber particles and the rest is dissolved ordispersed in the serum. The lipids consist of fats, waxes,sterol esters, and phospholipids and its total content isabout 0.9 per cent. The total concentration of inorganicmaterials is about 0.5 per cent, the main constituentsbeing salts of potassium, magnesium, copper, iron, sodium,calcium and phosphorous.

1.3 PROCESSING OF NR LATEX AND EFFLUENT GENERATION
Field latex and field coagulum obtained fromrubber plantations are highly susceptible to degradationcaused by oxidation and microbial contamination (5). Hencenatural rubber latex is processed into forms that alloweasy storage and marketing.
Field latex can be processed into the followingforms (6):
a) Ribbed smoked sheet or air dried sheetb) Preserved latex and latex concentratec) Pale latex crepe andd) Technically specified block rubber or crumb
rubber
Similarly field coagulum is processed into crepe rubber andcrumb rubber. The crepe rubber produced from fieldcoagulum can be classified into three grades namely estatebrown crepe (EBC), remilled crepe and flat bark crepedepending on the quality of the coagulum used. Theprocessing methods of all these grades are almost the same.
During the processing of natural rubber, largequantity of water is used for various purposes such as

dilution of latex, cleaning of various utensils used,washing, cooling etc. The quantity of water used and thevolume and characteristics of wastewater generated duringprocessing vary depending upon the type of natural rubberprocessed and product produced (7). A brief description ofthe various processing methods and sources of effluents aregiven in the following sections.
a) Ribbed Smoked Sheets
Fig.l.l illustrates the process of making ribbedsheets from latex. Latex collected from the field is firstsieved to remove foreign materials. It is then bulked tohave uniform property and diluted to a standard dry rubbercontent (DRC) of 12.5 per cent to improve the quality ofcoagulum. Dry rubber content usually expressed as apercentage may be defined as the ‘real’ rubber content oflatex if all the serum were removed (8). Chemicals likesodium bisulphite and para nitro phenol are added toprevent decolourisation. They also act as preservative.The latex is then coagulated using formic acid or aceticacid. After completion of coagulation, the serum isdrained out and the coagulum is obtained in the form ofblocks. Washed coagulum is then rolled to sheets using apair of plain rolls and another set of grooved ones. The

Field latex
water
Bulking &tandardisation
Chemicaladdition
acid
__§fEEQ__ __ Coagulation:1-2cu.m/tonI of DRC' water. I:_______ ____ Sheeting &I 20—25cu.m/ton drippingI ofDm3 II
I
II DryingII .IFloor & tank I ‘
washings etc. I3—5cu.m/ton of‘: Smoking""“ " “' —‘ ‘-I II I
II IV VComposite Grading &effluent packlng
20-30 cu.m/ton of rubber(drytnsis)
FIG.l.1 PROCESS now SHEET FOR RIBBED SMOKED SHEET MANUFACTURE.
sheets are then allowed to drip in shade and smoked insmoke houses for producing ribbed smoked sheet.
Water is used in the process for diluting thelatex and for washing the coagulum during sheetingoperations. This water forms part of the effluent. Thewater consumption is estimated to be in the range of 20-30litre/kg. of DRC.
b) Preserved Latex and Latex Concentrate
The field latex if kept as harvested willcoagulate within 6-12 hours of its collection. Microorganisms like bacteria and yeast contaminate the latex asit comes out of the tree. They metabolise the non—rubberconstituents of the latex and produce volatile fatty acidssuch as formic, acetic and propionic acids which lead tocoagulation of latex (10). Hence preservatives are addedto latex to keep it for longer periods (lO,ll). Among thevarious chemicals used as preservatives, ammonia is ofprime importance. The latex from the field is sieved andbulked and ammonia is bubbled through it so as to get aconcentration of 0.7 to 1.0 per cent by volume of latex.Ammonia inhibits bacterial growth, acts as an alkalinebuffer and raise the pH and neutralise the free acid formed

in latex (12). It inactivates some metal ions which tendto coagulate latex by forming insoluble compounds orcomplexes with them.
Preserved field latex is unsuitable for most latexapplications as its rubber content is low. For mostproduct manufacture, a latex of 60 per cent minimum dryrubber content is essential. The important methods for theconcentration of preserved field latex are (i) creaming,(ii) centrifuging. These methods involve partial removalof non—rubber constituents and the particle sizedistribution of the concentrate differs from that of theinitial latex as a proportion of the smaller particles areeliminated in the serum. At present, more than 90 per centof the latex concentrate is obtained by centrifuging.
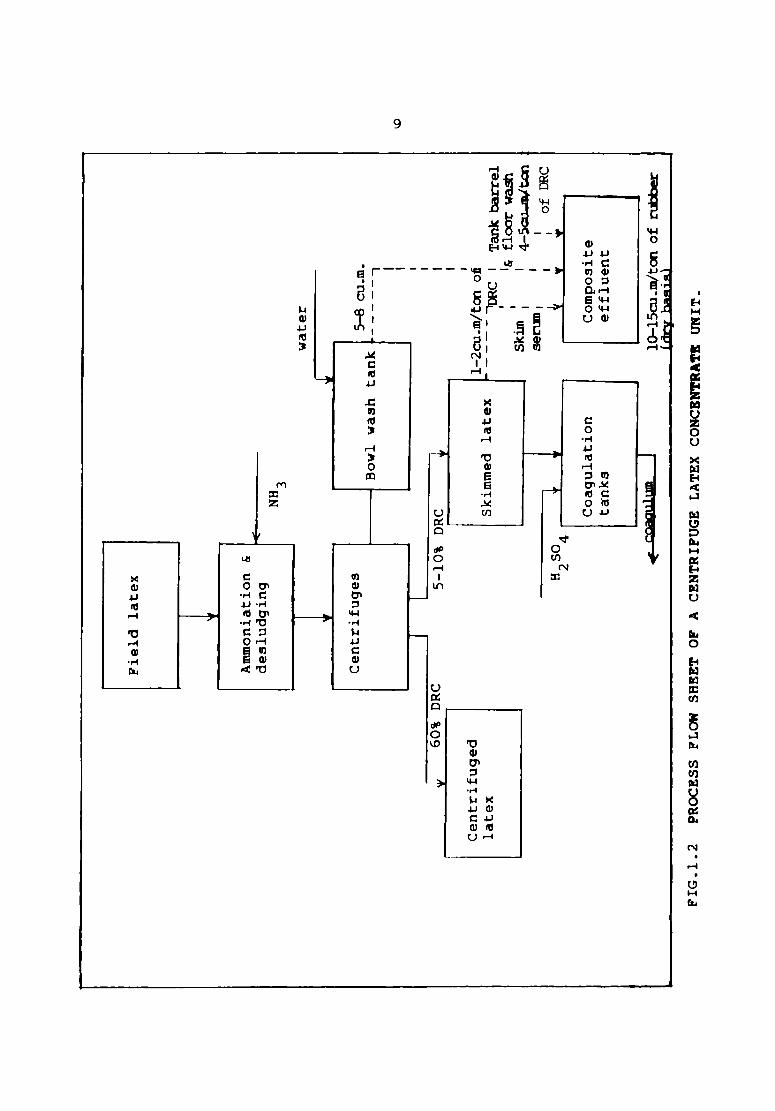
l. Centrifuging
In the centrifuging process, the centrifugal forcebrings about separation of rubber particles. Theammoniated field latex is subjected to strong centrifugalforce in aa bowl rotating at ea speed of around 6000 rpmwhereby individual rubber particles tend to separate into alayer surrounding the axis of rotation leaving behind anouter layer (skim) having a comparatively lower rubber
.HH2D nacmazmozoo xmaaq moammmazmo 4 mo auumm zoam mmmoomm N.H.UHm
.u_gn.»u:
hand no :B\a.8mT2 _1Jn3._._uuauIV
ucmsauum mxcmumuwnomsou cowumasomoo
H u » vommm
o%uwo M _ :Gom§\...83 _ _._5_m
cum: uooau w_ _
Hmuuun game _ umor..|..u.- xmuma umeaaxm xmuma
no .._ou\e.8~A ommvsuwuucmo
__
_ 4 one aoaum omn wow .
_ F _
__
Tnl.nn.4 xcmu cum: Haom
a so mum mwmswfluucwo
noun:
m
mz m ocwmnnammow :oaum«coaE<gonna oamfim

10
content. The DRC of the centrifuged latex is around 60 percent. About 85 to 90 per cent of the total rubber in thefield latex will be separated into the concentratedfraction. 10-15 per cent rubber will be lost into the skimfraction. The volume of the skim latex will beapproximately equal to that of the concentrated fraction.To recover the rubber in skim latex, it is coagulated withsulphuric acid and the serum left out is drained off.
The water requirement in centrifuging process isin the range of 10-15 litres per kg of dry rubber. Thewater requirement is for cleaning the latex storage tanksonce a week, washing the barrels, washing the bowls of thecentrifuging machine twice imi a shift and coagulation ofskim latex. All the water used in the process comes out aseffluent apart from the skim serum. The flow diagram ofthe process with effluent generation is shown in Fig.l.2.
2. CreamingIn the creaming process, the preserved field latex
is kept for a few days for ageing. Tamarind seed powder isusually used as the creaming agent. A 3% solution of theseed powder is prepared by boiling the required quantity inwater. The calculated quantity of the creaming agent

11
solution and a 10 per cent soap solution is added to latexin order to get a latex concentration of 0.3 per cent. Thelatex is stirred for one hour. After stirring, the latexis allowed to remain undisturbed for a minimum period of 48hours to obtain a desired level of creaming (l). Thegravitational force brings about the separation of rubberparticles in creaming. Latex with 55-58 per cent DRC isobtained by the creaming method. The skim serum leftbehind will contain 2-3 per cent rubber. The waterrequirement in a latex creaming unit is in operations likecleaning the reception tanks and floor of the factory.This water goes out as effluent.
c) Pale Latex Crepe Units
The stages in the manufacture of pale latex crepe(PLC) are shown in Fig.l.3. The field latex containinganticoagulating agents like ammonia or sodium sulphite isreceived at the factory. The latex is then sieved, bulked,standardised and chemically treated. The chemicallytreated latex is then subjected to fractional coagulationusing acetic acid for removing colouring materials (6). Itis then sieved through a 60 mesh sieve and the yellowpigment fraction in latex is removed. The latex afterfractional coagulation and bleaching is coagulated using
12
Field latex
Sieving andbulking
l waterStandardisation
&
chemicaladdition
» #1Fractionalcoagulation ableaching
water
Formic acidJ
___.—_.__._._4lr2_3cu_m/ton CoagulationI oftmcI‘ watgrI J__.I
Fioo§_wash I5-10cu-I5/€071 T23-3025.6/Ea? °*‘°Pi"9ofDRC ‘ { u of DRC. I‘II J
'4
Compositeeffluent Drying30—40cu.m/ton of rubber
(drytusis)
FIG.l.3 PROCESS FLOW CHART OF A PALE LATEX CREPE UNIT.

13
formic acid. About 4 ml of formic acid per kg. of dryrubber is used. The coagulum obtained in the form of blockis milled in creping machines. Water is used duringmilling to wash out the serum and other non-rubbermaterials. The product is then dried and packed.
In a pale latex crepe unit, water is required fordiluting the latex, washing the coagulum and for coolingthe rollers. Waste water is released from the latexcoagulation section and crepe milling section (7). Waterconsumption per kg drc of the product is about 20-30litres. The quantity discharged as effluent slightlyexceeds this because the serum from coagulation also goesto the effluent.
d) Estate Brown Crepe UnitsEstate brown crepe (EBC) is made from field
coagulum or scrap rubber. Field coagulum is the rubbercollected from collection cups, trunk of the tree and fromthe ground beneath the collection cup. Soaking of thefield coagulum, maceration, creping and finishing are theoperations carried out in EBC manufacture. The soakedscrap is passed through macerator creper and finishingmachines several times.

.mm:eu¢maz<z mmmmo zzomm ma<amm mom ammmm zogm mmmuomm v.H.oHm
14
333 E3
Hwflfldh no cou\E.:UovIom
mcflxomm
ucmsauummuflmomeou
4 ._,
_
m:a>uo H fl_ _
r I I I I I I «.1
fl ” umo uo couxeéumum_ .mHK,uooHm
“ umo “
. we con e.sum~Io~
mcwmmuo fill I..|\I I I II.v_w cofiumumumz __L _umumz ”
umo
we :B\.__.BmTS umcaxmom !.r I I I I I I I V
umumz
Auwnnsu amuumvEsasmmou oamwm

L5
Fieldcoagulum
water
I {_________ Soaking
I —lOcu.m/ton| of DRC: waterI YI
Lg. _ _ _ _ _ -._ Cleaning &,5—10cu.m/ton blendingI oflmw, waterI. V JI
________ -. Maceration &20—25cu.m/ton creping°f DRC waterf E———_ _ _ _ _ _ _ 5 Size
| 2-5CU-IT!/1'-On reduction' °f DRC waterI' .|I CrumbF ‘ ‘ “ ‘ “ - ”“ collectionwashings '3-5CU.m/ton tank
——— — -— ., , of DRCI I| I I' II .1 4; Dry1ngCompositeeffluent
35-55 cu.m/ton of 111C Pressing
Packing
FIG.l.5 PROCESS FLOW SHEET FOR CRUMB RUBBER MANUFACTURE.

16
Water requirement for BBC manufacture are for thesoaking of the field coagulum, maceration and millingoperations and for the floor washing and other cleaningoperations. The water requirement and effluent generationis between 30-40 litre/kg of DRC (7). This is higher thanthe water requirement for producing pale latex crepe. Aflow diagram of the process with effluent generation isgiven in Fig.l.4.
e) Crumb Rubber Producing Units
Crumb rubber or block rubber is mostly producedfrom field coagulum (1). The stages in the process arecollection of field coagulum, soaking and pre—c1eaning,blending. milling and size reduction, drying, pressing andpacking. When crumb rubber is produced from field latex,the additional stages required are that of coagulation andpre-machining. Water is required for scrap soaking,milling, size reduction and crumb collection. The waterconsumption and effluent generation is estimated to be35-55 litres per kg of DRC. The flow diagram of theprocess is shown in Fig.l.5 with effluent quantities.
1.4 PHYSICAL; CHEMICAL AND BIOLOGICAL CHARACTERISTICS OFWASTE WATER
An understanding of the nature of wastewaters isessential in the design and operation of collection,

17
treatment, and disposal facilities and in the engineeringmanagement of water quality (13). It is, therefore,desirable to know the physical, chemical and biologicalcharacteristics of waste water. The pollution potential ofwastewaters, whether it is domestic or industrial, isexpressed in terms of these characteristics.
a) Physical CharacteristicsThe most important physical characteristics of
wastewater is its total solids content.
The other physical characteristics of importanceare odour, temperature and colour (13).
Total SolidsThe total solids content of wastewater is the sum
total of floating matter, matter in suspension, colloidalmatter, and matter in solution. Analytically, the totalsolids content of a wastewater is defined as all the matterthat remains as residue upon evaporation at lO3to 105°C.The total solids can be classified as either suspendedsolids or filterable solids by passing a known volume ofliquid through a filter. The filter is commonly chosen sothat the minimum diameter of the suspended solids is about

18
1 micron (14). The filterable-solids fraction consists ofcolloidal and dissolved solids. The colloidal fractionconsists of the particulate matter with an approximatediameter range of from 1 milli micron to 1 micron. Thedissolved solids consist of both organic and inorganicmolecules and ions that are present in the true solution inwater.
Turbidity, a measure of the light-transmittingproperties of water, is another test used to indicate thequality of waste discharges and natural waters with respectto colloidal matter. Colloidal matter will scatter oradsorb light and thus prevent its transmission (15).
Odour
odours in wastewater usually are caused by gasesproduced by the decomposition «of organic matter. Freshwastewater has a distinctive, somewhat disagreeable odour,which is less objectionable than the odour of septicwastewater. The most characteristic odour of stale orseptic wastewater is that of hydrogen sulphide, which isproduced by anaerobic microorganisms that reduce sulphatesto sulphides (16). Industrial wastewater may containeither odourous compounds or compounds that produce odoursduring the process of wastewater treatment.

19
Temperature
As the specific heat of water is much greater thanthat of air, the observed wastewater temperatures arehigher than the local air temperatures during most of theyear and are lower only during the hottest summer months.The temperature of water is a very important parameterbecause of its effect on aquatic life, the chemicalreactions and reaction rates, and the suitability of waterfor beneficial uses (17).
Colour
The colour of fresh wastewater is usually grey.However, the colour changes to black as organic compoundsare broken down by bacteria resulting in the depletion ofdissolved oxygen in wastewater (18). In this condition,the wastewater is said to be septic (or stale). Someindustrial wastewaters are coloured in nature.
b) Chemical Characteristics
In chemical characteristics, the components ofimportance are organic matter, inorganic matter and gases.
Organic Matter
In a wastewater of medium strength, about 75 percent of the suspended solids and 40 per cent of the
20
filterable solids are organic in nature (13). These solidsare derived from both the animal and plant kingdoms and theactivities of man as related to the synthesis of organiccompounds. Organic compounds are normally composed of acombination of carbon, hydrogen, and oxygen, together withnitrogen in same cases. Other important elements such assulphur, phosphorous and iron, may also be present. Theprincipal groups of organic matter found in wastewater areproteins, carbohydrates and fats and oils.
The laboratory methods commonly used for themeasurement of organic content in wastewater areBiochemical Oxygen Demand (BOD) and Chemical Oxygen Demand
(coo).
The most widely used parameter of organicpollution applied to both wastewater and surface water is
the 5-day BOD (BOD5). Its determination involves themeasurement of the dissolved oxygen used by microorganisms
in the bio-chemical oxidation of organic matter.Biochemical oxidation is a slow process and theoreticallytakes an infinite time to completion (19). The oxidationis about 95 to 99 per cent complete within a 20 day periodand in the 5 day period used for the BOD test, oxidation is

21
from 60 to 70 per cent complete. The 20°C temperature usedis an average value for slow-moving streams in temperateclimates and is easily duplicated in an incubator.
The COD test is used to measure the content oforganic matter of both wastewater and natural waters. Inthis test, the oxygen equivalent of the organic matter thatcan be oxidised is measured by using a strong chemicaloxidising agent in an acidic medium, at an elevatedtemperature. Potassium dichromate has been found to be anexcellent oxidising agent for this purpose. Compared tothe BOD test which takes 5 days, the COD can be determinedin 3 hours. The total organic content (TOC) of thewastewater is also widely used as an index of organicmatter.
Inorganic MatterSome of the parameters of importance are pH,
alkalinity, nitrogen and phosphorous.
pH: The hydrogen ion concentration is an important qualityparameter of both natural waters and wastewaters. Theconcentration range suitable for the existence of mostbiological life is quite narrow and critical. wastewaterwith an adverse concentration of hydrogen ion is difficultto treat by biological means.
22
Alkalinity: Alkalinity in wastewater results from thepresence of the hydroxides, carbonates and bicarbonates ofelements such as calcium, magnesium, sodium, potassium, orof ammonia. Alkalinity is determined by titrating againsta standard acid: the results are expressed in terms ofcalcium carbonate (20).
Nitrogen: Since nitrogen is an essential building block inthe synthesis of protein, nitrogen data will be required toevaluate the treatability of wastewater by biologicalprocesses. Insufficient nitrogen can necessitate theaddition of nitrogen to make the waste treatable. Wherecontrol of algal growths in the receiving water isnecessary to protect beneficial uses, removal or reductionof nitrogen in wastewaters prior to discharge may bedesirable (21).
Phosphorous: Like nitrogen, phosphorous is also essentialto the growth of algae and other biological organisms. Theusual forms of phosphorous that are found in aqueoussolutions include the orthophosphate, polyphosphate, andorganic phosphate (22). Because of the noxious algalblooms that occur in surface waters, there is presently

23
much interest in controlling the amount of phosphorouscompounds that enter surface waters in domestic andindustrial waste discharges and natural runoff.
Gases
Gases commonly found in untreated wastewaterinclude nitrogen, oxygen, carbon dioxide, hydrogen sulphideand methane. The first three are common gases ofatmosphere and will be found in all waters exposed to air.The latter two are derived from the decomposition of theorganic matter present in wastewater. Ammonia is alsofound to be present in untreated wastewater as ammoniumion.
Dissolved oxygen is required for the respirationof aerobic microorganisms as well as all other aerobic lifeforms. However, oxygen is only slightly soluble in water.The actual quantity of oxygen (other gases too) that can bepresent in solution is governed by (a) the solubility ofgas: (b) the partial pressure of the gas in the atmosphere:(c) the temperature and (d) the purity (salinity, suspendedsolids etc.) of the water (22).
Hydrogen sulphide is formed, as mentionedpreviously, from the decomposition of organic matter

24
containing sulphur or from the reduction of mineralsulphites and sulphates. It is not formed in the presenceof an abundant supply of oxygen. The blackening ofwastewater and sludge usually results from the formation ofhydrogen sulphide that has combined with the iron presentto form ferrous sulphide (23).
Methane gas is formed as the principal by-productof the anaerobic decomposition of the organic matter inwastewater. Methane is a colourless, combustiblehydrocarbon of high fuel value.
c) Biological CharacteristicsThe biological characteristics of wastewater
relate to the microorganisms present in surface and wastewater as well as those responsible for biologicaltreatment, the pathogenic organisms in wastewater and theorganisms used as indicators of pollution.
The principal groups of organisms found in waterand wastewater are classified as protista, plants andanimals. The category protista includes bacteria, fungi,protozoa and algae. Among them, bacteria play afundamental role in the decomposition and stabilisation of

25
organic matter, both in nature and in treatment plants(13). Seed plants, ferns, and mosses and liverworts areclassified as plants. Invertebrates and vertebrates areclassified as animals. Viruses which are also found inwastewater, are classified according to the host infected.
Pathogenic organisms found in wastewater may bedischarged by human beings who are infected with disease orwho are carriers of a particular disease. The usualbacterial pathogenic organisms that may be excreted by mancause diseases of the gastrointestinal tract, such asdysentry, diarrhea and cholera and typhoid and paratyphoidfever (24).
Because the identification of pathogenic organismsin water and wastewater is both extremely time—consumingand difficult, the caliform group of organisms is now usedas an indicator of the presence of feces in wastewater andhence pathogenic organisms (25). Coliform organisms arethe countless rod—shaped bacteria present in the intestinaltract of man. Each person discharges 100 to 400 billioncoliform organisms per day.
1.5 WATER POLLUTION AND ITS CONTROL IN RUBBER PROCESSINGUNITS
During the processing of natural rubber, largequantity of water is used for various purposes such as

26
dilution of latex, cleaning of various vessels andmachinery used, washing, cooling etc. The quantity ofwater used and the volume and characteristics of wastewater
generated during processing vary widely depending on thetype of natural rubber processed and the productmanufactured. The volume of water consumed and the volume
of wastewater generated are almost the same in the case ofa field coagulum processing unit: while in the case offield latex processing units the volume of wastewater ishigher the volume of water consumption (6). This is due tothe fact that the serum separated during latex coagulationis also discharged along with the process effluent in thecase of a field latex processing unit.
a) Characteristics of Effluents from Natural RubberProcessing
A few studies have been carried out in India andMalaysia to establish the characteristics of effluentsdischarged from rubber processing units (26,27,28,29). Theresults of the studies are summaried in Table 1.1.
The acidic nature of the effluent is attributed tothe use of formic, acetic, phosphoric or sulphuric acid inthe process line. The high Biochemical Oxygen Demand (BOD)

27
om
m.nu ooma oow» oomfi- oomo oomfiu cow- mufics wmwuu
om o.o oa o oom mo oom m czoun mumumm .m
om: m.mI om: mm: oomvu oomu ooow: ooovu mafia: uwwcm
om m.v ma oa oowm ooa ooom ooom nmxoem nwnnfim .v
om: m.o- om- mm- ooom- oo»- ooonu oowmu muflcs
om m.m oa m ooma mo ooom oomfi wmmuu xmuma mamm .m
om: m.»u ommn ommu comm- ooo- oomau omm- mufics
om m.m o.H o oom ow oom om uonnsu nesuo .~
man v.5- oooa- oomn oooomu oowmu oomoau oommn mafia: mad
ofi N.m oooa oom oomv oom ooom oomm umsufluucmu xmumq .a
omo mo
coflu Hxme H\mE wvaaom Hxme
Imumcwm mm cwmouufic cwmouuw: cw>HommH© mvaaom Hxme a\mE .ozucmsamwm Hmuoa HmumHcoae4 Hmuoa omucmmmsm moo mom >uumsccH no ma>e .Hw
muHamHmmao¢m<zu azmoqmmm
H.a
mqm<e

28
and Chemical Oxygen Demand (COD) of the latex concentrateand ribbed sheet factory effluent indicate that the totalsolids in the effluents are mainly of organic origin withhigh oxygen demand for their oxidation. The highammoniacal and total nitrogen of latex concentrate effluentis due to the use of substantial quantity of ammonia in thepreservation of latex. Hence the two potential pollutantsin rubber effluent are organic carbon and ammoniacalnitrogen (30).
b) Effect of Effluent Discharge on Water Bodies
The effluents from natural rubber processing unitshas been one of the important sources of water pollutionatleast in the state of Kerala (6). The effluent generallyconsists of process water, small amount of uncoagulatedlatex and serum containing small quantities of protein,carbohydrates, lipids, carotenoids, inorganic and organicsalts etc. The presence of these substances leads to highBOD, COD, suspended solids, dissolved solids and nitrogencompounds in the effluent. The concentration of eachcomponent in the effluent varies considerably with the typeand scale of the factory operation and in particular withthe amount of water used in processing.

29
The unabated discharge of raw effluent into theenvironment if unchecked will adversely affect the qualityof the receiving waterbodies. If the untreated effluentsfrom rubber latex processing units are discharged into anystream or river, it will deplete the dissolved oxygencontent of the waterbody due to high BOD and COD, thusaffecting the very survival of aquatic life. The acidicnature of the effluent also may affect the growth of fishand other aquatic life. Presence of ammonia and nitrogencompounds in the effluent encourage the growth of aquaticweeds and other plants in the water body. This will leadto a phenomenon called 'entrophication' (31).
c) Present Treatment Practices
In view of the serious pollution problems createdby the effluent, the rubber processing units are preventedfrom discharging the raw effluent into public sewers orrivers. In India the Envrionment (Protection) Rules, 1986(32) has prescribed standards for the discharge ofeffluents from natural rubber industry. Separate standardsare fixed for the discharge of effluents into inlandsurface waters and disposal on land for irrigation. Thesestandards are given in Table 1.2. These standards serve asa guideline for the state pollution control boards.

30
TABLE 1.2
STANDARDS PRESCRIBED FOR EFFLUENT DISCHARGE
FROM NATURAL RUBBER INDUSTRY
(all values except pH are in mg/l)
StandardsParameter
Discharge into Disposal oninland surface land forwaters irrigation
Colour and odour Absent AbsentpH 6.0-9.0 6.0-8.0BOD 50 100COD 250 250Oil and grease 10 10Sulphides 2 -Ammoniacal nitrogen as N 50 -Total Kjeldhal nitrogen 100 -Free ammonia (as NH3) 5 -Suspended_solids 100 200Dissolved solids (inorganic) 2100 2100

31
In most of the rubber processing units in India:proper treatment and discharge of effluents did not receivemuch attention in the past. The general practice was todischarge the effluents indiscriminately to the environmentwithout treatment. some of these units have providedrubber traps to detain rubber particles and one or twosettling tanks before discharging the effluent to publicwaterways (6). Some factories discharge the effluent intotheir own estates where it is allowed to percolate in thesoil or used for irrigation purposes. The growingenvironmental awareness among the people and theintroduction of various environmental legislations haveforced the rubber processing units in India, mostlysituated in the South Indian states of Kerala, Tamil Naduand Karnataka, to adopt some kind of effluent treatmentsystems. Already some of the crumb rubber factories andlatex centrifuging factories have set up effluent treatmentsystems. The systems adopted at present are the anaerobicfacultative ponding system and the oxidation ditch system.Both these systems are found suitable for the rubberprocessing factory effluents under Malaysian conditions(33:34).
The anaerobic—facultative ponding system involvesan anaerobic decomposition of the organic materials to a

32
level acceptable for further break down aerobically. Inthe breakdown process, the end products are methane andcarbon dioxide. The anaerobic liquor containing part ofthe organic matter is further treated in facultative pondswhich further converts the remaining organics into carbondioxide, water etc. The aerobic breakdown in thefacultative pond occurs in the top layer where oxygenrequired is available from the photosynthetic activity ofthe algae as well as by diffusion (35). However, in thebottom sediments anaerobic decomposition occurs.
The oxidation ditch essentially involves anaerobic process. It is elliptical in shape and is fittedwith an aerator which oxygenates and circulates theeffluent (36). The treated effluent from the oxidationditch overflows into the sedimentation tank where thesludge settles at the conical bottom. A portion of thesludge is recycled back to the system. The excess sludgefrom the sedimentation tank is removed and dried. Theclarified supernatant effluent from the sedimentation tankis discharged through a sand filter.
1.6 OBJECTIVES AND SCOPE OF THE WORK
A few treatment systems like anaerobic—facultativeponding and oxidation ditch have been found to be suitable

33
for the rubber processing factory effluents under Malaysianconditions. However, a detailed systematic study on theefficiency of different treatment systems for the naturalrubber processing factories under Indian conditions is notavailable (37). Having this in mind, the present study wasinitiated to evaluate the effectiveness of a few physico—chemical and biological methods for the treatment ofeffluents from natural rubber processing units. A survey(38) of the chemical characteristics of the effluentsdischarged from rubber processing factories showed that theeffluents from latex concentration units are the mostpolluting. Hence the effluent samples from a centrifugelatex concentration unit were used for the treatabilitystudies. The treatment methods evaluated in this studyhave been tried successfully for effluents from processindustries like distilleries, textile mills, foodprocessing etc. (l8,3l,36). An attempt has been made toextend these methods for the treatment of centrifuge latexconcentration effluents under Indian conditions.
The following formed part of the study:
1. A complete characterisation of effluents from thevarious sections of a centrifuge latex concentrationunit.

34
2. Evaluation of the effectiveness of metal coagulants intreating the centrifuge latex concentration effluents.
3. Evaluation of the effectiveness of natural and syntheticpolyelectrolytes as coagulants and coagulant aids.
4. The bio—chemical oxidation kinetics of the rubberprocessing effluents.
5. Treatability studies in an experimental wastestabilisation pond in admixture with domestic sewage.
6. The performance evaluation of a bench scale upflowanaerobic filter for the treatment of rubber processingeffluents.
This thesis is divided into seven chapters.
In chapter l, an overview of the various methodsof natural rubber processing and sources of effluentgeneration are presented. The physical, chemical andbiological characteristics of importance in the design andoperation of wastewater treatment plants have beendiscussed in brief. The effect of effluents on receivingwaters and the present treatment practices in naturalrubber processing units have been described. The scope andobjectives of the present work are defined in this chapter.

35
Chapter 2 is divided into two parts. In part A,the characteristics of the combined effluent and theindividual characteristics of effluents from the twosections of a centrifuging unit, viz., the centrifuging andskim latex coagulation are described. Correlations havebeen developed between the different characteristics.
In part B, the results of the experiments carriedout on centrifuge latex concentration effluent using ninecommonly used metal coagulants are discussed. Thecoagulants used in the study were alum, aluminium sulphate,ferrous sulphate, ferric chloride, ferrous chloride,aluminium chloride, lime and magnesium chloride. Theeffectiveness of the metal coagulants was evaluated interms of COD reduction, turbidity removal and ammoniacalnitrogen removal.
In chapter 3, the results of the studies carriedout using four natural polyelectrolytes and two syntheticpolyelectrolytes are presented. The naturalpolyelectrolytes used were starch, sodium alginate,tamarind seed powder and chitosan. The syntheticpolyelectrolytes used for the study were a cationicpolyacryl amide based one and an anionic polyamine based

36
one. The effectiveness of the polyelectrolytes as primarycoagulant and coagulant aid was evaluated.
Chapter 4 deals with the bio—chemical oxidationkinetics of natural rubber processing wastewaters. Thevariations in the BOD values of the effluent at fourtemperatures 20, 25, 30 and 35°C, were studied. The biochemical stabilization rate constant (k) and ultimate BOD
(LC) of the wastewater was determined using theobservations made at 20°C.
In chapter 5, the treatability of centrifuge latexconcentration effluent imi a waste stabilisation pond hasbeen discussed. The possibility of treating the wastewateralone and in admixture with sewage in the proportions of1:1, 1:2, 1:3, 1:4 and 1:5 was explored in an experimentalpond. The pattern of algal succession in the pond was alsostudied.
Qhapter 6 deals with the treatability of effluentsfrom a centrifuge latex concentration unit in a laboratoryscale upflow anaerobic contact filter. The effectivenessof the filter was evaluated in terms of COD removal, BODremoval and ammoniacal nitrogen removal at varying organic

37
loadings. Based on the experimental results, kineticparameters were estimated with respect to substrateremoval, microorganism growth and gas production.
In chapter 7, the results and conclusions of thestudy are summarised.

38
REFERENCES
Radhakrishna Pillay, P.N., (Ed.), Handbook of NaturalRubber Production India, The Rubber Research Institute ofIndia (1980).
Bateman, L. (Ed.), The Chemistry and Physics of Rubberlike Substances, Maclaren & Sons Ltd., London (1963).
Archer, B.L., Proc. Nat. Rubb. Prod. Res. Ass. JubileeConf. Cambridge, Maclaren & Sons Ltd., London (1964).
Archer, B.L. and Cockbain, E.G., Biochem. J., 75, 236(1960).
Gorton, A.D.T. and Pillai, N.M., Plrs. Bull. Rubb. Res.Inst., Malaya, 105, 282 (1969).
Comprehensive Industry Document on Natural RubberProcessing Industries. Prepared by Kerala State PollutionControl Board for Central Pollution Control Board (1990).
Kothandaraman, R. and Balagopalan, M.K., Rubb. Board

H.
10.
11.
12.
13.
14.
15.
39
Ru1l., 13, 4| (1976).
Roberts, A.D. (Hd.), Natural Rubber Science andTechnology, Oxford University Press (1988).
Lowe, J.S., Trans. Instn. Rubb. Ind., 36, 225 (1960).
Angove, S.N., Trans. Instn. Rubb. Ind., 40, 251 (1964).
Angove, S.N., Trans. Instn. Rubb. Ind., 41, 136 (1965).
Rhodes, E.J., Rubb. Res. Inst. Malaya, 8, 324 (1956).
Metcalf and Eddy, Inc., Wastewater Engineering: Treatment,Disposal, Reuse, Tata McGraw Hill, New Delhi (1979).
Sawyer, C.N. and MC Carty, P.L., Chemistry forEnvironmental Engineering, 3rd ed., McGraw Hill, New York(1978).
Staffman, P.G. and Turner, J.S., J. Fluid Mech., 1, 16(1956).

16.
17
18.
19.
20.
21.
22.
23.
40
Mc Carty, P.L., Public Works, 95 (1964).
Schroeder, E.D., Water and Wastewater Treatment, McGrawHill, New York (1977).
Ramalho, R.S., Introduction to Waste Water TreatmentProcesses, Academic Press, New York (1977).
Moore, E.w., Thomas, H.A. and Snow, W.B-, Sewage Ind.Wastes, 22 (10) (1950)
Standard Methods for the Examination of Water and WasteWater, 16th ed., American Public Health Association(1985).
Task Group Report, J. Am. Water Works Assoc., 59, 344(l967).(not in original).
Fair, G.M., Geyer, T.C. and Okun, D.A., Water and WasteWater Engineering, Vol.11, John Wiley & Sons (1984).
Eckenfelder Jr., W.W., Industrial Water Pollution Control,Mdsraw Hill, New York (1966).

41
24. Mara, D.D., Bacteriology for Sanitary Engineers, ChurchillLivingston, Edinburg (1974).
25. Kittrell, F.W. and Furfari, S.A., J. Water Poll. ControlFed., 35(l1) 1361 (1963).
26. Muthurajah, R.N., John, C.K. and Henry Lee, Proc. RRIM,Planters Conf., 402 (l973).
27. Ibrahim, A., Lee, H., Ponniah, C.D., Pushparajah, E., Rao,B.S., John, C.K., Singh, M.M. and Sung, C.P., Studies onEffluents from Rubber Processing Factories in Malaysia,Rubber Research Institute of Malaysia (1974).
28. Ponniah, C.D., Chick, N.H. and Seow, C.M., Proc. Inter.Rubb. Conf., Kuala Lumpur, 367 (1975).
29. Gadkari, S.K., Aboo, K.M., Badrinath, S.D., Kothandaraman,
V., Deshpande, V.P. and Kaul, S.N., IAWPC Tech. Annual,13, 41 (1986).
30. Jacob Mathew, Kothandaraman, R., Kochuthressiamma Joseph

31.
32.
33.
34.
35.
36.
37.
42
and Jayaratnam, K., IAWPC Tech. Annual, 13, 36 (1986).
Besselviere, E. and Schwartz, Treatment of IndustrialWastes, McGraw Hill Book Co. (1975).
The Environment (Protection) Act, 1986 and Rules.
Ponniah, C.D., Proc. Agro—Ind. Wastes Symp, Kuala Lumpur(1975).
Ponniah, C.D., John, C.K. and Lee, H., RRIM PlantersConf., Kuala Lumpur (1976).
Arceivala, S.J., Lakshminarayana, J.S.S., Algarsamy, S.R.ami Sastry, C.A., Design, Construction and Operation of
CPHERI, Nagpur (1969).Waste Stabilization Ponds in India,
Industrial Safety & Pollution Control Handbook, Associate(Data) Publishers Pvt. Ltd., Secunderabad (1991).
Kothandaraman, V., Aboo, K-M- and Sastry, C.A., Indian J.Environ. H1th., 23(2), 123 ( 1981).

43
38. John, C.K., Ponniah, C.D., Lee, H. and Ibrahim, A., Proc.Rubb. Res. Inst., Malaysia P1rs' Conf., Kuala Lumpur(1974).

Chapter 2
EFFLUENT CHARACTERISTICS AND TREATMENT WITH
METAL COAGULANTS
Part A: EFFLUENT CHARACTERISTICS
2A.1 INTRODUCTION
During the processing of natural rubber latex,water is always required in varying quantities (about 20-39litres/kg drc) for washing, cleaning, dilution etc. Thefield latex itself contains about 60% water. All theseconstitute the effluent discharged from a rubber processingunit. The effluent thus consists of process water,uncoagulated latex and significant amount of non—rubberswhich include proteins, sugars, lipids, carotenoids andorganic and inorganic salts which originate from the latex(1). These constituents are excellent substrates for theproliferation of microorganisms generating high BOD andobjectionable odour.
A thorough knowledge of the physico—chemicalcharacteristics of wastewaters is necessary in the designand operation of treatment plants. In the present study,
44

45
an attempt has been made to evaluate the characteristics ofeffluents discharged from a centrifuge latex concentrationunit which has the highest pollution potential among thevarious methods of rubber processing. The characteristicsof the combined effluent and the individual characteristicsof the effluents from the different sections of the unitwere determined. Correlations were developed between thevarious parameters representing organic matter for thecombined effluent.
2A.2 MATERIALS AND METHODS
The effluent samples used for the study werecollected from a centrifuge latex concentration unit inKottayam District of Central Kerala. The sources ofeffluents from a centrifuging unit are shown in Fig.2A.l.
In centrifuging process, the field latexcontaining 30-40 per cent nkberis mmnnfimed and split intolatex Concentrate containing 50-60 per cent rubber and skimlatex containing 5-10 per cent rubber. High speedcentrifuges are used in this process. The concentratedlatex is stored in drums and marketed. The skim latex,which contains about 0.8 per cent ammonia, is coagulated

46
I" I FII .l) |.}\'l'l‘IX.".l-I'l"I'|. I NH
'l‘I\NK.‘§
(Z|‘IN'l'IH l'"l|(‘.l3Z
(I()N(?FIN'I'l-U\'['l'-ll) WI\SHl.N(}Fo ITHUM SIK IMl..I\'lT!ZX |)HUMS,D()Wl.S F. 'I'I\NKS L.A'l'|‘2)(
crummm L1-|=:F2l?'l=‘l.lH=IN'l'
I‘ZI7|7|.lll‘IN'l' UK IM x“-FIIHJM 5;“ [M ‘LA-I-|:;y_
"'"""" — J i;,—,i..l_i;i::'r3;;:" (.'()A(:Hl.I\‘l'H)l‘l ._.-____.._ WI'|'l| u.I._.-m,‘L.” 3. «-n/u:m.r\r-1
F'[G.2l\.1 SOURCES 0|“ I-".F‘FI.U|?‘.N'l'S IN A (.'l-‘.N',l'RIl-"U(‘.l‘2 l.l'\’I'|3X(,‘()NCFIN'l'RI\'I.‘.l'ON UN1'.l.‘

47
with sulphuric acid to recover rubber. The skim serum goesas effluent. Water is required in the process for cleaningthe latex storagetanks once a week, washing the barrels,washing the bowls of the centrifuging machine twice in ashift and for coagulation of skim latex. The waterrequirement based on 1 kg of dry rubber is in the range of10-15 litres. All the water used in the process comes outas effluent apart from the skim serum.
The washings from the bowls of centrifuges anddrums and skim serum effluent constitute two differentstreams of effluent. They are collected in a tank and thisforms the combined effluent. Samples of washings fromcentrifuges and skim serum were collected separately ondifferent occasions for the study. Samples of the combinedeffluent were also collected on different occasions. Theflow rate of the effluent streams was recorded at the timeof sampling.
The effluent samples were analysed using thestandard methods (2) for the following parameters.

48
1. pH2. Turbidity3. Total solids4. Dissolved solids5. Suspended solids6. Chemical Oxygen Demand (COD)
7. Biochemical Oxygen Demand (BOD)
8. Total kjeldahl nitrogen9. Ammoniacal nitrogen and10. Total organic carbon
2A.3 RESULTS AND DISCUSSION
The range of variations in the physico—chemicalcharacteristics of wastewaters are shown in Table 2A.l and2A.2. The values for probability of occurance of SO and 90per cent of time as suggested by the Handbook forMonitoring Industrial wastewater and also shown in thetables (3). It is apparent from Table 2A.l and 2A.2 thatthe range of values in most cases, varies so much that togive minimum and maximum values for the items analysed maynot give sufficient data for designing a wastewatertreatment plant. The best possible solution in such casesis to represent these values as 50 and 90 per cent of times

PHYSICO—CHEMICAL CHARACTERTSTICS OF CENTRTFUGE
49
TABLE 2A.1
CONCENTRATION WASTEWATER (COMBINED EFFLUENT)
LATEX
PercentageParameter Minimum Maximum Average occurance50% 90%
PH 2.9 4.3 3.9 4.0 4.35Turbidity, NTU 490 2100 1140 1040 2020Total solids, mg/1 4565 17280 11190 11600 16800Dissolved solids, mg/1 2640 12220 8520 8400 12000Suspended solids, mg/1 1790 6140 2840 2600 6000COD, mg/1 1170 10700 5630 5590 10370BOD, mg/1 780 5680 3240 3120 5270Total kjeldahl nitrogen,mg/1 1450 1880 1590 1450 1725Ammoniacal nitrogen,mg/1 570 750 650 610 720Total organic carbon,mg/1 290 2550 1375 1300 2490Flow (m3/day) 36 40 38 32 38

)0
E om - - m., 1. f.amt-_E .J0I.haomw oflw onw oflm omw oom oqfl omfl omm oom m\mE \cwmonuac fimumficoee»
omflfl omma omwa omfl- omm omw oom oww M wtcmwnuun: Hnmvmmmv nmnon
umwm ommm omwm oomm ohm” ommm oovm mmmm oonm oomm me ‘mom
ammo- oqmm omnm oomom oomm oomoa oomm oomm no an oomm -\mE ‘nonomnm oawm omwm ommm ooh oonmfl omnm ommm momma oovm me \moflHom omucwmmJm
ommmu uflwoq oamofl omflwfl oomn onmm owmm oawm omwm oom -\we \muHaom vw>Hommunuomom omvwfl mnmwfi oomom oovm oomna ooflmfl mmmma oowmfl oomm M\oe .mofiHom H nunuoom ofimfl ooma ooflm oom oomv ommm mwmm oomw oomm Apazv mufioflnunmm.m o.m H.m v.m m.m o.» m.o H.» No.“ o.» :m
wom mom mom mom
wucmuqhuo - wuqmunbuo - ‘w’, mam -m mumucmuumm wumum>m eueaxmz eueacaz momucmuumm mumuw>m EEHxM£ EEHCfiE s u x n
xammm xHxm mwomHmazmu zomm ozHmm«z
HHZD ozHw mkmazmu xma«g
mo mzoHuumm msoHmm» mmm zomm mmma4xmam42 mo muHamHmmau«m4mu gnu zmmu-ouHmwmm
N.<~ mqm¢n

that the values are equal to or less than 'X' where ‘X’ isthe observed values (4). Ekenfelder and O'Cooner (5)suggested using 50 per cent of physico—chemica] values forprocess design criteria and 90 and 99 per cent values forthe estimation of hydraulic load in the design of a waste—water treatment plant.
The general trend observed for various parametersin the wastewater samples is discussed below:
a) Flow RateThe volume of effluent discharged varied between
36 and 40 m3/day with an average of 38 m3/day. While thewashings from centrifuges constituted a volume of 15 m3/dayon average, the skim serum effluent was in the range of 2530 m3/day with an average of 27 m3/day. Hence it can beseen that the major portion of the effluents from a latexcentrifuging unit originates from the skim latexcoagulation section.
b) pH ValuesThe pH values of the combined effluent varied
between 2.9 and 4.3 with an average value of 3.9. This

shows the highly acidic nature of the effluent. The wastewaters from the centrifuging section and skim latexcoagulation section showed average pH values of 7.1 and 3.lrespectively. It is apparent that the skim serum effluentis responsible for the highly acidic nature of the combinedeffluent. This can be attributed to the fact thatsulphuric acid is used for the coagulation of skim latex.
c) SolidsThe solids content of the wastewater samples is
expressed in terms of turbidity, total solids, dissolvedsolids and suspended solids.
The turbidity values of the combined effluentvaried between 490 and 2100 mg/l with an average value of1140 mg/l. The average turbidity values of the effluentsfrom centrifuging section and skim latex coagulationsection were 3375 mg/l and 1300 mg/l respectively. It isevident that the turbidity of washings from thecentrifuging section is higher than that of skim serumeffluent. Turbidity is an expression of the opticalproperty that causes light to be scattered and absorbedrather than in straight lines through the sample (6). All

Ln Lu
suspended matter in the wastewater samples contribute toturbidity regardless of particle size. The washings fromthe bowls of centrifuges and drums may contain considerableamount of suspended matter and this contributes to highturbidity values.
The total solids content of the combined effluentwas found to vary between 4565 mg/l and 17280 mg/1 with anaverage value of 11190 mg/l. The suspended solids presentin the wastewater varied between l79O mg/l and 6140 mg/lwhereas the concentration of dissolved solids in thecombined wastewater varied between 2640 mg/l and 12220mg/l. This shows that the effluents from a latexconcentration unit contain high suspended and dissolvedsolids. These figures show that suspended solids rangefrom 9.0 to 42.2 per cent of the total solids and majorfraction of solids are present in the dissolved form whichmay vary from 57.8 to 91.0 per cent of total solids. Thepresence of suspended solids indicates that the wastewaterhas high organic matter (4).
Among the effluents from the two sections of thecentrifuging unit, the effluents from the centrifugingsection showed higher values of suspended solids contentwhich varied from 6400 mg/l to 12900 mg/1. But the skimserum effluent had a higher dissolved solids content, the

54
average value of which was 10810 mg/I.
d) NitrogenThe total kjeldahl nitrogen (TKN) content and
ammoniacal nitrogen content of the combined effluentsamples and effluent samples from the two sections of thecentrifuging unit did not show wide fluctuation in thevalues. The TKN content of the combined effluent variedbetween 1450 mg/l and 1880 mg/l with an average value of1590 mg/l whereas the ammonical nitrogen content variedbetween 570 and 750 mg/1.
The total kjeldahl nitrogen includes ammonia andorganic nitrogen but does not include nitrite and nitratenitrogen. So the TKN content monitored in the samplesinclude the ammonical nitrogen and organic nitrogen presentin the proteinaceous matter which is a constituent ofnatural rubber latex. The presence of ammoniacal nitrogenin the effluent is attributed to the fact that the fieldlatex is preserved with ammonia to prevent coagulation andmicrobial action. From Table 2A.2, it is evident that theammoniacal nitrogen content of the effluents from the skimlatex coagulation section is higher than that of washings

55
from the centrifuge. While the ammoniacal nitrogen contentof skim serum varied between 430 mg/l and 510 mg/1, thevalue varied between 100 mg/l and 720 mg/l for the washingsof centrifuging section. The skim which is coagulated withsulphuric acid contains about 0.8 per cent ammonia and thisshould be the reason for the higher ammoniacal nitrogencontent of the skim serum effluent.
a) Organic MatterThe organic matter in a wastewater is estimated in
the form of COD, BOD and Total Organic Carbon (TOC).
The variations in the values of COD, BOD and TOC
are given in Table 2A.l and 2A.2. The COD, BOD and TOCvalues of the combined effluent were in the range of 117010700 mg/1, 780-5680 mg/l and 290-2550 mg/1, respectively.These figures show that the wastewaters from a latexcentrifuging unit is highly organic in nature. The COD andBOD values measured for the effluents from the twodifferent sections of the plant show that the organiccontent of the two effluent streams are more or less thesame.

56
The relationship between COD and BOD is shown inFig.2A.2. The co—efficient 'b' (intercept) and 'm' (slope)were computed by the method of least square (7). Therelationship between the COD (x) and BOD (y) of thecombined effluent from a centrifuge latex concentrationunit can be represented by the equation x = l.643y + 310.
The relationship between COD and organic carbonis shown in Fig.2A.3. The intercept and slope values are29 and 0.24 in the case of organic carbon and COD.Fig.2A.3 shows that the intercept lies on the axis of totalorganic carbon indicating thereby the presence of organicsubstances that are not oxidised by dichromate in the CODtest (ie., they do not exert COD). Ford (8) observed thata plot between COD and organic carbon would not passnecessirily through the origin and intercept would lieeither on the axis of COD or organic carbon depending onthe nature of wastewater.
The ratio between COD and organic carbon for thecombined effluent samples is in the range of 3.95-4.20 witha mean value of 4.07. The stoichiometric COD/TOC ratio ofa wastewater is the approximate molecular ratio of oxygen

57
n L_
x — l.643y + 310
6 ...
Emv
I
©I—I>1
r-I\3. 4 _Q0U3
2 ._
‘ I I 1 I I I7 4 5 R I0 I?Col), mg/l_x|()—~I( x)
F'IG.2I\.2 REl.I\'J.'TONSHIP |':1F."1'WFIF2N COD AND ROI).

coo, mg/1x1o'3(
58
1 r I’ r r a400
FIG.2A.3
2000 ?40Omg/l(x)
800 1200 1600TOTAL ORGANIC CARBON:
RELATIONSHIP BETWEEN TOG AND COD.

59
to carbon of 32:12 = 2.66 (8). Theoretically, the ratiolimits would range from zero when the organic material isresistant to dichromate oxidation to 5.33 for methane (4).It is, therefore, evident from the relationship between CODand total organic carbon that if an analyst estimatesorganic carbon, he can find out COD roughly using thecorrelation developed in Fig.2A.3.
Although good correlation has been obtainedbetween BOD and TOC for sewage, it has been difficult tocorrelate BOD and TOC for industrial wastewater (4). Anattempt has been made in Fig.2A.4 to develop a correlationbetween BOD and TOC for the combined effluent from a latex
centrifuging unit. It is seen that the line fitted byleast square method does not include most of theexperimental data. This is reasonable, because thereported BOD yield for industrial wastewater are oftenerratic and highly dependant on seed acclimatization,temperature, pH and concentration of toxic substances (4).A 5-day BOD—TOC correlation for sewage has been reported by
several investigators. While ratio of 1.87 has beenreported by Warhmann (4), a ratio in the range of 1.35 to2.62 has been reported by Mohlman and Edwards (9). The
60
8 _
6 I0
>1
MI0«-4
>-.‘
r-I\U‘E\4-~
Qom
2 L—
I ‘ I IL I I I400 L300 1200 .1600 2000 2400
TOTAL ORGANIC CARBON, mg/I(x)
l"I(}.2I\.4 RE2|.I\'.l‘I'ONSlllP Bl:3'l'WI:2E2N 'I‘()C ANI) I301).

61
calculated relationship between five day BOD and TOC is,
BOD5 O2 32me C = 12(o.9o)(o.77) _ 1.85
where,
(a) the ultimate BOD will exert approximately 90 per centof the theoretical oxygen demand and
(b) the five-day BOD is 77 per cent of the ultimate BOD fordomestic waste (4).
In view of the above mentioned facts, it is notpossible to develop good correlation between BOD and TOC oflatex centrifuging wastewater, but the conjunctive use ofthe three parameters, COD, BOD and TOC, can provide manyanswers when quantitatively analysing the effluents from alatex concentration unit.
f) Pollution LoadThe volume of wastewater discharged from a typical
latex centrifuging unit is about 40 m3/day. This is almostthe same as the volume of water used for various purposeslike washing the bowls of the centrifuge and drums in thecentrifuging process. The average BOD concentration of the

effluent is
62
3200 mg/l. Thus the pollution load from anatural rubber latex centrifuging unit is about 128 kg BODper day.
2A.4 CONCLUSIONS
The effluents discharged from a latex concentrationtnit are strongly acidic in nature. The average pHvalue of the effluent is 3.9. The main source of acidiceffluents is the skim latex coagulation section, whichdischarges serum effluent having an average pH value of3.1.
The 50 percent and 90 percent probability values forBOD, COD, suspended solids, total kjeldahl nitrogen andmmmniacal nitrogen of the effluent samples weredetermined.
The suspended solids content of the wastewaters rangefrom 9.0 to 42.2 percent of the total solids and majorportion of solids are present in the dissolved formwhich may vary from 57.8 to 91.0 percent of totalsolids.

63
4. The relationship between COD and total organic carbonindicates the presence of organic carbon which is notoxidised by dichromate during COD estimation.
5. The pollution load from a typical rubber latexcentrifuging unit is about 128 kg BOD per day.

64
REFERENCES
Kumaran, M.G., Rubb. Board Bull., 24, 21 (1987).
Standard Methods for the Examination of water and WasteWater, American Public Health Association, 16th edn.(1985).
Handbook for Monitoring Industrial Wastewater, U.S.Environmental Protection Agency, Technology Transfer, 8-9(1973).
Saxena, K.L., Indian J. Environ. Hlth., 29, 2, 85 (1986).
Eckenfelder, Jr. W.W. and O'Conner, D.J., Biological WasteTreatment, Pergamon Press, New York (1961).
Staffman, P.G. and Turnur, J.S., Jour. Fluid Mech., l, 1,16 (1956).
Metcalf and Eddy Inc, Waste—water Engineering: Treatment,Disposal, Reuse, Tata McGraw Hill, New Delhi (1978).

65
8. Ford, D.L., Application of Total Carbon Analyser forIndustrial Wastewater Evaluation, 23rd Industrial WasteConference, p.989 (1968).
9. Mohlman, F.W. and Edwards, G.P., Ind. Eng. Chem. Anal., 3,119 (1931).

66
Part B: TREATMENT WITH METAL COAGULANTS
2B.1 INTRODUCTION
The coagulation process is widely employed in thetreatment of water and wastewater. Colloidal and suspendedparticles, organic matter imparting turbidity and colour,and bacterial and algal cells are removed efficiently by agroup of chemicals known as 'coagulants'. Coagulation maybe defined as the process in which chemicals are added toan aqueous system to create rapidly settling aggregates outof colloidal matter present (1). Flocculation is thesecond stage in the formation of these aggregates, which isachieved by gentle and prolonged mixing.
It is well known that when particles in liquidsuspensions are in the low or sub—micron range they eitherremain in suspension or settle too slowly for subsequentfiltration. Usually appreciable settling rates cannot beachieved unless individual primary particles are aggregatedinto larger units (2). Aggregation may result from one ormore of the following mechanisms (3):
(a) Charge neutralisation by double layer

67
(b) The bridging action by added materials of highmolecular weight.
(c) Entrapment of smaller particles within a loose fibrousstructure of a floc formed.
2B.1.2 THEORY OF COAGULATION
Colloidal dispersions in water consist of discreteparticles held in suspension by their extremely small size(l—200 nm), state of hydration (chemical combination withwater), and surface electric charge. Surface charge developsmost commonly through preferential adsorption, ionizationand isomorphous replacement (4). If the particles incolloidal dispersion are to be aggregated into largerparticles with enough mass to settle easily, their stabilitymust be overcome.
There are two types of colloids — hydrophilic andhydrophobic. Hydrophilic colloids are readily dispersed inwater, and their stability (lack of tendency to agglomerate)depends upon a marked affinity for water rather than uponthe slight negative charge that they possess. Hydrophobic

68
colloids have no affinity for water and owe their stabilityto the electric charge they possess. Metal oxide colloids,most of which are positively charged are examples ofhydrophobic sols (colloidal dispersion in a liquid). Acharge on the colloid is gained by absorbing positive ionsfrom the water solution (5). Electrostatic repulsion betweenthe charged colloidal particles produces a stable sol.
The concept of zeta potential is derived from thediffuse double-layer theory applied to hydrophobic colloids(Fig.2B.l). A fixed covering of positive ions is attractedto the negatively charged particle by electrostaticattraction. This stationary zone of positive ions, isreferred to as the stern layer, which is surrounded by amovable, diffuse layer of counterions. The concentration ofthese positive ions in the diffuse zone decreases as itextends into the surrounding bulk of electroneutralsolution. Zeta potential is the magnitude of the charge atthe surface of shear. The boundary surface between the fixedion layer and the solution serves as a shear plane when theparticle undergoes movement relative to the solution. Themagnitude of zeta potential can be estimated fromelectrophoretic measurement of particle mobility in an

69
Hull: 1)!wlnliun
Hwhk\__ _ |:<H:'llli:|'' ‘W 'illll|\|lI|(|ill!'.I ' lvillliflt‘' /('l:| |\l‘,('.‘IlIl.'l|
_ |)iH'u<:- 'Zl\’(‘lnl u'()l|ll|'.'1iU|I
|'ixm| '£I\'l‘l Ir» .1 usml" inll\'
l?'_lG.2D.1 CONCI."Z[".l' OF ZF}'1‘l'\ I-’()'l'EN'[‘.[I\L l)|."JRfVl3l) FROM 'l‘lll't‘.DJ,F'F‘USE DOUBLE-LI\YER TIIFJORY.

70
electric field (6).
A colloidal suspension is said to be stable whenthe dispersion shows little or no tendency to aggregate.The repulsive force of the charged double layer dispersesparticles and prevents aggregation, thus particles with ahigh zeta potential produce a stable sol. Factors tendingto destabilize a sol are van der Waals' forces of attractionand Brownian movement (7). Van der Waals' forces are themolecular cohesive forces of attraction that increase inintensity as particles approach each other. These forcesare negligible when the particles are slightly separated butbecome dominant when particles contact. Brownian movementis the random motion of colloids caused by their bombardmentby molecules of the dispersion medium. This movement has adestabilising effect on a sol because aggregation mayresult.
Destabilization of hydrophobic colloids can beaccomplished by adding electrolytes to the solution.Counterions of the electrolyte suppress the double layercharge of the colloids sufficiently and lower the zetapotential permitting the particles to contact closely (8).

71
Upon meeting, van der Waals' forces of attraction becomedominant and aggregation results. Electrolytes found to bemost effective are multivalent ions of opposite charge tothat of the colloidal particles. As counter ions in aqueoussystems are mostly positively charged, destabilization isdone in practice by the use of aluminium and iron salts.Highly charged hydrolysis products of these metal saltsreduce the repulsive forces between the colloids bycompressing the double—layer charge, bringing oncoagulation. Hydrolysed metal ions are also adsorbed on thecolloids, creating bridges between the particles.
Colloids in domestic wastes or inorganic wastesare hydrophillic (9). Their affinity for water arises from
the presence of polar groups like -OH, —COOH, and —NH4 onthe particle surface. These groups are water soluble. Thusthey acquire a sheath of water firmly round the particle.The primary charge on hydrophillic colloids arises from theionisation of the chemical groups present at the surface ofthe particles. Extent to which these surface groups ionize,determines the charge; and therefore, charge is pH dependent(10). Most of the particles in wastewaters are stabilisedby negative charges. Therefore, salts of polyvalent cations

72
3+ 3+ 2+Isuch as Al Fe , Fe and Ca2+ are used as coagulants in
conformity with the Schulze Hardy rule (11).
2B.l.2 HYDROLYSING METAL SALTS
When salts of metals like aluminium or iron areadded to water or wastewater, they hydrolyse into polyvalent
3+ which reduce the zeta potential andcations Al3+ and Fefacilitate coagulation. In the past it was thought thatfree Al3+ and Fe3+ were responsible for the effects observedduring particle aggregation; however, it is now known thattheir complex hydrolysis products are responsible (12,13).
A typical hypothetical model proposed by Stumm(14) for Al3+ is shown below:
[Al(H2O)6]3+ OH" [A1(H2O)5OH]++ OH— [Al(H2O)4(OH)2]+
OH_ /063+ 4+
[A16(OH)15l (aq) or [A18(0H)2O] (aq).I IOH
[Al(0H)3(H2O)3] (s)
OH
[A1(oH)4(H2o2]‘
73
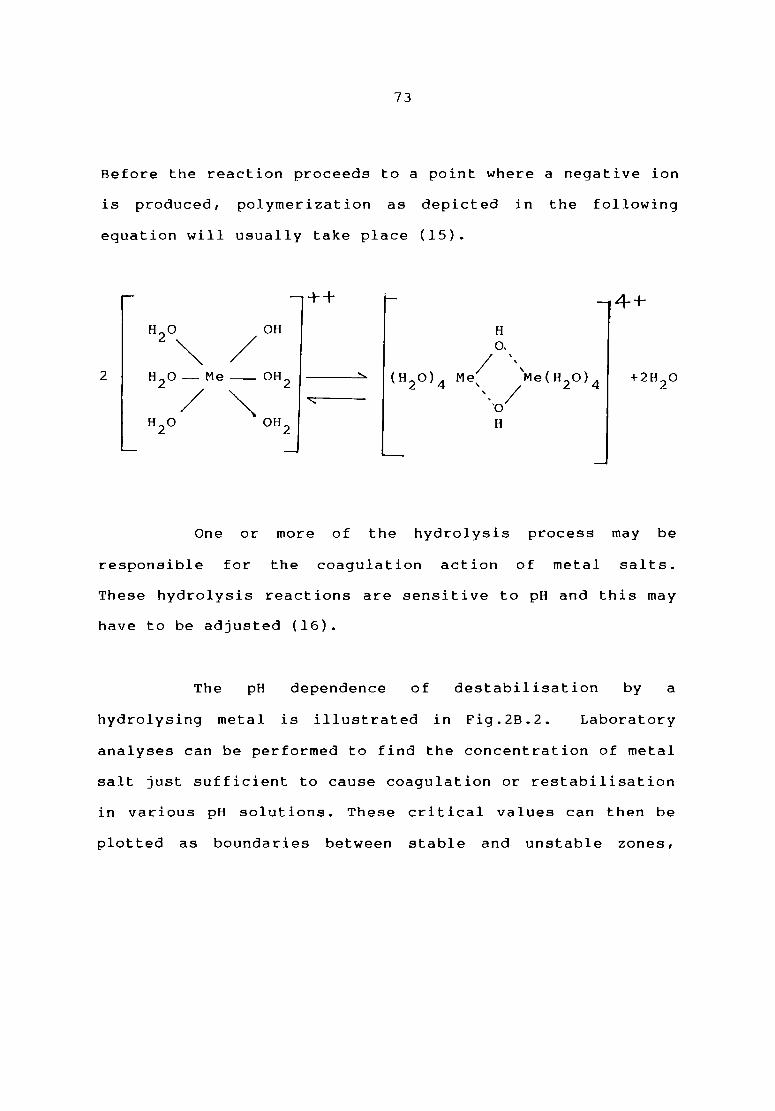
Before the reaction proceeds to a point where a negative ionis produced, polymerization as depicted in the followingequation will usually take place (15).++ __V [4+
H2O\ / OH 22 H20 — Me — OH2 —> (H2o)4 Me\\ Me(H2O)4 +2H2O/ \ VT‘ ‘_O/H20 OH2 H
One or more of the hydrolysis process may beresponsible for the coagulation action of metal salts.These hydrolysis reactions are sensitive to pH and this mayhave to be adjusted (16).
The pH dependence of destabilisation by ahydrolysing metal is illustrated in Fig.2B.2. Laboratoryanalyses can be performed to find the concentration of metalsalt just sufficient to cause coagulation or restabilisationin various pH solutions. These critical values can then beplotted as boundaries between stable and unstable zones,

74
FIG.2B.2 SCHEMATIC DIAGRAM OF COAGULANT DOSAGE—pHDOMAINS FOR COAGULATION AND RESTABILIZATION

75
thus establishing domains of stability (17). Anuncoagulated dispersion zone indicates that insufficientcoagulant has been applied and destabilization does notoccur. A restabilization zone is generally attributed tocharge reversal at higher concentrations of coagulant byadsorption of coagulant ions onto the surface of colloids.The coagulation region defines the conditions of pH andcoagulant concentrations which produce rapid clarification.Turbidity removal in water treatment practice isaccomplished by applying the coagulant dosage within theregion where it is most efficient.
Stumm and O'Melia (13) has defined coagulation asa time—dependent process including the following reactionsteps:
1. hydrolysis of multivalent metal ions and subsequentpolymerisation to multinuclear hydrolysis species;
2. adsorption of hydrolysis species at the solid—solutioninterface to accomplish destabilisation of the colloid:
3. aggregation of destabilised particles by interparticlebridging involving particle transport and chemicalinteractions:

76
4. aggregation of destabilised particles by particletransport and van der Waals' forces:
5. "aging" of flocs, accompanied by chemical changes in thestructure of meta1—OH-metal linkages, concurrent changein floc sorbability and in extent of floc hydration: and
6. precipitation of metal hydroxide.
Some of these steps occur sequentially; someoverlap (steps 1 and 2), and several may occur concurrentlyunder certain conditions (steps 3 and 4, or step (3 withsteps 1-5).
Several studies have been reported on the use ofmetal coagulants in the treatment of industrial wastewaters.Painter (18) has shown that by chemical precipitation alone,the suspended solids and BOD of farnawastewaters can bereduced by 90 per cent and 70 per cent respectively. Thestudy revealed that the coagulant demand depends oncharacteristics of wastewater such as gfli, solids content,phosphates etc. Loehr (19) reported that the reduction of

77
BOD, COD and suspended solids of agricultural wastewaters isa function of the amount and type of chemical coagulantadded, pH of the effluent and type of the wastewater. Smith(20) has shown that most of the suspended solids and part ofthe BOD are removed by the addition of alum or ferricchloride with or without polyelectrolyte. Weber (21) statesthat coagulation of wastewater can be accomplished by any ofthe water coagulants including lime, iron and aluminiumsalts and synthetic polymers. The choice is to be made onthe basis of suitability for a particular waste,availability, cost and sludge treatment and disposalconsiderations.
Several coagulants like alum, ferric chloride andferrous sulphate have been tried for the chemicalcoagulation of tannery wastewaters (22). Ferrous sulphateis reported to be the best coagulant for the removal ofsulphides and may be used for the effective removal ofcolour, BOD and suspended solids from chrome—tan wastes.Kothandaraman et al. (23) reported that calcium chloride isvery effective in the treatment of wool—scouring wastes fromtextile mills. Bhole and Dhabadgaonkar (24) evaluated theefficiency of a number of coagulants to remove colour and

78
COD of textile mill waste. Aluminium chloride was found to
be the best coagulant for the removal of both colour andCOD.
Rao and Sastry (25) reported that severalcoagulants like lime and Nirmali seed extract can beeffectively used for the clarification of coal washerywastes. Wastewaters from antibiotic manufacturing units canneither be clarified in settling tanks nor can be chemicallycoagulated to reduce BOD (26). The poor response of wasteto coagulation is due to the fact that most of thesubstances contributing to BOD appear in solution. Thakuret al. (27) studied the chemical treatment of sewage usingalum, ferric chloride, ferrous sulphate and lime.
No systematic study has been reported inliterature on the use of chemical coagulants in thetreatment of wastewaters from natural rubber processingunits. The aim of the present study is to evaluate theeffectiveness of nine metal coagulants viz., alum, aluminiumsulphate, ferrous sulphate, ferric sulphate, ferricchloride, ferrous chloride, aluminium chloride, lime andmagnesium chloride, in the treatment of effluents from a

79
centrifuge latex concentration unit. The effectiveness ofthe coagulants was assessed in terms of COD reduction,turbidity removal and ammoniacal nitrogen removal. Theinfluence of pH on coagulation action and sludge settlingcharacteristics were also studied.
2B.2 MATERIALS AND METHODS
The coagulants used for the study were ofcommercial grade. The composition of the coagulants were asfollows:
1. Potassium alum, AlK(SO4)2.l2H2O containing 0.01 per centiron.
2. Aluminium sulphate, Al2(SO4)3.l4H2O with a productstrength of 17 per cent as A1203.
3. Ferrous sulphate, FeSO4.7H2O having a strength of 55 percent FeSO4.
4. Ferric sulphate, Fe2(SO4)3.3H2O.5. Ferric chloride, FeCl3.6. Ferrous chloride, FeCl2.7. Aluminium chloride, AlCl3.8. Lime, Ca(OH)2.9. Magnesium chloride, MgCl2.

80
The composite wastewater samples used for thestudy were collected from a latex concentration unitsituated in Kottayam district of Central Kerala. Thewastewater was analysed for pH, turbidity, total solids,dissolved solids, suspended solids, COD, BOD, and ammoniacal
nitrogen as per standard methods (28). Five samplescollected from the composite effluent tank at five differenttimes were selected.
The efficiency of the various coagulants wascompared from their ability to reduce turbidity, COD andammoniacal nitrogen of the effluent samples. Coagulationexperiments were carried out in a Jar test apparatusprovided with four stirrers having speed regulator.Required dosages of the coagulants were added to thewastewater samples, one litre each taken in beakers. Thecontents were stirred thoroughly at 100 rpm for 1 minute andthen at a speed of 30 rpm for 15 minutes for flocculation.The contents of the beakers were then allowed to settle for30 minutes. The supernatants were siphoned off for theestimation of pH, turbidity, COD and ammoniacal nitrogen.

81
The optimum pH for the effective coagulation inthe case of each of the coagulants was determined using theJar test apparatus. The pH of the samples were brought tooptimum levels by adding sodium hydroxide before carryingout the coagulation studies. Four different dosages of thecoagulants viz., 200, 300, 400 and 500 mg/1 were tried. Thedosage of lime depended on the pH required. Theeffectiveness of lime at pH values of 9, 10, 10.5 and 11 wasstudied.
The sludge settling characteristics were studiedby adding optimum dosage of coagulant and adjusting the pHto the optimum value of the effluent samples taken in a 100ml measuring cylinder. The contents in the measuringcylinder were mixed well for 3 to 4 minutes. The rate ofsettling of the floc formed was measured by noting theposition of sludge at regular interval until furthersettling was negligible.
2B.3. RESULTS AND DISCUSSION
The experiments were carried out using fiveeffluent samples. The effluent characteristics are given inTable 2B.l.

82
TABLE 2B.l
EFFLUENT CHARACTERISTICS
Sample Sample Sample Sample SampleParameter 1 2 3 4 5pH 4.3 3.9 4.0 2.9 4.2Turbidity; NTU 490 2100 1230 680 1590COD, mg/1 1170 8080 5790 10700 3420Ammoniacalnitrogen, mg/1 570 750 590 630 650
83
(a) Effect of pH on coagulation efficiency
To determine the optimum pH of coagulation for thenine metal coagulants studied, the pH of the latexconcentration wastewater samples were varied from 4 to 10.
Variation in pH was controlled by O.lN H2504 and 0.lN NaOH.The coagulation efficiency was estimated in terms of percentturbidity removal achieved at a coagulant dosage of300 mg/l.
1-AliFor alum, the maximum turbidity removal was
obtained at a pH of 6.5 as shown in Fig.2B.3. The turbidityremoval efficiency increased steadily on increasing the pHfrom 4 to 6.5. But on increasing the pH further, theefficiency of alum in turbidity removal was found to drop.The turbidity removal achieved for the sample having initialturbidity 680 NTU was higher than the removal efficienciesachieved for the sample with 2100 NTU for all the pH valuesexcept 7. Removal efficiencies of 43 and 44 per centrespectively were achieved for the initial turbidities of2100 NTU and 680 NTU at the optimum pH 6.5. But at pH value
of 7, the removal efficiencies were 40 per cent for 2100 NTUand 39 per cent for 680 NTU.

84
ofl
SD44 mo wuzmHuHmmm zoHa<qso<ou may Z0 mm mo aummmm
mm
m.mm.oflm
DB2 oweDB2 OOHN
wBHQHmmDH q<HBHzHNBHDHmmDH q<HHHZH
0
ONowom
NOILDDGQH xm1a1aunL LN3DH3d

85
2. Aluminium sulphate
The effect of pH on the coagulation efficiency ofaluminium sulphate is illustrated in Fig.2B.4. The optimumpH of aluminium sulphate for the coagulation of latexconcentration wastewaters was found to be 7.0. There was a
steady increase in the coagulation efficiency as the pH ofthe wastewater was increased from 4.0 to 7.0. But from a pHvalue of 7.5, there was a gradual reduction in the turbidityremoval efficiency. Upto a pH value of 7, the turbidityremoval for the initial turbidity of 680 NTU was higher thanthat for 2100 NTU. But subsequently the trend reversed.
3. Ferrous sulphate
The variation of the coagulation efficiency offerrous sulphate with pH is shown in Fig.2B.5. The optimumpH value of ferrous sulphate was found to be 8.5. In thecase of initial turbidity 2100 NTU, the removal efficiencyincreased from 10 per cent to 30 per cent as the pHincreased from 4.0 to 6.0. The rise in removal efficiencywas much slower thereafter. At a pH of 6.0, the removalefficiency was 30 per cent. This went up to 35 per cent asthe pH increased to 8.5. On further increasing the pH to

86
ma¢mmqsm zsHzHzsq< mo »uzmHuHmmm zoHa<qoo<oo mme ZO mm mo aummmm ¢.m~.oflm
mm
-4
_.
oazwomm
waHoHmmoa q<HBHzH ANsaz oofim »aHaHmmoa q<HHHzH mu
ONowom
NOILDDGQH KLIGIEHDL muaouaa

87
.ma<mmqom moommmm mo »uzmHoHmmm zoHa<qsu<ou may Z0
OH
mm
mm mo aommmm m.m~.oHm
4/®aDB2 ommDB2 ooam
\<\d\4Vmxoxxxo
waHoHmmoa q<HBHzH AmwaHoHmmaa q¢HHHzH Av
omowow
NOI.T.DnClFlH XJ.IClI 880.1. .T.N!?lDH3d

88
9.0, the removal efficiency dropped. The same pattern wasobserved for the initial turbidity of 680 NTU.
4. Ferric sulphate
From Fig.2B.6, it is observed that the optimum pHof ferric sulphate for the efficient coagulation of latexconcentration wastewaters is 6.5. At this pH, turbidityremoval efficiencies of 30 per cent and 29 per centrespectively were obtained for the initial turbidity valuesof 2100 NTU and 680 NTU. In the pH range between 6.0 and7.0, the removal efficiencies achieved were very close toeach other.
5. Ferric chlorideAs for ferric chloride, the effect of pH on
coagulation efficiency is shown in Fig.2B.7. The optimum pHvalue was found to be 8.0. At this pH, the removalefficiencies achieved were 38 per cent and 41 per centrespectively for the initial turbidity values of 680 NTU and2100 NTU: As the pH value increased from 4.0 to 8.0, therewas a steady increase in the turbidity removal efficiencies.

ma<mmqsm uammmm mo »uzmHuHmmm zoHe<qoo¢ou may zo mm mo eummmm m.m~.uHm
mm
89
6/
©\xm
@
DHZ omm
»aHaHmmoa q<HBHzH Am292 ooam »aHaHmm:e q<HBHzH mu
0N
O<2‘
NOILDDGQH KLIGIQHDL mmaouaa

90
moHmogmu uHmmmm mo mozmHuHmmm zoHa¢gao«ou may zo ma mo aummmm
OH
mm
h.mN.UHm
4%DB2 ommDB2 oofim
MBHQHmmDB A<HBHzHweHnHmmaa q<HBHzH
<|O
x@xxx
\
O(‘J
NOI.LC)D(l'3H MLIGI EUILL .LN3DH'Eldom

91
6. Ferrous chloride
The variation of the coagulation efficiency offerrous chloride with pH is shown in Fig.2B.8. The resultsobtained for the initial turbidity values, 2100 NTU and 680NTU were very close to each other. The optimum pH offerrous chloride for the effective coagulation of latexconcentration waste waters was found to be 7.5. From thecloseness of turbidity removal efficiencies obtained, the pHrange between 7.0 and 8.0 may be considered as effective forcoagulation.
7. Aluminium chloride
For aluminium chloride, the maximum turbidityremoval efficiency was obtained at a pH of 7.0 as shown inFig.2B.9. The removal efficiencies achieved for the twoeffluent samples tested were very close to each other. AtpH 7.0, a turbidity removal efficiency of 57 per cent wasobtained for the sample with initial turbidity, 2100 NTU:while the removal efficiency obtained for the sample withinitial turbidity 680 NTU was 54 per cent.

OH
maHmoqmo moommmm mo wuzmHuHmmm zoHa¢aou«oo mma ZO mm mo aommmm
mm
m.mN.uHm
92
DB2 omoDHZ ooam
waHoHmmse q4HaHzH Aw
waHoHmmsa
q¢HBHzH mu
omowom
NOI.I.Df)G'.ElH .K.'LI(lI EIHFLL .LN‘.ElC)HEId

93
maHmoqmu zoHzHzsa< mo wuzmHuHmmm zoHa¢qou<ou may zo ma mo aummmm
m.mm.uHm
mm
3 m m v N
_ _ ~ “ .
1 om
_\/.
@//@/
\
Q OW
ow @
/ \ 2.2 omm u E..EHmmB. .::..:zH Q0 PE 88 u rflfimmoa .2EHzH O
. om
NOILODGQH XLIGIHHDL LNED H36

94
8. Magnesium chloride
The effect of pH on the coagulation efficiency ofmagnesium chloride is illustrated in Fig.2B.lO. The maximumturbidity removal efficiency was achieved at a pH of 8.0.The turbidity removal efficiencies achieved for the twoeffluent samples tested at different pH values did not showmuch difference.
The optimum pH values for the effective action ofeach of the coagulants are listed in Table 2B.2.
(b) Effectiveness of coagulants in COD reduction. turbidityremoval and ammoniacal nitrogen removal
The effectiveness of the coagulants was assessedin terms of their ability to reduce COD, turbidity andammoniacal nitrogen from centrifuge latex concentrationwastewaters. Four coagulant dosages; 200 mg/1, 300 mg/1,400 mg/l and 500 mg/l of all the coagulants except lime weretried on each five effluent samples. For lime, theeffectiveness was assessed at pH values of 9, 10, 10.5 and11.0. The per cent COD reduction, turbidity removal andammoniacal nitrogen removal obtained for each of thecoagulants are tabulated in Tables 2 B.3 to 2B.ll.

95
OH
moHmoqmu
zsHmmzo<z mo wozmHuHmmm zOHH<ADO<OU mma ZO mm mo aummmm oH.mm.oHm
.j_j_j___ —fi
DB2 oweDB2 ooam
»aHoHmmoa q¢HBHzH Aw»aHoHmmba q<HBHzH mv
ONowom
NOILDDGQH XLIGIHHHL LNED Hfld

96
TABLE 2B.2
OPTIMUM pH FOR THE EFFECTIVE ACTION OF COAGULANTS
Sl.No. Coagulant Optimum pH
1. Alum 6.52. Aluminium sulphate 7.03. Ferrous sulphate 8.54. Ferric sulphate 6.55. Ferric chloride 8.06. Ferrous chloride 7.57. Aluminium chloride 7.08. Magnesium chloride 8.0

97
1. Alum
For alum, the maximum COD reduction ranging from
39 to 47 per cent was obtained with a dosage of 500 mg/1.The highest per cent COD reduction of 47 was Obtained for theraw effluent COD concentration of 10700 mg/1. The maximumper cent turbidity removal and ammoniacal nitrogen removalwere also obtained with the alum dosage of 500 mg/l. Whilethe maximum turbidity removal of 48 per cent was obtainedfor the effluent sample 2 having an initial turbidity of2100 NTU, the maximum ammoniacal nitrogen removal of 28 per
cent was also obtained for sample 2 which had an initialammoniacal nitrogen content of 750 mg/l.
2. Aluminium sulphate
In the case of aluminium sulphate, the optimumdosage for COD reduction, turbidity removal and ammoniacalnitrogen removal was found to be 400 mg/l. The per cent CODreduction obtained with this dosage was in the range of 4656 and the maximum removal efficiency was obtained for aninitial COD concentration of 8080 mg/l (Sample 2). Whilethe per cent turbidity removal varied between 43 and 49)theammoniacal nitrogen removal varied between 24 and 29 per

98
mq av mw mv mm on ma om .mmm mm vm Hm nw mv vv av nv om Hm mm .vmm mm Hm om ow mq av ow Nq mm aw mm .mmm mm mm mm av mv mw mv ow vm mv mm .mom vm mm mm ow vw N¢ me vv mm om mm .H
H\me H\me H\me H\mE Hxme H\me Hxwe H\@E H\wE H\0E H\me H\me .02oom oov oom oom oom oov oom oom oom oow oom oom mamemm
Hm>oEwu cwoouuflcHmUmHCOEE< ucwuumm
Hw>OEwM %udUHDHDB ucmuumm
COHUUDUwH QOU ucmouwm
oz< a<>ozmm
NBHQHmmDB
q¢>ozmm zmoomaHz q<u<Hzozz<
.zoHaosomm D00 ZH SD44 mo wuzmHoHmmm
m.m~ mum¢e

99
mv av nw wq Hm vm NV mq .mmm om mm mm aw om av nw ow om nv mm .¢vm mm mm mm vw mq NV mq mw Hm mm ow .mmm mm mm mm wv aw ow mv mm mm mm Hm .mmm um mm mm ow sq mv m¢ om om ow nw .H
H\me a\mE a\mE Hxme Hxme a\mE Hxme H\mE a\mE a\mE Hxme H\me
oom oov oom oom oom oov oom oom oom oow oom oom .ozwamemm
Hm>oEwu cwmouuac
amuma:oEE< ucmuumm Hm>oEmu wuflnflnuse ucmuuwm cofluoswmu ooo ucmuuwm
g<>ozmm zmuomaHz q<u<Hzozz<
DZ¢ q¢>ozmm NBHQHmmDB \zoHauaomm QOU ZH ma<mmgam EDHZHSDq¢ mo wozmHuHmmm
v.mm mqm¢a

100
cent. The maximum removal efficiency of turbidity removaland ammoniacal nitrogen removal was obtained for Sample 4having an initial turbidity of 680 NTU and ammoniacalnitrogen concentration of 630 mg/l.
3. Ferrous sulphate
For ferrous sulphate, the optimum dosage was foundto be 300 mg/l for COD reduction bringing about reductionefficiencies ranging from 57 to 62 per cent. The maximumremoval efficiency of 62 per cent was obtained for Sample 2with an initial COD of 8080 mg/1. The maximum turbidityremoval and ammoniacal nitrogen removal were obtained at adosage of 400 mg/l. The maximum removal efficienciesobtained for turbidity and ammoniacal nitrogen were in theranges of 35-38 per cent and 15-18 per cent respectively.
4. Ferric sulphate
In the case of ferric sulphate, the optimum dosagefor COD reduction, turbidity removal and ammoniacal nitrogenremoval was found to be 200 mg/l. The per cent CODreduction obtained with this dosage was in the range of 5153 and the maximum removal efficiency was obtained for an

101
mm mm mm «m Hm ow mm sq .m
va ma ma NH vm mm mm mm mm av mm mm .vofl ma va Ha om om vm Hm mw ow om Hm .mNa na ma oa mm mm mm om mm vm No nm .N
ma ma Va NH mm mm vm mm wm mm om vm .H
H\we a\mE Hxoa H\oe H\me Hxme H\wE a\mE axme a\mE Hxme Hxmeoom oow oom oom oom oov oom oom oom oov oom oom
Hm>oEmu cwmouuflc
am>oEwu wuflvfinusa ucwuumm
HmUmHCOEE¢ ucwuumm
cowuuscwu QOU ucmoumm
q<>ozmm ZMUOMBHZ q¢U¢HZOSS<
oz¢ q<>ozmm MBHQHmmDB .zoHaooomm Q00 ZH ma<mmqDm msommmm mo wuzmHoHmmm
m.m~ mgm¢a

102
mm mm mm om ow nv av Hm .m0 5 a ma mm um mm mm ow nv av mm .w
m B m Ha mm mm mm Hm mv om om mm .mm w OH Na mm mm om mm NV ow av Hm .NN N m Ha um um am am av av av om .H
Hxme Hxme Hxme H\mE H\mE H\me H\mE H\me H\mE Hxme H\mE H\me
oom oow oom oom oom oow oom oom oom oov oom oom magnum
am>oEwu cmmouuflc
Hm>oEwu >uH©HDhSH ucmuumm cofluusomu moo ucmuumm
HMUMHCOEE4 ucmuumm
q<>ozmm zmoomaHz q<u<Hzozz<
oz< q<>ozmm NBHDHmmDB .zoHaooomm Q00 ZH maammgsm uHmmmm mo wozmHuHmmm
m.m~ mqm¢e
103
effluent COD concentration of 5790 mg/l. While the per centturbidity removal at the optimum dosage varied between 30and 33, the per cent COD removal varied between 11 and 13.
5. Ferric chloride
The effectiveness of ferric chloride was mostoptimum at a dosage of 500 mg/l for COD reduction. Theoptimum dosage for turbidity removal and ammoniacal nitrogenremoval was 400 mg/1. The COD reduction efficienciesobtained at the optimum dosage varied between 59 and 66 percent. The turbidity removal efficiencies and ammoniacalnitrogen efficiencies achieved at the optimum dosage of400 mg/1 were in the ranges of 39-42 per cent and 19-22 percent respectively.
6. Ferrous chloride
For ferrous chloride, the optimum dosage was foundto be 400 mg/1 for COD reduction bringing about reductionefficiencies varying from 52 to 54 per cent. The maximumremoval efficiency of 54 per cent was obtained for Sample 4with initial COD of 10700 mg/1. The maximum turbidityremoval and ammoniacal nitrogen removal was obtained at a dosage of

104
mm av ow mm mm mm mm mm .mma mm Hm ma mm mw av mm vo Ho mm mm .¢ma om ma ma um ow mm mm mm mm mm mm .mma Hm ma ma mm aw mm mm mm mm «m mm .NNa ma ma ma mm mm mm mm mm vm Hm sq .H
H\OE Hxme H\me a\wE Hxma a\mE H\mE H\OE H\mE H\OE Hxme H\ms
oom oov oom oom oom cow oom oom oom oow oom oom .ozm>oEw mm H wamemm
Hm%macoE%¢cucmmmww Hm>oEwu >uw©flnu:a ucmuuwm cofluunown moo ucwouwm
q<>ozmm zmuomaHz q<o<Hzozz<
oz< g¢>ozmm waHoHmmaa .zoHeuoamm QOU ZH moHmoqmo oHmmmm mo muzmHoHmmm
b.mN mqm¢e

105
mm vm mm om av mm nq ow .mma «H ma Ha mm «m mm am am vm m¢ mv .v«H NH Ha m vm mm Hm mm om mm av ow .mma «H ma Ha on «m mm Hm om mm ow nv .mma ma NH ofl mm mm mm om Hm mm mv ow .H
Hxme H\me H\we H\me Hxme Hxme H\ma Hxme H\me H\@E H\mE H\mE .ozoom oov oom oom oom oov oom oom oom oov oom oom mamemm
am>oEwu cwmouuacHmUmHcOEE¢ ucmoumm
Hm>oEwu wufloanusa ucmuumm
q<>ozmm ZMUOMBHZ q<o<Hzozz«
cowuusomu QOU ucwuuwm
DZ< u<>ozmm NBHQHmmDB \zoHao:amm O00 ZH moHmoqmo mnommmm mo wuzmHoHmmm
m.mm mqm<a

106
500 mg/l. The maximum removal efficiencies obtained for COD_and ammoniacal nitrogen were in the ranges of 34-36 per centand 14-16 per cent respectively.
7. Aluminium chloride
In the case of aluminium chloride, the optimumdosage for COD reduction, turbidity removal and ammoniacalnitrogen removal was found to be 300 mg/l. The per cent CODreduction obtained with this dosage was in the range of 6973 per cent and the maximum removal efficiency of 73 percent was obtained for an initial COD concentration of10700 mg/l (Sample 4). While the per cent turbidity removalfor the optimum dosage of 300 mg/l varied between 52 and 57and ammoniacal nitrogen efficiencies varied between 32 and37 per cent.
8. Magnesium chloride
For magnesium chloride, the optimum dosage wasfound to be 400 mg/1 for COD reduction, turbidity removaland ammoniacal nitrogen removal. At the optimum dosage of400 mg/1, the COD removal efficiencies varied between 44 and46 per cent and the maximum reduction of 46 per cent was

107
om Hm vm nw we no mm mm .mmm mm wm Hm nw ow vm Hm mm mm mm mm .vmm Hm mm mm ow Hm mm aw mm mm H» mm .mcm um mm mm om vm mm mm we mm mm mm .Nam om mm mm Hm om mm ow me no on we .a
H\me a\mE H\we H\@E H\me H\mE a\mE Hxms H\me Hxme Hxme H\me .ozoom oow oom oom oom oov oom oom oom oov oom oom mamemm
am>oEmu cwmouuficHmUmflCOEE¢ ucmuuwm
am>oEmu xufluflnuse ucmuuwm
COHUUSUQH QOU ucwuuwm
g<>ozmm zmuomaHz q<U<HZOSEd
QZ¢ q<>ozmm MBHQHmmDB .zoHaooomm QOU ZH MDHMOQEU SDHZHzDq< mo »ozmHoHmmm
m.mm mqm<a

108
om mm am pm mv ow mw ow .mNH ma NH ofi mm mm mm om mv mv mv mm .v
Ha ma AH 5 am mm am pm mv ww Nv H¢ .mHa ma Ha m Hm mm am am mw ow mw av .moa NH OH m om mm om mm mv mw av ow .H
Hxms a\mE Hxme H\wE H\mE Hxms H\me a\oE Hxme Hxme H\oE Hxme .o
oom oov oom oom oom oov oom oom oom cow oom oom maaemw
m
Hm%m%mmm%<cmcmmmww HG>OEwh muflnflnusa ucwuuwm cofluuscwu moo ucmuumm
q¢>ozmm zmwomaHz q<u<Hzozz<
oz« q<>ozmm MHHQHmmDB .zoHeuoamm QOU ZH moHmoqmo zaHmmzo<z mo wozmHoHmmm
oH.mm mamas

109
obtained for influent COD concentrations of 8080 mg/l and10700 mg/1. As for turbidity removal, efficiencies rangingfrom 32 to 33 per cent were obtained for all the samples atthe optimum dosage of 400 mg/l. At the optimum dosage, theammoniacal nitrogen removal efficiencies varied between 12and 13 per cent.
9. Lime
In the case of lime, the maximum COD removal;turbidity reduction and ammoniacal nitrogen removal wasobtained at a pH of 10.5. The ICOD removal efficienciesachieved were in the range of 52-58 per cent and the maximumefficiency of 58 per cent was obtained for an initial CODconcentration of 5790 mg/1. The turbidity removalefficiencies ranged between 40 and 43 per cent with themaximum removal obtained for an initial turbidity of680 mg/l. As for ammoniacal nitrogen removal. the removalefficiencies were in the range of 32-33 per cent.
The optimum dosages for the most effective actionof each of the coagulants and the maximum removalefficiencies obtained for COD, turbidity and ammoniacalnitrogen are summarised in Table 2B.l2.

110
mv av ow mv ow vm ow aw ..mmm mm om mm vq mw mv aw av mm nv mw .vom mm Hm mm mv aw ow av wm mm ow nv .mmm mm om mm vv Nv aw ow Hm vm ow mv .Nmm mm mm vm mv ow mm aw om mm nw vv .a
HH m.oH oa m Ha m.oH 0H m Ha m.oH ofi m .ozmm um Hm>oEwu mm um mm um mamemm
cwmouuac HmUwflCOEE< ucmuumm am>oEmu wuflownsua ucwuumm cofluosvmu moo ucmuuwm
q<>ozmm zmwomaHz q<o<Hzozz« .
oz4 q<>ozmm NBHQHmmDB .zoHauoomm QOU ZH MEHQ mo wuzmHoHmmm
HH.mN mamas

111
mm
mv
mm
mm m.oHn m.oHuma m.oHumm mafia .mma mm ow oov oow oov mcfluoaco esflmwcmmz .mmm mm mm oom oom oom mofluoanu EsH:HE:a< .5ma om vm oom oom oov mofiuoaco msouumm .0mm mv mo oov ooq oom mufluoaco ofluumm .m
ma mm mm oom oom oom mumcmasm ufluumm .vma mm mm cow oov oom mumcaflsm msouumm .mmm av om oov oov oow mumcaasm E:flcfiE:H¢ .~mm aw nv oom oom oom E5H< .H
Hm>OEh Hm>OEh
cwmouufl: Hm>oEmu coauusvmu cwmouuflc HM>OEmh cofluuswmu
amuficoéa wflfifisa ooo 18320.52 finfifise moo . ozucmanmmou .am
mucmflufiuww ._...m>0_.=0.H E.DE..n KMS
H\me wmmmoo Eseaumo
maz<g2o«oo mooHm<> mo zowHm4mzou
NH.mm
mqm<e

112
From Table 2B.l2, it is evident that aluminiumchloride is the most effective coagulant among the ninecoagulants studied in respect of COD reduction, turbidityremoval and ammoniacal nitrogen removal.
In the case of COD reduction, aluminium chlorideis followed by ferric chloride, ferrous sulphate, lime,aluminium sulphate, ferrous chloride, ferric sulphate, alumand magnesium chloride. In the case of turbidity removal,aluminium chloride is followed by aluminium sulphate, alum,lime, ferric chloride, ferrous sulphate, ferrous chloride,ferric sulphate and magnesium chloride, in that order. Inthe case of ammoniacal nitrogen removal, the order ofdominance is aluminium chloride, lime, aluminium sulphate,alum, ferric chloride, ferrous sulphate, ferrous chloride,ferric sulphate and magnesium chloride.
(c) Settling characteristics of sludge
The settling characteristics of the flocs formedby each of the coagulants are plotted in Piqs.2R.]l to2B.l9.

113
.2244 mauz nua<anu<oo azuonmmu mo waHqHm¢muaamm Ha.m~.uHm
Anouacflav MSHB
om 3 3. m w
___
,\,l|||1)J .
< a.{o,IIo.{)./)
(
(\ /)..
(\~l\/@..[.\),. L
I\/\J(\
,/\}A/O
2’
H W l
imr oom mmon /
K.
m/(013) 390013 30 .LHDI3HNa

114
mammmumm zmHzHznq4 mnwz nma<mnu«on mzmnqmmm mo mnun-mmmunnmm
Ammusnafi M.$.Hm.
ow m4 N- m W
m~.m~.oHm
(Q)
L
0.» "mmHxme oov nmmoo
ma
(mo) Flf)(In’]S‘ .40 mnomn

mm<mmgum woommmm mmH2 oma¢qmo<on azmngmmm mo wnHqHm«muaamm o-.mm.wH
rll
Ammuscfie, mznm
om mm mm m
115
m.m "maH\me oow ummoo
muma
(mo) a9nn1s an mnntnn

116
HI.... 11)) )I u..lH u.I| \I.l.1.aJ.J:1...)) l..l..J1n nll 1.. In
o|,.lflu1.Hhun.U (lwlwhlluf CD[flLr.Lfl(( rr7h.aIr. . -11-“.
' . r« (Ln
Mmmuncfin umun
OI VI
(Ill-'3) !?lF)(H1'l§ .-1() .T.HE)l1-'Ill

117
moHmogmu uummmm mnHz nmamqnoaon ezmnummm mo muHqHm<mqaamm
Ammuscfi... mvmmh.
ON
U).-«I
mu m
%
\/
ll)
c L/IOIIOIIIO >
o.m "moH\me oow ummoo
I!)
o
(flMl
I4fu
(mo) EIDGIYIS .40 .T.HD]F|ll

118
mowmoqmu moommmm MHHR nma<qou<on uzmnnmmm
Kmmuscufi
om ma ma
11 .
mzun
olIoI\ofuo..\ofo/.
mo wnHaHm¢mnaamm
OI.OIOl:O/o/0
O/[_I
wI ma
(W3) 390018 30 mnsxnn

119
mfimoqmu 23232.3. FHH3 omafiaoaou azmofimm mo ..a.H.Em<m.E.amm Z.m~.oH...._
AWNUDCHEV MZHH
ow 3 3 m w
W ~ _ _ —
\./
o clIol\o(:o/
@QI'[|l?V/. ll
0 0/0
/0
OO
oé "mm
19. oom ummon O
Naea
(W3) 390013 30 mHDI3H

120
.531. m.HH3 nm.H<..._DU¢OU azmnfimm mo w.S.Em<muL.amm m4_..mm.uE
Ammuzcaev mzHn
om 3 NH m .1
_ _ _ _
o/|o/uoIloI:oIlo.{o:oJo/o
93 "mm
CD
(U10) 390018 .80 JZHDIFIHNH3

121
Amwuscfiev MZHH.
moHmogmu zoHmmzo<z maHz oma<goo<oo azmogmmm mo »aHgHm<mqeamm
mH.mN.0Hm
ON ma NH m
O/l ll.O:IuO/rIo.|f0/
0/ 1.
0/0
o.m "maH\me ooq ummoo
Na
K}ma
(mo) ElE)Cln"lS .:1O J.HDI3ll

122
It is evident from the figures that the settlingcharacteristics of the sludge formed by the coagulants aresimilar in nature. Most of the sludge settling occurredduring the first 5 to 6 rninutes. In the case of alum,ferric sulphate, ferric chloride and magnesium chloride, thecompression of sludge was more gradual than for othercoagulants.
The height of the sludge at the end of 20 minutessettling time for the effluent treated with aluminiumchloride was 1.8 cm, the minimum sludge height obtainedduring the studies. This shows the ability of the sludgeformed by aluminium chloride to get compressed better thanthe sludges formed by other coagulants. Aluminium chloridewas followed by lime and ferrous chloride, the flocs formedby which could get compressed to 2.1 cms. Among thecoagulants studied, alum and magnesium chloride showed theminimum sludge compression capacity. The less the sludgeheight, the less the volume of sludge generated in thecoagulation process. The desludging losses in theclarification plant will be less if the volume of the sludgeis kept at minimum (30).

123
2B.4 CONCLUSIONS
1. The optimum pH values for the most effective action ofthe coagulants, viz. alum, aluminium sulphate, ferroussulphate, ferric sulphate. ferric chloride, ferrouschloride, aluminium chloride and magnesium chloride weredetermined. The optimum pH values were in the range6.5-8.5. As for lime, the best results were obtainedwith a pH of 10.5.
Among the nine coagulants studied, aluminium chloridewas found to be the most efficient for COD reduction,
and ammoniacal nitrogen removal ofturbidity removallatex concentration effluents.
The compressibility of the sludge produced by aluminiumchloride is better than those of other coagulants triedin the treatment of latex concentration effluents.

124
REFERENCES
Ritchie, A.R., Proc. Soc. Water Treatment Exam., 5, 2, 81(1956).
Camp, T.R., Trans. Am. Soc. Civil Engrs., 120 (1955).
Hudson, H.E. Jr., J. Am. Water Works Assoc., 49, 242(1957).
Metcalf and Eddy Inc, Waste Water Engineering: Treatment,Disposal, Reuse, Tata McGraw Hill, New Delhi (1979).
Clark, J.W., Viessman, W., Jr. and Hammer, M.J., WaterSupply and Pollution Control, Harper & Row (1977).
Shaw, D.J., Introduction to Colloid and Surface Chemistry,Butterworth, London (1966).
Stumm, W. and Morgan, J.J., Aquatic Chemistry, WileyInterscience, New York (1970).
Arceivala, S.J., Wastewater Treatment and Disposal, Marcel

10.
11.
12.
13C
14.
15.
125
Dekker Inc., New York (1981).
Wastewater Treatment: A Course Manual, NationalEnvironmental Engineering Research Institute, Nagpur(1985).
Hagar, D.C. and Railly, P.B., J. Wat. Pollt. Cont. Fed.,42, 974 (1970).
Frisch, H.L., Jour. of Colloid Chemistry, 60, 4, 463(1956).
Stumm, W. and Morgan, J.J., J. Am. Water Works Assoc. 54,8 (1962).
Stumm, W. and O'Melia, C.R., J. Am. Water Works Assoc.,60, 514 (1963).
Fair, G.M., Geyer, J.C. and Okun, D.A., Water andWastewater Engineering, Vol.2, Wiley, New York (1968).
Thomas, A.W., Colloid Chemistry, McGraw Hill, New York(1934).

16D
17.
18.
19.
20.
210
225
126
Ramalho, R.S., Introduction to Wastewater TreatmentPnocesses, Academic Press, New York (1977).
Weber, W.J. Jr., Physicochemical Processes for WaterQuality Control, Wiley-Interscience, New York (1974).
Painter, H.A., Wastewater Treatment Jour., p.352 (1957)(not in original).
Loehr, R., Agricultural Waste Management Problem,Processes and Approaches, Academic Press (1974).
Smith, J. Metal, Proc. Conf. on Application of NewConcepts of Physical Chemical Wastewater Treatment,Vanderbilt University, Tennesse (1972) (not in original).
Weber, W.J., Proc. Conf. on Application of New Concepts ofPhysical Chemical Wastewater Treatment, VanderbiltUniversity, Tennesse (1972) (not in original).
Chattopadhyay, S.N., Arora, H.C. and Sharma, V.P., Ind.Jr. of Env. Hlth, 15, 3, 208 (1973).

24.
25.
26.
27.
28C
127
Kothandaraman, V., Aboo, K.M. and Sastry, C.A., Ind. Jr.of Env. H1th.: 18, 2; 93 (1976).
Bhole; A.G. and Dhabadgaonkar, S.M., IAWPC Tech. Annual,14; 52 (1987).
Rao, M.N. and Sastry, C.A., Env. H1th., 10, 4, 265 (1968).
Kozirowski and Kucharski, J. Industrial Waste Disposal,Pergamon Press (1972).
Thakur, U.C., Dhabadgaonkar, S.M. and Deshpande, W.M.,Ind. Jr. of Env. H1th., 19, 1, 16 (1977).
Standard Methods for the Examination of Water andWastewater, 16th edn., American Public Health Association(1985).

Chapter 3
POLYELECTROLYTES AS COAGULANT AND COAGULANT AID
3.1 INTRODUCTION
In recent years natural and synthetic organicpolyelectrolytes have been increasingly used in thecoagulation of suspended matter in water and wastewater.The polyelectrolytes are polymers with high molecularweight possessing such characteristics of simpleelectrolytes as electrical charges or ionisable groups.They are used in water and waste treatment either alone ortogether with metal coagulants to improve clarification, toreduce coagulant dosage required, or to allow an increasedtreatment rate without overloading existing facilities.
Coagulation basically involves two steps(a) neutralisation of the charge on the colloids and(b) agglomeration or flocculation of smaller particles intobigger particles. Black, Ruehrwein and others (1) havediscussed the mechanism of coagulation of colloids causedby these long-chain compounds. According to them thepolymers in water act as polyvalent ions. The polymerchain carries a very large number of ionic sites along its
128

129
length. Coagulation takes place by the neutralisation ofcharge on the electronegative colloid particles by theseionised centres or by hydrogen bonding among the chargedsurfaces. Electrostatic cross-linking also binds thelinear chains together. Riddick (2) has found thateffective removal of colloids is obtained when the zetapotential of particles (15-25 mV) is reduced to zero plusor minus 5 mV. A polyelectrolyte aid is effective incausing large changes in the zeta potential of particleswithout appreciably changing either alkalinity or pH (3).Even if a polyelectrolyte is not very efficient in chargeneutralisation, they may be very effective in formation offloc by what is known as "bridging". The polymer isadsorbed on the surface of the particle and bridges betweenthem with the aid of free segments of the adsorbed polymer(1). Bridging results in the formation of large, strong,three dimensional and quickly settleable flocs.
The term polyelectrolyte was first coined by Fuoss(4) for those polymers which, by the action of an acid oralkali, can be converted into charged ions. Thepolyelectrolytes may be of natural or synthetic origin.Cohen (5) described the naturally occurring ones asbiocolloids. The feature common to both natural and

130
synthetic polyelectrolytes is the presence of recurringunits containing ionisable groups in the molecule.
Depending on the charge of the recurring units thepolyelectrolytes have been classified as cationic, anionicand non-ionic. An example of a cationic polyelectrolyte ispolyvinylpyridinum butyl bromide which has a positivelycharged pyridine nucleas in each repeating unit. Sodiumpolymethacrylate is anionic, the negative chargeoriginating from the dissociation of carboxyl groups.Gelatin belongs to the group of non—ionic polyelectrolytes.The non—ionic materials provide both positive and negativecharges in solution.
The polyelectrolytes have a great role to play inthe treatment of water and wastewater and in the abatementof water pollution. Yet, many a times, full benefits thatcan be achieved by the use of a polyelectrolyte, are notderived due to ignorance about certain practicalconsiderations regarding their use (6). For example, somepolyelectrolytes of proven value, are declared ineffective,just because some simple procedures, such as those requiredfor making solutions of a polyelectrolyte are not followed,or the solution of the polyelectrolyte used is too

131
concentrated to disperse in water or the mixing of thepolyelectrolyte with process water is inadequate or thepolyelectrolyte is subjected to vigorous agitationresulting in the shearing of its molecules or its correctdose is not applied at the correct point. The choice of aproper polyelectrolyte for a given application is ofparamound importance.
The bacteria and colloidal matter present innatural waters generally carry negative charge. Hence, thecationic polyelectrolytes, which produce positively chargedfunctional group on dissolution in water, are mostsuitable. If water contains only mineral suspended solids,cationic polyelectrolytes are found to be very effective asprimary coagulants (7). If water contains both mineral andorganic substances, a combination of inorganic coagulantssuch as alum or ferric chloride with cationicpolyelectrolytes gives best results (8). Even for waterswith mineral solids, a combination of alum with a cationicpolyelectrolyte may prove to be more economical than anyone coagulant (9,l0) because the polyelectrolytes do nothave great capacity for charge neutralisation due to theirlarge molecules and small doses used.
If non—ionic polyelectrolytes are used, chargeneutralisation has to be brought about solely by inorganic

132
coagulants. The non-ionic polyelectrolyte serves as abridge between neutralised particles (11). The combinationgenerally results in excellent clarification. But thedoses of non-ionic polymers required are generally tentimes than those of cationic ones (12).
Anionic polymers have been found to be inefficientas primary coagulant for natural waters due toelectrostatic repulsion between the colloids and thefunctional group obtained on dissolution of the polymer inwater, having similar charges. However, for someindustrial wastewaters containing positively chargedcolloids, the anionic polyelectrolytes would be mosteffective (6). They have also been used as "aid" incoagulation and filtration.
The higher the molecular weight of apolyelectrolyte, the more effective it is. Polyacrylamidewhich can be made cationic by special processes, gives bestresults at higher molecular weights (6). Non—ionicpolyelectrolytes are found to be effective when molecularweight is greater than 2x10⁶. This mainly applies topolyacrylamide.
The bridging mechanism basically depends on themolecular weight which determines the size and segments of

133
the polymer formed on dissolution in water. It is on thisaccount that even anionic polyacrylamide of high molecularweight is effective in coagulating waters containingnegatively charged colloids (13). However, the doserequired in such cases, may indeed be high.
The effectiveness of polyelectrolytes for varioususes can be found out by suitable experimental procedures.However, jar test alone can give valuable information aboutthe effectiveness of polyelectrolytes not only forcoagulation but also for filtration and sludgeconditioning. It can at least be used for indicatingrelative efficiency of various flocculants and possiblerange of effective doses (14).
Several studies have been carried out on theeffectiveness of various polyelectrolytes, both natural andsynthetic, for the treatment of natural water andindustrial wastewater and sewage. Actually, seeds ofcertain plants have been used in water clarification sincetime immemorial. A paste made from the seed of Strychnospotatorum Linn commonly known as clearing nut or Nirmaliseed precipitates suspended siliceous impurities in rawwater (15). Subbaramiah and Sanjiv Rao (16) found from

134
electrophoretic measurements that the paste carried a weaknegative charge and attributed its coagulating propertiesto its strychnin and albumin content. Sen and Bulusu (17)have reported on the effect of Nirmali seed, alone and inconjunction with metal coagulants, on chemical coagulationof Jamuna River water. They concluded that the extractprepared from the seed showed promising results in thesystems studied. Bulusu and Sharma (18) have confirmedthese findings on a pilot plant using Jamuna River waterhaving a turbidity between 300 and 3500 mg/1. Continuedresearch in this field by CPHERI, Nagpur led to thedevelopment of natural polyelectrolytes namely CA3, CA4 andCA5. Bulusu et al. (19) reported that they produceexcellent flocculation when added to clay suspensions inconjunction with aluminium and iron salts in dosages thatare only a small fraction of those required forflocculation with metal salts. Pathak et al. (20) studiedthe effectiveness of CPHERI developed anionicpolyelectrolytes CAll and CAl2 as coagulant aid in watertreatment. Rao and Sastry (21) found that 2 mg/l ofNirmali seed extract reduce the alum dose by more than 50%.Bulusu and Pathak (22) found the seeds of Red Sorella to bevery effective primary coagulant. Pandit (23) found bothMaize-e and caustic starches in small doses effective as

135
coagulant aids in conjunction with aluminium sulphate forwater clarification with the additional advantage ofrendering the water non—corrosive.
Tripathi et al. (24) established the anionicnature of Nirmali seed extract by I.R. spectral studies andfound that eventhough it is very efficient in thecoagulation——flocculation of hydrophobic colloids (such asclay turbidity), it is a poor flocculant in the case ofhydrophilic colloids such as bacteria. Prasad and Jivendra(25) investigated the performance of Tamarindus indica seedextract as coagulant aid in water clarification andreported that it can reduce the alum dose by 50 per cent.Azharia and Dirar (26) reported the coagulating propertiesof powdered seeds of Moringa oleifera Lam, a traditionalcoagulant in the rural areas of Sudan. Vaidya and Bulusu(27) studied the effectiveness of chitosan as a coagulantand coagulant aid in water clarification and found it apotential candidate
Moore et al. (28) studied the effect ofpolyelectrolyte treatment on waste strength of snap and drybean wastewaters and found Floculite 250 and chitosan veryeffective in COD and solids reduction. Karim (29)

136
investigated the use of inorganic salts and polymers in thetreatment of palm oil effluent. Prasad and Belsare (30)studied the effectiveness of polyacrylamide as a coagulantaid in water treatment and found that a relatively smallconcentration (0.1 ppm) of polyacrylamide could remove highturbidity (2500 ppm) to the acceptable level of 10 ppm andreduce half of the original amount of alum without anydifference in the achievement of steady state. Sihorwalaand Reddy (31) studied the use of syntheticpolyelectrolytes and metal salts in the treatment of cottontextile waste.
No systematic study has been reported inliterature on the use of natural and syntheticpolyelectrolytes as coagulant and coagulant aid in thetreatment of effluents from a natural rubber latexconcentration unit. The purpose of the present study is toevaluate the effectiveness of four natural polyelectrolytesviz. starch, sodium alginate, tamarind seed powder andchitosan and two synthetic polyelectrolytes viz., acationic polyacrylamide based one and the other an anionicpolyamine based polyelectrolyte: as coagulant and coagulantaid in the treatment of effluents from a centrifuge latexconcentration unit.
137
3.2 MATERIALS AND METHODS
The polyelectrolytes used for the study were:
a) Natural polyelectrolytes
1. Starch2. Sodium alginate3. Chitosan
4. Tamarind seed powder
b) Synthetic polyelectrolytes
l. Polyacrylamide based cationic polyelectrolyte2. Polyamine based anionic polyelectrolyte.
Starch
starches consist of two types of polysaccharides,linear chains of D—g1ucose units joined by OC—D (1-4)linkages (amylose) and highly branched structuresconsisting of short chains of 20-25 units of the linearpolysaccharide joined to each other by OC—(l—6) glycosidiclinkages (amylopectin). Usually amylopectin is the majorcomponent and has a much higher molecular weight, rangingupto 106. The amylose fraction has been reported superiorto amylopectin or native starch in red—mud flocculation(32). starches isolated from corn, wheat, sorghum, rice,

138
potatoes and tapioca are all used to some degree asflocculants, but some work better with certain substratesthan others.
Sodium alginate
This is also a polysaccharide based flocculant.Sodium alginate is produced from brown algae (sea
weed) by alkaline extraction. Alginic acid is either amixture of (1-4) — fi—D mannuronic acid and of L—guluronicacid, or else is a copolymer of the two uronic acids.
Chitosan
This cationic polysaccharide is made from chitin,which is derived from crustacean shells. Chitin is apolysaccharide constituted of p—(l—4) 2 acetamido-2-deoxy—D—glucose units, some of them being deacetylated withalkali. This natural polymer that may be called poly—N—acetyl—D-glucosamine, can be considered a derivative ofcellulose‘ where the C-2-hydroxyl groups are replaced byacetamido groups.
Tamarind seed powder
The seeds of Tamarindus indica exhibit coagulating

139
properties. The ground seeds are sieved and a 0.1%solution is prepared by boiling.
Among the four natural polyelectrolytes studied:tapioca starch, sodium alginate and chitosan were obtainedin the form of solution from commercial suppliers.Tamarind seed extract was prepared by boiling seed powderwith water.
The synthetic polyelectrolytes were also obtainedfrom commercial suppliers.
Cationic polyelectrolyteThis polyacrylamide based polyelectrolyte was
obtained in the form of a viscous solution.
Anionic polyelectrolvteThis polyamine based polyelectrolyte also was
available in the form of a viscous solution.
All the polyelectrolytes, both natural andsynthetic were assessed for their effectiveness, both as acoagulant and coagulant aid in the treatment of latexconcentration wastewaters. Their effectiveness as a

140
coagulant was assessed in terms of turbidity removal, CODreduction, and ammoniacal nitrogen removal. The effect ofpH on coagulation and sludge settling characteristics werealso studied. All the polyelectrolytes were tested ascoagulant aid in conjunction with three metal salts, viz.,alum, ferric chloride and aluminium chloride. Theefficiency of the polyelectrolytes as coagulant aid wasassessed on the basis of their ability to reduce the metalcoagulant dose.
The effluent samples were collected from acentrifuge rubber latex concentration unit situated inCentral Kerala. The various parameters of the effluentwere analysed using standard methods (33). The effluentcharacteristics are given in Table 3.1.
Coagulation experiments were carried out in Jartest apparatus provided with stirrers having speedregulator. Samples, one litre each were placed on a mixingpad and requisite additions were made. The contents werestirred rapidly at 100 rpm for 1 minute and then at a speedof 30 rpm for 15 minutes for flocculation. The beakerswere then separated from the pad and allowed to settle for30 minutes. The supernatants were siphoned off for theestimation of pH, COD, turbidity and ammoniacal nitrogen.

141
TABLE 3.1
EFFLUENT CHARACTERISTICS
Parameter SaTple Sagple Sagple Sagple
pH 4.3 3.9 4.0 2.9Turbidity, NTU 490 2100 1230 680COD, mg/1 1170 8080 5790 10700Ammoniacalnitrogen, mg/l 570 750 590 630
142
a) Polyelectrolytes as Primary Coagulant
The optimum pH for the effective coagulation ofeach of the polyelectrolytes was determined using the jartest apparatus. The pH of the samples were brought tooptimum levels by adding sodium hydroxide (0.1 N) beforecarrying out coagulation studies. Four different dosagesof the polyelectrolytes, viz., 2 mg/l, 4 mg/l, 6 mg/1 and 8mg/l were tried.
b) Sludge Settling Characteristics
The sludge settling characteristics were studiedby adding optimum dosage of polyelectrolyte and adjustingthe pH to the optimum value of the effluent samples takenin a 100 ml measuring cylinder. The contents of themeasuring cylinder were mixed well for 3 to 4 minutes. Therate of settling of the floc formed was measured by notingthe position of sludge at regular interval until furthersettling is negligible.
c) Polyelectrolytes as coagulant Aid
The optimum dosage of each of the three metalcoagulants, alum, ferric chloride and aluminium chloride,was estimated by jar test. The corresponding 5%! valueswere also noted.

143
Preliminary experiments were carried out to get anidea of the range of the dosage of polyelectrolyte requiredand also the metal coagulant dose which can be reduced.After adding the reduced quantity of the coagulant dose(say 50% of the optimum dose determined in (a) above), thepolyelectrolyte in varying doses was added to latexconcentration effluent samples taken in beakers. The jartest was carried out and pH and turbidity of thesupernatants were measured.
3.3 RESULTS AND DISCUSSION
a) Effect of pH on Coagulation EfficiencyTo determine the optimum pH of coagulation for the
four natural polyelectrolytes, the pH of the effluentsamples was varied between 4 and 11. For the two syntheticpolyelectrolytes, the pH was varied between 4 and 12. Thecoagulation efficiency of all the polyelectrolytes wasestimated in terms of per cent turbidity removal achievedat a polyelectrolyte dosage of 4 mg/l.
1. StarchEffect of pH on the coagulation efficiency of
starch is shown in Fig.3.l.

Na OH
ma
0/AW 3O]!
/4 0/
144
DB2 ommDB2 ooam
/4/oH.@/o\o\o\oH©H
/
O\¢
.)\mwV<
®M4\
\4\4
4.\4
»aHoHmmae q<HHHzH mu»aHoHmmoa q<HaHzH Aw
H\mE v "mmoo
OHomomoq
WVAONHU AmlUl8Ufl& LNHD Ufld

145
As the pH increased from 4 to 8.5, there was agradual increase in the per cent turbidity removal achievedby starch. The maximum turbidity removal was achieved at apH of 8.5. Beyond this pH value, the per cent turbidityremoval achieved showed a decreasing trend. Among the twosamples used for the study, the one with an initialturbidity of 2100 NTU was found to be more susceptible toturbidity removal by starch compared to the sample withinitial turbidity, 850 NTU.
2. Sodium alginateThe pH dependence of sodium alginate coagulant is
illustrated in Fig.3.2.
The optimum pH for coagulation by sodium alginatewas found to be 9.5. At this pH, the removal efficiencyachieved was 29 per cent for both the initial turbidityvalues 2100 NTU and 680 NTU.
3. Chitosan
The variation of the coagulation efficiency ofchitosan with pH is shown in Fig.3.3. The results obtainedfor the initial turbidity values, 2100 NTU and 680 NTU were

146
\\\
\
DB2 omo n rflflmmae q<H.mHzHD82 82 n w.H_HoHmmD_H EH32.» G.
H\mE w ummoo
'l\1I\ON3U AJ.I(]IElHfl.L .T.N'El.") klliid

147
NA
z<moaHmu
()-~l
um
zoHa¢qno<ou zo mm mo aummmm um.m.oHm
DB2 omoD92 ooam
»aHoHmmaa g<HuHzH Aw»aHaHmmsa q<HnHzH AH
H\me
w mmoo
OHomomowom
'lVl\()Ni:lH AJ.l(lIUHH.L J.NC~l.') Ufld

148
very close to each other. The optimum pH of chitosan forthe effective coagulation of latex concentrationwastewaters was found to be 10.0.
4. Tamarind seed powder
As for Tamarindus_indica seed powder, the effectof pH on coagulation efficiency is shown in Fig.3.4. Theoptimum pH value was found to be 7.5. At this pH value.the removal efficiencies achieved were 30 per cent and 31per cent respectively for the initial turbidity values of2100 NTU and 680 NTU. As the pH increased from 4.0 to 7.5,there was a steady increase in the turbidity removalefficiencies.
5. Polyacrylamide based synthetic polyelectrolyteFor the polyacrylamide based synthetic
polyelectrolyte, the maximum turbidity removal efficiencywas obtained at a pH of 10.5 as shown in Fig.3.5. At thispH value, a turbidity removal efficiency of 25 per cent wasobtained for the sample with initial turbidity of 2100 NTU:while the removal efficiency obtained for the sample withinitial turbidity 680 NTU was 23 per cent.
6. Polyamine based synthetic polyelectrolyteThe effect of pH on the coagulation efficiency of
polyamine based anionic polyelectrolyte is illustrated in

(\l«-4
(D
149
DB2 omo n .».EmHmm3. q<H.H.HzH ODB2 ooam n rflammoa q<H.uHzH 4
H\me V mmoo
Q.
L- ...1___,_.___- L,._-..
'IVI\()w'.-IL! .R.l.[(llH}l{1.l. .l.Ni-_lI) U'.:ld

III) -c).||.I|J)- )d .1 .n0 )1.)In..) I) ..)lI..2.)n;...)) ..) .3: 4). 11.1-41uE5-OWEth-nh»Ln rrHmTE7>u (Tr(FFflV >n 7(rFn-:(n(( 7( Tr u( Etunnn
150
“G)
sax omm u mmHmHmmoa q4HnH-u muDB2 oofl mmmmmmmpm ammumzu
|(|(4)
('3ll['11
_,_| _,_________.T_ _J.___... .. -.__
If)
'l\‘I/HVWFIH X.T.I('lIfl}lf1.I. .I.NFlI‘Hfv'lr1

151
mawqomaumqmwqom
uHemmazwm UHZOHZ4 Mm zoHa«gou<ou Z0 mm mo enmmmm
mm
3 m w V
j M _ 4. a M _M_ M_ ‘ I\ ,
} 1‘ @\@n@ j
@ 010 0.. @fiww.®\ J. @/ \ .l\..Q
/O\ /\ 4 omQ om
oaz omo u E.HoHmmE ..._<HHHzH O _
1 ow
2.2 82 u .«:H.HQHmms.H ..;:,SzH 4
$9.. v mmoo _
'l\lI\()N'.-HI A.l.l(lllllIl].I. .l.N'.-VI) HI-Id

152
Fig.3.6. The maximum turbidity removal efficiency wasobtained at a pH of 11.0. The removal efficienciesachieved were 21 per cent and 19 per cent respectively forthe initial turbidity values, 2100 NTU and 680 NTU.
The optimum pH values for the effectivecoagulation action of each of the polyelectrolytes arelisted in Table 3.2.
b) Effectiveness of Polyelectrolytes in COD ReductionTurbidity Removal and Ammoniacal Nitrogen Removal
The effectiveness of the polyelectrolytes wasassessed in terms of their ability to remove COD, turbidityand ammoniacal nitrogen from centrifuge latex concentrationwastewaters. Four polyelectrolyte dosages: 2 mg/l, 4 mg/l,6 mg/l and 8 mg/l were tried on each of the four effluentsamples after adjusting the pH to optimum values. The percent COD reduction, turbidity removal and ammoniacalnitrogen removal obtained for each of the polyelectrolytesare tabulated in Tables 3.3 to 3.8.
1. StarchFor starch, the maximum COD reduction ranging from
32 to 38 per cent was obtained with a dosage of 8 mg/1.

153
TABLE 3.2
OPTIMUM pH FOR THE EFFECTIVE ACTION OF POLYELECTROLYTES
Sl.No. Polyelectrolyte Optimum pH
1. Starch 8.52. Sodium alginate 9.53. Chitosan 10.04. Tamarind seed powder 7.55. Cationic syntheticpolyelectrolyte 10.56. Anionic syntheticpolyelectrolyte 11.0

154
ma na na ma vN mN ON HN Nm om mN >N .qma ma ed «a mN «N mN ma mm 5N Hm mN .mma ma «N Na ¢N NN oN ma mm mN Hm om .Nma ma ma «H mm vN mN HN mm mN mN mN .H
H\me H\me a\mE H\me H\me H\mE Hxme H\@E H\mE a\mE Hxme Hxme
m o v N m o v N w o v N .02
Hm2EEu
cmmouufic HMUHCOEEM ucwuumm
am>oEmu >uHvHnun9 ucmuuwm :oHuu5vwu.ooo ucmouwm maaemm
a«>ozmm zmoomaHz q<o<Hzozz<
oz< q¢>ozmm weHoHmmsa .zoHeo:omm Q00 ZH mom<em mo wozmHoHmmm
m.m mgmaa

155
The highest per cent COD reduction, 38 per cent wasobtained for the raw effluent COD concentration of 8080mg/1. The maximum per cent turbidity removal andammoniacal nitrogen removal were also obtained with thestarch dosage of 8 mg/1. While the maximum turbidityremoval of 26 per cent was obtained for the effluentsample-1 with an initial turbidity of 490 NTU, the maximumammoniacal nitrogen removal of 18 per cent was obtained forthe effluent samples, 1, 3 and 4 which had initialammoniacal nitrogen content of 570 mg/1, 590 mg/l and 630mg/l respectively.
The coagulation action of starch may be attributedto the "bridging" action brought about by the amylopectinfraction which has a very high molecular weight rangingupto 106 (23). In effect, starch may be considered as anon—ionic polyelectrolyte which does not ionise in solutionand hence does not neutralise the charge on the colloidalparticles.
2. Sodium alginateIn the case of sodium alginate, the optimum dosage
for COD reduction, turbidity removal and ammoniacalnitrogen removal was found to be 4 mg/1. The per cent COD

156
«H ma Hm ma mm am mm mm mm mm aw mm .vmfi ma om ma ma mm mm mm mm mm mw mm .mma ma ma NH om mm mm mm mm mm NV mm .mvfi ma om ma mm mm mm mm mm mm mv ow .a
Hxme Hxoe H\me Hxme H\me Hxme a\mE H\me Hxme H\me Hxme Hxme
m o v N m m V N m o v N
.02
Hm%mmmm%%<cmmmmm%w am>oEmu >uH©HDu5B ucwuumm cofluusvmu oou ucmuumm waaamm
q<>ozmm zmoomaHz g¢o¢Hzozz<
ozc q<>ozmm waHoHmm:s \zoHao:omm Q00 ZH ma<zHoq¢ zoHoom mo »uzmHoHmmm
v.m mgm<a

157
reduction obtained with this dosage was in the range of 4143 and the maximum removal efficiency was obtained for theinfluent COD concentrations, 1170 mg/l and 5790 mg/1.While the per cent turbidity removal at the optimum dosagevaried between 27 and 29, the per cent ammoniacal nitrogenremoval varied between 19 and 21.
Alginic acid is either a mixture of (l-4)—p—D—mannuronic acid or of L—guluronic acid, or else is acopolymer of the two uronic acids (32) which contain the—COOH group. At pH higher than 3, -COOH will ionize as —COO- (24) which shows that sodium alginate or alginic acidis an anionic polyelectrolyte of high molecular weight.Due to its anionic nature, sodium alginate is ineffectivein neutralising the charge of colloidal particles. Thecoagulation action can be attributed to the bridgingmechanism which basically depends on the molecular weightwhich in turn determines the size and segments of thepolymer formed on dissolution in water (6).
3. ChitosanFor chitosan, the optimum dosage was found to be
2 mg/l for COD reduction, turbidity removal and ammoniacalnitrogen removal. At the optimum dosage of 2 mg/l, the CODremoval efficiencies varied between 49 and 52 per cent and

158
«H ha ma mm vm mm mm vm Nv aw NV om .vma ma om mm mm mm Hm um mv wv mv ow .mvfl ea om Hm om Hm mm mm nv ow vv mm .mma ma ma mm um mm om vm mv ow sq am .a
H\me H\me H\ms H\me Hxme a\mE H\mE a\mE Hxme Hxme Hxme a\mE
m o v N m o w m m o v m
m .oz
dm%m%mmm%<cmcmmmww Hm>oEwu >uHCflQuDB ucwuumm cofluusowu ooo ucwuumm waaemm
q«>ozmm zmoomaHz q<o<Hzozz<
az¢ MHHQHmmDB .zoHaoaomm QOU ZH z¢moaHmu mo »ozmHoHmmm
m.m mqm<a

159
the maximum reduction of 52 per cent was obtained for theinfluent COD concentration of 8080 mg/l. As for turbidityremoval, efficiencies ranging from 34 to 37 per cent wereobtained for all the samples at the optimum dosage of 2mg/l. At the optimum dosage, the ammoniacal nitrogenremoval efficiency varied between 21 and 23 per cent.
Chitosan solution is generally prepared in acetic
acid. In the Chitosan solution in acetic acid, —NH3+groups are responsible for the polyelectrolyte behaviour
while CH3COO_ counterions are free to move (27). Atrelatively high concentrations, the polyelectrolytemolecules overlap each other and the counterions are notallowed to leave the molecular domain. As dilutionincreases, and the counter ions diffuse in regions wherethe polymer molecules are absent, the total electric chargeon each polymer chain increases and forces the molecule toextend itself to a large configuration. The largeconfiguration results in bridging which describes thedestabilization mechanism where molecules if addedchemically attach on to two or more colloids causingaggregation. The polymer is useful for aggregating andbinding together negatively charged aggregates intoagglomerates that resist redispersion.

160
4. Tamarind seed powderIn the case of Tamarindus indica seed powder, the
optimum dosage for COD reduction, turbidity removal andammoniacal nitrogen removal was found to be 4 mg/1. Theper cent COD reduction obtained with this dosage was in therange of 45-48 per cent and the maximum removal efficiencyof 48 per cent was obtained for an initial CODconcentration of 8080 mg/1. While the per cent turbidityremoval for the optimum dosage of 4 mg/l varied between 31and 34 per cent, the ammoniacal nitrogen removalefficiencies varied between 18 and 22 per cent.
The polyelectrolyte behaviour of tarmarind seedpowder may be attributed to the fact that its Inoleculescontain —COOH group which dissociates into -COO‘ at pHhigher than 3 (24). This shows that the tamarind seedextract has anionic behaviour. Hence the coagulationaction of tamarind seed powder should be due to thebridging mechanism.
5. Polyacrylamide based cationic polyelectrolyteThe effectiveness of the cationic polyelectrolyte
in treating the effluent samples from a centrifuge latex

161
ma ma mm ma mm «N Hm mN ow NV ow NV .v«N ma oN ma mN mN «N NN mm H¢ mw Nv .mma ma ma NH «N oN Nm om Nw «N aw mq .NNH «N ma ma oN NN Hm NN av mv Nw vw .H
H\wE N\me H\mE H\mE N\oE N\me Nxme H\mE N\me N\oe N\oe H\mE
N 0 N N N o N N m m N N
.ozHm>oEmu cmmouufiz coauusowu wuaoanusa ucwuuwm coauosvwu moo ucmuumm mamamm
HmumH:oEE< ucwuuwm . . . .
q<>ozmm ZMUOMBHZ q¢o<Hzozz<
oza q<>ozmm MBHQHmmDB .zoHao:amm QOU ZH mmozom ammm ozHm<z<a mo wuzmHuHmmm
o.m mqmaa

162
OH Ha NH ma am mN vN mN mN mN Hm «N .mHa NH ma «H oN mm mm wm mN mN mN om .Nm OH NH ma Hm mN Hm mw hm mN om Nm .H
Cm... Co... Co... Co... Co... 19.. Qme Cm... Cm... Cm... iv... 19..
N o v N m o N N m o N N
.ozHm>oEwu cwmouuflc cofiuunowu xufivfinusa ucmuumm cofluuswmu ooo ucwuuwm wamemm
HmUmHCOEE< ucmuuwm
q<>ozmm zmoomaHz q<U<HZOEE<
oz< q<>ozmm waHoHmmoa .zoHeu:omm QOU ZH mawqomaomqmwqom uHammezwm UHZOHB<U mo wozmHuHmmm
N.m mqm<a

163
concentration unit was most optimum at a dosage of 2 mg/l.with this dosage, maximum reduction could be achieved forCOD, turbidity and ammoniacal nitrogen. The COD reductionefficiency obtained at the optimum dosage varied between 30and 34 per cent. The turbidity removal efficiencies andammoniacal nitrogen removal efficiencies achieved at theoptimum dosage were in the ranges of 24-28 per cent and14-16 per cent respectively.
Polyacrylamide is classified as a non—ionicpolyelectrolyte. It is made cationic by special processes(6) and gives best results at high molecular weights. Thecoagulation action of the cationic polyelectrolyte solutionused in the study may be attributed to chargeneutralisation and bridging action. The COD removalefficiency, turbidity removal efficiency and ammoniacalnitrogen removal efficiency achieved by the cationicpolyelectrolyte was found to be less than that achieved bystarch, sodium alginate and tamarind seed powder which areeither non—ionic or anionic in nature. This may be due tothe inadequate positive charge imparted to thepolyacrylamide molecule by the special processes.

164
6. Polyamine based anionic polyelectrolyteIn the case of polyamine based anionic
polyelectrolyte, the optimum dosage for COD reduction,turbidity removal and ammoniacal nitrogen removal was foundto be 4 mg/l. The per cent COD reduction obtained withthis dosage was in the range of 24-26 and the maximumremoval of 26 per cent was obtained for the influent CODconcentration of 5790 mg/l. While the per cent turbidityremoval at the optimum dosage varied between 19 and 21 percent, the per cent ammoniacal nitrogen removal variedbetween 10 and 13.
Polyelectrolytes based on polyamine are generallycationic polymers of low to medium molecular weight (34).The polyamine based used in the study should have been madeanionic by special techniques (6). The coagulation actionof the anionic polyelectrolyte can be attributed tobridging mechanism.
The optimum dosages for the most effectivecoagulation action of each of the six polyelectrolytesstudied and the maximum removal efficiencies obtained for
COD, turbidity and ammoniacal nitrogen are summarised inTable 3.9.

165
a HH NH OH mH ©H HN wH om HN ©N mm .mw m OH m 5H mH mH mH NN vm vm ON .Nm OH NH OH ©H wH ON nH Hm mm mm NN .H
H\mE H\mE H\mE H\mE H\mE H\mE H\wE H\mE H\oE H\mE H\wE H\mE
w o v N w o v N w o w N
.02Hm%mmmM%%<cm%mMm%w Hm>oEmu >uH©HnusH ucwuuwm coHuu:©mu oou ucmuumm mHQEmw
q<>ozmm zmoomaHz q¢U<HZOEE¢
oz« g¢>ozmm wBHQHmmDB .zoHeooomm QOU ZH mswgomaumqmwgom oHammazwm UHZOHz¢ mo wuzmHuHmmm
m.m mgm<a

166
NH Hm wN N w w mu>NouuumNm»Noa
UHCOHCM nmmmn w:NEm>Hom .o
ma mN «N N N N mu>HopuumNmI>aom uacoflumu
Uwmmn mcHEmaHuom>aom .mmm «m av v v v umczom ommm ocflumeme .v
mm mm Nm N N N cmmouflsu .mHm mN mv v v v mumcflofim e:Noom .Nma mN mm m m m coumum .H
Hm>oEmu coauu Hm>oEwu COHMU
cmmouufl: Hm>oEmu Isnmu cmmouufic Hm>oEmu Isomu .ozHmumNcoEE¢ >uNuNnusa oou NmumNcoea¢ mufloflnuse 900 wu>HouuuwHw>aom .Hm
cw>wHcom N\me
>ucwNuHmwm am>oEwu Eseflxmz wmmmon ESEHHQO
mez<q2o<oo wm<zHmm m¢ mmawqomaomgmwqom maoHm<> mo zomHm<mzou
m.m mqm<a

167
From Table 3.9, it is evident that Chitosan is themost effective polyelectrolyte among the six polyelectrolytes studied as primary coagulants in respect ofCOD reduction, turbidity removal and ammoniacal nitrogenremoval. Chitosan is followed by Tamarind seed powder,sodium alginate, starch, polyacrylamide based cationicpolyelectrolyte and polyamine based anionic polyelectrolytein that order for COD removal, turbidity reduction andammoniacal nitrogen removal. The study clearly shows thatthe natural polyelectrolytes perform better than thesynthetic polyelectrolytes in the treatment of effluentsfrom a centrifuge rubber latex concentration unit.
c) Settling Characteristics of Sludge
The settling characteristics of the flocs formedby each of the polyelectrolyte are plotted in Figures 3.7to 3.12. It is evident from the figures that the settlingcharacteristics of the sludge formed by thepolyelectrolytes are more or less similar in nature. Mostof the sludge settling occured during the first 5 to 6minutes.
The height of the sludge at the end of 20 minuteswas 1.0 cm for the effluent treated with chitosan, the

168
.mum<am Mm omzmom mooaqm mo muHamHmmau<m<mu ozuqammm n.m.uHm
Ammuncfiev mzHH
om ma NH m v_ _ H 4
flV|}‘l'hV‘ll[[LQ?|l"'IflU IlIIl©Q|l!lII@w Q9
I//o
m.w "maHxme m "mmoo
(mo) anunws do mnslan

169
.m.S_zHu.2 zDHDOm wm omzmou. muooam mo muEmHmmao<m«mu UzH.H.H:H.mm
Ammuscaew mzHa
om ma NH m w
_ _ fl _
OI:/O
._ VIIO/O
/0
/AU Lv
/
lmflGm.m "mm _
[NH
Hxma v ummoo
E|‘.)(l[l‘lS .:lO J.lIf)I Elli(mo)

170
z¢moaHmu am omzmom mooagm mo muHamHmmau4m<mu uzHgsamm .n.94I (Ih
Am0u~DEHEV MZHB
ON ma Na w \%
onion/0/ol/0
/7
OIOIO
[.
0/ .O/O J uI w
5O
0.0H "mmHxma N "mmoo
(HID) Elf)(|fl']S JO J.H'.')IEJll
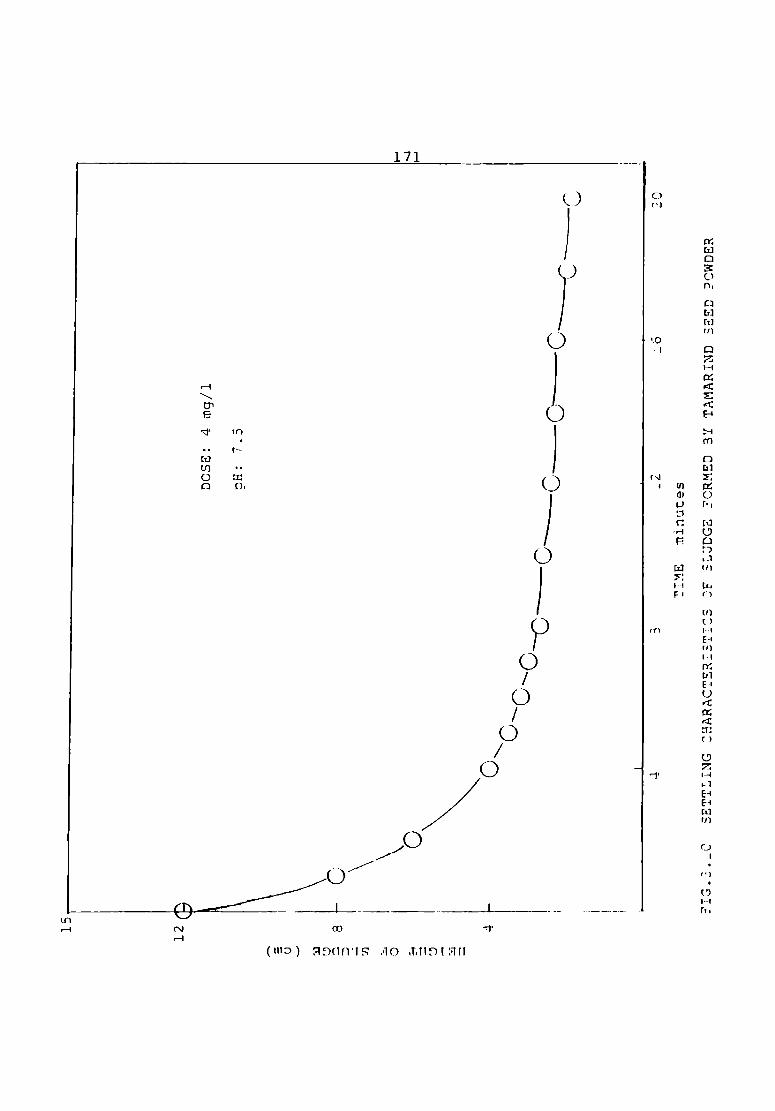
mmmm ozHm§.3 um omzmon. magnum ma muhrmmmmuuamamu wzflaamm o-..3wHm
mmuscafi m.$.H..ur
01. Q4
l_ .1
m
'1
171
(D
(W3) HDUHWS JO mHDTHH

172
mamqomaumqmwqom uHzoHa4n
omm¢m mnHz<g»mu<»qom am omzmom moopgm mo muHamHmmau¢m<mu uzHu mum n.m.uHm
Ammuscdi mEH.H_
om ma ma w v
4 _ .4 .
/0
“Vi,
O/O L
O/O
,v)xp
m.oH “mmH\ma N "mmoo
/NH
(mo) QDGHWS JO LHDIQH

ommam mzHz«wqom wm omzmom
Amwuscasv
om ma ma
mawgomaumqmwqom UHZOHZ4muooqm mo mnHumHmmau<m¢mu uzHqaamm
MZHB
Q.
NH.m.uHm
C
173
\./Illlll
O/I
QIQ/O
O
'.3lD(Il]'lS .50 .].HE)I3H(W3)

174
minimum sludge height obtained during the studies. Thisshows that the sludge formed by chitosan gets compessedbetter than the sludges formed by other polyelectrolytes.Chitosan was followed by sodium alginate, starch, tamarindseed powder, cationic synthetic polyelectrolyte and anionicsynthetic polyelectrolyte in that order in sludgecompression ability. Compared to the metal coagulantsstudied in chapter 2, the polyelectrolytes have shownbetter sludge compression ability. Among the metalcoagulants, aluminium chloride which showed the best sludgesettling characteristics could compress the sludge only to1.8 cm at the end of 20 minutes. The three naturalpolyelectrolytes, viz., chitosan, sodium alginate andstarch performed better than aluminium chloride in sludgecompression.
d) Polyelectrolytes as Coagulant Aid
The results obtained with all the sixpolyelectrolytes are given in Table 3.10 to 3.15. It isapparent from the tables that small quantities ofpolyelectrolytes effectively reduce the metal coagulantdosage.
Starch solution could bring down the dosage ofalum, ferric chloride and aluminium chloride by 50 per

175
TABLE 3.10
EFFECTIVENESS OF STARCH AS COAGULANT AID
Metal Dosage Dosage Turbidity Reduced Starch Turbidity pHcoagulant of of NTU metal dosage NTUmetal starch coagu— mg/1coagulant lant dosemg/1 mg/1 "'9/1O —- 1200200 -— 720 250 2.0 680 8.2mm 300 -- 708 250 4 .o 620 8 .0400 -- 684 250 6.0 610 7.5500* —— 648 250 8.0 590 7.8
o __ 1200200 —— 732 240 2.0 750 8.1FeC13 300 —- 763 240 4.0 740 3.3400* —— 720 240 6.0 742 8.2500 —— 756 240 8.0 735 8.2
O —— 1200 138200 —— 624 138 2.0 630 8.1AlCl3 300* —— 576 133 4 .0 592400 —— 588 138 6.0 575500 —— 612 138 8.0 560 8.2
* Optimum dose.

176
cent, 40 per cent and 54 per cent respectively. Inconjunction with the reduced aluminium chloride dosage, astarch dosage of 8 mg/l could achieve better turbidityremovals than that achieved by the optimum dosage ofaluminium chloride when used alone.
Sodium alginate could reduce the dosage of alum,ferric chloride and aluminium chloride by 50 per cent, 42per cent and 55 per cent respectively. Compared to thecombinations with alum and ferric chloride, the combinationwith aluminium chloride gave better clarity of thesupernatant. Sodium alginate dosage of 4 mg/l was found tobe the most effective.
As for chitosan, it could bring down the dosagesof alum, ferric chloride and aluminium chloride by 51 percent, 44 per cent and 60 per cent respectively. The mosteffective chitosan dosage was found to be 2 mg/l.
Tamarind seed powder was found to act effectivelyas a coagulant aid at very low dosages. The consumption ofalum, ferric chloride and aluminium chloride were reducedby 50 per cent, 42 per cent and 57 per cent respectively.Tamarind seed extract dosage of 4 mg/l was found to be themost effective.

EFFECTIVENESS OF SODIUM ALGINATE AS COAGULANT AID
TABLE
177
3.11
Metal Dosage Dosage Turbidity Reduced Sodium Turbidity pHcoagulant of of NTU metal alginate NTUmetal sodium coagu— dosagecoagu— alginate lant mg/llant mg/lmg/1
O —— 1200200 —- 720 250 2 710 9.0ALUM 300 -— 708 250 4 640 8.5400 —— 684 250 6 660 8.7500* -- 648 250 8 684 9.2
O —— 1200200 -— 732 232 2 726 9.4FeCl3 300 —— 768 232 4 712 9.2400* —— 720 232 6 742 9.1500 -- 756 232 8 755 9.0
O‘ —- 1200200 —- 624 135 2 580 8.9AlCl3 300* —- 576 135 4 560 9.1400 —- 588 135 6 597 9.2500 —— 612 l35 8 621 8.8
* Optimum dose.

178
TABLE 3.12
EFFECTIVENESS OF CHITOSAN AS COAGULANT AID
Metal Dosage Dosage Turbidity Reduced Chitosan Turbidity pHcoagulant of of NTU metal dosage NTUcoagu— chitosan coagu— mg/1lant mg/1 lantmg/1 mg/10 -— 1200200 —— 720 245 2 640 9.2
ALUM 300 —— 708 245 4 725 9.1400 -- 684 245 6 740 9.5500* —— 648 245 8 752 9.4
O -— 1200200 —— 732 224 2 705FeCl3 300 —— 768 224 4 748400* —- 720 224 6 767500 —— 756 224 8 778 .
O —— 1200200 —— 624 120 2 552 9.5A1C13 300* —— 576 120 6 568 9.2400 —— 588 120 6 582 9.5500 —- 612 120 8 602 9.4
* Optimum dose.

EFFECTIVENESS OF TAMARIND SEED POWDER AS COAGULANT AID
179
TABLE 3.13
Metal Dosage Dosage Turbidity Reduced Tamarind Turbidity pHcoagulant of of NTU metal powder NTUcoagu— tamarind coagu— dosagelant powder lant mg/1mg/1 mg/1 mg/1
O —— 1200200 —— 720 250 2 710 6.8ALUM 300 —— 708 250 4 640 6.7400 -- 684 250 6 722 6.8500* —— 648 250 8 682 6.7
O —- 1200200 -- 732 232 2 724 7.6FeCl3 300 —— 768 232 4 706 7.5400* —- 720 232 6 742 7.5500 —- 756 232 8 760 7.4
O -— 1200200- —— 624 129 2 580 6.9AlC13 300* —— 576 129 4 542 7.0400 —- 588 129 6 612 7.0500 —— 612 129 8 630 6.8* Optimum dose.

EFFECTIVENESS OF CATIONIC SYNTHETIC POLYELECTROLYTEAS COAGULANT AID
TABLE
180
3.14
Metal Dosage Dosage Turbidity Reduced Poly- Turbidity pHcoagulant of of NTU metal electro- NTUmetal po1y— coagu- lytecoagu- electro- lant dosagelant lyte mg/1 mg/lmg/1 m9/1
0 —— 1200200 —— 720 250 2 640 10.2ALUM 300 —— 708 250 4 680 10.3400 —- 684 250 6 710 10.1500* -- 648 250 8 724 10.4
0 —— 1200200 —— 732 208 4 740 10.1FeC13 300 —- 768 208 4 740 10.1400* —— 720 208 6 765 10.3500 —— 756 208 8 780 10.3
0 —- 1200200 —— 624 135 2 560 10.3A1C13 300* —- 576 135 4 582 10.2400 —— 588 135 6 614 10.1500 —— 612 135 8 638 10.2
* Optimum dose.

EFFECTIVENESS OF ANIONIC SYNTHETIC POLYELECTROLYTEAS COAGULANT AID
181
TABLE 3.15
Metal Dosage Dosage Turbidity Reduced Po1y— Turbidity pHcoagulant of of NTU metal electro— NTUmetal poly— coagu— lytecoagu— electro— lant dosagelant lyte dosage mg/1mg/1 mg/l mg/1
O —- 1200200 —- 720 290 2 652 10.6ALUM 300 —- 708 290 4 630 10.4400 -— 684 290 6 720 10.4500* -- 648 290 8 704 10.5
0 —- 1200200 —- 732 240 2 740 10.5FeCl3 300 —— 768 240 4 700 10.6400* —— 720 240 6 765 10.5500 —- 756 240 8 780 10.4
0 -— 1200200 -— 624 162 2 540 10.6AlCl3 300* -- 576 162 4 582 10.5400 —— 588 162 6 578 10.5500 -- 612 162 8 614 10.4* Optimum dose.

182
In the case of polyacrylamide based cationicpolyelectrolyte, a small dosage of the polyelectrolytecould bring down the consumption of alum, ferric chlorideand aluminium chloride by 50 per cent, 48 per cent, and 55per cent respectively. The most effective dosage of thecationic synthetic polyelectrolyte was found to be 2 mg/1.
The polyamine based anionic polyelectrolytereduced the dosage of alum, ferric chloride and aluminiumchloride by 42 per cent, 40 per cent and 46 per centrespectively. The most effective dosage of the anionicsynthetic polyelectrolyte was found to be 4 mg/1.
Among the combinations of metal coagulants andpolyelectrolytes, the combinations with aluminium chloridewas found to be the most effective. This was followed bythe combinations with alum and ferric chloride. Among thevarious combinations, a combination of chitosan andaluminium chloride could bring about better clarificationof the centrifuge rubber latex concentration wastewaterscompared to other combinations.
3 .4 CONCLUSION
l. The optimum pH values for the effective coagulationaction of the six polyelectrolytes, viz., starch, sodium

183
alginate, chitosan, tamarind seed powder, cationicsynthetic polyelectrolyte and anionic syntheticpolyelectrolyte were determined. The optimum pH valueswere in the range of 7.5—11.0.
Among the six polyelectrolytes studied, chitosan wasfound to be the most effective as a primary coagulant inthe treatment of centrifuge latex concentrationwastewaters. Chitosan could bring about the maximum CODreduction, turbidity removal and ammoniacal nitrogenremoval compared to other polyelectrolytes.
The compressibility of the sludge produced by chitosanis better than that of other polyelectrolytes.
Polyelectrolyte solutions have a high potential ascoagulant aid also in the treatment of effluents from acentrifuge rubber latex concentration unit. While usedin conjunction with metal coagulants, a very small
of the polyelectrolyte could reduce thequantityrequirement of metal coagulant by 40-60 per cent withbetter clarity of the supernatant.
Among the six polyelectrolytes studied, chitosan provedto be the most efficient at a dosage of 2 mg/1 bringing

184
about 50-60 per cent reduction in the metal coagulantdose. A combination of chitosan and aluminium chloridewas the most effective.
Among the two synthetic polyelectrolytes studied. thepolyacrylamide based cationic polyelectrolyte performedbetter than the anionic one. As a coagulant aid; thecationic one could bring down the metal coagulant doseby about 50 per cent at a lower dosage.

185
REFERENCES
Black, A.P. et al., J. Amer. water Wks. Assoc., 51, 247(1959).
Riddick, T.M., J. Amer. Water Wks. Assoc., 53; 1007(1961).
Borchardt, J.A., Water & Sewage Wks. J., 108, 201 (1961).
Fuoss, R.M. and Cathers, G.I., J. Polymer Sci., 2, 12(1947).
Cohen, J.M. et al., J. Amer. Water Wks. Assoc., 50, 463(1958).
Singh, R.C., Indian J. Environ. H1th., 27(1), 15 (1985).
Singh, R.C., Jour. Inst. of Engr. (India), 60, EN—3, 75(1980).
Singh, R.C., Jour. Inst. of Engr. (India), 60, EN—3, 80(1980).

10.
11.
12.
13.
14.
15.
16.
186
Rebhun, M., D.Sc. Thesis, Haifa (1966) (not in original).
Singh, R.C., Proc. of the Semi Annual Paper Meeting of theInst. of Engr. (India) held at Jabalpur (1974).
Dhekane, N.Y., Ambawane, G.B., Patil, B.N. and Pagar,S.D., J. Pub. Hlth. Div. Inst. of Engr. (India), 50, 10,Pt.PH3, 108 (1970).
Beard, J.B. and Tanska, T.S., J. Amer. Water Wks. Assoc.,66, 2, 109 (1974).
Rebhun, M. et al., Final Report, Technion, Hafia (1968)(not in original).
Adin, A., Baumann, E.R. and Cleasby, J.L., J. Amer. WaterWks. ASSOC.) 71] 11
Nadkarni, K.M., Indian Materia Medica.
Subbaramiah, K. and Sanjiv Rao, B., Proc. Indian Acad.Sci., 7, 59 (1937).

187
17. Sen, A.K. and Bulusu, K.R., Env. H1th., 4, 233 (1962).
18. Bulusu, K.R. and Sharma, V.P., Env. Hlth., 7, 165 (1965).
19. Bulusu, K.R.,Thergaonkar, V.P., Kulkarni, D.N. andPathak, BoNof Env. Hlth-1 10,
20. Pathak, B.N., Thergaonkar, V.P., Kulkarni, D.N. andBulusu, K.R., Env. H1th., 12, 28 (1970).
21. Rao, M.N. and Sastry, C.A., J. Indian Wat. Wks. Assoc., 5,4, 242 (1973).
22. Bulusu, K.R. and Pathak, B.N., Indian J. Env. H1th., 16,1, 63 (1974).
23. Pandit, R.K., Env. H1t:h., 7, 1, 39 (1965).
24. Tripathi, P.N., Chaudhuri, M. and Bokil, S.D., Indian J.Environ Hlth., 18, 4, 272 (1976).
25. Prasad, D.Y. and Jivendra, J. Indian Wat. Wks. Assoc., 13,
4, 323 (1981).

188
26. Azharia, S.A. and Dirar, H., Water, SA, 5, 2, 90 (1979).
27. Vaidya, M.V. and Bulusu, K.R., Jour. Inst. of Engr.(India); 64/ EN]
28.Dbore, K.J., Johnson, M.G. and Sistrunk, W.A., J. FoodSci” 52(2), 491 (1987).
29. Karim, M.I.A. et al., Biol. Wastes, 22(3), 209 (1987).
30. Prasad, D.Y. and Belsare, D.K., J. Indian Wat. Wks.Assoc” 14, 3 (1982).
31. Sflmmwala, T.A. and Reddy, K.G., Indian J. EnvironmentalProuxtion, 9, 7 (1989).
32. Kiflm Othmer (Ed.), Encyclopedia of Chemical Technology,VolJD, 3rd edn., John Wiley & Sons (1980).
33. Stamhrd Methods for the Examination of Water andWastamter, 16th edn., American Public Health Association(1985).
34. Use of Polymeric Flocculants in Process Industries, IronExchange (India) Ltd.

Chapter 4
BIOCHEMICAL OXIDATION KINETICS
4.1 INTRODUCTION
Microorganisms degrade the organic matter presentin any wastewater aerobically. The dissolved oxygenpresent in wastewater is utilised by the microorganisms forthe biochemical oxidation of organic matter. The amountof oxygen required at any given time depends on the quantumof bio—degradable organic matter and also on the microbialpopulation present in wastewater. The most widely usedparameter of organic pollution is the "biochemical oxygendemand (BOD)". The determination of BOD involves themeasurement of dissolved oxygen utilised by microorganismsin the biochemical oxidation of organic matter (1).
The constituents of the effluents from acentrifuge rubber latex concentration unit are mostlycarbonaceous in nature (2). A procedure for BODdetermination has been prescribed in standard methods (3).This test is performed at 20°C for 5 days. Many a times,BOD is estimated everyday by incubating samples for periodsranging from 1 to 15 days. BOD values on each day can be
189

190
used to obtain the rate at which dissolved oxygen is beingconsumed during the incubation period. A constant ofproportionality, 'K' exists between the rate of oxygenutilisation by microorganisms and the rate of destructionof bio—degradable organics under aerobic conditions (4).Also, after a long period of time, when the waste shouldhave been stabilised, a constant 'k' exists which measuresthe biochemical stabilisation of organic matter in thesystem. Little work has been done on the biochemicalkinetics of natural rubber processing wastewaters. Henceit has been found desirable to determine the values of kand K for the effluents from a centrifuge rubber latexconcentration unit which contributes maximum to thepollution load among rubber processing units. The BOD testis affected by many variables like temperature, time, pH,essential mineral nutrients, microbiological populations,toxicity and nitrification (5). The effect of temperatureis governed by the Vant Hoff Arrhenius relationship (6).
The purpose of the present study is to determinebiochemical stabilization rate constant (k), oxygenutilisation rate constant (K) and ultimate BOD (LO) on thebasis of observations made at 20°C on effluents collectedfrom a centrifuge rubber latex concentration unit. The

191
variation in the BOD values of the effluent at fourdifferent temperatures 20, 25, 30 and 35°C was alsoverified.
4 . 2 THEORY
a) Kinetics of Organic Degradation
The organic matter present in a system isconverted into various gases and cell tissue by the actionof microorganisms, especially bacteria. Oxygen is utilisedin the process of biodegradation. The oxygen demand bybacteria that degrade organic matter is called the firststage BOD. Noncarbonaceous matter, such as ammonia, isproduced during the hydrolysis of proteins. Some of theautotrophic bacteria are capable of using oxygen to oxidisethe ammonia into nitrites and nitrates (7). Thenitrogenous oxygen demand caused by the autotrophicbacteria is called the second stage BOD. At 20°C, thetemperature used for BOD test, the reproductive rate ofnitrifying bacteria is very low (8).
The kinetics of BOD reaction can be formulated on
the basis of first order reaction kinetics and may beexpressed as,
d_Ldt =—-KL (1)

192
where L = amount of first—stage BOD remaining in thewastewater at time 't', mg/1
K = first order oxygen utilisation rate constant fororganic matter by oxidation during biodegradationprocess.
dL _77 K dt (2)Integrating (2) between limits Lo and L at time t = 0 and trespectively.
L1"(f ) = —Kt (3)o
ie.. § = e_Kt = 10”“ (4)0
Where L0 = BOD remaining at time, t = 0 (ie., the total orultimate first stage BOD initially present)
k and K are related by the expression,
K
2.303
The amount of BOD remaining at any time t,
L = L x 1o’kt (5)

193
If 'y' is the BOD exerted at any time 't' then,
y = LO — L (6)= L — L 10'ktO O_ _ —kt— LO (1 10 ) (7)
If the oxidation process is allowed to last for akt tends tolong time, ie., as 't' tends to infinity; 10
zero and y = L . Hence 'k' measures the rate ofbiochemical stabilisation of organic matter present in the
system and Lo measures the total amount of oxidisableorganic matter present and is regarded as the ultimate BOD.
b) Determination of k, K and Lo
Some methods for the determination of k, K and Lohave been developed and discussed by many researchers likeThomas (9), Thomas et al. (10), Eckenfelder (11) andOluwande(l2). The method for the determination adopted inthis study is the "log—difference" recommended byEckenfelder (ll).

194
c) Log—Difference Method
Differentiating Eq. (7) with respect to 't';
kt) (2.303 log 10) (—k)fifi? = LO(-l0
For definite changes in the amounts of 'y' and't', we have
A1’. = _ ‘ktAt 2 303 Lok x 10 (8)%% is the rate of oxygen utilisation.
Taking decimal logarithms,
log %% = log (2.303 Lok) — kt (9)
Thus. when log ( Ay/'At) is plotted against 't', a straightline graph is obtained whose slope is —k.
ie.; k = —(slope) (10)From equation (5), K = 2.303 x slope
(N.B. The values of K and k are always rendered in positive).

195
The intercept of the graph on the ordinate axis
log (2.303 L k)0 (11)log (LOK)
ie., log L0 = intercept — log K (12)
Hence the ultimate BOD, ie., Lo, can be calculated fromEqns. (11) and (12).
When the BOD of wastewater is determined for along time (in days) and a graph is plotted against time,the curve obtained (not considering the effect of nitrification) is as shown in Fig.4.l.
d) Effect of Temperature on k
Rate of any chemical or biochemical reaction attwo temperatures vary and they are governed by Vant HoffArrhenius relationship:
2d(lnk)/dt = E/RT (13)where T = temperature, °K
R = ideal gas constant, andE = activation energy constant.

196
HEHB .m> mm>mau mom omNS.<.mmzmu
T T35 z_ m.1_»_ Tl
§.v.uE
m><o z. mz:
/ %/.4
4-r—:———(1)9mNIvw3u 0 08
W_/ _.__ / \ _
I -uI3LFuL -.LLF-l }_., \
__.>5__.__.___
\\\
'<—— (1 EIZIHJD IIEIEJAXO

197
Equation (13) on integration gives the relation
(14)K /K = (T2 — T1)2 l 69 is called the temperature coefficient.
This equation can be used to find out the operative rateconstants as a function of temperature.
If the rate constant at 20°C is found out. thenthe same at temperature T will be
K :T K20. e(T_20) (15)4.3 RESULTS AND DISCUSSION
Composite wastewater samples collected from acentrifuge latex concentration unit at different times wereused for the study. Altogether 10 composite samples wereobtained and were used for BOD determination. The determination of BOD values was made as per the standard methods(3). The dilutions found suitable for the effluents were0.25, 0.1 and 1.0 percent. The diluted samples wereincubated at 20°C, 25°C, 30°C and 35°C and the incubation

198
period of the diluted samples varied between one day andseven days. The results of four samples for each of thefour temperatures are shown in Tables 4.2 to 4.3. They arerepresentative of the results of other samples.
4.4 RESULTS AND DISCUSSION
a) Evaluation of 'k' and 'K' valuesThe results of the analysis made for the various
samples at four different temperatures 20°C, 25°C and 30°Cand 35°C are shown in Table 4.1 and Tables 4.2-4.5.
log (%%) values are plotted against mid—intervalvalues of time 't' for each sample. The representativeplots are shown in Figs. 4.2 to 4.5.
From Fig.4.2,
_(slope) using Eqn.(l0)7?‘ II
= -3.24 — 2.32 da -16.5 Y1-0.142 day‘
10.142 day_ (ignoring the negative sign).7?‘ II

199
TABLE 4.1
CHARACTERISTICS OF THE LATEX CENTRIFUGING EFFLUENT
Characteristic Range Mean
pH 3.2-7.4 5.4Biochemical Oxygen Demand(BOD); mg/l 2800-5680 4800Chemical Oxygen Demand(000), mg/1 3420-10700 8200Suspended solids, mg/1 790-6140 3200Total Dissolved Solids, mg/1 6300-15200 11140
Total Nitrogen, mg/1 1130-3940 2010

200
TABLE 4.2
RESULTS OF ANALYSIS OF REPRESENTATIVE COMPOSITE EFFLUENTSAMPLES OF LATEX CENTRIFUGING UNIT
(Temperature: 20°C)
Time t BOD At Lo “id i”ter‘g:Tp1e in da;s) valfigé ?{:1) (Ay/%:t)::;:€E¥?°f(1) (2) (3) (4) (5) (6)
1 1985 1985 3.30 0.52 3040 1055 3.02 1.5
Sample 1 3 3850 310 2.91 2.54 4420 570 2.75 3.55 4750 330 2.52 3.56 5050 300 2.47 5.57 5259 209 2.32 6.51 2095 2095 3.32 0.52 3170 1075 3.03 1.5
Sample 2 3 3950 800 2.90 2.54 4530 530 2.76 3.55 4870 340 2.53 4.56 5160 290 2.46 5.57 5375 215 2.33 6.5
(contd..)

201
TABLE 4.2 (CONTD.)
(1) (2) (3) (4) (5) (6)1 1970 1970 3.29 0.52 2995 1025 3.01 1.53 3725 730 2.86 2.5
Sample 3 4 4305 580 2.76 3.55 4680 375 2.57 4.56 4950 270 2.43 5.57 5140 190 2.28 6.5
1 2010 2010 3.30 0.52 3086 1076 3.03 1.53 3865 779 2.89 2.5
Sample 4 4 4440 575 2.76 3.55 4790 350 2.54 4.56 5080 290 2.46 5.57 5280 200 2.30 6.5
log ( AY/ At)
202
SAMPLE — I
20"C
[.6 ”
k — 0.142 day-1
[.7 _ K = 0.326 day‘1L0 = 5331 mg/1
0.3 ~
0.4 —
I I I I _ I __Jm1 2 3 4 5 6 7TIME (t) [N DAYS
FIG.4.2: PLOT OF ( Ay/ At) AGAINST MID-INTERVALS 't'

203
TABLE 4.3
RESULTS OF ANALYSIS OF REPRESENTATIVE COMPOSITE EFFLUENTSAMPLES OF LATEX CENTRIFUGING UNIT
(Temperature: 25°C)
Mid intervalTime(t) BOD (y) Ay/At Log value ofin days values (t=1) (Ay/At) timeutu(1) (2) (3) (4) (5) (6)1 2900 2900 3.46 0.52 3720 820 2.91 1.53 4500 780 2.89 2.5
Sample 1 4 4900 400 2.60 3.55 5200 300 2.48 4.56 5375 175 2.24 5.57 5498 123 2.09 6.51 3100 3100 3.49 0.52 3950 850 2.93 1.53 4500 550 2.74 2.5
Sample 2 4 5000 500 2.70 3.55 5400 400 2.60 4.56 5700 300 2.48 5.57 5875 175 2.24 6.5
(contd..)

204
TABLE 4.3 (CONTD.)
(1) (2) (3) (4) (5) (6)l 2800 2800 3.45 0.5
Sample 3 2 3720 920 2.96 1.53 4340 620 2.79 2.54 4900 560 2.75 3.55 5320 420 2.62 4.56 5675 355 2.55 5.57 5850 175 2.24 6.5
1 2890 2890 3.46 0.52 3800 910 2.96 1.5
Sample 4 3 4590 890 2.95 2.54 5000 410 2.61 3.55 5350 350 2.54 4.56 5650 300 2.48 5.57 5850 200 2.30 6.5

log (Ay/At)
205
SAMPLE — 1
25°C
1.61.2“ _]k = 0.183 day ‘K = 0.42 day‘1
o,8— L0 = 4536 mg/1
0.4~
I 1 41 I I ,11 2 3 4 5 6 7TIME (t) IN DAYS
FIG.4.3: PLOT OF log (Ay/At) AGAINST MID—INTERNAL 't'

206
TABLE 4.4
RESULTS OF ANALYSIS OF REPRESENTATIVE COMPOSITE EFFLUENTSAMPLES OF LATEX CENTRIFUGING UNIT
(Temperature: 30°C)
Time (t) BOD (y) Ay/At Log Mid intervalin days values (t=l) (Ay/ At) V§1ue oft1me 't'(1) (2) (3) (4) (5) (6)l 3400 3400 3.53 0.52 4100 700 2.84 1.53 4750 650 2.81 2.5
Sample 1 4 5300 450 2.65 3.55 5700 400 2.60 4.56 5900 200 2.30 5.57 6050 150 2.17 6.5
1 3575 3575 3.55 0.52 4350 775 2.89 1.53 4860 510 2.70 2.5
Sample 2 4 5350 490 2.69 3.55 5775 425 2.63 4.56 5950 175 2.24 5.57 6075 125 2.09 6.5

TABLE 4.4 (CONTD)
207
(1) (2) (3) (4) (5) (6)
1 3400 3400 3.53 0.52 4120 720 2.86 1.53 4700 580 2.76 2.5
Sample 3 4 5200 500 2.69 3.55 5670 470 2.67 4.56 5950 280 2.45 5.57 6120 170 2.23 6.5
1 3350 3350 3.52 0.52 4200 850 2.93 1.53 4890 690 2.83 2.5
Sample 4 4 5320 430 2.63 3.55 5700 380 2.57 4.56 5970 270 2.43 5.57 6090 120 2.08 6.5

LOG (AY/At)
208
— SAMPLE — l30°C
F k = 0.153 day“1K = 0.422 day-1
— L0 = 5433 mg/1
1 1 n I L 11 2 3 4 5 6 7TIME (t) IN DAYS
FIG.4.4 PLOT op (Ay/ At) AGAINST MID INTERVAL OF 't'

209
TABLE 4.5
RESULTS OF ANALYSIS OF REPRESENTATIVE COMPOSITE EFFLUENTSAMPLES OF LATEX CENTRIFUGING UNIT
(Temperature: 35°C)
Mid intervalTime (t) BOD (y) Ay/at Log Vahm ofin days values (t=l) (by/At) timertr
(1) (2) (3) (4) (5) (6)1 3700 3700 3.57 0.52 4500 800 2.90 1.53 5070 570 2.75 2.54 5500 430 2.63 3.55 5890 390 2.59 4.56 6000 110 2.04 5.57 6075 75 1.87 6.51 3900 3900 3.59 0.52 4700 800 2.90 1.53 5100 400 2.60 2.54 5490 390 2.59 3.55 5870 380 2.58 4.56 6075 205 2.31 5.57 6110 35 1.54 6.5
(contd..)

TABLE 4 .5 (CONTD.)
210
(l) (2) (3) (4) (5) (6)1 3750 3750 3.57 0.52 4400 650 2.81 1.5
Sample 3 3 5000 600 2.77 2.54 5450 450 2.65 3.55 5860 410 2.61 4.56 6100 240 2.38 5.57 6230 130 2.11 6.5
1 3600 3600 3.56 0.52 4290 690 2.83 1.5
Samsple 4 3 4870 580 2.76 2.54 5420 550 2.74 3.55 5940 520 2.72 4.56 6090 150 2.17 5.57 6175 85 1.93 6.5

LOG ( AY/ At)
211
SAMPLE — 11.5- O 35°C
1.2 —
-1k: 0.22 day0.8”‘ _K = 0.506 day 1
L0 = 3943 mg/]0.4 —
L 1 1 1 I 1 11 2 3 4 5 6 7TIMF‘. (t) TN DAYS
F‘IG.4.5 PLOT OF‘ (AV/At) AGAINST MTD INTFJRVAI. OF‘ 't'

212
This means that the biochemical stabilization rate
constant for the degradation of organic matter in thecentrifuge rubber latex concentration effluent after aninfinitely long period of time is 0.142 day_l.
Also K = 2.303 k= 2.303 x (‘o.142)
= 0.326 day'1
ie.. K = 0.326 day_l (ignoring the negative sign).
Hence, the oxygen utilisation rate constant forthe bio—degradation of organic matter present in thecentrifugue latex concentration effluent is 0.326 day-1.
Hence, Eqn.(ll), the intercept of the graph on the
ordinate axis is log(2.303 Lok) or log(LoK).
From Fig.4.2,
log L0 = 3.24 — log(O.326).
L0 = 5331 mg/1.
Hence, the ultimate BOD of the latex effluent is 5331 mg/l.

213
By adopting a similar procedure, the values of k,
K and LO were calculated for samples 2 to 4. The valuesobtained at 20°C for the four samples are shown in Table4.6. From the four different values obtained for k, K and
1Lo, their mean values are 0.145 day- . 0.333 day"1 and 5475mg/l respectively.
The mean values of k and K obtained for the foursamples at different temperatures are given in Table 4.7.The values obtained for biochemical stabilization rateconstant, k, for the samples varied between 0.142 and 0.147day-1 at 20°C, the mean value being 0.145 day-1. The valuesobtained for oxygen utilisation rate constant, K, at 20°Cranged between 0.326 and 0.338 day_1; the mean value was
0.333 day_l. The ultimate BOD values (Lo) varied from 5331to 5671 mg/l and the mean value was 5475 mg/l.
Little work has been done on the biochemicaloxidation kinetics of natural rubber processing effluents.However, the 'k' value of polluted water and wastewater hasbeen found to be equal to 0.10 day-1. (13). Thecorresponding K values will be approximately 0.23 day—1.Also Fair et al. (4) found that K values for most sewages

214
TABLE 4.6
k AND 'K' VALUES AT 20°C FOR REPRESENTATIVE COMPOSITEEFFLUENT SAMPLES FROM THE LATEX CENTRIFUGING UNIT
k, day-1 K, day—l Lo, mg/1
Sample 1 0.142 0.326 5331.0Sample 2 0.146 0.336 5671.0Sample 3 0.144 0.330 5514.0Sample 4 0.147 0.338 5383.0

215
TABLE 4.7
MEAN VALUES OF k and K AT DIFFERENT TEMPERATURES
Temperature k, day_ K, day
20°C 0.145 0.33325°C 0.161 0.37030°C 0.190 0.43735° 0.250 0.567

216
were between 0.16 and 0.70 day_l. The mean value was foundto be 0.39 day_l. This mean value is comparable to the meanvalue of K obtained in this study for centrifuge latexconcentration wastewaters.
The experiments have shown that variations occurin the values of 'K'. Sawyer (14) has stated thatvariations in the composition of organic matter present inthe wastewater and ability of the microorganisms present todegrade the organic matter would cause variations in 'K'.It must be noted, however, that organic matter in solutionis always more readily available for biodegradation thanthat contained in the suspended matter which must firstundergo hydralysis before use. Balmat (15) reported muchhigher K values for the soluble fraction than for thesettleable fractions of the sewage. This implies that theBOD of raw sewage in the early stages is dominated by thedissolved organic matter. Another factor that causesvariations in 'K' value is the presence or absence of toxicsubstances (16).
b) Progressive BOD
The progressive BOD values obtained for the

217
centrifuge latex concentration wastewaters at fourdifferent temperatures 20°C, 25°C, 30°C and 35°C are shownin Figs.4.6—4.9.
The COD concentrations of the wastewater samplesare shown in Table 4.8.
The progressive BOD curves in Fig.4.6—4.9 indicatealmost identical trend in the exertion of BOD at alltemperatures. Figures 4.10-4.13 show incremental increasein BOD with time at four temperatures. BOD was 24.5 percentof COD (8080 mg/l) in one day at 20°C whereas in the sameperiod, about 45.3 percent is exerted when the temperaturewas raised to 35°C. This incremental exertion of BOD withtime decreases after the first day at all temperatures. Thedecrease in the incremental exertion of BOD became sharperas the temperature was raised from 20°C to 35°C. It ispossible that the microorganisms got established in theinitial period itself and exerted the maximum incrementalBOD on the very first day. The activity of themicroorganisms should have come down thereafter for reasonslike substrate inhibition and toxicity at all temperatures.

BOD, mg/l
6000
50(X)
4000
3000
2000
1000
218
C) SAMPLE — 1
[§ SAMPLE — 4
I I I I IFIG.4.6
3 4 5 6 7DAYS
PROGRESSIVE BOD AT 20°C

BOD, mg/1
6000
5000
4000
3000
2000
1000
C) SAMPLE - I
Z: SAMPLE — 4
N
FIG.4.7
DAYS
PROGRESSIVE BOD AT 25"C.

220
6000 () SAMPLE — 1
5000 _
4000 ‘
BOD! mg/l
2000 h
1000
I I I 1
[x SAMPLE - 4 z’’///
1 2 3 4 5DAYS
FIG.4.8 PROGRESSIVE BOD AT 30°C.

221
6000 _ O SAMPLE — 1[B SAMPLE — 2
5000
4000
3000BOD, mg/l
2000
1000
I I I 1 Il 2 3 4 5DAYS
FIG.4.9 PROGRESSIVE BOD AT 35°C.

222
TABLE 4.8
COD CONCENTRATION OF THE WASTEWATER SAMPLES
Sample No. COD, mg/1
1 107002 80803 46204 34205 57906 1170

ABOD (mg/1)
3000
2000
1000
223
...
24.5%
13.0%
10.0%
7.0%
4-0% 3.7%“’ 2.6%
1 2 3 4 a 6 7TIME IN DAYS
FIG.4.10 aoo PER DAY AT 20”C (PERCENTAGES ARR op coo).

ABOD (mg/l)
3000
2000
1000
224
L.
35.9%
10.1%9.6%
4.9%2.7%
2.2% 1_5%
1 2 3 4 5 5 _a- 7TIME IN DAYS
FIG.4.11 BOD pea DAY AT 25°C (PERCENTAGES ARE op con).

ABOD (mg/l)
225
42.0%
3000
2000 L
1000 —
8.7%8.0!
5;!‘ 4.95%2.47%
-"1 1.85%1 2 3 4 5 6 7TIME IN DAYS
FIG.4.l2 BOD PER DAY AT 30°C (PERCENTAGES ARE OF COD).

A300 (mg/1)
3000
2000
1000
226
H1
FIG.4.13
2 3 4 5 6 7TIME IN DAYS
BOD PER DAY AT 35°C (PERCENTAGES ARE OF COD).

227
c) Effect of temperature on ‘k' values
Vant Hoff—Arrhenius equation has been used tocorrelate reaction rate with temperature.
_ (T—20)kT ' R20
A value of 9 often quoted in literature fortemperature above 20°C is 1.047 (17). This value of E3was assumed to calculate ‘k' values at 25°C, 30°C and 35°C
based on the k value at 20°C determined experimentally. Thecalculated values of ‘k' are compared with the experimentalvalues in Table 4.9.
From Table 4.9, it is evident that the calculatedvalues of 'k' are not fully in agreement with theexperimental values. The calculated values were found to behigher than the experimental values by 13-20 percent. Butconsidering the various assumptions (1) used in the BODtest, this difference can be said to be reasonsble. Anotherreason for this difference may be the assumed value of 6.
It is apparent from both the calculated andexperimental values that the value of ‘k' increases with

228
TABLE 4.9
EXPERIMENTAL AND CALCULATED VALUES OF "k" (day_l)
Temperature Calculated Experimental % difference
20°C —- 0.14525°C 0.182 0.161 13.030°C 0.229 0.190 20.535°C 0.288 0.250 15.2
9: 1.047 (assumed)

229
temperature. The increase in 'k' value in the temperaturerange 20—35°C may be attributed to the increased activityof the mesophilic group of bacteria which could play amajor role in the degradation of natural rubber processingwastewaters. The optimum temperature range for themesophilic group of bacteria is 25—40°C (1).
4.5 CONCLUSION
l. The biochemical stabilization rate constant (k) at 20°Cfor the effluents from a centrifuge rubber latexconcentration unit can be taken as 0.145 day—l and thecorresponding oxygen utilisation rate constant (K) as0.333 day‘1.
2. Bulk of the BOD is exerted within one day for thewastewater samples and the extent of this quantitydepends on temperature.
3. The value of biochemical stabilization rate constant(k) and oxygen utilisation rate constant (K) increaseswith temperature.

230
REFERENCES
Metcalf and Eddy, Inc., Wastewater Engineering: Treatment,
Disposal, Reuse, Tata McGraw Hill Publishing Co. Ltd., NewDelhi (1979).
John,C.K., Ponniah, C.D., Lee, H. and Ibrahim, A., Proc.Rubb. Res. Inst., Malaysia Plrs' Conf. Kuala Lumpur(1974).
Standand Methods for the Examination of Water andWastewater, 16th edn., American Public Health Association(1935).
Fair, G.M., Geyer, J.C. and Okun, D.A., Water andWastewater Engineering, Vol.2, John Wiley, New York.
McKinney, R.E., Microbiology for Sanitary Engineers,McGraw Hill Book Co. (1962).
Schropdmm E.D., Water" and Wastewater Treatment, McGrawHill, New York (1977).

231
7. Ramalho, R.S., Introduction to Wastewater TreatmentProcesses, Academic Press, New York (1977).
8. Besselviere, E. and Schwartz, Treatment of Industrialwastes, McGraw Hill Book Co. (1975) .
9. Thomas, H.)-\., Jr., Water and Sewage Works, 97, 123 (1940).
10. Thomas, H.A. Jr., Snow, W.B. and Moore, E.W., Sewage andIndustrial Wastes, 22(1), 1343 (1950).
11.Eckenfe1der, W.W. Jr., Water Quality Engineering forPractising Engineers, Barnes and Noble, New York (1970).
12. Oluwande, P.A., The Nigerian Engineer, 10(1), 17 (1975).
13. Deshkar, A.M., Srinivasan, M.V., Ratnaparkhi, D.Y.,Jadhao, S.T., Deshpande, S.Y., Kshirsagar, S.R. andThergaonkar, V.P., Indian J. Environ. H1th., 27, 4, 330(1985).
14. Sawyer, C.N. and McCarty, P.L., Chemistry for

232
Environmental Engineering, 3rd edn., McGraw Hill, New York
(1978).
15. Balmat, J.L., Sewage and Industrial Wastes, J., 29(7), 757(1957).
16. Ademoroti, C.M.A., Inter. J. Environmental Studies, 29,145 (1987).
Chapter 5
WASTE STABILISATION POND METHOD
5.1 INTRODUCTION
Waste stabilisation ponds or oxidation ponds areno longer a novelty. Considerable design and operatingexperience has accumulated over the years and these pondscan be used as a simple and reliable means of treatment forsewage and certain industrial wastes (1). The mainadvantages of stabilisation ponds are their low capitalrequirement (except for land) and operating costs, andtheir ability to handle fluctuating organic and hydraulicloads.
Stabilisation is the phenomena of wastewatertreatment by biological means, wherein highly unstableorganic matter is converted into a stable cellular mass——the algal cell (2). This method of waste treatment in ashallow lagoon is known as "stabilisation pond method".During the process of waste stabilisation, organic matteris oxidised by the activity of bacteria into simpler algalgrowth substances (3). Algae while assimilating thenutrients, donate oxygen into the environment through

234
photosynthetic activity. Thus, a waste stabilisation pondcan very well be regarded as a natural aquatic ecosystemwith controlled inflow and outflow: and continuous cyclingof nutrients and flow of energy with constant conversion ofabiotic components into biotic components.
The ecological characterisation of a wastestabilisation pond is given in Fig.5.l. The variousecological factors involved in a stabilisation pond arelisted below (4):
1. Internal inputs: Solar Energy, Air and Waste
2. Photosynthesis by algae
3. Primary respiration by bacteria and zooplankton
4. Biological decomposition and excretion by aerobes andanaerobes
5. Death of algae, zooplankton and bacteria and endogenousrespiration
6. Grazing by zooplankton
7. Sedimentation of waste solids and dead organisms and
8. Equilibrium of chemicals, HCO3, CO3 and C02
The ponds are often classified according to thenature of the biological activity that is taking place,

235
/[Sun ]_ightfl :7 Water surfacel light
u PHOTOSYNTHESIS C0?rH?O-—————9 O?4algal Cell— . I .CD. IC: |lg. Soluble and BF LUENTI > suspended ————>U, organics ‘soluble organics,'*" t ' 118' |bac er1a, a gaeLIIcu
«c:
I1 _ |T Aeroblc ;'3'0 degradation/OrganicsiO5—J,~CO? |~ new ce_11srd ‘ “.3.g8'3::52 Co mur.v:'<v: 2 :4i II IU; ‘-.4, (D '.¢:._o~ ‘13:9, _ _ ACID FERMENTA'1'1ONmwlq 51-U59‘-9 Organics 'n"‘?_* new cellslgasesmum Methane Fermentatmn
Ii
FIG. 5.1. ECOLOGICAL CHARACTERISA’l‘ION OF AWASTE STABILISATION POND.

236
ie., aerobic, anaerobic and aerobic—anaerobic(facultative). Aerobic ponds are used primarily for thetreatment of soluble organic wastes and the polishing ofeffluents from facultative or waste water treatment plants,while anaerobic ponds are normally employed forstabilisation of strong organic wastes. Facultative pondsare the most common type, and have been used to treatdomestic and a variety of wastewaters. For bettertreatment efficiency, pond systems are commonly used andoperated in series such as: anaerobic ponds————+facultative ponds_____+ aerobic ponds, or facultative ponds...’aerobic ponds (5).
5.2 ROLE OF ALGAE AND BACTERIA
a) Algae
The successful operation of a waste stabilisationpond depends on the mutually beneficial relationship thatexists between algae and bacteria. The term "symbiosis" isused to describe this mutual relationship between algae andbacteria. In the presence of sunlight and sufficientnutrients contained in the incoming waste, a healthy bloomof algae flourishes in a stabilisation pond together with alarge number of aerobic bacteria and other organisms. Thetreatment process depends on the effective use of bacteriafor breakdown or stabilisation of organic material and on

237
the presence of algae for oxygen supply (6). As long asthe algae can provide an excess of oxygen above thatrequired by bacteria, an aerobic environment will bemaintained. Under these conditions, aerobic bacteriaoxidise the organic matter present in the waste resultingin the production of carbon dioxide, ammonia and waterwhich incidentally happen to be the essential requirementsalong with sunlight for algal photosynthesis.
Common types of algae found in waste stabilisation
ponds are the green (Chlorophyta) and blue—green(Cyanophyta) algae. Some flagellates and yellow—greenalgae are also usually present. Typical of the green algaein stabilisation ponds are (7):
1. Chlorella2. Scenedesmus
3. Chlamydomonas4. Chlorococcum
5. Chlorogonium6. Coelastrum7. Gonium8. Ankistrodesmus9. Microtinium10. Actinastrumll. Eudorina and12. Pondorina

238
Among the blue—green algae common to wastestabilisation ponds are:
1. Oscillatoria2. Spirulina (Arthospira)3. Phormidium
4. Merismopedia5. Anabaena
6. Anacystis (Microcystis)7. Aphanizomenon
The commonly found flagellates are:
l. Euglena2. Phacus3. Trachelomonas
The most common yellow—green algae are:
l. Navicula2. Cyclotella3. Asterionella4. Sxnedra5. Tabellaria6. Melosira7. Fragilaria
Blue—green algal mats frequently develop in ponds duringsummer months. Euglena show a high degree of adaptability

239
to various pond conditions and are present during allseasons and under most climatological conditions (8).Probably next in adaptability are Chlamydomonas,Ankistrodesmus, Scenedesmus and Chlorella. Chlorella isthe most desirable algae in waste stabilisation ponds as ithas relatively the maximum oxygen donation capacity (9).
b) Bacteria
The bacteria necessary for the stabilisation oforganic matter are present in large numbers in sewage aswell as in soil washings. Depending on the conditions inthe pond, aerobic, facultative or anaerobic bacteria willthrive and stabilise the organic matter in different ways.
Under aerobic conditions, part of the organicmatter is used by aerobic bacteria to produce energy and isconverted into stable end—products like carbon dioxide,ammonia and water and the remainder is used forsynthesising new cells. A continuous supply of oxygen mustbe maintained during the aerobic process. The predominantbacteria present in stabilisation pond usually belong tothe group of Pseudomonas, Flavobacterium and Alcaligenes(10).
Anaerobic decomposition of wastewater in thestabilisation pond is a mixed culture process consisting of

240
two phases: (a) degradation of higher organic matter intovolatile organic acids and (b) fermentation of theseorganic acids into methane and other gases. The formerprocess is accomplished by both facultative and anaerobicbacteria which are abundant in nature. The second phase isbrought about by methane bacteria which are strictanaerobes. The major reactions that take place in aerobicanaerobic decomposition are shown in Fig.5.2.
During the last three decades, several studieshave been carried out on the applicability of wastestabilisation ponds for the treatment of domestic sewage(ll,l2,l3,l4). Systematic studies on the treatment ofindustrial wastes combined with domestic sewage have beencarried out in recent years. Govindan and Sundaralingam(15) carried out studies on the treatment of textile millwastewaters by stabilisation pond method. It was foundpossible to treat textile mill wastewater in admixture withsewage (1:5) by this method with a detention time of 8-12days using acclimatised algae culture at a BOD loading of200 kg per hectare per day. The BOD reduction obtained wasabout 98 per cent. Govindan (16) studied the treatabilityof tannery waste waters by stabilisation pond method andobtained percentage BOD and COD reduction ranging from 64

241
N.m.OHm
. zofifimomzoumo uHmomm2z..TuHmomm¢ mo E86
. no::l1.m m
3o_..2=m m , 2 ..
O .
.‘ o_._u5uE u=n.oc_uo mus. :v Eoum
locofou n:E_.:.__coo =uoo.:_z Su.::.__ Lew/<3
.o._:z.u_..._oEE< Nu.._o_ . 5
.. . zo_.:mon_zoumo ..._o .0.
. mwuaooma .22.“. =:_.__..m .._. uo:3_n:._on_auN n2u._c>u_on.au..:_...o:_z u::_z_ 2.38;
. . ..o. I mmsfiz
.3. mud zo_._._mon=zoumo 1.. .
..:.,.u go mwunoomm kzd .n_ oz_>_.._
zgfism m m§82mE.z_
\ 3_.3_oEE3ubS
.uu..o:oa._cu 23.59 .. 1%.. I W.. \.w aw«non
fi :o._:zoEoEEdN vac.
uE2o:.._
zo_._._moazoumo
uo mpunoomaw.::omzmm»z_
...2...2=m =vuo._v»Im.uo...8_u=ap..ou~53:2 E=oFE4._
oazoumo no
zoEm
om“. ..<_.:z_
aaoouocoaouu2..o:¢oo._:z_
ouEo3m.cuoo=..»:m
uu_..o_o._3._5
vcu wflacopflu Boo
«Boo uEoa..o N can .
mzoumo noIn ..<_.:z_
zw».::..
u_z4o¢o ofio
4 14
22:3
Ebaoo . . . .zoEmo._:oumo goo.

242
to 93 and 60 to 89, respectively. The algal species growingwell in tannery wastewater—sewage mixtures were alsoidentified.
Very little work has been done on the treatment ofnatural rubber processing effluents in a waste stabilisationpond in combination with domestic sewage. The purpose ofthe present study is to evaluate the treatability ofcentrifuge latex concentration wastewater in a stabilisationpond. The possibility of treating the waste—water alone andin admixture with sewage in the proportions of 1:1, 1:2,1:3, 1:4 and 1:5 was explored in an experimental pond(aquarium tank).
5.3 MATERIALS AND METHODS
a) Stabilisation Pond ModelThe composite wastewater samples from a centrifuge
latex concentration unit was used for the treatabilitystudies. An aquarium glass tank of size 60x30x2O cm wasused as the experimental stabilisation pond. Sewage wasadded to latex wastewater in different proportions of 1:1,1:2, 1:3; 1:4 and 1:5 and the mixtures were placed one afteranother in the experimental pond. Experiments were alsocarried out with latex wastewater alone. pH of the sampleswere adjusted to the range 7.0-8.0 by adding sodiumbicarbonate. Sewage and algae samples were obtained from a

243
sewage treatment plant. Algae were acclimatized to latexcentrifuging wastewaters by using dilution technique. Theacclimatized algal cultures were transferred to theexperimental stabilisation pond containing waste-water assuch and waste—sewage mixtures. The experimentalstabilisation pond was kept open in atmosphere exposed tosunlight and the wastewater—sewage mixtures were allowed tostabilise for 15 days. Samples were collected from theexperimental pond unit periodically and analysed for algaeand bacteria and parameters such as pH, alkalinity, COD,BOD, dissolved oxygen, ammoniacal nitrogen and suspendedsolids as per standard methods (17).
b) Flask Culture Experiments
Experiments to find out the influence of initialBOD strength of sewage on algal growth were carried out inflat bottomed culture flasks.
Different levels of sewage strength are made bydiluting the freshly collected raw sewage with distilledwater. 3 litres of the samples thus prepared were taken inculture flasks and inoculated with algal laden watercollected from the experimental stabilisation pond.

244
Analyses of 5 day BOD were done as per thestandard methods for water and wastewater analysis (17).Observations on algal growth are made by direct microscopyand counting the number of cells per ml. by drop countmethod (17).
5.4 RESULTS AND DISCUSSION
a) pH and Alkalinity of the Waste—Sewage Mixture
The variation of pH value of the waste-sewagemixture with detention time is given in Table 5.1. The pHof centrifuge latex concentration wastewater—sewage mixtureduring treatment in experimental stabilisation pond usingacclimatized algal culture ranged from 6.9 to 8.0. Duringthe first three days of detention, there was a sudden dropin pH (by 0.2-0.3). Thereafter, the pH variation remainedgradual. However, the general trend was a shift in pHtowards the acidic side. This should be due to theproduction of CO2 in quantities in excess of therequirement of algae.
The variation of alkalinity with detention time isplotted in Fig.5.3. In all the waste-sewage combinations,the change in alkalinity with detention time was notconsiderable. From Fig.5.3, it is seen that the average
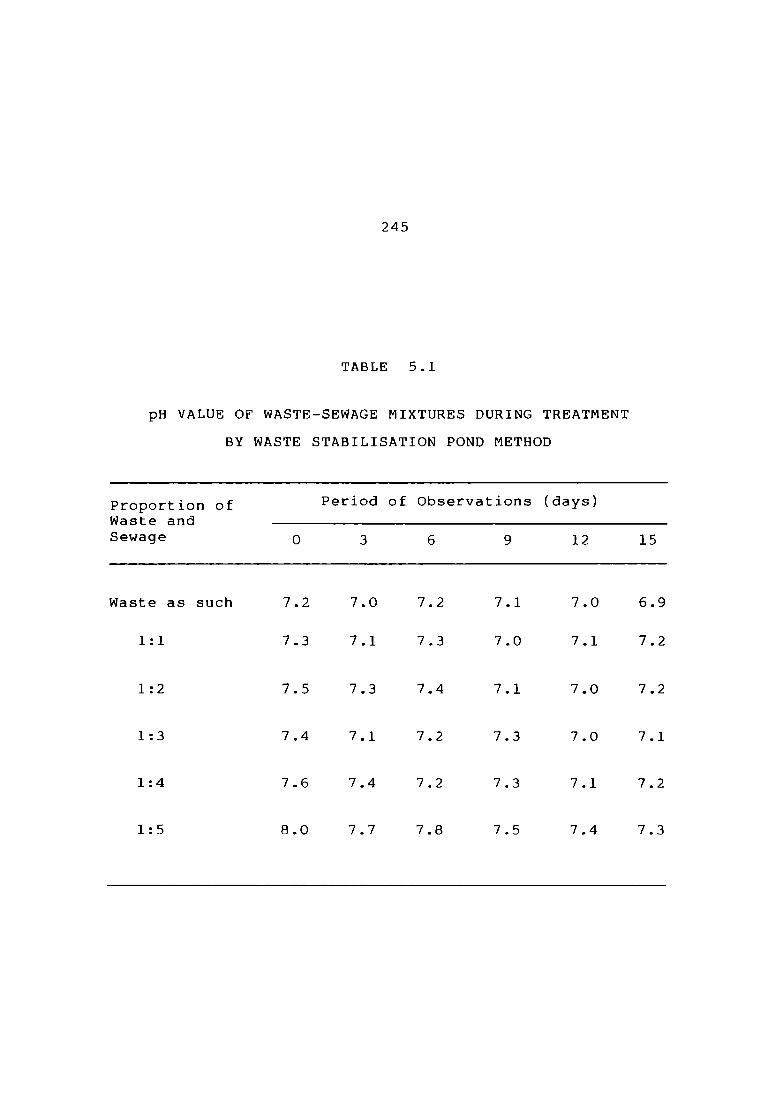
245
TABLE 5.1
pH VALUE OF WASTE—SEWAGE MIXTURES DURING TREATMENT
BY WASTE STABILISATION POND METHOD
proportion of Period of Observations (days)waste andSewage O 3 6 9 12 15Waste as such 7.2 7.0 7.2 7.1 7.0 6.9
1:1 7.3 7.1 7.3 7.0 7.1 7.21:2 7.5 7.3 7.4 7.1 7.0 7.21:3 7.4 7.1 7.2 7.3 7.0 7.11:4 7.6 7.4 7.2 7.3 7.1 7.21:5 8.0 7.7 7.8 7.5 7.4 7.3

ALKALINITY (mg/1)
400
100
246
O WASTE A LONE
.1 :1. DI[.U'I'ION
1:2 DILUTION
I :3 DILUT [ON
.I : /1 D I l.U'.l‘ I ON
1:5 DILUTION>>IDO
DAYS
F‘IG.5.3 ALKI\f.INI'I‘Y 'Vs.' DETENTION TTME.

247
difference between the initial alkalinity and thealkalanity after 15 days of detention time is only 20-30mg/1. This should be due to the fact that the acclimatizedalgal culture takes care of the alkalinity changes in thesystem.
b) Dissolved Oxygen in the Pond
The variation in dissolved oxygen (DO) content inthe experimental stabilisation pond for various wastesewage mixtures is shown in Fig.5.4. The dissolved oxygencontent in the experimental pond was found to increase withdetention time. This is an indication of the increasingphotosynthetic activity ix) the pond which results in therelease of oxygen. The difference in initial and final(after 15 days detention time) DO was found to be maximumfor the 1:5 waste—sewage mixture. There was a steepincrease of DO content from 0.9 to 9.4. As the proportionof sewage in the pond increases, the DO content in the pondshows a steep increase. This phenomenon may be attributedto the increasing algal growth in the waste-sewage mixtureand the subsequent rise in photosynthetic activity.
In plant photosynthesis, solar energy is utilisedin reducing the carbon dioxide of atmosphere to produce the

DISSOLVED OXYGEN (mg/l)
248
O WASTE ALONE
0 1 :1 DILUTION
10 __ 1:2 DILUTION. 1:3 DILUTION /‘A 1:4 [)II,.U'I‘.[ONA 1:5 DILUTION Ag8 — /
1?.9DAYS
FIG.5.4 DISSOLVED OXYGEN 'Vs.' DFJ'I‘BN'I‘ION TIME.

249
organic structure of the plant (18). Hydrogen for theprocess is obtained from water thus releasing oxygen. Inotherwords, the production of new algae by photosynthesisis accompanied by the utilisation of energy and the releaseof oxygen. The overall equation representing the synthesisof algal cell material and release of oxygen can be statedas:
aCO + (O.5b — l.5d) H O + dNH——————>CaH (Algae)2 2 3 0c”b d+ (a + O.25b — O.75d — O.5c) 02
The production of oxygen during photosynthesisdepends, therefore, on the coefficients a, b, c and d andcan vary from one species to another (7).
c) BOD and COD Reduction
The BOD reduction in waste—sewage mixtures during
treatment in experimental stabilisation pond for 15 daysvaried from 69 to 93 per cent and BOD was brought down to269 mg/l.from 3845 mg/1 at a dilution of 1:5. The maximumBOD reduction was achieved in the 1:5 waste—sewage mixture.When the wastewater was treated alone, the BOD reductionachieved was 68 per cent in a detention period of 15 days.The effect of detention time and dilution factor on BOD isshown in Fig.5.5.

PERCENT BOD REDUCTION
100
80
60
250
O WASTE ALONE
1.[3 1:2 DILUTION
1:1 DILUTION
I 1 :3 DILUTION
A
_ A
1:4 DILUTION
1:5 DILUTION
I 1 1 L9
DAYS
BOD REMOVAL EFFICIENCY Vs. DETENTION TIME.FIG.5.5
15

PERCENT COD REDUCTION
100*
80
60
40
20
251
(D WASTE ALONE
. 1:1K] 1:2
.1:3A1:4A1:5
DILUTION
DILUTION
DILUTION
DILUTION /DDILUTION .
12DAYS
FIG.5.6 COD REMOVAL EFFICIENCY Vs. DETENTION TIME.

252
In a detention time of 15 days, the COD reductionin waste-sewage mixtures ranged from 65 to 90 per cent.The highest percentage reduction recorded was 90 to adilution of 1:5 as was evident from the reduction of COD to
890 mg/1 from 8905 mg/1. When the wastewater was treatedalone, the COD reduction achieved was 63 per cent in adetention period of 15 days. The effect of detention timeand dilution factor on COD removal efficiency is shown inFig.5.6.
In the case of both BOD and COD reduction, thereduction efficiency was found to increase as theproportion of sewage in the waste-sewage mixture increased.This may be attributed to the increased bacterial activityat higher dilutions. The organic matter present in thewaste is utilised for the synthesis of bacterial mass.
d) Algal Count and Algal Succession
The algal counts in latex wastewater—sewagemixtures are presented in Table 5.2. The algal countduring stabilisation in waste-sewage mixtures varied from3Ox1O4/ml to 167x104/ml. A maximum count of 167x104/ml was
recorded on the 12th day in 1:5 waste-sewage mixturefollowed by 160x104/ml in the same dilution on the 9th day.

253
TABLE 5.2
ALGAL COUNT IN WASTEWATER-SEWAGE MIXTURES
(ALGAL COUNT IN X 104/ml)
Progntion Period of Observations (days)of waste- Algalwater and species 0 3 6 9 12 15sewage
Waste 1 8 11 18 29 39 32water 2 10 14 20 28 34 42alone 3 11 12 15 16 21 224 13 18 26 34 28 221 11 13 21 26 34 372 10 12 19 31 39 381=1 3 13 15 18 25 26 294 10 16 25 37 29 211 7 10 14 28 43 342 9 15 18 26 37 351'2 3 8 12 17 23 31 364 6 8 18 33 25 161 11 14 18 26 38 362 13 19 30 37 44 481 3 3 10 15 18 27 36 444 9 16 25 37 29 181‘ 10 16 25 36 35 262 8 16 22 36 48 371 4 3 9 14 21 34 47 404 8 18 32 25 13 91 11 17 22 33 32 242 13 20 32 45 50 441:5 3 14 19 28 42 56 584 9 20 37 40 29 16
Algal species: 1. Chlorella vulgaris, 2. Scenedesmus quadricauda3. Euglena acus, 4. Microcystis aeruginosa.

254
Total algal count declined in all the dilutions ofwastewater—sewage mixture from the ]2th day onward. Whenthe wastewater was treated alone, the algal count variedbetween 42xlO4/ml and 122x104/ml. As in the case ofwastewater—sewage mixtures, the algal count declined fromthe 12th day onwards.
The results clearly show that the algal speciesChlorella vulgaris, Scenedesmus quadricauda, Euglena acusand Microcystis aeruginosa grew well in waste and wastesewage mixtures in the experimental stabilisation pond.Maximum number of Chlorella vulgaris was observed on the12th day of stabilisation in 1:2 waste-sewage mixture. TheBOD and COD values recorded on the days when ghlgrellavulgaris dominated were 1527 mg/l and 4147 mg/1 respectively. The pH on the day when maximum number of C.Vulgariswas observed was 7.0. Scenedesmus guadricauga was observedin maximum numbers on the 12th day of stabilisation in 1:5waste-sewage mixture when the pH, BOD and COD values were7.4, 692 mg/l and 2404 mg/l respectively. The maximumoccurance of Euglena agus was observed on the 15th day ofstabilisation in 1:5 waste-sewage mixture. The pH, BOD andCOD values of this dilution on the 15th day ofstabilisation were 7.3, 269 mg/l and 890 mg/l respectively.

255
On the 9th day of stabilisation in 1:5 waste-sewagemixture, maximum number of Microcystis aeruginosa werepresent when the pH was 7.5. The BOD and COD values were1192 mg/l and 3740 mg/l respectively.
The influence of waste-sewage proportion on algalsuccession is presented in Table 5.3. Dilutions of 1:1,1:3 and 1:5 are considered here.
For a dilution of 1:1, Euglena, a flagelletedominated the experimental pond in the initial stages. Buton the 6th day, and 9th day, Microcxstis, a blue green algawas found to be dominant. Then the algal successionshifted towards green algae and the species Scenedesmusdominated the pond on the 12th and 15th day of observation.For a dilution of 1:3, the green algae Scenedesmus wasfound to be dominant throughout the period of observation.The trend again changed for the dilution of 1:5. Euglenadominated the scene in the initial stage and final stage.The green algae, Scenedesmus were dominant on the 6th and9th days of observation.
A definite pattern of algal succession could notbe observed in the centrifuge latex concentration

256
A..nucouV
m I mcmamnm m mfiumwoouuflz m maamuoanu
m I maamuoano m mcmamsm m mcwamsm m
Q I mflumNuouuHz m maamuoacu m msemmvmcwumQ I msemmuwcmum Q msemwcwcwom Q maumnuouuflzm I mfiumwoouuflz m mflumwuouuflz m mfiumwoouoflzm I msemmvwcmum m mcwamsm m maamuofinu
m I maamuoano m maamuoacu m msemmcmcwum o
Q I mcmamsm Q msemmomcmum Q mcwamsm
:1 Q2 Sv AHVmua mua Hua Am>m©V mafiacoHu:muwQ
MMDHXHZ m0<3MmImHmd3
ZOHWWMUUDW d¢Ud< ZO ZOHBmOmOmm mU<3mm|mHm¢3 mO mUZMDqmZH
m.m mqm«a

257
A.DBZOUv m.m mQm¢a
.ucm:flEo©Insm I m .u:mcQEoQ I Q
m mwum>uouuHz m I mflumNuouuflz m mfiumwuouufizm maamuoano m I mcmamsm m maamuoacu
m msemwvmcmom m I maawuoano m mcmawdm ma
Q mcwamsm Q I msamwcmcwum Q msemwowcwumm mflumwuouufiz m I mfiumNuouuflz m mfiumnuouoflzm maawuoaco m I mcmamsm m maamuoaco
m mnemwwmcmom m I maawuoanu m mcwamsm ma
Q mcmamsm Q I wsemwomcmum Q mssmwomcmumm mcmamsm m I mcwamsm m msemwumcmomm maawuoanu m I mfiumxuouuflz m mcmamsm
m mflumwuouoflz m I maawuoanu m maawuoano Q
Q msemmvmcmum Q I msemmvmcmum Q mfiumwuouuflz
31 :3 3; Q3

258
wastewater—sewage mixture. As a whole, green algae andflagellets were found to be predominant in the experimentalstabilisation pond.
e) Removal of Ammoniacal Nitrogen
The effect of detention time and dilution factoron ammoniacal nitrogen removal is shown in Table 5.4. Theper cent ammoniacal nitrogen removal that could be achievedvaried between 4 and 20. The removal efficiency increasedwith increasing dilutions of waste-sewage mixture and with
detention time. The maximum NH4—N removal efficiency of 20per cent was obtained at 1:5 dilution on the 15th day ofobservation.
The reduction in ammoniacal nitrogen in theexperimental waste stabilisation pond can be attributed tothe utilisation of nitrogen as a nutrient by both algae andbacteria (19).
f) Suspended Solids Removal
The effect of detention time and dilution onsuspended solids removal is shown in Table 5.5. Thesuspended solids removal efficiency varied between 11 and25 per cent. The removal efficiency was found to increase

PERCENTAGE REMOVAL OF AMMONIACAL NITROGEN
259
TABLE 5.4
Proportionof waste
Period of Observations (days)
and sewage 3 6 9 12 15Waste as such 4 6 7 ll 111:1 4 6 8 12 121:2 5 7 9 12 131:3 6 8 10 13 141:4 7 9 11 14 151:5 10 12 14 17 20

260
TABLE 5.5
PERCENTAGE SUSPENDED SOLIDS REMOVAL
Proportion ofWaste and
Period of observations (days)
Sewage 3 6 9 12 15Waste as such 11 13 14 15 171:1 12 14 16 17 191:2 13 15 17 18 201:3 14 16 18 19 191:4 15 17 19 20 211:5 17 20 22 23 25

261
with dilution and detention time. The maximum suspendedsolids removal of 25 per cent was obtained at a dilution of125 on the 15th day of observation.
Removal of suspended solids is brought about bybiological activity and flocculating action in a wastestabilisation pond. The suspended solids containingorganic matter are decomposed by bacterial action and thusremoved. A waste stabilisation pond has thecharacteristics of a sedimentation basin and particles ofsuspended solids settle by perikinetic flocculation whichis brought about by Brownian motion (20).
g) Influence of Sewage Strength on Algal Growth
The influence of sewage strength on algal growthcan be inferred from the results of the flask cultureexperiments. The results are presented in Fig.5.7.
The algal growth recorded on the 8th day ofobservation was maximum in the case of the sewage samplehavimg a BOD of 200 mg/1. As the sewage strength camedown, the total count of algae showed a decreasing trendand the minimum algal count was observed on the 8th day fora sewage strength of 50 mg/1 (BOD). The decreasing trend

ALGAL COUNT (x104/ml)
60
A O
262
INl'l'II\|.
OPDIEIOO
BOD OF SF‘.WI\(‘~F‘. 4 00
100
700
.150
mg/I
mq/I
mq/I
mg/I,
FIG.5.7 INFLUENCE OF‘
DAYS
SEWAGE STRENGTH ON ALGAL GROWTH.

263
in algal count was also observed when the sewage strengthwas increased from 200 mg/l to 400 mg/l. This shows thatthere is an optimum sewage strength for algal growth. Thisoptimum strength should correspond to maximum oxygen supply
and nutrient availability.
5.5 CONCLUSION
l. The wastewaters from a centrifuge rubber latexconcentration unit were found to be amenable fortreatment in a waste stabilisation pond in admixturewith sewage using acclimatized algal culture. Thegreater the dilution, the more efficient was the degreeof treatment. Of the five dilutions studied, 1:5dilution gave the best performance with reference to BODreduction, COD reduction, ammoniacal solids removal and
suspended solids removal.
2. When the wastewater is mixed with sewage in theproportion of 1:5, the BOD reduction and COD reductionobtained were 93 per cent and 90 per cent respectivelyin a detention period of 15 days. The maximumammoniacal nitrogen removal and suspended solids removal
obtained were 20 and 25 per cent respectively.

3.
acus
264
The algal count during stabilisation in different latexwaste—sewage mixtures varied from 3x10⁴ to l67xlO4/ml.A maximum count of 167x104/ml was recorded on the 12th
day in 1:5 waste—sewage mixture.
Chlorella vulgaris, Scenedesmus quadricauda. Euglenaand Microcystis aeruginosa grew well in rubber
latex waste—sewage mixtures during the course ofstabilisation under experimental conditions. Eventhoughno definite pattern of algal succession was observed,the green algae and flagellets dominated theexperimental pond.

265
REFERENCES
Arceivala, S.J., Waste Water Treatment and Disposal Engineering and Ecology in Pollution Control, MarcelDekker Inc., New York (1981).
Kuentzal, L.E., J. Wat. Pollu. Cont. Fed.,4l,10, 137(1969).
Alagarsamy, S.R., Chaudhary, K.W., Abdullappa, M.K. and
Bopardikar, M.V., Env. Hlth., 9, 241 (1976).
Sinha, A.K., Mathur, R.P. and Srivastava, A.K., J. IPHE,India, 4, 75 (1980).
Polprasert Chongrak and Bhattarai, K.K., Journal ofEnvironmental Engineering Division, ASCE, 111, 1, 45(1985).
Thirumurthi, D., J. Wat. Poll. Cont. Fedn.,46, 9, 2094(1974).
Arceivala, S.J., Lakshminarayana, J.S.S., Algarsamy,and C.A., Design, Construction andS.R. Sastry,
Operation of Waste Stabilization Ponds in India, CPHERI,Nagpur (1969).

10.
11.
12.
13.
14.
15.
16.
17.
266
Ganapathy, S.V., Arch. Hydrobio1., 76, 3, 302 (1972).
Jayaangounder, I.S., Env. H1th., 8, 190 (1966).
Davis, B.A., Env. H1th., 5, 333 (1963).
Kumaran, P., Env. H1th., 8, 134 (1966).
McGarry, M.G. and Tankasame, C., J. Water Poll. Cont.Fed.: 43, 824 (1971).
Chatterjee, S.N., Arora, B.K. and Gupta, D.R., Env.H1th., 9, 156 (1967).
Hodgson, H.T., J. Wat. Poll. Cont. Fed., 36, 51 (1964).
Govindan, V.S. and Sundaralingam, V.S., Indian J. Env.H1th., 21, 4, 321 (1979).
Govindan, V.S., Indian J. Env. H1th., 27, 1, 58 (1985).
Standard Methods for the Examination of Water andWastewater, 16th edn., American Public HealthAssociation (1985).

18.
19.
20.
Hawkes, H.A., The
267
Ecology
Pergamon Press (1963).
Govindan, V.S. and Devika,
Journal — Env. Engg. Div.,
Camp, T.R., Trans. Am. Soc.
of Waste Water Treatment,
R., Instn. of Engrs. (India)74. 16 (1993).
Civil Engrs., 120 (1955).

Chapter 6
ANAEROBIC CONTACT FILTER
6.1 INTRODUCTION
Anaerobic decomposition of organic matter is awell established process for the treatment of biologicalsludges and wastewaters, and the process is especiallyuseful for wastes containing a high concentration of organicmatter. The process involves the breakdown of organicmatter to methane and carbon dioxide in the absence ofoxygen.
The biological conversion of organic matter in ananaerobic system is considered to occur in either two orthree steps (1). In the three step sequence, the first stepinvolves the enzyme—mediated transformation or liquefactionof higher weight molecular compounds into compounds for useas a source of energy and cell carbon. The second stepinvolves the bacterial conversion of the compounds resultingfrom the first step into lower molecular weight intermediatecompounds. The third step involves the bacterial conversionof the intermediate compounds into simpler and products,principally, methane and carbon dioxide. In the two—step
268

269
sequence, the first two steps are thought to occursimultaneously and are defined as the first step (2).
In the two—step sequence, the microorganismsresponsible for the decomposition of the organic matter canbe divided into two groups. The first group hydrolyzes andferments complex organic compounds to simple organic acidslike acetic acid and propionic acid (1). This group ofmicroorganisms consisting of facultative and obligateanaerobic bacteria is described as nonmethanogenic. Thesemicroorganisms are also called "acid formers". Among thenonmethanogenic bacteria that are commonly found inanaerobic sludge digesters are Clostridium sp, Peptococcusanaerobus, Bifidobacterium sp, Desulphovibro sp,Corynebacterium)Lactobacillus Actinomyces)Staphylococcusand Escherichia coli (3).
The second group of microorganisms converts theorganic acids formed by the first group to methane gas andcarbon dioxide. The bacteria responsible for thistransformation are strict anaerobes and are called”methanogenic" or "methane formers". Many of themethanogenic bacteria isolated from anaerobic digesters aresimilar to those found in the stomachs of ruminant animals

270
and in organic sediments taken from lakes and rivers (4).The most important among the methanogens that have beenidentified are Methanobacterium and Methanobacillus havingrod like shape and the sphere like Methanococcus andMethanosarcina (5).
The methanogenic bacteria that degrade acetic acidand propionic acid play an important role in anaerobicdecomposition. The metabolism of these bacteria is usuallyconsidered rate limiting in the anaerobic treatment of anorganic waste as they have very slow growth rates (6). Theactual stabilization of the waste is accomplished by themethanogenic organisms that convert organic acids intomethane and carbon dioxide. Methane gas is highly insoluble,and its departure from solution represents actual wastestabilization.
6.1.1. Mechanism of methane formation
With regard to the specific mechanisms involved inthe formation of methane, it appears that two pathways arepossible, depending on the nature of the starting substrate(1). The methanogenic bacteria appear to be capable ofusing the following three categories of substrate (7):

271
l. The lower fatty acids containing six or fewer carbonatoms (Formic, acetic, propionic, butyric, valeric andcaproic).
2. The normal and iso alcohols containing five or fewercarbon atoms (methanol, ethanol, propanol, butanol andpentanol).
3. Three inorganic gases (hydrogen, carbon monoxide andcarbon dioxide).
In the first mechanism suggested for methaneformation, methane is produced by the oxidation ofsubstrates such as ethanol, butyrate, and hydrogen and bythe reduction of atmospheric carbon dioxide. In the second,methane is formed by the reduction of carbon dioxide formedduring the oxidation of substrates such as acetate andpropionate. The two mechanisms involved can be described byconsidering the following equations (8):
Reduction of atmospheric CO2:
2C2H5OH + CO2-—————,2CH3COOH + CH4
4H2 + COi—————+ CH4 + 2H2O
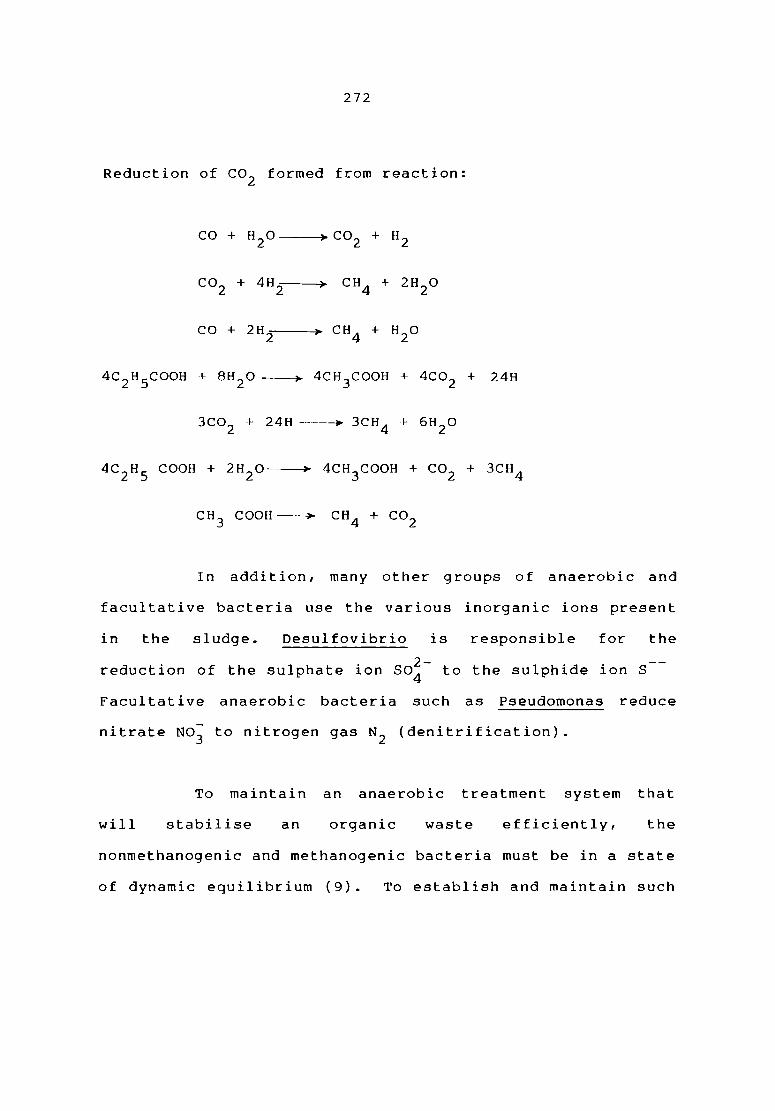
272
Reduction of CO2 formed from reaction:
C0 + H2O——>CO2 + H2
CO2 + 4H2—?—> CH4 + 2!-120
C0 + 2H2-———> CH4 + H20
4C2H5COOH + 8H2O——> 4CH3COOH + 4CO2 + 24H
3CO2 + 24H ---————> 3CH4 + 6H2O
4C2[-I5 COOH + 2H2O%> 4CH3COOH + C02 -1- 3CH4
CH3 COOH—-—> CH4 + CO2
In addition, many other groups of anaerobic andfacultative bacteria use the various inorganic ions presentin the sludge. Desulfovibrio is responsible for the
2‘ to the sulphide ion S-Facultative anaerobic bacteria such as Pseudomonas reducereduction of the sulphate ion SO
nitrate NO; to nitrogen gas N2 (denitrification).
To maintain an anaerobic treatment system thatwill stabilise an organic waste efficiently, thenonmethanogenic and methanogenic bacteria must be in a stateof dynamic equilibrium (9). To establish and maintain such

273
a state, the reactor contents should not contain dissolvedoxygen and be free from inhibitory concentrations ofconstituents like heavy metals and sulphides. Also the pH ofthe aqueous environment should be in the range of 6.6-7.6(1). Sufficient alkalinity should be present to ensure thatthe pH will not drop below 6.2, because the methane bacteriacannot function below this point (10). A sufficient amountof nutrients. such as nitrogen and phosphorous, must also beavailable to ensure the proper growth of the biologicalcommunity. Temperature is another important environmentalparameter. The optimum temperature ranges are themesophilic, 30 to 38°C and the thermophilic, 49 to 57°C.
6.1.2 The concept of "Anaerobic Filter"Anaerobic biological treatment of high strength
organic wastes has a number of advantages which makes has anumber of advantages which makes it preferable to eitheraerobic biological or physical chemical treatment methods.The major advantage is that a high degree of wastestabilization can be accomplished with a relatively lowproduction of biological solids thus reducing the costsassociated with sludge disposal. Methane gas is produced asa result of the anaerobic process and valuable energy can berecovered from the gas by subsequent combustion.

274
A disadvantage of the anaerobic process is the lowbacterial growth rate which may result in a washout of thebiomass if the solids in the effluent are not returned tothe unit. Young and Mc Carty (ll, 12) therefore developedan upflow anaerobic filter in which the anaerobic bacteriaare present in a film attached to a rock medium to removeorganics in the waste flowing upward through the column. Thebacteria in the anaerobic filter are firmly attached to themedium resulting in sludge ages of more than 600 days (12)and 150 days (13). The unit can therefore be operated attemperatures substantially below 35°C which decreases thebacterial growth rate while still maintaining a sufficientbiomass.
The studies carried out by Young and Mc Carty(ll,l2) using synthetic organic waste indicated that at thesame organic loading the percentage COD removal increasedwhen the concentration of the influent COD increased. Elshafie et a1. (14) used a multiple filter system. The unitconsists of a group of six filters operating in series.Their study based on a synthetic wastewater indicated thatthe percentage removal of organic material is constant —regardless of the concentration of the organic load appliedto anaerobic filters in a continuous flow system.

Z/‘_')
Arora et al. (15) studied the suitability of ananaerobic filter for the treatment of effluents fromvegetable tanning. The results of the study showed thatupto a certain organic loading, the increase in COD and BODof the effluent is accompanied by an increase in thepercentage removals of COD and BOD, whereafter the declinein percentage removals with increased organic loading isexponential. A study carried out by Jennett and Dennis (16)investigated the performance of anaerobic filter for thetreatment of pharmaceutical waste. During the last twodecades, several studies (17, 18, 19, 20, 21) have beencarried out to evaluate the performance of anaerobic filterfor the treatment of wastewaters from various industries.The anaerobic filter has also been applied successfully as areactor for the biological denitrification (22,23,24) ofeffluents.
The purpose of the present study is to evaluatethe performance of an upflow anaerobic filter for thetreatment of wastewaters from a centrifuge rubber latexconcentration unit. Based on the experimental results,kinetic parameters were estimated with respect to substrateremoval, microorganism growth and gas production.

276
6.1.3 System Analysis
The evaluation of kinetic parameters was made withrespect to substrate removal, microorganism growth and gasproduction.
(a) Substrate Removal Kinetics
The substrate removal kinetics in fixed filmbiological systems can either be described in terms ofsubstrate concentrations existing in the bulk liquid phaseor simulated substrate concentrations in each layer of thebiofilm, the sum of which predicts the response of theentire film. Eventhough the earlier workers (ll,l2) usedthe former approach, the recent trend is to use the secondapproach in which the process of substrate diffusion andbacterial uptake are simulated for each of the successivelayers of the biofilm (25).
In a biological film reactor at steady state, amass balance within the film can be made by equating:
Input — Output = Uptake (1)

277
Using Fick's law of molecular diffusion andbiological uptake rate, equation within the biological layercan be written asdzs us x
Z _ l_ _.___— D (2)which states that the second derivative of substrateconcentration with respect to z' is dependent on both the
substrate and biomass concentrations. S2 is the substrateconcentration at depth '2' (mass/length3), D is thediffusion coefficient (lengthz/time), U is the maximumsubstrate removal rate (mass of substrate/mass ofbiomass.time). X is the biomass concentration within the
biolayer (mass/length3) and K5 is the ha1f—ve1ocityconcentration (mass/length3).
Using various assumptions as given by Dewalle and
Chian (25), when S2 is much larger than KS, equation (2) canbe written asI dF A LV at = kl V (se)2 (3)k1 is the coefficient based on zero order kinetics. when S2is much smaller than KS, equation (2) becomes,IdF Ava?=’<2v5 <4’

278
k2 is the coefficient based on first order kinetics.dF .5: 1S the rate of mass transfer at the dinterface
(mass/time)
V is the reactor volume (length3)A is the surface area (lengthz)
and Se is the substrate concentration in bulk liquid(mass/length3).
The model described by the above equation has a drawback,that it cannot define a maximum rate of substrate removal(26). This value can be arrived at by assuming a Monod‘s
hyperbolic relationship between —{,- ‘fig and Se whereby theconstants can be evaluated from a Line Weaver Burk Plot and
is given by the equation;
195I dF V dt-— =j (5)v'cTt' [(+5s eL Sm eor _L =K +S e
L is the substrate loading rate (mass/length3.time).
Lm is the maximum substrate loading rate(mass/1ength3.time).

279
S is effluent substrate concentration (mass/length3)S is influent substrate concentration (mass/length3)K is substrate removal rate constant based on loading rateK is the substrate removal rate constant based on detention
period, (tim€|)9 is the hydraulic retention period (time)
B is COD removal efficiencyE is the maximum substrate removal efficiencya is the critical hydraulic retention time (HRT) (time)
(b) Microorganism Growth Kinetics
The specific growth rate of microorganism wasdetermined by Smith et al. (26) and is given by the equation“ (10)p.15 the specific growth rate (time_1).K is called the biological constant.
The determination of maximum specific growth rate
( pmax) and decay coefficient (kd) was made by the use ofMonod's modified model given by the equation
Pmax'SeP = —;<‘T‘_k‘l ‘11’S e

280
The substrate removal kinetics in an upflowanaerobic filter can be described tn! considering it. as afixed film packed bed biological reactor. But the plug flownature of the flow regime in an upflow anaerobic filterprohibits adequate mechanistic explanation of substrateremoval mechanism in packed bed reactor and forces thedesigner to search for empirical and pseudo mechanisticmodels(26), viz,,
eET = eXP(_KL/L) (6)1
se _—— = exp( K88 ) (7)Si
E = Em(l - 3/8) (B)A model based on total organic loading has been
developed by Stover et al. (27) which defines a hyperbolicMonod form relationship between substrate removal rate andtotal organic loading applied and is given by the equation;
Umax(FSi/A) (9)U = (Ks+FSi/A)

281
K is the half velocity concentration within the biolayer(mass/length3).
(c) Gas Production Kinetics
Methane production is generally accepted as therate limiting step of anaerobic degradation of organicsubstrate. The total gas production rate and methanequantity can also be mathematically modelled and accuratelypredicted in a manner similar to substrate removal.
Stover at al. (27) found that the total gas andmethane production are a function of total applied substrateloading rate and assumed that they should respond in asimilar manner as the substrate utilisation kinetics. Themodels are given by the following equations:
(GmaxFsi/@fi@B + FSi/A) (12)C) II
3 ll (MmaxFsi/A)/(MB + Fsi/A) (13)
G is the specific gas production rate (length3/length2.time)
Gmax is the maximum specific gas production rate.

282
A is the surface area (lengthz)
GB is the proportionality constant (mass/lengthz time)M is the specific methane production rate
(length3/length2.time)
Mmax is the maximum specific methane production rate.MB is the proportionality constant (mass - length2.time).
6.2 MATERIALS AND METHODS
A bench scale anaerobic contact filter (Fig.6.l)was fabricated using PVC pipe of 9.5 cm diameter and 180 cmheight having a total volume of 0.012 m3 (12 litres). Alength of 7 cm was left over for sedimentation anddistribution of wastewater at the bottom of the column.Sampling ports were provided at every 30 cm height of thefilter from the perforated plate upto 150 cm. Granitestones with rough surfaces of the size ranging from 1 to 3cm were used as filter media upto a height of 130 cm fromthe perforated plate. A clear liquid column of 40 cm wasprovided above the media for the separation of the effluent,suspended solids and gas. A space of 13 cm has beenprovided for the accumulation of gas produced. The gas wascollected by the displacement method. The filter was fedwith- wastewater at the point just below the perforated
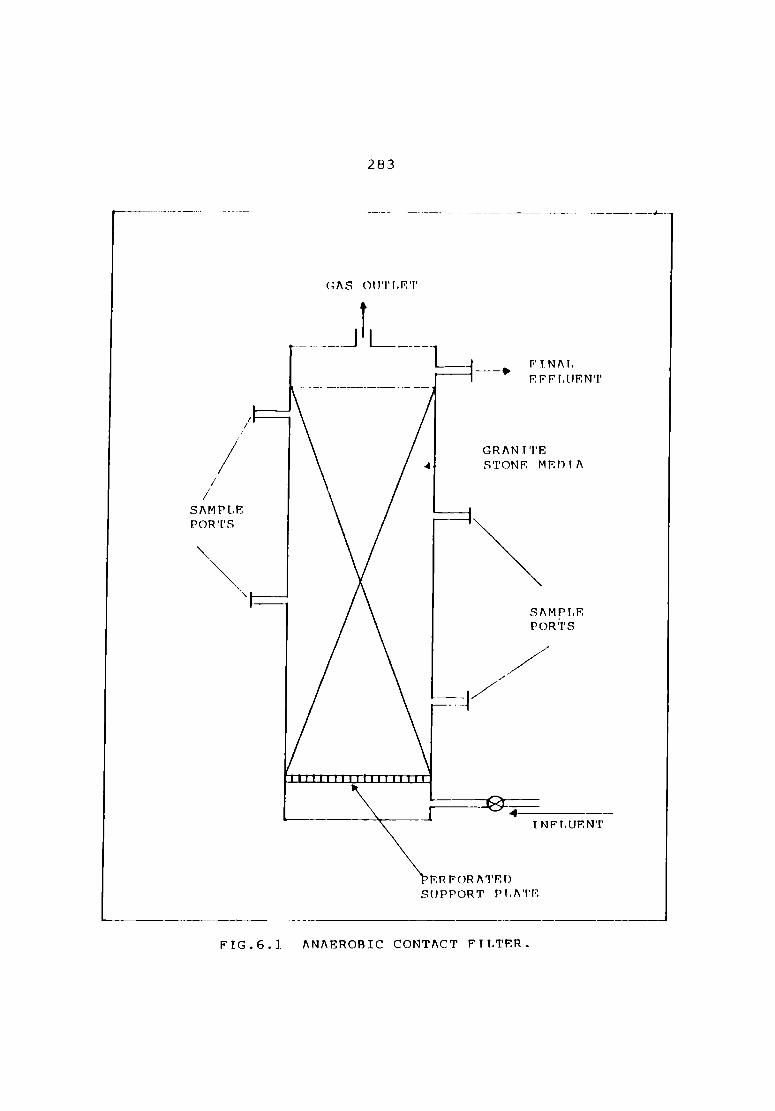
283
GAS Oll'l'f.F‘.'l'
T
»_"Mm"_J L—_—“~l:::4___. FINALRFFLUENT
/.I
GRANITE4 STONE MEDIA
/SAMPLE __ IPORTS
‘t:_—.snnpnnPORTS
IIIIIIIIIIIIIIIIITT
_J—”8‘<—' —~—TNFLUENT
ERFORATEDSUPPORT PLATE
-———»———_: ..-_.._. _____ __ ,,?_4__‘_
FIG.6.l ANAEROBIC CONTACT FILTER.

284
support plate from an overhead reservoir by gravity flow.
Active biomass was grown on the surface of thefilter media by daily feeding a mixture of sewage and cowdung slurry (1%) into the filter. Significant growth ofbacteria was observed as evident from the methane gasproduction after 20 days of continuous operation. Forproper acclimatization, the proportion of sewage was reducedto 90%, 80%, 70% etc. by adding increasing quantities of therubber latex centrifuging effluent. After 15 days of thiscontinuous acclimatization, steady state was achieved for aCOD concentration of 9500 mg/l. The pH of the feed solutionwas adjusted to 6.4 by adding sodium carbonate and thesolution was fed into the filter at different hydraulicloadings (7.20, 8.64, 10.08 and 11.52 litres/day).
The following observations were made during thecourse of the experiments which lasted for 15 days.
a) Measurement of pH and alkalinity of the influent andeffluent overday.
b) Estimation of COD, BOD, volatile acids, and ammoniacalnitrogen content of the effluent daily using standardmethods (28).

285
c) Analysis of the biogas produced for its methane contentat the end of 15 days of steady state operation of thefilter using a gas chromatograph.
The above procedure was repeated for otherinfluent COD concentrations of 10400 mg/l, 5800 mg/1 and4620 mg/l. Adequate time was provided for acclimatizationbetween change of organic as well as hydraulic loadings.
The characteristics of the centrifuge latexconcentration wastewater samples used in the study are givenin Table 6.1.
6.3 RESULTS AND DISCUSSION
The waste analysis indicated that the waste wasnutrient—limited by phosphorous. For an unhinderedanaerobic treatment of waste at full strength, at least 800mg/1 of nitrogen and 160 mg/l of phosphorous would be needed(29). In order to maintain unhindered anaerobic growth:phosphorous in the form of dibasic potassium phosphate wereadded to the feed wastewater in sufficient quantities tomaintain a phosphorous: nitrogen: carbon ratio of l:5.9:l0O

286
TABLE 6.1
EFFLUENT CHARACTERISTICS
parameter Sample Sample Sample Sample1 2 3 4pH 4.2 4.0 4.0 3.9Total solids, mg/1 8200 17280 12875 8800Dissolved solids, mg/1 6300 11140 10800 8010Suspended solids, mg/1 1900 6140 2075 790COD, mg/1 9500 10400 5800 4620BOD, mg/l 5700 6100 3100 2800Total kjeldahl nitrogen,mg/1 1500 1880 1580 1560Ammoniacal nitrogen, mg/1 630 750 590 710

287
(29). The addition of potassium phosphate served twopurposes. It not only provided the required phosphorous,but it increased the buffer capacity of the system to alimited extent. During periods of decreased alkalinity, theamount of potassium phosphate added to the feed wasincreased to provide additional buffer capacity.
(a) pH Value
pH range of 6.4 to 7.3 was observed for variousorganic loading rates of latex concentration effluent. ThepH variation observed for the organic loading rates,6 kg/day/n? and 7.2 kg/day/m3 are plotted in Fig.6.2. Inall the loading conditions, reduction in pH was observed inone day detention samples because of production of volatileacids but subsequently it remained neutral because ofconversion of volatile acids to biogas.
(b) COD Removal
A steady state COD removal efficiency was obtainedafter a period of operation at a given loading. The resultsof a series of organic loading changes are illustrated inFig.6.3. Initially, latex effluent with a COD of 9500 mg/lwas fed to the filter at a loading rate of 6 kg COD/day/m3
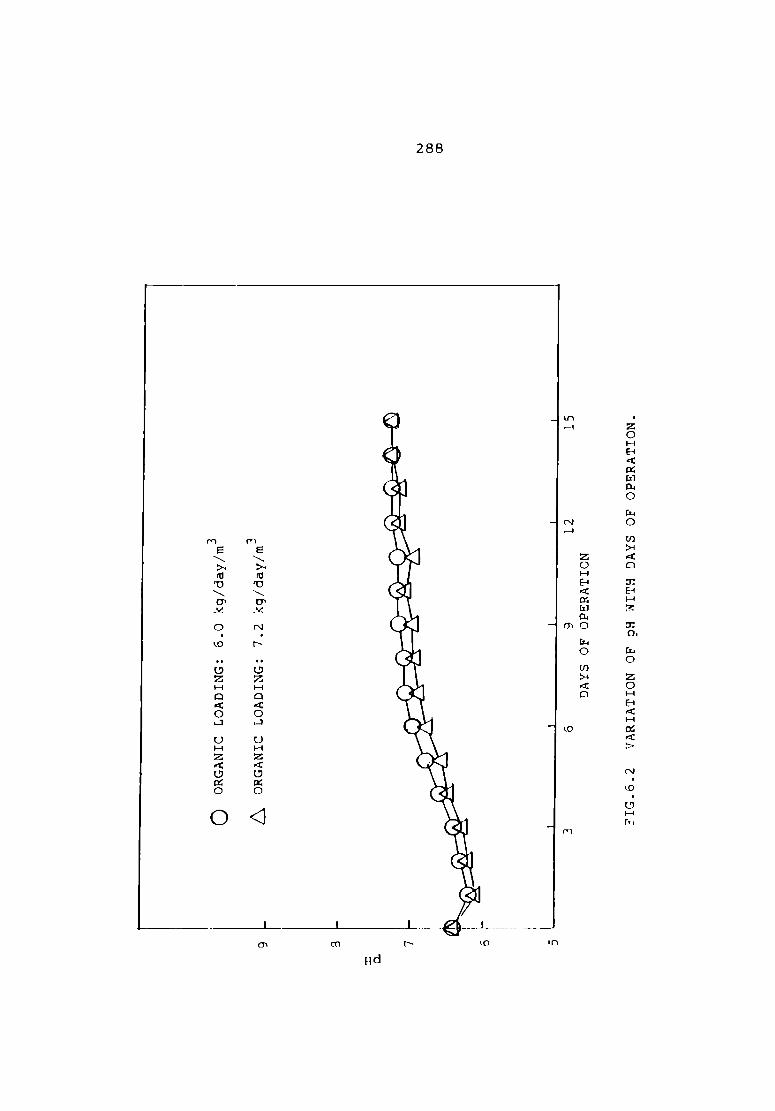
288
.zoHa<mmmo mo mw«o maHz mm mo zOHB<Hmd> ~.m.oHm
zoHa<mmmo mo mw¢o
NH m
ID;—I
LO
(‘W
\4 A H _ ,nme\»mo\mx m.~ "wzHo«oq uHz4omo AN 1 m
me\»mn\mx o.m ”uzHo<oq uHz«wmo mu

289
.muzHo¢on uHzmumo mooHm<> B4 20
Huunnmm non ezmummm m.m.oHm
-e\»mm\o« \ozHo«on uHzmwmo
m m
T
-4 (\l
Cos oovoa noon ezmn.EzH .Qme oomm 58 azm3.mzH O
l
onomomOOH
NOILOHGRH GOD mNflDHfid

290
This was followed by loading rates of 7.2, 8.4 and9.6 kg/day/m3. On increasing the loading rate from 6 to8.4, the COD removal efficiency increased from 89 per centto 92 per cent. But when the loading rate was furtherincreased to 9.6 kg/day/m3, the COD removal dropped to 88per cent. The same trend was observed at an influent CODconcentration of 10400 mg/l. Although the COD removalefficiency increased from 89 per cent to 91 per cent onincreasing the organic loading rate from 6.57 kg/day/m3 to9.19 kg/day/m3, it dropped to 87 per cent on furtherincreasing the loading rate to 10.5 kg/day/m3.
It is seen that the COD removal efficienciesdecrease with increase in organic loadings beyond aparticular limit This may be due to substrate inhibition,or inadequate acclimatization of bacteria or formation ofpropionic acids (30).
The percentage COD reduction obtained on each dayof operation of the filter is shown in Fig.6.4. The curvesplotted for different organic loading rates show that rapidCOD removals are obtained in the first day detentionsamples. This should be due to the active biomass presenton the filter medium which decomposes the organic matter in

291
.zoHa<mmmo mo m»«o EHHB zoHauaomm oou
ezmummm ZH zOHB<Hm¢5
zoHa¢mmmo mo mw<n
m
LO
w.m.oHm
>mo\me\mx m.m "ozHo¢oq uHz¢omo>mu\me\mx v.m "uzHo¢oq oHz¢omommoxmexmg N.» uozHo<oq uHz¢umo
OO<l4>mn\ms\wx m uwzHo<oq uHzaomo
I.
onom
NOT .T.Df1(1HH GOD .T.NFl3HH<-1

292
the feed wastewater very efficiently. For all the loadingrates, most of the COD removal was found to take placeduring the first 10 days of operation. This points to thefact that most of the stabilization of the waste should beoccurring during the first ten days of operation. The CODremoval efficiencies achieved for different influentconcentrations are summarised in Table 6.2.
(c) BOD Removal
As in the case of COD removal, the BOD removalefficiency also increased with organic loading upto acertain limit. The variation of BOD removal with organicloading is illustrated in Fig.6.5. When the organic loadingrate was increased from 6 kg/day/m3 to 8.4 kg/day/m3 for aninfluent COD of 9500 mg/l, the BOD removal efficiencyincreased from 92.5 per cent to 95.0 per cent. But onincreasing the organic loading rate to 9.6 kg/day/m3, theBOD removal efficiency was found to drop to 91.0 per cent.The same pattern repeated for other influent CODconcentrations also. The reason for this behaviour shouldbe substrate inhibition or improper acclimatization ofbacterial mass.

.mwzHo¢on uHzmomo mooHmm> um zounuommm mom mzmu.mm m.m.wH
qe\>mn\mm \uzHa¢oa uHz¢umo
293
m m .1 N
A DH. ” A m (I
ML omJ on
Que oovoa uoou azn.b.EzH .
n om
Hxmfi comm "oou azmanmzH mu
1 om00.
NOT. .T.DF1(l'E|H OOH .T.NFl.')H!-‘Id

294
.zoHa4mmmo mo mwao mHH3 zoHauoomm oom azmummm ZH zOHB¢Hm<>
zoHa<mmmo mo mȢo
m
K0
o.m.uHm
ma. 3
»mo\me\3 m.m nozfizoq Szaomo {»mo\me\3 Ya ".ozE<o.H ufifiumo 4>m_.u\.me\mx N.» 5233:. Bzaumo .»mo\me\mx o uozHa<og oHz<umo mu
OOH
(ill! (10?! .LN'.El()llEldNOl..l.D{](|

295
TABLE 6.2
PERFORMANCE OF ANAEROBIC FILTER FORVARIOUS ORGANIC LOADINGS
Influent Organic loading Percent PercentCOD concen— rate 3 COD BODtration kg COD/day/m removal removalmg/1
6.0 89.0 92.59500 7.2 91.0 94.08.4 92.0 95.09.6 88.0 91.06.57 89.0 91.07.88 90.5 93.09.19 91.0 94.010400 10.50 87.0 90.03.66 87.0 90.54.39 88.0 91.55800 5.13 89.0 93.05.86 86.0 88.52.92 87.0 90.03.50 89.0 91.04620 4.08 90.5 94.04.67 85.0 90.0

296
The variation of BOD with detention time is shown
in Fig.6.6. Rapid BOD removals were observed in the firstday detention samples in all the loading conditions whichconfirms the presence of an active biomass in the filter.The BOD removal efficiencies achieved during the course ofthe experiments are given in Table 6.2.
(d) Gas Production
Biogas production is the final step of anaerobicprocess and is due to the conversion of volatile acids togaseous form by methanogenic bacteria. The volume of gasgenerated and its methane content for different organicloadings are plotted in Fig.6.7.
For an influent COD concentration of 9500 mg/l,the volume of gas collected during 15 days of operation ofthe filter was 5.1 litres, i.e., 0.34 litres of gasproduction per day on an average. The volume of gascollected rose to 5.85 litres (0.39 litre/day) on increasingthe organic loading to 8.4 kg/day/m3. But on increasing theorganic loading rate further to 9.6 kg/day/m3 the volume ofmethane produced was found to decrease to 5.4 litres. Thesame trend was observed for an influent COD concentration of

297
J.N1d.l.N()() E|NVIl.L3l«| .l.N!d(.)U'dd
om8omo3
.ozHo¢oq oHz<omo .m>_ mmuoHm mo zoHa4mmzmo ~.o.oHm
mmo\me\mg .ozHa<og uHz4umo
NH ofi m o v
q . _ _ ,_. M
@ H\me oovoa 2 azmazou mz4memz
W
H\me oovofl coo amgzH mom .zoomm m<wHxme oomm 2 azmazoo mz<mamsH\me oomm oou amqzH mom .zoomm m<w
.cPIIIIm&MmmNuuu:AmnnunnnnuAmnnmuw\\AN
OO<]4_.,. _ __ _.____ _._.__._l, ___
KC
(9913! I) :awn'm/\ svn
298
10400 mg/1. On increasing the organic loading rate from6.57 kg/day/m3 to 9.19 kg/day/m3, the gas productionincreased from 5.25 litres (0.35 litre/day) to 6 litres (0.4litre/day). While on increasing the organic loading rate to10.5 kg/day/m3, the volume gas produced dropped to 5.4litres.
The methane content of the biogas produced variedwith organic loading. As in the case of gas production, themethane content of the gas increased from 63 per cent to 67per cent on changing the organic loading rate from 6.0kg/day/m3 to 8.4 kg/day/m3 for an influent COD concentrationof 9500 mg/1. The methane content of the biogas was foundto decrease to 62 per cent on increasing the organic loadingrate to 9.6 kg/day/m3. The same trend was observed for theinfluent concentration of 10400 mg/1.
The reason for the drop in gas production andmethane content beyond a particular organic loading rateshould be due to the lesser organic removal at higherorganic loadings and lesser activation of methanogenicbacteria (30). The specific biogas yield expressed as litCH4/gm COD destroyed/day for the various organic loadingsstudied is given in Table 6.3.

299
TABLE 6.3
SPECIFIC METHANE PRODUCTION FORVARIOUS ORGANIC LOADINGS
Influent CODconcentrationmg/l
Organic loadingrate 3kg COD/day/m
Specific methaneproductionlit CH4/gm CODdestroyed/day
6.0 0.0259500 7.2 0.0270.4 0.0299.6 0.0266.57 0.0237.00 0.02510400 9.19 0.02010.50 0.0243.66 0.0234.39 0.0255000 5.13 0.0295.06 0.0242.92 0.0253.50 0.0264620 4.00 0.0294.67 0.026

300
(e) Variation in Alkalinity
The variation in alkalinity experienced in thefilter during the experimental run of 15 days is shown inFig.6.8. The alkalinity values measured for the two organicloadings, viz., 6 kg/m3/day and 7.2 kg/day/m3, show that thefluctuations occurring have been taken care of by thebacterial mass in the filter. There is practically nodifference between the initial and final alkalinity valueswhich indicates a steady state operation of the filter.
(f) Volatile Acids
The volatile acid concentration of the effluentduring the period of operation of the filter is shown inFig.6.9.
For all the organic loading rates, there was asteep increase in the production of volatile acids duringthe initial period. This should be due to the increasedactivity of non—methanogenic bacteria which produce volatileacids (31). But as the detention time increased, thevolatile acid concentration came down. The conversion ofvolatile acids to methane by bio-methanation should havecaused the drop in volatile acids concentration.

301
.zoH.2mmmo mo 2:3 EBHZ .w.H.HZHq¢M...2« ZH zOHB¢Hm<> m.m.oE
zoE<mmmo mo mags
3 3 m 0 m_ _ _ % _ fi
IOOH
N.» nozfizoq uHz.$mo{F.Ene\3 o "uzE<o._ Bzaomofl
oom
4\</ 4/
fl4\ 4/4/4\4\ 4\4\4/4\4/£2
(I/51") A.I.INI']V)l’J\I

302
ma
.zoHH<mmmo mo m»<o .m>_ zoHauooomm DHU< maHa<qo> .m.o.wHm
zoHe«mmmo mo mw<o
ma NH m 0 m
— _ a _
oomoomI oov
me.:§<E o.m "oz3<o._ Bzfiumo 4me:.6o\3 Tm “ozS<o... Bzfimo 4
- oom
ms::.6\9. N.» ”ozHo<o._ Szfiumo .msimuxfl m “ozHo<og Bzaomo O
ooo
(T/51“) u I :)v 3'1 1.l.‘\1‘l()/\

303
(g) Effect of Filter Height
During the periods of steady-state operation ofthe filter, samples were collected periodically from thefilter at various heights. The profiles of COD removalefficiency "Vs' filter depth at various organic loadings ofthe latex concentration effluent are shown in Fig.6.lO.
For all the organic loadings, the maximum CODremoval efficiency was observed in the samples collected ata depth of 150 cm. The samples collected from points atdifferent depths of 120 cm, 90 cm and 30 cm showed a steepfall in the COD removal efficiency. The results indicatethat the performance of the filter in terms of per cent CODremoval was better at a filter height of 30 cm. This showsthat the biomass is most active at the bottom portions ofthe anaerobic filter. Since the efficiency of treatment didnot improve beyond 120 cm filter height, higher filters maynot be advisable. Khan and Siddiqi (32) and Govindan (20)also reported that the efficiency of the filter was lowbeyond 120 cm (4 ft.).
(h) Ammoniacal Nitrogen Removal
The per cent ammoniacal nitrogen removal obtained

COD REDUCTION
PERCENT
100
80
60
40
20
304
C) ORGANIC LOADING: 6.57 kg/day/m3
. ORGANIC LOADING: 7.88 kg/day/m3
LOADING: 9.19 kq/day/maA ORGANIC
A ORGANIC I.0AmN<:: 10.50 kq/day/rn‘
I L,12030 60 90
FILTER DEPTH; Cm
FIG.6.1O COD REMOVAL EFFICIENCY 'Vs.' FILTER DEPTH.
I50

305
in the filter in a period of 15 days for different organicloading rates is shown in Table 6.4.
The results show that the upflow anaerobic filteris capable of reducing the ammoniacal nitrogen content inthe filter considerably. The persistent reduction ofammoniacal nitrogen in the effluents may be due to theutilisation of nitrogen as nutrient by the microbialpopulation. According to a study carried out by Sanders andBloodgood (29), for an inhindered anaerobic growth of wasteat full strength, at least 800 mg/l of nitrogen would beneeded. All the effluent samples used for the studycontained total kjeldahl nitrogen ranging from 1500 to 1880mg/1 and ammoniacal nitrogen ranging from 590 to 750 mg/l.
The trend observed in the case of COD and BODremoval is repeated for ammoniacal nitrogen removal also.For an influent COD concentration of 9500 mg/l, as theorganic loading rate increased from 6.0 kg COD/day/m3 to8.4 kg/day/m3, the ammoniacal removal efficiency increasedfrmn 87 to 92 per cent. But on further increasing theloading rate to 9.6 kg/day/m3, the removal efficiencydropped to 89 per cent. This may be due to decreasedbacterial activity at higher organic loads resulting fromsubstrate inhibition.

306
TABLE 6.4
PERCENTAGE AMMONIACAL NITROGEN REMOVAL
Organic loading Percent removalkg Coo/day/m3 Of “H4-N6.0 87.07.2 90.08.4 92.09.6 89.06.57 88.07.88 91.09.19 93.010.50 88.03.66 86.04.39 87.55.13 90.05.86 86.02.92 85.03.50 87.04.08 90.54.67 85.0

307
(i) Kinetics
(1) Substrate kinetics
The substrate rate constants (k2A/V) weredetermined by using equation (4). From Fig.6.ll, it can beobserved that loading rates versus effluent concentrationvaried linearly as predicted by Dewalle and Chian model(25).
The maximum loading rates (Lm) and half velocityconstants (KS) were determined using equation (5). TheLineweaver Burk Plot (Fig.6.l2) indicates that whenreciprocal of substrate removal was plotted againstreciprocal of effluent substrate concentration, a linearrelationship as desired was obtained. The maximum loadingrate that could be applied in the anaerobic filter was found
to be 50 kg CODr/m3/d.
The substrate removal rate constants, viz., KL,K6 and 'a' (Figs.6.l3 to 6.15) were determined usingequations 6, 7 and 8. The value of KL was found increasingwith detention time, while K decreased with increasing9
loading rates (Figs.6.l6 and 6.17).

308
.zoHa<mazmozou azmogmmm m:mmm> ma<m 0ZHD¢Oq mo aoqm
ooofl
H\mE ‘A my zoHa¢mazmozou azmogmmm
oowa
wooma
oooa
oom
oom
00¢
HH.m.UHm
oom
.
A
4
N
_
_
oomcowooooom
oooflooma WA .dp I) ELVH DNIUVOJ(A99/‘:11/Goo Bw

309
.me<m uzHo<oq z::Hx<z mo zoHB¢zHzmmamo NH.o.wHmmOaxAHwmv ZOHB<mBZmUZOO azmoqmmm mo q<oommHumm
®.H w.H N.a o.H m.o m.o v.o N.O
_ _ _ _ _ _ 1 _
H\me nmnw n mg»mo.me\uooo mg om u xmeq
m m
m+ Mw .xmE
m g
mH.onH.o
I (p‘Ew/bx) [_1 ’3LVH DNIGVO1 so 1VDOHdID38

RATIO OF EFFLUENT TO INFLUENT COD
310
0.Il
e
E; = 0.135 exp(—KL/L)3
KL = 3.95 kg/m .dayL
n n 10.05 0.10 0.15RECIPROCAL OF LOADING RATE(L") (kg coo/m3.d)’S _FIG.6.l3 PLOT or (.2 ) vansus L I
51

RATIO OF EFFLUENT TO INFLUENT COD, Se/Si
311
se '-— = 0.128 exp(—K .8)si 3 ._ -1K _ 0.39 day .
1 I I I0.2 0.6 1.0 1.4HYDRAULIC RETENTION TIME ( 8), any
S
FIG.6.l4 PLOT OE‘ -S-E VERSUS HRTi

FRACTIONAL COD REMOVAL (%E)
312
0.91
E: 0.935 (l—0.0l8/9 )
I
FIG.6.15
0.2 0.4RECIPROCAL op HRT (e'1). DAY
PLOT OF FRACTIONAL
O. 6 0.8COD REMOVAL V5.
1.01
RECIPROCAL OF HRT.

SUBSTRATE REMOVAL RATE CONSTANT (Y); kg/m3.day
15.0
13.0
H H 0
\O O
\l O
313
J I I L, -I I 410.2 0.4 0.6 0.8 1.0 1.2 1.4HYDRAULIC RETENTION PERIOD (X), DAY
FIG.6.16 PLOT OF SUBSTRATE REMOVAL RATE VERSUS HRT.

SUBSTRATE REMOVAL RATE CONSTANT (2), day'1
F‘ I |-‘
0 \O
O \l
314
Y —'o.o33x + 1.17
1 I 1 n 1 L_ 12 4 6 e 10 12 14LOADING RATE (X), kg/m3.day
FIG.6.17 PLOT OF suEsTRATE REMOVAL RATE CONSTANT VERSUSLOADING RATE.

315
The maximum removal efficiency (Esm) andtheoretical detention time ('a') were determined by Youngand Mc Carty Model given by equation (8). The maximumsubstrate removal efficiency decreased with increasingloading rate and 'a' increased with decreasing efficiency(Fig.6.l8) thereby confirming the fact that 100% removalcannot be achieved even at detention times tending toinfinity.
The Stover's model (equation 9) was evaluated forthe anaerobic filter to determine the values of maximum
specific substrate loading rate (Umax) and proportionalityconstant (K6) (Fig.6.19).
(2) Microorganism growth kineticsThe determination of specific growth rate (p) and
biological constant (KP) were estimated for the upflowanaerobic filter by making use of equation (10) (Fig.6.20).The model fitted well for the filter. The values ofspecific growth rate (p) was found to increase withincreasing loading rates as shown in Fig.6.2l. This may beattributed to the fact that at higher loadings there isevery possibility of volatile acid formation which in turnis used by methanogenic bacteria for generation of methane.

MAXIMUM REMOVAL EFFICIENCY (Y) CRITICAL HRT (Y), day
0.018_ _,,.»«/””/"_ _# ,9/'6. ,’/’''’’'7M,,,
0.016E””””/”/”””
0.014_
2 = o.0015x + 0.01630.012_
0.010~
1.1 _
Y = —o.o12x + 1.01
1.0 —
Q 00.9 _ \\\\\\.\\\\\\\
J L 1 1 1 12 4 6 5 10 12LOADING RATE (x), kg/m3, day
FIG.6.l8 PLOT OF MAXIMUM REMOVAL EFFICIENCY AND
316
CRITICAL HRT VERSUS LOADING RATE.

m2.daykg_l
e)
RECIPROCAL OF SUBSTRATE UTILIZATION (A/F(Sr-S
1
317
Umax(Fsi/A)U= “—"*“—(KB+FSi/A)_ -2 -1
Umax fl 0.018 kgm day
140m)” KB = 0.0278 kgm_2day—10
10000 —
O
6000 —
2oooL
IJ I I I I I I _2000 4000 6000 8000 10000 12000 14000 16000
RECIPROCAL OF APPLIED SUBSTRATE LOADING (A/FSi), m2.day kg-1FIG.6.19 DETERMINATION OF MAXIMUM SPECIFIC SUBSTRATE REMOVAL.

LOG OF REMOVAL EFFICIENCY
318
LOG our HRT (LOGB ), DAY0.02 0.06 0.10 0.14 0.18 0.22O I 1 If I I I
E = 1.075 90'”
0.03 L
0
0.04
0
0.05
0
0.06
._ _ ____:J.FIG.6.2O DETERMINATION OF SPECIFIC GROWTH RATE OF BIOMASS.

SPECIFIC GROWTH RATE (Y), day-1
I-‘ 0 |\.)
b O
O CD
319
Y 0.55 L 0.0375X
L I J 1FIG.6.2l
3 6 9 12LOADING RATE (X), kg/m3.day
PLOT OF SPECIFIC GROWTH RATE VERSUS LOADING RATE.

320
The maximum specific growth rate (pmax) and decay
coefficient (kd) were determined using Monod's modifiedmodel, equation (11). The values of F and K weremax Pdetermined by trial and error method using various assumed
values of KS until a linear relationship with a negativeintercept was obtained by plotting P against (Se/KS+Se) asgiven in Fig.6.22.
(3) Gas kineticsTotal gas and methane production were defined as a
function of applied substrate loading by equations (12) and(13). The reciprocal of specific gas production rate andreciprocal of applied substrate loading rate have beenplotted and a linear relationship as predicted was obtained(Fig.6.23). The values of maximum specific gas production
rate (Gmax) and proportionality constant (GB) have beendetermined. Similarly the maximum specific methaneproduction rate (Mmax) and proportionality constant (MB)have also been found (Fig.6.24).
The values of kinetic parameters obtained aresummarised in Table 6.5. Loading rates indicate maximumloading rate that can be applied to the anaerobic filtersystem and are not necessarily optimum values. Only typicalgraphs have been presented.

SPECIFIC GROWTH RATE 9;), day-1
321
‘EII I J C!)
I X0.:
//27 0.11 0.13 0.15 0.17
F‘[G.6.22_ DFJTERMINl\TION OF MAXIMUM SPECIFIC GROWTH RATE.

RECIPROCAL or specxyxc GAS PRODUCTION RATE (G'1), (m3.m'2.day‘l)
O C c
O O \l
C 0 w
0 O U)
322
A
max
I 0 ll
Gmax (Fsi/A)(G lFSi/A5B
3 2 -1= 0.004m m‘
0.017 kgm_
I I I4000
RECIPROCAL OF APPLIED SUBSTRATE LOADING (A/FSi)(m2.day kgFig.6.23
10000 16000 22000l
DETERMINATION OF MAXIMUM SPECIFIC GAS PRODUCTION.
)

323
Mmax(FSi/A)Mn T‘?-—§;7K7
:--I
0-038~- M " 0.002m3.m’2.day‘11 /M : 0.013 kg m'2.day‘
0.036 _ //
0.032 —
RECIPROCAL OF SPECIFIC METHANE paoon. RATE (M'l).m3.m'2.day
O O 91 A
O . 030 l. _.._l..._,. "H ._ L________L4000 8000 12000 16000
RECIPROCAL or APPLIED SUBSTRATE LOADING (A/Fsi) m2.day.kg-JFIG.6f24 DETERMINATION or MAXIMUM spacrrrc METHANE pncxnurrtow.

324
TABLE 6.5
KINETIC CONSTANTS FOR THE ANAEROBIC FILTER
I. SUBSTRATE KINETICS
Parameter ValuesE 0.935H1a; d 0.018K9 0.39KL 3.95
3Lmax(kg CODr/m .d) 50.00Ks, mg/1 47973Umax,(kg CODr/m .d) 0.018
KB, (kg/m2.d) 0.028II. MICROORGANISM GROWTH KINETICSK 1.075
UPI (3-1 0.15-1Fmax' O'625
-1kd, d 0.43III. GAS KINETICS
3 2Gmax, m /m .d 0.004GB, kg COD/m2.d 0.017M , m3cH /m2.d 0.002max 4M , kg COD/m2.d 0.013B

325
6.4 CONCLUSION
l. The anaerobic filter successfully treated the effluentsfrom a centrifuge latex concentration unit at influentCOD concentrations as high as 10400 mg/l. The maximumCOD removal and BOD removal recorded after 15 days ofcontinuous steady-state operation of the filter was 91per cent and 95 per cent respectively at an organicloading rate of 8.4 kg COD/day/m3 and a hydraulicretention time of 1.2 days.
The COD and BOD removal efficiency of the filter wasfound to increase on increasing organic loading upto acertain limit. On increasing the organic loadingfurther, the removal efficiency was found to drop.
The maximum volume of gas production recorded during theperiod of investigation was 0.4 litres/day. Thepercentage methane content of the gas ranged from 61 to67 per cent.
A pH range of 6.4 to 7.3 was observed during the study.Eventhough a reduction in pH was observed initially, itremained almost neutral subsequently.

326
For all the organic loading rates, there was a steepincrease in the volatile acids concentration during theinitial period, but subsequently it came down.
The performance of the filter was found to be better atlower depths, especially at heights below 30 cm.
The anaerobic Contact filter is capable of reducing theammoniacal content of the latex centrifuging effluentconsiderably. A maximum removal efficiency of 92 percent was observed for the organic loading rate of 8.4kg/daY/m3.
The important kinetic parameters have been determinedfor substrate, biomass and biogas for the anaerobicfilter.

327
REFERENCES
Metcalf and Eddy, Inc., Wastewater Engineering:Treatment, Disposal, Reuse, Tata McGraw Hill, New Delhi(1979).
Higgins, I.J. and Burns, R.G., The Chemistry andMicrobiology of Pollution, Academic, London (1975).
Mara, D.D., Bacteriology for Sanitary Engineers,Churchill Livingstone, Edinburgh (1974).
Lawrence, A.W. and Mc Carty, P.L., J. Water Pollut.Control Fed., 41, 2 (1969).
Mc Carty, P.L., Public Works, 95, 9-12 (1964).
Mc Carty, P.L., Kinetics of Waste Assimilation inAnaerobic Treatment, Developments in IndustrialMicrobiology, Vol.7, American Institute of BiologicalSciences, Washington, D.C. (1966).
Mc Kinney, R.E., Microbiology for Sanitary Engineers,McGraw Hill, New York (1962).

10.
ll.
12.
13.
14.
328
Schroeder, E.D., Water and Wastewater Treatment, McGraw
Hill, New York (1977).
Brawn, R. and Huss, S., Process Biochemistry, 77, 4, 25(1932).
Clark, R.H. and Spiece, R.E., Proc. 5th InternationalWater Pollution Res. Conference, San Francisco, pp.27—38(1970).
Young, J.C. and Mc Carty, P.L., Proc. 22nd IndustrialWaste Conference, Purdue University, pp.559—574 (1967).
Young, J.C. and Mc Carty, P.L., J. Wat. Pollut. ControlFed.[ 411 5
Plummer, A.H., Malina, J.F. and Eckenfelder, W.W., Proc.
23rd Industrial Waste Conference, Purdue University,pp.462—478 (1968).
El—Shafie, Ahmed, T. and Bloodgood, D.E., J. Wat.Pollut. Control Fed., 45, ll (1973).

15.
16.
17.
18.
19.
20.
21.
22.
23.
329
Arora, H.C., Chottapadhya, S.N. and Routh, T., Wat.Pollut. Control, 74, 584 (1975).
Jennett, J.C. and Dennis, N.D., J. Wat. Pollut. ControlFed., 47, 104 (1975).
Colleran, E.M., Barry, A.W. and Newell, P.J., ProcessBiochemistry, 77, 2, 12 (1982).
Landine, R.C., Brown, G.J. and Veeraraghavan, T., FoodScience and Technology, 14, 2, 144 (1981).
Lovan, C.R. and Foree, E.G., Proc. 26th Industrial WasteConference, Purdue University, pp.lO74—lO86 (1971).
Govindan, V.S., IAWPC Tech. Annual, 15, 199 (1988).
Sharma, S.R.R. and Bandopadhyay, M., Indian J. Environ.Hlth., 33, 4, 456 (1991).
Seidel, D.F. and Crites, R.W., Jour. San. Eng. Div.,Proc. Amer. Soc. Civil Engr., 96, 267 (1970).
Polprasert, C. and Park, H.S., Wat. Res., 20, 8, 1015(1986).
24.
25.
26.
27.
28.
29.
30.
31.
330
Tamblyn, T.A. and Sword, B.R., Proc. 25th Ind. WasteConf., Purdue University; p.1135 (1970).
Dewalle, F.B. and Chian, E.S.K., Biotechnol. Bioeng.,18, 1275 (1976).
Venkataraman, J.’ Satyanarayan, S.) Deshpande, C.V. andKaul, S.N., Proc. Indian Chem. Engg. Cong., 479 (1989).
Stover, E.L., Reinaldo, G. and Gomathinayagam, G., Proc.2nd Ind. Conf. on Fixed Film Biological Process.
Standard Methods for the Examination of water and WasteWater, 16th edn., American Public Health Association(1985).
Sanders, F.A. and Bloodgood, D.E., Jour. Water Pollut.Control. Fed., 37, 1741 (1965).
Callander, I.J. and Barford, J.P., Process Biochem., 18,24 (1983).
Gadre, R.V. and Godbole, .H, Indian J. Environ. H1th.,23: 1; 54 (fl986).

331
32. Khan, A.N. and Siddiqi, R.H., Indian J. Environ. Hlth.,18, 4, 282 (1976).

Chapter 7
SUMMARY AND CONCLUSIONS
The overall objective of the study was to evaluatethe effectiveness of a few physico—chemical and biologicalmethods for the treatment of effluents from natural rubberprocessing units, especially a centrifuge latexconcentration unit. The effluents from a centrifuging unitwas specifically selected for the study because they showthe maximum pollution potential. The treatment methodsevaluated in this study were earlier tried successfully forthe treatment of wastewaters from process industries likedistilleries, food processing, textile mills etc. Anattempt was made to extend these methods to the treatment oflatex concentration effluents.
This thesis is divided into seven chapters.
In Chapter 1, the composition of natural rubberlatex and*effluent generation are described. The importanceof various physical, chemical and biological characteristicsof wastewater are discussed briefly. The characteristics ofeffluents from natural rubber processing units, the effect
332

333
of effluent discharge on water bodies and the presenttreatment practices have also been described. Theobjectives and scope of the study are defined in thischapter.
Chapter 2 is divided into two parts. In part 'A',the characteristics of the combined effluent and theindividual characteristics of effluents from the twosections of a latex centrifuging unit, viz., thecentrifuging section and skim latex coagulation section aredescribed. The study showed that the effluents dischargedfrom a latex centrifuging unit are strongly acidic innature. The average pH of the combined effluent was foundto be 3.9. The main source of acidic effluents wasidentified as the skim latex coagulation section wheresulphuric acid is used. BOD, COD, suspended solids content,total kjeldahl nitrogen content and ammoniacal nitrogencontent of the effluents were estimated and the 50 per centand 90 per cent probability values were calculated. Thesuspended solids content of the wastewaters ranges from 9.0to 42.2 per cent of the total solids and major portion ofthe solids are present in the dissolved form. Thecorrelation developed between COD and total organic carbongives the indication that organic carbon which is not

334
oxidised by dichromate during COD estimation may be presentin the latex centrifuging effluent. The pollution load froma typical rubber latex centrifuging unit is estimated to beabout 128 kg BOD per day.
In part 'B' of Chapter 2, the results of theexperiments carried out on latex centrifuging wastewatersusing nine commonly available metal coagulants arepresented. The coagulants used in the study’ were alum,aluminium sulphate, ferrous sulphate, ferric sulphate,ferric chloride, ferrous chloride, aluminium chloride, limeand magnesium chloride. The effectiveness of the metalcoagulants was evaluated in terms of COD reduction,turbidity removal and ammoniacal nitrogen removal. Theeffect of pH on coagulation was also investigated. Theoptimum pH values for the most effective coagulation actionof the metal salts except lime were in the range of 6.5-8.5.As for lime, the best results were obtained at a pH of 10.5.Among the metal salts, aluminium chloride was found to bethe most efficient one for COD reduction, turbidity removaland ammoniacal nitrogen removal. The settleabilitycharacteristics of the flocs formed by all the ninecoagulants were studied. The compressibility of the sludgeproduced by aluminium chloride was found to be better thanthat of the sludge generated by other coagulants.

335
The results of the studies carried out with fournatural polyelectrolytes and two synthetic polyelectrolytesare presented in Chapter 3. The natural polyelectrolytesused were starch, sodium alginate, tamarind seed powder andchitosan. The synthetic polyelectrolytes used for the studywere a cationic polyacrylamide based one and an anionicpolyamine based one. The effectiveness of thepolyelectrolytes as primary coagulant and coagulant aid wasevaluated. The optimum pH values for the effectivecoagulation action of the polyelectrolytes were found to bein the range 7.5-11.0. Among the six polyelectrolytesstudied, chitosan was found to be the most effective as aprimary coagulant in the removal of COD, turbidity andammoniacal nitrogen from latex centrifuging wastewaters.The compressibility of the sludge produced by chitosan wasfound to be superior to that of other polyelectrolytes. Asa coagulant aid also, chitosan performed better than others.At a small dosage of 2 mg/l, chitosan could reduce the metalcoagulant dose by about 50-69 per cent. A combination ofaluminium chloride with chitosan was the most effective.Comparing the two synthetic polyelectrolytes, it was foundthat the cationic polyacrylamide based one performed betterthan the anionic one.

336
In Chapter 4, the biochemical oxidation kineticsof wastewaters from a latex centrifuging unit is discussed.The variations in the BOD values of the effluent at fourdifferent temperatures: 20, 25, 30 and 35°C were studied.The biochemical stabilization rate constant (k), oxygenutilisation rate constant (K) and ultimate BOD (L0) weredetermined at 20°C. The study showed that bulk of the BODis exerted within one day for the wastewater samples and theextent of this quantity was found to be dependent ontemperature. The biochemical stabilization rate constant(k) and the corresponding oxygen utilisation rate constant(K) at 20°C for the effluents from a centrifuge rubber latex
1concentration unit were estimated as 0.145 day- and 0.33day_l respectively. The values of biochemical stabilizationrate constant and oxygen utilisation constant were found toincrease with temperature.
The treatability of latex centrifuging effluent ina waste stabilisation pond is the topic of discussion inChapter 5. The possibility of treating the wastewater aloneand in admixture with sewage in the proportions of 1:1, 1:2,1:3, 1:4 and 1:5 was explored in an experimental pond. Thewastewaters from a latex centrifuging unit were found to be

337
amenable for treatment in a waste stabilisation pond inadmixture with sewage using acclimatized algal culture. Thegreater the dilution, the more efficient was the degree oftreatment. Of the five dilutions studied, 1:5 dilution gavethe best performance in respect of BOD reduction, CODreduction, ammoniacal nitrogen removal and suspended solidsremoval. When the wastewater was mixed with sewage in theproportion of 1:5, the BOD reduction and COD reductionobtained were 93 per cent and 90 per cent respectively in adetention time of 15 days. The maximum ammoniacal nitrogenremoval and suspended solids removal obtained were 20 and 25per cent respectively. The algal succession in the pond wasalso studied. The algal count during stabilisation indifferent wastewater—sewage mixtures varied between 3x10⁴and 167x104 per ml. Chlorella vulgaris, Scenedesmusquadricauda, Egglena acus and Microcystis aeruginosa grewwell during the course of stabilisation under experimentalconditions. Eventhough no definite pattern of algalsuccession was observed, the green algae and flagelletsdominated the experimental pond.
In Chapter 6, the treatability of effluents from acentrifuge latex concentration unit in a laboratoryfabricated upflow anaerobic contact filter is discussed.

338
The effectiveness of the filter was evaluated in terms ofCOD removal, BOD removal and ammoniacal nitrogen removal at
varying organic loadings. The anaerobic filter successfullytreated the effluents from a centrifuge latex concentrationunit at influent COD concentration as high as 10400 mg/1.The maximum COD removal and BOD removal recorded after 15
days of continuous steady state operation of the filter were92 per cent and 95 per cent respectively at an organicloading rate of 8.4 kg COD/day/m3 and a hydraulic retentiontime of 1.2 days. The COD and BOD removal efficiency of thefilter was found to increase on increasing the organicloading upto a certain limit. On increasing the organicloading beyond this limit, the removal efficiencies dropped.The maximum volume of gas production recorded during theperiod of investigation was 0.4 litres/day. The percentagemethane content of the gas ranged from 61 to 67 per cent.For an the organic loading rates, there was a steepincrease in the volatile acids concentration during theinitial period, but subsequently it came down. Theperformmce of the filter was found to be better at lowerdepths,especially at heights below 30 cm. Based on theexperimetal results, kinetic parameters were estimated withrespect 0 substrate removal, microorganism growth and gasproductio.
339
LIST OF PUBLICATIONS FROM THE PRESENT W03
Characterisation and Treatment of Effluents from aCentrifuge Rubber Latex Concentration Unit
Nat. Rubb. 4(2), 97-102 (1991).Indian J. Res.,Use of Synthetic Polyelectrolytes in the Treatment ofEffluents from Small Scale Natural Rubber ProcessingUnitsPresented atDecember 1992.
Indian Chem. Engg. Congress, Manipal,
Tamarind Seed Powder as Coagulant and Coagulant aid inthe Treatment of Effluents from Natural RubberProcessing UnitsProceedings of the Fifth Kerala Science Congress, 53-55(1993).
Use of Natural Polyelectrolytes in the Treatment ofEffluents from Centrifuge Latex Concentration UnitsCommunicated to ‘Asian Environment‘.
Treatment of Natural Rubber Latex Concentration WasteWaters by Stabilisation Pond Method
‘Int. J. Environmental Studies‘.Communicated to
Biochemical Oxidation Kinetics of Waste Waters from aNatural Rubber Processing Industry
‘Water Pollution Control‘, U.K.Communicated to
Anaerobic Contact Filter for the Treatment of Effluentsfrom a Rubber Latex Concentration UnitAccepted for Presentation at the Sixth Kerala ScienceCongress, January 1994.