Embed Size (px)
Citation preview

Studies on Bikeability in a Metropolitan Area Using the Active Commuting Route Environment Scale (ACRES)

Örebro Studies in Sport Sciences 13
LINA WAHLGREN
Studies on Bikeability in a Metropolitan Area Using the Active Commuting Route Environment Scale (ACRES)
Örebro Studies in Sport Sciences 13
LINA WAHLGREN
Studies on Bikeability in a Metropolitan Area Using the Active Commuting Route Environment Scale (ACRES)

© Lina Wahlgren, 2011
Title: Studies on Bikeability in a Metropolitan Area Using the Active Commuting Route Environment Scale (ACRES).
Publisher: Örebro University 2011
www.publications.oru.se [email protected]
Print: Ineko, Kållered 09/2011
ISSN 1654-7535 ISBN 978-91-7668-815-1
Abstract Lina Wahlgren (2011): Studies on Bikeability in a Metropolitan Area Using the Active Commuting Route Environment Scale (ACRES). Örebro Studies in Sport Sciences 13, 131 pp. Background: The Active Commuting Route Environment Scale (ACRES) was developed to study active commuters’ perceptions of their route environments. The overall aims were to assess the measuring properties of the ACRES and study active bicycle commut-ers’ perceptions of their commuting route environments. Methods: Advertisement- and street-recruited bicycle commuters from Greater Stockholm, Sweden, responded to the ACRES. Expected differences between inner urban and suburban route environments were used to assess criterion-related validity, together with ratings from an assembled expert panel as well as existing objective measures. Reliability was assessed as test-retest reproducibility. Comparisons of ratings between advertisement- and street-recruited participants were used for assessments of representativity. Ratings of inner urban and suburban route environments were used to evaluate commuting route environment pro-files. Simultaneous multiple linear regression analyses were used to assess the relation between the outcome variable: whether the route environment hinders or stimulates bicycle-commuting and environmental predictors, such as levels of exhaust fumes, speeds of traffic and greenery, in inner urban areas. Results: The ACRES was characterized by considerable criterion-related validity and reasonable test-retest reproducibility. There was a good correspondence between the advertisement- and street-recruited participants’ ratings. Distinct differences in commuting route environment profiles between the inner urban and suburban areas were noted. Suburban route environments were rated as safer and more stimulating for bicycle-commuting. Beautiful, green and safe route environ-ments seem to be, independently of each other, stimulating factors for bicycle-commuting in inner urban areas. On the other hand, high levels of exhaust fumes and traffic conges-tion, as well as low ‘directness’ of the route, seem to be hindering factors. Conclusions: The ACRES is useful for assessing bicyclists’ perceptions of their route environments. A number of environmental factors related to the route appear to be stimulating or hinder-ing for bicycle commuting. The overall results demonstrate a complex research area at the beginning of exploration.
Keywords: active transport, bicycle commuting, bikeability, multiple linear regression analysis, perception, reliability, route environment, validity. Lina Wahlgren, School of Health and Medical Sciences Örebro University, SE-701 82 Örebro, Sweden, e-mail: [email protected]

List of papers
I. Wahlgren, L., Stigell, E. & Schantz, P. (2010). The active commut-ing route environment scale (ACRES): development and evalua-tion. International Journal of Behavioral Nutrition and Physical Activity. 7:58.
II. Wahlgren, L. & Schantz, P. (2011). Bikeability and methodologi-
cal issues using the active commuting route environment scale (ACRES) in a metropolitan setting. BMC Medical Research Meth-odology. 11:6.
III. Wahlgren, L. & Schantz, P. Exploring bikeability in a metropoli-
tan setting: stimulating and hindering factors in commuting route environments. Submitted manuscript.

Table of contents
1 PREFACE ............................................................................................. 13
2 BACKGROUND ................................................................................... 15 2.1 Physical activity ........................................................................................... 15 2.1.1 Active transport ........................................................................................ 16 2.2 Correlates of physical activity ..................................................................... 17
2.2.1 Ecological models of physical activity ......................................... 18 2.3 Measuring the relation between physical activity and the environment ....................................................................................................... 19
2.3.1 The development of the research field ......................................... 19 2.3.1.1 Walkability .............................................................................. 21 2.3.1.2 Space syntax ............................................................................ 22 2.3.1.3 Route choices ........................................................................... 23 2.3.2 A new research strategy .............................................................. 24 2.3.2.1 Bikeability ................................................................................ 24
2.4 Measures of environments related to physical activity............................... 25 2.4.1 Objective measures ..................................................................... 26 2.4.2 Observational measures .............................................................. 26 2.4.3 Perceived measures ...................................................................... 26 2.4.3.1 The measured area ................................................................... 29 2.4.3.2 Items and response scales ......................................................... 29 2.4.3.3 Validity and reliability ............................................................. 31
2.5 Environments related to physical activity: reviews and overviews ............ 34 2.5.1 The route environment related to bicycling ................................. 35 2.5.1.1 Bicycle-related infrastructure ................................................... 36 2.5.1.2 Safety ....................................................................................... 38 2.5.1.3 Road users ............................................................................... 39 2.5.1.4 The ‘natural’ environment and aesthetics ................................. 40
3 THIS THESIS ........................................................................................ 43 3.1 Relevance and research questions ............................................................... 43 3.2 Aims ............................................................................................................. 44
4 METHODS ........................................................................................... 47 4.1 Study designs ............................................................................................... 47
4.1.1 Study I ........................................................................................ 47 4.1.2 Study II ....................................................................................... 47 4.1.3 Study III ...................................................................................... 48
4.2 Participants: procedures, recruitments and descriptive characteristics ...... 49 4.2.1 Advertisement-recruited participants .......................................... 49

4.2.2 Street-recruited participants ........................................................ 53 4.2.3 Experts ........................................................................................ 56 4.2.4 Ethical approval .......................................................................... 57
4.3 Existing objective measures ......................................................................... 57 4.4 Measures ...................................................................................................... 57
4.4.1 The Physically Active Commuting in Greater Stockholm Questionnaire (PACS Q) ...................................................................... 57 4.4.1.1 Measures of descriptive characteristics ..................................... 57 4.4.1.2 The Active Commuting Route Environment Scale (ACRES) .... 58 4.4.1.3 Development of the Active Commuting Route Environment Scale (ACRES) ..................................................................................... 61
4.5 Study area ..................................................................................................... 62 4.5.1 The inner urban area ................................................................... 63 4.5.2 The suburban area ...................................................................... 63
4.6 Statistical analyses ........................................................................................ 66
5 RESULTS .............................................................................................. 67 5.1 Criterion-related validity: differences in ratings between inner urban and suburban environments (Studies I and II) .................................................. 67
5.1.1 Comparisons with existing objective measures ............................ 67 5.1.2 Comparisons between the inner urban and suburban areas as well as with ratings of experts .......................................................... 69
5.2 Test-retest reproducibility in ratings of inner urban and suburban environments (Study I) ....................................................................................... 72 5.3 Representativity: relations between ratings of advertisement- and street-recruited participants (Study II) ............................................................... 75 5.4 Commuting route environment profiles: comparisons between the inner urban and suburban areas, as well as between subgroups (Study II) ...... 77 5.5 Relations between environmental predictor variables and the outcome variable: hinders or stimulates ........................................................................... 82
5.5.1 Correlations between predictors and the outcome variable ......... 82 5.5.2 Model results .............................................................................. 84
6 DISCUSSION ........................................................................................ 87 6.1 Items and response scales ............................................................................. 87 6.2 Validity ......................................................................................................... 88 6.3 Reliability ..................................................................................................... 92 6.4 Commuting route environment profiles ...................................................... 93 6.5 Relations between the route environment as hindering or stimulating and environmental factors ................................................................................. 94
6.5.1 Furthering understanding ............................................................ 97 6.6 Limitations ................................................................................................. 100
6.7 Strengths .................................................................................................... 101 6.8 Future perspectives .................................................................................... 102 6.9 Conclusions and application of findings................................................... 103
7 ACKNOWLEDGEMENTS ................................................................. 105
SVENSK SAMMANFATTNING ........................................................... 107
REFERENCES ....................................................................................... 109
APPENDIX ............................................................................................ 125

LINA WAHLGREN Studies on Bikeability in a Metropolitan Area... I 13
1 Preface After taking my degree in Health Science and Health Education at the Stockholm University College of Physical Education and Sports, now named GIH – The Swedish School of Sport and Health Sciences, located in Stockholm, Sweden, I started an additional course in research methodology at the University College. The head of the course was Professor Ingemar Wedman. The meeting with Ingemar became the beginning of my ‘PhD journey’. I first became Ingemar’s project assistant and later, in 2006, a PhD student with Ingemar as my supervisor. My work as a PhD student was focused on questionnaires measuring health, particularly measuring physical activity as a part of health.
In 2007 Ingemar fell ill and in February 2008 he passed away. He did not just leave me with sorrow and emptiness – still I often think of you, miss your cheerful voice and our talks about research – I also had to find a new supervisor.
At GIH – The Swedish School of Sport and Health Sciences, there is a group called the Research Unit for Movement, Health and Environment aimed at exploring the relations between physical activity, public health and sustainable development. Its main research focus is on active commut-ing. One of the challenges working with physical activity and health is to activate people. An area that I had found interesting was the incorporation of physical activity into normal and habitual daily living. Active commut-ing constitutes a part of that area. Therefore, after being invited by the head of the research unit, Associate Professor Peter Schantz, I decided to join the group and Peter became my new supervisor. I was offered to work with their main research project named Physically Active Commuting in Greater Stockholm (PACS) and data collected with the aim of understand-ing more about active commuters’ route environments. For the collection of data, a scale had been developed, called the Active Commuting Route Environment Scale (ACRES). Before exploring factors of possibly impor-tance in the commuting route environments, I had to begin exploring the accuracy of the ACRES. This became my new research focus as a PhD student, and consequently the beginning of this thesis.

14 I LINA WAHLGREN Studies on Bikeability in a Metropolitan Area...
LINA WAHLGREN Studies on Bikeability in a Metropolitan Area... I 15
2 Background This thesis presents a novel methodological design for studying people’s perceptions of environmental factors in their active commuting route envi-ronments. The overall aim is to understand which factors can be of impor-tance for creating a stimulating route environment for bicycle commuting. The aim of the following Background segments is to present the context in which this thesis has evolved.
2.1 Physical activity Historically, physical activity has been a natural part of being a human being. Nearly all types of human work required a physical effort, not least movement. In contrast, the last few centuries’ ‘labour-saving devices’ in the industrialized world have resulted in the common lifestyles of inactivity. For example, people predominantly transport themselves by motorized means. People’s physical inactivity is a public health concern because physical activity has many substantial health benefits (cf., e.g. U.S. De-partment of Health and Human Services, 2008). Parts of the populations in various countries do not meet the recommended level of physical activity (cf., e.g. Bauman, Bull, Chey et al., 2009). For example, although difficult to estimate, about one third of the Swedish adult population do not meet the recommended minimum level (cf. The National Board of Health and Welfare, Sweden, 2009). Increasing the level of physical activity in the population is therefore an important public health goal (e.g. World Health Organisation, 2004).
Physical activity can be defined as ‘any bodily movement produced by skeletal muscles that result in energy expenditure’ (Caspersen, Powell and Christenson, 1985, p. 126). Furthermore, physical activity can be broken down into different types, such as walking or swimming, and can be per-formed with a specific purpose, such as exercise or leisure. The purposes can be combined. For example, the purpose of active transport can be both exercise and transport. Physical activity performed with the purpose of active transport can be further specified by the purpose or the destination of the trip (Figure 1).

16 I LINA WAHLGREN Studies on Bikeability in a Metropolitan Area...
Figure 1. Physical activity specified by type and purpose.
The common view regarding the public recommendation for health-enhancing physical activity (HEPA) (Oja and Borms, 2004) is that people should accumulate at least 30 minutes of physical activity of at least mod-erate intensity on preferably all days of the week (Haskell, Lee, Pate et al., 2007; Pate, Pratt, Blair et al., 1995; Professional Associations for Physical Activity, Sweden 2003; 2008; U.S. Department of Health and Human Ser-vices, 1996; 2008). Moreover, a physically active lifestyle has been urged (Haskell et al., 2007). A physically active lifestyle or active living represents the incorporation of physical activity into normal and habitual daily living. Thus, active transport – travelling by, e.g. foot or bicycle – could have an important potential for increasing people’s physical activity level (for a review, see Shephard, 2008) and thereby meeting the physical activity rec-ommendation.
2.1.1 Active transport Active transport or non-motorized travel, includes walking, bicycling, small-wheeled transports, such as inline skates and skateboards, and wheelchairs (Committee on Physical Activity, Health, Transportation and Land Use, 2005). The most common forms are walking and bicycling. Active transport, i.e. walking and bicycling, has, however, generally de-clined in the industrialized world over the last decades (cf. Pucher and Buehler, 2010). Active transport and active commuting to the place of work have, from a theoretical point of view, the potential to influence pub-lic health positively – especially bicycle commuting, since it seems easier to meet the requested intensity level by bicycle compared to by foot (cf. Shephard, 2008). Bicycle commuting could probably result in approxi-mately the same improvement in physical performance as specific training programmes (Hendriksen, Zuiderveld, Kemper et al., 2000). An associa-
Physical activity
Type
WalkingBicyclingOther- e.g. swimming, skating
Purpose
RecreationExerciseCompetitionTransportOther- e.g. household activities, occupa-tional activities
Purpose(destination)
WorkOther- e.g. shop, bank
LINA WAHLGREN Studies on Bikeability in a Metropolitan Area... I 17
tion between active commuting and reduced cardiovascular risk has been recognized (for a meta-analytic review, see Hamer and Chida, 2008). A Swedish study (Lindström, 2008) demonstrated that active commuting to the place of work had a negative association with overweight and obesity. Furthermore, transport bicycling and bicycle commuting have resulted in reduced all-cause mortality (Andersen, Schnohr, Schroll et al., 2000; Mat-thews, Jurj, Shu et al., 2007). Although more evidence is needed, regular bicycling will most likely have an impact on health, which will probably affect public health positively (for a systematic review, see Oja, Titze, Bauman et al., 2011). In conclusion, it seems that active transport has the potential to influence health positively.
Besides the likely health benefits, active transports also have other ad-vantages, as well as disadvantages. Active transport could contribute fa-vourably to sustainable development and reduce noise and congestion lev-els. Active transport is, furthermore, less expensive than other means of transport and is ‘trustworthy’ and represents ‘freedom’ since it does not depend on, for example, timetables. A lack of time presently appears to be a major constraint for physical activity behaviours (cf. Trost, Owen, Bauman et al., 2002). Therefore, active transport might have the potential to positively influence the desirable recommended daily level of physical activity, particularly active commuting to the place of work, since it is of-ten done on a regular basis. Apart from the many advantages that active transport seems to constitute, there are some possible disadvantages. Active transport, especially bicycling, requires a physical effort, which sometimes can be tiresome. Active transports can, furthermore, be weather-dependent. Compared to other means of transport, active transports are slow and disadvantageous for travelling longer distances and can be impractical for the transport of cumbersome loads. Although, active transports have some disadvantages, there are many advantages for both the individual and soci-ety. Active transport therefore constitutes an important research area.
2.2 Correlates of physical activity A wide range of factors have been identified as correlates and potential determinants of adults’ participation in physical activity. Correlates refer to simple statistical associations and determinants refer to causal factors (Bauman, Sallis, Dzewaltowsk, 2002). Correlates of physical activity can be categorized as demographic and biological factors, psychological, cogni-tive, and emotional factors, behavioural attributes and skills, social and cultural factors, physical environment factors, and physical activity charac-teristics (for a review, see Trost et al., 2002). The theories and models used for research on correlates of physical activity have gone from specifying

18 I LINA WAHLGREN Studies on Bikeability in a Metropolitan Area...
psychological and social aspects focusing on interventions targeting indi-viduals to a broader perspective (cf. U.S. Department of Health and Hu-man Services, 1996), including ecological models, which in the public health field focus on people’s interactions with their physical and sociocul-tural environments (cf. Sallis and Owen, 2002). Ecological models are well suited for studying correlates of physical activity behaviours.
2.2.1 Ecological models of physical activity Ecological models of physical activity consist of a wide range of influences of behaviours at various levels. Intrapersonal, interpersonal or cultural, organizational, physical environmental and policy factors are included in these models. To a varying degree, all levels of factors can influence behav-iours concurrently. A person is surrounded by different environments and the interactions between a person and the environment constitutes behav-iours. Both objective aspects and people’s perceptions of environments are likely to influence behaviours. For example, objective aspects, such as the quality and quantity of bicycle paths, may influence the likelihood of bicy-cling. Furthermore, if people think that the traffic environment is unsafe, although it is in fact safe, their perceptions could result in a non-bicycling behaviour. ‘Behaviour settings’, which are places were physical activity can occur, should also be considered regarding both access and characteristics (cf. Sallis and Owen, 2002; Sallis, Cervero, Ascher et al., 2006). Ecological models constitute a promising approach and Sallis et al. (2006) stated that such models are ‘well suited for studying physical activity, because physical activity is done in specific places. Studying characteristics of places that facilitate or hinder physical activity, therefore, is a priority’ (p. 299).
Sallis and Owen (2002) suggested that ecological approaches to health behaviour change should be behaviour-specific. This aspect of specificity was further promoted by Giles-Corti, Timperio, Bull et al. (2005). Among other things, they concluded and suggested that ‘future research might consider: 1) studying specific behaviors; 2) the context within which the behavior is performed; [and] 3) using context-specific behavior measures’ (Giles-Corti et al. 2005, p. 180). Studying bicycle commuting to the place of work (Figure 1) and the route environments within which the bicycle commuting is performed constitute such specificity.
LINA WAHLGREN Studies on Bikeability in a Metropolitan Area... I 19
2.3 Measuring the relation between physical activity and the environment
2.3.1 The development of the research field The research on the relation between physical activity and environments is a relatively new area of research. A number of research strategies have, however, evolved, with the aim of measuring the relationship. They all have their strengths and limitations. Studies have appeared from mainly three fields: (1) health, including public health, exercise and behavioural sciences; (2) city or urban planning, including travel behaviour, transport planning, urban design and geography; and (3) parks, recreation and lei-sure sciences (cf. Sallis, 2009). Most of the influential research on the gen-eral relation between physical activity and the environment is found within the first two fields.
First out was the research in the field of urban planning. Research on travel behaviours, i.e. walking and bicycling for transport, and land use, design of communities, and design of transport systems have been studied since at least the 1980s. The goal for the urban planning field was to en-hance the quality of life by, for example, reducing traffic congestion and improving air quality. Residential density, land-use design, and pedestrian-oriented design, often defined as walkability, were the focus (cf. Sallis, 2009). The urban planning field contributes to our knowledge of active transport, but the focus is on a more aggregated community level (Handy, Boarnet, Ewing et al., 2002), which gives a rather crude understanding, leaving much to be learnt on an important individual level.
The focus on environments related to physical activity in the field of health is on a more disaggregated and individual level. Only a few studies in the health field were conducted before the mid-1990s. The physical ac-tivity behaviours of interest for the health field were recreational and lei-sure time physical activities. Social environments, access to recreational facilities, home equipment and neighbourhood attributes were studied (cf. Sallis, 2009). The interest in the field of health for the relationship between active transport and the environment seems to originate mainly from the shift of focus regarding: (a) physical activity recommendations, moving from vigorous to moderate physical activity, emphasizing walking; and (b) behavioural change intentions, moving from interventions targeting indi-viduals to a broader perspective, including ecological models which em-phasize the importance of environments. Consequently, the health and physical activity research was influenced by the urban planning and trans-port research. One example is that by Saelens, Sallis and Frank (2003a) that prompted transport walkability characteristics (i.e. higher density,

20 I LINA WAHLGREN Studies on Bikeability in a Metropolitan Area...
greater connectivity, and more land-use mix) as being important for physi-cal activity and health research. They also suggested that other factors, such as safety, pavements and bike lanes, and aesthetics and topography, possibly associated with active transport needed to be studied. On the basis of these recommendations, a self-report questionnaire, called the Neighborhood Environment Walkability Scales (NEWS), was developed in the U.S. (Saelens, Sallis, Black et al., 2003b). As the name implies, the focus of the scale is on assessing the neighbourhood environments related to walking.
Another example, partly inspired by urban planning and transport re-search, is a conceptual framework of environmental factors that may influ-ence walking and bicycling in local neighbourhoods developed by Pikora, Giles-Corti, Bull et al. (2003). Four separate frameworks were developed: one for recreational walking, one for transport walking, one for recrea-tional bicycling and one for transport bicycling. There were differences between all four frameworks regarding the inclusion and magnitude of influences of environmental factors, emphasizing the importance of study-ing physical activity behaviours specifically. On the basis of this frame-work, an audit tool, called the Systematic Pedestrian and Cycling Envi-ronmental Scan (SPACES), was developed in Australia (Pikora, Bull, Jam-rozik et al., 2002).
The majority of the studies on physical environments have been con-ducted in the U.S. and Australia (cf. Wendel-Vos, Droomers, Kremers et al., 2007). In 2002, however, an international collaboration (the Interna-tional Prevalence Study (IPS)) was initiated with the aim of collecting na-tional data from different countries for international comparisons. In addi-tion to the assessment of physical activity, an environmental module was developed to assess the local neighbourhood, complementing the Interna-tional Physical Activity Questionnaire (IPAQ) (cf. Alexander, Bergman, Hagströmer et al., 2006). Although it contributes to furthering our knowl-edge of environments related to physical activity, the focus on the local neighbourhood, also exemplified by the NEWS and the SPACES, it ex-cludes important aspects of the extended route environment related to active transport. This is one reason for the development of questionnaires that focus on the route environment (de Geus, De Bourdeaudhuji, Jannes et al., 2008; Titze, Stronegger, Janschitz et al., 2007).
In conclusion, the health and physical activity researchers have devel-oped research strategies influenced by the urban planning work, which emphasized walkability. In contrast to the field of urban planning, which mainly acts on an aggregated level, the health field integrated walkability in research strategies mostly on a disaggregated level. The general envi-
LINA WAHLGREN Studies on Bikeability in a Metropolitan Area... I 21
ronmental focus is on the local neighbourhood. The conceptual framework developed by Pikora et al. (2003) emphasized the importance of studying physical activity behaviours specifically, and the IPS emphasized the impor-tance of studying the relation between physical activity and the environ-ment from an international perspective (cf. Alexander et al., 2006). In ad-dition to the research approaches in the fields of urban planning and health, the concept of space syntax was developed in the field of architec-ture as a tool for studying peoples’ movement in relation to buildings and cities (Space Syntax, viewed 23 November 2010, <http://www.spacesyntax.org>). Other, additional research approaches include studying people’s route choices. This can be done by stated prefer-ence measures (e.g. Stinson and Bhat, 2003) or by comparing the shortest route with the actual route (Winters, Teschke, Grant et al., 2010a). All of these research strategies have their strengths and limitations. One limita-tion is that the vast majority of the studies are of cross-sectional design (cf. Wendel-Vos et al., 2007) and therefore no causal relations can be estab-lished. Furthermore, self-selection, i.e. people’s choices and decisions to live in a specific area depending on their preferences, can influence the findings. As mentioned, this research work is in a relatively early stage, exploring a complex field of research. Therefore, new research approaches are needed to further the state of knowledge about the relation between physical activ-ity and the environment.
2.3.1.1 Walkability In relation to bicycling, walking is a rather well studied behaviour in re-search on the relation between physical activity and the environment. One possible explanation is that most studies are conducted in the U.S. and Australia (cf. Wendel-Vos et al., 2007) where walking is more common than bicycling (cf. Pucher and Buehler, 2010). Regarding walking envi-ronments, walkability is a concept currently in focus. Regarding the eco-logical approach, Sallis et al. (2006) refer to walkability as a characteristic of a behavioural setting in relation to active transport and describe walk-ability of neighbourhoods as ‘the ability to walk to nearby destinations such as shops’ (p. 302). As mentioned, walkability originates from research in the field of urban planning on travel behaviours and land use and design (cf. Sallis, 2009). Walkability is frequently referred to as being dependent on levels of density, connectivity, land-use mix and pedestrian-oriented infrastructure. Handy et al. (2002, p. 66) have defined and explained the ‘walkability factors’ as the following: density is defined as the ‘amount of activity in a given area’ or ‘population, employment, or building square footage per unit of area’ and measured, for example, as ‘ratio of commer-

22 I LINA WAHLGREN Studies on Bikeability in a Metropolitan Area...
cial floor space to land area’; street connectivity is defined as the ‘directness and availability of alternative routes through the network’ and measured, for example, as ‘average block length’; and land-use mix is defined as the ‘proximity of different land uses’ and measured, for example, as the ‘dis-tance from house to nearest store’ or the ‘share of total land area for dif-ferent users’. Pedestrian-oriented infrastructure relates to design features, such as pavements. Walkability can be assessed both subjectively (Saelens et al., 2003b) and objectively (e.g. Frank, Schmid, Sallis et al., 2005), and it can be assessed as an index (e.g. Frank et al., 2005). Research supports walkability in general. For example, Saelens et al. (2003a) concluded in a review that higher density, greater connectivity and more land-use mix were associated with higher levels of walking, as well as bicycling. Bicy-cling and walking are, however, quite different behaviours and bikeability is still a relatively new and unexplored concept.
2.3.1.2 Space syntax Space syntax (Space Syntax, 2010), is a ‘theory’ and a set of analysis tech-niques developed to study people’s movement behaviours in relation to buildings and cities, particularly regarding the street network and walking. It originated in the field of architecture, but it has also been used in other areas, for example, in the urban design and transport field. Briefly, space syntax is based on space as an intrinsic aspect of human activity and the assumption that the desired direction of movement is essentially linear. The urban system configuration – the street network – is thought to represent a strong generator of movements, particularly for pedestrians. The smaller the number of direction changes that the street network requires a person to make to reach a certain destination, the more stimulating is the street configuration for movement. Axiality and linearity are regarded as key properties. Axial lines represent the direct lines of sight and access, which have an impact on pedestrians’ movement. The continuity of lines of sight or access can be interrupted by, for example, a hill, a curb or a building. Each axial line represents the horizontal straight line that a person can take before he or she has to make an angular turn to be able to progress. The longest and fewest straight lines are graphed and analysed in a subtle way. The shortest path, the least angle change and fewest turns are, furthermore, taken into consideration. These measures are then combined with observed movements of people. The results disclose a measure of the effect that the urban form, the street network, has on movement (cf. Hillier, Penn, Han-son et al., 1993; Hillier and Vaughan, 2007). Space syntax is primarily used for the assessment of the influence of the street network on walking. Little research has been conducted on bicycling using space syntax, but it
LINA WAHLGREN Studies on Bikeability in a Metropolitan Area... I 23
seems that there is a rising interest in the issue (e.g. Raford, Chiaradia and Gil, 2007). Space syntax includes interesting aspects, but the narrow focus on the street network’s influence on walking, excludes influences of other possible important factors in the route environment.
2.3.1.3 Route choices Ways to assess people’s route choices are stated preference measures and comparisons of the actual route with the shortest route. In contrast to re-vealed preferences, which refer to measures of actual behaviours, stated preferences refer to measures of people’s preferred options or intended behaviours. Stated preference measures can, for example, ask the respon-dent to choose between pairs of choices that have different characteristics, such as a short route without a bicycle path versus a long route with a bicycle path (cf. Pucher, Dill and Handy, 2010). Stated preference meas-ures have been used for the assessment of bicyclists’ preferences, particu-larly route choices (Hunt and Abraham, 2007; Krizek, 2006; Sener, Eluru and Bhat, 2009; Stinson and Bhat, 2003; Tilahun, Levinson and Krizek, 2007; Winters and Teschke, 2010). A specialized form of stated preference measure is the adaptive stated preference (Krizek, 2006; Tilahun et al., 2007), which assess the value people attach to different characteristics: for example, a value on how much people are willing to spend to obtain a particular feature of bicycling facilities. Stated preference studies contribute to the understanding of people’s preferred choices but are limited since they constitute a construction of reality. In real life, people have to make choices in relation to the present environment. In addition, there is a risk that people state what they are expected to state due to, what is proposed in, for example, a policy document and, furthermore, it is often difficult to distinguish the magnitude of importance between different preference rat-ings.
People’s actual route can be compared with the shortest route (Winters et al., 2010a). The shortest route is probably, in a way, a preference, since distance is a central factor for active commuting (e.g. Badland, Schofield and Garrett, 2008). Still, people sometimes take detours. Characteristics of the actual route taken, if characterized by detours, can therefore further our understanding of factors in the route environments which may influ-ence route choices. There might, for instance, be a trade-off between fac-tors that influence route choices. People might, for example, choose a longer route in order to enhance safety. The comparison between people’s actual route and the shortest route is a promising research strategy, al-though it is time-consuming. Furthermore, ‘detour findings’ should be in-terpreted with caution if the trip distance is not taken into consideration

24 I LINA WAHLGREN Studies on Bikeability in a Metropolitan Area...
because the distance and time allocation appear to represent strong con-strains in relation to peoples’ route choices.
2.3.2 A new research strategy The different research approaches used to measure the relationship be-tween physical activity and the environment all have, as mentioned and outlined, their strengths and limitations. The predominant aim has gener-ally been to try to understand how environments may affect levels of physical activity within the population. In general, participants have been separated into physically active or not. And then the characteristics of the two groups’ environmental settings have been compared, usually without matching the behaviour with the environment, i.e. not considering where the actual physical activity is taking place. Another research strategy is to use only people who already have a physical activity behaviour and study the environment within which the behaviour takes place.
Studying bicycle commuters, who already have a ‘bicycle use behaviour’, and the route environment within which the commuting takes place is such an approach. Active bicycle commuting is normally a repetitive behaviour along a specific route. This makes the bicycle commuters very familiar with their route environments and therefore their perceptions of the route envi-ronment can be considered relevant, possibly furthering our understanding of bicycle-commuting route environments’ importance for: (1) the well-being of bicyclists when bicycling; (2) the volume of their bicycling, i.e. trip frequency and trip distance; (3) the maintenance of a bicycle behaviour during a life span; and (4) the decision to cycle. Thus, studying bicycle commuters’ perceptions of their route environment constitutes an impor-tant research area.
2.3.2.1 Bikeability Active bicyclists have a ‘bicycle use behaviour’ and, interestingly, bicycling appears to be performed in environments that vary substantially and irre-spectively of optimal or preferred environmental conditions. It is therefore, from an analytical perspective, useful to differentiate between the choice or decision to bicycle and bicycle usage and the extent to which the route environments are bicycling-friendly or not. In the predominant research regarding walkability, such distinctions are vague or absent (e.g. Frank et al., 2005; Inoue, Ohya, Odagiri et al., 2010). This could possibly result in a rather crude understanding of the possible relationship between walking behaviours and environments. The research on bikeability is at a much earlier stage of development than that on walkability. Hence, it is useful to elaborate on the term bikeability.
LINA WAHLGREN Studies on Bikeability in a Metropolitan Area... I 25
Initially, the term bikeability should be related, if possible, to a specific bicycling purpose. At least three different purposes should be considered: (1) transport; (2) recreation; and (3) exercise, as well as competition. The bicycling purpose may affect the understanding of bikeability. For exam-ple, given that, by definition, transport bicycling always involves a destina-tion, distinct distance requirements are imposed. Yet, distance-decay rela-tions, i.e. people’s willingness to travel different distances to reach destina-tions (cf. Iacono, Krizek and El-Geneidy, 2008), may vary for different types of destinations. Furthermore, the desired qualities of the route envi-ronments during recreational and exercise bicycling might be other – ‘higher or better’ – than for transport bicycling. Thus, it is important to consider specific bicycling purposes in relation to bikeability.
The following aspects could be included as components of possible im-portance for the perception of bikeability in relation to a specific bicycling purpose, namely bicycle commuting to one’s place of work: (1) the means of transport – the bicycle; (2) the level of safety; (3) whether the route envi-ronment stimulates or hinders bicycle commuting; and (4) the route dis-tance and topography. The means of transport – the bicycle – is related to various aspects of the fact that bicycling constitutes an interaction between a person and technology. The needed effort for bicycle transports might affect bikeability. The level of safety relates to traffic safety and other forms of risk, such as crime. Whether the route environment stimulates or hinders active bicycle commuting most probably relates to a complex of environmental variables. The route distance and topography relate to the required time allocation and the acceptable levels of physical effort that bicycle commuting demands. These four aspects of bikeability can be viewed as a chain with four different links. Weakness in one link may be enough to break the chain. The characteristics of the different components might interact as well. For example, a perceived high level of traffic un-safeness may be acceptable if the route distance is sufficiently short. This brief elaboration on bikeability demonstrates the importance of consider-ing different aspects of bikeability, being specific about these aspects, and clearly indicating which aspects are studied. (See Paper II)
2.4 Measures of environments related to physical activity The assessments of environments related to physical activity are mainly based on the three different types of measures: (1) objective measures; (2) observational measures; and (3) perceived measures (for a review, see Brownson, Hoehner, Day et al., 2009).

26 I LINA WAHLGREN Studies on Bikeability in a Metropolitan Area...
2.4.1 Objective measures The objective measures are, in principle, based on Geographic Information Systems (GIS). GIS ‘integrates hardware, software, and data for capturing, managing, analyzing, and displaying all forms of geographically referenced information’ (Geographic Information Systems, viewed 24 November 2010, <http://www.gis.com>). GIS-based measures of the environments are mainly based on existing spatial data sources, for example, addresses. Characteristics such as population density, land-use mix, street patterns, greenness and slopes can be assessed by GIS-based measurements (cf. Brownson et al., 2009).
2.4.2 Observational measures Observational measures are called audit tools. Audit tools are used for systematic observations of the environment (Hoedl, Titze and Oja, 2010; Millington, Ward Thompson, Rowe et al., 2009; Pikora et al., 2002; Troped, Cromley, Fragala et al., 2006). Typically, trained observers collect data considering quantities and qualities of the environment: for example, number of red lights and quality of bicycle paths. A unit of observation normally consists of a street segment (cf. Brownson et al., 2009). There is also another form of observation in which bicyclists, for instance, are counted and the rates are related to characteristics of the bicycle environ-ments (Garrard, Rose and Lo, 2008; Raford et al., 2007). Yet another form of neighbourhood audit is a virtual audit, where internet storage of images is used (Clarke, Ailshire, Melendez et al., 2010).
2.4.3 Perceived measures Perceived measures or self-reports are subjective measures based on struc-tured interviews or questionnaires. Some questionnaires have been devel-oped to subjectively assess the neighbourhood environment as possibly related to physical activity (Alexander et al., 2006; Foster, Hillsdon and Thorogood, 2004; Ogilvie, Mitchell, Mutrie et al., 2008; Saelens et al., 2003b; Spittaels, Foster, Oppert et al., 2009; Table 1). The Neighborhood Environment Walkability Scale (NEWS; Saelens et al., 2003b) or the ab-breviated version (NEWS-A; Cerin, Saelens, Sallis et al., 2006) are proba-bly the most frequently used questionnaires internationally for the assess-ment of environments related to physical activity, particularly to neighbourhood walking environments (cf. Brownson et al., 2009). It origi-nates in the U.S., but has been translated or developed to suit the language of other countries and modified to suit other countries’ environmental attributes. There is, for example, a Japanese version (NEWS-AJ; cf. Inoue
LINA WAHLGREN Studies on Bikeability in a Metropolitan Area... I 27
et al., 2010) and an Australian version (NEWS-AU; Cerin, Leslie, Owen et al., 2008; Leslie, Saelens, Frank et al., 2005).
Self-reports have both advantages and disadvantages. For example, they are inexpensive, allowing large sample sizes and place a low burden on the participants. There are, on the other hand, numerous potential biases re-lated to self-reports (cf. Streiner and Norman, 2008). These biases are mainly due to problems with accuracy: for example, recall biases and social desirability. GIS-based measures as well as audit tools are promising due to their being more or less objective. These measures are, however, expensive and time-consuming. Furthermore, as already mentioned, perceptions of the environments are likely to influence people’s physical activity behav-iours (cf. Sallis et al., 2006). Studies have, however, shown poor agreement between objective and perceived measures of environments (Ball, Jeffrey, Crawford et al., 2008; Hoehner, Brennan Ramirez, Elliott et al., 2005; McGinn, Evenson, Herring et al., 2007). Therefore, in order to further our understanding and knowledge of the possible relationships between physi-cal activity and the environments, self-reports assessing people’s percep-tions of environments in relation to physical activity are important.

28
I L
INA
WA
HL
GR
EN St
udie
s on
Bik
eabi
lity
in a
Met
ropo
litan
Are
a...
Tab
le 1
. Exa
mpl
es o
f qu
esti
onna
ires
on
perc
epti
ons
of e
nvir
onm
ents
rel
ated
to
phys
ical
act
ivit
y.
Que
stio
nnai
reR
elat
edph
ysic
al a
ctiv
ityM
easu
red
area
Que
stio
ns o
r ite
ms a
nd m
easu
red
aspe
cts,
con
stru
cts,
subs
cale
s or
them
esR
espo
nse
scal
e(c
omm
on ty
pe)
IPAQ
env
iron
men
tal m
odul
e*A
lexa
nder
et a
l.,20
06W
alki
ng, w
alki
ng
and
bicy
clin
g,
bicy
clin
g
Nei
ghbo
urho
od‘th
e ar
eaA
LLar
ound
you
r ho
me
that
you
cou
ld w
alk
to
in 1
0–15
min
utes
’
17 q
uest
ions
(lon
g ve
rsio
n)R
esid
entia
l den
sity
, Acc
ess t
o de
stin
atio
ns, N
eigh
bour
hood
’s in
fra-
stru
ctur
e, A
esth
etic
qua
litie
s, So
cial
env
ironm
ents
, Stre
et c
onne
ctiv
ity,
Nei
ghbo
urho
od sa
fety
, Hou
seho
ld m
otor
veh
icle
s
4-po
int
A4L
Fost
er e
t al.,
2004
Wal
king
Loca
l nei
ghbo
urho
od,
neig
hbou
rhoo
d9
ques
tions
Safe
ty, C
onve
nien
ce, A
esth
etic
s, Tr
affic
, Spo
rt fa
cilit
ies,
Soci
al s
uppo
rt5-
poin
t
Traf
fic a
nd h
ealth
in G
lasg
ow
Que
stio
nnai
re (t
he p
art a
bout
lo
cal a
rea)
*O
gilv
ie e
t al.,
2008
Wal
king
, bic
yclin
gLo
cal a
rea
‘eve
ryw
here
with
in a
ten-
min
ute
wal
k (a
bout
half
am
ile) f
rom
you
r hom
e’
14 it
ems
Aes
thet
ics,
Gre
en sp
ace,
Acc
ess t
o am
eniti
es, C
onve
nien
ce o
f rou
tes,
Traf
fic, R
oad
Safe
ty, P
erso
nal S
afet
y
5-po
int
NEW
S*Sa
elen
s et a
l.,20
03b
Wal
king
, (w
alki
ng
and
bicy
clin
g)N
eigh
bour
hood
83 it
ems (
long
ver
sion
)R
esid
entia
l den
sity
, Lan
d us
e m
ix-d
iver
sity
, Lan
d us
e m
ix-a
cces
s, St
reet
con
nect
ivity
, Wal
king
/cyc
ling
faci
litie
s, A
esth
etic
s, Tr
affic
sa
fety
, Crim
e sa
fety
4-po
int
‘ALP
HA’
*Sp
ittae
ls et
al.,
2009
Wal
king
, wal
king
an
d bi
cycl
ing,
bi
cycl
ing
Nei
ghbo
urho
od‘th
e ar
ea A
LLar
ound
you
r ho
me
that
you
cou
ld w
alk
to
in 1
0–15
min
utes
–ap
prox
1
mile
or 1
.5 k
m’
49 it
ems (
long
ver
sion
)Ty
pes o
f res
iden
ces i
n yo
ur n
eigh
bour
hood
, Dist
ance
to lo
cal f
acili
ties,
Wal
king
or c
ycle
infra
stru
ctur
e in
you
r nei
ghbo
urho
od, M
aint
enan
ce o
f in
frast
ruct
ure
in y
our n
eigh
bour
hood
, Nei
ghbo
urho
od sa
fety
, How
pl
easa
nt is
you
r nei
ghbo
urho
od, C
yclin
g an
d w
alki
ng n
etw
ork,
Hom
e en
viro
nmen
t, W
orkp
lace
or s
tudy
env
ironm
ent
4-po
int
C4T
Titz
e et
al.,
2007
Bic
yclin
gR
oute
env
ironm
ent
(cyc
ling
path
toth
e un
iver
-sit
y)
44 it
ems
Func
tiona
lity,
Saf
ety,
Aes
thet
ics,
Des
tinat
ion,
Hom
e ne
ighb
ourh
ood,
‘S
ocia
l env
ironm
ent’,
Adv
anta
ges o
f cyc
ling,
Disa
dvan
tage
s of c
yclin
g
4-po
int
ACRE
S
(See
Pap
er I)
Wal
king
Bic
yclin
g(s
epar
ate
ques
tion-
naire
s)
Rou
te e
nviro
nmen
t(a
ctiv
e co
mm
utin
gto
the
plac
e of
wor
k or
stud
y)
15 it
ems
for w
alki
ng/1
8 ite
ms
for b
icyc
ling
Phys
ical
env
ironm
ent (
Bic
ycle
pat
hs, G
reen
ery,
Ugl
y or
bea
utifu
l, C
ours
e of
the
rout
e, H
illin
ess,
Red
ligh
ts, S
hort
or lo
ng),
Traf
fic
envi
ronm
ent (
Exha
ust f
umes
, Noi
se, F
low
of m
otor
veh
icle
s, Sp
eeds
of
mot
or v
ehic
les,
Spee
ds o
f bic
yclis
ts, C
onge
stio
n: a
ll ty
pes o
f veh
icle
s, C
onge
stio
n: b
icyc
lists
/ped
estri
ans)
, Soc
ial e
nviro
nmen
t (C
onfli
cts)
, On
the
who
le, H
inde
rs o
r stim
ulat
es, T
raffi
c: u
nsaf
e or
safe
(sin
gle
item
s)
15-p
oint
IPA
Q =
Inte
rnat
iona
l Phy
sica
l Act
ivity
Que
stio
nnai
re, A
4L =
Act
ive
for L
ife m
easu
re (f
or q
uest
ionn
aire
nam
e, se
e Sp
ittae
ls et
al.,
2009
), N
EWS
= N
eigh
borh
ood
Envi
ronm
ent W
alka
bilit
y Sc
ale,
AH
PHA
= In
stru
men
ts fo
r Ass
essi
ng L
evel
s of P
hysi
cal A
ctiv
ity a
nd F
itnes
s, C
4T =
Cyc
ling
for T
rans
port
mea
sure
(for
que
stio
nnai
re n
ame,
see
Spitt
aels
et a
l.,20
09),
and
AC
RES
=
Act
ive
Com
mut
ing
Rou
te E
nviro
nmen
t Sca
le.*
IPA
Q e
nviro
nmen
tal m
odul
e, v
iew
ed 4
May
201
1, <
http
://w
ww
.drja
mes
salli
s.sds
u.ed
u/m
easu
res.
htm
l>,T
raffi
c an
d he
alth
in G
lasg
ow Q
ues-
tionn
aire
,vie
wed
7 N
ovem
ber 2
008,
<ht
tp://
ww
w.b
iom
edce
ntra
l.com
/con
tent
/sup
plem
enta
ry/1
479-
5868
-5-3
2-S1
>, N
EWS,
vie
wed
24
Nov
embe
r 201
0,<h
ttp://
ww
w.d
rjam
essa
llis.s
dsu.
edu/
Doc
umen
ts/N
EWS.
pdf>
,and
‘ALP
HA
’, vi
ewed
24
Aug
ust 2
008
, <ht
tp://
ww
w.b
iom
edce
ntra
l.com
/con
tent
/sup
plem
enta
ry/1
479-
5868
-6-3
9-S3
>
LINA WAHLGREN Studies on Bikeability in a Metropolitan Area... I 29
Commuting route
2.4.3.1 The measured area A previously mentioned research strategy was to study the local neighbourhood and the majority of questionnaires on perceptions of envi-ronments related to physical activity have focused on this local environ-ment. The measured area is often defined as the area within a 10 to 15-minute walk from your home or similar definitions (e.g. Alexander et al., 2006; Table 1). Active commuting, particularly bicycle commuting to the workplace, however, often involves an extended environment compared to the local neighbourhood (Hu, Pekkarinen, Hänninen et al., 2002; Stigell and Schantz, 2006; Stigell and Schantz, 2011; Figure 2). Therefore, in 2005, Dr Peter Schantz and Erik Stigell, members of the Research Unit for Movement, Health and Environment, GIH – The Swedish School of Sport and Health Sciences, developed a scale named the Active Commuting Route Environment Scale (ACRES). The ACRES was developed for the assessment of bicyclists’ and pedestrians’ perceptions of their route envi-ronments. Interestingly, at about the same period of time, Titze et al. (2007) also developed a self-report questionnaire that considers bicycling and route environments. The two questionnaires were developed independ-ently. In addition, de Geus et al. (2008) have developed a questionnaire which assesses bicycling for transport and traffic variables on the road to work, based on the NEWS. Thus, there are a few questionnaires that con-sider the route environment. The majority are still limited to assessing the neighbourhood area.
Figure 2. The neighbourhood and the commuting route.
2.4.3.2 Items and response scales The questionnaires on perceptions of environments related to physical activity assess different aspects of the environments and the related physi-
Neighbourhood
Home
Place of work
28 I LINA WAHLGREN Studies on Bikeability in a Metropolitan Area...
Table 1. Examples of questionnaires on perceptions of environments related to physical activity. Questionnaire Related
physical activityMeasured area Questions or items and measured aspects, constructs, subscales or
themesResponse scale(common type)
IPAQ environmental module*Alexander et al., 2006
Walking, walking and bicycling, bicycling
Neighbourhood‘the area ALL around your home that you could walk to in 10–15 minutes’
17 questions (long version)Residential density, Access to destinations, Neighbourhood’s infra-structure, Aesthetic qualities, Social environments, Street connectivity, Neighbourhood safety, Household motor vehicles
4-point
A4LFoster et al., 2004
Walking Local neighbourhood, neighbourhood
9 questionsSafety, Convenience, Aesthetics, Traffic, Sport facilities, Social support
5-point
Traffic and health in Glasgow Questionnaire (the part about local area)*Ogilvie et al., 2008
Walking, bicycling Local area‘everywhere within a ten-minute walk (about half amile) from your home’
14 itemsAesthetics, Green space, Access to amenities, Convenience of routes, Traffic, Road Safety, Personal Safety
5-point
NEWS*Saelens et al., 2003b
Walking, (walking and bicycling)
Neighbourhood 83 items (long version)Residential density, Land use mix-diversity, Land use mix-access, Street connectivity, Walking/cycling facilities, Aesthetics, Traffic safety, Crime safety
4-point
‘ALPHA’*Spittaels et al., 2009
Walking, walking and bicycling, bicycling
Neighbourhood‘the area ALL around your home that you could walk to in 10–15 minutes – approx 1 mile or 1.5 km’
49 items (long version)Types of residences in your neighbourhood, Distance to local facilities, Walking or cycle infrastructure in your neighbourhood, Maintenance of infrastructure in your neighbourhood, Neighbourhood safety, How pleasant is your neighbourhood, Cycling and walking network, Home environment, Workplace or study environment
4-point
C4TTitze et al., 2007
Bicycling Route environment(cycling path to the univer-sity)
44 itemsFunctionality, Safety, Aesthetics, Destination, Home neighbourhood, ‘Social environment’, Advantages of cycling, Disadvantages of cycling
4-point
ACRES
(See Paper I)
WalkingBicycling(separate question-naires)
Route environment(active commuting to the place of work or study)
15 items for walking/18 items for bicyclingPhysical environment (Bicycle paths, Greenery, Ugly or beautiful, Course of the route, Hilliness, Red lights, Short or long), Traffic environment (Exhaust fumes, Noise, Flow of motor vehicles, Speeds of motor vehicles, Speeds of bicyclists, Congestion: all types of vehicles, Congestion: bicyclists/pedestrians), Social environment (Conflicts), On the whole, Hinders or stimulates, Traffic: unsafe or safe (single items)
15-point
IPAQ = International Physical Activity Questionnaire, A4L = Active for Life measure (for questionnaire name, see Spittaels et al., 2009), NEWS = Neighborhood Environment Walkability Scale, AHPHA = Instruments for Assessing Levels of Physical Activity and Fitness, C4T = Cycling for Transport measure (for questionnaire name, see Spittaels et al., 2009), and ACRES = Active Commuting Route Environment Scale. *IPAQ environmental module, viewed 4 May 2011, <http://www.drjamessallis.sdsu.edu/measures.html>, Traffic and health in Glasgow Ques-tionnaire, viewed 7 November 2008, <http://www.biomedcentral.com/content/supplementary/1479-5868-5-32-S1.pdf>, NEWS, viewed 24 November 2010,<http://www.drjamessallis.sdsu.edu/Documents/NEWS.pdf>, and ‘ALPHA’, viewed 24 August 2008 , <http://www.biomedcentral.com/content/supplementary/1479-5868-6-39-S3.pdf>

30 I LINA WAHLGREN Studies on Bikeability in a Metropolitan Area...
cal activity behaviour and include different amounts of items (Table 1). Although both walking and bicycling are the physical activity behaviours in question, walking is the dominant one. Common environmental themes included in questionnaires are: housing types; local facilities; access to ser-vices; street connectivity; places for walking and bicycling; neighbourhood surroundings or aesthetics; safety from traffic; and safety from crime (Spit-taels et al., 2009). Some of the questionnaires have a long and a short ver-sion (e.g. the IPAQ environmental module and the NEWS). In the NEWS short version: NEWS-A (Cerin et al., 2006), the number of items has been reduced using factor analysis to combine items. Also in other cases, large numbers of items are often reduced and presented as composite compo-nents or factors (e.g. de Geus et al., 2008; Titze et al., 2007; Titze, Stro-negger, Janschitz et al., 2008). Using composite components or factors can have benefits of clarity, but can also limit the transparency and compara-bility (cf. Brownson et al., 2009). The questionnaires’ response scales are predominantly of 4- or 5-point Likert scale types (Table 1; for an example of an item from the NEWS, see Figure 3). In contrast, the ACRES has 15-point response scales (for an example of an item from the ACRES, see Fig-ure 4). Depending on the amount of response scale points, different statis-tical analyses can be used. Advantages of using 15-point response scales are that they in principle allow finer distinctions and correlation assessments of relations between and within predictor and outcome variables. Although questionnaires on perceptions of environments related to physical activity are similar in some ways, they assess different aspects in different ways, which, among other things, makes comparability difficult and different response scale points allow different statistical analyses. There are trees along the streets in my neighborhood.
1 2 3 4stronglydisagree
somewhatdisagree
somewhatagree
stronglyagree
Figure 3. Example of an item from the Neighborhood Environment Walkability Scale (NEWS) (Sallis J.F., San Diego State University, viewed 24 November 2010, <http://www.drjamessallis.sdsu.edu/Documents/NEWS.pdf>). The respondents are asked to circle the answer that best applies to their neighbourhood.
LINA WAHLGREN Studies on Bikeability in a Metropolitan Area... I 31
How do you find the availability of greenery (natural areas, parks, planted items, trees) along yourroute?
Inner urban: Verylow
1---2---3---4---5---6---7---8---9---10---11---12---13---14---15↑
Veryhigh
neither lownor high
Suburban: Verylow
1---2---3---4---5---6---7---8---9---10---11---12---13---14---15↑
Veryhigh
neither lownor high
Figure 4. Example of an item from the Active Commuting Route Environment Scale (ACRES). The respondents are asked to recall and rate – circle – their overall experience of their self-chosen route environments based on their active commuting to their place of work or study during the previous two weeks. All items have two identical parallel response lines. One line refers to the inner urban area and the other to the suburban as well as rural area. If the respondents cycle or walk in both environments, they are asked to mark both lines. If the respondents, for instance, first cycle in the southern suburban area, then cross into the inner urban area and finish their route in the northern suburban area, they are asked to give an average rating for both suburban areas of the route. In the original ACRES, both areas refer to clearly delimited areas in Greater Stockholm.
2.4.3.3 Validity and reliability Before using measures, it is important to assess and establish validity and reliability. Validity assessments of questionnaires on perceptions of envi-ronments related to physical activity can be challenging and complicated. Sometimes no objective data exist or are difficult to collect for comparison. Moreover, perceptions are individually dependent and subjective. It could be argued that perceptions of the environment represent the reality, par-ticularly for attributes like aesthetics. In a review of assessing the built environment for physical activity, Brownson et al. (2009) state that the following three types of validity are most relevant for the assessment of perceived environments: (1) content validity; (2) construct validity; and (3) criterion-related validity. Content validity refers to the truthfulness of an instrument’s content based on a logical interpretation. Construct validity refers to the accumulated theoretical and statistical evidence of the ex-pected ‘behaviour’ of an instrument. Criterion-related validity refers to an instrument’s ability to predict a known valid criterion (Morrow, 2002). Validity assessments of questionnaires on perceptions of environments related to physical activity are rare. Some can be found on assessments of

32 I LINA WAHLGREN Studies on Bikeability in a Metropolitan Area...
the validity of the NEWS (Adams, Ryan, Kerr et al., 2009; Cerin et al., 2006; Cerin et al., 2008; Cerin, Conway, Saelens et al., 2009; De Bour-deaudhuij, Sallis and Saelens, 2003; Saelens et al., 2003b). Different types of validity, such as concurrent (Adams et al., 2009), factorial (Cerin et al., 2006; Cerin et al., 2008; Cerin et al., 2009) and aspects of criterion-related validity (Cerin et al., 2006; Cerin et al., 2008; Saelens et al., 2003b) are considered. In general, the validity is supported.
Reliability can be assessed in different ways. Test-retest reproducibility and possibly internal consistency measures (cf. Brownson et al., 2009) are suitable for reliability assessments of questionnaires on perceptions of envi-ronments related to physical activity. Internal consistency can be assessed by clustering variables using factor analysis and thereafter using inter-item correlations (e.g. Ogilive et al., 2008). Test-retest reproducibility assess-ments are common (Alexander et al., 2006; Brownson, Chang, Eyler et al., 2004; De Bourdeaudhuij et al., 2003, Evenson and McGinn, 2005; For-syth, Oakes and Schmitz, 2009; Kondo, Lee, Kawakubo et al., 2009; Leslie et al., 2005; Ogilive et al., 2008; Oyeyemi, Adegoke, Oyeyemi et al., 2008; Saelens et al., 2003b; Sallis, Bowles, Bauman et al., 2009; Table 2), and measures such as percent agreement and different correlations are used. Intraclass correlation coefficients (ICC) are frequently used. The assessed test-retest reproducibility is generally reasonable.
LINA WAHLGREN Studies on Bikeability in a Metropolitan Area... I 33
Table 2. Examples of reliability assessments of questionnaires on perceptions of
environments related to physical activity.
Questionnaire and study Design Reliability measure
Result
IPAQ environmental moduleAlexander et al., 2006
Test-retest % agreement 55–93%♂: 51–90%♀: 51–96%
ICC 0.36–0.98♂: 0.41–0.96 ♀: 0.27–0.98
IPAQ environmental moduleOyeyemi et al., 2008
Test-retest ICC 0.43–0.91♂: 0.11–0.96 ♀: 0.23–0.87
IPAQ environmental module(short version: 7 items)Sallis et al., 2009
Test-retest ICC 0.64–0.84
NEWSDe Bourdeaudhuij et al., 2003
Test-retest ICC 0.40–0.97 (predomi-nantly composites)
Intrarater ICC 0.80–0.90NEWSBrownson et al., 2004
Test-retest ICC 0.18–0.890.41–0.93 (subscales)
NEWSForsyth et al., 2009
Test-retest Pearsons’s r 0.47–0.91 (both single and scales)
Spearman’s rho 0.51–0.89 (both single and scales)
NEWSSaelens et al., 2003b
Test-retest ICC 0.58–0.80 (subscales)
NEWS-A (abbreviated version)Kondo et al. 2009
Test-retest Pearson’s r 0.42–0.95 (probably subscales)
Internal consistency
Cronbach’s α 0.57–0.94 (probably subscales)
NEWS-AU (Australian version)Leslie et al., 2005
Test-retest ICC 0.26–0.910.62–0.88 (subscales)
‘Environmental factors’(partly based on NEWS)Evenson et al., 2005
Test-retest ICC 0.16–0.87♂: 0.14–0.92♀: 0.07–0.93
Traffic and health in Glasgow Questionnaire(the part about local area)Ogilvie et al., 2008
Test-retest % agreement 40–66%Pearson’s r 0.33–0.70
Subscales: 0.57–0.75Overall: 0.73
Spearman’s rho 0.38–0.66Subscales: 0.59–0.76Overall: 0.73
ICC 0.34–0.70Subscales: 0.57–0.75Overall: 0.73
Cohen’s κ 0.18–0.50 (original)0.24–0.59 (collapsed)
Internal consistency
Cronbach’s α 0.72
IPAQ = International Physical Activity Questionnaire, NEWS = Neighborhood Environment Walk-ability Scale, and ICC = Intraclass Correlation Coefficient. When interpreting the ICC results the following ratings suggested by Landis and Koch (1977) can be used: < 0.00, ‘poor’; 0.00–0.20, ‘slight’; 0.21–0.40, ‘fair’; 0.41–0.60, ‘moderate’; 0.61–0.80, ‘substantial’ and 0.81–1.00 ‘almost perfect’.

34 I LINA WAHLGREN Studies on Bikeability in a Metropolitan Area...
2.5 Environments related to physical activity: reviews and overviews An increased interest in studying the environments related to physical ac-tivity was seen around 2000 and an increasing numbers of studies on the possible relation between physical activity and the environment have been published (cf. Gebel, Bauman and Petticrew, 2007; Sallis, 2009). Conse-quently, several reviews and overviews have been published that deal with quantitative studies of adults’ environments in relation to physical activity (Badland and Schofield, 2005a; Badland and Schofield, 2005b; Duncan, Spence and Mummery, 2005; Foster and Hillsdon, 2004; Frank and Engelke, 2001; Handy et al., 2002; Heath, Brownson, Kruger et al., 2006; Heinen, van Wee and Maat, 2010; Humpel, Owen and Leslie, 2002; Lee and Moudon, 2004; McCormack, Giles-Corti, Lange et al., 2004; Ogilvie, Egan, Hamilton et al., 2004; Ogilvie, Foster, Rothnie et al., 2007; Owen, Humple, Leslie et al., 2004; Panter and Jones, 2010; Pucher et al., 2010; Saelens et al., 2003a; Saelens and Handy, 2008; Sallis, Bauman and Pratt, 1998; Sallis and Owen, 1999; Sallis, Frank, Saelens et al., 2004; Trost et al., 2002; Wendel-Vos et al., 2007; Yang, Sahlqvist, McMinn et al., 2010). The aims of these reviews and overviews are diverse. Some focus on studies from the field of health (Lee and Moudon, 2004; Owen et al., 2004) and others on studies from the urban planning field (Handy et al., 2002; Sael-ens et al., 2003a). Some focus broadly on physical activity (e.g. Sallis and Owen, 1999; Trost et al., 2002) and others on active transport (e.g. Bad-land and Schofield, 2005b; Heinen et al., 2010; Panter and Jones, 2010), walking and bicycling (e.g. Ogilvie et al., 2004; Saelens et al., 2003a), walking (e.g. Ogilvie et al., 2007; Owen et al., 2004) or bicycling (e.g. Heinen et al., 2010; Pucher et al., 2010; Yang et al., 2010). Some focus on findings from intervention studies (e.g. Foster and Hillsdon, 2004; Ogilvie et al., 2004; Ogilvie et al., 2007; Yang et al. 2010) or on correlates of physical activity behaviours (e.g. Heinen et al., 2010; Trost et al., 2002), where the environment is seen as one factor among others. Others focus on separated environments, for example, the physical environment and the socio-cultural environment (e.g. Wendel-Vos et al., 2007), a specific level of the environment, for example, the policy level (e.g. Heath et al., 2006), predefined environmental categories or characteristics (e.g. Humpel et al., 2002; McCormack et al., 2004) or separation of the environment charac-teristics based on the assessment: objective or perceived (e.g. McCormack et al., 2004). In conclusion, several reviews or overviews have been pub-lished dealing with environments related to physical activity. They are, however, versatile, include different aspects of both physical activity behav-
LINA WAHLGREN Studies on Bikeability in a Metropolitan Area... I 35
iours and environments. There is no review that solely considers bicycle commuting and the related route environment.
It is difficult to draw general conclusions from these reviews and over-views for several reasons. There are considerable methodological variations among them (for a review of reviews, see Gebel et al., 2007) and the ma-jority are narratives (for exceptions, see, e.g. Ogilvie et al., 2004; Ogilvie et al., 2007; Yang et al., 2010) where no syntheses are presented. This could be due to difficulties with comparability since the research field is complex and in a relatively early stage. A large number of environmental factors are addressed (cf. Moudon and Lee, 2003; Wendel-Vos et al., 2007) and measured in different ways (cf. Brownson et al., 2009) and at various lev-els: aggregated as well as disaggregated. As mentioned previously, there is a lack of specificity both regarding the physical activity behaviour and the environment (cf. Giles-Corti et al., 2005) and the spatial matching be-tween, for example, data on the built environments and data on travel behaviours (cf. Handy et al., 2002). Furthermore, the majority of the stud-ies were conducted in U.S. and Australian urban areas (cf. Wendel-Vos et al., 2007), which are quite different from urban areas in Europe. Finally, due to the difficulties related to studying the field (cf. Ogilvie, Mitchell, Mutrie et al., 2006), a vast majority of the studies are, as mentioned previ-ously, of cross-sectional design (cf. Wendel-Vos et al., 2007). Therefore, no causal relations can be established. Also as mentioned previously, self-selection, that is people’s choices and decisions to live in a specific area depending on their preferences, can influence the findings. Furthermore, a substitution of physical activity behaviours can influence the findings. An example is that a person who used to swim for exercise starts to bicycle commute instead, which results in increased active transport, but not in an increased level of physical activity. Nevertheless, in spite of the methodo-logical variations among reviews, Gebel et al. (2007) concluded in a review of reviews that ‘physical activity was consistently reported to be associated with mixed land use and residential density, street connectivity and physi-cal infrastructure such as sidewalks. Less-consistent associations with physical activity were reported for cycle and pedestrian safety, safe well-lit areas, aesthetic features’ (p. 364). The reviews and overviews of adults’ environments related to physical activity indicate that there are some limi-tations related to the field. Consequently, more research is needed.
2.5.1 The route environment related to bicycling The route environment, from the immediate surroundings to larger areas around a person, could be an important factor for bicycling and walking, ‘because people on foot or on bicycle move relatively slowly through the

36 I LINA WAHLGREN Studies on Bikeability in a Metropolitan Area...
environment […] they are afforded an intimate experience of the environ-ment around them that affects where and how long they choose to walk or bike’ (Moudon and Lee 2003, p. 23). The slow speeds allow people to become aware of and observe the environment, such as plantings and the architecture of buildings. The desired qualities of the route environments might differ with the purpose of the physical activity. Recreational bicy-clists might, for example, want other – ‘higher or better’ – qualities of the route environment than transport bicyclists. Thus, it is important to be specific when studying these issues. The environment related to transport bicycling can in principle be separated into: the origin, the destination and the route (cf. Moudon and Lee, 2003). Only a few researchers have taken this separation into consideration. However, Winters, Brauer, Setton et al. (2010b) used the separation and found that characteristics of the routes were, in general, more important than the characteristics of the origins and destinations for the likelihood of bicycling. Furthermore, they advocated the importance of addressing the relevant spatial area when studying the relation between physical activity and environments. Thus, studying bicy-cle-commuting route environments is in accord with their suggestion.
The route environment related to bicycling may be separated into: (1) bicycle-related infrastructure; (2) safety; (3) road users; and (4) the ‘natu-ral’ environment and aesthetics. The following is an overview, focusing on findings, rather than a critical review.
2.5.1.1 Bicycle-related infrastructure An often suggested investment with the purpose of increasing bicycling is bicycle-related infrastructure. Bicycle-related infrastructure, particularly the infrastructure that aims at separating bicyclists from motor vehicles, is a rather well studied area. Findings from a stated preference study demon-strated that bicycle commuters in general prefer routes with low volumes of motor traffic and routes separated from motor traffic (Stinson and Bhat, 2003). There is a wide variety in types of bicycle-related infrastructure between and within countries and cities. Some examples are: on-road bicy-cle lanes, off-street paths and bike boxes (for a review, see Pucher et al., 2010). The type and characteristics of the bicycle infrastructure matter for bicyclists (for an overview, see Heinen et al., 2010). For example, in an adaptive stated preference study, Tilahun et al. (2007) found a willingness ‘to travel up to twenty minutes more to switch from an unmarked on-road facility with side parking to an off-road bicycle trail’ (p. 287). Krizek (2006) also used an adaptive stated preference method to study preferences for different bicycle infrastructures. His findings indicated that desirable characteristics, such as being off-road, having a designed bicycle lane, and
LINA WAHLGREN Studies on Bikeability in a Metropolitan Area... I 37
having no parking, increased the likelihood of choosing a more time-consuming route. Furthermore, off-street paths were generally the most preferred routes, followed by separated paths, residential roads, and major and rural roads, ranked by current and potential bicyclists (Winters and Teschke, 2010). In addition, within each route type, bicyclists preferred routes with bicycling facilities, such as traffic calming features and routes without parking. Moreover, Winters and Teschke (2010) compared current types of infrastructure used by bicyclists with preferred routes and found a discrepancy. Based on this finding, they stated that the current road net-work could be adjusted to be more supportive of bicycling.
There seems to be a positive relation between levels of bicycling and bi-cycle paths (for an overview, see Heinen et al., 2010). Objectively meas-ured presence of bicycle lanes was, however, not found to be associated with the likelihood of bicycling. Perceived presence of recreational facili-ties, i.e. bicycle lanes and trails and, objectively measured, having proxi-mate trails, were, on the other hand, positively related to the likelihood of bicycling (Moudon, Lee, Cheadle et al., 2005). In addition, closeness to on-street bicycling facilities was found to predict bicycle use (Krizek and John-son, 2006). Studying the actual routes compared to the shortest routes, Winters et al. (2010a) noted that bicyclists spend less time on arterial roads and more time on local roads, off-street paths and designed bicycle routes. Furthermore, Titze et al. (2008) found that bicycling was positively associ-ated with the perceived presence of ‘bike lane connectivity’. Bike lane con-nectivity was a composite variable including: presence of bicycle tracks and the possibility to take shortcuts as a bicyclist. Thus, connectivity could be related to the bicycle-related infrastructure. In conclusion, it seems that different aspects of bicycle-related infrastructure, such as bicycle paths, could influence bicycling.
Associated with bicycle-related infrastructure are car parking facilities and parked cars. Parked cars can affect bicyclists’ accessibility, convenience and safety. Stated preference studies indicated that bicycle commuters avoid routes where parking is permitted (Stinson and Bhat, 2003) and that bicyclists prefer no parking along the route (Sener et al., 2009). These find-ings could be regarded as intuitive, since car parking can interfere with the bicyclists’ movement space, reduce sight distance and consequently be a safety threat causing injuries.
Another aspect associated with bicycle-related infrastructure is the con-tinuity of the movement of the bicycle trip, which could influence bicy-cling. Traffic controls or traffic calming, such as stops signs, traffic lights and speed humps, could probably influence the bicyclist both negatively and positively. Negatively, in terms of interrupting the continuity, and

38 I LINA WAHLGREN Studies on Bikeability in a Metropolitan Area...
positively, in terms of convenience and safety, since the speed of motor traffic is affected (cf. Heinen et al., 2010). Stated preference studies indi-cated that bicyclists and bicycle commuters preferred continuous bicycle facilities and routes with fewer traffic controls and major cross streets (Se-ner et al., 2009) and have a tendency to avoid routes with lots of these attributes (Stinson and Bhat, 2003). Winters et al. (2010a) studied bicy-clists’ actual routes, compared to the shortest routes, and found that the actual routes were somewhat longer. One suggested possibility of the cho-sen detours was that the actual routes hade more bicycle facilities including traffic calming features, bicycle stencils and signage than the shortest routes. Traffic controls or traffic calming are ambiguous aspects of bicy-cling, probably influencing bicycling both negatively, in terms of inter-rupted continuity, and positively, in terms of safety.
The surface quality and maintenance of bicycle-related infrastructure are yet other aspects that could influence bicycling (cf. Heinen et al., 2010; Pucher et al., 2010). For example, glass or debris on the route and icy or snowy routes were ranked among the strongest perceived deterrents of bicycling (Winters, Davidson, Kao et al., 2010c). In conclusion, bicyclists’ concerns with infrastructure seem to mainly relate to safety issues, arising primarily from contact with motor vehicles. Other important aspects of the bicycle-related infrastructure might be accessibility, convenience and conti-nuity.
2.5.1.2 Safety Often-mentioned reasons not to bicycle are safety concerns (cf. Heinen et al., 2010; Parkin, Ryley and Jones, 2007). Pucher et al. (2010) concluded that the most important message, from summarizing studies of cities im-plementing multiple interventions, was, that ‘some cities, even very large cities, have dramatically raised bicycling levels while also improving bicy-cling safety’ (p. S117). Interestingly, an increase in the numbers of people walking and bicycling seems to increase the safety of pedestrians and bicy-clists (Jacobsen, 2003). Transport bicyclists’ safety concerns predominantly seem to be related to traffic safety and motor traffic and traffic injuries. The speeds of the bicyclists and the closeness to motor traffic probably make the safety concerns a bigger issue for bicyclists than for pedestrians. Lower speeds and levels of motor traffic are assumed to have a positive effect on bicycling (cf. Heinen et al., 2010), and there seems to be an asso-ciation between bicycling infrastructure and perceptions of safety (Xing, Handy and Mokhtarian, 2010). Unexpectedly, Titze et al. (2007) found that perceptions of a high traffic safety along the paths were associated with less likely regular bicycling. Traffic safety was a composite variable
LINA WAHLGREN Studies on Bikeability in a Metropolitan Area... I 39
including: ‘availability of bike lanes’, ‘little traffic’, ‘danger of cycling’, ‘busy crossings’, ‘presence of tramway lines’ and ‘conflicts with car-drivers’. One stated speculative explanation for this finding was that regu-lar bicyclists are more experienced and therefore more aware of the traffic dangers. Besides, safety concerns related to traffic, safety can also be re-lated to crime, physical activity injuries, pollution and sun exposure. Safety can furthermore be both objective and perceived, and both objective as-pects and people’s perceptions of the environment are likely to influence behaviours (cf. Sallis et al., 2006). It is fairly apparent that safety concerns could influence transport bicycling. For example, if people think that the traffic environment is unsafe, although it is in fact safe, their perceptions could result in a non-bicycling behaviour. Thus, it is important to study bicycle commuters’ perceptions of safety.
2.5.1.3 Road users Bicycling often involves interaction with other road users, such as motor vehicles, pedestrians and other bicyclists. Titze et al. (2007) found no asso-ciation between perceptions of conflicts with non-motor road users – pe-destrians and bicyclists – and bicyclists. Thus, motor vehicles appear to constitute a substantial concern for bicyclists, probably related, as previ-ously mentioned, to safety issues. In general, preferences for routes with a lower traffic volume and speed limits were expressed by bicyclists (Sener et al., 2009). Furthermore, in a study of perceptions of motivators and deter-rents of bicycling, ‘streets with a lot of car, bus and truck traffic’, ‘vehicles driving faster than 50 km/hr’, ‘risk of injury from car-bike collisions’, and ‘risk from motorists who do not know how to drive safely near bicycles’ were among the top deterrents (Winters et al., 2010c). Also associated with other road users and safety concerns are bicycle-related infrastructure. Findings from a stated preference study suggested a general feeling among bicyclists that cycling on roads with mixed traffic was less attractive than cycling on a designed bicycle lane (Hunt and Abraham, 2007). Other road users could also influence congestion, noise and pollution levels. Using a money-based trade-off analysis, Sener et al. (2009) found that improve-ments in traffic volume were what commuter bicyclists were willing to pay the highest price in money and/or time for. In addition, perceptions of ‘routes away from traffic noise and air pollution’ were ranked as the strongest motivators of bicycling (Winters et al., 2010c). In contrast, objec-tively measured traffic speed and volume were not related to the likelihood of bicycling (Moudon et al., 2005), and air pollution was not perceived as a reason for bicyclists to take detours (Winters et al., 2010a). Although

40 I LINA WAHLGREN Studies on Bikeability in a Metropolitan Area...
there are somewhat contradictory findings, road users, and particularly motor traffic, seem to influence bicycling.
2.5.1.4 The ‘natural’ environment and aesthetics The ‘natural’ environment, such as hilliness and greenery, as well as aes-thetics, are aspects of the environment that might influence bicycling. For example, Winters et al. (2010c) found that perceptions of flat routes and ‘routes with beautiful scenery’ were regarded as top motivators for bicy-cling. On the other hand, Winters et al. (2010a) did not find differences between the shortest and the actual routes to depend on either hills or greenness. Greenness included ‘the percentage of land area with green cover, including street trees, park and forest trees and grasslands’. A possi-ble explanation stated for the findings was a lack of variability between the shortest route and detour within a reasonable distance.
The hilliness of the route could have an impact on bicycling, mainly be-cause a terrain with many slopes requires an extended effort of the bicy-clist. Several studies have found a negative effect of slopes on bicycle use (for an overview, see Heinen et al., 2010). In contrast, some studies have indicated contradictory results. Objectively measured slopes were not re-lated to the likelihood of bicycling (Moudon et al. 2005) and the perceived presence of steep elevations was found to be positively related to bicycling (Titze et al., 2008). Furthermore, stated preference studies showed prefer-ences for hilly or moderately hilly bicycle-commuting route terrains com-pared to flat ones (Sener et al., 2009; Stinson and Bhat, 2003). One possi-ble explanation for these intuitively contradictory results is that the pur-pose of the trip is, at least partly for some bicyclists, to get exercise.
Greenery may be regarded as a part of aesthetics or a factor by itself. Natural environments or green space by itself might be an important con-tributor to physical activity (cf. de Vries, Claßen, Eigenheer-Hug et al., 2011). Research regarding greenery and bicycling is sparse. Nevertheless, a negative relationship was found between green space around people’s homes and bicycling commuting (Maas, Verheij, Spreeuwenberg et al., 2008). A stated possible explanation of this finding was that greener living environments tend to be further away from destination, such as shops or place of work, making distances less suitable for bicycling. If people bicy-cle-commuted, they were, however, likely to spend more time on it if they had more green space around their homes. In accord with the latter view, Wendel-Vos, Schuit, De Nuit et al. (2004) found a positive relationship between time spent on bicycle commuting and the amount of parks in the neighbourhood. In contrast, no relation was found between the likelihood of bicycling and objectively measured presence of parks (Moudon et al.,
LINA WAHLGREN Studies on Bikeability in a Metropolitan Area... I 41
2005). Although there are somewhat conflicting findings, greenery consti-tutes an interesting factor in relation to bicycling, and more research is therefore needed.
Aesthetics is a broad concept, and the term or closely related aspects thereof are used in different ways. In a review of reviews of environments related to physical activity, Gebel et al. (2007) found less-consistent asso-ciations between physical activity and ‘aesthetic features’. In the previously mentioned conceptual framework of environmental factors that may influ-ence bicycling presented by Pikora et al. (2003), aesthetics was, however, a factor of importance for both recreational and transport bicycling. Since recreational cycling included more items related to aesthetics, it appeared to be more important for recreational bicycling than for transport bicy-cling. In addition, perceptions of the ‘aesthetic nature of the environment’ were found to be associated with exercise or recreational walking, but not with transport walking (for a review, see Owen et al., 2004). Yet, the ‘gen-eral attractiveness of the route’ has been stated as an important factor for bicycling in general (cf. Parkin et al., 2007). Probably in contrast, Titze et al. (2008) found no associations between bicycling and perceptions of ‘at-tractiveness of cycling conditions’ or perceptions of ‘land use mix-diversity of uses’. These two factors were composite variables and included, among other components, the following that are of interest in relation to the aes-thetic dimension: ‘lots of trees, gardens, green spaces or parks along the route’, ‘many attractive buildings along the route’ and ‘many interesting things to look at’. In an additional study by Titze et al. (2007), a positive relationship was seen between perceptions of the ‘attractiveness of the sur-roundings’ and irregular bicycling. On the other hand, no relation was seen regarding regular bicycling. Again, ‘the attractiveness of the surroundings’ was a composite variable, including ‘air pollution level’, ‘green areas’, ‘at-tractiveness of buildings’ and ‘interesting things’. As previously mentioned, using composite variables has benefits, but limits the transparency and comparability (cf. Brownson et al., 2009). To sum up, although the results are somewhat contradictory, aesthetics in general seems to have some posi-tive association with bicycling. In conclusion, different factors in the route environment appear to influ-ence bicycling in various ways. This overview of findings gives an insight into some aspects that appear to be of importance. The cited findings are based on different research strategies, which have both strengths and limi-tations. Certainly, these finding can therefore be critically questioned. It is, however, beyond the scope of this thesis to explore these aspects in depth. I will, however, refer to some of the issues in the Discussion. Given the re-

42 I LINA WAHLGREN Studies on Bikeability in a Metropolitan Area...
sults of previous studies and methodological limitations described in the Background, there is a need for more research regarding the relationship between bicycling and the route environment and to, for this purpose, make use of new research approaches.
LINA WAHLGREN Studies on Bikeability in a Metropolitan Area... I 43
3 This thesis
3.1 Relevance and research questions Bicycle commuting to one’s place of work might contribute to increasing the population’s level of physical activity and thereby enhancing public health. The commuting route environment might possibly influence the behaviour – the bicycling. The research on environments related to bicy-cling is, however, in a relatively early stage and currently rather incom-plete, in dealing with a complex area. Different research strategies, with both strengths and limitations, are used. There is, therefore, a need for the development of new research approaches.
An ideal research design, with the purpose of studying the relation be-tween physical activity and the environment, would be to enable the isola-tion of the effect of different environmental variables in and of themselves, i.e. what would the effect be if only one environmental factor was changed. This is a difficult task. In line with this thinking, there is a need to differen-tiate within potentially important environmental categories.
The focus of this thesis is on bicycle commuting. I have therefore elabo-rated on the term bikeability and emphasized it as the wholeness of factors connected with bicycling itself. The following aspects are included as com-ponents of possible importance for the perception of bikeability in relation to bicycle commuting to one’s place of work: (1) the means of transport – the bicycle; (2) the level of safety; (3) whether the route environment stimu-lates or hinders bicycle commuting; and (4) the route distance and topog-raphy.
In my view, it is important to study each of these different levels of bike-ability in order to further our knowledge of the relationship between bicy-cling and the environment. The focus of this thesis is on whether the route environment stimulates or hinders bicycle commuting and what environ-mental factors might be of importance in this respect.
One problem connected with the research on the relation between physi-cal activity and the environments is the lack of specificity, regarding both the behaviours and the environments, and the matching between them. Therefore, this thesis focuses on active bicycle commuters, commuting to their place of work, and their commuting route environments.
Both people’s perceptions and more objective aspects of the environ-ments are likely to influence people’s behaviour. Bicycle commuting to one’s place of work is normally a repetitive behaviour along a specific route. Consequently, the bicycle commuters probably become very familiar with their route environments. Thus, the bicycle commuters’ perceptions of

44 I LINA WAHLGREN Studies on Bikeability in a Metropolitan Area...
the route environments could be relevant in understanding active commut-ing. Therefore, this thesis studies active bicycle commuters’ perceptions of their commuting route environments.
In order to study bicycle commuters’ perceptions of their route environ-ments, accurate measures are needed. Questionnaires developed to assess environments related to physical activity primarily deal with the local neighbourhoods. The commuting route, however, often includes an ex-tended area, especially for bicycle commuting to one’s place of work. Hence, the Active Commuting Route Environment Scale (ACRES) was developed for the assessment of bicyclists’ perceptions of their route envi-ronments. Furthermore, in contrast to most of the questionnaires devel-oped to assess environments related to physical activity, which have 4- or 5-point Likert scale types, the ACRES has 15-point response scales. These 15-point response scales enable assessment of, in principle, changes of finer distinction and correlations of relations between and within the predictor and outcome variables. Before using a measure, it is important to assess its accuracy. Therefore, this thesis studies the measurement properties – the validity and reliability – of the ACRES. The following two main research questions are addressed in this thesis:
• What are the measurement properties – the validity and reliability – of the ACRES?
• Do different characteristics of the commuting route environment hinder or stimulate active bicycle commuting?
3.2 Aims The overall aims of this thesis were to: (a) assess the measurement proper-ties – the validity and reliability – of the Active Commuting Route Envi-ronment Scale (ACRES) and (b) study active bicycle-commuters’ percep-tions of their commuting route environments, in terms of relations between different environmental predictor variables and the outcome variable: the overall environment as hindering or stimulating. The specific aims were to:
• Assess the criterion-related validity of the ACRES (Studies I and II). • Assess the test-retest reproducibility of the ACRES (Study I). • Compare ratings of perceptions of environmental factors between a
street- and an advertisement-recruited sample, with the aim of as-sessing representativity (Study II).
LINA WAHLGREN Studies on Bikeability in a Metropolitan Area... I 45
• Compare commuting route environment profiles of inner urban and suburban areas, with the aim of understanding which perceptions of factors in the commuting route environment, such as levels of ex-haust fumes, noise, speeds of traffic, traffic congestion and green-ery, might contribute to explaining potential differences between perceptions of: (a) the overall environment as hindering or stimulat-ing for active bicycle commuting and (b) feelings of unsafety or safety in traffic as a commuting bicyclist along the route (Studies I and II).
• Assess, in an inner urban area, the relation between perceptions of the overall environment as hindering or stimulating for active bicy-cle commuting and perceptions of factors in the commuting route environment, such as levels of exhaust fumes, noise, speeds of traf-fic, traffic congestion and greenery, by means of correlation and multiple regression analyses (Study III).

46 I LINA WAHLGREN Studies on Bikeability in a Metropolitan Area...
LINA WAHLGREN Studies on Bikeability in a Metropolitan Area... I 47
4 Methods
4.1 Study designs The three studies in this thesis are based on data from three groups of par-ticipants: (1) advertisement-recruited participants (Figure 5), (2) street-recruited participants (Figure 7) and (3) experts.
4.1.1 Study I The Active Commuting Route Environment Scale (ACRES) was developed to assess bicyclists’ and pedestrians’ perceptions of their route environ-ment. The main aims of Study I were to assess the validity and reliability of the ACRES in assessing bicyclists’ perceptions. The inner urban area of Greater Stockholm is quite different to the suburban and rural areas. The suburban and rural areas are referred to as suburban areas, unless stated otherwise. The ACRES addresses the inner urban and suburban route envi-ronments separately. Therefore, expected differences between the two envi-ronments were used for a criterion-related validity assessment. A street-recruited group of bicycle commuters (Figure 7) was used as well as exist-ing objective measures and an expert panel for the assessments. Bicycle commuters who cycled in both the inner urban and suburban areas were used. The experts also provided data on both route environments. First, the directions of differences in ratings of the experts and the bicycle commuters for the two different environments were compared with the directions of differences in existing objective measures of these environments. Thereaf-ter, directions and sizes of potential differences in the ratings of inner ur-ban and suburban environments were compared between the experts and the bicycle commuters. Reliability was assessed as test-retest reproducibil-ity among bicycle commuters, separated into inner urban and suburban environments.
4.1.2 Study II The aim of Study II was threefold. The first aim was to assess the criterion-related validity of the ACRES on another and larger groups of bicycle commuters, while also enabling separate analyses of men and women. The same design as in Study I was used – assessments based on differences in ratings between inner urban and suburban route environments and existing objective measures and ratings of experts as well as of bicycle commuters. Instead of street-recruited bicycle commuters, participants were recruited by advertisements (Figure 5). As in Study II, bicycle commuters who cycled in both the inner urban and suburban areas were used. The directions of

48 I LINA WAHLGREN Studies on Bikeability in a Metropolitan Area...
differences between the inner urban and the suburban environments as rated by the bicycle commuters were compared with the directions of dif-ferences in existing objective measurements. Thereafter, the sizes of differ-ences in the ratings of inner urban and suburban environments, separated for men and women, were compared with the experts’ ratings.
Active commuters, and particularly bicycle commuters, normally consti-tute a small group within the general population in larger cities. Therefore, it is, at present, difficult to use population-based random samples. Hence, there was a concern regarding the representativity of the advertisement-recruited participants. The street recruitment strategy was considered to represent the population of active commuters with greater certainty. There-fore, the ratings of the inner urban and suburban environments were com-pared between the advertisement- and street-recruited participants. This was the second aim. From both groups, participants who provided data in both inner and suburban environments were used. The ratings of inner urban and suburban environments by the two groups were used for com-parisons of both absolute levels, distributions of values and directions and sizes of differences between the inner urban and suburban environments.
The third aim was to study commuting route environment profiles of the inner urban and suburban areas. This assessment was based on advertise-ment-recruited participants, separated into men and women, divided into the following subgroups: (1) those who bicycle-commuted in both inner urban and suburban areas (hereafter called Both I&S); (2) those who bicy-cle-commuted in only an inner urban area (hereafter called Only I); and (3) those who bicycle-commuted in only a suburban area (hereafter called Only S). The ratings of the inner urban and the suburban environments by Both I&S and by Only I and Only S were compared. The different com-muting route environment profiles provided a basis for furthering our un-derstanding of different environments in relation to important aspects of bikeability. Finally, the ratings of the inner urban and suburban environ-ments were compared between Both I&S and Only I and Both I&S and Only S. This separation into subgroups enabled an expanded understand-ing of the validity of the ACRES in terms of whether or not bicycling and ratings of route environments in two different areas, compared to only one area, would affect the rating levels. Unless so indicated, there were no di-rected hypotheses regarding particular rating response patterns for any of the subgroups, sexes and issues studied.
4.1.3 Study III The main aim of Study III was to assess the potential associations between perceptions of whether the route environment on the whole hinders or
LINA WAHLGREN Studies on Bikeability in a Metropolitan Area... I 49
stimulates bicycle commuting and perceptions of environmental factors, such as levels of exhaust fumes, noise, speeds of traffic, traffic congestion and greenery. For this purpose, the ACRES and multiple regression analy-ses were used. Since Greater Stockholm has a variety of settings with dis-tinctly different environmental characteristics, this approach was expected to result in relatively large individual variations of ratings and thereby enable an exploratory comparative study of the relations between different items. An advertisement-recruited group of bicycle commuters (Figure 5) and data on route environments of the inner urban area of Greater Stock-holm were used.
Simultaneous multiple regression analysis was chosen to explore associa-tions between the outcome variable, hinders or stimulates, and the predic-tor variables, exhaust fumes, noise, flow of motor vehicles, speeds of motor vehicles, speeds of bicyclists, congestion: all types of vehicles, congestion: bicyclists, conflicts, bicycle paths, traffic: unsafe or safe, greenery, ugly or beautiful, course of the route, hilliness and red lights. Two models were run. In the first one, Model 1, traffic: unsafe or safe was excluded, and in the second, Model 2, it was included.
4.2 Participants: procedures, recruitments and descriptive characteristics
4.2.1 Advertisement-recruited participants Participants were recruited by advertising in two large morning newspapers (Dagens Nyheter and Svenska Dagbladet) in Stockholm towards the end of May and early June 2004. Inclusion criteria included: (a) being at least 20 years old; (b) living in Stockholm County, excluding the municipality of Norrtälje; and (c) walking and/or cycling the whole way to one’s place of work or study at least once a year. The place of work/study are referred to as place of work unless stated otherwise. In the invitation to participate, it was emphasized that people with short commuting distances were also welcome to participate. The reason for including people with less frequent active commuting behaviours, as well as with short route distances, was to include a wide range of commuting behaviours.
The advertisement resulted in 2148 people volunteering to take part. A first questionnaire, named the Physically Active Commuting in Greater Stockholm Questionnaire (PACS Q1), was posted to the participants in September 2004. The response frequency was 94% (n = 2010). During the peak bicycle-commuting period of the year, in May 2005, a second ques-tionnaire, the PACS Q2, was sent to 1978 participants. The response fre-quency was 92% (n = 1819). Both questionnaires were sent home to each

50 I LINA WAHLGREN Studies on Bikeability in a Metropolitan Area...
participant together with a prepaid return envelope. A maximum of three reminders were sent out. No incentives were provided for the participants. Some participants were excluded because they did not meet the inclusion criteria or did not wish to participate in the second part of the study. The participants were bicyclists, pedestrians or dual-mode commuters, i.e. indi-viduals who sometimes walk and sometimes cycle. They commuted in ei-ther the inner urban or suburban – rural areas or both inner and suburban – rural areas of Greater Stockholm, Sweden. Only data on bicycle commut-ing were used in the studies. After cleansing and editing the data, 1379 participants were included in the analyses. Different groupings of the par-ticipants were used in Studies II and III (Figure 5). For descriptive charac-teristics of the participants, see Tables 3 and 4.
LINA WAHLGREN Studies on Bikeability in a Metropolitan Area... I 51
Figure 5. Flowchart of advertisement-recruited participants and related data. PACS Q = The Physically Active Commuting in Greater Stockholm Questionnaire, ACRES = The Active Commuting Route Environment Scale, B = bicyclist, P = pedestrian, Dmc = dual-mode commuters, i.e. people who sometimes walk and sometimes cycle. In Study II a total of 1379 participants was included. They yielded data in the following subgroups: (Only I) bicycle commuting in only the inner urban area (n = 272); (Both I&S) bicycle commuting in both the inner urban and suburban areas (n =555); and (Only S) bicycle commuting in only the suburban area (n = 552). In Study III a total of 827 participants was included. All of these 827 participants yielded data regarding bicycle commuting in the inner urban area.
Study III
Advertisement
n = 2148
PACS Q1
n = 2010
PACS Q2
n = 1978
n = 1819
n = 1656
No return or drop-out (n = 138)
Did not want to participate in the next step of the study (n = 32)
No return or drop-out (n = 159)
Did not meet the inclusion criteria (n = 24)Incomplete or incorrect ACRES (n = 139)
Missing ACRES data for bicyclists(> 3 missing values) (n = 6)
n = 1650 (B: n = 1160, Dmc: n = 219, P: n = 271 Data: B: n = 1379, P: n = 490)
Bicyclists & Dual-mode commuters’ ACRES bicycle data
Only inner urban(Only I):n = 272
Inner urban & suburban(Both I&S):
n =555
Only suburban(Only S):n = 552
Data, inner urban:n = 827
Data, suburban:n = 1107
Study II

52
I L
INA
WA
HL
GR
EN St
udie
s on
Bik
eabi
lity
in a
Met
ropo
litan
Are
a...
Tab
le 3
. Des
crip
tive
cha
ract
eris
tics
of
part
icip
ants
in S
tudy
II:
adv
erti
sem
ent-
and
str
eet-
recr
uite
d pa
rtic
ipan
ts.
A
dver
tisem
ent-
recr
uite
dpa
rtic
ipan
tsSt
reet
-rec
ruite
dpa
rtic
ipan
tsB
oth
I&S*
Onl
y I*
Onl
y S*
Cha
ract
eris
ticW
omen
(n =
299
–30
2)
Men
(n =
249
–25
3)
Wom
en(n
= 1
93–
197)
Men
(n =
73–
75)
Wom
en(n
= 3
91–
399)
Men
(n =
151
–15
3)
Wom
en(n
= 3
2–33
)
Men
(n =
59–
60)
Age
in y
ears
, mea
n ±
SD47
±10
48 ±
11
48±
1146
± 1
249
± 1
049
± 1
142
. ± 9
.46
± 11
Wei
ght i
n kg
, mea
n ±
SD64
± 8
79±
1164
±8
78±
865
± 9
78 ±
962
± 7
78 ±
10
Hei
ght i
n cm
, mea
n ±
SD16
8 ±
618
1±
616
9 ±
618
2±
616
8±
618
0±
716
9±
518
2 ±
7Bo
dy m
ass i
ndex
, mea
n ±
SD23
±3
24 ±
322
± 2
24±
323
± 3
24 ±
222
± 2
24±
3G
ainf
ul e
mpl
oym
ent,
%95
9493
9698
9910
095
Educ
ated
at u
nive
rsity
leve
l, %
7874
8280
7166
7375
An
inco
me
abov
e 25
.000
SEK
** a
mon
th, %
6073
5872
3669
6180
Parti
cipa
nt a
nd b
oth
pare
nts b
orn
in S
wed
en, %
7986
8284
8089
6987
Hav
ing
a dr
iver
’s li
cenc
e, %
9496
9291
9095
9197
Usu
ally
acc
ess t
o a
car,
%74
8258
5274
8676
80Le
avin
g ho
me
7–9
a.m
. to
cycl
e to
wor
k, %
7267
8485
6861
8182
Num
ber o
f bic
ycle
-com
mut
ing
trips
per
yea
r***
, m
ean
± SD
241
± 12
228
0 ±
136
318
± 13
732
1 ±
117
266
± 13
127
1 ±
141
301
± 13
735
0 ±
84
Ove
rall
phys
ical
hea
lth e
ither
goo
d or
ver
y go
od, %
8686
8076
8280
9793
Ove
rall
men
tal h
ealth
eith
er g
ood
or v
ery
good
, %83
8684
8080
8491
88V
alue
s are
bas
ed o
n se
lf-re
ports
.*B
oth
I&S
= th
ose
who
bic
ycle
-com
mut
ed in
bot
h th
e in
ner u
rban
and
sub
urba
n ar
eas,
Onl
y I=
thos
e w
ho b
icyc
le-c
omm
uted
in o
nly
the
inne
r urb
an a
rea
and
Onl
y S
=th
ose
who
bic
ycle
-co
mm
uted
in o
nly
the
subu
rban
are
a.**
SEK
= S
wed
ish
crow
n/kr
ona,
yea
r 200
5:1
€≈
9 SE
K; 1
US$
≈ 8
SEK
.**
*The
num
ber o
f bic
ycle
-com
mut
ing
trips
per
yea
r is b
ased
on
figur
es fo
r 239
wom
en a
nd 2
18 m
en in
Bot
h I&
S, 1
61 w
omen
and
63
men
in O
nly
Iand
316
wom
en a
nd 1
29 m
en in
Onl
y S
and
18 w
omen
and
43
men
in th
e st
reet
-rec
ruite
d pa
rtici
pant
gro
up. T
he lo
w re
spon
se ra
te is
due
to m
issi
ng v
alue
s in
one
or m
ore
of th
e 12
mon
ths,
lead
ing
to e
xclu
sion
in th
e su
m sc
ore.
LINA WAHLGREN Studies on Bikeability in a Metropolitan Area... I 53
Table 4. Descriptive characteristics of participants in Study III (n = 816–826).
CharacteristicWomen, % 60Age in years, mean ± SD 47 ± 11Weight in kg, mean ± SD 70 ± 11Height in cm, mean ± SD 173 ± 9Body mass index, mean ± SD 23 ± 3Gainful employment, % 94Educated at university level, % 78An income above 25.000 SEK* a month, % 65Participant and both parents born in Sweden, % 82Having a driver’s licence, % 94Usually access to a car, % 71Leaving home 7–9 a.m. to cycle to work, % 75Number of bicycle-commuting trips per year**, mean ± SD 279 ± 133Overall physical health either good or very good, % 84Overall mental health either good or very good, % 84Values are based on self-reports.*SEK = Swedish crown/krona, year 2005: 1 € ≈ 9 SEK; 1 US$ ≈ 8 SEK.***The number of bicycle-commuting trips per year is based on 681 participants. The low response rate is due to missing values in one or more of the 12 months, leading to exclusion in the sum score.
4.2.2 Street-recruited participants Participants were recruited while they were walking or bicycling into, out of or in the inner urban area of Greater Stockholm, Sweden. The pedestri-ans or bicyclists were approached between 7 and 9 a.m. in mid-November 2005 as they either slowed down at one of four bridges or stopped at a traffic light on one arterial road (Figure 6). An invitation to participate together with a reply coupon was handed to 589 individuals. Inclusion criteria were the same as for advertisement-recruited participants. Overall, 214 coupons were returned in due time. The participants were then divided into two subgroups. One group (n = 114) was mainly used for a test-retest study of the Physically Active Commuting in Greater Stockholm Question-naire (PACS Q1) and one group (n = 100) was mainly used for a test-retest study of the PACS Q2. Test and retest questionnaires were sent to the par-ticipants during November and December, 2005. Thereafter, in a crossover manner, the participants received the questionnaire that they did not re-spond to initially. The participants received a lottery ticket and a cycling map as a token of gratitude after returning the questionnaires. The partici-pants were bicyclists, pedestrians or dual-mode commuters, i.e. individuals who sometimes walk and sometimes cycle. They commuted in either the inner urban or suburban – rural areas or both the inner and suburban – rural areas of Greater Stockholm, Sweden. Only data on bicycle commut-ing were used in the studies. Different groupings of the participants were used in Studies I and II (Figure 7). All of the participants were bicycle commuters. They are, however, referred to as bicycle commuters in Study I
52 I LINA WAHLGREN Studies on Bikeability in a Metropolitan Area...
Table 3. Descriptive characteristics of participants in Study II: advertisement- and street-recruited participants.
Advertisement-recruitedparticipants
Street-recruitedparticipants
Both I&S* Only I* Only S*Characteristic Women
(n = 299–302)
Men(n = 249–
253)
Women(n = 193–
197)
Men(n = 73–
75)
Women(n = 391–
399)
Men(n = 151–
153)
Women(n = 32–
33)
Men(n = 59–
60)Age in years, mean ± SD 47 ± 10 48 ± 11 48 ± 11 46 ± 12 49 ± 10 49 ± 11 42. ± 9. 46 ± 11Weight in kg, mean ± SD 64 ± 8 79 ± 11 64 ± 8 78 ± 8 65 ± 9 78 ± 9 62 ± 7 78 ± 10Height in cm, mean ± SD 168 ± 6 181 ± 6 169 ± 6 182 ± 6 168 ± 6 180 ± 7 169 ± 5 182 ± 7Body mass index, mean ± SD 23 ± 3 24 ± 3 22 ± 2 24 ± 3 23 ± 3 24 ± 2 22 ± 2 24 ± 3Gainful employment, % 95 94 93 96 98 99 100 95Educated at university level, % 78 74 82 80 71 66 73 75An income above 25.000 SEK** a month, % 60 73 58 72 36 69 61 80Participant and both parents born in Sweden, % 79 86 82 84 80 89 69 87Having a driver’s licence, % 94 96 92 91 90 95 91 97Usually access to a car, % 74 82 58 52 74 86 76 80Leaving home 7–9 a.m. to cycle to work, % 72 67 84 85 68 61 81 82Number of bicycle-commuting trips per year***, mean ± SD
241 ± 122 280 ± 136 318 ± 137 321 ± 117 266 ± 131 271 ± 141 301 ± 137 350 ± 84
Overall physical health either good or very good, %
86 86 80 76 82 80 97 93
Overall mental health either good or very good, % 83 86 84 80 80 84 91 88Values are based on self-reports.*Both I&S = those who bicycle-commuted in both the inner urban and suburban areas, Only I = those who bicycle-commuted in only the inner urban area and Only S = those who bicycle-commuted in only the suburban area.**SEK = Swedish crown/krona, year 2005: 1 € ≈ 9 SEK; 1 US$ ≈ 8 SEK.***The number of bicycle-commuting trips per year is based on figures for 239 women and 218 men in Both I&S, 161 women and 63 men in Only I and 316 women and 129 men in Only Sand 18 women and 43 men in the street-recruited participant group. The low response rate is due to missing values in one or more of the 12 months, leading to exclusion in the sum score.

54 I LINA WAHLGREN Studies on Bikeability in a Metropolitan Area...
and street-recruited participants in Study II. For descriptive characteristics of the participants, see Tables 3 and 5.
Figure 6. Contact points for street-recruitment (Studies I and II). Aerial view from 2005 over the inner urban area of Greater Stockholm, Sweden. The yellow circles denote contact points. Participants were recruited while they were walking or bicy-cling into or in the inner urban area. For geographical reasons, three of these con-tact points for recruitment, two bridges and one arterial road, were focal centres for active commuters entering or leaving the inner urban area from three different parts of the surrounding suburban areas. (Copyright: Lantmäteriverket, Gävle, Sweden, 2011; Permission 81055230.)
LINA WAHLGREN Studies on Bikeability in a Metropolitan Area... I 55
Figure 7. Flowchart of street-recruited participants and related data. PACS Q = The Physically Active Commuting in Greater Stockholm Questionnaire, ACRES = The Active Commuting Route Environment Scale, Dual-mode commuters = people who sometimes walk and sometimes cycle. In Study I a total of 54 participants were included. They yielded data in the following subgroups: (a) bicycle commuting in both the inner urban and suburban areas (n = 44); (b) bicycle commuting in the inner urban area (n = 53); and (c) bicycle commuting in the suburban area (n = 45). In Study II a total of 93 participants were included. All of these 93 participants bicycle-commuted in both the inner urban and suburban areas. All of the partici-pants are bicycle commuters. They are, however, referred to as bicycle commuters in Study I and street-recruited participants in Study II.
Street-recruitment
Invitation: n = 589
PACS Q1: n = 114 n = 214 PACS Q2: n = 100
PACS Q1 Retest n = 54 PACS Q2 Retest
PACS Q2 PACS Q1
Bicyclists & Dual-mode commuters’ ACRES bicycle data
Only inner urban:n = 9
Inner urban & suburban:n = 44
Only suburban:n = 1
Data, inner urban:n = 53
Inner urban & suburban:n = 37
Inner urban & suburban:n = 12
Inner urban & suburban: n = 93
Study I
Study II
Criterion-related validityTest-retest reproducibility
Data, suburban:n = 45

56 I LINA WAHLGREN Studies on Bikeability in a Metropolitan Area...
Table 5. Descriptive characteristics of participants in Study I: bicycle commuters
and experts.
Bicycle commuters* Experts**(n = 23–24)Characteristic Women
(n = 19–20)Men
(n = 34)Age in years, mean ± SD 41 ± 9 47 ± 10 44 ± 9Weight in kg, mean ± SD 61 ± 6 77 ± 8 -Height in cm, mean ± SD 169 ± 4 180 ± 6 -Body mass index, mean ± SD 21 ± 2 24 ± 2 -Gainful employment, % 100*** 97 -Having a driver’s license, % 95 94 96†Usually access to a car, % 70 82 83†Educated at university level, % 75 74 100An income above 25.000 SEK‡ a month, % 50 82 100†Overall physical health as either good or very good, %
100 88 -
Overall mental health as either good or very good, %
90 91 -
Values are based on self-reports.*The mean number of bicycle-commuting trips to work per year was 339 ± 89 (± SD, n = 35).**10 usually bicycle-commuted to work all the year round, and 4 did so during the summer half-year.***n = 19, i.e. one missing value.†n = 23, i.e. one missing value.‡SEK = Swedish crown: Year 2005 and 2009: 1 € ≈ 10 SEK; 1 US$ ≈ 8 and 7 SEK, respectively.
4.2.3 Experts An expert panel of employees working at the exploitation, traffic, city planning or environment units of the Municipality of Stockholm was as-sembled in September 2009 to assess the inner urban and suburban route environments of Greater Stockholm. Thirty-two relevant individuals were chosen to be part of the expert panel. They received a questionnaire with questions on descriptive characteristics and a modified version of the ACRES assessing bicyclists’ perceptions. One item, short or long, was not included. The experts were asked to assess the overall route environments for cyclists commuting in Greater Stockholm and for the whole group of commuting cyclists, and for the inner urban and suburban areas separately. Twenty-eight experts returned the completed questionnaire and data on 24 (women, n = 11) could be included in the analyses. The experts received cinema tickets as an incentive after returning the questionnaire. The ex-perts were used in Studies I and II. In Study II, only the experts’ mean val-ues for the sizes of differences between ratings of the inner urban and sub-urban environments were used for comparisons with the advertisement-recruited participants’ corresponding values. For descriptive characteristics of the experts, see Table 5.
LINA WAHLGREN Studies on Bikeability in a Metropolitan Area... I 57
4.2.4 Ethical approval The studies in this thesis are part of the Physically Active Commuting in Greater Stockholm (PACS) studies. The Ethics Committee of the Karolin-ska Institute approved the PACS studies. Furthermore, the advertisement- and street-recruited participants, as well as the experts, gave their informed consent.
4.3 Existing objective measures Differences between inner urban and suburban environments of Greater Stockholm, corresponding to the four ACRES items, exhaust fumes, noise, congestion: all types of vehicles and greenery, were used for comparisons of the direction of differences. Existing objective measurements showed higher levels for the inner urban environments than for the suburban envi-ronments corresponding to the items: exhaust fumes (The Stockholm–Uppsala Air Quality Management Association, 2009), noise (The Munici-pality of Stockholm, Department of Environment and Health, 2009) and congestion: all types of vehicles (Eliasson, 2008; Morán Toledo, 2008; The Stockholm Trials, 2006). The opposite, higher levels for the suburban envi-ronments than for the inner urban environments, was shown correspond-ing to the item greenery (Löfvenhaft, 2002).
4.4 Measures
4.4.1 The Physically Active Commuting in Greater Stockholm Questionnaire (PACS Q) The PACS Q1 and PACS Q2 are self-administered questionnaires in Swed-ish, based on self-reports. They include 35 and 68 items, respectively, com-prising descriptive characteristics of participants and different aspects of active commuting. The PACS Q2 includes the ACRES. The PACS Q1 and Q2 were developed in 2004–05 by Dr Peter Schantz and Erik Stigell, mem-bers of the Research Unit for Movement, Health and Environment at GIH – The Swedish School of Sport and Health Sciences. The questionnaires were pre-tested on a small convenience sample of academic staff members.
4.4.1.1 Measures of descriptive characteristics Data on sex, age, weight, height, employment and number of bicycle-commuting trips per month were obtained from the PACS Q1. The body mass index (BMI) was calculated by dividing body weight by height squared (kg/m²). Active commuting trips per year were calculated by add-ing each of the 12 months’ average trip frequency per week, dividing by 12 and multiplying by 52. Educational levels, income, ethnicity, having a

58 I LINA WAHLGREN Studies on Bikeability in a Metropolitan Area...
driver’s licence, having access to a car, time leaving home to cycle to work and overall physical and mental health were obtained from the PACS Q2.
4.4.1.2 The Active Commuting Route Environment Scale (ACRES) The ACRES consists of 18 items for the assessment of bicyclists’ percep-tions of their self-chosen commuting route potentially associated with ac-tive commuting (Table 6; the original questionnaire in Swedish is found in the Appendix) and 15, fundamentally identical, items for the assessment of the pedestrians’ perceptions. Each item considers the inner urban area of Stockholm, the capital of Sweden, and the suburban, as well as rural areas surrounding it within Stockholm County, separately. The questionnaire instructions include a drawn map that distinguishes the inner urban area from the surrounding area (Figure 8). The participants are asked to differ-entiate between their experiences when their active commuting route is in the inner urban area and when it is in the surrounding suburban as well as rural area (Figure 4).
Figure 8. The drawn map included in the ACRES instructions. The dashed line distinguishes the inner urban and the suburban areas of Greater Stockholm. Lake Mälaren and inner parts of the Baltic Sea in the Stockholm archipelago create a natural separation between the southern and northern suburban and rural areas.
To simplify understanding, the items have been divided into: (a) the physi-cal environment; (b) the traffic environment; and (c) the social environ-ment. The following items are included in the physical environment: bicy-cle paths (#11) (not for pedestrians), greenery (#13), ugly or beautiful (#14), course of the route (#15), hilliness (#16), red lights (#17) and short or long (#18). They represent non-moving aspects. The following items are included in the traffic environment: exhaust fumes (#3), noise (#4), flow of
LINA WAHLGREN Studies on Bikeability in a Metropolitan Area... I 59
motor vehicles (#5), speeds of motor vehicles (#6), speeds of bicyclists (#7) (not for pedestrians), congestion: all types of vehicles (#8) (not for pedes-trians) and congestion: bicyclists/pedestrians (#9). They represent moving aspects. The following item is included in the social environment: conflicts (#10). It represents relationships between road users. All items are meant to operate independently. The remaining three items, namely, on the whole (#1), hinders or stimulates (#2) and traffic: unsafe or safe (#12), are re-garded as outcome variables. All the other items are regarded as predictor variables believed to be potentially important for the outcome variables. The numbers specified in parentheses indicate the order in the question-naire; see Table 6.
Fifteen-point response scales, with adjectival opposites, ranging from 1 to 15, corresponding to, e.g. ‘very low’ and ‘very high’, are used, with the exception of one item. The item bicycle paths has an 11-point response scale ranging from 0% (0) to 100% (10). The 15-point response scales feature a numbered continuous line, i.e. whole numbers from 1 to 15, with number 8 as a neutral option in the middle, labelled, e.g., ‘neither low nor high’. For an example of an item from the ACRES, see Figure 4.
In the questionnaire instructions, the participants are asked to recall and rate their overall experience of their self-chosen route environments based on their active commuting to their place of work or study during the previ-ous two weeks. At no point were the participants informed about the in-tent of the ACRES.

60
I L
INA
WA
HL
GR
EN St
udie
s on
Bik
eabi
lity
in a
Met
ropo
litan
Are
a...
Tab
le 6
. The
Act
ive
Com
mut
ing
Rou
te E
nvir
onm
ent
Scal
e (A
CR
ES)
ass
essi
ng b
icyc
lists
’ per
cept
ions
.
15-p
oint
res
pons
e sc
ale
Que
stio
n1
151.
How
do
you
expe
rienc
e th
e en
viro
nmen
t on
the
who
le a
long
the
rout
e?V
ery
bad
Ver
y go
od2.
Do
you
thin
k th
at, o
n th
e w
hole
, the
env
ironm
ent y
ou c
ycle
in st
imul
ates
/hin
ders
you
r com
mut
ing?
Hin
ders
a lo
tSt
imul
ates
a lo
t3.
How
do
you
find
the
exha
ust f
ume
leve
ls al
ong
your
rout
e?V
ery
low
Ver
y hi
gh4.
How
do
you
find
the
nois
e le
vels
alon
g yo
ur ro
ute?
Ver
y lo
wV
ery
high
5. H
ow d
o yo
u fin
d th
e flo
w o
f mot
or v
ehic
les (
num
ber o
f car
s) a
long
you
r rou
te?
Ver
y lo
wV
ery
high
6. H
ow d
o yo
u fin
d th
e sp
eeds
of m
otor
veh
icle
s (ta
xis,
lorri
es, o
rdin
ary
cars
, bus
es) a
long
you
r rou
te?
Ver
y lo
wV
ery
high
7. H
ow d
o yo
u fin
d ot
her c
yclis
ts’ s
peed
s alo
ng y
our r
oute
?V
ery
low
Ver
y hi
gh8.
How
do
you
as a
cyc
list f
ind
the
cong
estio
n le
vels
in m
ixed
traf
fic, c
ause
d by
all
type
s of v
ehic
les,
alon
g yo
ur ro
ute?
Ver
y lo
wV
ery
high
9. H
ow d
o yo
u fin
d th
e co
nges
tion
leve
ls ca
used
by
the
num
ber o
f cyc
lists
on
the
cycl
e pa
ths/c
ycle
lane
salo
ng y
our r
oute
?V
ery
low
Ver
y hi
gh10
. How
do
you
find
the
occu
rrenc
e of
con
flict
s bet
wee
n yo
u as
a c
yclis
t and
oth
er ro
ad u
sers
(inc
ludi
ng p
edes
trian
s) a
long
yo
ur ro
ute?
Ver
y lo
wV
ery
high
11. A
bout
how
larg
e a
part
of y
our r
oute
con
sists
of c
ycle
pat
hs/c
ycle
lane
s/cy
cle
road
ssep
arat
ed fr
om m
otor
-car
traf
fic?
0%10
0%*
12. H
ow u
nsaf
e/sa
fe d
o yo
u fe
el in
traf
fic a
s a c
yclis
t alo
ng y
our r
oute
?V
ery
unsa
feV
ery
safe
13. H
ow d
o yo
u fin
d th
e av
aila
bilit
y of
gre
ener
y (n
atur
al a
reas
, par
ks, p
lant
ed it
ems,
trees
) alo
ng y
our r
oute
?V
ery
low
Ver
y hi
gh14
. How
ugl
y/be
autif
ul d
o yo
u fin
d th
e su
rroun
ding
s alo
ng y
our r
oute
?V
ery
ugly
Ver
y be
autif
ul15
. To
wha
t ext
ent d
o yo
u fe
el th
at y
our c
ycle
trip
is m
ade
mor
e di
fficu
lt by
the
cour
se o
f the
rout
e?Fo
r exa
mpl
e,a
cour
se w
ith m
any
shar
p tu
rns,
deto
urs,
chan
ges i
n di
rect
ion,
side
cha
ngeo
vers
etc
.V
ery
little
Ver
y m
uch
16. T
o w
hat e
xten
t do
you
feel
that
you
r cyc
le tr
ip is
mad
e m
ore
diffi
cult
by h
illin
ess?
Bas
e th
is on
the
rout
e to
and
from
you
r pla
ce o
f wor
k/st
udy.
Ver
y lit
tleV
ery
muc
h
17. T
o w
hat e
xten
t do
you
feel
that
you
r pro
gres
s in
traffi
c is
wor
sene
d by
the
num
ber o
f red
ligh
ts d
urin
g yo
ur tr
ip to
you
rpl
ace
of w
ork/
stud
y?V
ery
little
Ver
y m
uch
18. H
ow sh
ort/l
ong
do y
ou e
xper
ienc
e yo
ur ro
ute
to b
e?V
ery
shor
tV
ery
long
Not
e th
at th
is is
a tr
ansla
tion
of th
e or
igin
al A
CR
ES in
Sw
edis
h.*1
1-po
int s
cale
.
LINA WAHLGREN Studies on Bikeability in a Metropolitan Area... I 61
4.4.1.3 Development of the Active Commuting Route Environment Scale (ACRES) The ACRES was developed in 2005 by Dr Peter Schantz and Erik Stigell, members of the Research Unit for Movement, Health and Environment at GIH – The Swedish School of Sport and Health Sciences, as part of the research project called Physically Active Commuting in Greater Stockholm (PACS). The development was influenced by published research literature in the field, as well as by Peter’s and Erik’s many years of bicycling-commuting experiences and by Erik’s professional experiences from work-ing with bicycling advocacy and promotion issues in the region of Stock-holm.
The outcome variable concerning whether the environment on the whole is perceived as stimulating or hindering physically active commuting (hin-ders or stimulates) was formulated to be specific for the particular physical activity behaviour studied (cf. Giles-Corti et al., 2005). Hinders or stimu-lates was complemented with a more generally formulated outcome vari-able concerning how the environment on the whole along the commuting route is perceived (on the whole). The outcome variable traffic: unsafe or safe was prompted by the fact that feelings of unsafeness have been re-ported as an important hindrance to cycling (cf. Parkin et al., 2007).
The predictor variables flow of motor vehicles and speeds of motor ve-hicles were chosen based on a mixture of inputs, including the conceptual framework developed by Pikora et al. (2003). Included composite expres-sions of these two items were noise, exhaust fumes and congestion: all types of vehicles. The latter item may also be influenced by the item con-gestion: bicyclists, although it is related to bicyclists in bicycle paths or lanes. Congestion: bicyclists can, however, also be regarded as an indicator of the flow of bicyclists in general. The item congestion: bicyclists was prompted by concerns expressed by civil servants dealing with bicycle traf-fic at the traffic unit of the Municipality of Stockholm (Isaksson, K. pers. comm. by Schantz, P., September 2004) in relation to an increasing flow of bicyclists. Frequently noted complaints regarding bicyclist behaviours by citizens, addressed as letters from ‘Readers’ or ‘Opinions’ in the two major Stockholm morning newspapers, were among the reasons for inclusion of the items speeds of bicyclists and conflicts. The item bicycle paths was chosen because it is an often suggested infrastructure investment in policy documents aimed at increasing bicycling. Furthermore, in a population study in the Municipality of Stockholm, bicycle paths have been indicated as an issue influencing the willingness to cycle more (Ericson, 2000). The inclusion of the item greenery was prompted by the fact that natural ele-
60 I LINA WAHLGREN Studies on Bikeability in a Metropolitan Area...
Table 6. The Active Commuting Route Environment Scale (ACRES) assessing bicyclists’ perceptions.
15-point response scaleQuestion 1 151. How do you experience the environment on the whole along the route? Very bad Very good2. Do you think that, on the whole, the environment you cycle in stimulates/hinders your commuting? Hinders a lot Stimulates a lot3. How do you find the exhaust fume levels along your route? Very low Very high4. How do you find the noise levels along your route? Very low Very high5. How do you find the flow of motor vehicles (number of cars) along your route? Very low Very high6. How do you find the speeds of motor vehicles (taxis, lorries, ordinary cars, buses) along your route? Very low Very high7. How do you find other cyclists’ speeds along your route? Very low Very high8. How do you as a cyclist find the congestion levels in mixed traffic, caused by all types of vehicles, along your route? Very low Very high9. How do you find the congestion levels caused by the number of cyclists on the cycle paths/cycle lanes along your route? Very low Very high10. How do you find the occurrence of conflicts between you as a cyclist and other road users (including pedestrians) along your route?
Very low Very high
11. About how large a part of your route consists of cycle paths/cycle lanes/cycle roads separated from motor-car traffic? 0% 100%*12. How unsafe/safe do you feel in traffic as a cyclist along your route? Very unsafe Very safe13. How do you find the availability of greenery (natural areas, parks, planted items, trees) along your route? Very low Very high14. How ugly/beautiful do you find the surroundings along your route? Very ugly Very beautiful15. To what extent do you feel that your cycle trip is made more difficult by the course of the route?For example, a course with many sharp turns, detours, changes in direction, side changeovers etc.
Very little Very much
16. To what extent do you feel that your cycle trip is made more difficult by hilliness?Base this on the route to and from your place of work/study.
Very little Very much
17. To what extent do you feel that your progress in traffic is worsened by the number of red lights during your trip to yourplace of work/study?
Very little Very much
18. How short/long do you experience your route to be? Very short Very longNote that this is a translation of the original ACRES in Swedish.*11-point scale.

62 I LINA WAHLGREN Studies on Bikeability in a Metropolitan Area...
ments appear to be a modifier of stress and mood states (cf. Ulrich, 1984; Ulrich, Simons, Losito et al., 1991). Greenery is presumably a component of the item regarding aesthetics (ugly or beautiful). The items ugly or beau-tiful can, however, be a composite expression of other sources of beauty as well. Ugly or beautiful merited inclusion also based on findings regarding the local neighbourhood and levels of walking (Owen et al., 2004). The items course of the route, hilliness and red lights were related to the theo-ries of space syntax (Hillier and Hanson, 1984; Hillier et al., 1993). Space syntax is based on the fact that people seem to prefer to move in a linear fashion. A shift in direction can, for example, be necessary due to the fact that the street is not straight. The item course of route relates to this issue. Furthermore, the continuity of lines of sight or access can be interrupted by, for example, a hill. Therefore, hilliness is an included item. Another important reason for the inclusion of the item hilliness is its stated impact of hindering movements due to greater demands on effort (e.g. Parkin et al., 2007). The number of red lights along a route may possibly have an independent effect on hindering or stimulating movement, as well as on the perception of traffic safety, and therefore red lights is an included item. The item short or long was regarded as a potentially important perception in relation to the outcome variable hinders or stimulates.
All items in the ACRES can vary independently of each other, and the ACRES was developed to enable the evaluation of relations between and within the predictor and outcome variables. This affected the choice of items, including the response scales. An additional input was the changes in motorized traffic flows expected to occur with the introduction of a con-gestion tax at the limits of the Stockholm inner urban area in 2006 (The Stockholm Trials, 2006). This could potentially lead to changes in different environmental variables connected with the traffic environment, as well as with a changeover to more active transport. These changes were considered to be interesting to examine in terms of perceptions by active commuters. Some of the anticipated changes, for example, in exhaust fume levels, were in the order of 10% (Eliasson, 2008). This was the reason for choosing response scales which, in principle, have the potential to capture changes of finer distinction. (See Paper I)
4.5 Study area The study area includes the inner urban and the suburban as well as rural parts of Greater Stockholm, Sweden (Figure 9). The inner urban area in-cludes the city sections of ‘Gamla stan’ (the Old Town), Södermalm, Kung-sholmen, Vasastan, Norrmalm and Östermalm. The separation between the inner urban and the suburban as well as rural parts was essentially
LINA WAHLGREN Studies on Bikeability in a Metropolitan Area... I 63
based on the fact that these areas constitute different environments and that the inner urban area essentially includes a dense urban setting with blocks placed in a grid-like streetscape, typical of European cities. An addi-tional input for this separation was the changes in motorized traffic flows expected to occur with the introduction of a congestion tax at the limits of the Stockholm inner urban area in 2006 (The Stockholm Trial, 2006).
4.5.1 The inner urban area The inner urban part of Stockholm, the capital of Sweden, is located in the centre of a metropolitan area with about 1.9 million inhabitants (Figure 9). The area constitutes the region’s single core urban structure. The centre is situated where Lake Mälaren meets the Baltic Sea, thereby dividing the region into two main parts. The inner urban part of the study area is a predominantly built-up area, with blocks in a grid-like streetscape. The age of the buildings varies. One part, the Old Town, is from medieval times. Most parts of the built-up environment are, however, predominantly a result of the architectural styles from the end of the 19th and beginning of the 20th century, with most buildings about five storeys high. In the newest part of the city the original buildings were torn down during the 1950s and 1960s. Today this area includes modernistic architecture, including a few skyscrapers. In 2005 the residential density of the inner urban parts of the study area was approximately 13.000 residents per square km (The Mu-nicipality of Stockholm, Office of Research and Statistics, 2008).
The city has a number of waterfronts and islands, a number of both small and large parks, and some alleys and esplanades. Most streets are void of trees or other forms of greenery. The natural landscape in the area is sediment-filled valleys as a part of the surrounding rift-valley landscape and raised archipelago landscape with eroded bedrocks after deglaciation. It is basically rather flat, but there are some dominant natural features as, for example, part of an esker, rising 40 metres above sea level, as well as a rather steep fault scarp. The road system also includes rather gentle slopes of infrequent moraine hills, normally not accounting for more than about 10–15 metres of elevation. Two arterial highways pass through the inner urban area, but they come into very little contact with cyclists or pedestri-ans. These are also the only roads, besides some tunnels, that do not permit cycling.
4.5.2 The suburban area The suburban part of the study area is located in the suburban and rural areas of Greater Stockholm (Figure 9). These areas include a mixture of residential areas, smaller industrial areas and managed forests as well as

64 I LINA WAHLGREN Studies on Bikeability in a Metropolitan Area...
agricultural land. The residential areas either have predominantly single houses or more dense areas with multi-storey houses. The single houses were mainly built during the 1930s and onwards in different architectural styles, whereas the majority of the densely built-up areas were fashioned in a modernistic style after the Second World War and during the 1970s. Houses are generally placed separately in the landscape, not in blocks, and the streets are not normally laid out in a grid-like streetscape. On the other hand, the main roads often follow old road networks formed during the agricultural period of the landscape. The residential density of the land-scape normally varies with the proximity to underground or commuter train stations, which usually have small centres near the stations. The southern and westerns suburbs of the Municipality of Stockholm were chosen to indicate the residential density of the suburban parts of the study area. In 2005 these suburbs amounted to approximately 3.500 and 2.900 residents per square km, respectively (The Municipality of Stockholm, 2008).
There are trees and other forms of greenery in gardens and between the multi-storey houses, but not in alleys bordering the streets. The settlements, as well as the roads and traffic zones, lie in former agricultural landscapes in the sediment-filled valleys in this rift valley landscape. Between the val-leys, bedrocks, which are mostly covered with coniferous forest, often rise in faults. The bedrocks often protrude from the thin soil cover, called mo-raine. The valleys in this area are basically flat, but the road system in-cludes rather gentle slopes of infrequent moraine hills from the deglaciation and normally do not account for more than about 10–15 metres of eleva-tion. Forest-dominated areas stretch from the rural areas towards and into the centre of the region, between settlements and traffic zones, like ten green wedges. Lakes, islands and the Baltic Sea are other components. Some arterial highways pass through the landscape with varying contact with cyclists and pedestrians.
L
INA
WA
HL
GR
EN S
tudi
es o
n B
ikea
bilit
y in
a M
etro
polit
an A
rea.
.. I
65
Fi
gure
9. A
eria
l vie
w f
rom
200
5 ov
er t
he m
ore
cent
ral p
arts
of
Gre
ater
Sto
ckho
lm, S
wed
en. T
he y
ello
w li
ne d
isti
ngui
shes
the
inne
r ur
ban
and
the
subu
rban
as
wel
l as
rura
l par
ts o
f th
e st
udy
area
. (C
opyr
ight
: Lan
tmät
eriv
erke
t, G
ävle
, Sw
eden
.)
LINA WAHLGREN Studies on Bikeability in a Metropolitan Area... I 65
Figure 9. Aerial view from 2005 over the more central parts of Greater Stockholm, Sweden. The yellow line distinguishes the inner urban and the suburban as well as rural parts of the study area. (Copyright: Lantmäteriverket, Gävle, Sweden.)

66 I LINA WAHLGREN Studies on Bikeability in a Metropolitan Area...
4.6 Statistical analyses Questionnaire data were entered in the Statistical Package for the Social Sciences (SPSS). Thereafter, all entered data from the PACS Q2 were checked for accuracy. The statistical analyses were performed using the SPSS versions 17.0 and 19.0 (IBM SPSS INC., Somer, NY, USA).
Analyses of differences between environments, groups and occasions (i.e. order effects) were performed using paired or independent Student’s t-tests. Linear regression analysis and Pearson’s correlation coefficient (r) were used to assess the agreement between mean scores. The standard error of measurement, i.e. representing the typical error (Hopkins, 2000), and the intraclass correlation (ICC), based on a one-way analysis of variance, were used to assess test-retest reproducibility. Simultaneous multiple regression analysis was used to explore associations between the outcome variable, hinders or stimulates, and the environmental predictor variables.
Percentages and mean scores ± 1 standard deviation (SD) were used to report the characteristics of the participants. The values of the ACRES items are presented as mean scores ± 1 SD or the standard error of differ-ence (SEd). The linear regression equations and the ICCs are presented with 95% confidence intervals (95% CI). The values from the simultane-ous multiple regression analyses are presented as unstandardized beta coef-ficients (B) and their 95% confidence interval (CI) and partial correlation coefficients. Furthermore, R square (R²) is presented for the overall models.
In general, a statistical level of at least p ≤ 0.05 was used to indicate si g-nificance. In case of problems with multiple comparisons, using the same data, a statistical level of p ≤ 0.025 was appli ed, making a Bonferroni cor-rection. Linear regression lines were not considered to deviate significantly if the 95% CI included 1.0 for the slope and 0.0 for the y-intercept (line of identity: slope = 1.0 and y-intercept = 0.0).
Ratings suggested by Landis and Koch (1977): < 0.00, ‘poor’; 0.00–0.20, ‘slight’; 0.21–0.40, ‘fair’; 0.41–0.60, ‘moderate’; 0.61–0.80, ‘substan-tial’ and 0.81–1.00 ‘almost perfect’, were used as agreement levels for the interpretation of ICCs.
For comparisons between the advertisement- (Both I&S) and the street-recruited participants, the men’s and women’s ratings were combined to give ‘sex-neutral’ means (Study II).
LINA WAHLGREN Studies on Bikeability in a Metropolitan Area... I 67
5 Results
5.1 Criterion-related validity: differences in ratings between inner urban and suburban environments (Studies I and II)
5.1.1 Comparisons with existing objective measures The ratings of the experts (Study I), the bicycle commuters at test and re-test (Study I) and the advertisement-recruited men and women (Both I&S; Study II) showed significantly higher values for the inner urban environ-ments than for the suburban environments on the items: exhaust fumes, noise and congestion: all types of vehicles. The opposite was observed for the item greenery (Tables 7 and 8). These findings correspond with the directions of the existing objective measures.

68
I L
INA
WA
HL
GR
EN St
udie
s on
Bik
eabi
lity
in a
Met
ropo
litan
Are
a...
Tab
le 7
. Env
iron
men
t ra
ting
s by
the
exp
erts
and
bic
ycle
com
mut
ers
at t
est
and
rete
st. M
ean
± SD
.
Exp
erts
(n =
22–
24)
Bic
ycle
com
mut
ers (
n =
43–4
4)T
est
Ret
est
Item
Inne
r ur
ban
Subu
rban
Inne
r ur
ban
Subu
rban
Inne
r ur
ban
Subu
rban
1. O
n th
e w
hole
8.21
± 2
.28
9.13
± 2
.33
9.43
± 3
.42
10.9
8 ±
2.80
*8.
86 ±
3.1
510
.63
± 2.
68*
2. H
inde
rs o
r stim
ulat
es7.
79 ±
3.0
68.
96 ±
2.4
99.
98 ±
3.2
911
.23
± 2.
57*
9.18
± 3
.04
10.2
7 ±
2.86
*3.
Exh
aust
fum
es10
.04
± 2.
60*
7.50
± 2
.83
9.98
± 2
.80*
7.91
± 3
.58
9.77
± 3
.09*
7.32
± 3
.63
4. N
oise
11.5
0 ±
2.18
*9.
45 ±
2.2
89.
98 ±
2.7
7*8.
50 ±
3.3
59.
91 ±
2.4
4*8.
52 ±
3.6
25.
Flo
w o
f mot
or v
ehic
les
12.0
9 ±
2.27
*9.
30 ±
3.0
212
.27
± 2.
64*
9.98
± 3
.73
11.4
1 ±
2.30
*8.
91 ±
3.8
46.
Spe
eds o
f mot
or v
ehic
les
9.00
± 2
.73
10.5
2 ±
2.41
*8.
95 ±
2.8
09.
41 ±
2.6
89.
25 ±
2.6
09.
23 ±
2.8
17.
Spe
eds o
f bic
yclis
ts9.
38 ±
2.9
910
.62
± 2.
208.
73 ±
2.7
39.
11 ±
2.4
68.
91 ±
2.6
88.
98 ±
2.4
28.
Con
gest
ion:
all
type
s of v
ehic
les
11.9
2 ±
2.62
*7.
92 ±
2.4
510
.61
± 3.
23*
6.57
± 2
.92
10.3
0 ±
2.79
*6.
41 ±
3.1
49.
Con
gest
ion:
bic
yclis
ts12
.58
± 2.
06*
7.33
± 2
.68
9.70
± 3
.59*
5.41
± 3
.21
9.02
± 3
.69*
5.75
± 3
.44
10. C
onfli
cts
12.1
2 ±
1.92
*8.
58 ±
2.3
49.
20 ±
3.9
8*4.
98 ±
3.3
28.
37 ±
3.7
7*5.
74 ±
3.5
311
. Bic
ycle
pat
hs†
6.42
± 1
.50
6.79
± 1
.18
6.93
± 1
.94
7.79
± 2
.35
6.84
± 2
.17
7.45
± 2
.50
12. T
raffi
c: u
nsaf
e or
safe
6.39
± 2
.46
9.43
± 1
.83*
8.82
± 3
.42
12.0
0 ±
2.29
*8.
82 ±
3.3
711
.41
± 2.
54*
13. G
reen
ery
5.58
± 2
.52
9.83
± 2
.18*
7.48
± 3
.77
10.8
6 ±
2.81
*7.
57 ±
3.6
210
.18
± 2.
81*
14. U
gly
or b
eaut
iful
10.5
8 ±
2.81
*7.
79 ±
2.7
011
.20
± 2.
8110
.16
± 3.
4110
.73
± 2.
659.
77 ±
3.0
615
. Cou
rse
of th
e ro
ute
10.5
0 ±
3.16
9.83
± 3
.04
7.50
± 3
.47*
5.07
± 3
.55
7.11
± 3
.48*
5.36
± 2
.98
16. H
illin
ess
7.29
± 2
.69
9.00
± 1
.96*
4.77
± 3
.44
6.39
± 3
.92*
5.39
± 3
.53
6.52
± 3
.62*
17. R
ed li
ghts
11.0
4 ±
3.37
*8.
54 ±
3.7
48.
39 ±
3.8
6*4.
48 ±
3.4
78.
14 ±
3.8
3*5.
16 ±
3.4
518
. Sho
rt or
long
‡-
-6.
73 ±
2.1
76.
86 ±
2.7
47.
32 ±
1.9
07.
11 ±
2.3
2*F
orth
e ex
perts
, sig
nific
antly
hig
her (
p ≤
0.05
), an
d fo
r the
bic
ycle
com
mut
ers,
sign
ifica
ntly
hig
her (
p ≤
0.02
5), c
ompa
red
to th
e ot
her e
nviro
nmen
t.†M
inim
al v
alue
= 0
and
max
imal
val
ue =
10.
‡Not
ass
esse
d by
the
expe
rt pa
nel.
LINA WAHLGREN Studies on Bikeability in a Metropolitan Area... I 69
Table 8. Environment ratings by advertisement-recruited participants (Both I&S).
Mean ± SD.
Women (n = 286–302) Men (n = 247–253)Item Inner urban Suburban Inner urban Suburban1. On the whole 8.49 ± 3.41 11.25 ± 2.82* 8.49 ± 3.29 11.15 ± 2.68*2. Hinders or stimulates
9.13 ± 3.49 11.28 ± 2.93* 8.92 ± 3.08 10.82 ± 2.86*
3. Exhaust fumes 10.44 ± 3.24* 7.53 ± 3.46 9.02 ± 3.21* 6.36 ± 3.284. Noise 10.23 ± 3.11* 7.67 ± 3.60 8.74 ± 3.02* 6.84 ± 3.295. Flow of motor vehicles
11.43 ± 3.40* 8.18 ± 3.94 10.55 ± 3.67* 7.66 ± 3.79
6. Speeds of motor vehicles
9.74 ± 2.88* 8.99 ± 3.32 8.73 ± 2.77 8.79 ± 2.89
7. Speeds of bicyclists
9.94 ± 2.73 9.92 ± 2.59 7.76 ± 2.84 8.06 ± 2.62
8. Congestion: all types of vehicles
10.72 ± 3.52* 6.74 ± 3.42 10.14 ± 3.42* 5.46 ± 3.08
9. Congestion: bicyclists
9.31 ± 3.81* 6.26 ± 3.76 8.64 ± 3.90* 4.99 ± 3.29
10. Conflicts 8.14 ± 3.82* 5.44 ± 3.63 8.56 ± 3.77* 5.19 ± 3.4711. Bicycle paths†
6.37 ± 2.95 7.67 ± 2.35* 5.90 ± 2.77 7.42 ± 2.30*
12. Traffic: unsafe or safe
8.24 ± 3.89 11.29 ± 2.99* 8.68 ± 3.55 11.55 ± 2.82*
13. Greenery 7.09 ± 4.11 10.96 ± 3.43* 6.72 ± 3.88 10.84 ± 2.98*14. Ugly or beautiful
9.88 ± 3.35 10.74 ± 3.08* 9.84 ± 3.22 10.21 ± 2.99
15. Course of the route
6.98 ± 3.86* 5.41 ± 3.51 7.48 ± 4.01* 5.60 ± 3.65
16. Hilliness 5.20 ± 3.70 6.61 ± 4.16* 5.07 ± 3.44 6.24 ± 3.83*17. Red lights 8.06 ± 4.62* 3.98 ± 3.48 8.25 ± 4.33* 4.50 ± 3.4618. Short or long 6.78 ± 2.98 7.78 ± 3.02* 6.95 ± 2.32 7.85 ± 2.71**Significantly higher (p ≤ 0.025) compared to the other environment.†Minimal value = 0 and maximal value = 10.
5.1.2 Comparisons between the inner urban and suburban areas as well as with ratings of experts In Study I, significant differences were seen between ratings of inner urban and suburban environments in 12 of 17 items rated by the experts, and in 13 of 18 items rated by the bicycle commuters at both test and retest. A correspondence in both the significance and directions of the differences was noted in 10 of the 17 items for the two groups (Table 7).
There were only 3 significant differences between the bicycle commuters’ mean of the sizes of differences in ratings of inner urban and suburban environments at test and retest. The scores were therefore combined to give a test-retest mean for each item. The test-retest means were compared with the ratings of the experts. The sizes and directions of the differences in ratings of inner urban and suburban environments corresponded quite well
68 I LINA WAHLGREN Studies on Bikeability in a Metropolitan Area...
Table 7. Environment ratings by the experts and bicycle commuters at test and retest. Mean ± SD.
Experts (n = 22–24) Bicycle commuters (n = 43–44)Test Retest
Item Inner urban Suburban Inner urban Suburban Inner urban Suburban1. On the whole 8.21 ± 2.28 9.13 ± 2.33 9.43 ± 3.42 10.98 ± 2.80* 8.86 ± 3.15 10.63 ± 2.68*2. Hinders or stimulates 7.79 ± 3.06 8.96 ± 2.49 9.98 ± 3.29 11.23 ± 2.57* 9.18 ± 3.04 10.27 ± 2.86*3. Exhaust fumes 10.04 ± 2.60* 7.50 ± 2.83 9.98 ± 2.80* 7.91 ± 3.58 9.77 ± 3.09* 7.32 ± 3.634. Noise 11.50 ± 2.18* 9.45 ± 2.28 9.98 ± 2.77* 8.50 ± 3.35 9.91 ± 2.44* 8.52 ± 3.625. Flow of motor vehicles 12.09 ± 2.27* 9.30 ± 3.02 12.27 ± 2.64* 9.98 ± 3.73 11.41 ± 2.30* 8.91 ± 3.846. Speeds of motor vehicles 9.00 ± 2.73 10.52 ± 2.41* 8.95 ± 2.80 9.41 ± 2.68 9.25 ± 2.60 9.23 ± 2.817. Speeds of bicyclists 9.38 ± 2.99 10.62 ± 2.20 8.73 ± 2.73 9.11 ± 2.46 8.91 ± 2.68 8.98 ± 2.428. Congestion: all types of vehicles 11.92 ± 2.62* 7.92 ± 2.45 10.61 ± 3.23* 6.57 ± 2.92 10.30 ± 2.79* 6.41 ± 3.149. Congestion: bicyclists 12.58 ± 2.06* 7.33 ± 2.68 9.70 ± 3.59* 5.41 ± 3.21 9.02 ± 3.69* 5.75 ± 3.4410. Conflicts 12.12 ± 1.92* 8.58 ± 2.34 9.20 ± 3.98* 4.98 ± 3.32 8.37 ± 3.77* 5.74 ± 3.5311. Bicycle paths† 6.42 ± 1.50 6.79 ± 1.18 6.93 ± 1.94 7.79 ± 2.35 6.84 ± 2.17 7.45 ± 2.5012. Traffic: unsafe or safe 6.39 ± 2.46 9.43 ± 1.83* 8.82 ± 3.42 12.00 ± 2.29* 8.82 ± 3.37 11.41 ± 2.54*13. Greenery 5.58 ± 2.52 9.83 ± 2.18* 7.48 ± 3.77 10.86 ± 2.81* 7.57 ± 3.62 10.18 ± 2.81*14. Ugly or beautiful 10.58 ± 2.81* 7.79 ± 2.70 11.20 ± 2.81 10.16 ± 3.41 10.73 ± 2.65 9.77 ± 3.0615. Course of the route 10.50 ± 3.16 9.83 ± 3.04 7.50 ± 3.47* 5.07 ± 3.55 7.11 ± 3.48* 5.36 ± 2.9816. Hilliness 7.29 ± 2.69 9.00 ± 1.96* 4.77 ± 3.44 6.39 ± 3.92* 5.39 ± 3.53 6.52 ± 3.62*17. Red lights 11.04 ± 3.37* 8.54 ± 3.74 8.39 ± 3.86* 4.48 ± 3.47 8.14 ± 3.83* 5.16 ± 3.4518. Short or long‡ - - 6.73 ± 2.17 6.86 ± 2.74 7.32 ± 1.90 7.11 ± 2.32*For the experts, significantly higher (p ≤ 0.05), and for the bicycle commuters, significantly higher (p ≤ 0.025), compared to the other environment.†Minimal value = 0 and maximal value = 10.‡Not assessed by the expert panel.
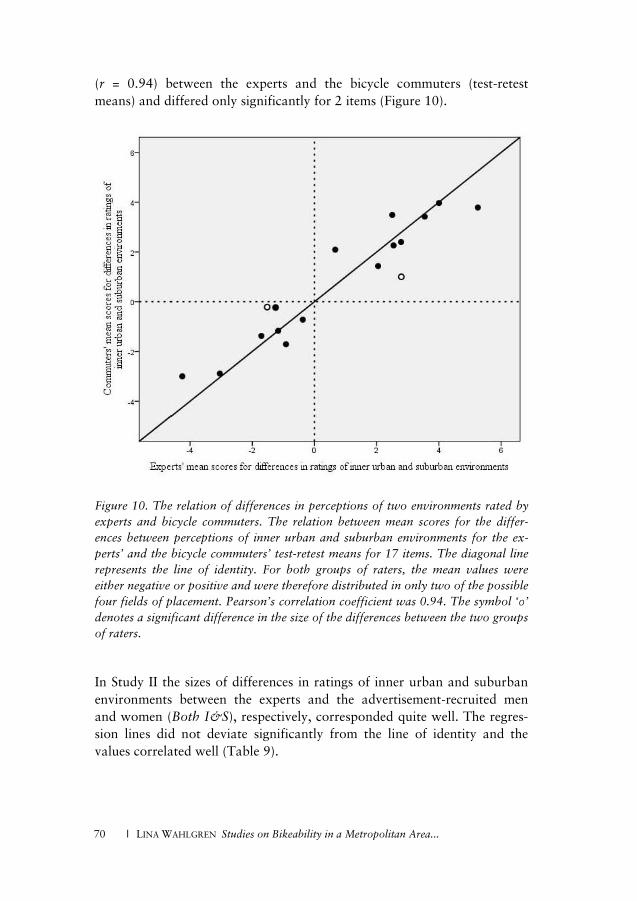
70 I LINA WAHLGREN Studies on Bikeability in a Metropolitan Area...
(r = 0.94) between the experts and the bicycle commuters (test-retest means) and differed only significantly for 2 items (Figure 10).
Figure 10. The relation of differences in perceptions of two environments rated by experts and bicycle commuters. The relation between mean scores for the differ-ences between perceptions of inner urban and suburban environments for the ex-perts’ and the bicycle commuters’ test-retest means for 17 items. The diagonal line represents the line of identity. For both groups of raters, the mean values were either negative or positive and were therefore distributed in only two of the possible four fields of placement. Pearson’s correlation coefficient was 0.94. The symbol ‘’ denotes a significant difference in the size of the differences between the two groups of raters.
In Study II the sizes of differences in ratings of inner urban and suburban environments between the experts and the advertisement-recruited men and women (Both I&S), respectively, corresponded quite well. The regres-sion lines did not deviate significantly from the line of identity and the values correlated well (Table 9).
LINA WAHLGREN Studies on Bikeability in a Metropolitan Area... I 71
Table 9. The y-intercept and slope with the 95% confidence interval (95% CI) of
the linear regression equation, and Pearsons’s correlation coefficient (r), for adver-tisement-recruited participants (Both I&S) in relation to those of the experts and the street-recruited participants. The regression lines were not considered to deviate
significantly if the 95% CI included 1.0 for the slope and 0.0 for the y-intercept (line of identity: slope = 1.0 and y-intercept = 0.0). All linear regression analyses were initially performed with the advertisement-recruited participants’ values
placed alternately on the y- and x-axes. The interpretation of similarity to the line of identity only differed for two cases and the differences were of a minor magni-tude. The experts’ and the street-recruited participants’ values were placed on the
x-axis. For comparison between the advertisement- (Both I&S) and the street-recruited participants, the men’s and women’s ratings were combined to give ‘sex-neutral’ means.
Y-intercept (95% CI) Slope (95% CI) rSizes of differences in ratings of inner urban and suburban environments
Advertisement-recruited women in relation to experts
-0.03 (-0.80–0.75) 0.84 (0.55–1.12) 0.85
Advertisement-recruited men in relation to experts
-0.05 (-0.71–0.61) 0.90 (0.66–1.14) 0.90
Sex-neutral meansInner urban: advertisement- in relation to street- recruited participants
0.59 (-0.30–1.49) 0.90 (0.80–1.01) 0.98
Suburban: advertisement- in relation to street- recruited participants
-0.63 (-2.08–0.81) 1.05 (0.88–1.22) 0.96
Sex-neutral means for standard deviationsInner urban: advertisement- in relation to street- recruited participants
0.74 (0.17–1.30) 0.85 (0.67–1.03) 0.93
Suburban: advertisement- in relation to street- recruited participants
0.60 (-0.01–1.21) 0.84 (0.65–1.04) 0.92
Sex-neutral means of sizes of differences in ratings of the inner urban and suburban route environments
Advertisement- in relation to street-recruited participants
-0.19 (-0.44–0.06) 1.29 (1.17–1.42) 0.98

72 I LINA WAHLGREN Studies on Bikeability in a Metropolitan Area...
5.2 Test-retest reproducibility in ratings of inner urban and suburban environments (Study I) The test-retest reproducibility assessments of the inner urban environments showed: (a) order effects in 4 items; (b) a range of the typical errors from 0.93 to 2.54; and (c) a range of the ICCs from ‘moderate’ (0.42) to ‘almost perfect’ (0.87). Six items had a ‘moderate’ ICC value, 10 items had a ‘sub-stantial’ value and 2 items had an ‘almost perfect’ value (Table 10).
The test-retest reproducibility assessments of the suburban environments showed: (a) order effects in 2 items; (b) a range of the typical errors from 1.11 to 2.38; and (c) a range of the ICCs from ‘moderate’ (0.46) to ‘almost perfect’ (0.82). Six items had a ‘moderate’ ICC value, 11 items had a ‘sub-stantial’ value and 1 item had an ‘almost perfect’ value (Table 11).
L
INA
WA
HL
GR
EN S
tudi
es o
n B
ikea
bilit
y in
a M
etro
polit
an A
rea.
.. I
73
T
able
10.
Tes
t-re
test
rep
rodu
cibi
lity
of t
he in
ner
urba
n en
viro
nmen
t ra
ted
by b
icyc
le c
omm
uter
s (n
= 5
2–53
).
Tes
tR
etes
tT
ypic
al e
rror
ICC
(95%
CI)
†It
emM
ean
±SD
Min
–m
axM
ean
±SD
Min
–m
ax1.
On
the
who
le9.
58 ±
3.25
3–15
9.06
±3.
073–
141.
510.
76 (0
.62–
0.86
)2.
Hin
ders
or s
timul
ates
10.0
2 ±
3.19
*3–
159.
26 ±
2.97
2–15
1.48
0.75
(0.6
0–0.
84)
3. E
xhau
st fu
mes
9.92
±2.
843–
159.
87 ±
2.96
3–15
1.88
0.58
(0.3
8–0.
74)
4. N
oise
10.0
2 ±
2.74
4–15
9.96
±2.
374–
151.
960.
42 (0
.17–
0.62
)5.
Flo
w o
f mot
or v
ehic
les
12.0
9 ±
2.68
4–15
11.5
1 ±
2.30
5–15
1.60
0.57
(0.3
6–0.
73)
6. S
peed
s of m
otor
veh
icle
s8.
92 ±
2.77
1–15
9.28
±2.
544–
141.
860.
51 (0
.28–
0.68
)7.
Spe
eds o
f bic
yclis
ts8.
77 ±
2.65
4–15
8.94
±2.
623–
140.
930.
87 (0
.79–
0.93
)8.
Con
gest
ion:
all t
ypes
of v
ehic
les
10.6
0 ±
3.18
2–15
10.2
6 ±
2.80
3–15
1.45
0.76
(0.6
3–0.
86)
9. C
onge
stio
n: b
icyc
lists
9.72
±3.
46*
2–15
8.96
±3.
511–
141.
370.
83 (0
.72–
0.90
)10
. Con
flict
s9.
31 ±
3.97
*1–
158.
50 ±
3.66
1–15
1.96
0.72
(0.5
6–0.
83)
11. B
icyc
le p
aths
‡6.
70 ±
2.07
2–10
6.72
±2.
161–
101.
230.
67 (0
.49–
0.79
)12
. Tra
ffic:
uns
afe
or sa
fe8.
89 ±
3.44
1–15
8.94
±3.
303–
151.
940.
67 (0
.50–
0.80
)13
. Gre
ener
y7.
08 ±
3.82
1–15
7.45
±3.
521–
142.
040.
69 (0
.52–
0.81
)14
. Ugl
y or
bea
utifu
l11
.38
±2.
685–
1511
.04
±2.
673–
151.
530.
67 (0
.49–
0.79
)15
. Cou
rse
of th
e ro
ute
7.34
±3.
541–
147.
08 ±
3.50
1–14
2.54
0.48
(0.2
5–0.
67)
16. H
illin
ess
4.74
±3.
291–
125.
62 ±
3.50
*1–
142.
230.
55 (0
.33–
0.71
)17
. Red
ligh
ts8.
29 ±
4.03
1–15
8.37
±3.
761–
152.
460.
61 (0
.40–
0.75
)18
. Sho
rt or
long
6.53
±2.
222–
106.
94 ±
2.06
2–12
1.26
0.64
(0.4
6–0.
78)
*Sig
nific
antly
hig
her (
p ≤
0.05
) com
pare
d to
the
othe
r tes
tocc
asio
n.Th
is in
dica
tes a
n or
der e
ffect
.†I
ntra
clas
s cor
rela
tion
coef
ficie
nt w
ith 9
5% c
onfid
ence
inte
rval
.‡M
inim
al v
alue
= 0
and
max
imal
val
ue =
10.
LINA WAHLGREN Studies on Bikeability in a Metropolitan Area... I 73
Table 10. Test-retest reproducibility of the inner urban environment rated by bicycle commuters (n = 52–53).
Test Retest Typical error ICC (95% CI)†Item Mean ± SD Min – max Mean ± SD Min – max1. On the whole 9.58 ± 3.25 3–15 9.06 ± 3.07 3–14 1.51 0.76 (0.62–0.86)2. Hinders or stimulates 10.02 ± 3.19* 3–15 9.26 ± 2.97 2–15 1.48 0.75 (0.60–0.84)3. Exhaust fumes 9.92 ± 2.84 3–15 9.87 ± 2.96 3–15 1.88 0.58 (0.38–0.74)4. Noise 10.02 ± 2.74 4–15 9.96 ± 2.37 4–15 1.96 0.42 (0.17–0.62)5. Flow of motor vehicles 12.09 ± 2.68 4–15 11.51 ± 2.30 5–15 1.60 0.57 (0.36–0.73)6. Speeds of motor vehicles 8.92 ± 2.77 1–15 9.28 ± 2.54 4–14 1.86 0.51 (0.28–0.68)7. Speeds of bicyclists 8.77 ± 2.65 4–15 8.94 ± 2.62 3–14 0.93 0.87 (0.79–0.93)8. Congestion: all types of vehicles 10.60 ± 3.18 2–15 10.26 ± 2.80 3–15 1.45 0.76 (0.63–0.86)9. Congestion: bicyclists 9.72 ± 3.46* 2–15 8.96 ± 3.51 1–14 1.37 0.83 (0.72–0.90)10. Conflicts 9.31 ± 3.97* 1–15 8.50 ± 3.66 1–15 1.96 0.72 (0.56–0.83)11. Bicycle paths‡ 6.70 ± 2.07 2–10 6.72 ± 2.16 1–10 1.23 0.67 (0.49–0.79)12. Traffic: unsafe or safe 8.89 ± 3.44 1–15 8.94 ± 3.30 3–15 1.94 0.67 (0.50–0.80)13. Greenery 7.08 ± 3.82 1–15 7.45 ± 3.52 1–14 2.04 0.69 (0.52–0.81)14. Ugly or beautiful 11.38 ± 2.68 5–15 11.04 ± 2.67 3–15 1.53 0.67 (0.49–0.79)15. Course of the route 7.34 ± 3.54 1–14 7.08 ± 3.50 1–14 2.54 0.48 (0.25–0.67)16. Hilliness 4.74 ± 3.29 1–12 5.62 ± 3.50* 1–14 2.23 0.55 (0.33–0.71)17. Red lights 8.29 ± 4.03 1–15 8.37 ± 3.76 1–15 2.46 0.61 (0.40–0.75)18. Short or long 6.53 ± 2.22 2–10 6.94 ± 2.06 2–12 1.26 0.64 (0.46–0.78)*Significantly higher (p ≤ 0.05) compared to the other test occasion. This indicates an order effect.†Intraclass correlation coefficient with 95% confidence interval.‡Minimal value = 0 and maximal value = 10.

74
I L
INA
WA
HL
GR
EN St
udie
s on
Bik
eabi
lity
in a
Met
ropo
litan
Are
a...
Tab
le 1
1. T
est-
rete
st r
epro
duci
bilit
y of
the
sub
urba
n en
viro
nmen
t ra
ted
by b
icyc
le c
omm
uter
s (n
= 4
4–45
).
Tes
tR
etes
tT
ypic
al e
rror
ICC
(95%
CI)
Item
Mea
n ±
SDM
in –
max
Mea
n ±
SDM
in –
max
1. O
n th
ew
hole
11.0
7 ±
2.86
4–15
10.7
3 ±
2.73
5–15
1.58
0.68
(0.4
9–0.
81)
2. H
inde
rs o
r stim
ulat
es11
.31
±2.
60*
4–15
10.3
8 ±
2.91
3–15
1.61
0.62
(0.4
0–0.
77)
3. E
xhau
st fu
mes
7.78
±3.
651–
157.
20 ±
3.67
1–15
1.96
0.71
(0.5
2–0.
83)
4. N
oise
8.36
±3.
451–
148.
38 ±
3.71
1–15
2.10
0.66
(0.4
6–0.
80)
5. F
low
of m
otor
veh
icle
s9.
80 ±
3.88
*2–
158.
78 ±
3.90
2–15
2.25
0.64
(0.4
4–0.
79)
6. S
peed
s of m
otor
veh
icle
s9.
22 ±
2.93
1–15
9.07
±2.
982–
142.
190.
46 (0
.20–
0.66
)7.
Spe
eds o
f bic
yclis
ts9.
11 ±
2.46
5–15
8.95
±2.
404–
141.
110.
79 (0
.65–
0.88
)8.
Con
gest
ion:
all
type
s of v
ehic
les
6.47
±2.
971–
136.
31 ±
3.17
1–13
2.11
0.53
(0.2
9–0.
71)
9. C
onge
stio
n: b
icyc
lists
5.40
±3.
171–
125.
67 ±
3.45
1–13
1.53
0.79
(0.6
5–0.
88)
10. C
onfli
cts
5.02
±3.
281–
135.
75 ±
3.48
1–13
2.23
0.56
(0.3
1–0.
73)
11. B
icyc
le p
aths
‡7.
82 ±
2.33
2–10
7.48
±2.
512–
101.
590.
57 (0
.33–
0.74
)12
. Tra
ffic:
uns
afe
or sa
fe12
.04
±2.
296–
1511
.49
±2.
566–
151.
650.
53 (0
.28–
0.71
)13
. Gre
ener
y10
.93
±2.
822–
1510
.29
±2.
872–
151.
750.
61 (0
.38–
0.76
)14
. Ugl
y or
bea
utifu
l10
.27
±3.
454–
159.
89 ±
3.12
3–15
1.39
0.82
(0.6
9–0.
90)
15. C
ours
e of
the
rout
e4.
98 ±
3.56
1–13
5.29
±2.
991–
111.
900.
67 (0
.47–
0.80
)16
. Hill
ines
s6.
27 ±
3.96
1–14
6.56
±3.
591–
132.
380.
61 (0
.39–
0.76
)17
. Red
ligh
ts4.
40 ±
3.47
1–15
4.98
±3.
481–
142.
210.
59 (0
.37–
0.75
)18
. Sho
rt or
long
6.89
±2.
721–
127.
13 ±
2.30
1–10
1.46
0.67
(0.4
7–0.
80)
*Sig
nific
antly
hig
her (
p ≤
0.05
) com
pare
d to
the
othe
r tes
t occ
asio
n.†I
ntra
clas
s cor
rela
tion
coef
ficie
nt w
ith 9
5% c
onfid
ence
inte
rval
.‡M
inim
al v
alue
= 0
and
max
imal
val
ue =
10.
LINA WAHLGREN Studies on Bikeability in a Metropolitan Area... I 75
5.3 Representativity: relations between ratings of advertisement- and street-recruited participants (Study II) The sex-neutral means corresponded quite well between the advertisement- (Both I&S) and the street-recruited participants for both the inner urban and the suburban environments (Figures 11 and 12). The regression lines did not deviate significantly and the values correlated well (Table 9). In general, the sex-neutral means for the standard deviations corresponded reasonably well between the advertisement- and the street-recruited par-ticipants for both the inner urban and the suburban environment (Table 9).
Figure 11. Relationship between advertisement- (Both I&S) and street-recruited participants’ ratings of inner urban route environments. The mean values are ex-pressed as sex-neutral means. The solid diagonal line represents the line of identity (slope = 1.0 and y-intercept = 0.0). The dotted line represents the linear regression line. The regression line (y = 0.59 + 0.90 x) did not deviate significantly from the line of identity (Table 9). Pearson’s correlation was 0.98.
74 I LINA WAHLGREN Studies on Bikeability in a Metropolitan Area...
Table 11. Test-retest reproducibility of the suburban environment rated by bicycle commuters (n = 44–45).
Test Retest Typical error ICC (95% CI)Item Mean ± SD Min – max Mean ± SD Min – max1. On the whole 11.07 ± 2.86 4–15 10.73 ± 2.73 5–15 1.58 0.68 (0.49–0.81)2. Hinders or stimulates 11.31 ± 2.60* 4–15 10.38 ± 2.91 3–15 1.61 0.62 (0.40–0.77)3. Exhaust fumes 7.78 ± 3.65 1–15 7.20 ± 3.67 1–15 1.96 0.71 (0.52–0.83)4. Noise 8.36 ± 3.45 1–14 8.38 ± 3.71 1–15 2.10 0.66 (0.46–0.80)5. Flow of motor vehicles 9.80 ± 3.88* 2–15 8.78 ± 3.90 2–15 2.25 0.64 (0.44–0.79)6. Speeds of motor vehicles 9.22 ± 2.93 1–15 9.07 ± 2.98 2–14 2.19 0.46 (0.20–0.66)7. Speeds of bicyclists 9.11 ± 2.46 5–15 8.95 ± 2.40 4–14 1.11 0.79 (0.65–0.88)8. Congestion: all types of vehicles 6.47 ± 2.97 1–13 6.31 ± 3.17 1–13 2.11 0.53 (0.29–0.71)9. Congestion: bicyclists 5.40 ± 3.17 1–12 5.67 ± 3.45 1–13 1.53 0.79 (0.65–0.88)10. Conflicts 5.02 ± 3.28 1–13 5.75 ± 3.48 1–13 2.23 0.56 (0.31–0.73)11. Bicycle paths‡ 7.82 ± 2.33 2–10 7.48 ± 2.51 2–10 1.59 0.57 (0.33–0.74)12. Traffic: unsafe or safe 12.04 ± 2.29 6–15 11.49 ± 2.56 6–15 1.65 0.53 (0.28–0.71)13. Greenery 10.93 ± 2.82 2–15 10.29 ± 2.87 2–15 1.75 0.61 (0.38–0.76)14. Ugly or beautiful 10.27 ± 3.45 4–15 9.89 ± 3.12 3–15 1.39 0.82 (0.69–0.90)15. Course of the route 4.98 ± 3.56 1–13 5.29 ± 2.99 1–11 1.90 0.67 (0.47–0.80)16. Hilliness 6.27 ± 3.96 1–14 6.56 ± 3.59 1–13 2.38 0.61 (0.39–0.76)17. Red lights 4.40 ± 3.47 1–15 4.98 ± 3.48 1–14 2.21 0.59 (0.37–0.75)18. Short or long 6.89 ± 2.72 1–12 7.13 ± 2.30 1–10 1.46 0.67 (0.47–0.80)*Significantly higher (p ≤ 0.05) compared to the other test occasion.†Intraclass correlation coefficient with 95% confidence interval.‡Minimal value = 0 and maximal value = 10.

76 I LINA WAHLGREN Studies on Bikeability in a Metropolitan Area...
Figure 12. Relationship between advertisement- (Both I&S) and street-recruited participants’ ratings of suburban route environments. The mean values are ex-pressed as sex-neutral means. The solid diagonal line represents the line of identity (slope = 1.0 and y-intercept = 0.0). The dotted line represents the linear regression line. The regression line (y = -0.63 + 1.05 x) did not deviate significantly from the line of identity (Table 9). Pearson’s correlation was 0.96.
Among the street-recruited participants, significant differences were seen between ratings of inner urban and suburban environments in 10 of 18 items rated by the women and in 15 of 18 items rated by the men. Corre-spondence in both significance and direction of the differences was seen between the advertisement- (Both I&S) and the street-recruited partici-pants in 10 of the 18 items for the women and in 14 of the 18 items for the men (Tables 8 and 12).
LINA WAHLGREN Studies on Bikeability in a Metropolitan Area... I 77
Table 12. Environment ratings by street-recruited participants. Mean ± SD.
Women (n = 32–33) Men (n = 58–60)Item Inner urban Suburban Inner urban Suburban1. On the whole 10.03 ± 2.55 10.78 ± 2.95 8.19 ± 3.61 10.24 ± 2.77*2. Hinders or stimulates
10.58 ± 2.80 10.85 ± 3.03 8.90 ± 3.29 10.66 ± 2.65*
3. Exhaust fumes 10.18 ± 3.14* 8.61 ± 2.84 9.68 ± 3.00* 7.52 ± 3.394. Noise 10.06 ± 3.17* 8.24 ± 3.10 9.83 ± 2.66* 8.52 ± 3.465. Flow of motor vehicles
11.73 ± 3.46* 9.45 ± 3.75 11.38 ± 2.63* 9.53 ± 3.95
6. Speeds of motor vehicles
9.53 ± 2.59 9.59 ± 2.34 8.92 ± 2.77 9.31 ± 2.76
7. Speeds of bicyclists
10.15 ± 2.74 9.67 ± 2.57 7.85 ± 2.04 8.55 ± 2.00*
8. Congestion: all types of vehicles
10.63 ± 3.14* 7.50 ± 2.63 10.53 ± 3.10* 6.53 ± 3.11
9. Congestion: bicyclists
9.61 ± 4.03* 6.48 ± 3.35 8.17 ± 3.81* 5.15 ± 3.27
10. Conflicts 8.42 ± 3.89* 5.70 ± 3.65 8.43 ± 3.97* 5.38 ± 3.3711. Bicycle paths†
7.22 ± 2.27 7.91 ± 2.18 6.44 ± 2.47 7.46 ± 2.49*
12. Traffic: unsafe or safe
9.42 ± 3.47 11.45 ± 2.59* 8.77 ± 3.22 11.62 ± 2.58*
13. Greenery 8.12 ± 3.45 9.91 ± 3.47* 6.14 ± 3.42 10.20 ± 3.18*14. Ugly or beautiful
11.42 ± 2.96 11.12 ± 3.04 9.47 ± 3.32 9.18 ± 3.29
15. Course of the route
6.59 ± 3.79* 5.38 ± 3.66 7.35 ± 3.24* 5.38 ± 3.38
16. Hilliness 5.82 ± 3.81 6.21 ± 3.87 4.70 ± 3.30 6.52 ± 3.88*17. Red lights 8.09 ± 4.38* 5.33 ± 3.59 7.65 ± 3.93* 4.23 ± 3.3818. Short or long 6.58 ± 2.37 6.91 ± 3.22 6.45 ± 2.22 7.20 ± 2.48*Significantly higher (p ≤ 0.05) compared to the other environment.†Minimal value = 0 and maximal value = 10.
The sex-neutral means of the sizes of differences in ratings of the inner urban and suburban route environments corresponded reasonably well between the advertisement- (Both I&S) and the street-recruited partici-pants. The regression line deviated slightly from the line of identity, but the values correlated well (Table 9).
5.4 Commuting route environment profiles: comparisons between the inner urban and suburban areas, as well as between subgroups (Study II) Significant differences between ratings of inner urban and suburban envi-ronments were seen in 17 of 18 items and in 15 of 18 items rated by the advertisement-recruited women and men (Both I&S), respectively. Corre-spondence between male and female raters in both the significance and direction of the differences was noted in 15 of the 18 items (Table 8).

78 I LINA WAHLGREN Studies on Bikeability in a Metropolitan Area...
Significant differences were seen between ratings of inner urban and suburban route environments on all of 18 items rated by Only I women and Only S women, and on 15 of 18 items rated by Only I men and Only S men. Correspondence between men and women in both the significance and direction of the differences was noted in 15 of the 18 items (Table 13). Table 13. Environment ratings by advertisement-recruited participants bicycle-
commuting in the inner urban or suburban area (Only I and Only S). Mean ± SD.
Women MenItem Only I†
(n = 194–197)
Only S†(n = 394–
399)
Only I(n = 74–
75)
Only S(n = 151–
153)1. On the whole 8.72 ± 3.35 11.63 ± 2.75* 8.47 ± 3.33 11.14 ± 2.66*2. Hinders or stimulates
9.52 ± 3.52 11.73 ± 2.70* 9.15 ± 2.78 11.08 ± 2.83*
3. Exhaust fumes 10.16 ± 2.86* 6.47 ± 3.75 10.15 ± 2.74* 6.35 ± 3.404. Noise 9.78 ± 2.78* 6.56 ± 3.75 9.79 ± 2.78* 6.78 ± 3.195. Flow of motor vehicles
11.35 ± 2.93* 6.99 ± 4.13 11.27 ± 2.69* 7.35 ± 3.55
6. Speeds of motor vehicles
10.16 ± 2.63* 7.81 ± 3.34 8.91 ± 2.73 8.14 ± 3.15
7. Speeds of bicyclists
9.91 ± 2.42* 8.64 ± 2.51 8.77 ± 2.59* 7.80 ± 1.94
8. Congestion: all types of vehicles
10.33 ± 2.97* 5.35 ± 3.55 10.77 ± 2.70* 5.69 ± 3.23
9. Congestion: bicyclists
9.01 ± 3.33* 3.84 ± 2.98 8.20 ± 3.67* 3.50 ± 2.52
10. Conflicts 7.81 ± 3.60* 4.49 ± 3.44 9.08 ± 3.38* 5.01 ± 3.5411. Bicycle paths‡
5.45 ± 2.76 6.65 ± 2.84* 4.73 ± 2.88 6.18 ± 2.78*
12. Traffic: unsafe or safe
8.66 ± 3.59 11.61 ± 3.10* 8.81 ± 3.54 11.46 ± 2.76*
13. Greenery 7.43 ± 4.17 12.04 ± 2.88* 7.33 ± 3.71 11.39 ± 2.84*14. Ugly or beautiful
10.62 ± 3.32 11.28 ± 2.73* 10.68 ± 2.93 10.53 ± 2.68
15. Course of the route
6.25 ± 3.43* 4.74 ± 3.45 7.29 ± 3.86* 5.31 ± 3.18
16. Hilliness 4.81 ± 3.46 5.78 ± 3.91* 5.56 ± 3.48 5.93 ± 3.8417. Red lights 7.87 ± 3.98* 3.62 ± 3.52 9.27 ± 3.61* 3.90 ± 3.2018. Short or long 5.26 ± 2.64 6.46 ± 3.37* 5.52 ± 2.75 7.08 ± 2.87**Significantly higher (p ≤ 0.025) compared to the other group.†Only I = those who bicycle-commuted in only the inner urban area, and Only S = those who bicycle-commuted in only the suburban area.‡Minimal value = 0 and maximal value = 10.
Altogether (Both I&S, Only I and Only S, categorized as men and women), both the significance and direction of the differences between the inner urban and the suburban environments corresponded in 14 of the 18 items. For all of these four groups, significantly higher values for the inner urban than for the suburban environments were seen for the items: exhaust fumes, noise, flow of motor vehicles, congestion: all types of vehicles, con-
LINA WAHLGREN Studies on Bikeability in a Metropolitan Area... I 79
gestion: bicyclists, conflicts, course of the route and red lights. The oppo-site, significantly higher values for the suburban environments than for the inner urban ones, were seen for the items: on the whole, hinders or stimu-lates, bicycle paths, traffic: unsafe or safe, greenery and short or long (Ta-bles 8 and 13, and Figures 13 and 14).
Figure 13. Commuting route environment profiles for women cycling in the inner urban and suburban areas. Advertisement-recruited participants: Both I&S = those who bicycle-commuted in both the inner urban and suburban areas, Only I = those who bicycle-commuted in only the inner urban area and Only S = those who bicy-cle-commuted in only the suburban area. Unfilled symbols represent ratings of the inner urban route environments. Filled symbols represent the suburban route envi-ronments. *Minimal value = 0 and maximal value = 10.
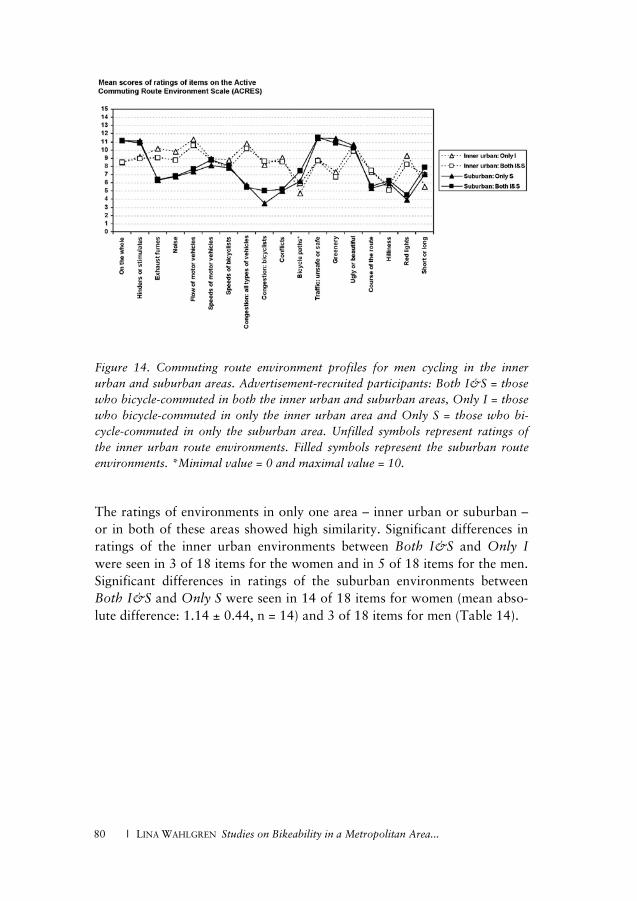
80 I LINA WAHLGREN Studies on Bikeability in a Metropolitan Area...
Figure 14. Commuting route environment profiles for men cycling in the inner urban and suburban areas. Advertisement-recruited participants: Both I&S = those who bicycle-commuted in both the inner urban and suburban areas, Only I = those who bicycle-commuted in only the inner urban area and Only S = those who bi-cycle-commuted in only the suburban area. Unfilled symbols represent ratings of the inner urban route environments. Filled symbols represent the suburban route environments. *Minimal value = 0 and maximal value = 10.
The ratings of environments in only one area – inner urban or suburban – or in both of these areas showed high similarity. Significant differences in ratings of the inner urban environments between Both I&S and Only I were seen in 3 of 18 items for the women and in 5 of 18 items for the men. Significant differences in ratings of the suburban environments between Both I&S and Only S were seen in 14 of 18 items for women (mean abso-lute difference: 1.14 ± 0.44, n = 14) and 3 of 18 items for men (Table 14).
LINA WAHLGREN Studies on Bikeability in a Metropolitan Area... I 81
Table 14. Differences in ratings of route environments by subgroups of advertise-
ment-recruited participants (Both I&S and Only I or Only S). Mean ± standard error of difference (SEd).
Inner urban: Difference:Only I† and Both I&S†
Suburban: Difference:Only S† and Both I&S
Item Women Men Women Men1. On the whole 0.24 ± 0.32 -0.02 ± 0.44 0.38 ± 0.22 -0.01 ± 0.282. Hinders or stimulates
0.39 ± 0.32 0.24 ± 0.40 0.45 ± 0.22 0.27 ± 0.29
3. Exhaust fumes -0.28 ± 0.28 1.12 ± 0.41* -1.06 ± 0.27* -0.01 ± 0.344. Noise -0.45 ± 0.27 1.05 ± 0.39* -1.09 ± 0.28* -0.05 ± 0.335. Flow of motorvehicles
-0.09 ± 0.29 0.70 ± 0.39 -1.19 ± 0.31* -0.32 ± 0.38
6. Speeds of motor vehicles
0.42 ± 0.25 0.18 ± 0.36 -1.18 ± 0.25* -0.65 ± 0.31
7. Speeds of bicyclists
-0.03 ± 0.24 1.01 ± 0.37* -1.28 ± 0.20* -0.25 ± 0.23
8. Congestion: all types of vehicles
-0.40 ± 0.29 0.66 ± 0.38 -1.38 ± 0.27* 0.23 ± 0.32
9. Congestion: bicyclists
-0.30 ± 0.32 -0.44 ± 0.51 -2.42 ± 0.26* -1.49 ± 0.29*
10. Conflicts -0.33 ± 0.34 0.52 ± 0.48 -0.95 ± 0.27* -0.16 ± 0.3611. Bicycle paths‡
-0.93 ± 0.26* -1.15 ± 0.37* -1.01 ± 0.20* -1.24 ± 0.27*
12. Traffic: unsafe or safe
0.43 ± 0.35 0.13 ± 0.47 0.32 ± 0.23 -0.09 ± 0.29
13. Greenery 0.33 ± 0.38 0.61 ± 0.51 1.08 ± 0.24* 0.56 ± 0.3014. Ugly or beautiful
0.73 ± 0.31* 0.84 ± 0.42 0.53 ± 0.22* 0.32 ± 0.29
15. Course of the route
-0.72 ± 0.34 -0.19 ± 0.52 -0.68 ± 0.27* -0.29 ± 0.35
16. Hilliness -0.39 ± 0.33 0.49 ± 0.45 -0.83 ± 0.31* -0.31 ± 0.3917. Red lights -0.19 ± 0.39 1.02 ± 0.50 -0.36 ± 0.27 -0.60 ± 0.3418. Short or long -1.52 ± 0.26* -1.43 ± 0.35* -1.32 ± 0.24* -0.77 ± 0.29**Significant difference between groups (p ≤ 0.025).†Both I&S = those who bicycle-commuted in both the inner urban and suburban areas, Only I = those who bicycle-commuted in only the inner urban area and Only S = those who bicycle-commuted in only the suburban area.‡Minimal value = 0 and maximal value = 10.

82 I LINA WAHLGREN Studies on Bikeability in a Metropolitan Area...
5.5 Relations between environmental predictor variables and the outcome variable: hinders or stimulates
5.5.1 Correlations between predictors and the outcome variable Interrelations between all variables are shown in Table 15. The range for correlations between the outcome variable, hinders or stimulates, and the predictor variables was, in absolute values, r = 0.00–0.52. The following predictor variables had a positive correlation with the outcome variable: ugly or beautiful (r = 0.52), greenery (r = 0.48), traffic: unsafe or safe (r = 0.44) and bicycle paths (r = 0.21). The following predictor variables had a negative correlation with the outcome variable: congestion: bicyclists (r = -0.08), conflicts (r = -0.21), speeds of motor vehicles (r = -0.22), noise (r = -0.30), red lights (r = -0.30), course of the route (r = -0.31), flow of motor vehicles (r = -0.32), congestion: all types of vehicles (r = -0.32), exhaust fumes (r = -0.35). Speeds of bicyclists was close to no correlation with the outcome variable (r = 0.01) and hilliness had no correlation with the out-come variable (r = 0.00).
L
INA
WA
HL
GR
EN S
tudi
es o
n B
ikea
bilit
y in
a M
etro
polit
an A
rea.
.. I
83
T
able
15.
Cor
rela
tion
s be
twee
n en
viro
nmen
tal v
aria
bles
(n
= 81
8–82
7).
Var
iabl
e1
23
45
67
89
1011
1213
1415
16H
inde
rs o
r stim
ulat
es-
Exha
ust f
umes
-0.3
5*-
Noi
se-0
.30*
0.68
*-
Flow
of m
otor
veh
icle
s-0
.32*
0.58
*0.
60*
-Sp
eeds
of m
otor
veh
icle
s-0
.22*
0.35
*0.
43*
0.49
*-
Spee
ds o
f bic
yclis
ts0.
010.
20*
0.25
*0.
23*
0.39
*-
Con
gest
ion:
all
type
s of v
ehic
les
-0.3
2*0.
41*
0.40
*0.
50*
0.39
*0.
22*
-C
onge
stio
n: b
icyc
lists
-0.0
8*0.
22*
0.22
*0.
29*
0.24
*0.
39*
0.50
*-
Con
flict
s-0
.21*
0.23
*0.
19*
0.26
*0.
18*
0.09
*0.
45*
0.45
*-
Bic
ycle
pat
hs†
0.21
*-0
.05
0.03
-0.0
3-0
.05
0.14
*-0
.15*
0.14
*-0
.03
-Tr
affic
: uns
afe
or sa
fe0.
44*
-0.2
8*-0
.28*
-0.3
1*-0
.32*
-0.0
9*-0
.47*
-0.2
4*-0
.34*
0.26
*-
Gre
ener
y0.
48*
-0.3
2*-0
.28*
-0.3
0*-0
.18*
0.06
-0.3
1*-0
.07*
-0.1
4*0.
26*
0.37
*-
Ugl
y or
bea
utifu
l0.
52*
-0.2
1*-0
.23*
-0.1
8*-0
.11*
0.11
*-0
.12*
0.07
-0.0
60.
23*
0.28
*0.
54*
-C
ours
e of
the
rout
e-0
.31*
0.12
*0.
12*
0.15
*0.
12*
-0.0
8*0.
24*
0.17
*0.
30*
-0.1
5*-0
.34*
-0.1
7*-0
.18*
-H
illin
ess
0.00
0.01
0.05
0.05
0.05
0.13
*0.
09*
0.14
*0.
14*
0.05
-0.0
10.
030.
040.
19*
-R
ed li
ghts
-0.3
0*0.
28*
0.29
*0.
36*
0.21
*0.
000.
41*
0.19
*0.
32*
-0.1
3*-0
.31*
-0.3
2*-0
.18*
0.35
*0.
13*
-*p
≤ 0.
05.
†Min
imal
val
ue =
0 a
nd m
axim
al v
alue
= 1
0.
LINA WAHLGREN Studies on Bikeability in a Metropolitan Area... I 83
Table 15. Correlations between environmental variables (n = 818–827). Variable 1 2 3 4 5 6 7 8 9 10 11 12 13 14 15 16Hinders or stimulates -Exhaust fumes -0.35* -Noise -0.30* 0.68* -Flow of motor vehicles -0.32* 0.58* 0.60* -Speeds of motor vehicles -0.22* 0.35* 0.43* 0.49* -Speeds of bicyclists 0.01 0.20* 0.25* 0.23* 0.39* -Congestion: all types of vehicles -0.32* 0.41* 0.40* 0.50* 0.39* 0.22* -Congestion: bicyclists -0.08* 0.22* 0.22* 0.29* 0.24* 0.39* 0.50* -Conflicts -0.21* 0.23* 0.19* 0.26* 0.18* 0.09* 0.45* 0.45* -Bicycle paths† 0.21* -0.05 0.03 -0.03 -0.05 0.14* -0.15* 0.14* -0.03 -Traffic: unsafe or safe 0.44* -0.28* -0.28* -0.31* -0.32* -0.09* -0.47* -0.24* -0.34* 0.26* -Greenery 0.48* -0.32* -0.28* -0.30* -0.18* 0.06 -0.31* -0.07* -0.14* 0.26* 0.37* -Ugly or beautiful 0.52* -0.21* -0.23* -0.18* -0.11* 0.11* -0.12* 0.07 -0.06 0.23* 0.28* 0.54* -Course of the route -0.31* 0.12* 0.12* 0.15* 0.12* -0.08* 0.24* 0.17* 0.30* -0.15* -0.34* -0.17* -0.18* -Hilliness 0.00 0.01 0.05 0.05 0.05 0.13* 0.09* 0.14* 0.14* 0.05 -0.01 0.03 0.04 0.19* -Red lights -0.30* 0.28* 0.29* 0.36* 0.21* 0.00 0.41* 0.19* 0.32* -0.13* -0.31* -0.32* -0.18* 0.35* 0.13* -*p ≤ 0.05.†Minimal value = 0 and maximal value = 10.

84 I LINA WAHLGREN Studies on Bikeability in a Metropolitan Area...
5.5.2 Model results The results of the analysis for Model 1 are shown in Table 16. About 40% of the variance of the outcome variable, hinders or stimulates, was ex-plained by the environmental predictors in the model (R² = 0.415). The regression equation was y = 8.53 + 0.33 ugly or beautiful + 0.14 greenery + (-0.14) course of the route + (-0.13) exhaust fumes + (-0.09) congestion: all types of vehicles (p ≤ 0.019). Table 16. Simultaneous multiple regression analysis of route environment variables
(Model 1, excluding traffic: unsafe or safe) (n = 805).
Outcome variable y-intercept p-value 95% CIHinders or stimulates 8.53 0.000 7.34 – 9.72
Regression coefficient Partial correlationcoefficientPredictor variable B p-value 95% CI
Exhaust fumes -0.13 0.002 -0.21 – -0.05 -0.11Noise 0.01 0.800 -0.08 – 0.10 0.01Flow of motor vehicles -0.04 0.309 -0.12 – 0.04 -0.04Speeds of motor vehicles -0.04 0.368 -0.11 – 0.04 -0.03Speeds of bicyclists 0.00 0.905 -0.08 – 0.07 0.00Congestion: all types of vehicles -0.09 0.019 -0.17 – -0.02 -0.08Congestion: bicyclists 0.05 0.146 -0.02 – 0.11 0.05Conflicts -0.05 0.110 -0.11 – 0.01 -0.06Bicycle paths* 0.03 0.407 -0.04 – 0.10 0.03Traffic: unsafe or safe - - - -Greenery 0.14 0.000 0.09 – 0.20 0.18Ugly or beautiful 0.33 0.000 0.27 – 0.40 0.33Course of the route -0.14 0.000 -0.20 – -0.09 -0.19Hilliness 0.03 0.205 -0.02 – 0.09 0.05Red lights -0.02 0.394 -0.07 – 0.03 -0.03R² = 0.415.*Minimal value = 0 and maximal value = 10.
The results of the analysis for Model 2 are shown in Table 17. About
40% of the variance of the outcome variable: hinders or stimulates, was explained by the environmental predictors in the model (R² = 0.435). The regression equation was: y = 6.55 + 0.31 ugly or beautiful + 0.16 traffic: unsafe or safe + (-0.13) exhaust fumes + 0.12 greenery + (-0.12) course of the route (p ≤ 0.001).
LINA WAHLGREN Studies on Bikeability in a Metropolitan Area... I 85
Table 17. Simultaneous multiple regression analysis of route environment variables
(Model 2, including traffic: unsafe or safe) (n = 805).
Outcome variable y-intercept p-value 95% CIHinders or stimulates 6.55 0.000 5.17 – 7.93
Regression coefficient Partial correlationcoefficientPredictor variable B p-value 95% CI
Exhaust fumes -0.13 0.001 -0.21 – -0.05 -0.11Noise 0.01 0.733 -0.07 – 0.10 0.01Flow of motor vehicles -0.05 0.240 -0.12 – 0.03 -0.04Speeds of motor vehicles -0.01 0.857 -0.08 – 0.07 -0.01Speeds of bicyclists 0.00 0.999 -0.07 – 0.07 0.00Congestion: all types of vehicles -0.05 0.216 -0.12 – 0.03 -0.04Congestion: bicyclists 0.05 0.130 -0.01 – 0.11 0.05Conflicts -0.03 0.380 -0.08 – 0.03 -0.03Bicycle paths* 0.00 0.908 -0.06 – 0.07 0.00Traffic: unsafe or safe 0.16 0.000 0.10 – 0.22 0.19Greenery 0.12 0.000 0.07 – 0.18 0.15Ugly or beautiful 0.31 0.000 0.25 – 0.38 0.32Course of the route -0.12 0.000 -0.17 – -0.06 -0.15Hilliness 0.02 0.402 -0.03 – 0.07 0.03Red lights -0.02 0.458 -0.07 – 0.03 -0.03R² = 0.435.*Minimal value = 0 and maximal value = 10.
84 I
LIN
A W
AH
LG
RE
N Studies on B
ikeability in a Metropolitan A
rea... 5.5.2 M
odel results T
he results of the analysis for Model 1 are show
n in Table 16. A
bout 40%
of the variance of the outcome variable, hinders or stim
ulates, was ex-
plained by the environmental predictors in the m
odel (R² = 0.415). T
he regression equation w
as y = 8.53 + 0.33 ugly or beautiful + 0.14 greenery + (-0.14) course of the route + (-0.13) exhaust fum
es + (-0.09) congestion: all types of vehicles (p ≤ 0.019). T
able 16. Simultaneous m
ultiple regression analysis of route environment variables
(Model 1, excluding traffic: unsafe or safe) (n = 805).
Outcom
e variabley-intercept
p-value95%
CI
Hinders or stim
ulates8.53
0.0007.34 –
9.72R
egression coefficientPartial correlation
coefficientPredictor variable
Bp-value
95% C
IExhaust fum
es-0.13
0.002-0.21 –
-0.05-0.11
Noise
0.010.800
-0.08 –0.10
0.01Flow
of motor vehicles
-0.040.309
-0.12 –0.04
-0.04Speeds of m
otor vehicles-0.04
0.368-0.11 –
0.04-0.03
Speeds of bicyclists0.00
0.905-0.08 –
0.070.00
Congestion: all types of vehicles
-0.090.019
-0.17 –-0.02
-0.08C
ongestion: bicyclists0.05
0.146-0.02 –
0.110.05
Conflicts
-0.050.110
-0.11 –0.01
-0.06B
icycle paths*0.03
0.407-0.04 –
0.100.03
Traffic: unsafe or safe-
--
-G
reenery0.14
0.0000.09 –
0.200.18
Ugly or beautiful
0.330.000
0.27 –0.40
0.33C
ourse of the route-0.14
0.000-0.20 –
-0.09-0.19
Hilliness
0.030.205
-0.02 –0.09
0.05R
ed lights-0.02
0.394-0.07 –
0.03-0.03
R²= 0.415.*M
inimal value = 0 and m
aximal value = 10.
T
he results of the analysis for Model 2 are show
n in Table 17. A
bout 40%
of the variance of the outcome variable: hinders or stim
ulates, was
explained by the environmental predictors in the m
odel (R² = 0.435). T
he regression equation w
as: y = 6.55 + 0.31 ugly or beautiful + 0.16 traffic: unsafe or safe + (-0.13) exhaust fum
es + 0.12 greenery + (-0.12) course of the route (p ≤ 0.001).

86 I LINA WAHLGREN Studies on Bikeability in a Metropolitan Area...
LINA WAHLGREN Studies on Bikeability in a Metropolitan Area... I 87
6 Discussion This thesis was part of a research project named Physically Active Com-muting in Greater Stockholm (PACS). More specifically, two main research questions were addressed in the thesis. First, do different characteristics of the commuting route environment hinder or stimulate active bicycle com-muting? Hence, the Active Commuting Route Environment Scale (ACRES) was developed for the assessment of bicyclists’ perceptions of their route environments. Before using a measure, it is important to assess its accu-racy. Therefore, the second research question was: What are the measure-ment properties – the validity and reliability – of the ACRES? Three studies were included in this thesis. The main findings showed:
• That the ACRES was characterized by considerable criterion-related validity and reasonable test-retest reproducibility. This supports the use of the ACRES.
• Distinct differences in commuting route environment profiles be-tween the inner urban and suburban areas. Suburban route envi-ronments were rated as safer and more stimulating for bicycle commuting. This demonstrates a higher level of bikeability in sub-urban route environments.
• That beautiful, green and safe route environments seem to be, inde-pendently of one another, stimulating factors for bicycle commuting in inner urban areas. On the other hand, high levels of exhaust fumes and traffic congestion, as well as low ‘directness’ of the route, seem to be hindering factors. This supports the view that creating more stimulating route environments is of importance for the well-being of bicyclists when bicycling.
The results from the studies are discussed below.
6.1 Items and response scales As previously mentioned, the ACRES was developed by Dr Peter Schantz and Erik Stigell, members of the Research Unit for Movement, Health and Environment at GIH – The Swedish School of Sport and Health Sciences, as part of the research project called Physically Active Commuting in Greater Stockholm (PACS). The development was, as described, influenced by published research literature in the field, as well as by Peter’s and Erik’s many years of bicycling-commuting experiences and by Erik’s professional experiences from working with bicycling advocacy and promotion issues in

88 I LINA WAHLGREN Studies on Bikeability in a Metropolitan Area...
the region of Stockholm. This development procedure strengthens the con-struct and content validity of the ACRES.
The ACRES contains aspects comparable to items and concepts in other questionnaires on perceptions of environments related to physical activity (Spittaels et al., 2009; Table 1). The ACRES has, however, a focus on these factors in relation to the commuting route environments. When developing a questionnaire, there is the possibility of missing important items. One area, quality of the surface and surface maintenance, was indicated by several of the experts as a factor that they felt was missing. This area could be added in a future version of the ACRES. On observing the ACRES closely, another area possibly missing is the flow of bicyclists. The item congestion: bicyclists could, however, be regarded as an indicator of the flow of bicyclists in general. Other aspects, such as crime safety and light-ning, could be of relevance. It is essential to be context-specific and these aspects were not relevant for the circumstances in the studies included in this thesis. Before using the ACRES in other contexts, issues related to the included items should be considered and, for example, factors of impor-tance might be added.
Questionnaires on perceptions of environments related to physical activ-ity predominantly have response scales of 4- or 5-point Likert scale types (Table 1). In contrast, the ACRES has 15-point response scales. In line with people’s capacity to discriminate on response scales, five to nine steps are ideal in most circumstances (cf. Streiner and Norman, 2008). Therefore, the 15-point response scales were strengthened by numbering the line with the entire range of values, i.e. whole numbers, 1 to 15, and by using neu-tral options in the middle, i.e. at number 8 (Figure 4). The reasonable test-retest reproducibility results and the distribution of responses, ranging from nearly minimum to maximum for all items, can be interpreted as support for the use of the 15-point scales. The reason for choosing 15-point response scales was the potential to, in principle, capture changes of finer distinction and to facilitate multiple correlation analyses.
6.2 Validity Validity assessments can be challenging or complicated when no objective data exist or are difficult to gather for comparison. This is indeed the case of validation of bicycle commuters’ perceptions of commuting route envi-ronments. Since the ACRES addresses the inner urban and the suburban environments separately, one possibility was to use some expected differ-ences between the two environments for a criterion-related validation. And since each active commuter has a specific route, the validity of their aver-age perception of commuting route environments is difficult to evaluate on
LINA WAHLGREN Studies on Bikeability in a Metropolitan Area... I 89
an individual level. Instead, the criterion-related validity assessments of the ACRES were based on whether or not some general differences between the inner urban and the suburban environments were reflected by differ-ences in perceptions of those environments. This approach corresponds to the ‘known group difference method’ (Cronbach and Meehl, 1955). Both Studies I and II were aimed at assessing the criterion-related validity of the ACRES. The same design was used in the two studies: criterion-related validity assessments based on differences between inner urban and subur-ban route environments and existing objective measures and ratings of experts, as well as of bicycle commuters.
First, the directions of differences ratings of the inner urban and subur-ban environments were considered. I have combined all possible results from the studies in this respect regardless of whether the data were used for other aims (Table 18). Directions of the ratings of the four ACRES items, exhaust fumes, noise, congestion: all types of vehicles and greenery, corre-sponded with the directions of differences in the existing objective meas-ures by all groups. In a way, this could be an expected result. Nevertheless, taking into consideration the difficulty of validating perceptions of route environments, this constitutes a feasible and important first step. Further-more, on considering the results from all groups, the amount of differences between environments ranged from 10 to 18 items. A correspondence be-tween all groups in both significance and directions of the differences was noted in 9 items. The similar results for the different groups can also be interpreted as strengthening the external validity. Second, the sizes of the differences in ratings of the route environments by bicycle commuters (Study I) and advertisement-recruited participants (Both I&S; Study II) corresponded reasonably well with the ratings of the experts. The experts were asked to assess the overall route environments for bicycle commuting in Greater Stockholm and for the whole group of bicycle commuters, whereas the bicycle commuters and advertisement-recruited participants (Both I&S) were asked to rate their own self-chosen route environments. In addition, the ratings were done during different parts of the year and in different years. Therefore, in contrast to the assessments of similarity, there were no expectations that the absolute levels of the ratings of the items would show high concordance between the experts and the bicycle com-muters and advertisement-recruited participants (Both I&S). In conclusion, the results of the assessments of criterion-related validity point in the same direction. Therefore, the criterion-related validity of the ACRES was re-garded as considerable.

90
I L
INA
WA
HL
GR
EN St
udie
s on
Bik
eabi
lity
in a
Met
ropo
litan
Are
a...
Tab
le 1
8. C
rite
rion
-rel
ated
val
idit
y: d
iffe
renc
es i
n ra
ting
s of
inn
er u
rban
and
sub
urba
n en
viro
nmen
ts.
Not
e th
at s
ome
of t
he p
arti
cipa
nts
in S
tudy
I, B
icyc
le c
omm
uter
s, a
nd in
Stu
dy I
I, S
tree
t-re
crui
ted
part
icip
ants
, wer
e th
e sa
me
indi
vidu
als
(Fig
ure
7).
Stud
y I
Stud
y II
Exp
erts
Bic
ycle
com
mut
ers
Adv
ertis
emen
t-rec
ruite
dpa
rtic
ipan
ts(B
oth
I&S†
)
Stre
et-r
ecru
ited
part
icip
ants
Adv
ertis
emen
t-rec
ruite
dpa
rtic
ipan
ts(O
nly
I –O
nly
S†)
Item
Tes
tR
etes
tW
omen
Men
Wom
enM
enW
omen
Men
1. O
n th
e w
hole
-S
SS
S-
SS
S2.
Hin
ders
or s
timul
ates
-S
SS
S-
SS
S3.
Exh
aust
fum
esI
II
II
II
II
4. N
oise
II
II
II
II
I5.
Flo
w o
f mot
or v
ehic
les
II
II
II
II
I6.
Spe
eds o
f mot
or v
ehic
les
S-
-I
--
-I
-7.
Spe
eds o
f bic
yclis
ts-
--
--
-S
II
8. C
onge
stio
n: a
ll ty
pes o
f veh
icle
sI
II
II
II
II
9. C
onge
stio
n: b
icyc
lists
II
II
II
II
I10
. Con
flict
sI
II
II
II
II
11. B
icyc
le p
aths
--
-S
S-
SS
S12
. Tra
ffic
: uns
afe
or sa
feS
SS
SS
SS
SS
13. G
reen
ery
SS
SS
SS
SS
S14
. Ugl
y or
bea
utifu
lI
--
S-
--
S-
15. C
ours
e of
the
rout
e-
II
II
II
II
16. H
illin
ess
SS
SS
S-
SS
-17
. Red
ligh
tsI
II
II
II
II
18. S
hort
or lo
ng‡
--
SS
--
SS
I = si
gnifi
cant
ly h
ighe
r rat
ings
for i
nner
urb
an e
nviro
nmen
tsan
d S
= si
gnifi
cant
ly h
ighe
r rat
ings
for s
ubur
ban
envi
ronm
ents
.†B
oth
I&S
= th
ose
who
bic
ycle
-com
mut
ed in
bot
h th
e in
ner u
rban
and
subu
rban
are
as, O
nly
I= th
ose
who
bic
ycle
-com
mut
ed in
onl
y th
e in
ner u
rban
are
a an
d O
nly
S=
thos
e w
ho b
icyc
le-c
omm
uted
in o
nly
the
subu
rban
are
a.‡N
ot a
sses
sed
by th
e ex
perts
.
LINA WAHLGREN Studies on Bikeability in a Metropolitan Area... I 91
An additional dimension of criterion-related validity relates to the ques-tion of whether ratings of an area would be affected by whether the par-ticipants had also experienced and rated another area. This was possible to evaluate by comparing the ratings between advertisement-recruited Only I (i.e. those who bicycle-commuted in only an inner urban area) or Only S (i.e. those who bicycle-commuted in only a suburban area) and Both I&S (i.e. those who bicycle-commuted in both inner urban and suburban areas). The inner urban route environments are rather discrete and homogeneous in nature, compared to the suburban ones, which feature a variety of from close to inner urban qualities to rural qualities. Therefore, comparisons of ratings of the inner urban area between Both I&S and Only I were consid-ered in the first place. The deviances noted between the two groups were remarkably small. This result was interpreted as a sign of the robustness of the ACRES, which further strengthens its criterion-related validity.
Interestingly, in contrast, for women, differences in most of the items were noted in ratings of the suburban route environments between Both I&S and Only S. The differences that generate statistical significance were, however, small. Considering that the ACRES has 15-point response scales, these significances probably reflect the fairly large sample size. Still, this finding is worth considering, particularly since the corresponding deviation was not noted for men. At present, only speculation about possible expla-nations is possible. One plausible explanation is that Only S women’s sub-urban areas are located more distant from the inner urban areas and there-fore might constitute a slightly different suburban area compared to Both I&S women’s suburban areas. Differences in the spatial distribution of workplaces for men and women (Turner and Niemeier, 1997), as well as differences in distances covered by bicycle-commuting men and women (Stigell and Schantz, 2006; Stigell and Schantz, 2011), support this inter-pretation. These findings indicate that there is much to be learned about the actual route taken, in relation to route environments, and potential differences between men and women.
Comparisons of the validity findings of the ACRES with previous re-search are limited, mainly because there is a lack of research in this area and because the ACRES focuses on a specific behaviour in a specific envi-ronment. Previous studies have generally focused on physical activity and the neighbourhood environments. Some validity results have been reported on the Neighborhood Environment Walkability Scale (NEWS) (Adams et al., 2009; Cerin et al., 2006; Cerin et al., 2008; Cerin et al., 2009; De Bourdeaudhuij et al., 2003; Leslie et al., 2005; Saelens et al., 2003b ). In some of these studies (Cerin et al., 2008; Leslie et al., 2005; Saelens et al., 2003b) a high- versus low-walkability comparison design was used. This
90 I LINA WAHLGREN Studies on Bikeability in a Metropolitan Area...
Table 18. Criterion-related validity: differences in ratings of inner urban and suburban environments. Note that some of the participants in Study I, Bicycle commuters, and in Study II, Street-recruited participants, were the same individuals (Figure 7).
Study I Study IIExperts Bicycle
commutersAdvertisement-recruited
participants(Both I&S†)
Street-recruitedparticipants
Advertisement-recruitedparticipants
(Only I – Only S†)Item Test Retest Women Men Women Men Women Men1. On the whole - S S S S - S S S2. Hinders or stimulates - S S S S - S S S3. Exhaust fumes I I I I I I I I I4. Noise I I I I I I I I I5. Flow of motor vehicles I I I I I I I I I6. Speeds of motor vehicles S - - I - - - I -7. Speeds of bicyclists - - - - - - S I I8. Congestion: all types of vehicles I I I I I I I I I9. Congestion: bicyclists I I I I I I I I I10. Conflicts I I I I I I I I I11. Bicycle paths - - - S S - S S S12. Traffic: unsafe or safe S S S S S S S S S13. Greenery S S S S S S S S S14. Ugly or beautiful I - - S - - - S -15. Course of the route - I I I I I I I I16. Hilliness S S S S S - S S -17. Red lights I I I I I I I I I18. Short or long ‡ - - S S - - S SI = significantly higher ratings for inner urban environments and S = significantly higher ratings for suburban environments.†Both I&S = those who bicycle-commuted in both the inner urban and suburban areas, Only I = those who bicycle-commuted in only the inner urban area and Only S =those who bicycle-commuted in only the suburban area.‡Not assessed by the experts.

92 I LINA WAHLGREN Studies on Bikeability in a Metropolitan Area...
design is similar to the one used for the criterion-related validity assess-ments of the ACRES, where perceptions of two different environments were compared. The findings of the NEWS and the ACRES are consistent, supporting the view that differences in environment characteristics can be assessed by self-reports.
6.3 Reliability In general, the results concerning the reliability of the ACRES indicated reasonable test-retest reproducibility. A frequently used measure of reliabil-ity of questionnaires on perceptions of physical activity environments is the intraclass correlations coefficient (ICC; Table 2). The overall ICCs of the ACRES for both inner urban and suburban environments range from ‘moderate’ (0.42) to ‘almost perfect’ (0.87), according to agreement levels for the interpretation given by Landis and Koch (1977). This result is simi-lar to findings from other reliability studies concerning questionnaires de-veloped to assess neighbourhood environments believed to be associated with physical activity behaviours (Alexander et al., 2006; Brownson et al., 2004; De Bourdeaudhuij et al., 2003; Evenson et al., 2005; Ogilvie et al., 2008; Oyeyemi et al., 2008; Sallis et al., 2009; Table 2). This similarity is interesting because the ACRES has 15-point response scales. Other fre-quently used scales have fewer response alternatives, predominantly 4- or 5-point Likert scale types (Table 1). One expectation might be that more response alternatives would possibly result in lower test-retest reproducibil-ity. Another area that might influence the test-retest reproducibility of the ACRES is the fact that the nature of the items assessed is somewhat changeable, e.g. the number of bicycle commuters in the bicycle paths may change considerably depending on weather conditions. Therefore, low test-retest values could reflect actual changes in the environments. In conclu-sion, the ACRES demonstrated reasonable test-retest reproducibility.
Interestingly, the item congestion: bicyclists showed an order effect but a high ICC for the inner urban environment. Furthermore, the item hinders or stimulates shows an order effect, but substantial ICCs for both inner urban and suburban environments. This finding of contradictory indica-tions of test-retest reproducibility is in conformity with Alexander et al. (2006), who reported a high percent agreement, but only fair ICC, for an item of the International Physical Activity Questionnaire environmental module (IPAQ environmental module). This emphasizes the point of using several tests in the interest of understanding the nature of reproducibility and for comparability.
LINA WAHLGREN Studies on Bikeability in a Metropolitan Area... I 93
6.4 Commuting route environment profiles One aim of Study II involved commuting route environment profiles. Rat-ings of inner urban route environments were compared to ratings of sub-urban route environments, for advertisement-recruited Both I&S as well as between Only I and Only S. For both men and women, higher values for the inner urban than for the suburban environments were noted for the items: exhaust fumes, noise, flow of motor vehicles, congestion: all types of vehicles, congestion: bicyclists, conflicts, course of the route and red lights. The opposite, higher values for the suburban environments than for the inner urban ones, were noted for the items: on the whole, hinders or stimu-lates, bicycle paths, traffic: unsafe or safe, greenery and short or long. Con-sequently, distinctly different route environmental profiles were observed for the inner urban as compared to the suburban route environments.
Higher ratings for the suburban environments were noted for traffic safety (traffic: unsafe or safe) and the extent to which the route environ-ment stimulated bicycle commuting (hinders or stimulates). These two perceptions can be regarded as key outcome perceptions in relation to the bikeability of route environments. Findings of higher demands on route environments for transport among occasional and potentially new bicy-clists (Winters and Teschke, 2010) point to the importance of both safe and stimulating route environment qualities from a public health perspec-tive. Both of these possible components of bikeability are most probably composite outcomes of input from several environmental predictors. Given that the results indicated distinctly different commuting route environ-mental profiles, one suggestion is that the higher ratings of the bikeability of route environments in suburban areas might be explained by factors that differ between the inner urban and the suburban environments. The higher ratings of bicycle paths and greenery and the lower ratings of exhaust fumes, noise, and flow of motor vehicles in the suburban, compared to the inner urban, route environments, for example, could therefore be regarded as explanatory factors for the differences in the outcome perceptions traf-fic: unsafe or safe and hinders or stimulates. Interestingly, a study on moti-vators and deterrents of bicycling supports many of the findings regarding possible explanatory factors (Winters et al., 2010c).
The results of commuting route environment profiles indicated a higher level of traffic safety and stimulation of bicycle commuting in the suburban route environments as compared to the inner urban ones. Interestingly, it has been stated that the likelihood of bicycle use is higher when residential neighbourhood environments have a higher residential density, greater mixed-land use and higher connectivity of streets, i.e. higher walkability (Owen, De Bourdeauhuji, Sygiyama et al., 2010). This can be interpreted

94 I LINA WAHLGREN Studies on Bikeability in a Metropolitan Area...
to be due to, not least, proximity to destinations, which generally means shorter distances in these areas. If this interpretation is correct, it can point, in conjunction with our findings, in the opposite direction as well: bicycle usage in settings with higher residential density and greater mixed-land use may exist under conditions of clearly suboptimal bikeability from a popu-lation perspective. Higher bikeability is suggested in the suburban route environments compared to inner urban route environments based on find-ings of commuting route environments profiles in Study II.
6.5 Relations between the route environment as hindering or stimulating and environmental factors In Study III multiple linear regression analyses were used to explore asso-ciations between the outcome variable, hinders or stimulates, and envi-ronmental predictor variables. About 40% of the variance of the outcome variable was explained in the two models (Model 1: traffic: unsafe or safe excluded and Model 2: traffic: unsafe or safe included). In both models five predictors contributed significantly to the variance of the outcome variable. Ugly or beautiful and greenery contributed positively and exhaust fumes and course of the route negatively in both models. In Model 1, where traf-fic: unsafe or safe was excluded, congestion: all types of vehicles also con-tributed negatively. In model 2, where traffic: unsafe or safe was included, it contributed positively.
Ugly or beautiful was the predictor that contributed the most to the variance of the outcome variable in the models. This finding is in line with the overall support of a positive relation between aesthetics and physical activity in general (for reviews, see Humpel et al., 2002; McCormack et al., 2004; Trost et al., 2002) and for bicycling more specifically (cf. Parkin et al., 2007; Winters et al., 2010c). It is, however, somewhat in contrast to Pikora et al. (2003) conceptual framework of environmental factors that may influence bicycling, where aesthetics can be interpreted as more im-portant for recreational bicycling than for transport bicycling. Neverthe-less, the finding regarding ugly or beautiful, as one of the contributing predictors in the models, emphasizes the importance of aesthetics for transport bicycling.
It is, however, somewhat difficult to interpret the finding regarding ugly or beautiful. It is most probably a composite variable. Greenery was as-sessed as a separate factor, although it could be regarded as a part of ugly or beautiful. Correlation evidence supports this relationship (r = 0.54; see Table 15). Yet, greenery and also ugly or beautiful were both factors that contributed positively to the variance of the outcome variable in the mod-
LINA WAHLGREN Studies on Bikeability in a Metropolitan Area... I 95
els. This is interpreted in terms of the view that other forms of aesthetic features, such as architecture, water and open spaces, constitute an inde-pendent stimulating environmental impact on bicycling commuting.
Research regarding natural environments and bicycling is sparse and in-conclusive. Negative or no relations between green areas in the neighbour-hood and bicycle commuting have been noted (Maas et al., 2008; Moudon et al., 2005) and ‘greenness’ was not a reason to take a detour (Winters et al., 2010a). One possible explanation for this finding is that in greener living environments, destinations, such as shops or places of work, tend to be further away, making distances less suitable for bicycling. In line with this, having green areas in the living environment seems to correlate posi-tively with time spent on bicycle commuting (Maas et al., 2008; Wendel-Vos et al., 2004). All of the findings regarding greenery indicate complexity and emphasize the importance of including distances as a key factor for cycling, particularly for bicycle commuting. Irrespectively of supporting environments, bicycling will not take place if distances are impossible to undertake by bicycle. In contrast to these somewhat conflicting results, our findings clearly support a positive influence of greenery on bicycling com-muting. Thus, other factors might influence the decision to cycle stronger than the presence of green space, but once the cyclist is cycling in the route environment, greenery seems to be a stimulating factor.
Bicycle commuting often involves interaction with other road users, such as motor vehicle drivers, pedestrians and other bicyclists. Two of the items that regard other bicyclists, speeds of bicyclists and congestion: bicyclists, both demonstrated low correlations with the outcome variable. Thus, other bicyclists appear not as a major hinder for the studied bicycle commuters. In contrast, the items regarding or associated with motor vehicles, flow of motor vehicles, speeds of motor vehicles, congestion: all types of vehicles, and conflicts, all showed negative correlations with the outcome variable. In addition, congestion: all types of vehicles, was one of the predictors that contributed negatively to the variance of the outcome variable in one of the models (Model 1, excluding traffic: unsafe or safe). Furthermore, two of our items associated with motor vehicles: exhaust fumes and noise, both showed negative correlations with the outcome variable. In addition, ex-haust fumes was one of the predictors that also contributed negatively to the variance of the outcome variable in the models. Thus, different aspects of motor vehicles appear to constitute a substantial concern for bicyclists.
Often-mentioned reasons not to bicycle are safety concerns. The major-ity of these safety concerns are most probably related to motor vehicles. Traffic: unsafe or safe contributed positively to the variance of the outcome variable when it was included in the analysis as a predictor (Model 2),

96 I LINA WAHLGREN Studies on Bikeability in a Metropolitan Area...
taking over the role of congestion: all types of vehicles (Model 1). Our finding regarding traffic safety supports the influence of safety in stimulat-ing bicycling behaviours (cf. Heinen et al., 2010; Parkin et al., 2007; Xing et al., 2010). It seems that safety concerns regarding pollution – exhaust fumes constitutes more of an indirect threat to bicycle commuters, whereas, traffic safety constitutes a more direct threat, probably because of an immediate concern regarding traffic accidents and traffic injuries.
Finally, the predictor course of the route contributed negatively to the variance of the outcome variable in the models. Course of the route could be interpreted as the ‘directness’ of the route, which could be related to connectivity. Moreover, in a broader sense, course of the route could relate to street connectivity. Street connectivity is one of the factors that consti-tute walkability (cf. Saelens et al., 2003a), which has shown an association with higher levels of physical activity (for a review of reviews, see Gebel et al., 2007). If we interpret course of the route as the ‘directness’ of the route, related to connectivity, our finding is in accord with previous re-search.
In general, bicyclists seem to prefer a bicycle-related infrastructure, such as bicycle paths or lanes which separates them from motor traffic. It was therefore somewhat unexpected that the item bicycle paths did not con-tribute to the variance of the outcome variable. The reason for this could be that the question in this matter includes a total level of a mix of bicycle-related infrastructure (i.e. ‘cycle paths/cycle lanes/cycle roads’). In Greater Stockholm a substantial part of this mix consists of cycle lanes, which are not the preferred route type among bicycle commuters (The Municipality of Stockholm, Traffic and Real Estate Administration, 2004). Thus, this might hide a potentially positive effect of bicycle paths on the outcome variable.
The continuity of the movement of the bicycle trip is another aspect that could influence bicycling, probably both negatively and positively. Nega-tively in terms of interruptions in the bicycling flow, and positively in terms of convenience and safety (for an overview, see Heinen et al., 2010; cf. Pucher et al., 2010). Our item red lights implies the negative aspect. Al-though red lights was not one of the predictors that contributed to the variance of the outcome variable, it showed a negative correlation with the outcome variable, possibly reflecting the negative aspect of traffic controls on the continuity of the movement of the bicycle trip.
A terrain with many slopes requires an extended effort of the bicyclist. Therefore, slopes could have a negative impact on bicycling (for an over-view, see Heinen et al., 2010). In contrast, there are some studies that indi-cate contradictory results (Moudon et al., 2005; Sener et al., 2009; Stinson
LINA WAHLGREN Studies on Bikeability in a Metropolitan Area... I 97
and Bhat, 2003; Titze et al., 2008). A possible explanation for the contra-dictory results is that some bicyclists’ purpose for the trip is, at least partly, to get exercise. Consequently, hilly terrains are preferred. In our study, the item hilliness showed a zero correlation with the outcome variable. A pos-sible explanation is a lack of hills in the measured environment. The inner urban parts of Greater Stockholm are rather flat.
6.5.1 Furthering understanding The studies included in this thesis represent the first steps to further our knowledge of bicycle-commuting route environments, using the ACRES. In Studies I and II the ACRES was used to compare inner urban and suburban route environments (see Table 18). In general, bicycle commuters rated the outcome variable hinders or stimulates higher for suburban route environ-ments than for inner urban ones, i.e. suburban route environments were rated as more stimulating for bicycle commuting than inner urban route environments. At the same time, higher ratings of the items greenery and traffic: unsafe or safe and lower ratings of the items exhaust fumes, conges-tion: all types of vehicles and course of the route were noted in the subur-ban route environment than in the inner urban route environment. These factors were therefore regarded as potential explanatory factors in relation to hindering – stimulating route environments. Study III yielded another type of evidence supporting this role of these factors. Interestingly, how-ever, the item ugly or beautiful appeared as an additional factor of impor-tance for stimulating bicycle commuting. The most probable reason for this divergence in findings is that the ratings of ugly or beautiful did not in general differ significantly between inner urban and suburban route envi-ronments.
One of the next steps in furthering the state of knowledge about bicycle-commuting route environments, using the ACRES, is to cluster items to factors. As a novel exploratory step, I have therefore elaborated on this aspect based on the interrelations between the environmental predictor variables (Table 15) and the model results in Study III. I have developed a model based on the correlations between the environmental predictors (Figure 15). By scrutinizing the correlations, a useful cut-off point for in-clusion of the correlation in the model was found to be r ≥ ± 0.45. This value represents a moderate effect according to Hopkins (2002) (based on Cohen’s thresholds; Hopkins W.G., viewed 16 June 2011, <http://www.sportsci.org/resource/stats/effectmag.html>). Three major clusters were identified: (1) greenery and ugly or beautiful; (2) exhaust fumes, noise and flow of motor vehicles; and (3) congestion: all types of vehicles, congestion: bicyclists and conflicts. The first cluster seems to rep-

98 I LINA WAHLGREN Studies on Bikeability in a Metropolitan Area...
resent different aspects of aesthetics, although greenery could also include other values, such as stress reduction. Related to the second cluster is speeds of motor vehicles. This cluster seems to represent motor vehicles, both directly and indirectly. Directly in terms of flow and speeds of motor vehicles and indirectly in terms of exhaust fumes and noise. Related to the third cluster is traffic: unsafe or safe. This cluster seems to represents road users in a broader sense. Congestion appears to cause both conflicts and traffic unsafety. Not surprisingly, but interestingly, the second and the third clusters are related through flow of motor vehicles and congestion: all types of vehicles. This relationship most probably reflects the inclusion aspects of motor vehicles in both the clusters. All the predictors that con-tributed to the variance of the outcome variable, hinders or stimulates, are represented in the clusters if the related variables are included (i.e. traffic: unsafe or safe), except course of the route. Course of the route appears to be an independent factor. As mentioned before, the studies using the ACRES are in an early stage. This elaboration should therefore be regarded as an exploratory step in beginning a process with the aim of understand-ing a complex area of research.
L
INA
WA
HL
GR
EN S
tudi
es o
n B
ikea
bilit
y in
a M
etro
polit
an A
rea.
.. I
99
Figu
re 1
5. M
odel
of
clus
ters
of
envi
ronm
enta
l va
riab
les.
Thi
s m
odel
is
base
d on
cor
rela
tion
s be
twee
n th
e en
viro
nmen
tal
pred
icto
r va
ri-
able
s (r
≥ ±
0.4
5) (
Tab
le 1
5) a
nd t
he m
odel
s’ r
esul
ts i
n St
udy
III
rega
rdin
g si
gnif
ican
t pr
edic
tors
are
ind
icat
ed b
y ar
row
s (T
able
s 16
and
17
).
r= 0
.60
r= 0
.54
r= 0
.49
r=-0
.47
r= 0
.45
Hin
ders
or
stim
ulat
es
r= 0
.68
Exha
ust f
umes
Spee
ds o
f bic
yclis
ts
Con
flict
s
Ugl
y or
bea
utifu
lC
ours
e of
the
rout
e
Bic
ycle
pat
hs
Con
gest
ion:
all
type
s of v
ehic
les
Noi
se
Flow
of m
otor
ve
hicl
esSp
eeds
of m
otor
ve
hicl
es
Con
gest
ion:
bi
cycl
ists
Traf
fic: u
nsaf
e or
sa
fe
Hill
ines
s
Gre
ener
y
Red
ligh
ts
r= 0
.58
r= 0
.45
r= 0
.50
r= 0
.50
LINA WAHLGREN Studies on Bikeability in a Metropolitan Area... I 99
Figure 15. Model of clusters of environmental variables. This model is based on correlations between the environmental predictor vari-ables (r ≥ ± 0.45) (Table 15) and the models’ results in Study III regarding significant predictors are indicated by arrows (Tables 16 and 17).
r = 0.60
r = 0.54
r = 0.49 r = -0.47
r = 0.45
Hinders orstimulates
r = 0.68
Exhaust fumes
Speeds of bicyclists
Conflicts
Ugly or beautiful Course of the route
Bicycle paths
Congestion: all types of vehicles
Noise
Flow of motor vehicles
Speeds of motor vehicles
Congestion: bicyclists
Traffic: unsafe or safe
Hilliness
Greenery
Red lights
r = 0.58 r = 0.45
r = 0.50
r = 0.50

100 I LINA WAHLGREN Studies on Bikeability in a Metropolitan Area...
6.6 Limitations Several possible limitations of the studies included in this thesis should be mentioned. First, the collected data relied on self-reports. There are nu-merous potential biases to consider when working with self-report ques-tionnaires (cf. Strenier and Norman, 2008). For example, most certainly it is difficult to give an average rating with precision for two suburban areas of a route, which is asked for in the instructions included in the ACRES, if a person first cycles in the southern suburban area, then crosses into the inner urban area and finishes his/her route in the northern suburban area. More objective measures may provide additional information about the route environments. Yet, the focus of this thesis was on perceptions of the environments, for one thing, because perceptions are likely to influence people’s physical activity behaviours (cf. Sallis et al., 2006). In addition, studies have shown poor agreement between objective and perceived meas-ures of environments (Ball et al., 2008; Hoehner et al., 2005; McGinn et al., 2007). Therefore, to further the state of knowledge about the possible associations between environments and physical activity behaviours, a combination of objective and perceived measures of the environment might be important.
Second, the generalizability of the studies is limited. The work with the ACRES is in a relatively early stage at present and the studies were based on one city and two different samples of people. Representativity is related to the generalizability issue. Normally, active commuters, and particularly bicycle commuters, constitute a small group within the general population in larger cities. Thus, it is difficult to use population-based random sam-ples. The participants included in the studies were partly recruited by ad-vertising. Consequently, there was a concern about representativity. In addition, participants were recruited in the street. The street-recruited par-ticipants were considered to represent the population of active commuters with greater certainty than the advertisement-recruited participants. There-fore, one aim of Study II was to compare the ratings of the inner urban and suburban environments between the advertisement- and street-recruited participants. Overall, there was good correspondence between the adver-tisement- and the street-recruited participants regarding ratings of the two environments. Furthermore, although not tested for significance, in gen-eral, no major differences appeared to exist between the descriptive charac-teristics between the two groups. The use of the advertisement-recruited participants is strengthened by these similarities. Concerning generalizabil-ity in a wider sense, additional studies are desirable with a focus on active
LINA WAHLGREN Studies on Bikeability in a Metropolitan Area... I 101
transport with other purposes, different route environments and different samples, including people with different experiences of active transport.
Third, the data on the different participant groups were collected during different months as well as during different years: in May, 2005, for the advertisement-recruited participants, in November and December, 2005, for the street-recruited participants and in September and October, 2009, for the expert panel. As a result, the compared ratings could be based on somewhat different environments due to, for example, seasonal or built environment changes. On the other hand, only small, if any, changes have occurred in Greater Stockholm during this period which affect the general picture of the route environments (cf. Eliasson, 2008). The street-recruited participants appear to be characterized by all-year round active commut-ing, whereas the advertisement-recruited participants appear to include summer season active commuting as well. Yet, active commuting is nor-mally a repetitive behaviour along a specific route. This probably makes the active commuters very familiar with their individual route environ-ments and their perceptions of the route environment can therefore be considered relevant, irrespective of rather moderate variations in yearly trip frequency. Although not perfectly matched, the different participants groups constitute a useful base for comparisons.
Fourth, the statistical approach used in Study III might be seen as a limi-tation. The work with environmental predictors based on the ACRES is in a relatively early and exploratory stage and therefore a simultaneous mul-tiple regression analysis was regarded as appropriate. At this stage, there were not sufficiently many theoretical explanations to use a hierarchical approach. Hierarchical multiple regression analyses, as well as path analy-ses, possibly based on factor analyses, are, however, desirable future pro-gressions.
6.7 Strengths Despite the above-mentioned possible limitations, the studies included in this thesis have several strengths. Many of them are due to the overall re-search design. The focus is on active bicycle commuters and their commut-ing route environments: a specific physical activity behaviour and the spe-cific environment within which the behaviour occurred (cf. Giles-Corti et al., 2005). The active bicycle commuters participating in the studies repre-sent a selected group. This is advantageous, since the bicycle commuters are the experts on their commuting route environments. An additional positive value of using this more uniform group is the minimization of the effect of confounders. For example, our results cannot be affected by self-selection factors as a result of a cross-sectional study design. Furthermore,

102 I LINA WAHLGREN Studies on Bikeability in a Metropolitan Area...
an important strength of the ACRES is that it deals with the whole com-muting route environment and not just the local neighbourhood, as many other questionnaires on physical activity environments do (e.g. Saelens et al., 2003b). In addition, the behaviour and the environments were matched, in contrast to the majority of research in this area which meas-ures the behaviour and the environments separately. An additional strength of the ACRES is that it enables correlation studies between predictor vari-ables and principally different outcome variables in relation to bicycle commuting. This was used in Study III, where associations between the outcome variable, hinders or stimulates, and environmental predictor vari-ables were explored. Furthermore, both potentially stimulating and hinder-ing environmental variables could be included in the analyses. Therefore, the independent effects of different variables could be controlled. For ex-ample, greenery correlates negatively with exhaust fumes and noise. It is therefore impossible to state anything about the effect of greenery itself without simultaneously controlling for the effects of the other variables. The use of the ACRES allows for this. Other important strengths are the reliability tests of two different environments, the criterion-related study design, using an expert panel as a way of handling the problem of non-existing objective data for comparisons, as well as the repeated criterion-related validity assessments based on different samples, and the assess-ments of representativity, using different samples recruited by different sampling methods. Another strength is that the advertisement-recruited participants provided a large sample size. This enabled, among other things, different groupings: for example, separation of those who bicycle-commuted in both inner urban and suburban areas (Both I&S) and those who bicycle-commuted in only an inner urban or a suburban area (Only I or Only S), for comparisons. Indeed, this disclosed a robustness of the ACRES and further strengthened its criterion-related validity. Furthermore, the different commuting route environment profiles of inner urban and suburban areas and the use of multiple linear regression analyses provide a basis for furthering our understanding of bikeability in relation to route environments.
6.8 Future perspectives The work with the ACRES and bikeability is in a relatively early stage. The studies included in this thesis constitute a part of a base regarding measures of perceptions of bicycle-commuting route environments as well as bicycle commuters’ perceptions of commuting route environments. Yet, much remains to be learned. The inclusion of perceived exertion and route dis-tance as factors that possibly influence perceptions of environments gives
LINA WAHLGREN Studies on Bikeability in a Metropolitan Area... I 103
interesting perspectives. Using measures that are more objective may also further understanding of the commuting route environments as well as the development of the ACRES. One possibility in this respect is to use partici-pants’ self-drawn routes on maps as a base. A further option for finer dis-tinctions includes the possibility to break down the commuting route into distinct segments and have the participants rate each of them. Besides using questionnaires, more qualitative research methods might further expand the state of knowledge about commuting route environments. Moreover, as regular bicycle commuters, the advertisement- and street-recruited par-ticipants were probably very familiar with the route environments and therefore their perceptions might differ from those of irregular and poten-tial bicyclists. The ACRES may very well be used to study less regular commuters. Furthermore, with a slightly modified version of the ACRES, potential bicycle commuters’ perceptions could be studied. This may give a more comprehensive understanding of the route environment in relation to active commuting. Studying other environments also represents future ap-proaches. A step in this respect is to study the suburban parts of Greater Stockholm, using the same analyses as the ones used in Study III, where the inner urban parts were studied. Most of the research concerning relations between physical activity and the environments is of cross-sectional design (cf. Wendel-Vos et al., 2007). Experimental studies are practically impossi-ble in this research area. Therefore, interventions based on, for example, natural experiments are interesting and realistic approaches which further current knowledge. Indeed, additional and future studies are needed and welcomed.
6.9 Conclusions and application of findings In conclusion, the overall results from the studies included in this thesis showed:
• Considerable criterion-related validity of the ACRES. • Reasonable test-retest reproducibility of the ACRES. • Ratings of advertisement-recruited participants mirroring those of
street-recruited participants. • Different commuting route environment profiles of inner urban and
suburban areas. Suburban environments were rated as safer and more stimulating for bicycle commuting than the inner urban envi-ronments, thus demonstrating a greater bikeability of route envi-ronments in suburban areas.

104 I LINA WAHLGREN Studies on Bikeability in a Metropolitan Area...
• That in inner urban areas, beautiful, green and safe route environ-ments seems to be, independently of each other, stimulating factors for bicycle commuting. On the other hand, high levels of exhaust fumes, traffic congestion and low ‘directness’ of the route seem to be hindering factors for bicycle commuting.
Consequently, our results support the use of the ACRES in future re-
search to assess bicyclists’ perceptions of their route environments, as well as the use by health and transport professionals to survey route environ-ments for other purposes. The representativity results strengthen the argu-ment for the use of the advertisement-recruited participants in the studies as well as recruitment by advertisement as a feasible method. This result is encouraging because, as stated previously, it is difficult to use population-based random samples at present when studying active commuters because they normally only constitute a small proportion of the population in lar-ger cities. Furthermore, combining proximity to destinations with a high degree of personal safety and stimulating route environments for active transport appears to be an important goal for future urban and regional planning with the aim of creating more widely attractive and bikeable envi-ronments. Creating more stimulating route environments is of importance for: (1) the well-being of bicyclists when bicycling; and could be of impor-tance for; (2) the volume of bicycling, i.e. trip frequency and trip distance; (3) the maintenance of a bicycle behaviour throughout a life span; and (4) the decision to cycle. Thus, stimulating route environments might contrib-ute to increasing the population’s level of physical activity as well as to enhancing public health.
LINA WAHLGREN Studies on Bikeability in a Metropolitan Area... I 105
7 Acknowledgements The major portion of the work on this thesis was done at GIH – The Swed-ish School of Sport and Health Sciences, located in Stockholm, Sweden, as a part of the Physically Active Commuting in Greater Stockholm (PACS) studies. The work received financial support from CIF - the Swedish Na-tional Centre for Research in Sports, the Research Funds of the Swedish Transport Administration, the Public Health Funds of the Stockholm County Council, GIH – The Swedish School of Sport and Health Sciences, and from Mid Sweden University. I wish to express my sincerest gratitude to all who have contributed to the studies included in this thesis in different ways and made its completion possible. In addition to the acknowledgements in the individual papers, I would especially like to thank the following: Professor Peter Schantz, my main supervisor, for supporting and tutoring me, for sharing his knowledge with me and for ‘simply’ making this thesis possible. Dr Henrik Gustafsson, my co-supervisor, for his support and helpful com-ments. The Research Unit for Movement, Health and Environment at GIH, i.e. Peter, Hans, Jane and Erik, and all the people who have been involved in the Physically Active Commuting in Greater Stockholm (PACS) studies. The bicycle commuters and the expert panel, for voluntarily participating in the studies. Erik Stigell, my PhD student colleague, for his friendship, knowledge, sup-port and inspiration. Our ‘walks and talks’ were invaluable to me. All past and present colleagues at the GIH and ÖIP. Dr Carolina Lundqvist, my colleague, for her friendship, support and in-teresting discussion about research and statistics, as well as about life. All past and present PhD student colleagues, as well as people involved in the PhD training at the School of Health and Medical Sciences, Örebro University, Sweden.

106 I LINA WAHLGREN Studies on Bikeability in a Metropolitan Area...
Ninitha Maivorsdotter, my PhD student colleague, for her friendship, sup-port and interesting discussions about research, as well as about life. Professor Grant Schofield and colleagues at the Centre for Physical Activity and Nutrition at The Institute for Public and Mental Health, Auckland University of Technology, New Zealand, for generously hosting me during a study leave. Professor Will Hopkins, for inspiration and sharing his knowledge about statistics with me. Friends and family. My mother and father, Ulla and Torgny, my brother Aron, my life com-panion Peter and our son, for their endless and invaluable support. There are no words that can describe what you mean to me... love...
LINA WAHLGREN Studies on Bikeability in a Metropolitan Area... I 107
Svensk sammanfattning BAKGRUND: Färdvägsmiljöer kan tänkas påverka människors fysiskt aktiva arbetspendling och därmed bidra till bättre folkhälsa. Studier av färdvägsmiljöer är därför önskvärda för att öka förståelsen kring möjliga samband mellan fysiskt aktiv arbetspendling och färdvägsmiljöer. En en-kät, ”The Active Commuting Route Environment Scale” (ACRES), har därför skapats i syfte att studera fysiskt aktiva arbetspendlares upplevelser av sina färdvägsmiljöer. Huvudsyftet med denna avhandling var dels att studera enkätens psykometriska egenskaper i form av validitet och reliabili-tet, dels att studera arbetspendlande cyklisters upplevelser av sina färd-vägsmiljöer. METODER: Arbetspendlande cyklister från Stor-Stockholm rekryterades via tidningsannonsering och via direkt kontakt i anslutning till färdvägen. Deltagarna besvarade enkäten ACRES. Tillsammans med skatt-ningar från en grupp av experter och redan existerande objektiva mått användes förväntade skillnader mellan färdvägsmiljöer i inner- och ytter-staden för att studera kriterierelaterad validitet. Reliabiliteten studerades som reproducerbarhet via upprepade mätningar (test-retest). Jämförelser mellan skattningar av deltagare rekryterade via annonsering och via direkt kontakt i färdvägsmiljöer användes för att studera representativitet. Skatt-ningar av färdvägsmiljöer i inner- och ytterstaden användes vidare för att studera färdvägsmiljöprofiler. Multipel linjär regressionsanalys användes även för att studera sambandet mellan utfallsvariabeln huruvida färdvägs-miljön motverkar eller stimulerar arbetspendling med cykel och miljöpre-diktorer, såsom avgasnivåer, trafikens hastighet och grönska, i innerstads-miljöer. RESULTAT: Enkäten ACRES visade god kriterierelaterad validitet och rimlig reproducerbarhet. Det var en god överrensstämmelse mellan skattningar av deltagare rekryterade via annonsering och via direkt kon-takt. Färdvägsmiljöprofilerna visade tydliga skillnader mellan inner- och ytterstadsmiljöer. Ytterstadens färdvägsmiljöer skattades som tryggare och mer stimulerande för arbetspendling med cykel än innerstadens färdvägs-miljöer. Vidare verkar vackra, gröna och trygga färdvägsmiljöer, oberoen-de av varandra, vara stimulerade faktorer för arbetspendling med cykel i innerstadsmiljöer. Däremot verkar höga avgasnivåer, höga trängselnivåer och färdvägar som kräver många riktningsändringar vara motverkande faktorer. SLUTSATSER: Enkäten ACRES är ett användbart instrument vid mätningar av cyklisters upplevelser av sina färdvägsmiljöer. Ett antal fak-torer relaterade till färdvägsmiljön verkar vara stimulerande respektive motverkande för arbetspendling med cykel. Generellt sett på visar resulta-ten ett relativt outforskat och komplext forskningsområde.

108 I LINA WAHLGREN Studies on Bikeability in a Metropolitan Area...
LINA WAHLGREN Studies on Bikeability in a Metropolitan Area... I 109
References Adams, M.A., Ryan, S., Kerr, J., Sallis, J.F., Patrick, K., Frank, L.D. &
Norman, G.J. (2009). Validation of the Neighborhood Environment Walkability Scale (NEWS) items using Geographic Information Sys-tems. J Phys Act Health. 6 (Suppl 1) p. S113-S123.
Alexander, A., Bergman, P., Hagströmer, M. & Sjöström, M. (2006). IPAQ environmental module; reliability testing. J Public Health. 14 p. 76-80.
ALPHA. Assessing Levels of Physical Activity. Long measures of environ-mental perceptions: active travel and physical activity. [Online]. Avail-able from: http://www.biomedcentral.com/content/supplementary/1479-5868-6-39-S3.pdf. [Accessed: 24 August 2008].
Andersen, L.B, Schnohr, P., Schroll, M. & Hein, O.H. (2000). All-cause mortality associated with physical activity during leisure time, work, sports, and cycling to work. Arch Intern Med. 160 p. 1621-1628.
Badland, H. & Schofield, G. (2005a). Transport, urban design, and physi-cal activity: an evidence-based update. Transport Res D-TR E. 10 p. 177-196.
Badland, H.M. & Schofield, G.M. (2005b). The built environment and transport-related physical activity: what we do and do not know. J Phys Act Health. 2 p. 435-444.
Badland, H.M, Schofield, G.M. & Garrett, N. (2008). Travel behavior and objectively measured urban design variables: Associations for adults traveling to work. Health Place. 14 p. 85-95.
Ball, K., Jeffery, R.W., Crawford, D.A., Roberts, R.J., Salmon, J. & Tim-perio, A.F. (2008). Mismatch between perceived and objective measures of physical activity environments. Prev Med. 47 p. 294-298.
Bauman, A.E., Sallis, J.F., Dzewaltowsk, D.A. & Owen, N. (2002). To-ward a better understanding of the influences on physical activity: The role of determinants, correlates, causal variables, mediators, modera-tors, and confounders. Am J Prev Med. 23 (2S) p. 5–14.
Bauman, A., Bull, F., Chey, T., Craig, C.L., Ainsworth, B.E., Sallis, J.F., Bowles, H.R., Hagstromer, M., Sjostrom, M., Pratt, M. & The IPS Group. (2009). The International Prevalence Study on Physical Activity: results from 20 countries. Int J of Behav Nutr Phys Act. [online]. 6:21.

110 I LINA WAHLGREN Studies on Bikeability in a Metropolitan Area...
Available at: http://dx.doi.org/10.1186/1479-5868-6-21. [Accessed: 3 May 2011].
Brownson, R.C., Chang, J.J., Eyler, A.A., Ainsworth, B.E., Kirtland, K.A., Saelens, B.E. & Sallis, J.F. (2004). Measuring the environment for friendliness toward physical activity: a comparison of the reliability of 3 questionnaires. Am J Public Health. 94 p. 473-483.
Brownson, R.C., Hoehner, C.M., Day, K., Forsyth, A. & Sallis, J.F. (2009). Measuring the built environment for physical activity: state of the science. Am J Prev Med. 36 (4S) p- S99-S123.
Caspersen, C.J., Powell, K.E. & Christenson, G.M. (1985). Physical activ-ity, exercise, and physical fitness: definitions and distinctions for health-related research. Public Health Rep. 100 (2) p. 126-131.
Cerin, E., Saelens, B.E., Sallis, J.F. & Frank, L.D. (2006). Neighborhood Environment Walkability Scale: validity and development of a short form. Med Sci Sports Exerc. 38 (9) p. 1682-1691.
Cerin, E., Leslie, E., Owen, N. & Bauman, A. (2008). An Australian ver-sion of the Neighborhood Environment Walkability Scale: validity evi-dence. Meas Phys Educ Exerc Sci. 12 p. 31-51.
Cerin, E., Conway, T.L., Saelens, B.E., Frank, L.D. & Sallis, J.F. (2009). Cross-validation of the factorial structure of the Neighborhood Envi-ronment Walkability Scale (NEWS) and its abbreviated form (NEWS-A). Int J Behav Nutr Phys Act. 6:32. [online]. 6:32. Available at: http://dx.doi.org/10.1186/1479-5868-6-32. [Accessed: 21 August 2009].
Clarke, P., Ailshire, J., Melendez, R., Bader, M. & Morenoff, J. (2010). Using Google Earth to conduct a neighborhood audit: reliability of a virtual audit instrument. Health Place. [online]. Available at: http://dx.doi.org/10.1016/j.healthplace.2010.08.007. [Accessed: 13 Sep-tember 2010].
Committee on Physical Activity, Health, Transportation, and Land Use. (2005). Does the built environment influence physical activity? Examin-ing the evidence. Transportation Research Board Special Report 282. Washington, D.C. Transportation Research Board, Institute of Medi-cine of the National Academies. [Online]. Available from: http://onlinepubs.trb.org/onlinepubs/sr/sr282.pdf. [Accessed: 7 July 2010].
LINA WAHLGREN Studies on Bikeability in a Metropolitan Area... I 111
Cronbach, L.J. & Meehl, P.E. (1955). Construct validity and psychological tests. Psychol Bull. 52 p. 281-302.
De Bourdeaudhuij, I., Sallis, J.F. & Saelens, B.E. (2003). Environmental correlates of physical activity in a sample of Belgian adults. Am J Health Promot. 18 (1) p. 83-92.
de Geus, B., De Bourdeaudhuij, I., Jannes, C. & Meeusen, R. (2008). Psy-chosocial and environmental factors associated with cycling for trans-port among a working population. Health Educ Res. 23 (4) p. 697-708.
de Vries, S., Claßen, T., Eigenheer-Hug, S-M., Korpela, K., Maas, J., Mit-chell, R. & Schantz, P. (2011). Contributions of natural environments to physical activity: theory and evidence base. In: Nilsson, K., Sangster, M., Gallis, C., Hartig, T., de Vries, S., Seeland, K. & Schipperijn, J. (eds.). Forests, trees and human health. Berlin: Springer Verlag, pp. 205-243.
Duncan, M.J., Spence, J.C. & Mummery, W.K. (2005). Perceived envi-ronment and physical activity: a meta-analysis of selected environ-mental characteristics. Int J Behav Nutr Phys Act.[online]. 2:11. Avail-able at: http://dx.doi.org/10.1186/1479-5868-2-11. [Accessed: 23 April 2009].
Eliasson, J. (2008). Lessons from the Stockholm congestion charging trail. Transport Policy. 15, p.395-404.
Ericson, U. (2000). Increased bicycle commuting, but how? A survey of Stockholmers’ attitudes to cycling. Stockholm, Sweden: Municipality of Stockholm, Research and Statistics office. (In Swedish: Stockholms Stad, Utrednings- och Statistikkontoret: Ökad cykelpendling, men hur?: en undersökning om stockholmares attityder till cykling).
Evenson, K.R. & McGinn, A.P. (2005). Test-retest reliability of a ques-tionnaire to assess physical environmental factors pertaining to physical activity. Int J Behav Nutr Phys Act. [online]. 2:7. Available at: http://dx.doi.org/10.1186/1479-5868-2-7. [Accessed: 13 August 2010].
Forsyth, A., Oakes, J.M. & Schmitz, K.H. (2009). Test-retest reliability of the Twin Cities walking survey. J Phys Act Health. 6 p. 119-131.
Foster, C. & Hillsdon, M. (2004). Changing the environment to promote health-enhancing physical activity. J Sport Sci. 22 p. 755-769. [online]. Available at: http://dx.doi.org/10.1080/02640410410001712458. [Ac-cessed: 5 May 2009].

112 I LINA WAHLGREN Studies on Bikeability in a Metropolitan Area...
Foster, C., Hillsdon, M. & Thorogood, M. (2004). Environmental percep-tions and walking in English adults. J Epidemiol Community Health. 58, p. 924-928. [online]. 4068. Available at: http://dx.doi.org/10.1136/jech-2003.01. [Accessed: 11 January 2010].
Frank, L.D. & Engelke, P.O. (2001). The built environment and human activity patterns: exploring the impacts of urban form on public health. J Plan Lit. 16 (2) p. 202-218. [online]. Available at: http://dx.doi.org/10.1177/08854120122093339. [Accessed: 24 April 2009].
Frank, L.D., Schmid, T.L., Sallis, J.F., Chapman, J. & Saelens, B.E. (2005). Linking objectively measured physical activity with objectively meas-ured urban form. Findings from SMARTRAQ. Am J Prev Med. 28 (2S2) p. 117-125.
Garrard, J., Rose, G. & Lo, S.K. (2008). Promoting transportation cycling for women: the role of bicycle infrastructure. Prev Med. 46 p. 55-59.
Gebel, K., Bauman, A.E. & Petticrew, M. (2007). The physical environ-ment and physical activity: a critical appraisal of review articles. Am J Prev Med. 32 (5) p. 361-369.
Geographic Information Systems. (2010). [Online]. Available from: http://www.gis.com/. [Accessed: 24 November 2010].
Giles-Corti, B., Timperio, A., Bull, F. & Pikora, T. (2005). Understanding physical activity environmental correlates: increased specificity for eco-logical models. Exerc Sport Sci Rev. 33 (4) p. 175-181.
Hamer, M. & Chida, Y. (2008). Active commuting and cardiovascular risk: a meta-analytic review. Prev Med. 46 p. 9-13.
Handy, S.L., Boarnet, M.G., Ewing, R. & Killingsworth, R.E. (2002). How the built environment affects physical activity: views from urban plan-ning. Am J Prev Med. 23 (2S) p. 64-73.
Haskell, W.L., Lee, I-M., Pate, R.R., Powell, K.E., Blair, S.N., Franklin, B.A., Macera, C.A., Heath, G.W., Thompson, P.D. & Bauman, A. (2007). Physical Activity and Public Health: Updated Recommendation for Adults From the American College of Sports Medicine and the American Heart Association. Circulation. 116 p. 1081-1093. [online]. Available at: http://dx.doi.org/10.1161/CIRCULATIONAHA.107.185649. [Ac-cessed: 4 February 2009].
LINA WAHLGREN Studies on Bikeability in a Metropolitan Area... I 113
Heath, G.W., Brownson, R.C., Kruger, J., Miles, R., Powell, K.E., Ramsey, L.T. & the Task Force on Community Preventive Services (2006). The effectiveness of urban design and land use and transport policies and practices to increase physical activity: a systematic review. J Phys Act Health. 3 (Suppl 1) p. S55-S76.
Heinen, E., van Wee, B. & Maat, K. (2010). Commuting by bicycle: an overview of the literature. Transport Rev. 30 (1) p. 59-96. [online]. Available at: http://dx.doi.org/10.1080/01441640903187001. [Ac-cessed: 8 January 2010].
Hendriksen, I.J.M., Zuiderveld, B., Kemper, H.C.G. & Bezemer, P.D. (2000). Effect of commuter cycling on physical performance of male and female employees. Med Sci Sports Exerc. 32 (12) p. 504-510.
Hillier, B. & Hanson, J. (1984). The social logic of space. Cambridge: Cambridge University Press.
Hillier, B. & Vaughan, L. (2007). The city as one thing. ProgPlann. 67 (3) p. 205-230. [online]. Available at: http://dx.doi.org/10.10gress.2007.03.001. [Accessed: 18 November 2010].
Hillier, B., Penn, A., Hanson, J., Grajewski, T. & Xu, J. (1993). Natural movement: or, configuration and attraction in urban pedestrian move-ment. Environ Plann B. 20 p. 29-66.
Hoedl, S., Titze, S. & Oja, P. (2010). The Bikeability and Walkability Evaluation Table: Reliability and Application. Am J Prev Med. 39 (5) p. 457– 459.
Hoehner, C.M., Brennan Ramirez, L.K., Elliott, M.B., Handy, S.L. & Brownson, R.C. (2005). Perceived and objective environmental meas-ures and physical activity among urban adults. Am J Prev Med. 28 (2S2) p. 105-116.
Hopkins, W.G. (2000). Measures of reliability in Sports Medicine and Science. Sports Med. 30 (1) p. 1-15.
Hopkins, W.CG (2002). A New View of Statistics. [Online]. Available from: http://www.sportsci.org/resource/stats/effectmag.html. Accessed: 16 June, 2011.
Hu, G., Pekkarinen, H., Hänninen, O., Yu, Z., Tian, H., Guo, Z. & Nissi-nen, A. (2002). Physical activity during leisure and commuting in Tian-jin, China. B World Health Organ. 80 p. 933-938.

114 I LINA WAHLGREN Studies on Bikeability in a Metropolitan Area...
Humpel, N., Owen, N. & Leslie, E. (2002). Environmental factors associ-ated with adults’ participation in physical activity: a review. Am J Prev Med. 22 (3) p. 188-199.
Hunt, J.D. & Abraham, J.E. (2007). Influences on bicycle use. Transporta-tion. 34 p. 453-470.
Iacono, M., Krizek, K. & El-Geneidy, A. (2008). Access to destinations: how close is close enough? Estimating accurate distance decay functions for multiple modes and different purposes. Report no. 4 in the series: Access to destinations. Minnesota Department of Transportation. [online]. Available from: http://www.lrrb.org/PDF/200811.pdf. [Ac-cessed: 22 September 2010].
Inoue, S., Ohya, Y., Odagiri, Y., Takamiya, T., Ishii, K., Kitabayashi, M., Suijo, K., Sallis, J.F. & Shimomitsu, T. (2010). Association between perceived neighbourhood environment and walking among adults in 4 cities in Japan. J Epidemiol. [online]. Available at: http://dx.doi.org/10.2188/jea.JE20090120. [Accessed: 4 June 2010].
IPAQ International Physical Activity Questionnaire, environmental mod-ule. [Online]. Available from: http://www.drjamessallis.sdsu.edu/measures.html. [Accessed: 4 May 2011].
Jacobsen, P.L. (2003). Safety in numbers: more walkers and bicyclists, safer walking and bicycling. Injury Prev. 9 p. 205-209. [online]. Avail-able at: http://dx.doi.org/10.1136/ip.9.3.205. [Accessed: 25 October 2010].
Kondo, K., Lee, J.S., Kawakubo, K., Kataoka, Y., Asami, Y., Mori, K., Umezaki, M., Yamauchi, T., Takag, H., Sunagawa, H. & Akabayashi, A. (2009). Association between daily physical activity and neighbor-hood environments. Environ Health Prev Med. 14 p. 196–206. [online]. Available at: http://dx.doi.org/10.1007/s12199-009-0081-1. [Accessed: 14 July 2010].
Krizek, K.J. (2006). Two approaches to valuing some of bicycle facilities’ presumed benefits. J Am Plann Assoc. 72 (3) p. 309-319.
Krizek, K.J. & Johnson, P.J. (2006). Proximity to trails and retail: effects on urban cycling and walking. J Am Plann Assoc. 72 (1) p. 33-42.
Landis, J.R. & Koch, G.G. (1977). The measurement of observer agree-ment for categorical data. Biometrics. 33 p. 159-174.
LINA WAHLGREN Studies on Bikeability in a Metropolitan Area... I 115
Lee, C. & Moudon, A.V. (2004). Physical activity and environment re-search in the health field: implications for urban and transportation planning practice and research. J Plan Lit. 19 (2) p. 147-181. [online]. Available at: http://dx.doi.org/10.1177/0885412204267680. [Accessed: 24 April 2009].
Leslie, E., Saelens, B., Frank, L., Owen, N., Bauman, A., Coffee, N. & Hugo, G. (2005). Residents’ perceptions of walkability attributes in ob-jectively different neighbourhoods: a pilot study. Health Place. 11 p. 227-236.
Lindström, M. (2008). Means of transportation to work and overweight and obesity: a population-based study in southern Sweden. Prev Med. 46 p. 22-28.
Löfvenhaft, K. (2002). Spatial and temporal perspectives on biodiversity for physical planning: examples from urban Stockholm, Sweden. A the-sis submitted in partial fulfilment of the Requirements of Stockholm University, for the Degree of Doctor of Philosophy. Stockholm: Stock-holm University.
Maas, J., Verheij, R.A., Spreeuwenberg, P. & Groenewegen, P.P. (2008). Physical activity as a possible mechanism behind the relationship be-tween green space and health: A multilevel analysis. BMC Public Health [online]. 8:206. Available at: http://dx.doi.org/10.1186/1471-2458-8-206. [Accessed: 6 August 2008].
Matthews, C.E, Jurj, A.L., Shu, X-O., Li, H-L., Yang, G., Li, Q., Gao, Y-T. & Zheng, W. (2007). Influences of exercise, walking, cycling, and overall nonexercise physical activity on mortality in Chinese women. Am J Epidemiol. 165 (12) p. 1343-1350.
McCormack, G., Giles-Corti, B., Lange, A., Smith, T., Martin, K. & Pikora, T.J. (2004). An update of recent evidence of the relationship be-tween objective and self-report measures of the physical environment and physical activity behaviours. J Sci Med Sport. 7 (1) p. 81-92.
McGinn, A.P., Evenson, K.R., Herring, A.H., Huston, S.L. & Rodriguez, D.A. (2007). Exploring associations between physical activity and per-ceived and objective measures of the built environment. J Urban Health. 84 (2) p. 162-184. [online]. Available at: http://dx.doi.org/10.1007/s11524-006-9136-4. [Accessed: 15 May 2009].

116 I LINA WAHLGREN Studies on Bikeability in a Metropolitan Area...
Millington, C., Ward Thompson, C., Rowe, D., Aspinall, P., Fitzsimons, C., Nelson, N. & Mutrie, N. (2009). Development of the Scottish Walkability Assessment Tool (SWAT). Health Place. 15 p. 474-481.
Morán Toledo, C.A. (2008). Framework for estimating congestion per-formance measure: from data collection to reliability analysis: case study of Stockholm. A thesis submitted in partial fulfilment of the Re-quirements of the Royal Institute of Technology Stockholm, for the De-gree of Licenciate. Stockholm: The Royal Institute of Technology.
Morrow, J.R. (2002). Measurement issues for the assessment of physical activity. In: Welk, G.J. (ed). Physical activity assessments for health-related research. Champaign, IL: Human Kinetics , pp. 37-49.
Moudon, A.V. & Lee, C. (2003). Walking and bicycling: an evaluation of environmental audit instruments. Am J Health Promot. 18 (1) p. 21-37.
Moudon, A.V., Lee, C., Cheadle, A.D., Collier, C.W., Johnson, D., Schmid, T.L. & Weather, R.D. (2005). Cycling and the built environ-ment, a US perspective. Transport Res D-TR E. 10 p. 245-261.
NEWS Neighborhood Environment Walkability Scale. [Online]. Available from: http://www.drjamessallis.sdsu.edu/Documents/NEWS.pdf [Ac-cessed: 24 November 2010].
Ogilvie, D., Egan, M., Hamilton, V. & Petticrew, M. (2004). Promoting walking and cycling as an alternative to using cars: systematic review. BMJ. [online]. 329:763. Available at: http://dx.doi.org/10.1136/bmj.38216.714560.55. [Accessed: 27 April 2009].
Ogilvie, D., Mitchell, R., Mutrie, N., Petticrew, M. & Platt, S. (2006). Evaluating health effects of transport interventions: methodologic case study. Am J Prev Med. 31 (2) p. 118-126.
Ogilvie, D., Foster, C.E, Rothnie, H., Cavill, N., Hamilton, V., Fitzsimons, C.F., Mutrie, N. & on the behalf of the Scottish Physical Activity Re-search Collaboration (SPARColl) (2007). Interventions to promote walking: systematic review. BMJ. 334 p. 1204-1213. [online]. Available at: http://dx.doi.org/10.1136/bmj.39198.722720.BE. [Accessed: 26 April 2009].
Ogilvie, D., Mitchell, R., Mutrie, N., Petticrew, M. & Platt, S. (2008). Perceived characteristics of the environment associated with active travel: development and testing of a new scale. Int J Behav Nutr Phys
LINA WAHLGREN Studies on Bikeability in a Metropolitan Area... I 117
Act. 5:32. [online]. Available at: http://dx.doi.org/10.1186/1479-5868-5-32. [Accessed: 6 November 2008].
Oja, P. & Borms, J. (eds.) (2004). Health Enhancing Physical Activity. Oxford, UK: Meyer & Meyer sport.
Oja, P., Titze, S., Bauman, A., de Geus, B., Krenn, P., Reger-Nash, B. & Kohlberger, T. (2011). Health benefits of cycling: a systematic review. Scand J Med Sci Sports. [online]. 21 (4) p. 496-509. Available at: http://dx.doi.org/10.1111/j.1600-0838.2011.01299.x. [Accessed: 5 May 2011].
Owen, N., Humple, N., Leslie, E., Bauman, A. & Sallis, J.F. (2004). Un-derstanding environmental influences on walking: review and research agenda. Am J Prev Med. 27 (1) p. 67-76.
Owen, N., De Bourdeauhuij, I., Sygiyama, T., Leslie, E., Cerin, E., Van Dyck, D. & Bauman, A. (2010). Bicycle use for transport in an Austra-lian and a Belgian city: associations with built-environment attributes. J Urban Health. 87 (2) p. 189-198. [online]. Available at: http://dx.doi.org/10.1007/s11524-009-9424-x. [Accessed: 31 May 2010].
Oyeyemi, A.L., Adegoke, B.O.A., Oyeyemi, A.Y. & Fatudimu, B.M. (2008). Test-retest reliability of IPAQ environmental module in an Afri-can population. Int J Behav Nutr Phys Act. [online]. 5:38. Available at: http://dx.doi.org/10.1186/1479-5868-5-38. [Accessed: 6 November 2008].
Panter, J.R. & Jones, A. (2010). Attitudes and the environment as determi-nants of active travel in adults: what do and don’t we know? J Phys Act Health. 7 p. 551-561.
Parkin, J., Ryley, T. & Jones, T. (2007). Barriers to cycling: an exploration of quantitative analyses. In: Horton, D., Rosen, P. & Cox, P. (eds). Cy-cling and Society. Aldershot, UK: Ashgate. pp. 67-82.
Pate, R.R., Pratt, M., Blair, S.N., Haskell, W.L., Macera, C.A., Bouchard, C., Buchner, D., Ettinger, W., Heath, G.W., King, A.C., Kriska, A., Leon, A.S., Marcus, B.H., Morris, J., Paffenbarger, R.S., Patrick, K., Pollock, M.L., Rippe, J.M., Sallis, J. & Wilmore, J.H. (1995). Physical Activity and Public Health: A Recommendation From the Centers for Disease Control and Prevention and the American College of Sports Medicine. JAMA. 273 (5) p. 402-407.

118 I LINA WAHLGREN Studies on Bikeability in a Metropolitan Area...
Pikora, T.J., Bull, F.C.L., Jamrozik, K., Knuiman, M., Giles-Corti, B. & Donovan, R.J. (2002). Developing a reliable audit instrument to meas-ure the physical environment for physical activity. Am J Prev Med. 23 (13) p. 187-194.
Pikora, T., Giles-Corti, B., Bull, F., Jamrozik, K. & Donovan, R. (2003). Developing a framework for assessment of the environmental determi-nants of walking and cycling. Soc Sci Med. 56 p. 1693-1703.
Professional Associations for Physical Activity, Sweden (2003). Physical activity in prevention and treatment of diseases. Stockholm: National Institute of Public Health. (In Swedish: Yrkesföreningar för Fysisk Akti-vitet (2003). FYSS: Fysisk aktivitet i sjukdomsprevention och sjuk-domsbehandling. Statens Folkhälsoinstitut.)
Professional Associations for Physical Activity, Sweden (2008). Physical activity in prevention and treatment of diseases. Stockholm: National Institute of Public Health (In Swedish: Yrkesföreningar för Fysisk Akti-vitet (2008). FYSS 2008: Fysisk aktivitet i sjukdomsprevention och sjukdomsbehandling. Statens Folkhälsoinstitut FHI.)
Pucher, J. & Buehler, R. (2010). Walking and Cycling for Healthy Cities. Built Environ. 36 (4), p. 391-414.
Pucher, J., Dill, J. & Handy, S. (2010). Infrastructure, programs, and poli-cies to increase bicycling: an international review. Prev Med. 50 p. S106-S125.
Raford, N., Chiaradia, A. & Gil, J. (2007). Space syntax: the role of urban form in cyclist route choice in central London. California: Safe Trans-portation Research & Education Centre, Institute of Transport Studies, UC Berkley. [Online]. Available from: http://escholarship.org/uc/item/8qz8m4fz. [Accessed: 18 November 2010].
Saelens, B.E., Sallis, J.F. & Frank, L.D. (2003a). Environmental correlates of walking and cycling: findings from the transportation, urban design, and planning literatures. Ann Behav Med. 25 (2) p. 80-91.
Saelens, B.E., Sallis, J.F, Black, J.B. & Chen, D. (2003b). Neighborhood-based differences in physical activity: an environment scale evaluation. Am J Public Health. 93 (9) p. 1552-1558.
Saelens, B.E. & Handy, S.L. (2008). Built environment correlates of walk-ing: a review. Med Sci Sports Exerc. 40 (7S) p. S550-S566.
LINA WAHLGREN Studies on Bikeability in a Metropolitan Area... I 119
Sallis, J.F. (2009). Measuring physical activity environments: a brief his-tory. Am J Prev Med. 36 (4S) p. S86-S92.
Sallis, J.F. & Owen, N. (1999). Physical activity & behavioral medicine. Thousand Oaks, California: Sage.
Sallis, J.F. & Owen, N. (2002). Ecological models of health behavior. In: Glanz, K., Rimer, B.K. & Lewis, F.M. (eds). Health behavior and health education – theory, research, and practice. 3rd edition. San Francisco, CA: Jossey-Bass, pp. 462-484.
Sallis, J.F., Bauman, A. & Pratt, M. (1998). Environmental and policy: interventions to promote physical activity. Am J Prev Med. 15 (4) p. 379-397.
Sallis, J.F., Frank, L.D., Saelens, B.E. & Kraft, M.K. (2004). Active trans-portation and physical activity: opportunities for collaboration on transportation and public health research. Transport Res A-Pol. 38, p. 249-268.
Sallis, J.F., Cervero, R.B., Ascher, W., Henderson, K.A., Kraft, M.K. & Kerr, J. (2006). An ecological approach to creating active living com-munities. Annu Rev Public Health. 27 p. 297-322.
Sallis, J.F., Bowles, H.R., Bauman, A., Ainsworth, B.E., Bull, F.C., Craig, C.L., Sjöström, M., De Bourdeaudhuij, I., Lefevre, J., Matsudo, V., Ma-tsudo, S., Macfarlane, D.J., Gomez, L.F., Inoue, S., Murase, N., Vol-bekiene, V., McLean, G., Carr, H., Heggebo, L.K., Tomten, H. & Bergman, P. (2009). Neighborhood environments and physical activity among adults in 11 countries. Am J Prev Med. 36 (6) p. 484-490.
Sener, I.N., Eluru, N. & Bhat, C.R. (2009). An analysis of bicycle route choice preferences in Texas, US. Transportation. 36 p. 511-539.
Shephard, R.J. (2008). Is active commuting the answer to population health? Sports Med. 38 (9) p. 751-758.
Space syntax (2010). [Online]. Available from: http://www.spacesyntax.org/ [Accessed: 23 November 2010].
Spittaels, H., Foster, C., Oppert, J-M., Rutter, H., Oja, P., Sjöström, M. & De Bourdeaudhuij, I. (2009). Assessment of environmental correlates of physical activity: development of a European questionnaire. Int J Behav Nutr Phys Act. [online]. 6:39. Available at: http://dx.doi.org/10.1186/1479-5868-6-39. [Accessed: 21 August 2009].

120 I LINA WAHLGREN Studies on Bikeability in a Metropolitan Area...
Stigell, E. & Schantz, P. (2006). Physically active commuting between home and work/study place in Greater Stockholm. In: Proceedings of Transport Research Arena Europe. Greener, safer and smarter road transport for Europe. Conference of European Directors of Roads, European Commission & European Road Transport Research Advisory Council, Gothenburg, Sweden, 12-15 June 2006. pp. 109.
Stigell, E. & Schantz, P. (2011). Active commuting behaviours in a metro-politan setting – distance, duration, velocity and frequency in relation to mode choice and gender. Unpublished.
Stinson, M.A. & Bhat, C.R. (2003). An analysis of commuter bicyclist route choice using a stated preference survey. Transport Res. 1828 p. 107-111.
Streiner, D.L. & Norman, G.R. (2008). Health measurement scales: a prac-tical guide to their development and use. 4th edition. Oxford: Oxford University Press.
The Municipality of Stockholm, Traffic and Real Estate Administration (2004). Biking in the inner urban part of Stockholm. Stockholm, Swe-den: Municipality of Stockholm, Traffic and Real Estate Administra-tion, 2004:2. (In Swedish: Stockholms Stad, Gatu- och fastighetskonto-ret: Att cykla i Stockholms innerstad).
The Municipality of Stockholm, Office of Research and Statistics (2008). Area and population density by City district. [Online]. Available from: http://www.usk.stockholm.se/arsbok/b039.htm. (In Swedish: Stock-holms Stad, Utrednings- och Statistikkontoret: Areal och befolknings-täthet i stadsdelsområden, SDN-delar och stadsdelar 2008-12-31). [Ac-cessed: 7 October 2010].
The Municipality of Stockholm, Department of Environment and Health (2009). The Noise Map of Stockholm. [Online] Available from: http://www.map.stockholm.se/kartago/kartago_fr_buller.html. (In Swedish: Stockholms Stad, Miljöförvaltningen: Stockholms bullerkarta). [Accessed: 7 July 2009].
The National Board of Health and Welfare, Sweden (2009) Folkhälsorap-port 2009. [Online]. In Swedish. Available from: http://www.socialstyrelsen.se/publikationer2009/2009-126-71. [Ac-cessed: 1 May 2011].
LINA WAHLGREN Studies on Bikeability in a Metropolitan Area... I 121
The Stockholm Trials (2006). The Stockholm Trials. [Online]. Available from: http://www.stockholmsforsoket.se. (In Swedish: Stockholms-försöket). [Accessed: 7 July 2009].
The Stockholm–Uppsala Air Quality Management Association (2009). [Online] Available from: http://www.slb.nu/lvf/. (In Swedish: Stockholm och Uppsala Läns Luftvårdsförbund). [Accessed: 7 July 2009].
Tilahun, N.Y., Levinson, D.M. & Krizek, K.J. (2007). Trails, lanes, or traffic: the value of different bicycle facilities using an adaptive stated preference survey. Transport Res A-Pol. 41 p. 287-301.
Titze, S., Stronegger, W.J., Janschitz, S. & Oja, P. (2007). Environmental, social, and personal correlates of cycling for transportation in a student population. J Phys Act Health. 4 p. 66-79.
Titze, S., Stronegger, W.J., Janschitz, S. & Oja, P. (2008). Association of built-environment, social-environment and personal factors with bicy-cling as a mode of transportation among Austrian City dwellers. Prev Med. 47 p. 252-259.
Traffic and Health in Glasgow Questionnaire. [Online]. Available from: http://www.usbiomedcentral.com/content/supplementary/1479-5868-5-32-S1.pdf. [Accessed: 7 November 2008].
Troped, P.J, Cromley, E.K, Fragala, M.S., Melly, S.J., Hasbrouck, H.H., Gortmaker, S.L. & Brownson, R.C. (2006). Development and reliability and validity testing of an audit tool for trail/path characteristics: The Path Environment Audit Tool (PEAT). J Phys Act Health. 3 (Suppl 1) p. S158-S175.
Trost, S.G., Owen, N., Bauman, A.E., Sallis, J.F. & Brown, W. (2002). Correlates of adults’ participation in physical activity: review and up-date. Med Sci Sports Exerc. 34 (12), p.1996-2001.
Turner, T. & Niemeier, D. (1997). Travel to work and household respon-sibility: new evidence. Transportation. 24 p. 397-419.
Ulrich, R.S. (1984). View through a window may influence recovery from surgery. Science. 224 p. 420-421. [online]. 4647. Available at: http://dx.doi.org/10.1126/science.6143402. [Accessed: 29 August 2011].
Ulrich, R.S., Simons, R.F., Losito, B.D., Fiorito, E., Miles, M.A. & Zelson, M. (1991). Stress recovery during exposure to natural and urban envi-ronment. J Environ Psychol. 11, p.201-230.
122 I LINA WAHLGREN Studies on Bikeability in a Metropolitan Area...
U.S. Department of Health and Human Services (1996). Physical activity and health: a report of the Surgeon General. Atlanta, GA: U.S. Depart-ment of Health and Human Services, Centers for Disease Control and Prevention, National Center for Chronic Disease Prevention and Health Promotion.
U.S. Department of Health and Human Services (2008). The 2008 Physical Activity Guidelines for Americans. Physical Activity Advisory Commit-tee Report. Washington, DC: [Online]. Available from: http://www.health.gov/paguidelines/pdf/paguide.pdf. [Accessed: 27 No-vember 2008].
Wendel-Vos, G.C.W., Schuit, A.J., De Niet, R., Boshuizen, H.C., Saris, W.H.M. & Kromhout, D. (2004). Factors of the Physical Environment Associated with Walking and Bicycling. Med Sci Sports Exerc. 36 (4) p. 725–730.
Wendel-Vos, W., Droomers, M., Kremers, S., Brug, J. & van Lenthe, F. (2007). Potential environmental determinants of physical activity in adults: a systematic review. Obes rev. 8 p. 425-440. [online]. Available at: http://dx.doi.org/10.1111/j.1467-789x.2007.00370x. [Accessed: 12 February 2009].
Winters, M. & Teschke, K. (2010). Route preferences among adults in the near market for bicycling: findings of the cycling in cities study. Am J Health Promot. 25 (1) p. 40-47.
Winters, M., Teschke, K., Grant, M., Setton, E.M. & Brauer, M. (2010a). How far out of the way will we travel? Built environment influences on route selection for bicycle and car travel. Transport Res. [online]. 2190 p.1-10. Available at: http://dx.doi.org/10.3141/2190-01. [Accessed: 24 May 2010].
Winters, M., Brauer, M., Setton, E.M. & Teschke, K. (2010b). Built Envi-ronment Influences on Healthy Transportation Choices: Bicycling ver-sus Driving. J Urban Health. 87 (6) p. 969-993. [online]. Available at: http://dx.doi.org/10.1007/s11524-010-9509-6. [Accessed: 5 January 2011].
Winters, M., Davidson, G., Kao, D. & Teschke, K. (2010c). Motivators and deterrents of bicycling: comparing influences on decisions to ride. Transportation. [online]. 38 (1) p. 153-168. Available at: http://dx.doi.org/10.1007/s11116-010-9284-y. [Accessed: 2 July 2010].
LINA WAHLGREN Studies on Bikeability in a Metropolitan Area... I 123
World Health Organization (WHO) (2004). Global Strategy on Diet, Physical Activity, and Health. WHA57:17. Geneva: WHO. [Online]. Available from: http://www.who.int/dietphysicalactivity/strategy/eb11344/strategy_english_web.pdf. [Accessed: 7 September 2009].
Yang, L., Sahlqvist, S., McMinn, A., Griffin, S.J. & Ogilvie, D. (2010). Interventions to promote cycling: systematic review. BMJ. [online]. 2010:341. Available at: http://dx.doi.org/10.1136/bmj.c5293. [Ac-cessed: 20 October 2010].
Xing, Y., Handy, S.L. & Mokhtarian, P.L. (2010). Factors associated with proportions and miles of bicycling for transportation and recreation in six small US cities. Transport Res D-TR E. 15 p. 73-81.

124 I LINA WAHLGREN Studies on Bikeability in a Metropolitan Area...
LINA WAHLGREN Studies on Bikeability in a Metropolitan Area... I 125
Appendix

124 I LINA WAHLGREN Studies on Bikeability in a Metropolitan Area...
LINA WAHLGREN Studies on Bikeability in a Metropolitan Area... I 125
Appendix ”Enkät nr 2 om fysisk aktivitet vid arbetspendling”
Nu kommer ett antal frågor om hur du uppfattar miljön som du har gått och/eller cyklat i på väg till arbets-/studieplatsen under de senaste två veckorna. Ange din helhetsupplevelse under dessa veckor. Vi ber dig skilja på upplevelser när färdvägen går i innerstadsmiljö respektive när färden går i ytterstadsmiljö (se figur 1 nedan). Ange upplevelser i innerstadsmiljö på rad 1 och i ytterstadsmiljö på rad 2, se exempelrutan längst ned på sidan.
Figur 1. Med innerstaden menar vi området innanför den streckade linjen och med ytterstaden menar vi resten av Stockholms län. Ex. Gamla stan = innerstad, Täby och Huddinge = ytterstad.
Exempel på hur frågorna kan fyllas i.
Ringa in den siffra som bäst stämmer med din upplevelse. Om du ringar in fel eller ändrar dig ber vi dig att kryssa över det felaktiga och ringa in det rätta alternativet. Se exemplet.
Innerstaden: Lite 1---2---3---4---5---6---7---8---9---10---11---12---13---14---15 Mycket
varken mycket eller lite
Ytterstaden: Lite 1---2---3---4---5---6---7---8---9---10---11---12---13---14---15 Mycket
Varken mycket eller lite
Om du cyklar/går i båda miljöerna fyller du i båda raderna. Om du först cyklar i södra ytterstaden och sedan passerar innerstaden och avslutar resan i norra ytterstaden anger du ett medelvärde för båda ytterstadsfärderna.
Frågor om din färdväg
KTHGärdet
Lill-Jans skogenBrunnsviken
Solna
Östermalm
Kungsholmen
Årsta
Södermalm
Liljeholmen
Stora Essingen
Bromma
Vasastan
City
Nacka
Norra ytterstaden
Innerstaden
Södra ytterstaden

”Enkät nr 2 om fysisk aktivitet vid arbetspendling”
Alla frågor nedan gäller din helhetsupplevelse av din färdväg som cyklist till arbets-/studieplatsen. Ringa in den siffra som bäst stämmer med din upplevelse.
1. Hur upplever du miljön som helhet under färdvägen?
Innerstaden: Mycket 1---2---3---4---5---6---7---8---9---10---11---12---13---14---15 Mycketdålig bra
varken dålig eller bra
Ytterstaden: Mycket 1---2---3---4---5---6---7---8---9---10---11---12---13---14---15 Mycketdålig bra
varken dålig eller bra
2. Tycker du att miljön som du cyklar i som helhet stimulerar till/motverkar din arbetspendling?
Innerstaden: Motverkar 1---2---3---4---5---6---7---8---9---10---11---12---13---14---15 Stimulerarmycket mycket
varken motverkar eller stimulerar
Ytterstaden: Motverkar 1---2---3---4---5---6---7---8---9---10---11---12---13---14---15 Stimulerarmycket mycket
varken motverkar eller stimulerar
3. Hur uppfattar du avgasnivåerna under din färdväg?
Innerstaden: Mycket 1---2---3---4---5---6---7---8---9---10---11---12---13---14---15 Mycketlåga höga
varken låga eller höga
Ytterstaden: Mycket 1---2---3---4---5---6---7---8---9---10---11---12---13---14---15 Mycketlåga höga
varken låga eller höga
Frågor om de miljöer du har cyklat i

”Enkät nr 2 om fysisk aktivitet vid arbetspendling”
4. Hur uppfattar du bullernivåerna under din färdväg?
Innerstaden: Mycket 1---2---3---4---5---6---7---8---9---10---11---12---13---14---15 Mycketlåga höga
varken låga eller höga
Ytterstaden: Mycket 1---2---3---4---5---6---7---8---9---10---11---12---13---14---15 Mycketlåga höga
varken låga eller höga
5. Hur uppfattar du flödet av motorfordon (antalet bilar) längst din färdväg?
Innerstaden: Mycket 1---2---3---4---5---6---7---8---9---10---11---12---13---14---15 Mycketlågt högt
varken lågt eller högt
Ytterstaden: Mycket 1---2---3---4---5---6---7---8---9---10---11---12---13---14---15 Mycketlågt högt
varken lågt eller högt
6. Hur uppfattar du hastigheterna på motorfordon (taxi, lastbil, personbil, buss) under din färdväg?
Innerstaden: Mycket 1---2---3---4---5---6---7---8---9---10---11---12---13---14---15 Mycketlåga höga
varken låga eller höga
Ytterstaden: Mycket 1---2---3---4---5---6---7---8---9---10---11---12---13---14---15 Mycketlåga höga
varken låga eller höga

”Enkät nr 2 om fysisk aktivitet vid arbetspendling”
7. Hur du uppfattar andra cyklisters hastigheter under din färdväg?
Innerstaden: Mycket 1---2---3---4---5---6---7---8---9---10---11---12---13---14---15 Mycketlåga höga
varken låga eller höga
Ytterstaden: Mycket 1---2---3---4---5---6---7---8---9---10---11---12---13---14---15 Mycketlåga höga
varken låga eller höga
8. Hur uppfattar du som cyklist trängselnivåerna i blandtrafik, orsakad av alla sorters fordon, under din färdväg?
Innerstaden: Mycket 1---2---3---4---5---6---7---8---9---10---11---12---13---14---15 Mycketlåga höga
varken låga eller höga
Ytterstaden: Mycket 1---2---3---4---5---6---7---8---9---10---11---12---13---14---15 Mycketlåga höga
varken låga eller höga
9. Hur uppfattar du trängselnivåerna orsakad av antalet cyklister på cykelbana/cykelfält under din färdväg?
Innerstaden: Mycket 1---2---3---4---5---6---7---8---9---10---11---12---13---14---15 Mycketlåga höga
varken låga eller höga
Ytterstaden: Mycket 1---2---3---4---5---6---7---8---9---10---11---12---13---14---15 Mycketlåga höga
varken låga eller höga

”Enkät nr 2 om fysisk aktivitet vid arbetspendling”
10. Hur uppfattar du förekomsten av konflikter mellan dig som cyklist och andra trafikanter (inklusive fotgängare) under din färdväg?
Innerstaden: Mycket 1---2---3---4---5---6---7---8---9---10---11---12---13---14---15 Mycketlåg hög
varken låg eller hög
Ytterstaden: Mycket 1---2---3---4---5---6---7---8---9---10---11---12---13---14---15 Mycketlåg hög
varken låg eller hög
11. Ungefär hur stor del av din färdväg består av cykelbana/cykelfält/cykelväg separerad från bilar? Ringa in ungefärlig andel.
Innerstaden: 0 % ----10----20----30----40----50----60----70----80----90----100 %
Ytterstaden: 0 % ----10----20----30----40----50----60----70----80----90----100 %
12. Hur otrygg/trygg känner du dig i trafiken som cyklist under din färd?
Innerstaden: Mycket 1---2---3---4---5---6---7---8---9---10---11---12---13---14---15 mycketotrygg trygg
varken otrygg eller trygg
Ytterstaden: Mycket 1---2---3---4---5---6---7---8---9---10---11---12---13---14---15 Mycketotrygg trygg
varken otrygg eller trygg

”Enkät nr 2 om fysisk aktivitet vid arbetspendling”
13. Hur uppfattar du tillgången på grönska (naturområden, parker, planteringar, träd) längs med färdvägen?
Innerstaden: Mycket 1---2---3---4---5---6---7---8---9---10---11---12---13---14---15 Mycketlåg hög
varken låg eller hög
Ytterstaden: Mycket 1---2---3---4---5---6---7---8---9---10---11---12---13---14---15 Mycketlåg hög
varken låg eller hög
14. Hur fula/vackra uppfattar du att omgivningarna kring din färdväg är?
Innerstaden: Mycket 1---2---3---4---5---6---7---8---9---10---11---12---13---14---15 Mycketfula vackra
varken fula eller vackra
Ytterstaden: Mycket 1 ---2---3---4---5---6---7---8---9---10---11---12---13---14---15 Mycketfula vackra
varken fula eller vackra
15. Hur mycket upplever du att din cykeltur försvåras av färdvägens dragning? T.ex. dragning med många tvära svängar, omvägar, riktningsförändringar, sidbyten osv.
Innerstaden: Väldigt 1---2---3---4---5---6---7---8---9---10---11---12---13---14---15 Väldigtlite mycket
varken lite eller mycket
Ytterstaden: Väldigt 1---2---3---4---5---6---7---8---9---10---11---12---13---14---15 Väldigtlite mycket
varken lite eller mycket

”Enkät nr 2 om fysisk aktivitet vid arbetspendling”
16. Hur mycket upplever du att din cykeltur försvåras av färdvägens backighet? Utgå från färdvägen till och från arbets-/studieplatsen.
Innerstaden: Väldigt 1---2---3---4---5---6---7---8---9---10---11---12---13---14---15 Väldigt lite mycket
varken lite eller mycket
Ytterstaden: Väldigt 1---2---3---4---5---6---7---8---9---10---11---12---13---14---15 Väldigtlite mycket
varken lite eller mycket
17. Hur mycket upplever du att din framkomlighet försämras av antalet rödljus under din färd till arbets-/studieplatsen?
Innerstaden: Väldigt 1---2---3---4---5---6---7---8---9---10---11---12---13---14---15 Väldigtlite mycket
varken lite eller mycket
Ytterstaden: Väldigt 1---2---3---4---5---6---7---8---9---10---11---12---13---14---15 Väldigtlite mycket
varken lite eller mycket
18. Hur kort/lång upplever du att din färdväg är?
Innerstaden: Väldigt 1---2---3---4---5---6---7---8---9---10---11---12---13---14---15 Väldigt kort lång
varken kort eller lång
Ytterstaden: Väldigt 1---2---3---4---5---6---7---8---9---10---11---12---13---14---15 Väldigtkort lång
varken kort eller lång

PAPER I

Publications in the series Örebro Studies in Sport Sciences
1. Gustafsson, Henrik (2007). Burnout in competitive and elite athletes.
2. Jouper, John (2009). Qigong in Daily Life. Motivation and Intention to Mindful Exercise.
3. Wåhlin Larsson, Britta (2009). Skeletal Muscle in Restless Legs Syndrome (RLS) and Obstructive Sleep Apnoea Syndrome (OSAS).
4. Johansson, Mattias (2009). Qigong: Acute affective responses in a group of regular exercisers.
5. Cardell, David (2009). Barndomens oas. En tvärvetenskaplig studie av kulturindustriella intressen och organisering av evenemang genom exemplet Stadium Sports Camp. Licentiat.
6. Isberg, Jenny (2009). Viljan till fysisk aktivitet. En intervention avsedd att stimulera ungdomar att bli fysiskt aktiva.
7. Oskarsson, Eva (2010). Lateral epicondylitis. Intramuscular blood flow, pressure and metabolism in the ECRB muscle.
8. Andersson, Helena (2010). The physiological impact of soccer on elite female players and the effects of active recovery training.
9. Åkesson, Joakim (2010). Idrottens akademisering. Kunskapsproduktion och kunskapsförmedling inom idrottsforskning och högre idrottsutbildning. Licentiat.
10. Eliason, Gabriella (2010). Skeletal muscle characteristics and physical activity patterns in COPD.
11. Hedén, Anders (2011). Mental dynamisk prestation. Påverkansprocessen utifrån ett idrottsligt perspektiv.
12. Stigell, Erik (2011). Assessment of active commuting behaviour – walking and bicycling in Greater Stockholm.
13. Wahlgren, Lina (2011). Studies on Bikeability in a Metropolitan Area Using the Active Commuting Route Environment Scale (ACRES).