Embed Size (px)
Citation preview

Students’ perceptions of academic
quality and approaches to studying in
distance education
John T. E. Richardson*
The Open University, UK
(Submitted 6 August 2003; conditionally accepted 11 December 2003; accepted 4 February
2004)
Attempts to demonstrate a relationship between students’ approaches to studying in higher
education and their perceptions of their academic context have been bedevilled by limitations of
the research instruments and the problem of aggregating students’ perceptions and approaches
across different course units. The extended version of the Course Experience Questionnaire
(Wilson et al., 1997) and the Revised Approaches to Studying Inventory (Entwistle et al., 2000)
were adapted for use in distance education and administered in a postal survey to students taking
seven courses by distance learning with the Open University. Usable responses were obtained from
over 2100 students. Both instruments proved to be remarkably robust, and the students’ scores on
these two instruments shared 61% of their variance. Students’ perceptions of the academic quality
of courses in distance education are strongly associated with the approaches to studying that they
adopt on those courses.
Introduction
Interview-based research that was carried out in both Britain and Sweden during the
1970s identified three predominant approaches to studying in higher education: a
deep approach, based upon understanding the meaning of course materials; a surface
approach, based upon memorising course materials for the purposes of assessment;
and a strategic approach, based upon obtaining the highest grades. The choice of one
approach rather than another appeared to depend on the content, the context and the
demands of specific learning tasks (Marton, 1976; Laurillard, 1979; Ramsden, 1979;
for a detailed review, see Richardson, 2000, ch. 2). More recent quantitative studies
have shown that the same students may exhibit different approaches, depending upon
the demands of different course units (Eley, 1992), the quality of the teaching
(Vermetten et al., 1999) and the nature of the assessment (Scouller, 1998).
* Institute of Educational Technology, The Open University, Walton Hall, Milton Keynes MK7
6AA, UK. Email: [email protected]
British Educational Research Journal
Vol. 31, No. 1, February 2005, pp. 7–27
ISSN 0141-1926 (print)/ISSN 1469-3518 (online)/05/010007-21
# 2005 British Educational Research Association
DOI: 10.1080/0141192052000310001

These findings suggest that changes in the design and the delivery of specific
courses will affect how students tackle those courses. In particular, they imply that
the choice of appropriate course design, teaching methods and modes of assessment
will induce desirable approaches to studying. Unfortunately, there is very little
empirical evidence that educational interventions can induce desirable changes in
students’ approaches to studying (Gibbs, 1992; Kember et al., 1997; Hambleton
et al., 1998). One explanation for this is that the impact of contextual factors is
mediated by students’ perceptions of their academic environment. It follows that
educational interventions will not be effective unless they serve to modify the
students’ perceptions. However, this kind of account assumes that there is a direct
association between students’ approaches to learning and their perceptions of the
academic environment.
In this article, I first review the evidence for this assumption that has been
obtained in research carried out at campus-based institutions of higher education.
The evidence proves to be equivocal because of limitations of the survey instruments
and the problem of aggregating students’ accounts across different course units. I
then present a new study that evaluates the assumption of a link between students’
perceptions and approaches to studying using robust instruments to obtain data
from students taking individual courses by distance learning.
Initial evidence on students’ perceptions and approaches to studying
In the light of the results of interview-based research, Ramsden and Entwistle (1981)
devised the Approaches to Studying Inventory (ASI) to obtain self-reports from
students on various aspects of studying, subsumed under a ‘meaning orientation’, a
‘reproducing orientation’, an ‘achievement orientation’ and a ‘nonacademic
orientation’. They also developed the Course Perceptions Questionnaire (CPQ) to
obtain students’ accounts of eight different aspects of their academic environment.
Ramsden and Entwistle obtained data on both instruments from 2208 students at 54
institutions of higher education, and they carried out a factor analysis on these data
in order to identify scales of the CPQ and subscales of the ASI that loaded on the
same factors. This yielded a number of relationships between the two instruments:
(a) Perceptions of a heavy workload on the CPQ were associated with higher scores
on the subscales of the ASI that defined a reproducing orientation (namely,
Surface Approach, Syllabus-Boundness, Fear of Failure and Extrinsic
Motivation).
(b) Perceptions of clear goals and standards on the CPQ were associated with
higher scores on the subscales of the ASI that defined an achieving orientation
(Strategic Approach, Disorganised Study Methods, Negative Attitudes to
Studying and Achievement Motivation, where the second and third of these
subscales were scored in reverse).
(c) Higher scores on the subscales of the ASI concerned with intrinsic motivation
and the use of evidence were associated with a positive evaluation of the quality
of teaching in general according to the CPQ.
8 J. T. E. Richardson
Even so, Ramsden and Entwistle acknowledged that there was ‘not a great deal of
overlap’ between the two sets of measures (p. 375; see also Entwistle & Ramsden,
1983, p. 184). Parsons (1988) gave the ASI and the CPQ to English-speaking and
Afrikaans-speaking students at a South African institution of higher education. In
both cases, perceptions of a heavy workload on the CEQ were associated with high
scores on the ASI scales defining a reproducing orientation. In general, however,
Parsons’ results confirmed the impression from Ramsden and Entwistle’s study that
there are few associations between scores on the ASI and the CPQ, and that even
those associations that do attain statistical significance are relatively weak and
unlikely to be of much practical importance (see also Meyer & Parsons, 1989).
Measuring students’ perceptions of their academic context
The failure to find stronger links between these two instruments might have been
due to inherent weaknesses in the CPQ. Meyer (1988) developed a more detailed
questionnaire, and he found a number of associations between students’ responses
to the individual items and their scores on the ASI. On the basis of these results,
Meyer and Muller (1990) devised six scales to measure ‘deep’ and ‘surface’
perceptions of the learning context and added the workload scale from the CPQ to
yield a new instrument, the Qualitative Context Inventory. When this was
administered together with the ASI, it was found that scores on the scales that
measured deep perceptions of the learning context were closely associated with
scores on the ASI subscales defining a meaning orientation, a phenomenon that
Meyer and Muller called the ‘contextual orchestration’ of approaches to studying
(see also Meyer, 1991).
Entwistle and Tait (1990) used a modified version of the ASI and a new
instrument concerned with students’ experiences and evaluations in a survey of
engineering students at five Scottish institutions. On the one hand, students’
perceptions that the content of their courses was interesting and professionally
relevant were associated with higher scores on meaning orientation. On the other
hand, students’ perceptions of a difficult content and a heavy workload were
associated with higher scores on reproducing orientation and non-academic
orientation. In general, however, the degree of overlap between the two
questionnaires was again relatively weak. In particular, there was no clear link
between perceptions of good teaching and students’ scores on meaning orientation.
On the basis of his experience with the CPQ and a similar questionnaire intended
for use with schoolchildren (Ramsden et al., 1989), Ramsden (1991) devised a new
instrument, the Course Experience Questionnaire (CEQ). This was specifically
intended as an indicator of the quality of teaching on particular degree programmes,
and it contained 30 items in five scales corresponding to different aspects of effective
teaching. The defining items of these scales are shown in Table 1. For each item,
respondents indicate their level of agreement with a particular statement on a scale
from 1 to 5. Half of the 30 items are consistent with the meaning of the scale to
which they belong; the other half of the items have a meaning that is opposite to that
of the scale to which they belong, and so these items are scored in reverse.
Students’ perceptions of academic quality 9

Trigwell and Prosser (1991) administered the CEQ and a questionnaire
containing just three subscales from the ASI to 55 nursing students. They found
that the adoption of a surface approach was linked to perceptions of an inappropriate
workload and perceptions of inappropriate assessment. However, other relationships
between the students’ scores on the two questionnaires were small and not
statistically significant. Even so, it could be argued that both the sample size and the
research instrument that Trigwell and Prosser had used to measure approaches to
studying were too limited and consequently were unlikely to detect more subtle
associations with the students’ perceptions of their programme.
Since 1993, an adapted version of the CEQ has been administered annually to all
new graduates from Australian universities. This version contains only 17 of the
original 30 items, and it entirely omits the Emphasis on Independence scale. However,
it includes an extra scale that consists of six items concerned with the fostering of
generic skills. The resulting 23-item version of the CEQ is usually supplemented by an
item that is concerned with whether or not the respondents are satisfied with their
courses in general. For research purposes, Wilson et al. (1997) proposed that the
original 30-item version of the CEQ should be augmented with the Generic Skills
scale to yield a 36-item questionnaire. Wilson et al. presented evidence from
Australian students to demonstrate the reliability and validity of the latter instrument.
Measuring approaches to studying
Nevertheless, the failure to find stronger links between the CPQ and the ASI might
also have been due to inherent weaknesses in the ASI. In particular, some of the
ASI’s subscales do not appear to be very robust, particularly those intended to
measure an achievement orientation and a non-academic orientation (see
Richardson, 2000, pp. 90–96, 101–105, for a review). Richardson (1990) argued
that it was appropriate to abbreviate the ASI to the subscales that had been
consistently identified with a meaning orientation and a reproducing orientation in
the original data reported by Entwistle and Ramsden (1983, p. 52). This yields
Table 1. Defining items of the scales in the original Course Experience Questionnaire
Scale Defining item
Good Teaching Teaching staff here normally give helpful feedback on how
you are going.
Clear Goals and Standards You usually have a clear idea of where you’re going and
what’s expected of you in this course.
Appropriate Workload The sheer volume of work to be got through in this course
means you can’t comprehend it all thoroughly.*
Appropriate Assessment Staff here seem more interested in testing what we have
memorised than what we have understood.*
Emphasis on Independence Students here are given a lot of choice in the work they have
to do.
Note: adapted from Ramsden (1991, p. 134). Items with asterisks are scored in reverse.
10 J. T. E. Richardson

a shortened instrument containing 32 items in eight scales, and this version of the
ASI was successfully used in several research studies (see Richardson, 2000,
pp. 113–118).
Sadlo and Richardson (2003) administered Ramsden’s (1991) version of the CEQ
and the 32 item version of the ASI to 225 students at schools of occupational therapy
in six different countries. They found that the students’ scores on the two
instruments shared more than half of their respective variance. They concluded that
there was an intimate relationship between approaches to studying and perceptions
of the academic environment. A canonical correlation analysis showed that high
scores on the CEQ were associated with low scores on the ASI subscales concerned
with a reproducing orientation rather than with high scores on the ASI subscales
concerned with a meaning orientation. However, Sadlo and Richardson noted that
their students’ scores on meaning orientation were relatively high in comparison with
normative samples, which they ascribed to the applied nature of occupational
therapy.
Since 1992, Entwistle and his colleagues have been developing a new
questionnaire, the Revised Approaches to Studying Inventory (RASI; Entwistle
et al., 2000). In its latest version, this consists of 52 items in 13 subscales that
measure various aspects of a deep approach, a strategic approach and a surface
approach. The subscales themselves are listed in Table 2. Once again, respondents
indicate their level of agreement with each statement on a scale from 1 to 5.
Entwistle et al. considered that the first three subscales in each approach were more
consistently related to one another, but that the others were more peripheral and
likely to show varying relationships across different samples of students.
Kreber (2003) obtained data from 1080 Canadian students on the 52-item version
of the RASI, the 23-item version of the CEQ and 11 new items concerned with the
fostering of student independence. The students were asked to respond with regard
to their perceptions and approaches to studying on particular course units rather
than across their programmes of study. Analysis of the results confirmed the
reliability and the intended factor structure of the 13 subscales in the RASI. Multiple
regression analyses demonstrated that, taken together, the students’ demographic
characteristics and their perceptions of their course units accounted for 20.3% of the
variance in their scores on Deep Approach, 16.5% of the variance in their scores on
Strategic Approach and 36.7% of the variance in their scores on Surface Approach.
Table 2. Subscales contained in the Revised Approaches to Studying Inventory
Deep Approach Strategic Approach Surface Approach
Seeking Meaning Organised Studying Lack of Purpose
Relating Ideas Time Management Unrelated Memorising
Use of Evidence Alertness to Assessment Demands Syllabus-Boundness
Interest in Ideas Achieving Fear of Failure
Monitoring Effectiveness
Students’ perceptions of academic quality 11

Unfortunately, when Kreber carried out a factor analysis of her students’
responses to the CEQ, the Good Teaching scale split into two separate scales
concerned with the provision of feedback on students’ work and with the quality of
classroom instruction, respectively. In the context of individual course units, the
former is likely to depend on institutional policies and practices, whereas the latter is
likely to depend on the competence of particular teachers. Perhaps more crucially for
present purposes, Kreber did not report separately the proportion of variance in her
students’ scores on the RASI that could be explained by variations in their scores on
the CEQ rather than by variations in demographic variables such as age and gender.
Nevertheless, Kreber’s study raises a more fundamental issue. The CEQ was
intended to measure the quality of teaching across entire degree programmes, and
Wilson et al. (1997) explicitly advised that it should not be used to obtain feedback
on specific topics or teachers. However, the same students may evaluate different
course units in different ways, depending on their perceptions of the teachers’
competence and of the assessment demands (Eley, 1992; Scouller, 1998; Vermetten
et al., 1999). If the CEQ is used at the programme level, therefore, it provides merely
an aggregate view that fails to reflect variations in the students’ experience across
different course units. It may similarly not be useful to ask about students’
approaches to studying at the programme level if these, too, show variations across
different course units.
In fact, Prosser et al. (1994) modified the CEQ to refer to particular topics (such
as mechanics in a physics programme or photosynthesis in a biology programme),
while Lucas et al. (1997) used a version of the CEQ concerned with students’
perceptions of individual course units to compare their experience of large and small
classes. However, it is not clear how easily students on full-time programmes can
differentiate their experiences of different topics or course units. This issue may be
less serious for students on part-time programmes and especially for those studying
part-time by distance learning, because these students may be taking only one or two
course units at a time. Accordingly, research in distance education may provide a
clearer picture of the relationship between students’ perceptions of the quality of
their courses and the approaches to studying that they adopt on those courses.
Students’ perceptions and approaches to studying in distance education
Distance-learning students may have perceptions and approaches to studying that
are different from those of campus-based students. At a purely descriptive level,
distance-learning students are less likely to have a social, extrinsic orientation to
studying and are more likely to have a personal or intrinsic orientation to studying
than campus-based students (Taylor et al., 1981). Distance-learning students also
produce higher scores on the subscales of the ASI measuring a deep approach and
lower scores on the subscales of the ASI that measure a surface approach (Morgan
et al., 1980; Harper & Kember, 1986; Wong, 1992; Richardson et al., 1999).
However, distance-learning students also tend to differ from campus-based
students in a number of demographic characteristics. Most obviously, perhaps,
12 J. T. E. Richardson

distance-learning students tend to be older than campus-based students. In terms of
their orientations and approaches to studying, distance-learning students resemble
older campus-based students and differ from younger campus-based students.
Richardson (2000, pp. 179–180) concluded that differences between campus-based
and distance-learning students could be ascribed to differences in age and other
background variables rather than to differences in the mode of course delivery.
Many Australian institutions deliver their programmes both in a campus-based
mode and in a distance-learning mode. Both modes are included in the annual
surveys of Australian graduates, and students’ scores on the 23-item CEQ have been
compared in published reports. The consistent pattern is for graduates from
distance-learning programmes to obtain higher scores on Good Teaching and
Appropriate Assessment and to be more likely to agree that in general they are
satisfied with the quality of their programmes. Johnson (1997, pp. 39–40, 1998,
pp. 56–57, 73–74) suggested that these trends were due, not to the mode of study
per se, but to the fact that campus-based students and distance-learning students
tended to enrol on programmes in different disciplines that employed different
modes of assessment.
However, questionnaires developed for use with students at campus-based
institutions of higher education may well need to be adapted for use with students in
distance education. In particular, items that refer to ‘lecturers’ or ‘teaching staff’ may
be inappropriate when the curriculum is delivered primarily by written course
materials rather than through face-to-face instruction. In fact, most distance-
learning institutions use various kinds of personal support (such as face-to-face
tutorials, residential schools and teleconferencing) to try to narrow what Moore
(1980) called the ‘transactional distance’ with their students. This means that
teachers in distance education have specific roles as writers of course materials and
as tutors, and this needs to be taken into account in the construction and analysis of
student questionnaires.
Richardson and Woodley (2001) amended the 36-item version of the CEQ for use
in distance education by removing references to ‘lecturers’ or ‘teaching staff’ so that
the items in question referred to tutors or to teaching material. The aim of their
study was to compare perceptions of students with and without a hearing loss, and so
they also amended the CEQ in accordance with good practice in the construction of
assessment materials for people with a hearing loss (Nickerson et al., 1986; Vernon &
Andrews, 1990, ch. 10). This required the use of simple vocabulary and syntax as
well as the elimination of abstract and metaphorical constructions. These
modifications might be expected to enhance the reliability and validity of the
CEQ for respondents with no hearing loss, too (Miller & Herrmann, 1997).
Richardson and Woodley obtained responses to the modified CEQ from 265
students with a hearing loss who were taking courses by distance learning with the
Open University in the UK and from 178 students taking the same courses with no
form of disability. The results confirmed the reliability and the intended factor
structure of the CEQ except in two respects. First, the Good Teaching scale split
into two separate scales concerned with good materials and good tutoring. This was
Students’ perceptions of academic quality 13

not surprising, given the manner in which its constituent items had been reworded.
Second, the original Emphasis on Independence scale was reflected in a factor that
was more narrowly focused upon student choice rather than student autonomy.
Lawless and Richardson (2002) administered Richardson and Woodley’s version
of the CEQ together with a similarly modified version of Richardson’s (1990) 32-
item ASI to students taking six different courses by distance learning with the Open
University. Results from more than 1200 students confirmed the reliability and
intended factor structure of the CEQ, except that once again the Good Teaching
scale split into two separate scales relating to good materials and good tutoring, and
the Emphasis on Independence scale proved to be more narrowly concerned with
student choice. In addition, the students’ scores on the CEQ and the ASI shared
47% of their respective variance, confirming the idea of an association between
students’ approaches to studying and their perceptions of their academic
environment.
Richardson and Price (2003) repeated Lawless and Richardson’s study with
students who were taking two different courses in computing with the Open
University. In both cases, tutorial support was provided by electronic mail rather than
by face-to-face tutorials. Results from 241 students generally replicated Lawless and
Richardson’s findings with regard to the reliability and factor structure of the CEQ,
and the students’ scores on the CEQ and the ASI shared 64% of their respective
variance. Although Lawless and Richardson and Richardson and Price also confirmed
the intended factor structure of the 32-item ASI, in both cases the reliability of several
of its subscales was fairly poor by conventional psychometric criteria.
In other words, distance education appears to provide an appropriate context in
which to assess the hypothesis of an association between students’ perceptions of
particular courses and the approaches to studying that they adopt on those courses.
Nevertheless, the results of previous studies may be qualified by the limitations of
the survey instruments that have been employed. The CEQ and the RASI are
psychometrically superior to the CPQ and the ASI, and therefore the present study
was carried out to evaluate approaches to studying according to the RASI and
perceptions of academic quality according to the CEQ in students taking seven
courses by distance learning. The main interest lay in evaluating the extent and
nature of the overlap between the students’ scores on the subscales of the RASI and
the scales of the CEQ.
Method
Context
The Open University was established in 1969 to provide degree programmes by
distance education throughout the UK. Originally, nearly of all its courses were
delivered by correspondence materials, combined with television and radio
broadcasts, video and audio recordings, tutorial support at a local level and (in
some cases) week-long residential schools. In recent years, however, the University
has made increasing use of computer-based support, particularly CD-ROMs,
14 J. T. E. Richardson

dedicated websites and computer-mediated conferencing. It accepts all applicants
over the normal minimum age of 18 onto its courses without imposing formal
entrance requirements, subject only to limitations of numbers on individual courses.
The majority of the Open University’s courses run from February to October and
are weighted at either 30 or 60 credit points, on the basis that full-time study would
consist of courses worth 120 credit points in any calendar year. Students are
permitted to register for two or more courses up to a maximum load of 120 credit
points, but the majority register for just one course at a time. Courses contributing to
the University’s undergraduate programme are classified as introductory, inter-
mediate or honours, and since the year 2000 schemes of study that lead to a wide
range of named degrees have been introduced. Nevertheless, the programme retains
a modular structure in which prerequisite requirements are minimised. Most courses
are assessed by a combination of written assignments (submitted by post or
electronic mail) and traditional unseen examinations (taken at regional assessment
centres).
Participants
Seven courses presented in 2001 were chosen for this study. To maximise the
response rates, courses were chosen that had not been included in the annual survey
conducted under the University’s quality assurance procedures during 2001. Four
courses were chosen from the Arts Faculty, two were chosen from the Science
Faculty, and the last was a multidisciplinary course. Three of these courses were
rated at 30 credit points, and the rest were rated at 60 credit points. The courses
themselves will not be identified here but will be simply referred to as Courses 1–7.
Table 3 shows the number of students registered on each course and of those who
responded to the present survey.
Materials and procedure
The 52-item RASI was modified for use with students in distance education and
combined with the 36-item version of the CEQ devised by Richardson and Woodley
Table 3. Characteristics and response rates for seven courses
Course Faculty Level Credit
points
Number of
students
Number of
respondents
Response rate
(%)
1 Arts Intermediate 30 621 358 57.6
2 Arts Intermediate 60 654 454 69.4
3 Arts Honours 30 384 240 62.5
4 Arts Honours 60 633 430 67.9
5 Science Intermediate 30 541 278 51.4
6 Science Intermediate 60 305 136 44.6
7 Multidisciplinary Intermediate 30 455 281 61.8
Students’ perceptions of academic quality 15

(2001). The CEQ was further modified to refer to the specific course that each
student had taken in 2001, and the instructions referred to ‘your personal experience
of studying [course] in 2001’. For each item, the participants were asked to indicate
the extent of their agreement or disagreement with the relevant statement on a
5-point scale from 5 for ‘definitely agree’ to 1 for ‘definitely disagree’, where the
midpoint (3) was ‘only to be used if the statement doesn’t apply to you or if you
really find it impossible to give a definite answer’. The questionnaire was mailed to
students in January 2002, and a reminder was sent out later that month.
Results and discussion
A total of 2177 students returned completed copies of the questionnaire,
representing an overall response rate of 60.6%; 36% of the respondents were male,
64% were female; and they were aged between 21 and 87 with a mean of 48.0 years.
Table 3 shows the response rates for the seven courses. These varied significantly
from one another, X2(6, N52177)590.62, p50.00, but in each case they would be
considered adequate for a postal survey (Babbie, 1973, p. 165; Kidder, 1981,
pp. 150–151).
The first part of the data analysis was concerned with the psychometric properties
of the CEQ and the RASI in the context of distance education. Their internal
consistency was evaluated using Cronbach’s (1951) coefficient alpha; their construct
validity was evaluated using exploratory factor analysis; and their discriminant
validity was evaluated by means of comparisons among the students taking the seven
courses, adjusted for the possible effects of variations in age and gender. The second
part of the analysis was concerned with identifying relationships between scores on
the CEQ and scores on the RASI using canonical correlation analysis. Values of g2
(equal to the complement of Wilks’ lambda) are provided as measures of effect size
(Tabachnik & Fidell, 1996, p. 390).
CEQ scores
On examining the responses to the CEQ, it was found that 393 students had failed to
provide a response to one or more of the 36 items. In most cases, these were isolated
instances, and it was felt appropriate to regard them as items that did not apply to
the student in question; accordingly, they were coded as ‘3’ (i.e., ‘doesn’t apply to
me’). However, 25 respondents had missed more than four items, and they were
dropped from further analysis. Accordingly, the final sample consisted of 2152
students who had provided usable sets of data.
The different scales identified by Richardson and Woodley (2001) contain varying
numbers of items, and so the students were assigned scores on each of these seven
scales by computing the mean response across the relevant items. Descriptive
statistics are provided in Table 4. The scores on all seven scales showed a satisfactory
level of internal consistency, as evidenced by values of Cronbach’s (1951) coefficient
alpha between 0.63 and 0.86.
16 J. T. E. Richardson

An exploratory factor analysis was carried out on these scale scores. First, a
principal components analysis was used to determine the number of factors to
extract. This identified one component with an eigenvalue greater than 1, which
explained 45.0% of the total variance. The idea that just one factor should be
extracted was supported by Cattell’s (1966) scree test using both visual inspection
and Zoski and Jurs’ (1996) objective procedure, and it was also confirmed by a
comparison with the results of a parallel analysis of 1000 random correlation
matrices using the program devised by O’Connor (2000). For the main analysis, the
aim was to identify global dimensions underlying students’ perceptions. Principal
axis factoring was therefore used to extract just one factor with squared multiple
correlations as the initial estimates of community.
The loadings of the seven scales on the single extracted factor are shown in
Table 4. All seven scales showed loadings greater than 0.30 in magnitude, which
indicates that this factor can be interpreted as an overall measure of perceived
academic quality. However, the precise pattern of loadings implies that students’
perceptions of academic quality were determined somewhat more by their
perceptions of receiving good materials and clear goals and standards than by their
perceptions of receiving generic skills, good tutoring, appropriate assessment, choice
in their studies, or an appropriate workload. A second-order factor-based scale,
labelled ‘Perceived Academic Quality’, was constructed by computing each
student’s mean score across the seven CEQ scales (cf. Pedhazur & Schmelkin,
1991, pp. 625–626). This scale exhibited good internal consistency, as shown by a
coefficient alpha of 0.79.
A 37th item (‘In general, I am satisfied with the quality of [course]’) is often
included in the CEQ to validate its use as a measure of perceived quality. All of the
students who had provided usable responses to the CEQ had responded to this item.
The overall mean response on a scale from 1 to 5 was 4.25, and the modal response
on all seven courses was 4, which implies a high degree of satisfaction. The
correlation coefficients between the scores on the seven scales and the responses to
Item 37 were: Appropriate Assessment, +0.39; Appropriate Workload, +0.43; Clear
Table 4. Means, standard deviations, coefficient alphas and factor loadings of CEQ scales
Scale No. of
items
Mean SD Coefficient
alpha
Factor
loadings
Appropriate Assessment 6 4.14 0.75 0.63 0.53
Appropriate Workload 5 3.08 1.09 0.85 0.47
Clear Goals and Standards 4 3.67 0.95 0.81 0.73
Generic Skills 7 3.23 0.83 0.82 0.60
Good Materials 3 4.01 0.84 0.76 0.74
Good Tutoring 8 3.72 0.81 0.86 0.58
Student Choice 3 2.73 0.79 0.67 0.52
Perceived Academic Quality 3.51 0.58
Note: N52152.
Students’ perceptions of academic quality 17

Goals and Standards, +0.57; Generic Skills, +0.43; Good Materials, +0.66; Good
Tutoring, +0.40; and Student Choice, +0.35 (p50.00 in each case).
In other words, the students’ reported level of satisfaction with Open University
courses was determined rather more by their perceptions of receiving good materials
and clear goals and standards than by their perceptions of receiving generic skills, an
appropriate workload, good tutoring, appropriate assessment, or choice in their
studies. This is very similar to the pattern of loadings of the seven scales on the single
extracted factor, and this in turn provides further support for the interpretation of
this second-order factor as a measure of perceived academic quality.
A univariate analysis of variance was carried out on the measure of perceived
academic quality to compare the students who had taken the seven courses,
controlling for the covariates of age and gender (which were unavailable for one
student). There was a weak but statistically significant difference among the students
who had taken the seven courses, F(6, 2142)53.57, g250.01, p50.00. However, the
effects of age, F(1, 2142)50.43, g250.00, p50.51, and gender, F(1, 2142)52.84,
g250.00, p50.09, were not significant.
In short, the seven scales of the CEQ proved to have satisfactory internal
consistency according to the values of coefficient alpha. The construct validity of the
CEQ was shown by the fact that they collectively defined a single higher-order factor
that could be interpreted as a measure of perceived academic quality. Its
discriminant validity was shown by the fact that it differentiated among students
who had taken different courses. The latter variation was not particularly great, but
this can be attributed to the common ‘house style’ of Open University courses and
the impact of a rigorous and centralised system of quality assurance (Lawless &
Richardson, 2004).
RASI scores
On examining the responses to the RASI, it was found that 89 students had not
provided a response to one or more of the 52 items. In most cases, these were again
isolated instances, and it was felt appropriate to regard them as items that did not
apply to the student in question; accordingly, they were coded as ‘3’ (i.e., ‘doesn’t
apply to me’). However, 28 respondents had missed more than four items, and so
they were dropped from further analysis. Accordingly, the final sample consisted of
2149 students who had provided usable sets of data. Following Entwistle et al.
(2000), subscale scores were assigned by computing the total scores across the
relevant items, and therefore these scores vary between 4 and 20; scale scores were
similarly assigned by computing the total scores across the relevant subscales.
Descriptive statistics are summarised in Table 5. The scores on the 13 subscales
generally exhibited a satisfactory level of internal consistency, as evidenced by values
of Cronbach’s (1951) coefficient alpha between 0.50 and 0.82.
An exploratory factor analysis was carried out on these subscale scores. First, a
principal components analysis was again used to determine the number of factors to
extract. This analysis identified three components with eigenvalues greater than 1,
18 J. T. E. Richardson

which explained 60.8% of the total variance. The idea that three factors should be
extracted was supported by Cattell’s (1966) scree test both through visual inspection
and using Zoski and Jurs’ (1996) procedure, and it was also confirmed by
comparison with the results of a parallel analysis of 1000 random correlation
matrices using the program devised by O’Connor (2000). For the main analysis, the
aim was to identify more global approaches to studying. Consequently, principal axis
factoring was used to extract three factors with squared multiple correlations as the
initial estimates of community.
Finally, the extracted factor matrix was submitted to oblique rotation using a
quartimin method. The loadings of the subscales on the three extracted factors are
shown in Table 5. It is clear that the factors reflected a deep approach, a surface
approach and a strategic approach, respectively. There was a positive correlation
between the first and third factors, but there were smaller negative correlations
between the second factor and both the first and third factors.
A multivariate analysis of variance was carried out on the students’ scores on the
three main scales of the RASI to compare the students who had taken the seven
Table 5. Means, standard deviations, coefficient alphas and factor loadings of RASI subscales
Subscale Mean SD Coefficient
alpha
Factor loadings
1 2 3
Deep Approach
Seeking Meaning 16.35 2.73 0.68 0.67 20.04 0.20
Relating Ideas 15.20 2.85 0.63 0.84 20.03 20.08
Use of Evidence 15.85 2.53 0.61 0.77 0.11 0.09
Interest in Ideas 17.24 2.58 0.70 0.58 20.13 0.03
Total 64.63 8.72
Strategic Approach
Organised Studying 13.15 3.44 0.55 0.02 20.19 0.68
Time Management 15.03 3.86 0.82 20.11 20.17 0.85
Alertness to Assessment
Demands
13.31 3.19 0.58 0.07 0.25 0.40
Achieving 16.45 2.71 0.65 0.17 20.17 0.63
Monitoring Effectiveness 16.76 2.75 0.69 0.32 0.05 0.52
Total 74.69 11.85
Surface Approach
Lack of Purpose 5.85 2.57 0.63 20.12 0.48 20.16
Unrelated Memorising 9.24 3.01 0.50 20.10 0.66 0.02
Syllabus-Boundness 10.98 3.39 0.59 20.31 0.43 0.07
Fear of Failure 11.90 4.47 0.80 0.12 0.62 20.12
Total 37.97 9.64
Factor correlations
Factor 1 1.00 20.27 0.44
Factor 2 20.27 1.00 20.17
Factor 3 0.44 20.17 1.00
Note: N52149.
Students’ perceptions of academic quality 19

courses, controlling for the covariates of age and gender. There was once again a
statistically significant difference among the students who had taken the seven
courses, F(18, 6045)58.08, g250.07, p50.00, and there were statistically significant
though weaker effects of age, F(3, 2137)520.15, g250.03, p50.00, and gender, F(3,
2137)522.97, g250.03, p50.00.
Univariate tests demonstrated that there were statistically significant differences
among the students who had taken the seven courses in terms of their scores on
Deep Approach, F(6, 2139)511.95, g250.03, p50.00, Strategic Approach, F(6,
2139)54.43, g250.01, p50.00, and Surface Approach, F(6, 2139)57.55, g250.02,
p50.00. Age was positively correlated with scores on Deep Approach, F(1,
2139)529.04, g250.01, p50.00, and on Strategic Approach, F(1, 2139)550.31,
g250.02, p50.00, but negatively correlated with scores on Surface Approach, F(1,
2139)522.97, g250.01, p50.00. Women produced higher scores than men on
Strategic Approach, F(1, 2139)526.57, g250.01, p50.00, and on Surface
Approach, F(1, 2139)521.80, g250.01, p50.00, but not on Deep Approach, F(1,
2139)51.83, g250.00, p50.18.
In short, the 13 scales of the RASI proved to have satisfactory internal consistency
according to the values of coefficient alpha. The construct validity of the RASI was
shown by the fact that they collectively defined three higher-order factors that
corresponded to the three original approaches to studying. The discriminant validity
of the RASI was shown by the fact that it differentiated among students who had
taken different courses. The latter variation was not particularly great, but this can
again be attributed to the common ‘house style’ of Open University courses and the
impact of a rigorous and centralised system of quality assurance.
Relationships between CEQ scores and RASI scores
Of the 2177 respondents, 2137 students produced usable responses to both the
CEQ and the RASI. Table 6 shows the correlation coefficients between their scores
on the CEQ and the RASI. All but three of these correlation coefficients were
statistically significant (a50.05, two-tailed tests), which is in itself unsurprising,
given the size of the sample. A multivariate analysis of variance showed that the
proportion of variance shared between the scores on the CEQ and the scores on the
RASI was 61%, F(91, 13205)523.80, g250.61, p50.00.
A canonical correlation analysis was carried out on the within-group regression
between the scores on the seven scales of the CEQ and the 13 subscales of the RASI.
All seven canonical correlations were statistically significant, but only the first two
canonical correlations accounted for an overlap in variance of more than 10%. The
correlation coefficients between the first two canonical variates and the scores on the
20 dependent variables are shown in Table 7.
The first canonical variate was positively associated with all of the scales of the
CEQ, with the four subscales defining a deep approach, and with four of the five
subscales defining a strategic approach, but it was negatively associated with the four
subscales defining a surface approach. In other words, perceptions of academic
20 J. T. E. Richardson

quality were positively related to the more desirable approaches to studying (a deep
approach and, to a lesser extent, a strategic approach) and negatively related to
undesirable approaches to studying (a surface approach). The absolute magnitude of
the associations tended to be greater for the subscales defining a surface approach: in
other words, positive perceptions of academic quality tended to be more strongly
related to the discouragement of undesirable approaches to studying than to the
encouragement of more desirable approaches.
The second (and less important) covariate was positively associated with scores on
Generic Skills, Good Materials, Fear of Failure, Monitoring Effectiveness, and
Interest in Ideas, but negatively associated with scores on Appropriate Workload.
This suggests that students who combined the peripheral aspects of all three
approaches to studying perceived their courses as enhancing their generic skills at the
expense of incurring a heavier workload.
Conclusions
In this study, the RASI was administered to a large, representative sample of
students taking courses by distance learning. The results demonstrate that, like the
CEQ (cf. Richardson & Woodley, 2001), the RASI is remarkably robust in the
highly distinctive context of the Open University. This study also enabled a direct
comparison to be made between students’ scores on the RASI and the same
students’ scores on the CEQ. The results are consistent with those obtained by
Table 6. Correlation coefficients between RASI subscale scores and CEQ scale scores
RASI subscales CEQ scales
AA AW CG GS GM GT SC
Deep Approach
Seeking Meaning 0.26 0.19 0.22 0.28 0.24 0.19 0.13
Relating Ideas 0.23 0.16 0.16 0.29 0.24 0.17 0.16
Use of Evidence 0.20 0.10 0.10 0.21 0.15 0.12 0.06
Interest in Ideas 0.27 0.15 0.20 0.34 0.35 0.19 0.20
Strategic Approach
Organised Studying 0.15 0.13 0.17 0.18 0.13 0.10 0.08
Time Management 0.16 0.10 0.17 0.17 0.14 0.09 0.04
Alertness to Assessment Demands 20.01 20.04 0.04 0.17 0.06 0.09 0.02
Achieving 0.25 0.18 0.26 0.30 0.25 0.21 0.10
Monitoring Effectiveness 0.20 0.10 0.22 0.27 0.21 0.21 0.12
Surface Approach
Lack of Purpose 20.33 20.31 20.39 20.28 20.42 20.27 20.22
Unrelated Memorising 20.42 20.42 20.40 20.21 20.30 20.22 20.17
Syllabus-Boundness 20.27 20.23 20.16 20.11 20.15 20.14 20.11
Fear of Failure 20.19 20.53 20.30 20.02 20.15 20.13 20.06
Note: AA, Appropriate Assessment; AW, Appropriate Workload; CG, Clear Goals and Standards;
GS, Generic Skills; GM, Good Materials; GT, Good Tutoring; SC, Student Choice. N52137.
Students’ perceptions of academic quality 21
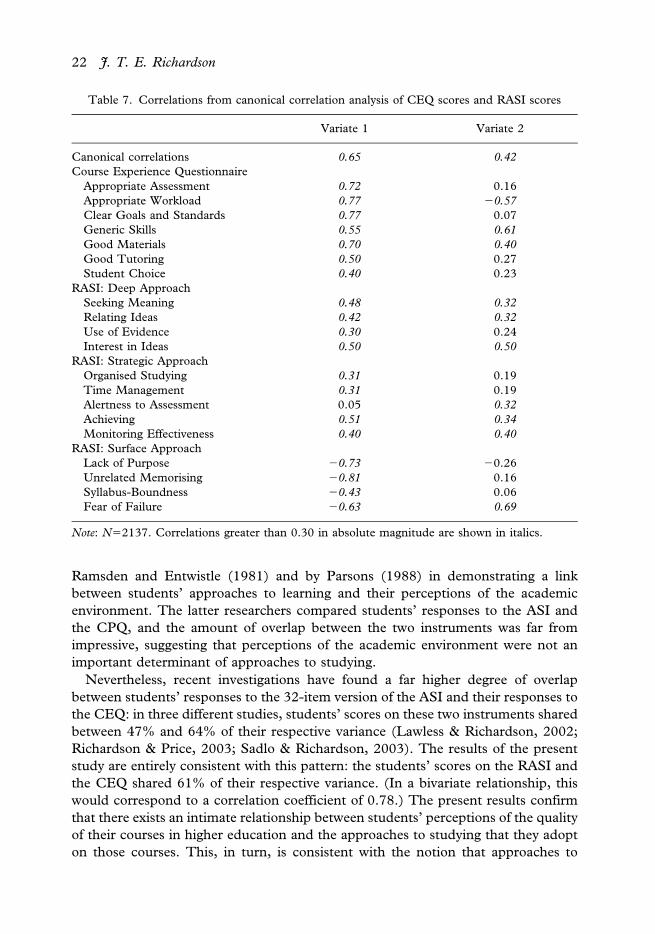
Ramsden and Entwistle (1981) and by Parsons (1988) in demonstrating a link
between students’ approaches to learning and their perceptions of the academic
environment. The latter researchers compared students’ responses to the ASI and
the CPQ, and the amount of overlap between the two instruments was far from
impressive, suggesting that perceptions of the academic environment were not an
important determinant of approaches to studying.
Nevertheless, recent investigations have found a far higher degree of overlap
between students’ responses to the 32-item version of the ASI and their responses to
the CEQ: in three different studies, students’ scores on these two instruments shared
between 47% and 64% of their respective variance (Lawless & Richardson, 2002;
Richardson & Price, 2003; Sadlo & Richardson, 2003). The results of the present
study are entirely consistent with this pattern: the students’ scores on the RASI and
the CEQ shared 61% of their respective variance. (In a bivariate relationship, this
would correspond to a correlation coefficient of 0.78.) The present results confirm
that there exists an intimate relationship between students’ perceptions of the quality
of their courses in higher education and the approaches to studying that they adopt
on those courses. This, in turn, is consistent with the notion that approaches to
Table 7. Correlations from canonical correlation analysis of CEQ scores and RASI scores
Variate 1 Variate 2
Canonical correlations 0.65 0.42
Course Experience Questionnaire
Appropriate Assessment 0.72 0.16
Appropriate Workload 0.77 20.57
Clear Goals and Standards 0.77 0.07
Generic Skills 0.55 0.61
Good Materials 0.70 0.40
Good Tutoring 0.50 0.27
Student Choice 0.40 0.23
RASI: Deep Approach
Seeking Meaning 0.48 0.32
Relating Ideas 0.42 0.32
Use of Evidence 0.30 0.24
Interest in Ideas 0.50 0.50
RASI: Strategic Approach
Organised Studying 0.31 0.19
Time Management 0.31 0.19
Alertness to Assessment 0.05 0.32
Achieving 0.51 0.34
Monitoring Effectiveness 0.40 0.40
RASI: Surface Approach
Lack of Purpose 20.73 20.26
Unrelated Memorising 20.81 0.16
Syllabus-Boundness 20.43 0.06
Fear of Failure 20.63 0.69
Note: N52137. Correlations greater than 0.30 in absolute magnitude are shown in italics.
22 J. T. E. Richardson

studying depend on the perceived content, context and demands of the learning
task.
In the present investigation, neither the age nor the gender of the students was
related to their scores on the CEQ, which suggests that they were capable of
evaluating their courses in a manner that was essentially independent of their
personal circumstances. Nevertheless, both age and gender showed statistically
significant but weak relationships with their scores on the RASI. As in other studies
(for a review, see Richardson, 1994), older students were more likely to exhibit
desirable approaches to learning and less likely to exhibit undesirable approaches to
learning than were younger students taking the same courses. Moreover, as in
previous research in distance education (Richardson et al., 1999), although not in
campus-based education (Richardson & King, 1991), women were more likely to
adopt a surface approach than men, but there was no gender difference in the
adoption of a deep approach.
Even so, the finding of an overlap between students’ scores on the CEQ and their
scores on the RASI is correlational in nature. Strictly speaking, it says nothing about
either the existence or the direction of a causal relationship between approaches to
studying and perceptions of the academic environment. It is usually inferred that
variations in students’ perceptions of their learning context give rise to variations in
their approaches to studying (e.g. Ramsden, 1988; Trigwell & Prosser, 1991; Prosser
& Sendlak, 1994; Prosser et al., 1994; cf. Biggs, 1987, pp. 9, 96). Nevertheless, it is
in principle possible that variations in students’ approaches to studying give rise to
variations in their perceptions of the learning context. Marsh (1987) suggested that
students might rate their courses more highly if they received better grades;
analogously, students might judge their programmes more favourably because they
find they have adopted more congenial ways of studying.
Yet another possibility is that the causal link between students’ perceptions of
their academic environment and their approaches to studying is bidirectional, so
that variations in perceptions give rise to variations in approaches to studying
and vice versa (cf. Biggs, 1993). Finally, Trigwell and Prosser (1997) proposed that
there was an internal relationship between perceptions of the academic environment
and approaches to studying, so that perceptions and approaches ‘are not
independently constituted but … are considered to be simultaneously present in
the students’ awareness’ (p. 243; see also Prosser & Trigwell, 1999a; 1999b, p. 13).
All of these accounts are equally consistent with the finding of an association
between students’ perceptions of their academic environment and their approaches
to studying.
However, if variations in students’ approaches to studying give rise to variations in
their perceptions of the learning context, then factors that affect their approaches to
studying should, in turn, influence their perceptions of the learning context. It is
hard to square this idea with the findings of the present investigation that students’
age and gender predicted their scores on the RASI but were essentially unrelated to
their ratings on the CEQ. Similar results with regard to the effects of age were
obtained by Sadlo and Richardson (2003). A fortiori, these findings are also
Students’ perceptions of academic quality 23

inconsistent with the idea that the causal relationship between perceptions of the
learning context and approaches to studying is bidirectional and with the idea of an
internal relationship between perceptions of the learning context and approaches to
studying: on both these accounts, any factors that influence students’ approaches to
studying should also influence their perceptions of the learning context.
In short, the present findings provide indirect evidence that students’ perceptions
of their academic environment influence their approaches to studying, rather than
vice versa. The fact that age and gender were related to scores on the RASI but not
to ratings on the CEQ entails that demographic characteristics and perceptions of
the academic environment are individually salient but mutually independent
influences on approaches to studying. This conclusion is contrary to a model of
student learning that was put forward by Prosser et al. (1994; Prosser & Sendlak,
1994), according to which perceptions of the learning context are influenced by
demographic characteristics of the students themselves. However, it supports the
more common assumption that student characteristics and contextual factors are
distinct influences on approaches to studying (e.g. Newble & Entwistle, 1986; Biggs,
1987).
Acknowledgements
The author is grateful for James Hartley for his comments on an earlier version of
this paper.
References
Babbie, E. R. (1973) Survey research methods (Belmont, CA, Wadsworth).
Biggs, J. B. (1987) Student approaches to learning and studying (Melbourne, Australian Council for
Educational Research).
Biggs, J. B. (1993) From theory to practice: a cognitive systems approach, Higher Education
Research and Development, 12, 73–85.
Cattell, R. B. (1966) The scree test for the number of factors, Multivariate Behavioral Research, 1,
245–276.
Cronbach, L. J. (1951) Coefficient alpha and the internal structure of tests, Psychometrika, 16,
297–334.
Eley, M. G. (1992) Differential adoption of study approaches within individual students, Higher
Education, 23, 231–254.
Entwistle, N. J. & Ramsden, P. (1983) Understanding student learning (London, Croom Helm).
Entwistle, N. & Tait, H. (1990) Approaches to learning, evaluations of teaching and preferences
for contrasting academic environments, Higher Education, 19, 169–194.
Entwistle, N., Tait, H. & McCune, V. (2000) Patterns of response to an approaches to studying
inventory across contrasting groups and contexts, European Journal of Psychology of
Education, 15, 33–48.
Gibbs, G. (1992) Improving the quality of student learning (Bristol, Technical & Educational Services).
Hambleton, I. R., Foster, W. H. & Richardson, J. T. E. (1998) Improving student learning using
the personalised system of instruction, Higher Education, 35, 187–203.
Harper, G. & Kember, D. (1986) Approaches to study of distance education students, British
Journal of Educational Technology, 17, 212–222.
24 J. T. E. Richardson

Johnson, T. (1997) The 1996 Course Experience Questionnaire. Report prepared for the Graduate
Careers Council of Australia (Parkville, Victoria, Graduate Careers Council of
Australia).
Johnson, T. (1998) The 1997 Course Experience Questionnaire. Report prepared for the
Graduate Careers Council of Australia (Parkville, Victoria, Graduate Careers Council of
Australia).
Kember, D., Charlesworth, M., Davies, H., McKay, J. & Stott, V. (1997) Evaluating the
effectiveness of educational innovations: using the Study Process Questionnaire to show that
meaningful learning occurs, Studies in Educational Evaluation, 23, 141–157.
Kidder, L. H. (1981) Research methods in social relations (New York, Holt, Rinehart & Winston).
Kreber, C. (2003) The relationship between students’ course perception and their approaches to
studying in undergraduate science courses: a Canadian experience, Higher Education
Research and Development, 22, 57–70.
Laurillard, D. (1979) The processes of student learning, Higher Education, 8, 395–409.
Lawless, C. J. & Richardson, J. T. E. (2002) Approaches to studying and perceptions of academic
quality in distance education, Higher Education, 44, 257–282.
Lawless, C. J. & Richardson, J. T. E. (2004) Monitoring the experiences of graduates in distance
education, Studies in Higher Education, 29, 353–374.
Lucas, L., Gibbs, G., Hughes, S., Jones, O. & Wisker, G. (1997) A study of the effects of course
design features on student learning in large classes at three institutions: a comparative study
in: C. Rust & G. Gibbs (Eds) Improving student learning: improving student learning through
course design (Oxford, Oxford Centre for Staff and Learning Development).
Marsh, H. W. (1987) Students’ evaluations of university teaching: research findings,
methodological issues, and directions for future research, International Journal of
Educational Research, 11, 253–388.
Marton, F. (1976) What does it take to learn? Some implications of an alternative view of learning
in: N. Entwistle (Ed) Strategies for research and development in higher education (Amsterdam,
Swets & Zeitlinger).
Meyer, J. H. F. (1988) Student perceptions of learning context and approaches to studying, South
African Journal of Higher Education, 2, 73–82.
Meyer, J. H. F. (1991) Study orchestration: the manifestation, interpretation and consequences of
contextualised approaches to studying, Higher Education, 22, 297–316.
Meyer, J. H. F. & Muller, M. W. (1990) Evaluating the quality of student learning: I. An unfolding
analysis of the association between perceptions of learning context and approaches to
studying at an individual level, Studies in Higher Education, 15, 131–154.
Meyer, J. H. F. & Parsons, P. (1989) Approaches to studying and course perceptions using the
Lancaster Inventory: a comparative study, Studies in Higher Education, 14, 137–153.
Miller, L. A. & Herrmann, D. (1997) Improving survey design: the linguistic complexity of survey
questions and the quality of responses, Cognitive Technology, 2(2), 31–40.
Moore, M. G. (1980) Independent study in: R. D. Boyd, J. W. Apps & Associates (Eds)
Redefining the discipline of adult education (San Francisco, CA, Jossey-Bass).
Morgan, A., Gibbs, G. & Taylor, E. (1980) Students’ approaches to studying the social science and
technology foundation courses: preliminary studies. Study Methods Group Report No. 4 (Milton
Keynes, The Open University, Institute of Educational Technology) (ERIC Document
Reproduction Service No. ED 197 639).
Newble, D. I. & Entwistle, N. J. (1986) Learning styles and approaches: implications for medical
education, Medical Education, 20, 162–175.
Nickerson, W., Zannettou, I. & Sutton, J. (1986) Succeeding with the Deaf Student in College
(Special Needs Occasional Paper No. 4) (York, Longman Group Resources Unit).
O’Connor, B. P. (2000) SPSS and SAS programs for determining the number of components
using parallel analysis and Velicer’s MAP test, Behaviour Research Methods, Instruments, and
Computers, 32, 396–402.
Students’ perceptions of academic quality 25

Parsons, P. G. (1988) The Lancaster Approaches to Studying Inventory and Course Perceptions
Questionnaire: a replicated study at the Cape Technikon, South African Journal of Higher
Education, 2, 103–111.
Pedhazur, E. J. & Schmelkin, L. P. (1991) Measurement, design, and analysis: an integrated approach
(Hillsdale, NJ, Erlbaum).
Prosser, M. & Sendlak, I. (1994) Student evaluation of teaching questionnaire, Research and
Development in Higher Education, 16, 551–555.
Prosser, M. & Trigwell, K. (1999a) Relational perspectives on higher education teaching and
learning in the sciences, Studies in Science Education, 33, 31–60.
Prosser, M. & Trigwell, K. (1999b) Understanding learning and teaching: the experience in higher
education (Buckingham, SRHE & Open University Press).
Prosser, M., Trigwell, K., Hazel, E. & Gallagher, P. (1994) Students’ experiences of teaching
and learning at the topic level, Research and Development in Higher Education, 16,
305–310.
Ramsden, P. (1979) Student learning and perceptions of the academic environment, Higher
Education, 8, 411–427.
Ramsden, P. (1988) Context and strategy: situational influences on learning in: R. R. Schmeck
(Ed) Learning strategies and learning styles (New York, Plenum Press).
Ramsden, P. (1991) A performance indicator of teaching quality in higher education: the Course
Experience Questionnaire, Studies in Higher Education, 16, 129–150.
Ramsden, P. & Entwistle, N. J. (1981) Effects of academic departments on students’ approaches
to studying, British Journal of Educational Psychology, 51, 368–383.
Ramsden, P., Martin, E. & Bowden, J. (1989) School environment and sixth form pupils’
approaches to learning, British Journal of Educational Psychology, 59, 129–142.
Richardson, J. T. E. (1990) Reliability and replicability of the Approaches to Studying
Questionnaire, Studies in Higher Education, 15, 155–168.
Richardson, J. T. E. (1994) Mature students in higher education: I. A literature survey on
approaches to studying, Studies in Higher Education, 19, 309–325.
Richardson, J. T. E. (2000) Researching student learning: approaches to studying in campus-based and
distance education (Buckingham, Open University Press).
Richardson, J. T. E. & King, E. (1991) Gender differences in the experience of higher education:
quantitative and qualitative approaches, Educational Psychology, 11, 363–382.
Richardson, J. T. E., Morgan, A. & Woodley, A. (1999) Approaches to studying in distance
education, Higher Education, 37, 23–55.
Richardson, J. T. E. & Price, L. (2003) Approaches to studying and perceptions of academic
quality in electronically delivered courses, British Journal of Educational Technology, 34,
45–56.
Richardson, J. T. E. & Woodley, A. (2001) Perceptions of academic quality among students with a
hearing loss in distance education, Journal of Educational Psychology, 93, 563–570.
Sadlo, G. & Richardson, J. T. E. (2003) Approaches to studying and perceptions of the academic
environment in students following problem–based and subject-based curricula, Higher
Education Research and Development, 22, 253–274.
Scouller, K. (1998) The influence of assessment method on students’ learning approaches:
multiple choice question examination versus assignment essay, Higher Education, 35,
453–472.
Tabachnik, B. G. & Fidell, L. S. (1996) Using multivariate statistics (3rd edn) (New York,
HarperCollins).
Taylor, L., Morgan, A. & Gibbs, G. (1981) The ‘orientation’ of Open University foundation
students to their studies, Teaching at a Distance, 20, 3–12.
Trigwell, K. & Prosser, M. (1991) Improving the quality of student learning: the influence of
learning context and student approaches to learning on learning outcomes, Higher Education,
22, 251–266.
26 J. T. E. Richardson

Trigwell, K. & Prosser, M. (1997) Towards an understanding of individual acts of teaching and
learning, Higher Education Research and Development, 16, 241–252.
Vermetten, Y. J., Lodewijks, H. G. & Vermunt, J. D. (1999) Consistency and variability of
learning strategies in different university courses, Higher Education, 37, 1–21.
Vernon, M. & Andrews, J. F. (1990) The psychology of deafness: understanding deaf and hard-of-
hearing people (New York, Longman).
Wilson, K. L., Lizzio, A. & Ramsden, P. (1997) The development, validation and application of
the Course Experience Questionnaire, Studies in Higher Education, 22, 33–53.
Wong, S. L. (1992) Approaches to study of distance education students, Research in Distance
Education, 4(3), 11–17.
Zoski, K. & Jurs, S. (1996) An objective counterpart to visual test for factor analysis: the standard
error scree, Educational and Psychological Measurement, 56, 443–451.
Students’ perceptions of academic quality 27