Embed Size (px)
Citation preview

Copyright is owned by the Author of the thesis. Permission is given for a copy to be downloaded by an individual for the purpose of research and private study only. The thesis may not be reproduced elsewhere without the permission of the Author.

i
Students and Sports: The Association between Participation in Sports and Academic
Achievement
A thesis presented in partial fulfilment of the requirements for the degree of
Master of Educational Psychology
At Massey University, College of Education, Albany
New Zealand.
By
Vibha V. Prasad
2012

ii
Declaration
I certify that the thesis entitled “Students and Sports: The Association between Participation
in Sports and Academic Achievement” submitted as part of the degree of Master of
Educational Psychology is the result of my own work, except where otherwise
acknowledged, and that this research paper (or part of the same) has not been submitted for
any other degree to any other university or institution.

iii
Abstract
Previous studies have found that participation in sports is positively associated with
academic achievement for students. Due to the lack of studies in the New Zealand context
and few studies examining Intermediate School students, the purpose of the current study
was to examine the associations between the level of participation in sports and mean grades
for Intermediate students. Data were obtained from self-report measures on sports
participation and academic achievement. These data were gathered via anonymous
questionnaires which were completed by students (n=86) from two different Intermediate
Schools in Auckland. Results from the Independent Samples T-Tests revealed that male
sports participants achieved significantly higher mean grades overall; and higher maths
grades, than male non-sports participants. Further, and not surprisingly, sports participants
from the high decile school achieved higher grades than students from the lower decile
school. Simple Linear Regression revealed that the frequency of sports played per week was
positively associated with mean grades. Results were therefore consistent with previous
studies confirming the value of sports participation.

iv
Acknowledgements
It is a pleasure to thank all those who made this thesis possible. I would like to thank my
supervisor, Dr. Steven G. Little, for his advice and guidance towards completing this thesis.
I would also like to thank the schools that agreed to participate in this study. I am very
grateful towards the Deputy Principals of both schools who were very accommodating and
supportive. Furthermore, this thesis would not have been possible without the participants;
therefore, I would like to thank the students who participated in the study for their time and
effort.

v
Table of Contents
Declaration ………………………………………………………………………… ii
Abstract …………………………………………………………………………… iii
Acknowledgements …………………………………………….…………………. iv
List of Tables .………….…………………………….…………………………... vii
List of Figures ……………………………………………………………………. viii
Introduction ………………………………………….…………………….……… 1
Overview of General Studies .…………………………….…….…... 3
Theory ……………………………………………………….…...….. 5
Psychological and Cognitive Benefits ……………………..……...... 6
Neurological Benefits… ……………………………………...….….. 7
Physical Activity and On-task Behaviour ……… ………………….. 7
Gender ………………………………………………………………. 8
Ethnicity …………………………………………………………….. 9
SES …………………………………………………….……………. 10
Core Subjects ……………………………………………………….. 11
Sport Type and Number of Sports …………………………………. 12
Time Spent …………………………………………………………. 12
Purpose of Current Study ………………………………………………………… 13
Research Questions ……………………………………………………………… 13
Hypothesis ……………………………….………………………………………. 14
Method ………………………………………...…………………………………. 15
Participants ………………………………………………….…....… 15
Materials ……………………………….…………………………... 18
Procedures ……………………………….…………………………. 20
vi
Data Analysis ………………………………………………………... 21
Results …………………………………………….……………………………….. 23
Independent Samples T-Test ..……………………………………….. 24
Simple Linear Regression ……………………………………………. 28
Multiple Linear Regression ……………………………..…………… 31
Summary of Results ……………………………………………………………...... 31
Discussion …………………………………..……………………………………….32
Implication of Results on Hypotheses ..…….. ……………………... 32
General Implications of Results ……………………………………... 33
Comparisons with Previous Studies …………………………..…...... 36
Limitations ………………………………….……………………..... 36
Future Recommendations ………………………………………....... 38
Conclusion …………………………………………..…………………………..... 39
References ……………………………………………………………………….....40
Appendix A ………………………………………..……………………………..…44
Appendix B ………………………………………..……………………………..…47

vii
List of Tables
Table 1 Demographic Breakdown of Participants from each School……….. 17
Table 2. Percentage of Students Within each Sporting Variable for
each School …………………………………………………………. 18
Table 3a Analyses used to evaluate the relationship and effect of sports
participation on mean academic grades ……………………….…… 22
Table 3b Independent Samples T-Test used on different Independent and
Dependent Variables …………………………………………........... 22
Table 4 Differences in mean grades between sports and non-sports
participants for male, female, high decile and low decile students.…. 23
Table 5 Between-Decile Comparison of Mean Grades between Sports and
Non-Sports Participants …………………………………….…….... 25
Table 6 Comparison of Mean Grades and Maths Grades between Male
Sports and Non-Sports Participants …………………………...……. 27
Table 7 Correlations of Variables with Mean Grade from Simple
Linear Regression Analyses ……………………………………….. 29
Table 8 Correlations and Significance of Participation in Sports, Number of
Sports, Frequency Played and Time Spent with Mean Grade ….…... 31

viii
List of Figures
Figure 1 The difference in mean grades between male sports participants
and male non-sports participants ……………………………………… 25
Figure 2 The difference in mean grades between sports and non-sports
participants from low and high decile schools ……………………... 26
Figure 3 The difference in mean English grades between female and male
sports Participants ………………………………..………………..... 27
Figure 4 The difference in mean mathematics grades between male sports
participants and male non-sports participants ……………………… 28
Figure 5 The trend of mean grades across the number of times sports are
played per week for all students …………………………………… 30

1
Students and Sports: The Association between Participation in Sports and Academic
Achievement
Introduction
One of the main aims for most parents, teachers, or schools is for their children or
students to succeed academically. For this reason, it is important for them to know which
factors are likely to have an influence on a students’ academic achievement. With growing
research on the positive relationship between academic achievement and sports participation,
there should be increasing numbers of children participating in sporting activities (Bailey,
2006; Corneliβen & Pfeifer, 2007; Fox, Barr-Anderson, Neumark-Sztainer & Wall, 2010;
Schlesser, 2004; Stephens & Schaben, 2002; Trudeau & Shephard, 2008). However,
participation in sports by the younger generation of New Zealanders is declining; and the
number of children falling in the overweight and obese category is increasing (Ministry of
Education (MOE), 2007; Carnachan, 2010).
Nationwide research was conducted by Sport New Zealand (NZ) on sports
participation and found that 50% of children do not participate in any sports and 70% of those
that do play; drop out by ages 13-17 (Sport NZ, 2006). Furthermore, only 10% of those
sports participants played sports during summer, and 16% during winter, for 5 hours or more
(Sport NZ, 2006). However, national guidelines state that young children should be engaging
in at least 60 minutes of moderate to vigorous physical activity through activities such as
sport (MOE, 2007).
As parents play an influential role on their child’s level of participation in sports, they
often worry that playing sports will have a negative impact on their learning (Sport NZ,
2006). However, the majority of studies around the world have found no negative impact on
academic achievement with some studies finding a positive impact (Bailey, 2006; Corneliβen
& Pfeifer, 2007; Fox et al., 2010; Schlesser, 2004; Stephens & Schaben, 2002; Trudeau &
2
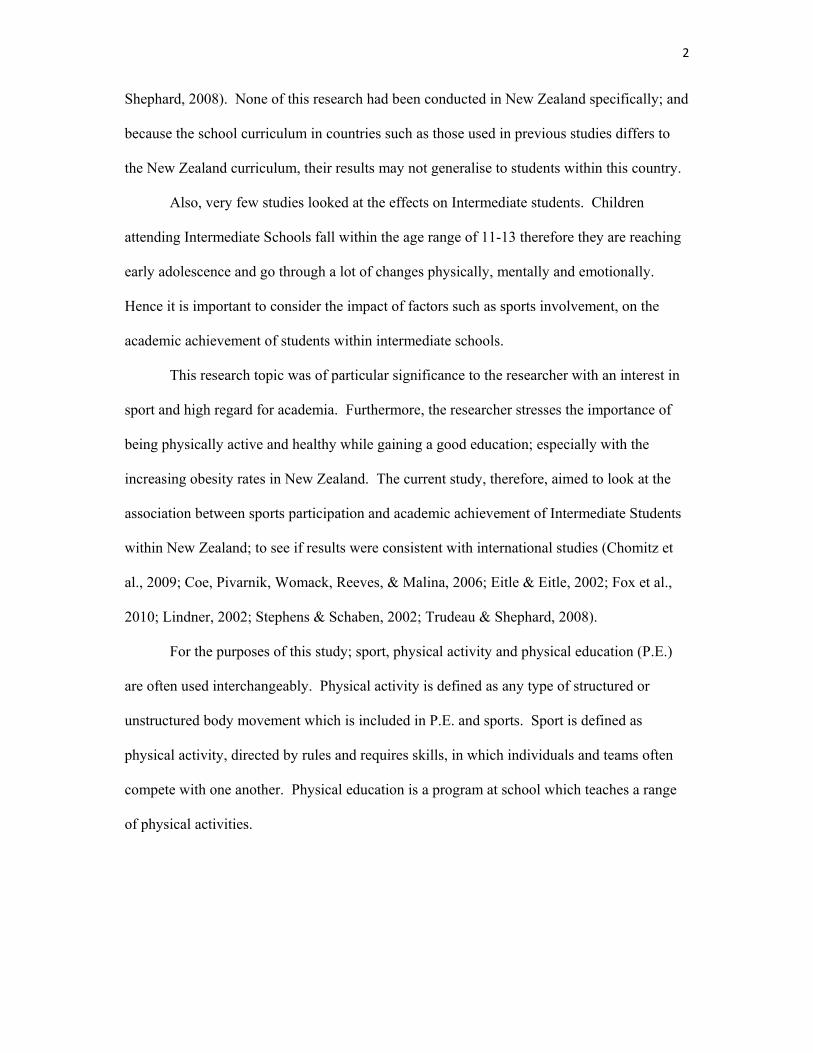
Shephard, 2008). None of this research had been conducted in New Zealand specifically; and
because the school curriculum in countries such as those used in previous studies differs to
the New Zealand curriculum, their results may not generalise to students within this country.
Also, very few studies looked at the effects on Intermediate students. Children
attending Intermediate Schools fall within the age range of 11-13 therefore they are reaching
early adolescence and go through a lot of changes physically, mentally and emotionally.
Hence it is important to consider the impact of factors such as sports involvement, on the
academic achievement of students within intermediate schools.
This research topic was of particular significance to the researcher with an interest in
sport and high regard for academia. Furthermore, the researcher stresses the importance of
being physically active and healthy while gaining a good education; especially with the
increasing obesity rates in New Zealand. The current study, therefore, aimed to look at the
association between sports participation and academic achievement of Intermediate Students
within New Zealand; to see if results were consistent with international studies (Chomitz et
al., 2009; Coe, Pivarnik, Womack, Reeves, & Malina, 2006; Eitle & Eitle, 2002; Fox et al.,
2010; Lindner, 2002; Stephens & Schaben, 2002; Trudeau & Shephard, 2008).
For the purposes of this study; sport, physical activity and physical education (P.E.)
are often used interchangeably. Physical activity is defined as any type of structured or
unstructured body movement which is included in P.E. and sports. Sport is defined as
physical activity, directed by rules and requires skills, in which individuals and teams often
compete with one another. Physical education is a program at school which teaches a range
of physical activities.

3
Overview of General Studies
A large number of studies have been carried out around the world to look into the
effect of participation in sports and physical activity. An overview of these studies will be
discussed with the majority revealing that sports participation does not negatively impact
academic achievement (Ahamed et al., 2007; Bailey, 2006; Chomitz et al., 2009; Coe et al.,
2006; Hillman et al., 2008; Mahar et al., 2006; Rees & Sabia, 2010; Tomporowski et al.,
2008; Trudeau & Shephard, 2008).
Trudeau and Shephard (2008) reviewed studies that examined the effects of
increasing physical activity within a school week; by decreasing teaching time from academic
subjects. They found that in a 5 year Quebec study, primary school students performed better
in mathematics when compared to control groups; even though 33 minutes were removed
from their mathematics class to increase P.E time.
Additionally, the results of both a Canadian and South Australian study showed
similar results (Trudeau & Shephard, 2008); suggesting that learning efficiency increases
with sports involvement. In the Canadian study, Ahamed et al. (2007) increased physical
activity by 47 minutes per week for 16 months and compared test scores with a control group.
They found that academic achievement was positively impacted; as the average score rose
from 1595 to 1672 units.
In the South Australian study, Trudeau and Shephard (2008) explained that academic
time was reduced to increase physical activity time by 1.25 hours per day. After measuring
reading and arithmetic scores, the authors found that academic achievement in these subjects
was not negatively impacted. Moreover, this effect was maintained 2 years later in a follow-
up study thus suggesting that increased time spent on P.E. does not have any immediate or
long-term detrimental effects on academic achievement.

4
A range of studies also found that physical fitness was positively associated with
academic achievement (California Department of Education (CDE), 2005; Castelli , Hillman,
Buck and Erwin, 2007; Chomitz et al., 2009; Coe et al., 2006). CDE (2005), Castelli et al.
(2007) and Chomitz et al. (2009) presented that students who were more physically fit were
more likely to have higher grades and Coe et al.’s (2006) results indicated that vigorous
physical activity most effectively supported higher grades. These authors and others
therefore concluded that, schools should not reduce time of sports and P.E. to increase
academic time; but instead they should do just the opposite (Ahamed et al., 2007; Chomitz et
al., 2009; Coe et al., 2006; Trudeau & Shephard, 2008; Vail, 2006).
Authors have also examined exactly how much physical activity is sufficient to
significantly improve academic performance. The results of Coe et al.’s 2006 study indicated
that higher grades were associated only with increased time on vigorous physical activity.
No significant effects on academic achievement were found with moderate physical activity.
Etnier et al. (1997) found that moderate to high intensity activity was also beneficial to
cognitive functioning. However, Ahamed et al. (2007) indicated that not only did less than
10% of school time consist of physical activity, but less than half the time of P.E. was spent
performing moderate to vigorous activity. Furthermore, Tomporowski et al. (2008) stated
that physical activity has significantly reduced over the past 10 years, therefore, academic
performance may not be up to potential.
From the above results it seems that the current amount of physical activity in schools
is not effective for enhancing grades. Therefore, with increasing pressure on educators and
policy makers; it is important to examine how physical and sporting activities are associated
with academic achievement (Chomitz et al., 2009). These studies, along with others, will be
discussed next, in relation to the variables and methods chosen for the current study; which
assessed the association between sports participation and academic achievement.

5
Theory
The current study aimed to look at whether participating in a sport had a negative or
positive impact on intermediate students’ grades. The majority of studies that examined
similar variables found either no association or a positive association; however Lindner
(2002) suggested that care needs to be taken when drawing conclusions from these results,
and offers an explanation worth noting.
Lindner (2002) discussed that results indicating a positive relationship between
academic achievement and physical activity could be due to two reasons called the selection
hypothesis and the situational hypothesis. The selection hypothesis states that certain people
naturally tend to be drawn to an active lifestyle and are better in sports and academia
(Lindner, 2002). Recent research by Mustelin et al. (in press) supports this idea as their
results suggest that genetic factors are a significant contributor towards sporting activity
levels for young adults. Therefore biological factors may lead some people towards a
sporting lifestyle and others towards a more sedentary lifestyle.
On the other hand, the situational hypothesis suggests that parents of students that do
well academically are usually more lenient towards allowing their child to participate in a
sport; where as parents of students that do poorer academically, are more inclined to prohibit
their child to participate in a sport (Lindner, 2002). Cheung and Chow (2010) and Sport NZ
(2006) discuss the fact that parents play an important role in their child’s participation or non-
participation in sports. Parents have a direct influence on their child’s participation in
physical activity and how their child perceives physical activity (Cheung & Chow, 2010).
Therefore the parents of a ‘low-achieving’ child may be discouraging towards a sporting
lifestyle.
6
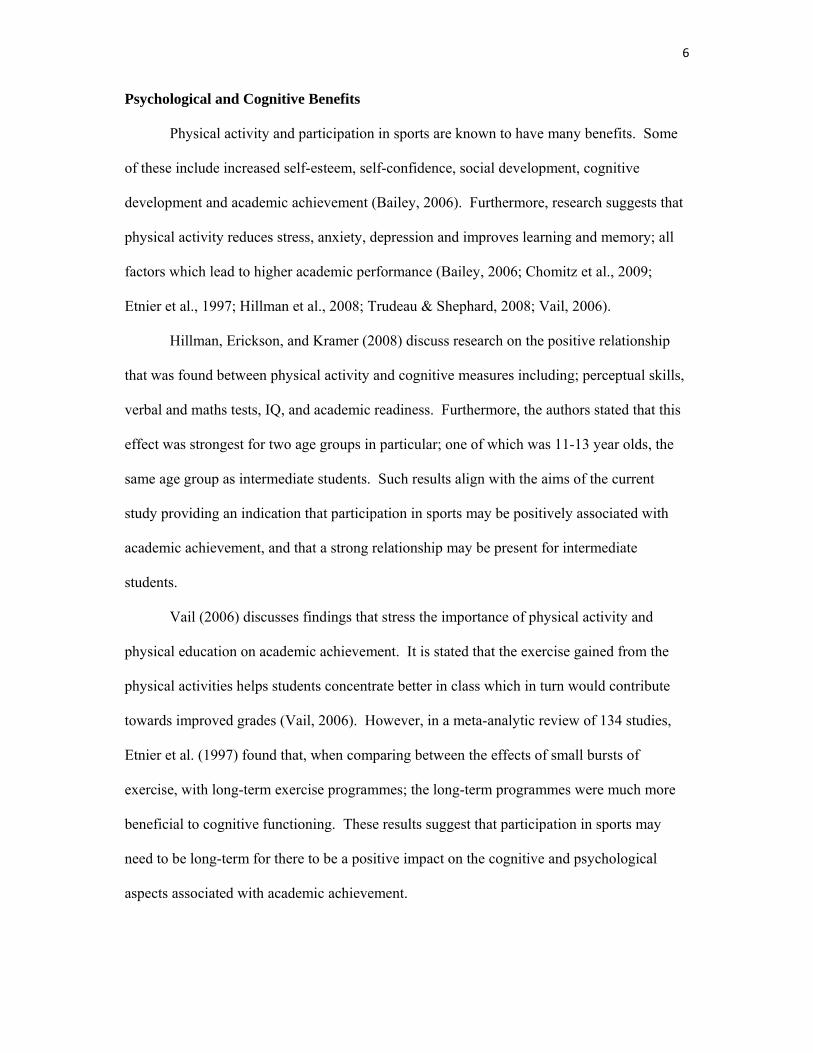
Psychological and Cognitive Benefits
Physical activity and participation in sports are known to have many benefits. Some
of these include increased self-esteem, self-confidence, social development, cognitive
development and academic achievement (Bailey, 2006). Furthermore, research suggests that
physical activity reduces stress, anxiety, depression and improves learning and memory; all
factors which lead to higher academic performance (Bailey, 2006; Chomitz et al., 2009;
Etnier et al., 1997; Hillman et al., 2008; Trudeau & Shephard, 2008; Vail, 2006).
Hillman, Erickson, and Kramer (2008) discuss research on the positive relationship
that was found between physical activity and cognitive measures including; perceptual skills,
verbal and maths tests, IQ, and academic readiness. Furthermore, the authors stated that this
effect was strongest for two age groups in particular; one of which was 11-13 year olds, the
same age group as intermediate students. Such results align with the aims of the current
study providing an indication that participation in sports may be positively associated with
academic achievement, and that a strong relationship may be present for intermediate
students.
Vail (2006) discusses findings that stress the importance of physical activity and
physical education on academic achievement. It is stated that the exercise gained from the
physical activities helps students concentrate better in class which in turn would contribute
towards improved grades (Vail, 2006). However, in a meta-analytic review of 134 studies,
Etnier et al. (1997) found that, when comparing between the effects of small bursts of
exercise, with long-term exercise programmes; the long-term programmes were much more
beneficial to cognitive functioning. These results suggest that participation in sports may
need to be long-term for there to be a positive impact on the cognitive and psychological
aspects associated with academic achievement.

7
Neurological Benefits
Researchers have discussed the neurological benefits of physical activity and how it
increases the blood flow to the brain thus; increasing ones mental alertness and attention
span, enhancing ones self-esteem, and reducing the chance of boredom (Bailey, 2006; Coe et
al., 2006; Etnier et al., 1997; Mahar et al., 2006; Shephard, 1996; Taras, 2005). All of these
factors are known to have a positive effect on academic achievement (Bailey, 2006; Coe et
al., 2006; Mahar et al., 2006). Furthermore, in an overview of research on the effects of
exercise; Tomporowski et al. (2008) found that there was a positive association between
physical fitness and academic achievement in the majority of studies.
One particular study, by Etnier et al. (1997) found that exercise of moderate to high
intensity was advantageous not only for increasing the nutrient supply to the brain; but also
for increasing neurotransmitters which is beneficial for memory. Moreover, Vail (2006)
explains how certain exercises encourages both hemispheres of the brain to work
collaboratively thus promoting the brain to function systematically.
These results therefore provide support towards the common belief that a healthy
body leads to a healthy mind. The neurological benefits found in these studies also provide a
good basis for the variables of the current study as it supports the idea that a positive
association exists between physical activity and the components that contribute towards
excelling academically.
Physical Activity and On-task Behaviour
An experimental study conducted by Mahar et al. (2006) assessed the effects of a
classroom-based physical activity program used in an American school to promote fitness
and improve on-task behaviours of students. In the study, 135 students in the experimental
group participated in the programme called Energizers for 12 weeks. After assessing the
third and fourth grader’s on-task behaviour, the researchers found that not only did their

8
behaviour improve by 8% since the programme was implemented; but those students that
were previously engaging in the most off-task behaviours increased their on-task behaviour
by 20%. These results were promising as they indicated that increasing physical activity
increases on-task behaviour; which may essentially lead to improvements in academic
achievement. However, academic achievement was not assessed in this study; therefore such
a conclusion could not be made.
Gender
Lindner (2002) carried out research in Hong Kong schools comprising of 13-17 year
olds in which data from academic records and sports participation questionnaires were
collected. The study included participants from different academic bands; in which students
from higher bands obtained better academic grades than those from lower bands. The results
from Lindner’s study indicated that a positive relationship did indeed exist between academic
performance and physical activity; as students from higher bands were more inclined to
spend time engaging in physical activities, compared to those in lower bands. However this
finding was only significant for males.
Another study was carried out in Germany by Cornelißen and Pfiefer (2007) in which
data from the German Socio-Economic Panel were used to determine how educational
attainment was affected by participation in sports. Data on the level of education achieved
and level of involvement in sports of 6050 participants were used in the year 2000.
Cornelißen and Pfiefer found that the probability of gaining higher school degrees increased
when children and adolescents were involved in a sport. Additionally, their results indicated
that the probability of attaining the highest level of school degree increased by 6.1% for
males and 5.6% for females, that participated in a sport. Similar results were found for
attaining a university degree which suggests that beneficial long-term effects also exist for
those that participate in a sport in their younger years.

9
In addition to these two studies, Fox et al. (2010) looked at the relationship of
physical activity and sports team participation on the academic achievement of both middle
and high school students. The authors used 1998-1999 survey data of 4746 students of which
1501 were middle school students. They focused on; student’s participation in sports teams,
time spent doing moderate to vigorous activity (MVPA), and mean Grade Point Averages
(GPA). Fox et al.’s (2010) results were similar to previous studies and revealed that male
middle school students that participated in sports had higher mean GPAs than those that did
not, however, there were no significant results for females.
In contrast to these three studies, two studies found that females significantly
outperformed male students (Stephens & Schaben, 2002; Schlesser, 2004). Stephens and
Schaben (2002) looked at the relationship between interscholastic sports and academic
achievement for students in 8th grade. The researchers used 136 student’s GPA and maths
scores as measures against their self-reported level of participation in sports in the 1998-1999
school years. The findings of the study indicated that, with regard to GPA, female sports-
participants (2.967) outperformed male participants (3.400).
In the second study, Schlesser (2004) investigated the relationship between
extracurricular activities and GPAs of 111 eighth grade students. Data were collected from
school lists of GPAs and the activity groups in which the corresponding students were
participants in 2002-2003. Schlesser (2004) found that the mean GPA for female activity
participants was higher than any other group. Each of these studies found gender differences
therefore this variable was an important factor to examine in the current study.
Ethnicity
Eitle and Eitle (2002) used information from the National Education Longitudinal
Survey, in America. The researchers’ data dated from 1988 to 1990 from which they focused
on differences between 4930 black and white male intermediate students playing sports, and
10
their academic outcomes. They found that participating in sports, other than football and
basketball, correlated with better academic grades for white students but poorer grades for
black students. Such findings indicate that differences may exist between different ethnic
groups; however this variable was not analysed in the current study.
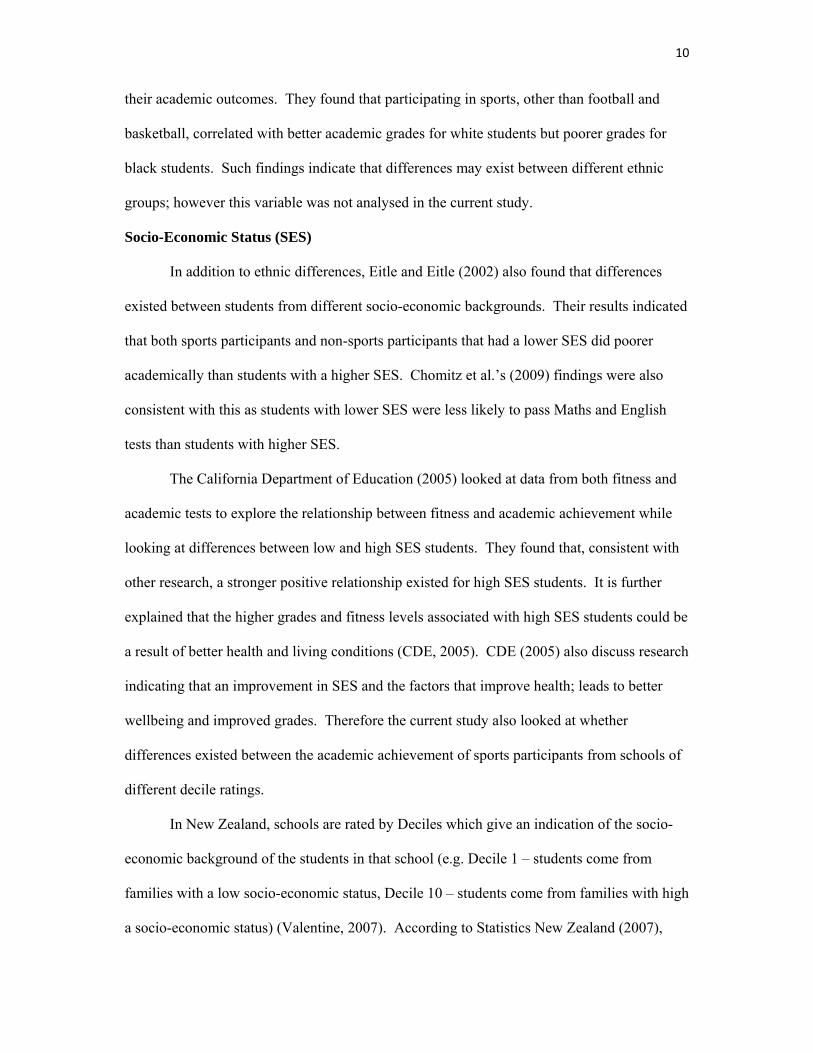
Socio-Economic Status (SES)
In addition to ethnic differences, Eitle and Eitle (2002) also found that differences
existed between students from different socio-economic backgrounds. Their results indicated
that both sports participants and non-sports participants that had a lower SES did poorer
academically than students with a higher SES. Chomitz et al.’s (2009) findings were also
consistent with this as students with lower SES were less likely to pass Maths and English
tests than students with higher SES.
The California Department of Education (2005) looked at data from both fitness and
academic tests to explore the relationship between fitness and academic achievement while
looking at differences between low and high SES students. They found that, consistent with
other research, a stronger positive relationship existed for high SES students. It is further
explained that the higher grades and fitness levels associated with high SES students could be
a result of better health and living conditions (CDE, 2005). CDE (2005) also discuss research
indicating that an improvement in SES and the factors that improve health; leads to better
wellbeing and improved grades. Therefore the current study also looked at whether
differences existed between the academic achievement of sports participants from schools of
different decile ratings.
In New Zealand, schools are rated by Deciles which give an indication of the socio-
economic background of the students in that school (e.g. Decile 1 – students come from
families with a low socio-economic status, Decile 10 – students come from families with high
a socio-economic status) (Valentine, 2007). According to Statistics New Zealand (2007),

11
based on the median income of employees, the highest income areas in Auckland were in the
Auckland City (Central Auckland) region with the lowest income areas in the Manukau City
(South Auckland) region.
Core Subjects
Chomitz et al. (2009) carried out a cross-sectional correlational study on the
relationship between physical fitness and academic achievement. Chomitz et al. (2009) used
academic achievement data on 1841 American public school students in fourth, sixth,
seventh, and eighth grade. Their data comprised of Maths and English grades and physical
fitness test scores. The researchers found that there was a strong relationship between maths
grades and fitness test scores with the maths passing rate estimated to increase by 38% as the
number of fitness tests passed increased by a unit. Similar results were evident for English
grades with an estimated 24% increase; however the relationship between the two variables
was much weaker.
Stephens and Schaben (2002) looked at both mean GPA scores and maths scores.
The results of the authors study indicated that those that participated in a sport had higher
cumulative GPAs than those that did not participate; which was evident for both sexes.
Furthermore, similar results were found for maths grades with sports-participants obtaining a
higher percentage score (64%) than non-participants (48%).
Schlesser (2004) also found that, consistent with results of previous studies, students
involved with extra-curricular activities had higher GPAs than those that did not. Although
this effect is a positive one, it should be noted that the activities referred to in this study
included six sporting activities and three non-sporting activities. Analyses differentiating
sports versus non-sports activities would have been beneficial however this was not present
for this study.

12
Castelli et al. (2007) and CDE (2005) both looked at the relationship between physical
fitness and academic achievement in core subjects. Castelli et al. (2007) found that students
who were fitter and had a lower Body Mass Index (BMI) performed better in Reading and
Mathematics. Furthermore, CDE’s (2005) results indicated that physical fitness was strongly
associated with higher grades in English, Mathematics, History and Science.
Therefore, not only did the current study aim to examine the association between
sports participation and mean grades, but it also looked at the association between sports
participation and each core subject (Mathematics, English and Science).
Sport Type and Number of Sports
Eitle and Eitle’s (2002) correlational study had an interesting result when assessing
the relationship between different sports and academic achievement scores. Their results
indicated a negative relationship between football and basketball participation and
achievement scores. Both these sports are team sports therefore the current study looked at
whether or not the type of sport, i.e. team or individual sport, had a significant effect on a
student’s mean grade.
In addition to the type of sport, the current study also looked at the number of sports
played. Stephens and Schaben’s (2002) study looking at interscholastic sports and the
academic achievement of intermediate school students found that students involved with
more sports had higher grades than students that engaged in a lower number of sports.
Furthermore, the two participants that took part in five sports were amongst the highest GPA
students in the class (Stephens & Schaben, 2002).
Time Spent
Cornelißen and Pfiefer’s (2007) findings illustrated that participating in sports
competitions did not have the same beneficial effects as regular sporting activities. The
probability of achieving higher degrees did not increase with participation in competition, on

13
the other hand, it did not decrease either. The researchers suggested that this may have been
due to the fact that time-consuming sports do not go hand in hand with time-consuming
studies that are associated with higher degrees. Although the current study did not examine
the effects of sports competitions specifically, it did look at how the amount of time spent on
sports per week affects a student’s academic achievement. The assessment of such a variable
therefore demonstrates whether time is a factor; like Cornelißen and Pfiefer suggest. In
contrast, the American study by Fox et al. (2010) looked at how the amount of time spent on
moderate to vigorous physical activity (MVPA) affected student’s mean GPAs. Their results
indicated that increased time spent on MVPA was found to be associated with higher mean
GPAs, which was significant for both male and female middle school students.
Purpose of Current Study
The purpose of the present study is to examine the association between participation
in sports and academic achievement. As discussed, most of the international literature
presented positive results therefore the current study sought to find similar results within New
Zealand. Such results would guide the decision making process for students and parents
when deciding to participate in sports. According to the literature just reviewed, it is evident
that certain variables are worth examining. These include differences between; gender,
deciles, core subject grades, amount of time spent on sports, and number of sports played.
Therefore the current study aimed to answer the following research questions.
Research Questions
1. Does participation in sports affect the academic achievement of intermediate
students?
2. Does the number of sports in which a student participates affect their academic
achievement?

14
3. What is the relationship between the amount of time spent on a sport per week and
academic achievement?
4. Is there a difference between the effects of sports participation on academic
achievement for males and females?
5. Is there a difference between the effects of sports participation on academic
achievement in different core subjects?
6. Is there a difference between the effects of sports participation and academic
achievement for high decile and low decile intermediate school students?
Hypotheses
Question One:
H1: There will not be a negative effect on academic achievement for students who participate
in sports compared to students who do not participate in sports as measured by mean
grades.
H2: Students who participate in one or more sports will demonstrate higher academic
achievement than students who do not participate in a sport as measured by mean
grades.
Question Two:
H3: Students who participate in a higher number of sports will demonstrate higher academic
achievement than students who participate in a lower number of sports as measured
by mean grades.
Question Three:
H4: Students who spend more hours/days per week on sports will demonstrate higher
academic achievement than students who spend less hours/days per week on sports as
measured by mean grades.
Question Four:

15
H5: Male students who participate in sports will demonstrate higher academic achievement
than female students who participate in sports as measured by mean grades.
Question Five:
H6: Students who participate in sports will demonstrate higher achievement in Mathematics
than achievement in English and Science as measured by Mathematics grades.
Question Six:
H7: Students from a high decile school who participate in sports will demonstrate higher
academic achievement than students from a low decile school who participate in
sports as measured by mean grades.
Method
The current study aimed to look at the association between participation in sports and
academic achievement of intermediate students while comparing differences between gender,
deciles, core subject grades, amount of time spent on sports, and number of sports played.
The methods used in the present study are similar to those of previous studies (Fox et al.,
2010; Schlesser, 2004; Stephens & Schaben, 2002); however they have been altered by the
researcher to examine the current research hypotheses.
Participants
Participants for this study were 86 intermediate students from two public schools in
Auckland. The participants included both Form 1 (year 7) and Form 2 (year 8) students aged
11-13 years old. The mean age of the participants in this sample was 12 years, 1 month. The
gender ratio of the total sample was fairly even although the majority of participants were
female (54.7% female, 45.3% male).
School 1 had 30 students in Class 1, 29 students in Class 2 and 31 students in Class 3
giving a total of 90 potential participants. Each of the 90 students were given consent forms
and those consenting were given questionnaires. However, only 52 out of the 90 students

16
returned completed consent forms and filled out questionnaires. The participation rate for
School 1 was therefore approximately 58%. Of the 52 questionnaires returned, all the
questionnaires were fully completed (all questions were answered); therefore complete data
collection was obtained on 100% of the students that participated.
School 2, on the other hand, had 26 students in Class 1 and 2 and 29 students in Class
3 giving a total of 81 students. These students were also given consent forms and those that
consented were given questionnaires. Of these students, only 34 returned completed consent
forms and questionnaires giving a participation rate of approximately 42%. However, from
these 34 students, only seven fully completed the questionnaires thus complete data were
obtained from only 20% of the participants. Overall, the participation rate was approximately
50%, and 69% of these participants fully completed the questionnaire.
Participants were recruited from two schools of differing decile rating. School 1,
which was located in Auckland Central, was a decile 9 school and School 2, located in South
Auckland, was a Decile 1 school. The racial breakdown of the total sample was 27.9% New
Zealand European, 22.1% Pacific Islander, 17.4% Asian, 14% Maori, 14% Mixed or Other,
and 4.7% Indian. The demographics of the participants for each school are presented in
Table 1 below.
The two different schools that were used in the sample were chosen because they
included students that came from both high and low income families thus representing
students from varied socio-economic backgrounds. The use of just one class from each
school could have produced biased results if, for example, the class chosen was an
‘accelerant’ class including high achieving students. Therefore, 3 classes (out of a possible
28 for School 1 and 24 for School 2) were randomly chosen from each school thus ensuring
variation within the sample.

17
Table 1.
Demographic Breakdown of Participants from Each School
Variable School 1 School 2 Total
N 52 34 86
Decile 10 1
Gender Male 56% 56% 45%
Female 44% 44% 55%
Ethnicity
N.Z. European 46% - 28%
Pacific Islander 8% 44% 22%
Asian 29% - 17%
Maori 2% 32% 14%
Indian 6% 3% 5%
Mixed/Other 9% 21% 14%
Mean Age 12 yr 5 m 11y 6m 12y 1m
From the 86 students that participated in the study, 77% participated in one or more
sports and 23% did not. The gender ratio for sports participants was equal with 33 male and
33 female sports participants. Of the non-sports participants, 70% were female and 30%
were male. Out of the 77% of sports participants, 35% were from the low decile school and
65% were from the high decile school. Furthermore, 55% of students from the low decile
school and 45% of students from the high decile school made up the 23% of non-sports
participants.
The breakdown of the type of sport played and organisation played for, was as
follows: Out of the 66 students that played a sport, 36% of students played individual sports
such as swimming or cycling of which 42% were male and 58% were female. Students
playing a team sport such as cricket or soccer made up 64% of the sports participants of
which 45% were female and 55% were male. Additionally, half of the sports participants
played for the school of which 40% were male and 60% female. The other half of these
students played for an outside club or organisation and 61% of these students were male with

18
39% being female. The gender differences between each school for these variables are
illustrated in Table 2 below.
Table 2.
Percentage of Students Within each Sporting Variable for each School
Sporting Variables School 1 School 2 Total
Participant Male 44% 60% 50%
Female 56% 40% 50%
Non-Participant Male 11% 45% 30%
Female 89% 55% 70%
Individual
Sport
Male 38% 66% 42%
Female 62% 34% 58%
Team Sport Male 50% 60% 55%
Female 50% 40% 45%
School Team Male 35% 36% 35%
Female 65% 64% 65%
Outside Org. Male 52% 80% 60%
Female 48% 20% 40%
Materials
The only materials used in the current study included information sheets and consent
forms for parents, students, and principals and questionnaires for the students. These
questionnaires were made up of three sections which are illustrated in Appendix A. The first
section asked for demographic information such as age, sex, and ethnicity. The second
section requested information regarding the current level, if any, of involvement in sports,
number of sports played, type of sports played, frequency played per week, hours played per
week, and how long they had been playing. The third section of the questionnaire required
information about the students’ academic achievement for that year. It asked the students
what grade they received in their mid-year report card for their core subjects, English, Maths,
and Science.

19
The anonymous self-report questionnaires were used to obtain information on both
sports participation, and academic achievement, due to limitations with the ethics committee
regarding concerns with confidentiality in accessing academic records of students from
school databases. However, the self-report questionnaire was a useful tool as it provided a
means for asking specific relevant questions for the study from which answers could be
recorded and coded systematically (Hersen, 2004). Furthermore, participants were able to
give answers openly (open-end questions) rather than be constrained to choosing already
given answers (i.e. multi-choice).
The preservation on anonymity of the participants also meant that students would be
less inclined to give false answers as it would not be possible to identify the student from the
questionnaire. Moreover, the students were instructed to complete the questionnaires in their
own time (at home) therefore it did not interfere with school time and it also reduced the
likelihood of their answers being influenced by their peers.
The questions used in the questionnaire were formed by the researcher to obtain data
consistent with prior studies. For example, Stephens and Schaben (2002) and Fox et al.
(2010) examined how the number of sports played might affect a student’s academic
achievement. Question 2 was therefore included in the questionnaire (Appendix A) to obtain
these data. Coe et al. (2006), Rees and Sabia (2010), and Fox et al. examined the amount of
time spent on physical activity/sports therefore Question 5 and 6 were designed to obtain data
on both frequency and time spent per week on sports.
Chomitz et al. (2009) examined the effects of physical fitness on different subjects
therefore Question 8 was designed to collect data on individual grades from each core
subject. However, unlike prior studies, the current questionnaire also included Science
grades so that comparisons could be made between the three subjects rather than two (Maths

20
and English). Many studies also looked at gender and SES and have found significant
differences; hence the inclusion of these questions in the demographics section.
Procedure
Before proceeding with the current study, the Code of Ethical Conduct for Research
was reviewed and an application was made to the Massey University Human Ethics
Committee after which approval was obtained to carry out the research project (MUHEC:
Northern Application 11/033). Once approval was received (see Appendix B), the principals
of five schools were contacted, given information regarding the study, and asked if their
school would like to participate. These schools were found from a list provided on the
Ministry of Education website detailing information such as the name and type of school
(primary, intermediate, high), geographical location (across New Zealand), and decile rating
(1-10).
The basis of choosing these five schools was on geographical location and decile
rank. A school from each district (North, South, East, West and Central Auckland) with
differing decile ratings (1, 3, 5, 7, and 9) were chosen. After finding the school website of
each of these schools, contact details of the school principal were obtained and each principal
was contacted. Three of the five schools declined to participate. Consequently, meetings at
the two schools that agreed to participate were arranged to discuss the study. Information
was provided to the Deputy Principals of these two schools.
The Deputy Principals of each school were then asked to choose three classes from
their Intermediate School. The teachers of these classes were given information sheets and
consent forms by the deputy principal for both the students in their class and their parents.
Participation in the study was completely voluntary and it was made clear that the students’
grades would not be affected if the student decided to participate or not. Students were given

21
a week to complete the consent forms and upon returning them, would receive an anonymous
questionnaire (Appendix A) to fill out and return within a week.
Once the questionnaires were completed and returned to the students’ teachers, the
Deputy Principal collected the paperwork and notified the researcher. For the duration of the
study, the researcher had contact with only the Deputy Principals of each school thus
preserving the anonymity of the students and their classes. Furthermore, it was made clear to
each participant that not only would their answers be completely anonymous, they also had
the right to refuse to answer any question if they wished.
Once these data were collected, the consent forms were stored away in a secure filing
cabinet and the questionnaires were organised into groups of sports participants and non-
sports participants, males and females, and low and high deciles. Each questionnaire was
then labelled with a number from 1-86 for data entry purposes. Data were then entered into
SPSS 18.0 (Statistical Programme for Social Sciences) with different labels for each variable.
Note that data from Section Two, Question 7 were not used in data analysis as the students
answers were not consistent enough to categorise.
Data Analysis
Once the data were labelled and entered into SPSS 18.0 accordingly, analyses were
conducted (see Tables 3a and 3b) with the significance level set at .05. The mean grade or
Grade Point Average (GPA) which, like the subject grades, ranged from 1 to 5 (1 – well
below average, 2 – below average, 3 – average, 4 – above average, 5 – well above average).
It was calculated for each participant by taking the sum of the grades for each subject
(English, Maths and Science) and dividing by the number of subjects (i.e. 3). This mean
grade was then used during analysis.
Table 3a includes the Independent Samples T-Test, Simple Linear Regression, and
Multiple Linear Regression analyses used; with Mean Grade as a Dependent Variable. Table

22
3b illustrates the variables on which Independent Samples T-Tests were conducted to
evaluate the effect of sports participation on core subject grades. These tests were used as
they were consistent with those used in previous studies similar to that of the current study.
Table 3a
Analyses used to evaluate the relationship between sports participation (PPT) and mean
academic grades.
Independent Samples T-Test Simple Linear Regression Multiple Regression
Sports vs Non-Sports Participants
(PPT) Sport Participation (PPT/Non-PPT)
Sport PPT, Number of
Sports, Frequency,
Time Spent
Male Sports vs Non-Sports PPTS
Female Sports vs Non-Sports PPTS Number of Sports (1-6)
Male Sports vs Female Sports PPTS
Male vs Female Non-Sports PPTS Sport Type (Individual/Team)
Low Decile Sports vs Non-Sports
PPTS
High Decile Sports vs Non-Sports
PPTS
Sport Organisation
(School/Outside)
Low Decile vs High Decile Sports
PPTS
Low Decile vs High Decile Non
PPTS
Sport Time Spent (Hours/wk)
Sport Frequency (No. played/wk)
Table 3b
Independent Samples T-Test used on different Independent and Dependent Variables.
D.V. English Grade Maths Grade Science Grade
I.V.
Sports vs Non-Sports Sports vs Non-Sports Sports vs Non-Sports
Male Sports vs Non-Sports Male Sports vs Non-Sports Male Sports vs Non-Sports
Female Sports vs Non-Sports Female Sports vs Non-Sports Female Sports vs Non-Sports
Male Sports vs Female Sports Male Sports vs Female Sports Male Sports vs Female Sports
Male Non vs Female Non-
Sports
Male Non vs Female Non-
Sports
Male Non vs Female Non-
Sports

23
Results
The main aims of the current study were to find out whether an intermediate student’s
academic achievement was affected by factors such as participating in a sport, the number of
sports participated played, and the amount of time spent playing the sport per week.
Furthermore, the study aimed to examine any differences in effects between sexes, subjects,
and deciles.
The research hypotheses were that participation in sports would be associated with
higher grades, an increased number of sports would increase academic achievement, and an
increased amount of time on sports would be associated with higher academic achievement.
Additionally, it was hypothesised that there would be a greater positive effect on males,
mathematics, and high decile students. A table of the mean grades and standard deviations
(SD) achieved for sports participants and non-sports participants is illustrated in Table 4
below and will be further explained in subsequent chapters.
Table 4
Comparison of mean grades with standard deviations (SD) between sports and non-sports
participants (PPT) for male, female, high and low decile students
All Male Female Low Decile High Decile
PPT Non-
PPT
PPT Non-
PPT
PPT Non-
PPT
PPT Non-
PPT
PPT Non-
PPT
Grades
Mean
(SD)
3.36
(±.70)
3.03
(±.84)
3.32
(±.66)
2.61
(±.87)
3.39
(±.75)
3.20
(±.79)
3.10
(±.78)
2.62
(±.73)
3.50
(±.63)
3.52
(±.71)
English
(SD)
3.26
(±.81)
2.85
(±1.09)
3.06
(±.86)
2.33
(±1.03)
3.45
(±.71)
3.07
(±1.07)
2.78
(±.90)
2.36
(±.92)
3.51
(±.63)
3.44
(±1.01)
Maths
(SD)
3.58
(±.86)
3.25
(±1.02)
3.70
(±.77)
2.83
(±.98)
3.47
(±.95)
3.43
(±1.02)
3.50
(±.86)
2.91
(±.94)
3.63
(±.87)
3.67
(±1.00)
Science
(SD)
3.34
(±.69)
3.38
(±.87)
3.32
(±.63)
3.33
(±.58)
3.36
(±.76)
3.40
(±.97)
3.29
(±.49)
3.25
(±.96)
3.35
(±.72)
3.44
(±.88)

24
Independent Samples T-Tests
To test the main research hypothesis, an independent samples t-test was carried out
using the mean academic grade, derived from the grades of the three core subjects, and
reports of participation in sports. The results indicated that although mean grades were
higher for sports participants (M = 3.36, SD =.70) than non-sports participants (M = 3.03, SD
= .84; t(84)= 1.78, p = .079), this difference was not statistically significant. Hypothesis 1 was
therefore accepted as sports participation does not negatively impact academic achievement.
After testing for gender differences, inspection of the two group means indicated that
the mean grade for male sports participants (M = 3.32, SD = 0.66) was significantly higher
than the mean grade for male students that did not participate in a sport (M = 2.61, SD = 0.87;
t(37) = 2.31, p = .026). The difference between the two means was 0.71 points on a 5-point
GPA scale; and the effect size, d = 0.71, was relatively large according to Cohen’s (1998)
guidelines on studies in behavioural sciences and education. This effect is illustrated in
Figure 1 below. The small difference in grades between female sports participants and non-
sports participants was not statistically significant (t(45)= 0.78, p = .435). These results
indicated that Hypothesis 5 could be rejected for females but accepted for males. However,
overall the hypothesis was rejected.

25
Figure 1
The difference in mean grades between male sports participants and male non-sports
participants
When comparing mean grades of male sports participants and female sports
participants, the Independent Samples T-test revealed that the observed mean difference
(0.07) was not statistically significant (t(64)= .406, p = .686). T-tests were also conducted
comparing the effect of sports participation for students in high and low decile schools. The
comparison of mean academic grades between sports participants and non-participants in the
low decile school did not produce a significant result. Similarly, no significant effect was
found for the high decile school. However, upon comparison of the effect of sports
involvement between high decile students and low decile students, there was a significant
difference in mean grades thus Hypothesis 7 accepted. This is illustrated in Table 5 below.
Table 5
Between-Decile Comparison of Mean Grades between Sports and Non-Sports Participants
Sports Non-Sports
N M S.D N M S.D T
Low 23 3.10 0.78 11 2.62 0.73 2.24*
High 43 3.50 0.63 9 3.52 0.71 2.77*
*p <.05, two-tailed
0
0.5
1
1.5
2
2.5
3
3.5
Participant Non‐Participant
Mean
Grade
Male Students
Mean grades for Male Sports and Non‐sports Participants
26
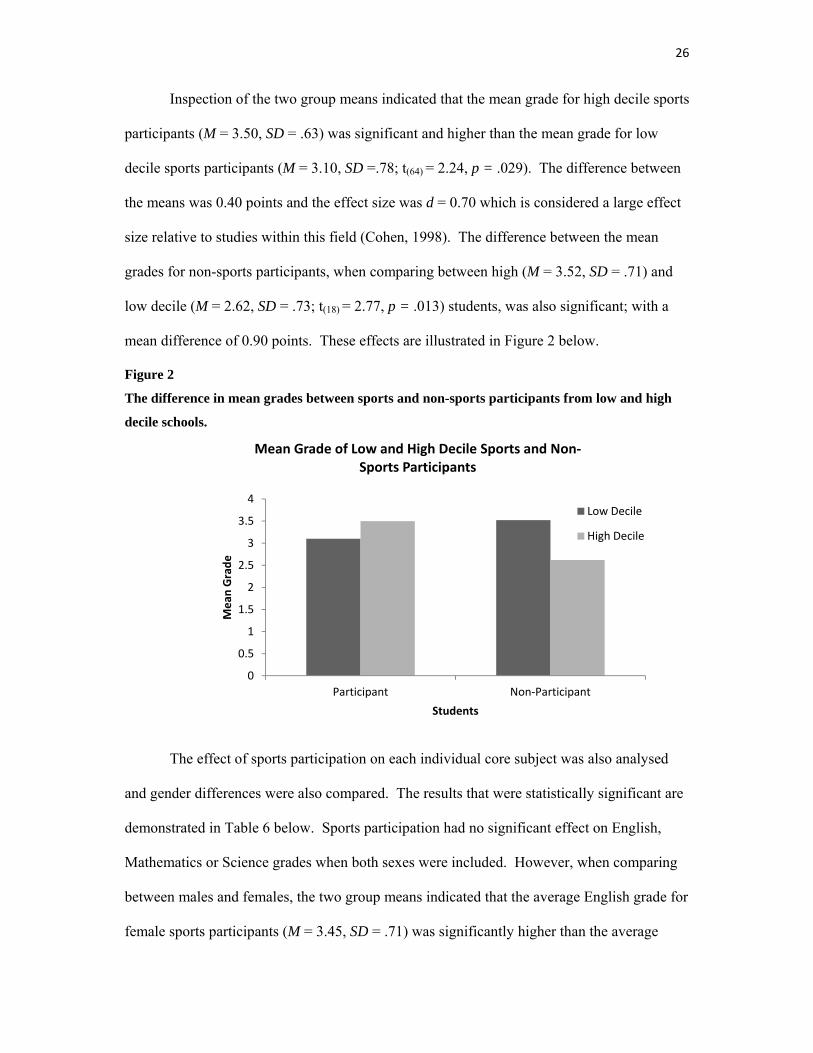
Inspection of the two group means indicated that the mean grade for high decile sports
participants (M = 3.50, SD = .63) was significant and higher than the mean grade for low
decile sports participants (M = 3.10, SD =.78; t(64) = 2.24, p = .029). The difference between
the means was 0.40 points and the effect size was d = 0.70 which is considered a large effect
size relative to studies within this field (Cohen, 1998). The difference between the mean
grades for non-sports participants, when comparing between high (M = 3.52, SD = .71) and
low decile (M = 2.62, SD = .73; t(18) = 2.77, p = .013) students, was also significant; with a
mean difference of 0.90 points. These effects are illustrated in Figure 2 below.
Figure 2
The difference in mean grades between sports and non-sports participants from low and high
decile schools.
The effect of sports participation on each individual core subject was also analysed
and gender differences were also compared. The results that were statistically significant are
demonstrated in Table 6 below. Sports participation had no significant effect on English,
Mathematics or Science grades when both sexes were included. However, when comparing
between males and females, the two group means indicated that the average English grade for
female sports participants (M = 3.45, SD = .71) was significantly higher than the average
0
0.5
1
1.5
2
2.5
3
3.5
4
Participant Non‐Participant
Mean
Grade
Students
Mean Grade of Low and High Decile Sports and Non‐Sports Participants
Low Decile
High Decile

27
grade for male sports participants (M = 3.06, SD = .86; t(64) = 2.02, p = .047) with a mean
difference of 0.39 points. The effect size was d = 0.5 which is typical according to Cohen’s
(1998) guidelines for studies within similar fields. Figure 3 below shows this effect. There
was no significant difference between the sexes for non-sports participants.
Table 6
Comparison of Mean Grades and Maths Grades between Male Sports and Non-Sports
Participants
Sports Non-Sports
N M S.D N M S.D t Mean Grade
33 3.32 0.66 6 2.61 0.87 2.31*
Maths Grade
33 3.70 0.77 6 2.83 0.98 2.43*
*p <.05, two-tailed
Figure 3
The difference in mean English grades between female and male sports participants
Analysis for Mathematics grades revealed a significant difference in mean grades for
male sports-participants when compared to non-participants; however there was no difference
between the means of female participants and non-participants. Inspection of the two group
2.8
2.9
3
3.1
3.2
3.3
3.4
3.5
Female Male
Mean
Englush Grade
Sports Participants
Mean English Grade for Male vs Female Sports Participants

28
means indicated that the average maths grade for male sports participants (M = 3.70, SD =
.77) was significantly higher than male students that did not participate in a sport (M = 2.83,
SD = .98; t(37) = 2.43, p = .020). The mean difference was 0.86 points on a 5-point scale and
the effect size was 0.8 which is relatively large for studies within this field (Cohen, 1998).
This effect is illustrated in Figure 4 below. There were no other significant differences for
English or Maths and no significant differences between achievement grades in Science;
therefore, overall, Hypothesis 6 was rejected.
Figure 4.
The difference in mean mathematics grades between male sports participants and male non-
sports participants
Simple Linear Regression
Correlation and Simple Linear regression analyses were conducted to investigate the
relationship between sports participation and mean academic achievement. Table 7 below
summarizes the descriptive statistics and analysis results. As seen in the table, the variables
that were analysed included sports participation, number of sports, type of sport, organisation
played for, time spent in hours, and frequency played per week, all with mean grade.
0
0.5
1
1.5
2
2.5
3
3.5
4
Participant Non‐Participant
Mean
Maths Grade
Male Students
Mean Maths Grade for Male Sports vs Non‐Sports Participants

29
Simple Linear Regression analysis was used to test if participation in sports
significantly predicted students mean grade. The results of the regression revealed that 3.6%
of the variation in mean grades could be accounted for by participation in sports. However,
there was no significant correlation between participation in sports and mean grade (R2 =
.036, F(1,84) = 3.155, p =.079).
Table 7
Correlations of Variables with Mean Grade from Simple Linear Regression Analyses
Variable Mean SD R2 R F
Mean Grade 3.28 ±.745 - - -
Sport Participation 1.23 ±.425 .036 -.190 3.155
No. of Sports 1.50 ±1.263 .029 .170 2.496
Sport Type 1.95 ±.718 .016 -.126 1.346
Sport Organisation 1.87 ±.773 .017 -.129 1.396
Time Spent 4.16 ±4.212 .042 .206 3.627
Frequency 2.61 ±2.242 .063 .252 5.610*
* = p < .05
After analysing whether the number of sports significantly predicted a student’s mean
grade; it was found that the number of sports predicted about 3% of the variation in mean
grades. The correlation between the two variables was also not significant (R2 = .029, F(1,84)
= 3.496, p =.118), therefore Hypotheses 2 and 3 were rejected.
With regard to the type of sport a student played, the regression analysis revealed that
the type of sport participated in accounted for 1.6% of the variation in mean grade. The
report for this measure, however, also indicated that the type of sport is not a significant
predictor for mean grade (R2 = .016, F(1,84) = 1.346, p = .249).
Simple Linear Regression analysis was also used to test if the organisation that a
student played a sport for predicted mean grade and it was found that this variable predicted
1.7% of the variation in mean grade. This measure was not found to be a statistically
significant predictor of mean grade (R2 = .017, F(1,82) = 1.396, p = .241). Further analysis
30
revealed that the time spent playing a sport, in hours per week, accounted for 4.2% of the
variance in mean grade. However, it was not found to be a significant predictor of mean
grade (R2 = .042, F(1,82) = 3.627, p = .060).
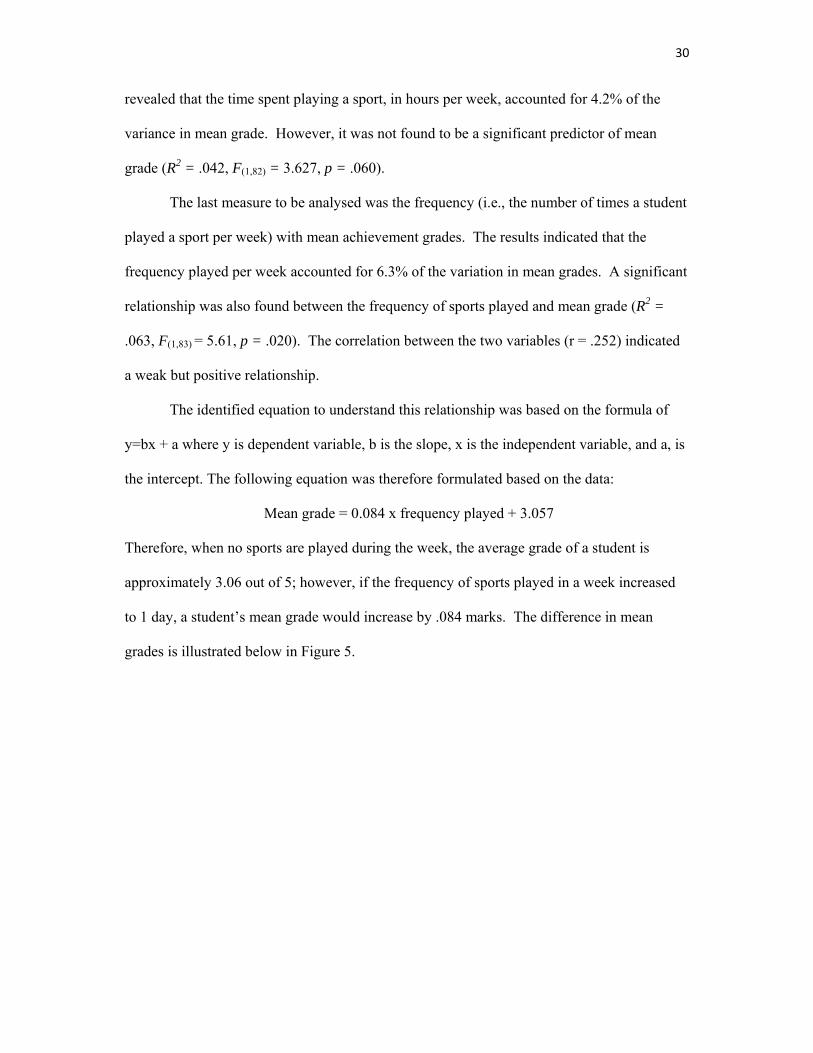
The last measure to be analysed was the frequency (i.e., the number of times a student
played a sport per week) with mean achievement grades. The results indicated that the
frequency played per week accounted for 6.3% of the variation in mean grades. A significant
relationship was also found between the frequency of sports played and mean grade (R2 =
.063, F(1,83) = 5.61, p = .020). The correlation between the two variables (r = .252) indicated
a weak but positive relationship.
The identified equation to understand this relationship was based on the formula of
y=bx + a where y is dependent variable, b is the slope, x is the independent variable, and a, is
the intercept. The following equation was therefore formulated based on the data:
Mean grade = 0.084 x frequency played + 3.057
Therefore, when no sports are played during the week, the average grade of a student is
approximately 3.06 out of 5; however, if the frequency of sports played in a week increased
to 1 day, a student’s mean grade would increase by .084 marks. The difference in mean
grades is illustrated below in Figure 5.

31
Figure 5
The trend of mean grades across the number of times sports are played per week for all
students.
Multiple Linear Regression
Simultaneous Multiple Regression was conducted to investigate the best predictors of
mean grades. When the combination of variables to predict mean grade included
participation in sports, number of sports, frequency played and time spent per week, F(4,79) =
1.41, p =.239. The Pearson correlations are presented in Table 8 below. Note that
participation in sports, frequency played, and time spent participating in sports per week all
significantly correlate with mean grade when all four variables are considered. However, all
four variables are highly correlated with each other thus there may be a problem with inter-
collinearity. The F statistic, however, is not statistically significant therefore the combination
of predictors does not significantly combine together to predict mean grade.
2
2.5
3
3.5
4
0 1 2 3 4 5 6 7
Frequency Played Per Week
Mean
Grade
Students Mean Grades across Frequency of Sports Played per week

32
Table 8
Correlations and Significance of Participation in Sports, Number of Sports, Frequency Played
and Time Spent with Mean Grade
* = p < .05 ** = p < .01 *** = p < .001
Summary of Results
After analysing the data via Independent Samples T-Test and Simple and Multiple
Regression analyses, only a few results were statistically significant. The main question of
whether participation in sports affects academic achievement has been answered. The results
indicated that no differences in academic achievement existed between female sports
participants and female non-sports participants; however differences existed for males.
Independent Samples T-Test revealed that males participating in a sport scored, on average,
0.71 points higher than males that did not participate in a sport, on a 5-point GPA scale.
This was found for Mathematics grades, as male sports participants, on average,
scored 0.86 points higher than males that were not sports participants. The only significant
effect for females was with English grades. It was also found that the mean English grade for
female sports participants was 0.39 points higher than male sports participants.
When comparing results of students from the low decile school to the high decile
school, it was found that students from the high decile school that participated in sports had,
on average, significantly higher grades than sports participants from the low decile school.
However, this effect was also present for non-sports participants as students from the high
Mean Grade Sports Number Frequency Time Spent
Sports -.187* 1.00 -.661*** .653 -.758***
Number .165 -.661*** 1.00 .632*** .623***
Frequency .252* -.653*** .632*** 1.00 .892***
Time Spent .214* -.758*** .623*** .892*** 1.00

33
decile school obtained, on average, 0.90 points more on their mean grades as compared to the
low decile school students.
Finally, the relationship between the frequency of sports played per week and mean
grade was also significant. It was found that if a student increased the number of times they
played sports in a week by 1 day, their mean grade was predicted to increase by 0.084 points
on a 5-point scale.
Discussion
Implication of Results on Hypotheses
It can therefore be concluded that the main hypothesis H1 was accepted. Participation
in sports was not negatively associated with the academic achievement of intermediate
students as there was no significant difference found between the grades of sports and non-
sports participants. Sports participation was not significantly associated with higher
academic grades therefore H2 was rejected. Although participation in sports was positively
associated with academic achievement for male participants; there was no significant
difference between the mean grades of male and female sports participants. H5 was therefore
rejected. Male sports participants had significantly higher maths grades than male non-
participants; however this association was not significant for females and was not applicable
to the other core subjects thus H6 was also rejected.
The number of sports in which one participated in, did not have a significant
relationship with academic achievement, therefore H3 was rejected. The association between
academic achievement and the amount of hours spent playing a sport was not significant,
however, the number of days played per week was associated with higher grades. As Figure
5 indicated, students that played a sport 5-7 days a week had a higher mean grade than all
other categories. However, as H4 included both hours and days per week, this hypothesis was
also rejected. On the other hand, H7 was accepted as sports participants from the high decile

34
school achieved significantly higher mean grades than sports participants from the low decile
school.
General Implication of Results
The majority of prior studies studying the effect of participation in sports on a
student’s academic achievement have found that students grades are either not affected at all
or they are significantly higher when participating in a sport. The results of the current study
are consistent with those of other studies as no significant differences were found in students
grades when comparing the mean grades of sports participants with the mean grade of non-
sports participants. Furthermore, it was found that when examining within sex differences,
male sports participants actually had higher overall mean grades than males that did not play
a sport. Similarly, male sports participants also outperformed male non-participants when
looking at average Mathematics grades. However, the same was not true of female sport
participants. Such a result implies that participating in sports may affect males and females
differently.
Although there was no significant relationship found between the organisation for
whom a participant plays, and mean grade, it is interesting to note that the majority of female
sports participants (61%) were part of a school sports team rather than an outside organisation
or club as compared to males. It is possible that being part of a school sports team results in a
different effect on academic school commitments as compared to being part of an outside
school organisation; however, such a conclusion cannot be made from these results.
In terms of gender comparisons (i.e. male results versus female results), female sports
participants were found to have, on average, higher English grades than male sports
participants. It may therefore be possible that participation in sports has a positive effect on
English grades for females as compared to males. Compared to female non-participants, the
mean English grade was 0.38 points higher for female sports participants; however this result

35
was not significant. Another explanation may be that females generally are better at English
than males, regardless of participation in sports. This may be more likely as comparisons of
the group means of male and female non-sports participants reveals that females, on average,
score 0.74 points higher than males in English; however this result was also not statistically
significant.
Further examination revealed that more students from the high decile school (School
1) participated in sports than students from the low decile school (School 2). Although the
response rate was higher from School 1, there were more students in the non-sports
participant group from School 2 compared to School 1. This comparison found that sports
participants from the high decile school obtained, on average, significantly higher mean
grades than sports participants from the low decile school which may have one of two
implications. The first implication is that students from high decile schools may generally
achieve better grades than students from low decile schools (Eitle & Eitle, 2002; Chomitz et
al., 2009). This is highly likely because it was also found that the non-sports participants
from School 1 achieved, on average, significantly higher mean grades (i.e., .90 grade points)
than non-sports participants from School 2.
The second implication is that students who participate in sports generally do better
than students who do not. The support for this statement lies in the number of students who
reported playing a sport compared with those who reported no sports involvement. In School
1, of the 52 students who participated in the study, 83% of the students were sports
participants compared to School 2’s 68% of 34 students. School 1 (high decile) is composed
of, overall, more students who participate in sports than School 2 (low decile). Therefore if
students who participate in sports do actually do better academically than non-participants;
the higher 15% of sports participants in the high decile school compared to the low decile
school may explain the significantly higher mean grade of School 1.

36
The only other significant finding was the association between sport frequency and
mean grade. The frequency a student played sports was positively associated with their
overall academic achievement thus implying that if students increased the number of days
they played a sport in a week (i.e., 5-7 days), their mean grade was likely to improve. This
may be because students that play 5-7 times a week need to work extra hard to balance
between their academic life and sporting life therefore gaining the benefits of discipline and
organisation skills for effective learning. However, although the Linear Regression analysis
revealed a positive association between the two variables, the correlation was not very strong.
The current results should, however, be interpreted with caution because the
relationship that is found between the variables is not a causal one. For this reason, the
results could be interpreted in two ways, one of which was that participation in sports results
in higher mean grades for males. However, it may be that male students that do well at
school and obtain high mean grades, and high maths grades, are more likely to participate in
sports. Similarly, it may be that students who achieve higher mean grades are more likely to
engage in sports more times a week than students that get lower grades.
This is supported by Lindner’s (2002) results in which the selection hypothesis and
situational hypotheses are described. Both these hypotheses are possible explanations for
these results as the selection hypothesis suggests male students in the current sample may
naturally achieve high grades academically and be drawn to a sporting lifestyle. On the other
hand, the situational hypothesis suggests that it may be the parents of the high achieving
children allow their children to take part in sports; compared to low achieving children who
are less likely to be allowed to participate. Further information is therefore needed to
interpret the results more accurately.

37
Comparisons with Previous Studies
Similar to other studies, the current study’s results found that participating in sports
did not negatively impact a student’s academic achievement. Furthermore, consistent with
previous research (Fox et al., 2010; Linder, 2002) significant positive effects were only found
for male sports participants. Cornelißen and Pfeifer (2007) also found that the effect of sports
participation was greater for males than females. Additionally, two studies (Chomitz et al.,
2009; Stephens & Schaben, 2002) found a significant positive effect on maths grades which
was consistent with the current studies results for males. Stephens and Schaben (2002) also
found that female sports participants outperformed male sports participants, which was also
the case for the current study in English grades.
Limitations
There are several limitations which need to be addressed. These limitations include
the following: schools were not randomly chosen; the schools were urban public schools, in
Auckland, there were unequal sample sizes between the schools; there was a low response
rate; self-report measures were used with self-made questionnaires; the research design was
non-experimental; and there were a higher number of sports participants in the study.
Firstly, the researcher chose schools on the basis of the schools geographical location
and their decile rating therefore the selection of each participating school was not randomly
chosen. This is a limitation because the sample was biased towards each extremity (e.g.
Decile 1 and Decile 9) and may not give a true estimate of the population. Additionally, the
chosen schools were based within Auckland and were urban public schools hence it is
possible that students from rural schools or schools in different areas of New Zealand have
different effects.
Another major limitation for the study was the number of participants. Only 2
schools participated in the study thus producing a small number of participants in the sample.

38
The inclusion of more Schools would have increased the number of participants available and
produced more reliable results to better represent the population. The low and uneven
response rate from both schools added to this limitation. Students from School 2 (Low
decile) had an extremely low data completion rate. Not only were some answers left
incomplete, but some answers that were given were irrelevant to the question. Therefore,
because there were more students in the sample of School 2 (high decile), School 1 may have
been under-represented; causing skewed results.
The current study also used self-made questionnaires. Therefore no pilot studies
existed to measure the validity or reliability of the questionnaire which may have led to
unreliable results. Moreover, the data were based on self-report measures therefore students
may have given incorrect or dishonest answers to some of the questions, particularly
questions concerning their academic achievement. Such an event may arise due to social
desirability bias where the student may want to be perceived as ‘smarter’ or ‘sportier’ than
they actually are; and would therefore write an answer that is higher than it should be
(Grimm, 2010). Even though it was evident and made clear that the questionnaire would be
anonymous, such a limitation was still possible and would have produced inaccurate results.
In addition to these limitations, the current study also did not employ an experimental
design; thus, no causal relationships can be concluded from the results. For this reason it is
possible that effects and associations found between the independent variables and the mean
grade may be interpreted in two ways. The results found from the Independent Samples T-
Tests may indicate that students who achieve higher grades are more likely to play sports or,
conversely, that students obtain higher grades if they play a sport.
Finally, and relatedly, it should be taken into consideration that sports participants are
more likely to respond to, or take part in the study, than students that do not play a sport. This
is a limitation as the sample included a larger number of sports participants (77%) compared

39
to non-sports participants (23%) hence non-sports participants were under-represented in this
study. This, again, may have produced skewed or unreliable results.
Future Recommendations
Recommendations for future research include an examination of the relationship
between sports participation and academic achievement. Firstly, it would be beneficial to
obtain more participants in the sample. Future researchers are encouraged to gather data
from more schools with different geographical locations, decile ratings, and rural versus
urban areas. If the study were to be on a larger scale then it is also ideal to use schools from
different cities across the country and not only Auckland schools.
The second recommendation would be to use school records rather than self-report
measures. Academic records and records of student’s participation in sports teams can be
collected from the school database as this would avoid the complications of incomplete
questionnaires, dishonest and irrelevant answers. Furthermore, this method would also
produce more accurate results. The current study planned to do this, but was limited by the
ethics committee’s insistence that school records not be accessed to ensure participant
anonymity.
Conclusion
An important part of many students’ lives is their engagement in sports. It is not
surprising then that parents and school personnel alike raise the question of whether
participating in a sport has a negative impact of their academic achievement. The results of
this study examined this effect and found that sports participation does not negatively impact
a student’s grades, but in fact for male students is positively associated with higher overall
grades and maths grades. Furthermore, the current study found that increasing the number of
times a week a student plays sports, is positively related to higher mean grades. Future
research is needed in the areas of use of more objective data and demographics, which would

40
increase generalizability. However, these results suggest that increased sports participation is
not detrimental to students’ grades.

41
References
Ahamed, Y., Macdonald, H., Reed, K., Naylor, P.-J., Liu-Ambrose, T., & Mckay, H.
(2007). School-based physical activity does not compromise childrens academic
performance. Medicine & Science in Sports & Exercise, 39, 371-376.
Bailey, R. (2006). Physical education and sport in schools: A review of benefits and
outcomes. Journal of School Health, 76, 397-401.
California Department of Education. (2005). A Study of the Relationship between
Physical Fitness and Academic Achievement in California using 2004 Test Results (2004
Report). California.
Carnachan, G. (2010). School sport: Trends, barriers, opportunities. Paper presented
at the Physical Education New Zealand National Conference, New Zealand.
Castelli, D. M., Hillman, C. H., Buck, S. M., & Erwin, H. E. (2007). Physical fitness
and academic achievement in third- and fifth-grade students. Journal of Sport and Exercise
Psychology, 29, 239-252.
Cheung, P. P. Y., Chow, B. C. (2010). Parental mediatory role in children's physical
activity participation. Health Education, 110, 351-366.
Chomitz, V. R., Slining, M., M., McGowan, R., J., Mitchell, S., E., Dawson, G., F., &
Hacker, K., A. (2009). Is there a relationship between physical fitness and academic
achievement? Positive results from public school children in Northeastern United States.
Journal of School Health, 79, 30-37.
Coe, D. P., Pivarnik, J., M., Womack, C., J., Reeves, M., J., & Malina, R., M. (2006).
Effect of physical education and activity levels on academic achievement in children.
Medicine & Science in Sports & Exercise, 38, 1515-1519.

42
Corneliben, T., & Pfeifer, C. (2007). The impact of participation in sports on
educational attainment: New evidence from Germany. Hannover: Leibniz University
Hannover.
Eitle, T. M., & Eitle, D., J. (2002). Race, cultural capital, and the educational effects
of participation in sports. Sociology of Education, 75, 123-146.
Etnier, J. L., Salazar, W., Landers, D. M., Petruzzello, S. J., Han, M., & Nowell, P.
(1997). The influence of physical fitness and exercise upon cognitive functioning: A meta-
analysis. Journal of Sport and Exercise Psychology, 19, 249-277.
Fox, C. K., Barr-Anderson, D., Neumark-Sztainer, D., & Wall, M. (2010). Physical
activity and sports team participation: Associations with academic outcomes in middle school
and high school students. Journal of School Health, 80, 31-37.
Grimm, P. (2010). Social Desirability Bias. Wiley International Encyclopedia of
Marketing.
Hersen, M. (2004). Comprehensive Handbook of Psychological Assessment:
Behavioral Assessment. New Jersey, John Wiley & Sons Inc.
Hillman, C. H., Erickson, K., I., & Kramer, A., F. (2008). Be smart, exercise your
heart: Exercise effects on brain and cognition. Nature Reviews, 9, 58-65.
Lindner, K. J. (2002). The physical activity participation-academic performance
relationship revisitied: Percieved and actual performance and the effect of banding (academic
tracking). Pediatric Exercise Science 14, 155-169.
Mahar, M. T., Murphy, S., K., Rower, D., A., Golden, J., Sheilds, T., A., & Raedeke,
T., D. (2006). Effects of a classroom-based program on physical activity and on-task
behavior. Medicine & Science in Sports & Exercise, 38, 2086-2094.

43
Ministry of Education. (2007). Physical Activity for Healthy Confident Kids:
Guidelines for Sustainable Physical Activity in School Communities. Retrieved from
http://www.tki.org.nz/e/community/health/PDF/pahck-guidelines.pdf.
Mustelin, L., Joutsi, J., Latvala, A., Pietelainen, K. H., Rissanan, A., & Kaprio, J. (in
press). Genetic influences on physical activity in young adults: A twin study. Medicine and
Science in Sport and Exercise.
Rees, D. I., & Sabia, J., J. (2010). Sports participation and academic performance:
Evidence from the national longitudinal study of adolescent health. Economics of Education
Review, 29, 751-759.
Schlesser, C. E. (2004). The correlation between extracurricular activities and grade
point average of middle school students. Master of Science Degree, University of
Wisconsin-Stout, Wisconsin.
Shephard, R. J. (1996). Habitual physical activity and academic performance.
Nutrition Reviews, 54, 32-36.
Sport New Zealand. (2006). Stay and Play. Retrieved from
http://www.sportnz.org.nz/Documents/Young%20People/4A_stayandplay.pdf
Statistics New Zealand. (2007). Mapping Trends in the Auckland Region. Retrieved
from http://www.stats.govt.nz/browse_for_stats/people_and_communities/geographic-
areas/mapping-trends-in-the-auckland-region/income.aspx.
Stephens, L. J., & Schaben, L., A. (2002). The effect of interscholastic sports
participation on academic achievement of middle level school students. NASSP Bulletin, 86,
34-41.
Taras, H. (2005). Physical activity and student performance at school. Journal of
School Health, 75, 214-218.

44
Tomporowski, P. D., Davis, C., L., Miller, P., H., & Naglieri, J., A. (2008). Exercise
and children's intelligence, cognition, and academic achievement. Educational Psychology
Review, 20, 111-131.
Trudeau, F., & Shephard, R. J. (2008). Physical education, school physical activity,
school sports and academic performance. International Journal of Behavioral Nutrition and
Physical Acitivity, 5.
Valentine, K. (2007). Deciles, from
http://www.kiwifamilies.co.nz/Topics/Education/Education+Overview/Deciles.html

45
Appendix A
Educational Psychology Programme
School of Education, Massey University
Private Bag 102904, North Shore Mail Centre 0745
Auckland
Students and Sports: The relationship between sports and academic achievement
Questionnaire
Thank you for participating in this study. Your questionnaire will be anonymous so please do not
write your name anywhere on this questionnaire, and be as honest as possible. Fill out this
questionnaire about your academic achievement and involvement in sports to the best of your
knowledge. You may decline to answer any question if you wish. Please complete and return this
questionnaire to your teacher within a week.
Section One: Demographics
Date: _________________ Age: _________ Male Female
Ethnicity: ___________________________
Section Two: Sports Involvement
Please answer the following questions about your involvement in sports. The word currently
refers to being part of a sports club/team at this moment. It does not matter whether you are
playing the sport during the current season as long as you are part of the club/team this year.
1. Are you currently taking part in any sports? ________________________
If no please proceed to Section Three, If yes please answer the following questions:
2. How many sports do you currently play? ____________________________

46
3. Which sport(s) do you currently play? (e.g. cricket, tennis etc.)
________________________________________________________________________________
________________________________________________________________________________
________________________________________________________________________________
4. For each sport you are currently playing, please specify the type of team or organization you are
associated with. (e.g. swimming - school team, soccer - north shore club)
Sport Team/Organization
_________________________ ___________________________________
_________________________ ___________________________________
_________________________ ___________________________________
_________________________ ___________________________________
_________________________ ___________________________________
5. How often do you play this sport(s)? (E.g. twice a week during the rugby season, if you play
more than one sport please specify for each sport e.g. cricket – once a week, soccer - twice a week)
Sport Frequency played (per week)
_________________________ ___________________________________
_________________________ ___________________________________
_________________________ ___________________________________
_________________________ ___________________________________
_________________________ ___________________________________
6. In a week, approximately how much time do you think you spend playing this sport(s) (E.g. 5
hrs/wk or if more than one sport please specify for each sport e.g. tennis – 3 hrs/wk, swimming 5
hrs/wk)
Sport Time spent (per week)
_________________________ ___________________________________
_________________________ ___________________________________
_________________________ ___________________________________
_________________________ ___________________________________
_________________________ ___________________________________

47
7. How long have you been playing this sport(s) for? (E.g. 3 months or 2 years, if you play more
than one sport, please specify for each sport how long you have been playing)
Sport Played for (weeks/months/years)
_________________________ ___________________________________
_________________________ ___________________________________
_________________________ ___________________________________
_________________________ ___________________________________
_________________________ ___________________________________
Section Three: Academic Achievement
8. In your mid-year report card, what grade did you receive for the following subjects;
English: ____________________________
Mathematics: ____________________________
Science: ____________________________

48