Embed Size (px)
DESCRIPTION
balloon
Citation preview

This content has been downloaded from IOPscience. Please scroll down to see the full text.
Download details:
IP Address: 169.226.11.193
This content was downloaded on 18/02/2015 at 16:18
Please note that terms and conditions apply.
An investigation into the nature of high altitude cosmic radiation in the stratosphere
View the table of contents for this issue, or go to the journal homepage for more
2013 Phys. Educ. 49 164
(http://iopscience.iop.org/0031-9120/49/2/164)
Home Search Collections Journals About Contact us My IOPscience

iopscience.org/ped
An investigation into the nature ofhigh altitude cosmic radiation inthe stratosphereSamuel Bancroft, Ben Bancroft and Jake Greenwood
Sixth Form, William Howard School, Longtown Rd, Brampton, Cumbria CA8 1AR, UK
E-mail: [email protected]
AbstractAn experiment was carried out to investigate the changes in ionizing cosmicradiation as a function of altitude. This was carried out using a Geiger–Mullertube on-board a high altitude balloon, which rose to an altitude of 31 685 m.The gathered data show that the Geiger–Muller tube count readings increasedto a maximum at an altitude of about 24 000 m; beyond this point they thendecreased with increasing altitude.
BackgroundIn 1912, the Austrian–American physicist VictorF Hess made a revolutionary discovery. He sys-tematically measured levels of ionizing radiationby taking equipment up on a manned balloon toheights of up to 5.3 km. What he discovered wasthat the radiation decreased as one moved furtherfrom the Earth, but beyond 1 km in altitude it thenincreased significantly, with readings taken at 5 kmthat were more than double the values of those atground level. This radiation intensity proved to notbe time dependent, and Hess therefore concludedthat the planet’s upper atmosphere was subject topenetrating radiation from deep space, not justour Sun. His findings opened many doors intoinvestigation in nuclear physics, and marked thebeginning of an era of cosmic ray physics.
Ground level radiation (below 4 km) is domi-nated by terrestrial sources (see table 1). However,above 4 km, the major source of radioactivityis cosmic rays. Cosmic rays are extra-terrestrialhigh-energy charged particles that travel at nearlythe speed of light and bombard the planet from alldirections. They are said to reach such high speeds
because of the action of magnetic forces in space.There are many suggestions for the origin of thesecosmic rays, such as that they are produced fromgalactic supernovae. At first, these particles wereincorrectly named ‘rays’, as they were first thoughtto be mostly electromagnetic radiation. However,they actually mainly consist of protons (90%) andα-particles (9%).
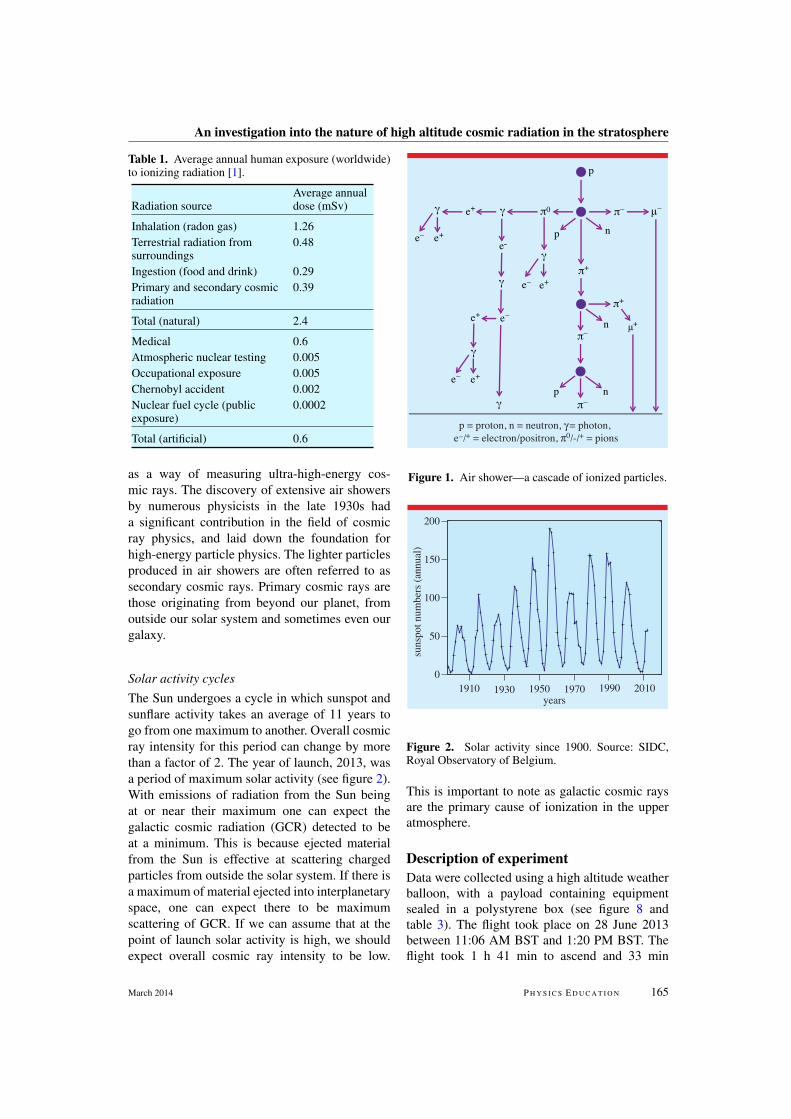
Air showersCosmic rays enter the Earth’s atmosphere, andcollide with molecules (mostly oxygen and ni-trogen), resulting in a cascade of lighter ionizedparticles (see figure 1). This shower of secondaryparticles is called an ‘air shower’, and it wasfrom these that the first muons and pions weredetected experimentally in 1947. Air showers donot persist into the lower atmosphere. This is be-cause as these particles continue downwards, moreparticle collisions occur as a result of increasingatmospheric density. Particles lose energy becauseof these collisions, meaning that they lose theenergy required to cause further ionization. Theseair showers are used today in many experiments,
164 P H Y S I C S E D U C A T I O N 49 (2) 0031-9120/14/020164+07$33.00 c© 2014 IOP Publishing Ltd
An investigation into the nature of high altitude cosmic radiation in the stratosphere
Table 1. Average annual human exposure (worldwide)to ionizing radiation [1].
Radiation sourceAverage annualdose (mSv)
Inhalation (radon gas) 1.26Terrestrial radiation fromsurroundings
0.48
Ingestion (food and drink) 0.29Primary and secondary cosmicradiation
0.39
Total (natural) 2.4
Medical 0.6Atmospheric nuclear testing 0.005Occupational exposure 0.005Chernobyl accident 0.002Nuclear fuel cycle (publicexposure)
0.0002
Total (artificial) 0.6
as a way of measuring ultra-high-energy cos-mic rays. The discovery of extensive air showersby numerous physicists in the late 1930s hada significant contribution in the field of cosmicray physics, and laid down the foundation forhigh-energy particle physics. The lighter particlesproduced in air showers are often referred to assecondary cosmic rays. Primary cosmic rays arethose originating from beyond our planet, fromoutside our solar system and sometimes even ourgalaxy.
Solar activity cyclesThe Sun undergoes a cycle in which sunspot andsunflare activity takes an average of 11 years togo from one maximum to another. Overall cosmicray intensity for this period can change by morethan a factor of 2. The year of launch, 2013, wasa period of maximum solar activity (see figure 2).With emissions of radiation from the Sun beingat or near their maximum one can expect thegalactic cosmic radiation (GCR) detected to beat a minimum. This is because ejected materialfrom the Sun is effective at scattering chargedparticles from outside the solar system. If there isa maximum of material ejected into interplanetaryspace, one can expect there to be maximumscattering of GCR. If we can assume that at thepoint of launch solar activity is high, we shouldexpect overall cosmic ray intensity to be low.
Figure 1. Air shower—a cascade of ionized particles.
Figure 2. Solar activity since 1900. Source: SIDC,Royal Observatory of Belgium.
This is important to note as galactic cosmic raysare the primary cause of ionization in the upperatmosphere.
Description of experimentData were collected using a high altitude weatherballoon, with a payload containing equipmentsealed in a polystyrene box (see figure 8 andtable 3). The flight took place on 28 June 2013between 11:06 AM BST and 1:20 PM BST. Theflight took 1 h 41 min to ascend and 33 min
March 2014 P H Y S I C S E D U C A T I O N 165

S Bancroft et al
Figure 3. Internal temperature (◦C) during the ascentversus altitude (m).
Figure 4. Profile histogram of counts (per∼17 s) versusaltitude (m). The histogram includes data obtained onboth the ascent and the descent. The error bars denoteone standard deviation (of the current bin) above andbelow the data point.
to descend. It reached a maximum altitude of31 685 m (see figure 9). The payload containeda single, omnidirectional Geiger–Muller counter(alongside other recording devices) and countswere recorded approximately every 17 s. Therecorded counts were stored, and the countswere reset before each new measurement. Allequipment inside the payload box was withinoperational ranges (see table 2), despite the in-ternal temperature fluctuations (see figure 3).Our measuring instruments were therefore notat considerable risk of recording inaccurate data.
Figure 5. Profile histogram of counts (per∼17 s) versusatmospheric Pressure (Pa). The histogram includes dataobtained on both the ascent and the descent. The errorbars denote one standard deviation (of the current bin)above and below the data point.
AnalysisA complete set of data was successfully obtained.The plots generated (in figures 4 and 5) canbe observed for the data gathered on both theascent and the descent independently. The peakof incidences caused by primary or secondarycosmic rays occurs at an altitude of approximately20 km, and there is a maximum count rate at anatmospheric pressure of ∼10 000 Pa.
Post-experiment investigationsDuring the analysis period, investigations werecarried out to ensure that there were no factors thatcould have significantly influenced the reliabilityof our results.
Potential orientation bias on the Geiger–Mullertube. If there was any orientation bias withour Geiger–Muller tube then the recorded resultscould have been affected by the way we positionedthe instrument in the payload box, or even by theswinging of the payload beneath the balloon. Ifthere was a horizontal orientation bias, then ioniz-ing particles incident on our Geiger–Muller tubefrom shallow angles would have been favoured(in terms of detection), and ionizing particlespropagating vertically downwards due to airshowers would have been neglected. This wouldhave been because a larger surface area of thetube would have been exposed to the horizontal
166 P H Y S I C S E D U C A T I O N March 2014

An investigation into the nature of high altitude cosmic radiation in the stratosphere
Table 2. Equipment data.
Measurement and units Precision Operational capability Temperature resilience
Ext. temperature ◦C Resolution user-definedfrom 9 to 12 bits
−65 to +125 ◦C −55 to +125 ◦C [4]
Int. temperature ◦C 0.1 −40 to +85 ◦C −40 to +85 ◦C [5]Pressure hPa 0.01 (Pa) 300–1100 hPa
(0.3–1 atm. approx.)−40 to +85 ◦C [5]
UV Rad. µV 1 mV 240 nm370 nm equivalence
−30 to +85 ◦C [6]
β and γ Rad. Cps — — −60 to +70 ◦C [2]Lat. Long. Alt. Time — — −40 to +85 ◦C [7]
Table 3. Bill of materials. Below is a list of materials that were directly pre-purchased in preparation for use aspart of the payload. Further equipment and materials such as a soldering iron, electrical wires and an SD card, etcwere also required, but are not listed. The materials in total cost ∼£287.
Name/description Brand/part no. Supplier
Geiger–Muller tube (×1) SBM-50 AdafruitBarometricpressure/temp./alt. sensor (×1)
BMP085 Adafruit
Waterproof external temperaturesensor (×1)
DS18B20 Adafruit
Analogue to digital converter (×1) MCP3008 AdafruitPolystyrene sheets600 mm × 400 mm × 25 mm (×5)
— Globe Packaging via Amazon
AA battery (×4) Energizer ultimate 626264 AAlithium batteries
iCell Media via Amazon
AAA battery (×2) Energizer ultimate AAA lithiumbatteries
Energizer via Amazon
AA battery holder (×2) — T2 Enterprises Ltd via AmazonGPS uBLOX MAX-6 (×1) HAB Supplies434.075 MHz radio transmitter (×1) NTX2 HAB Supplies24′′ Parachute (×1) Spherachute Random EngineeringNylon cord (×1) — Random Engineering2.23 m3 helium gas — BOC
plane. As we were focusing on radiation fromthe vertical direction, we needed to ensure thatthis was not the case. To test for any orientationbias, count rates on the ground were logged overmultiple 15 min periods with the Geiger–Mullertube positioned in both horizontal and verticalorientations alternately. We concluded from therecorded results that the count rate did not varyto a sufficient statistical significance to show anyvariations in counts recorded between horizontaland vertical orientations. There was a maximumarea of the tube exposed to the vertical planewhen the device was in a vertical orientation,and a minimum exposed area when it was in ahorizontal orientation.
Counts/15 min forvertical orientation
Counts/15 min forhorizontal orientation
247 285269 275273 257263 307288 266
Mean (xv) = 268 Mean (xh) = 278σv =
√xv σh =
√xh
σv = ±16.4 σh = ±16.7
The count rate for a fixed period of time isa random variable whose probability distributionis a Poisson distribution. Therefore the standard
March 2014 P H Y S I C S E D U C A T I O N 167

S Bancroft et al
deviation of each orientation for such a distributionis simply
√truemean.
σ√
n = standard error of the sampling distribu-tion, where n = the size of the population (5).√
(√σv√
5)2 + (
√σh√
5)2 = 10.4 = uncertainty in
the difference (combined standard errors).2(xv−xh)
xv+xh× 100 =% difference (difference in
means/mean of means).2(
√(√σv√
5)2+(
√σh√5)2)
xh+xv× 100 = % uncertainty of
the difference (uncertainty in the difference/meanof means).
This results in a difference of ∼3.66% ±3.83% to 3 s.f.
The difference is positive, but is statisticallycompatible with zero. We are able to reject thehypothesis of orientation bias. This shows that theswaying of the box is not significantly affectingcount readings, as the orientation of the instrumentdoes not significantly affect the count rate.
Dead time and potential saturation on theGeiger–Muller tube. After a count is detected,the instrument is rendered insensitive for approx-imately 190 µs (at a recommended operatingvoltage of 400 V) [2]. Therefore, in this dead timeperiod, it is temporarily unable to detect the arrivalof the next ionizing particle that could arrivewithin that time period. This means that our resultscould have been affected at sufficiently high countrates, where a discharge pulse occurs after a timeperiod of less than 190µs from the previous count.As counts are random and independent of eachother, there is always a chance that counts couldbe missed out; however, for this to be an issuethere must be a significant probability that countsare being lost. The probability of counts being lostvaries depending on the frequency of counts andthe dead time of the device. If our Geiger–Mullertube had encountered a heavy stream of radiation,the particles could have been arriving faster thanthe instrument had time to ‘recover’ itself. Insuch conditions, it would have become saturatedand would have falsely reported low or even zeroradiation at that time. However, if we assume thatthe time it takes for a count to be recorded (timeto count), and then for the instrument to recover,is a time period of about 190µs, the count rate per∼17 s would have to be around 5000—far aboveour peak count reading of 227. This is further
Figure 6. Scatter graph of counts (per ∼17 s) againstaltitude (m).
supported by figure 6; there are no readings thatprovide any evidence for this occurring. Becauseof this we can confidently state that the instrumentdid not become saturated; therefore, our resultswere not affected.
The peak count rate recorded was 227 countsin a 17 s interval, so the actual number of counts(recorded value + counts lost due to dead time)can be estimated using
N ≈Nm
1− Nmτ/T,
where Nm counts are recorded, T is the particulartime period and τ is the dead time. This assumesthat the tube is characterized by non-paralysablebehaviour, meaning that any event occurring dur-ing the dead time is simply missed—without thedead time being ‘restarted’.
N ≈227
1− 227× 1.9× 10−5/17= 227.057 605 85
Full calculation22717 = 13.352 941 18 = average number of counts
per second.13.352 941 18×1.9×10−5
= 0.000 253 706= average dead time per second for peak countrate.
0.000 253 706 ×13.352 941 18
1−0.000 253 706 =
0.003 388 579 = expected number of lost countsper second due to dead time.
168 P H Y S I C S E D U C A T I O N March 2014

An investigation into the nature of high altitude cosmic radiation in the stratosphere
Figure 7. The Pfotzer curve. Adapted from [3].
0.003 388 579 × 17 = 0.057 605 85 =
expected number of lost counts per 17 s (package)due to dead time.
227 + 0.057 605 85 = 227.057 6059 =expected number of counts if lost counts areincluded.
0.057 605 85227.057 6059 × 100 = 0.025 370 588 =
percentage of counts lost.As only 0.25% of the counts are lost at the
maximum count rate, we can safely assume thatthere was no significant effect on our readings dueto an influence by dead time.
ConclusionWe concluded that the peaks in the graphs are tobe attributed to the maximum flux of the com-ponents of cosmic rays that are of secondaryorigin. In other words, at an approximate altitudeof 20 km, there is a peak amount of ionizingmaterial produced from air shower cascades thatare propagating downwards to the surface. Thispeak can be understood by identifying two com-peting effects. Firstly, cosmic ray intensity willdecrease as altitude decreases, because there havealready been collisions higher up. Secondly, atmo-spheric density will increase as altitude decreases,increasing the likelihood of collisions. The prod-uct of these two competing effects produces amaximum in cosmic ray flux at ∼20 km. As wedid not use multiple coincidence arrays to isolateour cosmic radiation measurements solely to thevertical direction, we are unable to ascertain theimpact that ionizing particles interacting with theGeiger–Muller tube from the side had. We can
Figure 8. Payload arrangement. The payloadequipment was contained in an insulated polysytrenebox, separated with dividers (as pictured) and fasteneddown with a secondary polystyrene ‘roof’.
Figure 9. Balloon burst at 31 685 m.
only assume, based on previous research, thatthe majority of the radiation detected was in thevertical plane. Looking at previous investigations,we discovered an article produced by cosmic rayphysicist Pfotzer in the 1930s [3], based on hiswork with Regener. Their published graph (seefigure 7) has remarkable similarities with our ownresults. It should be noted that the count rate onthe Pfotzer curve (see figure 7) was measuredin counts per 4 min, and our count rates weremeasured per every approximate 17 s. The twographs seem to be supporting each other. OurGeiger–Muller tube recorded omnidirectionally,whereas their apparatus consisted of threefoldcoincidences which isolated their recordings to thevertical plane. This does not seem to have caused amajor difference between our graphed results. Thissuggests that the majority of cosmic radiation ispropagating downwards in a vertical direction.
March 2014 P H Y S I C S E D U C A T I O N 169

S Bancroft et al
Further investigationsThe cost of this investigation was relatively lowand further investigations could be performed ina similar manner. The sensor used was an om-nidirectional Geiger–Muller tube. This was usedbecause it was easily purchasable and affordable,and also because of the lightweight, rugged natureof the device. However it had weaknesses, such asan inability to continuously measure (due to deadtime) and record individual coincident particleenergies. A scintillation counter could have beenused instead to gather further information. Withit, the energy of each ionizing particle coincidenton the detector could have been recorded. Thiscould show a change in the average energy of eachparticle with altitude (the expected result wouldbe that the energy would increase as the altitudeincreased, up to the Pfotzer maximum). The sumenergy of all particles could also be calculated.The use of a larger balloon would mean that datafrom higher altitudes could also be collected. Thiscould be used to further evaluate the trend ofdecreasing count rate past 24 000 m. Multipledetectors stacked on top of each other would allowfor multiple coincidence counters. Only ionizingparticles that activate all detectors would cause acount to be recorded. Doing this would ensure thatonly vertical radiation was subject to investigation.Launching balloons from different locations (and,therefore, different geomagnetic latitudes) wouldallow an evaluation of the cut-off on the incomingcharged particles, which is imposed by the planet’sgeomagnetic field. This would certainly be aninteresting topic for future research!
EquipmentPayload informationThe payload consisted of a Model A RaspberryPi, running a program that was wrapped in ashell script for crash protection. The program waswritten in C, and was compiled using GCC. TheRaspberry Pi was running a modified version ofRaspbian, with the Spidev kernel driver enabled.The code used for the flight can be found at [8].
The code is the property of Ben Bancroft, unlessotherwise stated.
Regarding reproducibility, a knowledge ofcomputer programming is required. It is beyondthe scope of this paper to provide detailed instruc-tions of Raspberry Pi coding; however, for furtherinformation, one can visit the UK High AltitudeSociety’s website1.
Acknowledgments/special thanksThis was a Royal Society partnership project.We thank The Royal Society2, Professor MikeKosch (Lancaster University), Mr Phil Furneaux(Lancaster University), The Ogden Trust3,Mr Chris Anders (William Howard School,Cumbria), Dr Steven Marple (Lancaster Uni-versity), Mr Steven Holt (Lancaster University),Professor Roger Jones (Lancaster University) andDr Alexandre Chilingarov (Lancaster University)for their individual inputs towards the project, allof which have been greatly appreciated.
Received 1 October 2013, revised 4 October 2013doi:10.1088/0031-9120/49/2/164
References[1] United Nations Scientific Committee on the
Effects of Atomic Radiation UNSCEAR 20102008 Report to the General Assembly p 4www.unscear.org/unscear/en/publications/2008 1.html
[2] SBM-20 Geiger-Muller tube—parameters andcharacteristics http://gstube.com/data/2398/
[3] Pfotzer G 1936 Dreifachkoinzidenzen derUltrastrahlung aus vertikaler Richtung in derStratosphare Z. Phys. 102 23–40
[4] DS18B20 Data Sheetwww.adafruit.com/datasheets/DS18B20.pdf
[5] BMP085 Data Sheetwww.adafruit.com/datasheets/BMP085 DataSheet Rev.1.0 01July2008.pdf
[6] GUVA-S12SD Data Sheet www.dfrobot.com/image/data/TOY0044/guva-s12sd.pdf
[7] MAX-6 u-blox 6 GPS Modules Data Sheet. www.picaxe.com/docs/GPS010 max6 datasheet.pdf
[8] www.github.com/zenithuk
1 http://ukhas.org.uk/2 www.royalsociety.org/education/partnership3 www.ogdentrust.com
170 P H Y S I C S E D U C A T I O N March 2014