Embed Size (px)
Citation preview
I N C O M E A N D B E N E F I T S P O L I C Y C E N T E R
R E S E A RC H R E PO R T
Student Transportation and
Educational Access How Students Get to School in Denver, Detroit, New Orleans, New York City,
and Washington, DC
Urban Institute Student Transportation Working Group
February 2017
A BO U T THE U RBA N IN S T ITU TE
The nonprofit Urban Institute is dedicated to elevating the debate on social and economic policy. For nearly five
decades, Urban scholars have conducted research and offered evidence-based solutions that improve lives and
strengthen communities across a rapidly urbanizing world. Their objective research helps expand opportunities for
all, reduce hardship among the most vulnerable, and strengthen the effectiveness of the public sector.
Copyright © February 2017. Urban Institute. Permission is granted for reproduction of this file, with attribution to
the Urban Institute. Cover image by Tim Meko.

Contents Contents iii
Acknowledgments iv
Executive Summary v
Understanding Student Transportation in Choice-Rich Cities 1
Why Student Transportation Policy Matters 1
Cost of Student Transportation 2
Implications for Children’s Health and Safety 5
Academic Performance and Access to High-Quality Schools 6
Understanding Five Choice-Rich Cities 8
Transportation Infrastructure and Policy 10
Transportation and Choice 13
Current Spending on Transportation 14
Innovations in Student Transportation 16
Better Understanding Student Transportation 17
Appendix. Student Transportation Policy by City 18
Notes 24
References 25
Statement of Independence 28

I V A C K N O W L E D G M E N T S
Acknowledgments This report was funded by the Walton Family Foundation. We are grateful to them and to all our
funders, who make it possible for Urban to advance its mission.
The views expressed are those of the author and should not be attributed to the Urban Institute, its
trustees, or its funders. Funders do not determine research findings or the insights and
recommendations of Urban experts. Further information on the Urban Institute’s funding principles is
available at www.urban.org/support.
The Urban Institute Student Transportation Working Group members are as follows:
Kristin Blagg, Urban Institute
Matthew M. Chingos, Urban Institute
Sean P. Corcoran, New York University
Joshua Cowen, Michigan State University
Patrick Denice, Washington University in St. Louis
Betheny Gross, Center on Reinventing Public Education
Jane Arnold Lincove, University of Maryland, Baltimore County
Carolyn Sattin-Bajaj, Seton Hall University
Amy Ellen Schwartz, Syracuse University
Jon Valant, The Brookings Institution

E X E C U T I V E S U M M A R Y V
Executive Summary Urban education systems around the country are implementing school choice policies
aimed at expanding low-income students’ access to high-quality schools. But for too
many students, the promise of choice is an empty one because they cannot physically
access the school via school- or parent-provided transportation. Thirty-three percent of
low-income parents in Denver, Colorado, and Washington, DC, indicated that they
would send their child farther from home to attend a better school if transportation
were provided (Teske, Fitzpatrick, and O’Brien 2009).
Despite the broad attention that school choice policies have garnered, issues of student
transportation within choice-rich cities have not received much attention from policymakers. The
student transportation policy decisions cities make can have a substantial impact on school district
funding, student health and safety, and student access to different schools (including schools of choice),
as well as after-school programs.
In this report, we review the limited available research on student transportation and profile five
choice-rich cities: Denver, Colorado; Detroit, Michigan; New Orleans, Louisiana; New York City; and
Washington, DC. These cities vary widely in the availability of publicly funded transportation for
students, especially for students who opt out of their neighborhood school. Type of school, student’s
age, and city infrastructure are among the factors that contribute to the available transportation
options in a given city.
We conclude by laying out a set of critical questions that must be answered if student
transportation is to be an enabler of, rather than a barrier to, equitable access to high-quality education
in urban areas. These include better understanding how students currently get to school and how those
patterns might be affected by policy choices, such as changes in transportation eligibility or
transportation modes available and other innovations designed to increase equity of access to high-
quality schools.


Understanding Student
Transportation in Choice-Rich Cities Issues of student transportation have long played a significant, and sometimes controversial, role in
facilitating US education policy. In the late 19th and early 20th centuries, student transportation
enabled the consolidation of rural school districts, moving students from one-room school houses to
larger, more professionalized schools (Killeen and Sipple 2000). In the 1970s, “busing” became
synonymous with court-ordered desegregation of schools in cities across the country. Changes in
student transportation may facilitate (or hinder) changes in schooling options, thereby changing the
quality and character of education that a student is able to receive.
In recent years, more cities have adopted policies that allow students to select schools outside of
their neighborhood catchment zone (Wohlstetter, Zeehandelaar, and Griffith 2015). The number of
students attending charter schools has also increased, demonstrating that more students may be opting
for other public schools beyond their traditional neighborhood school.1 Student transportation policy
can promote equitable access to schools across a given city, but it can also reduce access, limiting
options for families who do not have the funds or available time to transport their children to school.
Why Student Transportation Policy Matters
Student transportation comes at considerable public cost and can absorb a surprising amount of a
school district’s or city’s budget. These costs are covered by a mix of federal, state, and local funds and
thus reflect policy decisions at multiple levels. Student transportation may also affect a student’s health
and well-being. Issues of safety and health while traveling to school can have an impact on a student’s
attendance and her overall academic performance. Finally, student transportation can have a
substantial effect on the quality of a student’s education and the composition of her peer group.
Transportation options can enable students to attend higher-quality schools that might have been
previously inaccessible, and they can allow for participation in enriching before- and after-school
activities.

2 S T U D E N T T R A N S P O R T A T I O N A N D E D U C A T I O N A L A C C E S S
Cost of Student Transportation
School districts spent about $23 billion on student transportation in the 2012–13 school year, which
amounts to roughly 4 percent of all current expenditures for public education.2 About half of America’s
students take publicly funded transportation to school, at an average cost of $914 dollars per year per
transported student.3 The share of students who use district-provided transportation has slowly
declined from its peak of 61 percent in 1983, yet the inflation-adjusted per pupil cost of transportation
has generally increased over time (figure 1).
FIGURE 1
Share of Students Transported at Public Expense, Total Expenditures
From 1929–30 to 2012–13
Source: Digest of Education Statistics 2016, table 236.90.
Notes: The percentage of students transported at public expense is unavailable after the 2007–08 school year. Expenditures per
transported student are adjusted to 2014–15 school year dollars using the Consumer Price Index.
The cost of transporting students is paid out of federal, state, and local funds. Federal public transit
funds cannot be used exclusively for student transportation, but local transit agencies can use part of
their federal funding to expand service on an existing route for the benefit of students; and most states
provide districts with funding designated for student transportation (Merrill 1990; Vincent et al. 2014).
$0B
$5B
$10B
$15B
$20B
$25B
$30B
0%
10%
20%
30%
40%
50%
60%
70%
80%
90%
100%
1929 1936 1943 1950 1957 1964 1971 1978 1985 1992 1999 2006
Share of enrolled students transported at public expense
Total expenditures for student transportation
Fall school year

S T U D E N T T R A N S P O R T A T I O N A N D E D U C A T I O N A L A C C E S S 3
The amount of state assistance varies widely. For example, New Hampshire provides minimal aid (only
for career and technical education and alternative education), but South Carolina provides all funding
for students’ yellow bus transportation.
School districts also differ in how much they spend per pupil on transportation, though costs tend to
be correlated with the size and density of the district (McDonald et al. 2015). In the 2013–14 school
year, districts with fewer than 3,000 students spent an average of $129 per enrolled student, while
districts with more than 50,000 students spent an average of $53.4
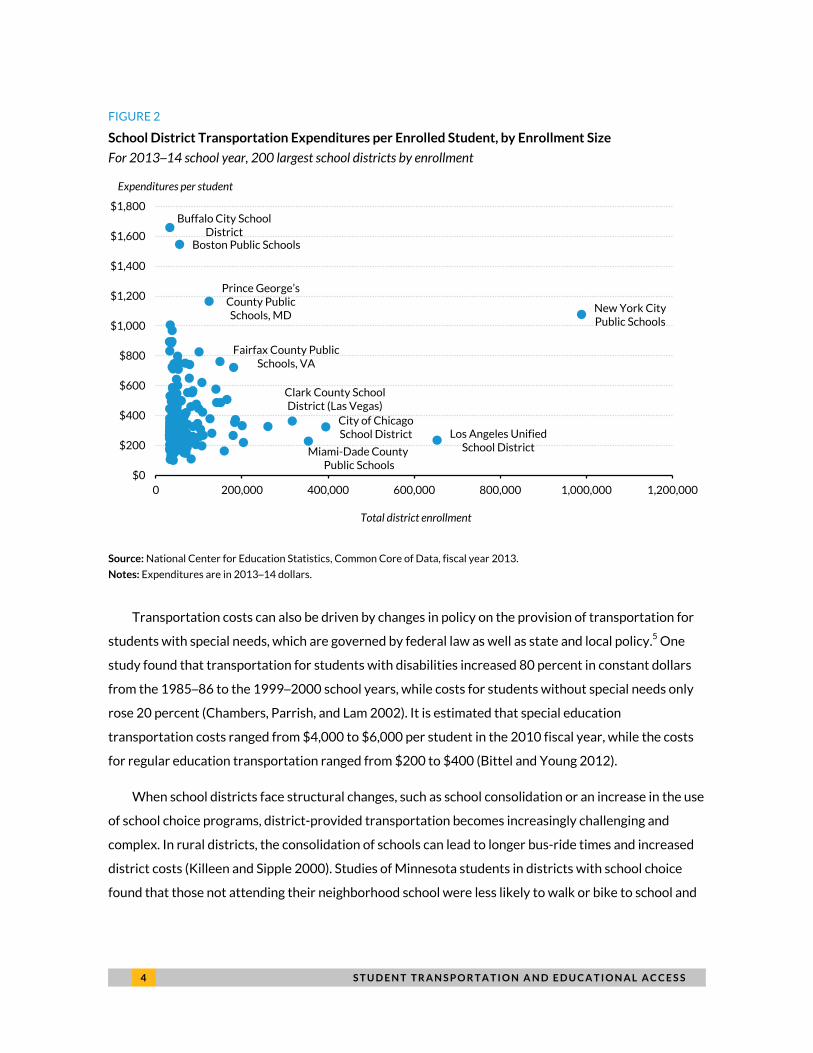
Among the two hundred largest school districts in the United States (by enrollment), there are
substantial differences in transportation spending relative to overall enrollment (figure 2). This
variation is likely driven by a number of factors, such as the size and density of the city, number of
students eligible for district-provided transportation (e.g., by age and proximity to school), state
requirements for student transportation, the availability and cost of public transportation
infrastructure, and the cost of living within the given district.
Changes in district-level transportation policies can have substantial effects on the budgets of both
school districts and local transit agencies. For example, from 2009 to 2012, Minneapolis Public Schools
implemented a pilot program, Student Pass, which allowed high school students to take unlimited rides
on regular-route buses and light rail during the school year. A study of this pilot estimated that it saved
the schools $1.55 million in continuing bus-service costs and reduced traffic congestion by saving an
estimated 2.2 million vehicle miles traveled by yellow buses and personal vehicles (Fan and Das 2015).
Yet, there are often trade-offs when such initiatives are put in place.
For example, a 2014 study of the costs and benefits of providing all Los Angeles County students
with free transit passes highlights the potential trade-off between the budgets of a school district and a
local transit agency. That study estimated that providing transit passes to students could decrease
transit fare revenue by $24 to $71 million, but that this decrease in transit revenue would be offset by
substantial savings in school district transportation costs, which totaled $273 million in the 2011–12
school year (Gase et al. 2014).
4 S T U D E N T T R A N S P O R T A T I O N A N D E D U C A T I O N A L A C C E S S
FIGURE 2
School District Transportation Expenditures per Enrolled Student, by Enrollment Size
For 2013–14 school year, 200 largest school districts by enrollment
Source: National Center for Education Statistics, Common Core of Data, fiscal year 2013.
Notes: Expenditures are in 2013–14 dollars.
Transportation costs can also be driven by changes in policy on the provision of transportation for
students with special needs, which are governed by federal law as well as state and local policy.5 One
study found that transportation for students with disabilities increased 80 percent in constant dollars
from the 1985–86 to the 1999–2000 school years, while costs for students without special needs only
rose 20 percent (Chambers, Parrish, and Lam 2002). It is estimated that special education
transportation costs ranged from $4,000 to $6,000 per student in the 2010 fiscal year, while the costs
for regular education transportation ranged from $200 to $400 (Bittel and Young 2012).
When school districts face structural changes, such as school consolidation or an increase in the use
of school choice programs, district-provided transportation becomes increasingly challenging and
complex. In rural districts, the consolidation of schools can lead to longer bus-ride times and increased
district costs (Killeen and Sipple 2000). Studies of Minnesota students in districts with school choice
found that those not attending their neighborhood school were less likely to walk or bike to school and
New York City Public Schools
Los Angeles Unified School District
City of Chicago School District
Miami-Dade County Public Schools
Clark County School District (Las Vegas)
Fairfax County Public Schools, VA
Prince George’s County Public Schools, MD
Boston Public Schools
Buffalo City School District
$0
$200
$400
$600
$800
$1,000
$1,200
$1,400
$1,600
$1,800
0 200,000 400,000 600,000 800,000 1,000,000 1,200,000
Total district enrollment
Expenditures per student

S T U D E N T T R A N S P O R T A T I O N A N D E D U C A T I O N A L A C C E S S 5
more likely to rely on bus service or automobile transportation in areas without school bus service,
which could lead to increased system costs (Wilson, Wilson, and Krizek 2007; Wilson et al. 2010).
School choice policies can have a substantial impact on a district’s bottom line, depending on
whether and how they provide publicly funded school transportation. Each state has its own policy on
whether charter school students must be provided bus service by the local public school district.6 For
example, Boston Public Schools spent $12 million providing bus services for charter students in the
2016 fiscal year, which amounts to 11 percent of the transportation budget to transport 14 percent of
all Boston resident students attending a public school (Boston Municipal Research Bureau 2016).
Implications for Children’s Health and Safety
The relationship of student transportation to students’ health and safety is a critical intersection for
researchers, students, and parents. Issues of health and safety often arise from the trade-off between
walking or biking to school (sometimes called active commuting), compared with using bus or private
automobile transportation. One study estimated that 41 percent of students walked or biked to school
in 1969, but just 13 percent did so in 2001 (McDonald 2007).
The federal Safe Routes to School Program, authorized in 2005, encourages walking and biking to
school, and there have been modest increases in the use of these transportation modes in recent years.
National survey data from the National Center for Safe Routes to School indicates that the percentage
of students who walked to school rose substantially between 2007 and 2012—from 12.4 percent to
15.7 percent before school and from 15.8 percent to 19.7 percent after school, with a greater increase
for students who attended low-income schools (National Center for Safe Routes to School 2013).
Students who are active commuters tend to accumulate slightly more moderate to vigorous
physical activity compared with students who are not active commuters; however, these active
commuters generally do not have a body-mass index that is statistically different from their nonactive
peers (Sirard and Slater 2008). There is evidence that exposure to diesel exhaust, produced by the
majority of school buses, is linked to an increase in the risk of lung cancer and asthma (Balmes 2011;
Weir 2002).
Despite this risk, school buses generally have a strong safety record—school buses account for 25
percent of trips for school-age children during normal school travel hours and just 2 percent of deaths
and 4 percent of injuries that occur from crashes during the same hours (Committee on School
Transportation Safety 2002). In addition, though any amount of bullying is concerning, middle and high
6 S T U D E N T T R A N S P O R T A T I O N A N D E D U C A T I O N A L A C C E S S
school students reported that bullying mostly occurs in the classroom (34 percent) or in hallways (46
percent) and less so on school buses (8 percent) (Zhang, Musu-Gillette, and Oudekerk 2016).
The relative risk of each mode of transportation is highly dependent on the context of the
community surrounding the school. For example, the physical characteristics of an urban area, such as
the real or perceived safety of the neighborhood or traffic, can affect a student’s travel mode to school
(McMillian 2005). Nationally, the percentage of students who report being afraid of attack or harm at
school or on the way to and from school decreased from 12 percent in 1995 to 3 percent in 2013
(Robers et al. 2015).
But students who are black or Hispanic, or who live in urban areas, tend to report higher rates of
fear than their white or suburban counterparts (Robers et al. 2015). A study of fifth-graders in low-
income Los Angeles neighborhoods found that 41 percent perceived walking to school as safe and 54
percent perceived it as unsafe (Banerjee, Uhm, and Bahl 2014). Students may perceive risk differently
than parents. For the surveyed students in Los Angeles, the decision on whether and where to walk was
centered more on the presence of social dangers, such as gang-related activities and the risk of
witnessing or being a victim of crime, than traffic-related dangers, whereas parents tended to perceive
traffic-related risks as the larger barrier to walking (Banerjee, Uhm, and Bahl 2014).
School choice policies could potentially affect health and safety through altering a student’s mode
of transportation to school, but direct evidence for this hypothesis is thin. A study of a mid-sized school
district in Eugene, Oregon, showed that students attending schools other than their default
neighborhood school were more likely to be driven to school and less likely to walk or bike to school
(Yang, Abbott, and Schlossberg 2012). A study of a 2010 Minneapolis policy that restricted school
choice to three regional zones found that, though average distance to school decreased, no significant
change was observed in the percentage of students walking or biking or in the number of automobiles
dropping off students at school (Sirard et al. 2015).
Academic Performance and Access to High-Quality Schools
Student transportation can have either positive or negative impacts on students’ academic
performance and access to high-quality schools. The logistics of travel to and from school influence a
student’s ability to get to school on time, her number of absences, and her availability to participate in
before- or after-school activities (Blackmon and Cain 2015; Canfield et al. 2016; Grossman, Walker, and
Raley 2001; Teasley 2004). Factors such as inclement weather, traffic, irregular public transit
S T U D E N T T R A N S P O R T A T I O N A N D E D U C A T I O N A L A C C E S S 7
schedules, out-of-pocket costs, or a change in a student’s home location all interact with transportation
choices to affect where students go to school and the amount of time they spend there.
Though school transportation can introduce logistical challenges, publicly provided student
transportation could enable access to a wider variety of high-quality schools. Transportation can give
students access to specialized programs or schools (e.g., bilingual programs and magnet schools) and
can allow families to cast a wider net for schools outside their neighborhood school, including schools
that enroll a more diverse student body. For students with disabilities, transportation allows access to
programs that best support their needs.
Transportation policies can have indirect effects on students through the limitations they often
place on school start times. A later school start time, especially for older students, has been shown to
have a substantial positive impact on academic achievement (Carrell, Maghakian, and West 2011;
Wolfson et al. 2007). However, a change in school start times is typically accompanied by a change in
student transportation schedules and policies, which can come with significant costs. When districts
vary start times to allow for reuse of buses, high schoolers are typically assigned the earliest start time.
Inverting a district’s bus schedule to give older students a later start time is one relatively low-cost
solution (Wahistrom 2002). But other types of transportation changes, particularly in bus schedules,
may be accompanied by an increase in costs (Edwards 2012; Jacob and Rockoff 2011).
There is some evidence that the competitive effects of spatial proximity to multiple schools could
generate increases in academic performance across all schools (Egalite 2013; Millimet and Collier
2008). A study of Florida’s tax credit scholarship program found that public schools that were exposed
to competitive pressure from nearby private schools because of the introduction of the scholarship
produced higher test scores compared with schools that did not have nearby private schools (Figlio and
Hart 2014). It is conceivable that lowering transportation barriers to allow access to more distant
schools would produce a similar competitive effect, but this effect has not been directly studied.
The availability of information on academic quality can interact with school proximity—spatial or
temporal—to influence access to and enrollment in high-quality schools. When parents in the
Charlotte-Mecklenburg Public School District were provided with information on school-level test
scores, proximity to a high-scoring school was a key predictor for choosing an alternative school
(Hastings and Weinstein 2008). A study of school lottery choices in Washington, DC, estimated that a
typical middle school parent would be willing to travel an additional 1.2 miles for a 10-point increase in
the rate of “proficient” test scores (Glazerman and Dotter 2016).
8 S T U D E N T T R A N S P O R T A T I O N A N D E D U C A T I O N A L A C C E S S
In surveys, parents indicate that they factor student transportation into their decisions on where to
send their children to school. A survey of parents in eight cities found that the percentage of parents
who reported finding transportation to and from school as a problem ranged from 19 to 32 percent,
depending on the city. In many of the surveyed cities, parents with less formal education (high school
diploma or less) were more likely to report difficulty with transportation than parents with more formal
education (bachelor’s degree or higher) (Jochim et al. 2014).
Issues of race, ethnicity, and class also interact with trade-offs between school quality and
transportation. An analysis of students entering high school in Chicago showed that students from
affluent neighborhoods were more likely to attend school close to home, but students from low-income
neighborhoods were more likely to travel farther and were 35 percent more likely to be the only
student from their neighborhood at a given school (Burdick-Will 2015). In Denver, black families were
more likely to apply to a distant, high-quality school than Hispanic or white families (Denice and Gross
2016).
Understanding Five Choice-Rich Cities
To further explore how issues of student transportation affect school districts, we chose five choice-
rich cities as case studies: Denver, Colorado; Detroit, Michigan; New Orleans, Louisiana; New York City;
and Washington, DC. Each of these five cities have evolved different approaches toward delivering
student transportation. We profile each of these cities, outlining similarities and differences in their
current policies and highlighting innovative initiatives currently under way to improve student
transportation.
These cities share a robust set of school choice options, but they vary substantially in their
population density, public transportation infrastructure, and demographics (table 1). In addition, each
city operates within its own policy context, under different state requirements for student
transportation and different policies for the regulation and management of schools of choice (the
appendix provides detailed policy information for each city).

S T U D E N T T R A N S P O R T A T I O N A N D E D U C A T I O N A L A C C E S S 9
TABLE 1
Descriptive Data on Five Choice-Rich School Districts
Denver, CO Detroit, MI New Orleans,
LA New York, NY Washington,
DC
Geographic sizea
(square miles) 153 139 169 303 61
Total populationb 682,545 677,257 389,617 8,550,405 672,228
Population density (people per square mile) 4,461 4,872 2,305 28,219 11,020
Demographicsb White 54% 10% 31% 32% 36%
Black 9% 79% 58% 22% 47%
Hispanic/Latino 31% 8% 6% 29% 11%
Asian 3% 1% 3% 14% 4%
Other/two or more 3% 2% 2% 3% 3%
Ages 5 to19 16% 21% 17% 17% 14%
Median HH incomec $ 53,637 $ 25,757 $ 36,792 $ 53,373 $ 70,848
Below $15,000/yearc
14% 32% 24% 17% 14%
Living in same residence last yearc 78% 84% 83% 89% 80%
Enrollment by typed Public 75% 57% 5% 78% 48%
Charter 14% 40% 68% 7% 36%
Private 11% 3% 26% 15% 16%
Commute to workc Drive alone/carpool 79% 82% 79% 27% 39%
Public transit 7% 9% 8% 57% 38%
Walked 5% 4% 5% 10% 13%
Other/work at home 10% 5% 8% 7% 10%
Average time (minutes) 25 27 23 40 30
Source: Sources are detailed in the lettered notes.
Notes: Demographics are by city school district boundaries (Denver County School District 1, Detroit City School District,
Orleans Parish School District, New York City Department of Education, and District of Columbia Public Schools). HH =
households. a 2015–16 school district boundaries.
b 2015 American Community Survey (ACS) one-year estimates.
c 2011–15 ACS five-year estimates.
d National Center for Education Statistics 2011–12 Private School Universe Survey, 2014–15 Common Core of Data.
1 0 S T U D E N T T R A N S P O R T A T I O N A N D E D U C A T I O N A L A C C E S S
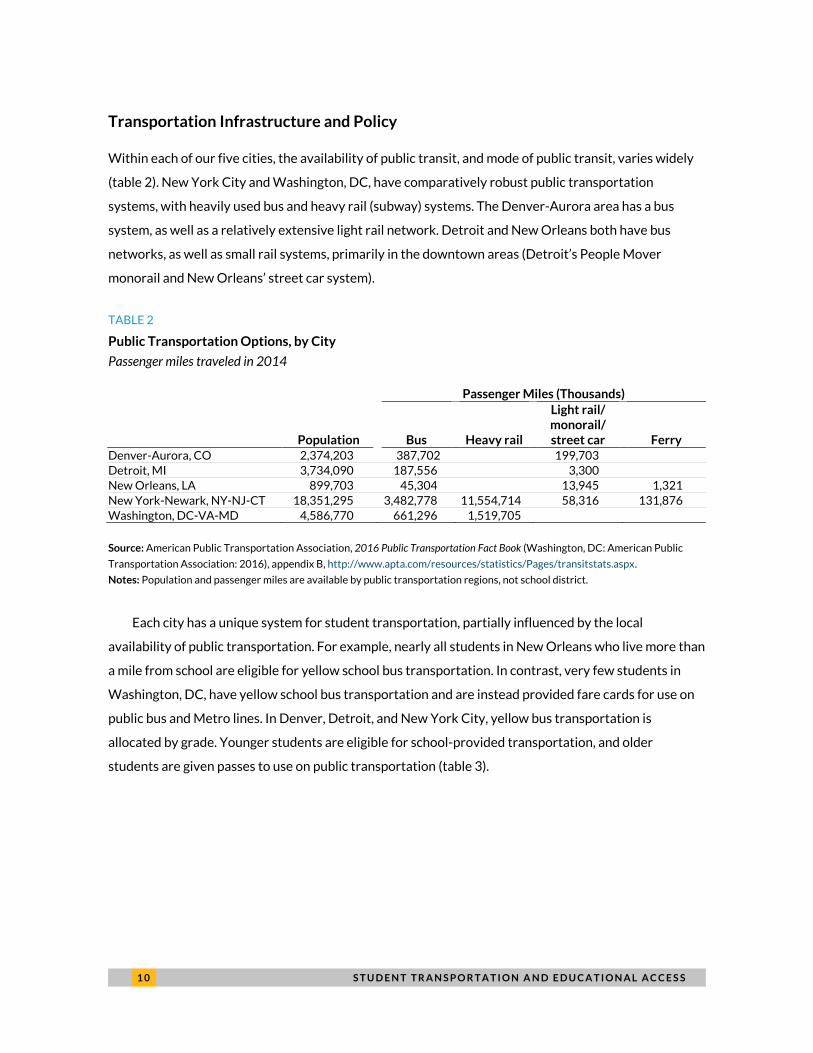
Transportation Infrastructure and Policy
Within each of our five cities, the availability of public transit, and mode of public transit, varies widely
(table 2). New York City and Washington, DC, have comparatively robust public transportation
systems, with heavily used bus and heavy rail (subway) systems. The Denver-Aurora area has a bus
system, as well as a relatively extensive light rail network. Detroit and New Orleans both have bus
networks, as well as small rail systems, primarily in the downtown areas (Detroit’s People Mover
monorail and New Orleans’ street car system).
TABLE 2
Public Transportation Options, by City
Passenger miles traveled in 2014
Passenger Miles (Thousands)
Population Bus Heavy rail
Light rail/ monorail/ street car Ferry
Denver-Aurora, CO 2,374,203 387,702 199,703
Detroit, MI 3,734,090 187,556 3,300
New Orleans, LA 899,703 45,304 13,945 1,321
New York-Newark, NY-NJ-CT 18,351,295 3,482,778 11,554,714 58,316 131,876
Washington, DC-VA-MD 4,586,770 661,296 1,519,705
Source: American Public Transportation Association, 2016 Public Transportation Fact Book (Washington, DC: American Public
Transportation Association: 2016), appendix B, http://www.apta.com/resources/statistics/Pages/transitstats.aspx.
Notes: Population and passenger miles are available by public transportation regions, not school district.
Each city has a unique system for student transportation, partially influenced by the local
availability of public transportation. For example, nearly all students in New Orleans who live more than
a mile from school are eligible for yellow school bus transportation. In contrast, very few students in
Washington, DC, have yellow school bus transportation and are instead provided fare cards for use on
public bus and Metro lines. In Denver, Detroit, and New York City, yellow bus transportation is
allocated by grade. Younger students are eligible for school-provided transportation, and older
students are given passes to use on public transportation (table 3).

S T U D E N T T R A N S P O R T A T I O N A N D E D U C A T I O N A L A C C E S S 1 1
TABLE 3
Available Transportation for Eligible Students
City Mode Student access
Denver, CO Yellow bus
Grades K–8 and students with special needs
Grades 9–12 in a Success Express neighborhood
Public transit Grades 9–12 outside a Success Express neighborhood
Detroit, MI Yellow bus
Grades K–8 and students with special needs
Grades 9–12 who attend an EAA school
Public transit Grades 9–12 who attend a DPS school
New Orleans, LA Yellow bus Grades K–12 enrolled in OPSB or Type 5 RSD charter schools
Public transit N/A
New York, NY
Yellow bus Grades K–6 and students with special needs
Public transit Grades K–6 not served by yellow bus route
Grades 7–12
Washington, DC Yellow bus Students with special needs
Public transit Grades K–12
Source: Urban Institute analysis of district transportation policies.
Notes: This is a broad summary of student transportation policy in these cities. See the appendix for full policy descriptions. For
Denver, yellow bus includes both standard routes and Success Express routes. The Education Achievement Authority is
Michigan’s state-run school district. A Type 5 charter school is a school chartered through the Recovery School District,
Louisiana’s state-run school district. DPS = Detroit Public Schools; EAA = Education Achievement Authority; OPSB = Orleans
Parish School Board; RSD = Recovery School District.
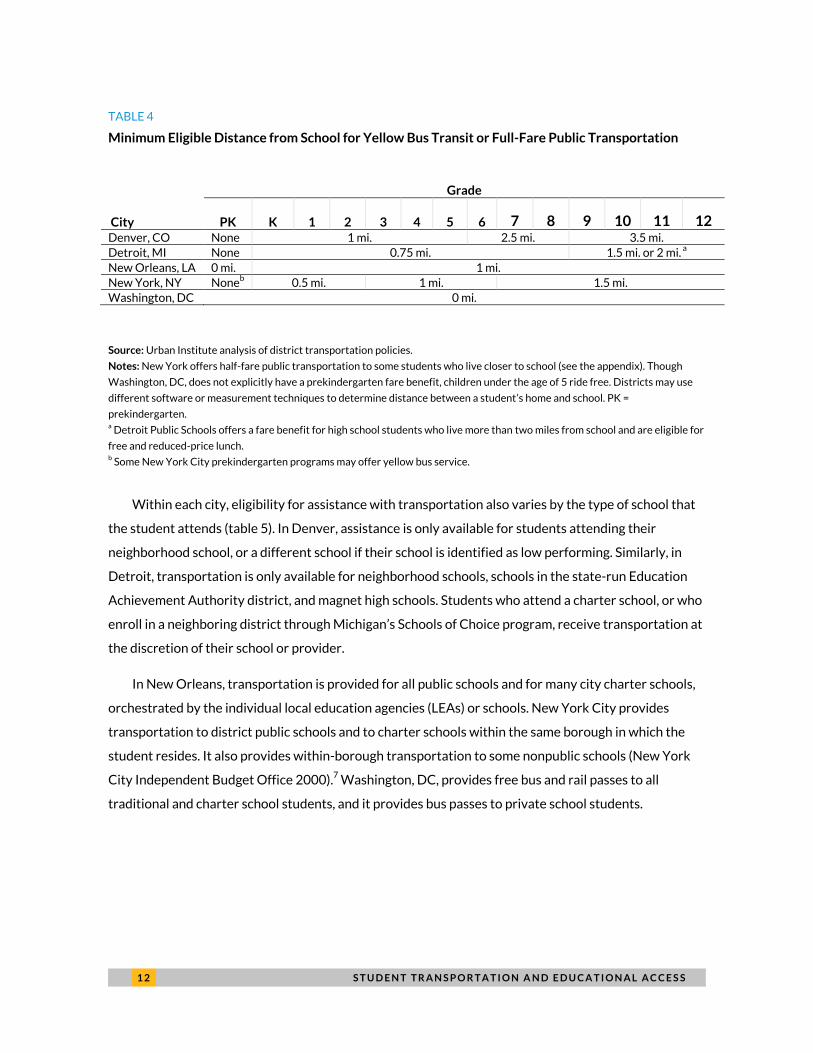
Among cities that stagger eligibility for transportation by age, there is substantial variation in how
far students need to live from their school to be eligible for transportation services (table 4). Denver
Public Schools provide transportation only for students who live a considerable distance from their
neighborhood school. For example, students in Denver middle schools are eligible for yellow bus
transportation if they live more than 2.5 miles (walking distance) from their school, a distance that is
farther than high schoolers are required to live to access a transit benefit in the four other cities. In
contrast, there is no distance limit for Washington, DC, students to access the Kids Ride Free
transportation benefit.
1 2 S T U D E N T T R A N S P O R T A T I O N A N D E D U C A T I O N A L A C C E S S
TABLE 4
Minimum Eligible Distance from School for Yellow Bus Transit or Full-Fare Public Transportation
Grade
City PK K 1 2 3 4 5 6 7 8 9 10 11 12 Denver, CO None 1 mi. 2.5 mi. 3.5 mi.
Detroit, MI None 0.75 mi. 1.5 mi. or 2 mi. a
New Orleans, LA 0 mi. 1 mi.
New York, NY Noneb 0.5 mi. 1 mi. 1.5 mi.
Washington, DC 0 mi.
Source: Urban Institute analysis of district transportation policies.
Notes: New York offers half-fare public transportation to some students who live closer to school (see the appendix). Though
Washington, DC, does not explicitly have a prekindergarten fare benefit, children under the age of 5 ride free. Districts may use
different software or measurement techniques to determine distance between a student’s home and school. PK =
prekindergarten. a Detroit Public Schools offers a fare benefit for high school students who live more than two miles from school and are eligible for
free and reduced-price lunch.
b Some New York City prekindergarten programs may offer yellow bus service.
Within each city, eligibility for assistance with transportation also varies by the type of school that
the student attends (table 5). In Denver, assistance is only available for students attending their
neighborhood school, or a different school if their school is identified as low performing. Similarly, in
Detroit, transportation is only available for neighborhood schools, schools in the state-run Education
Achievement Authority district, and magnet high schools. Students who attend a charter school, or who
enroll in a neighboring district through Michigan’s Schools of Choice program, receive transportation at
the discretion of their school or provider.
In New Orleans, transportation is provided for all public schools and for many city charter schools,
orchestrated by the individual local education agencies (LEAs) or schools. New York City provides
transportation to district public schools and to charter schools within the same borough in which the
student resides. It also provides within-borough transportation to some nonpublic schools (New York
City Independent Budget Office 2000).7 Washington, DC, provides free bus and rail passes to all
traditional and charter school students, and it provides bus passes to private school students.

S T U D E N T T R A N S P O R T A T I O N A N D E D U C A T I O N A L A C C E S S 1 3
TABLE 5
Likelihood of Public Student Transportation Assistance by School Attended
Traditional neighborhood
school
Traditional nonneighborhood
school Charter school Private school
Other districts
Denver, CO All Few Some None None
Detroit, MI All Few Some None Some
New Orleans, LA All All Most None None
New York, NY All Some Most Some None
Washington, DC All All All Most None
Source: Urban Institute analysis of district transportation policy.
Notes: Transportation for charter schools in Denver and Detroit is provided at discretion of the school. Transportation for other
district schools neighboring Detroit is provided at the discretion of the district. This table excludes assistance for students with
special needs.
Transportation and Choice
We have shown that families in these choice-rich cities who opt out of their neighborhood school also
opt into a more complex set of transportation options, which they may have difficulty navigating.
Surveys of parents in these cities show that distance to school and availability of transportation are
substantial factors in choosing a school.
The Center on Reinventing Public Education recently conducted a survey of parents in eight cities,
including Denver, Detroit, New Orleans, and Washington, DC. Nineteen percent of parents in New
Orleans and 21 percent of parents in Washington, DC, identified school transportation for their
children as a barrier to choosing a school. In Denver and Detroit, where student transportation to
nonneighborhood or charter schools is less likely, 29 percent of parents identify transportation as a
problem (Jochim et al. 2014).
Each of these cities has a guide for locating a student’s neighborhood school and available schools
of choice (table 6). In Denver, New Orleans, and New York City, the city’s public school districts (Denver
Public Schools, Orleans Parish School Board and Recovery School District, and New York Department
of Education) provide information on both public and charter schools in the city. In Detroit, the
comprehensive list of options is managed by a nonprofit provider. Washington, DC’s school finder is
overseen by the Office of the Deputy Mayor for Education.
Availability of transportation information in these guides varies widely. Some sites prioritize a map
view, showing how far each school is from a student’s home, and other sites also offer the option to sort

1 4 S T U D E N T T R A N S P O R T A T I O N A N D E D U C A T I O N A L A C C E S S
by distance. The New York and Washington, DC, guides offer clear information listing nearby public bus
and subway routes. In addition, the New York Department of Education’s School Search provides some
information on available yellow bus routes for a given school.
TABLE 6
Comprehensive School Choice Guide Transportation Information
Denver, CO Detroit, MI New Orleans,
LA New York, NY Washington,
DC
Provider SchoolChoice Excellent
Schools Detroit EnrollNOLA School Search My School DC School Finder
Format Website Website Website Website/print Website
Sort choices by distance Yes
Yes Yes
Map of school location Yes Yes Yes Yes Yes
Google directions Yes Yes Yes Yes Yes
Indicator of transportation Yes Yes Yes Yes Yes
Public transit information
When available
Yes Yes
Public transit route information
Yes Yes
Yellow bus information Yes When available
Yes
Yellow bus route information
Yes
Source: Urban Institute analysis of school choice resources as of October 2016.
Current Spending on Transportation
With each distinct approach to transportation, LEA-generated student transportation costs in each city
vary widely. Figure 3 shows the total transportation costs, as reported by public and charter school
LEAs, per total enrolled students in each of the five cities. Spending, in 2013 inflation-adjusted dollars,
has stayed relatively steady in Denver and Detroit, but spending in the other cities has generally risen
over time. Spending on transportation per student increased substantially in New Orleans after
Hurricane Katrina, where school choice increased the distance that students travel to school (Cowen
Institute for Public Education Initiatives 2013).
In Washington, DC, where the majority of transportation spending is for students enrolled in
special education programs, costs per student have risen over time, which may in part be driven by

S T U D E N T T R A N S P O R T A T I O N A N D E D U C A T I O N A L A C C E S S 1 5
compliance with the requirements of Petties v. District of Columbia, which placed DC’s special education
bus service under federal court supervision for much of 2002 to 2013 (Parrish et al. 2007).8 In New
York City, some have attributed rising costs to rising contract costs as well as an increase in students
opting for choice schools.9
FIGURE 3
School District Transportation Expenditures per Enrolled Student
From the 2002–03 to 2012–13 school years
Source: National Center for Education Statistics, Common Core of Data.
Notes: Expenditures per pupil are calculated for all local education agency, public and charter, within each city. Expenditures for
Highland Park School District and Hamtramck Public Schools are included in the Detroit calculation. Expenditures per pupil are
also calculated as the total reported current expenditures on student transportation divided by total fall enrollment.
Transportation spending for Washington, DC, in fiscal years 2009 and 2010 is imputed with supplementing budget documents
from the DC State Advisory Panel on Special Education.
Of course, LEA spending on student transportation is just part of the story on student
transportation spending. When students are provided subsidized fares on public transportation, costs
are often shared between state and local governments as well as the transportation agency.10 These
costs are often not included in LEA reports of student transportation expenditures.
$0
$200
$400
$600
$800
$1,000
$1,200
$1,400
$1,600
2003 2004 2005 2006 2007 2008 2009 2010 2011 2012 2013
Fiscal year
Expenditures per student, in 2013 dollars
Washington, DC
New York, NY
New Orleans, LA
Detroit, MI
Denver, CO

1 6 S T U D E N T T R A N S P O R T A T I O N A N D E D U C A T I O N A L A C C E S S
Innovations in Student Transportation
In each of these cities, new initiatives and pilot projects have taken root to help increase students’
access to schools. These initiatives focus on increasing safety for active commuters to school,
facilitating participation in after-school activities, and developing better data to understand student
transportation patterns.
In each of these cities, a substantial number of students may still walk or bike to school. Denver,
New York City, and Washington, DC, participate in the Vision Zero Network, a group of cities that have
committed to making changes to reduce traffic deaths and injuries (New Orleans is considering joining).
These include lowering speed limits, redesigning streets, and creating behavior change through
communications campaigns.11
All five cities participate in the Safe Routes to School programs, which promotes safe walking and
biking to and from schools. This program promotes safety through such initiatives as increased signage,
removal of barriers to walking and bicycling, safety communication and training, and projects such as
“walking school buses.” In addition, Denver and Washington, DC, have been focus cities within the
Green Lane Project, which supports cities in becoming national leaders in the installation of protected
bike lanes.12 District of Columbia Public Schools has also undertaken an initiative to ensure that all
second graders in their schools learn to ride a bike.
Denver Public Schools introduced a bus shuttle service, the “Success Express,” to promote
attendance and allow for participation in before- and after-school activities in the more isolated Far
Northeast and Near Northeast sections of the city. The buses, which are staffed by both a driver and a
paraprofessional, circulate through neighborhoods from 6:30 to 9:30 a.m. and from 2:30 to 6:30 p.m.,
giving students three opportunities before and after school to take the bus. These pilots have prompted
the development of other zoned bus routes throughout the district in the 2015–16 school year. This
initiative, along with other reform initiatives, has been associated with improvements in attendance and
decreased truancy (Ely and Teske 2014).
In 2013, the Skillman Foundation funded a pilot program called the Detroit Youth Transit Alliance,
which provided rides to and from school and after-school programs for students in southwest Detroit.
Funding for the project continues through the Ride for Ride program run by the alliance’s provider, the
Detroit Bus Company.13
In some cities, new technology streamlines access to transit and provides insight into how and when
students are using transportation services. Denver gives students an RFID card known as a +Pass,

S T U D E N T T R A N S P O R T A T I O N A N D E D U C A T I O N A L A C C E S S 1 7
which they use to tap into and out of yellow school buses. The +Pass system allows Denver Public
School officials and parents to keep track of students and provides valuable long-term information on
when students use the bus and the length of time it takes them to travel to school.14 In Washington, DC,
students’ bus and Metro fares are paid through their DC One Card, which also allows access to
Department of Parks and Recreation programs and functions as a library card. Washington, DC,
recently expanded the hours of the program, allowing free transit to school or school-related activities
all day, including weekends.15
Better Understanding Student Transportation
Transportation matters for students everywhere, but it is especially important in choice-rich cities that
are working to break the link between where students live and where they go to school. Our five case
studies make clear that each city has evolved its own policies and systems for allowing students to
access nonneighborhood schools. But researchers, policymakers, and practitioners still know far too
little about how these systems function in practice.
Specific areas for future inquiry in these and other choice-rich cities include the following:
Understanding current use: How far do students travel to go to school, how do they get there, and
how long does it take them? What are trade-offs of different transportation modes (walking or
biking, public transit, or private automobile), and how many students use transportation
provided directly by their school district?
Understanding potential use: How do current student transportation infrastructures affect
access to high-quality schools? What implications do transportation infrastructure and policy
have for equity of access to high-quality schools?
Simulating effects of policy changes: How can pilot projects and initiatives in student
transportation make access to high-quality schools more equitable? For example, what are the
potential benefits and costs to students of specific changes to a city’s public transit system or
yellow bus transportation services? How can other decisions, such as school siting policies or
the location of affordable housing, work in tandem with student transportation initiatives?
Obtaining answers to these challenging questions is a necessary first step toward ensuring that
transportation is an effective tool for educational equity rather than a barrier that dulls the impact of
reform.
1 8 A P P E N D I X
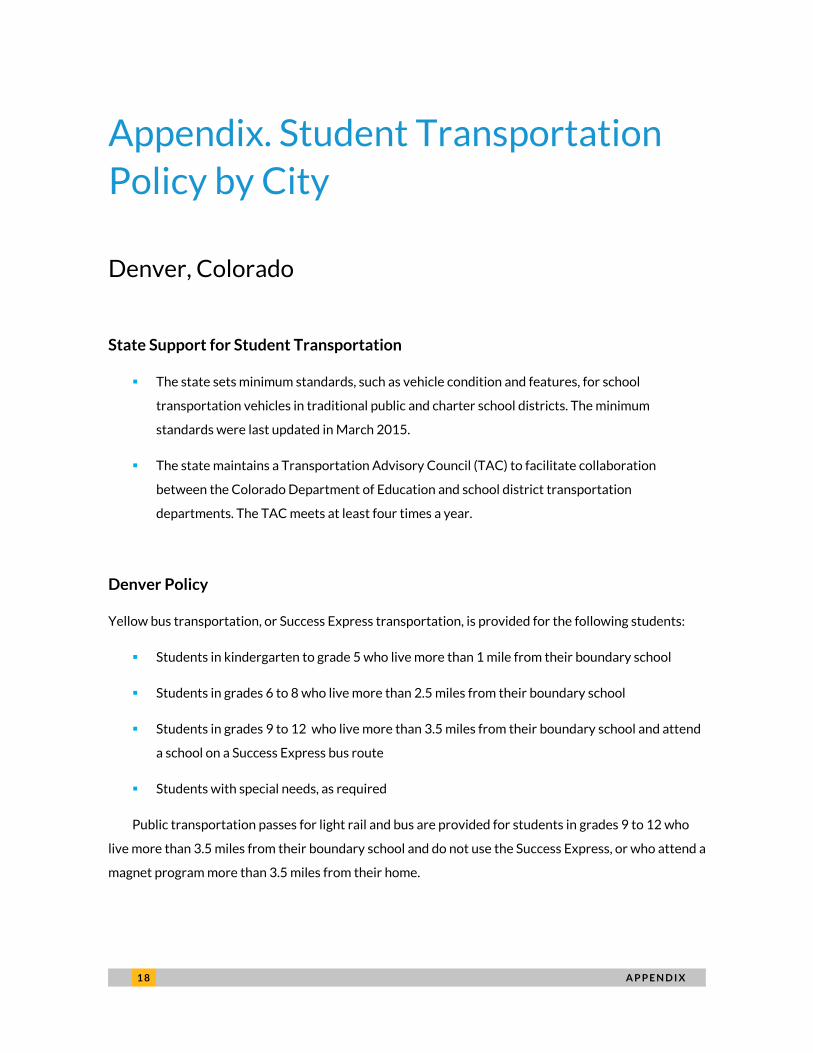
Appendix. Student Transportation
Policy by City
Denver, Colorado
State Support for Student Transportation
The state sets minimum standards, such as vehicle condition and features, for school
transportation vehicles in traditional public and charter school districts. The minimum
standards were last updated in March 2015.
The state maintains a Transportation Advisory Council (TAC) to facilitate collaboration
between the Colorado Department of Education and school district transportation
departments. The TAC meets at least four times a year.
Denver Policy
Yellow bus transportation, or Success Express transportation, is provided for the following students:
Students in kindergarten to grade 5 who live more than 1 mile from their boundary school
Students in grades 6 to 8 who live more than 2.5 miles from their boundary school
Students in grades 9 to 12 who live more than 3.5 miles from their boundary school and attend
a school on a Success Express bus route
Students with special needs, as required
Public transportation passes for light rail and bus are provided for students in grades 9 to 12 who
live more than 3.5 miles from their boundary school and do not use the Success Express, or who attend a
magnet program more than 3.5 miles from their home.

A P P E N D I X 1 9
Students who use school choice to enroll in a nonneighborhood school are not eligible for bus
services, unless their boundary school is identified as a Priority Improvement or Turnaround school or
the parent has secured a transportation exception.
Detroit, Michigan
State Support for Student Transportation
The state sets minimum standards, such as vehicle condition and features, for school
transportation vehicles, through the Pupil Transportation Act of 1990, which was last amended
in 2006.
The state allocates about $1.7 million in reimbursement funds for the inspection of student
transportation and $3.3 million for bus driver safety instruction, under the current
amendments to the State School Aid Act of 1979. The state also reimburses districts for 70.4
percent of the total approved costs of special education transportation, as required by the set
of court cases known as Durant v. State of Michigan.
The state maintains a Pupil Transportation Advisory Committee (PTAC) to facilitate
collaboration between the Michigan Department of Education and transportation
stakeholders. The PTAC meets three times a year.
Detroit Policy
Yellow bus transportation is provided for the following students:
Students in kindergarten to grade 8 who live more than 0.75 of a mile from their Detroit Public
Schools (DPS) neighborhood school or their Education Achievement Authority school, which
are part of Michigan’s state-run school district
Students in grades 9 to 12 who live more than 1.5 miles from their Education Achievement
Authority school; students in grades 9 to 12 who attend a DPS neighborhood school may have
access to a shuttle from other DPS campuses

2 0 A P P E N D I X
Students with special needs, as required
Public transportation passes for bus use are provided for students in grades 9 to 12 who live more
than 2 miles from their DPS neighborhood school and meet low-income guidelines for free and reduced-
price school lunch eligibility.
Students who use school choice to enroll in a nonneighborhood school are not eligible for bus
services. Students who enroll in charter schools in Detroit may have access to yellow bus service. Some
neighboring districts who educate Detroit students through the Schools of Choice program provide
yellow bus transportation.
New Orleans, Louisiana
State Support for Student Transportation
The state, through the Louisiana Department of Education, provides training and technical
assistance to the transportation supervisors of local school districts as well as to private
contractors who serve public schools. Through Bulletin 119, revised in February 2016,
Louisiana sets equipment standards for school buses and training standards for drivers.
The state provides funds for student transportation to LEAs through the Minimum Foundation
Program formula to support the minimum cost of education. Districts can apply for High Cost
Services grants, which may fund individual student transportation, when the cost of educating
the student with an individualized education program exceeds three times the average per
student expenditure.
The Louisiana Board of Elementary and Secondary Education requires Type 5 charter schools
(those that were previously public schools, now under the jurisdiction of the Recovery School
District) to provide transportation to students living within its attendance zone if the student
lives more than a mile from school. Currently, 88.5 percent of state-authorized, nonvirtual
charter schools provide student transportation (State Board of Elementary and Secondary
Education, n.d.).

A P P E N D I X 2 1
New Orleans Policy
Yellow bus transportation is provided for the following students:
All Orleans Parish School Board (OPSB) public school students in prekindergarten from the
nearest safe corner of their home
OPSB public school students in kindergarten to grade 2 who live more than 1 mile from school
(required to have a responsible adult present at the nearest safe corner)
OPSB public school students in grades 3 to 12 who live more than 1 mile from school are
eligible to be picked up at a stop no more than 1 mile from their house
Students with special needs, as required
Students enrolled at Type 5 (Recovery School District) charter schools who live more than a
mile from school
Students who enroll in non–Type 5 charter schools may have access to yellow bus service or to city
bus passes.
New York City, New York
State Support for Student Transportation
Under Section 3635 of New York’s Education Law, city school districts and the city portion of
enlarged city school districts are not required to provide transportation except for suitable
transportation for children with handicapping conditions.
The state has oversight responsibility for school district provision of student transportation
services, processes contracts and extensions for private service contracts, and provides
training programs for school bus drivers. In 2008–09, the state provided $1.5 billion of the $2.8
billion spent on student transportation (Transportation Working Group 2012).
The state maintains a School Bus Driver Instructor Advisory Committee, which meets three
times a year.
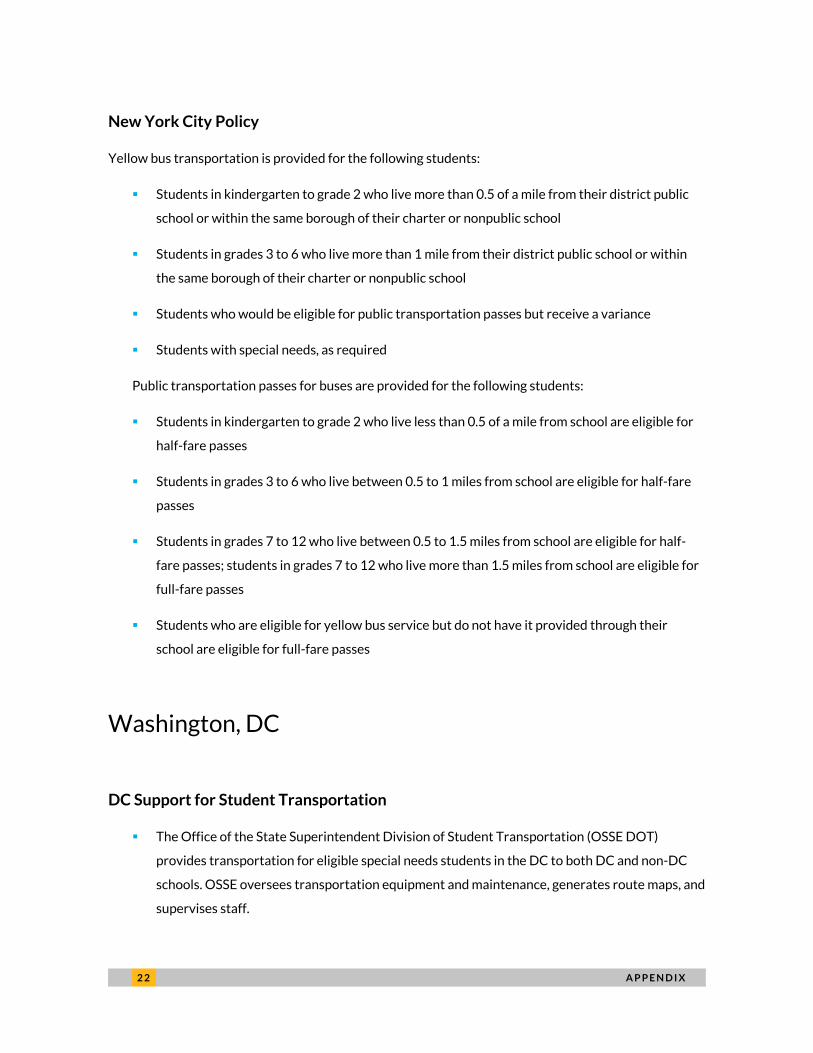
2 2 A P P E N D I X
New York City Policy
Yellow bus transportation is provided for the following students:
Students in kindergarten to grade 2 who live more than 0.5 of a mile from their district public
school or within the same borough of their charter or nonpublic school
Students in grades 3 to 6 who live more than 1 mile from their district public school or within
the same borough of their charter or nonpublic school
Students who would be eligible for public transportation passes but receive a variance
Students with special needs, as required
Public transportation passes for buses are provided for the following students:
Students in kindergarten to grade 2 who live less than 0.5 of a mile from school are eligible for
half-fare passes
Students in grades 3 to 6 who live between 0.5 to 1 miles from school are eligible for half-fare
passes
Students in grades 7 to 12 who live between 0.5 to 1.5 miles from school are eligible for half-
fare passes; students in grades 7 to 12 who live more than 1.5 miles from school are eligible for
full-fare passes
Students who are eligible for yellow bus service but do not have it provided through their
school are eligible for full-fare passes
Washington, DC
DC Support for Student Transportation
The Office of the State Superintendent Division of Student Transportation (OSSE DOT)
provides transportation for eligible special needs students in the DC to both DC and non-DC
schools. OSSE oversees transportation equipment and maintenance, generates route maps, and
supervises staff.

A P P E N D I X 2 3
OSSE requires that LEAs and schools that participate in student transportation submit a
biannual Certification for Student Transportation.
Students are eligible for free bus and rail passes (Kids Ride Free) through a collaboration
between the DC government and the Washington Metropolitan Area Transit Authority.
Washington, DC, Policy
Yellow bus transportation is provided for students with special needs, as required.
Public transportation passes are provided for the following students:
All students, ages 5 through 21, who are enrolled at a District of Columbia Public School or a
DC charter school are eligible for a free $100 monthly bus and rail pass.
All students enrolled in private and parochial schools are eligible for a free $100 monthly bus
pass.
Some charter schools opt to provide yellow bus service for students.

2 4 N O T E S
Notes 1. Simone Zhang and Megan Gallagher, “What Charter School Growth Means for Cities and Neighborhoods,”
Urban Wire (blog), Urban Institute, April 15, 2016, http://www.urban.org/urban-wire/what-charter-school-
growth-means-cities-and-neighborhoods.
2. Digest of Education Statistics 2016, tables 236.90 and 236.55.
3. Digest of Education Statistics 2016, table 236.90.
4. US Census Bureau, Public Elementary–Secondary Education Finance Data 2014, table 14.
5. “Questions and Answers on Serving Children with Disabilities Eligible for Transportation,” US Department of
Education, last modified November 2009,
http://www.ctaa.org/webmodules/webarticles/articlefiles/QandA_ChildrenWithDisabilities_Transportation.p
df.
6. “Charter Schools: Does the state specify who must provide transportation to charter school students?”
Education Commission of the States, last modified January 2016,
http://ecs.force.com/mbdata/mbquestNB2?rep=CS1524.
7. “Transportation,” Catholic Schools in the Archdiocese of New York, accessed February 2, 2017,
http://buildboldfutures.org/advocacy-student-services/transportation/.
8. Bill Turque, “Special Ed Bus Service Stays Under Court Supervision,” Washington Post, November 17, 2011,
https://www.washingtonpost.com/blogs/dc-schools-insider/post/special-ed-bus-service-stays-under-court-
supervision/2011/11/17/gIQApVtaVN_blog.html?tid=a_inl&utm_term=.47788fe7dfae.
9. Robert Lewis, “Why New York City School Busing is so Expensive,” WNYC, January 22, 2013,
http://www.wnyc.org/story/284319-why-new-york-city-school-busing-is-so-expensive/.
10. Alan Treffeisen, “The Cost of Students’ Free Ride,” IBO Web Blog, Independent Budget Office, January 11,
2010, http://ibo.nyc.ny.us/cgi-park/?p=118.
11. “What is Vision Zero?” Vision Zero Network, accessed February 2, 2017,
http://visionzeronetwork.org/about/what-is-vision-zero/.
12. “Green Lane Project Focus Cities,” People For Bikes, accessed February 2, 2017,
http://www.peopleforbikes.org/green-lane-project/landing/focus-cities.
13. Travis Wright, “Youth Transit Alliance: Detroit’s Alternative Transportation Plan in Jeopardy;” WDET, March
25, 2015, http://wdet.org/posts/2015/03/25/80005-youth-transit-alliance-detroits-alternative-
transportation-plan-in-jeopardy/; “Ride for Ride Program,” Detroit Bus Company, accessed February 2, 2017,
http://thedetroitbus.com/ride-for-ride/.
14. “DPS to Keep Track of Students with Bus Pass System,” CBS Denver, May 21, 2013,
http://denver.cbslocal.com/2013/05/21/dps-to-keep-track-of-students-with-bus-pass-system/.
15. “Use a DC One Card,” DC Office of the Chief Technology Officer, accessed February 2, 2017,
http://octo.dc.gov/node/687402.

R E F E R E N C E S 2 5
References Balmes, John R. 2011. “How Does Diesel Exhaust Impact Asthma?” Thorax 66 (1): 4–6.
Banerjee, Tridib, JungA Uhm, and Deepak Bahl. 2014. “Walking to School: The Experience of Children in Inner City
Los Angeles and Implications for Policy.” Journal of Planning Education and Research 34 (2): 123–40.
Bittel, Peter J., and Nicholas D. Young. 2012. Transforming Special Education Practices: A Primer for School
Administrators and Policy Makers. Lanham, MD: Rowman and Littlefield Education.
Blackmon, Bret J., and Daphne S. Cain. 2015. “Case Manager Perspectives on the Effectiveness of an Elementary
School Truancy Intervention.” School Social Work Journal 40 (1).
Boston Municipal Research Bureau. 2016. “The True Cost of Boston’s Charter Schools.” Special report 16-2. Boston
Municipal Research Bureau.
Burdick-Will, Julia. 2015. “School Choice, Neighborhood Income, and Educational Heterogeneity.” Paper presented
at American Sociological Association Annual Meeting, Chicago, IL, August 24.
Canfield, James P., Joesph Nolan, Dana Harley, Ashley Hardy, and Willie Elliott. 2016. “Using a Person-Centered
Approach to Examine the Impact of Homelessness on School Absences.” Child and Adolescent Social Work
Journal 33 (3): 199–205.
Carrell, Scott E., Teny Maghakian, and James E. West. 2011. “A’s from Zzzz’s? The Causal Effect of School Start
Time on the Academic Achievement of Adolescents.” American Economic Journal: Economic Policy 3 (3): 62–81.
Chambers, Jay G., Thomas B. Parrish, and Irene Lam. 2002. “What Are We Spending on Transportation Services for
Students with Disabilities, 1999–2000?” Special Education Expenditure Project (SEEP) report 3, Washington,
DC: American Institutes for Research.
Committee on School Transportation Safety. 2002. The Relative Risks of School Travel: A National Perspective and
Guidance for Local Community Risk Assessment. Special report 269. Washington, DC: National Academy of
Sciences, Transportation Research Board.
Cowen Institute for Public Education Initiatives. 2013. The State of Public Education in New Orleans 2013 Report.
New Orleans: Tulane University.
Denice, Patrick, and Betheny Gross. 2016. “Choice, Preferences, and Constraints.” Sociology of Education 89 (4):
300–20.
Edwards, Finley. 2012. “Early to Rise? The Effect of Daily Start Times on Academic Performance.” Economics of
Education Review 31 (6): 970–83.
Egalite, Anna J. 2013. “Measuring Competitive Effects from School Voucher Programs: A Systematic Review.”
Journal of School Choice 7 (4): 443–64.
Ely, Todd, and Paul Teske. 2014. “Success Express: Transportation Innovation in Denver Public Schools.” Denver:
University of Colorado Denver.
Fan, Yingling, and Kirti Das. 2015. Assessing the Impacts of Student Transportation on Public Transit. Minneapolis:
University of Minnesota.
Figlio, David, and Cassandra Hart. 2014. “Competitive Effects of Means-Tested School Vouchers.” American
Economic Journal: Applied Economics 6 (1): 133–56.
Gase, Lauren N., Tony Kuo, Steven Teutsch, and Jonathan E. Fielding. 2014. “Estimating the Costs and Benefits of
Providing Free Public Transit Passes to Students in Los Angeles County: Lessons Learned in Applying a Health
Lens to Decision-Making.” International Journal of Environmental Research and Public Health 11 (11): 11384–97.

2 6 R E F E R E N C E S
Glazerman, Steven, and Dallas Dotter. 2016. “Market Signals: Evidence on the Determinants and Consequences of
School Choice from a Citywide Lottery.” Working paper 45. Washington, DC: Mathematica Policy Research.
Grossman, Jean Baldwin, Karen Walker, and Rebecca Raley. 2001. “Challenges and Opportunities in After-School
Programs: Lessons for Policymakers and Funders.” Philadelphia: Public/Private Ventures.
Hastings, Justine S., and Jeffrey M. Weinstein. 2008. “Information, School Choice, and Academic Achievement:
Evidence from Two Experiments.” Quarterly Journal of Economics 123 (4): 1373–414.
Jacob, Brian A., and Jonah E. Rockoff. 2011. “Organizing Schools to Improve Student Achievement: Start Times,
Grade Configurations, and Teacher Assignments.” Washington, DC: Brookings Institution.
Jochim, Ashley, Michael DeArmond, Betheny Gross, and Robin Lake. 2014. How Parents Experience Public School
Choice. Seattle: Center on Reinventing Public Education.
Killeen, Kieran, and John Sipple. 2000. School Consolidation and Transportation Policy: An Empirical and Institutional
Analysis. Arlington, VA: Rural School and Community Trust.
McDonald, Noreen. 2007. “Active Transportation to School: Trends Among US Schoolchildren, 1969–2001.”
American Journal of Preventive Medicine 32(6): 509–16.
McDonald, Noreen, Ruth Steiner, Benjamin Lytle, Jeff Tsai, and Thomas Cook. 2015. Quantifying the Costs of School
Transportation. Gainesville, FL: Southeastern Transportation Research, Innovation, Development and
Education Center.
McMillan, Tracy E. 2005. “Urban Form and a Child’s Trip to School: The Current Literature and a Framework for
Future Research.” Journal of Planning Literature 19 (4): 440–56.
Merrill, Andrea. 1990. How Other States Fund School Transportation. Helena: Montana Legislative Council.
Millimet, Daniel L., and Trevor Collier. 2008. “Efficiency in Public Schools: Does Competition Matter?” Journal of
Econometrics 145 (1): 134–57.
National Center for Safe Routes to School. 2013. Trends in Walking and Bicycling to School from 2007 to 2012. Chapel
Hill, NC: Safe Routes.
New York City Independent Budget Office. 2000. Expanding Yellow School Bus Service: Fiscal Impact of Three Proposed
Policy Changes. New York City Independent Budget Office.
Parrish, Tom, Jenifer J. Harr, Jeffrey M. Poirier, Shannon Madsen, and Sara Yonker. 2007. “Special Education
Financing Study for the District of Columbia.” Washington, DC: American Institutes for Research.
Robers, Simone, Anlan Zhang, Rachel E. Morgan, and Lauren Musu-Gillette. 2015. Indicators of School Crime and
Safety: 2014. Washington, DC: National Center for Education Statistics.
Sirard, John R., Kelsey McDonald, Patrick Mustain, Whitney Hogan, and Alison Helm. 2015. “Effect of a School
Choice Policy Change on Active Commuting to Elementary School.” American Journal of Health Promotion 30
(1): 28–35.
Sirard, John R., and Megan E. Slater. 2008. “Walking and Bicycling to School: A Review.” American Journal of Lifestyle
Medicine 2 (5): 372–96.
State Board of Elementary and Secondary Education. n.d. “Response to the House Concurrent Resolution 187 of
the 2014 Regular Session.” Baton Rouge: Louisiana Department of Education.
Teasley, Martell L. 2004. “Absenteeism and Truancy: Risk, Protection, and Best Practice Implications for School
Social Workers.” Children & Schools 26 (2): 117–28.
Teske, Paul, Jody Fitzpatrick, and Tracey O’Brien. 2009. Drivers of Choice: Parents, Transportation, and School Choice.
Seattle: Center on Reinventing Public Education.

R E F E R E N C E S 2 7
Transportation Working Group. 2012. “21st Century Demonstration Project Grant.” Garden City, NY: Nassau
Board of Cooperative Educational Services.
Vincent, Jeffrey M., Carrie Makarewicz, Ruth Miller, Julia Ehrman, and Deborah L. McKoy. 2014. Beyond the Yellow
Bus: Promising Practices for Maximizing Access to Opportunity through Innovations in Student Transportation.
Berkeley: University of California, Center for Cities & Schools.
Wahistrom, Kyla. 2002. “Changing Times: Findings from the First Longitudinal Study of Later High School Start
Times.” NASSP Bulletin 86 (633): 3–21.
Wilson, Elizabeth J., Julian Marshall, Ryan Wilson, and Kevin J. Krizek. 2010. “By Foot, Bus Or Car: Children’s
School Travel and School Choice Policy.” Environment and Planning A 42 (9): 2168–85.
Wilson, Elizabeth J., Ryan Wilson, and Kevin J. Krizek. 2007. “The Implications of School Choice on Travel Behavior
and Environmental Emissions.” Transportation Research Part D: Transport and Environment 12 (7): 506–18.
Weir, Erica. 2002. “Diesel Exhaust, School Buses and Children’s Health.” Canadian Medical Association Journal 167
(5): 505.
Wohlstetter, Priscilla, Dara Zeehandelaar, and David Griffith. 2015. America’s Best (and Worst) Cities for School
Choice. Washington, DC: Thomas B. Fordham Institute.
Wolfson, Amy R., Noah L. Spaulding, Craig Dandrow, and Elizabeth M. Baroni. 2007. “Middle School Start Times:
The Importance of a Good Night’s Sleep for Young Adolescents.” Behavioral Sleep Medicine 5 (3): 194–209.
Yang, Yizhao, Steve Abbott, and Marc Schlossberg. 2012. “The Influence of School Choice Policy on Active School
Commuting: A Case Study of a Middle-Sized School District in Oregon.” Environment and Planning A 44 (8):
1856–74.
Zhang, Anlan, Lauren Musu-Gillette, and Barbara A. Oudekerk. 2016. Indicators of School Crime and Safety: 2015.
Washington, DC: National Center for Education Statistics and Bureau of Justice Statistics.

S T A T E M E N T O F I N D E P E N D E N C E
The Urban Institute strives to meet the highest standards of integrity and quality in its research and analyses and in
the evidence-based policy recommendations offered by its researchers and experts. We believe that operating
consistent with the values of independence, rigor, and transparency is essential to maintaining those standards. As
an organization, the Urban Institute does not take positions on issues, but it does empower and support its experts
in sharing their own evidence-based views and policy recommendations that have been shaped by scholarship.
Funders do not determine our research findings or the insights and recommendations of our experts. Urban
scholars and experts are expected to be objective and follow the evidence wherever it may lead.

2100 M Street NW
Washington, DC 20037
www.urban.org