Embed Size (px)
Citation preview

Student Loan Market Trends: Is College Worth It?
Laura Steinbeck, Director of Business Development
Sallie Mae

Agenda
This presentation is an overview of trends in the industry
and the value of a college education with the following
areas covered:
‒ Enrollment Trends
‒ Cost of Attendance and Student Loan Borrowing
‒ The Value of an Education
‒ Repayment Success
‒ Summary

ENROLLMENT TRENDS

High School Graduates Ages 16-24 Who Enroll in College
Source: information obtained 8/2016 from National Center for Education Statistics 2015; Table 302.10. https://nces.ed.gov/programs/digest/current_tables.asp

FAFSA Applications and Projections
Source: information obtained 7/2016 from Federal Student Aid Data Center (actuals through March 2016; released June 2016).

Undergraduate Enrollment and Projected Enrollment
Actual and projected undergraduate enrollment in degree-granting postsecondary institutions, by enrollment status: Fall 2000–2025
Source: Information gathered 8/2016 from National Center for Education Statistics http://nces.ed.gov/programs/coe/indicator_cha.asp

Graduate Enrollment and Projected Enrollment
Post baccalaureate enrollment in degree-granting postsecondary institutions, by enrollment status: Fall 2000–2025
Source: Information gathered 8/2016 from National Center for Education Statistics http://nces.ed.gov/programs/coe/indicator_chb.asp

Foreign Students Enrolled in US Institutions
Place of
Origin
Number of
Students
% of Total
China 304,040 31%
India 132,888 14%
South Korea 63,710 7%
Saudi Arabia 59,945 6%
Canada 27,240 3%
Brazil 23,675 2%
Taiwan 20,993 2%
Japan 19,064 2%
Vietnam 18,722 2%
Mexico 17,052 2%
All Others 287,597 29%
Total 974,926 100%
AY 14/15 Enrollment by Place of Origin
Source: information gathered 8/2016 from http://www.iie.org/Research-and-Publications/Open-Doors

US Students Studying Abroad by Region
Distribution
Africa 5% 6% 5% 5% 5% 4%
Asia 11% 12% 12% 12% 12% 12%
Europe 55% 54% 55% 53% 53% 53%
Latin America 15% 15% 15% 16% 16% 16%
Middle East 1% 2% 2% 3% 2% 2%
Canada 0% 0% 0% 1% 1% 1%
Australia 6% 5% 5% 5% 4% 4%
Source: Information gathered 8/2016 from Digest of Education Statistics 2015; Table 310.10https://nces.ed.gov/programs/digest/current_tables.asp

Total Degrees Awarded
Source: Information gathered 8/2016 National Center for Education Statistics 2015; Table 318.20 and 318.30. https://nces.ed.gov/programs/digest/current_tables.asp

COST OF ATTENDANCE AND STUDENT LOAN BORROWING

Cost of Tuition
% Variance
NFP4 - Private 4.7% 6.3% 5.0% 6.0% 3.7% 4.0% 4.2% 4.0% 3.9% 3.8% 3.6%
NFP4 - Public 7.1% 5.7% 6.7% 6.6% 7.2% 7.9% 8.5% 4.5% 2.8% 2.9% 2.9%
NFP2 5.0% 3.8% 1.2% 3.8% 7.9% 6.7% 8.4% 6.1% 2.8% 2.9% 3.0%
For Profit 5.0% 2.2% -0.1% 0.8% 3.0%
*Amount includes an enrollment weighted average including both in-state and out-of-state tuition amounts*From AY 05/06 to AY 15/16, the average published tuition at private institutions has risen 55%, while those at public 4 year schools has risen 71% and 57% at 2 year schools
*Tuition and fees weighted by full-time undergraduate enrollment, For Profit amounts not available prior to AY 10-11Source: Information gathered 8/2016 from College Board 2015 – Trends in College Pricing. https://trends.collegeboard.org/sites/default/files/trends-college-pricing-web-final-508-2.pdf

Net Price – Not for Profit 4 Year
From AY 05-06 to AY 15-16, the average net price at
private institutions has risen 33%, while those at public
schools has risen 57%
Avg Publ ished COA $28,755 $30,494 $31,990 $33,797 $35,072 $36,457 $37,983 $39,434 $40,939 $42,435 $43,920
Growth in Publ ished COA 5% 6% 5% 6% 4% 4% 4% 4% 4% 4% 3%
Avg Net COA $19,812 $20,955 $21,754 $22,120 $21,543 $21,589 $22,244 $23,119 $23,963 $24,950 $26,400
Growth in Net COA 4% 6% 4% 2% -3% 0% 3% 4% 4% 4% 6%
Discount Rate 31% 31% 32% 35% 39% 41% 41% 41% 41% 41% 40%
Avg Publ ished COA $12,121 $12,830 $13,551 $14,369 $15,235 $16,174 $17,159 $17,812 $18,376 $18,922 $19,550
Growth in Publ ished COA 7% 6% 6% 6% 6% 6% 6% 4% 3% 3% 3%
Avg Net COA $8,984 $9,531 $10,044 $10,406 $10,478 $10,995 $12,083 $12,668 $13,033 $13,503 $14,120
Growth in Net COA 8% 6% 5% 4% 1% 5% 10% 5% 3% 4% 5%
Discount Rate 26% 26% 26% 28% 31% 32% 30% 29% 29% 29% 28%
Pri
va
teP
ub
lic
Source: Information gathered 8/2016 from College Board 2015 – Trends in College Pricing. https://trends.collegeboard.org/sites/default/files/trends-college-pricing-web-final-508-2.pdf

Students Are Taking Primary Responsibility for Borrowing
Proportion of Students Who Borrowed 2015-16, by Loan Type
Source: Sallie Mae (with Ipsos Public Affairs); How America Pays for College, 2016
Of the 27% who borrowed to pay for college, students signed for nearly three-quarters of the dollars
• Students: 74%
• Parents: 35%

Cumulative Debt Per Borrower
Student Loans: Growth in Federal & Private Loans
Note: Nonfederal loans include loans to students from states and institutions, in addition to private loans issued by financial institutions.
SOURCE: Information gathered 8/2016 College Board Trends in Student Aid 2015. https://trends.collegeboard.org/sites/default/files/trends-student-aid-web-final-508-2.pdf

Federal vs. Private Student Loan Debt
Source: Information gathered 8/2016 Measure One Private Student Loan Report July 2016 (http://measureone.com/reports)

THE VALUE OF AN EDUCATION

Education Attainment Levels (25-29 Year Olds)
YoY Change
Source: Information gathered 8/2016 from Digest of Education Statistics 2015; Table 104.20. https://nces.ed.gov/programs/digest/current_tables.asp

Earnings for College Graduates
Source: Information gathered 8/2016 from Federal Reserve Bankhttps://www.newyorkfed.org/research/college-labor-market/college-labor-market_wages.html

Opportunity Cost of Not Attending College
Source: Information gathered 8/2016 from Federal Reserve – Do the Benefits of College Outweigh the Costs? https://www.newyorkfed.org/medialibrary/media/research/current_issues/ci20-3.pdf

Impact of Higher Education on Unemployment
Source: Information gathered 8/2016 from Bureau of Labor Statistics http://www.bls.gov/emp/ep_chart_001.htm

REPAYMENT SUCCESS
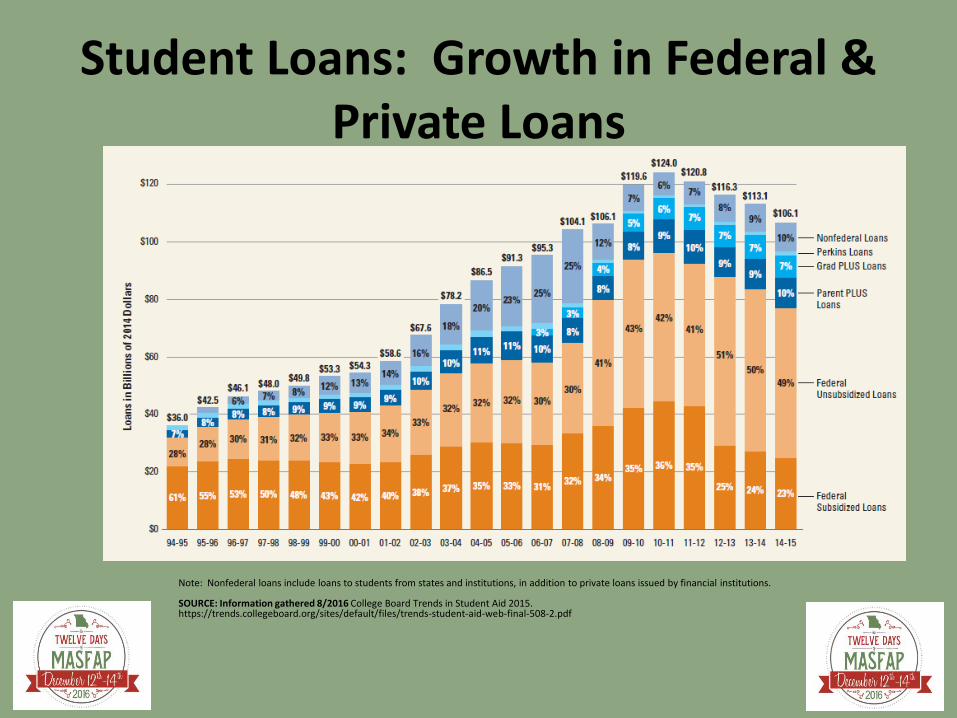
Federal and Private Loan Repayment Plans
Standard Repayment
Income Driven Plans
Graduated Repayment
Extended Repayment
Loan Consolidation
• Income Contingent Repayment
• Income Sensitive Repayment
• Income Based Repayment
• Pay as You Earn (PAYE)
• Revised Pay as You Earn (REPAYE)
Income Driven Repayment Plans
Note: Many private education loans offer flexibility in making payments as well.
Federal
Loan
Repayment
Plans

Participation in Federal Income Driven Repayment Plans
11%9%
13%14%
Source: Information gathered 8/2016 from Federal Student Aid Data Center (actuals through June 2016;released July 2016. https://studentaid.ed.gov/sa/about/data-center/student/portfolio
12%12%
19%15%10%*Fiscal Quarters

3yr Federal Loan Default Rate by School Type
Source: information gathered 8/2016 from Digest of Education Statistics 2015; Table 332.50. https://nces.ed.gov/programs/digest/current_tables.asp

Source: Information gathered 8/2016 Measure One Private Student Loan Report July 2016 (http://measureone.com/reports)
Gross Charge-off Rates
2.1%
2.3%
Private Loan Delinquency Rates and Charge-offs

SUMMARY

Summary Enrollment
• Number of high school graduates and those going to college has leveled off
• Foreign student enrollment continues to increase
Cost of Attendance
• Tuition and fees continue to increase
• Overall student borrowing is on the decline
• Federal loans make up 93% of $1.36 billion in student debt outstanding
Value of an Education
• Annual wages, lifetime earnings and unemployment support the going to college decision
Repayment Success
• Federal and private loan default rates are declining
• Private loan delinquency / charge off rates are considerably lower than federal loans

Looking Forward
Private Loan Trends• Interest Rates: Many lenders offer highly qualified families rates better than
the Federal PLUS Loan• Private Parent Loans• Private Loan Protections: Death and Disability coverage, repayment flexibility,
cosigner release• Private Loan Refinancing: consolidation of federal and private loans
• Students are giving up their federal loan repayment flexibility
Early FAFSA• Potential impact on the financial aid time
Reauthorization
• The last reauthorization (2008) took 5 years to complete• Key initiatives on the table
• FAFSA simplification• Transparency in college information for consumers • Financial literacy for recipients of federal aid • Accreditation reform• Federal loan repayment simplification

Questions?

The information contained in this presentation is not comprehensive, is
subject to constant change, and therefore should serve only as general,
background information for further investigation and study related to the
subject matter and the specific factual circumstances being considered or
evaluated. Nothing in this presentation constitutes or is designed to
constitute legal advice.
For school use only. Not to be distributed to students.
(MKT12067 09/2016)