Embed Size (px)
Citation preview

Student Guide Activity 1 Hudson River Watershed
A. Trace the Hudson River on Google Earth Through this curriculum you’ll explore water quality at three locations in New York State. You’ll first conduct virtual visits using the computer as your guide. Later in the year, you’ll actually visit some of the sites.
Start by using Google Earth to get familiar with the path of the Hudson River. Your teacher will help you begin. Locate your school, either by name or by street address. Place a yellow thumbtack marker on your school so you can easily find it again later. Then locate the Hudson River and the George Washington Bridge. Use the slider bar on the right side of the screen to practice zooming in and out, and moving the screen around. Always keep your school and the Hudson River in sight.
Start your Hudson River exploration by moving downstream to its mouth (where the river meets the Atlantic Ocean). Now follow the River slowly, changing the scale if necessary as you move upstream. Notice where there are cities and where there are fields or woods. Move slowly to the north, following the twists and turns of the River.
Can you find the “beginning” or source of the Hudson River? It’s tricky. At some point, the Mohawk River twists off to the left (west). Don’t follow it. Continue to move north. The Hudson will narrow and squeeze between hills. After you pass a light blue reservoir, move even more slowly. You’re in the right neighborhood. Type Lake Tear of the Clouds in the Fly to box on the left side of the Google Earth screen. This lake and the mountains around it are the source of the Hudson River.
B. Hudson River WatershedMany streams, rivers and lakes flow into the Hudson River. Together, the land drained by all of these water bodies is called the Hudson River Watershed. Download this watershed map into your Journal for reference: http://www.dec.ny.gov/education/63069.html
The drawing below represents any watershed that has a river flowing downhill to the ocean. The watershed boundaries are shown by yellow dotted lines along the mountain ridges above the river. The blue arrows show the direction that rainwater and snowmelt flow. Answer the questions below in your Journal:
Examine the human activities depicted in the drawing below. List and describe each of them, including ways that each might influence the river or ocean’s water quality.
Based on your experience, what other human activities might be added to the diagram? Describe how each of them might influence water quality,
Act 1 Stud Guide Hudson River Watershed.doc 1
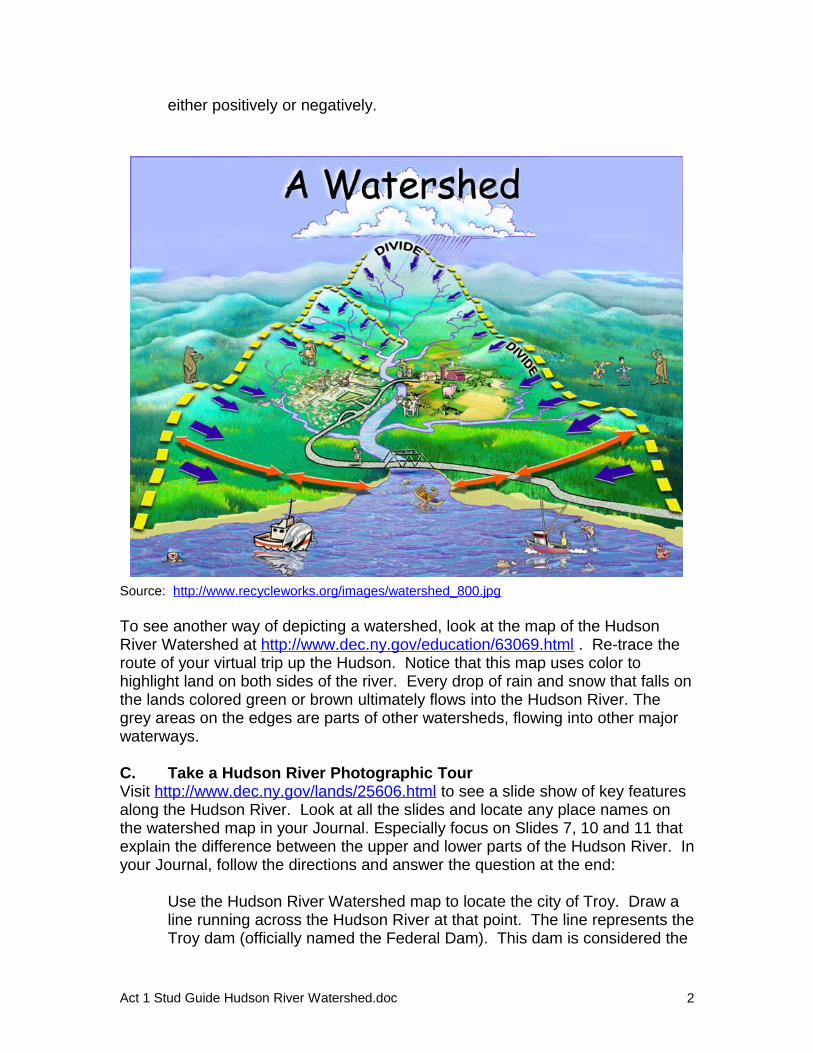
either positively or negatively.
Source: http://www.recycleworks.org/images/watershed_800.jpg To see another way of depicting a watershed, look at the map of the Hudson River Watershed at http://www.dec.ny.gov/education/63069.html . Re-trace the route of your virtual trip up the Hudson. Notice that this map uses color to highlight land on both sides of the river. Every drop of rain and snow that falls on the lands colored green or brown ultimately flows into the Hudson River. The grey areas on the edges are parts of other watersheds, flowing into other major waterways.
C. Take a Hudson River Photographic TourVisit http://www.dec.ny.gov/lands/25606.html to see a slide show of key features along the Hudson River. Look at all the slides and locate any place names on the watershed map in your Journal. Especially focus on Slides 7, 10 and 11 that explain the difference between the upper and lower parts of the Hudson River. In your Journal, follow the directions and answer the question at the end:
Use the Hudson River Watershed map to locate the city of Troy. Draw a line running across the Hudson River at that point. The line represents the Troy dam (officially named the Federal Dam). This dam is considered the
Act 1 Stud Guide Hudson River Watershed.doc 2

dividing line between the upper and lower portions of the Hudson River. From your viewing of the slide show, why do you think this dam is considered important?
D. Water Quality Monitoring sites in the Hudson River WatershedTo get to know the three water quality sites in the Hudson River Watershed, you’ll locate them on Google Earth. They are:
• Cascade Brook, in Black Rock Forest, a relatively pristine protected area about 50 miles north of New York City
• The Hudson River, at the New Jersey end of the George Washington Bridge
• The Harlem River, running between Manhattan and the Bronx, along its western shore.
As you do so, mark each location with a yellow thumbtack icon and name each one so that you can easily find it again. Start with Cascade Brook. Copy and paste the following GPS coordinates into the Fly To box on the left and click on the magnifying icon to the right of the box. When the location appears, click on the yellow thumbtack icon at the top of the page and then copy and paste its name into the box that appears on the right of the screen.
Cascade Brook 41 23.633N 73 59.813W
Repeat the above procedure with the two other sites:Hudson River40 51.118N 73 57.556W
Harlem River40 49.488N 73 56.079W
The next time you open Google Earth, the thumbtacks and labels will appear.
Act 1 Stud Guide Hudson River Watershed.doc 3

Black Rock Forest

Black Rock Forest has many natural and man-made streams and ponds.
Daniel Hutt, June 28, 2005 http://www.nynjtc.org/park/black-rock-forest
This beautiful waterfall is on Mineral Springs Brook.

Cascade Brook is to the lower right. The Brook’s water quality data is recorded at the Cascade Brook Stream Station

This is Cascade Brook. These students from Barnard College are collecting information on water flow.

You also need a good sense of balance!
To do this kind of work you may need to get wet.

The students are also testing water quality in Cascade Brook. This equipment measures how much dissolved oxygen is in the water.

Not-for-profit use of ODWS images Any student has permission to use any of the ODWS original images in his/her assignments. This includes word processing, PowerPoint presentations and web
sites. The ODWS team only asks that you credit the image and link back to the Open Door Web Site (© ODWS www.saburchill.com) All of the images copyrighted to the ODWS may be used for general not-for-profit publication with prior permission from the ODWS webmaster. This includes
printed material, websites and PPT presentations. The ODWS team asks that you credit the image and link back to the Open Door Web Site (© ODWS www.saburchill.com)
This kind of information is important for keeping the environment of Cascade Brook healthy for animals and plants that live there.
From the Open Door Website: http://www.saburchill.com/chapters/chap0023.html

Resources for Research Project – Living in Water
On the aquatic animal list below, you’ll see that we’ve added the name of a taxonomic category. To find your organism on some websites, you may need to know the name of this larger group in which your organism is a member.
VertebratesBrook Trout (Family: Salmonidae)Blacknose Dace (Family: Cyprinidae)Creek Chub (Family: Cyprinidae)Northern Two-lined Salamander
(Class: Amphibian)
MacroinvertebratesStonefly larva (Order: Plecoptera)Mayfly larva (Order: Ephemeroptera)Caddisfly larva (Order: Trichoptera)Hellgrammite (Order: Megaloptera)Dragonfly larva (Order: Odonata)Water boatman (Order: Hemiptera)Mosquito larva (Order: Diptera)Whirligig Beetle (Order: Coleoptera)Scud (amphipod) (Class: Crustacea)Leech (Phylum: Annelidae)Aquatic Worm (Phylum: Annelidae)
VertebratesPages with links to different fish groups (follow links for information on your animal)
• http://www.enature.com/fieldguides/intermediate.asp?curGroupID=3 You’ll need to enter species name on Search Field Guides tool
• http://chamisa.freeshell.org/fish.htm Good information on fish in streams and rivers
• http://cnre.vt.edu/efish/families/cyprinidae.html Click on family your fish belongs to.
Links for specific speciesBrook Trout
• http://en.wikipedia.org/wiki/Brook_trout • http://www.dec.ny.gov/animals/7016.html • http://fish.dnr.cornell.edu/nyfish/Salmonidae/brook_trout.html
Blacknose Dace• http://fish.dnr.cornell.edu/nyfish/Cyprinidae/e_blacknose_dace.html • http://www.gofishn.com/content/blacknose-dace
Act 2 Resources for Research Project.doc 1

Creek Chub• http://www.bio.txstate.edu/~tbonner/txfishes/semotilus%20atromaculatus.htm • http://ookaboo.com/o/pictures/picture/20946118/Creek_Chub_Semotilus_atro
maculatus• http://fish.dnr.cornell.edu/nyfish/Cyprinidae/creek_chub.html
Salamanders• http://nyfalls.com/wildlife/Wildlife-reptiles-salamanders.html Salamanders of
NY State, including Northern Two-lined Salamander• http://www.paherps.com/herps/salamanders/twolined_salamander
Information and photos of Northern Two-lined Salamander, adult and larvae
Macroinvertebrates These pages have links to most macroinvertebrate groups:
• http://www.epa.gov/bioindicators/html/benthosclean.html • http://chamisa.freeshell.org/inverts.htm#insects )• http://www.lakesuperiorstreams.org/understanding/benthos_ID.html Here
you’ll need to click on the Order your macroinvertebrate belongs to.
Sites for specific macroinvertebrate groupsStonefly
• http://chamisa.freeshell.org/mayfly.htm • http://people.virginia.edu/~sos-iwla/Stream-Study/Catalog/FGStonefly.HTML
Mayfly• http://chamisa.freeshell.org/mayfly.htm • http://people.virginia.edu/~sos-iwla/Stream-Study/Catalog/FGMayfly.HTML
Caddisfly• http://chamisa.freeshell.org/caddis.htm • http://people.virginia.edu/~sos-iwla/Stream-Study/Catalog/FGCaddisfly.HTML
Hellgrammite• http://people.virginia.edu/~sos-iwla/Stream-
Study/Catalog/FGDobsonfly.HTML• http://insects.tamu.edu/fieldguide/bimg121.html • http://www.fcps.edu/islandcreekes/ecology/dobsonfly.htm
Dragonfly• http://people.virginia.edu/~sos-iwla/Stream-Study/Catalog/FGDragonfly.HTML • http://www.dragonfly-site.com/dragonfly-life-cycle.html
Act 2 Resources for Research Project.doc 2

Water Boatman• http://www.lakesuperiorstreams.org/understanding/bugs_hemiptera.html • http://www.everythingabout.net/articles/biology/animals/arthropods/insects/bugs/wat
er_boatman/
Mosquito• http://chamisa.freeshell.org/fly.htm • http://www.mosquitoes.org/LifeCycle.html#anchor36469
Whirligig Beetle• http://www.arkive.org/whirligig-beetle/gyrinus-substriatus/ • http://insects.tamu.edu/fieldguide/bimg134.html • http://www.hiltonpond.org/thisweek031001.html
Scud:• http://people.virginia.edu/~sos-iwla/Stream-Study/Catalog/FGScud.HTML • http://www.fcps.edu/islandcreekes/ecology/scud.htm
Leech• http://people.virginia.edu/~sos-iwla/Stream-Study/Catalog/FGLeech.HTML • http://lakes.chebucto.org/ZOOBENTH/BENTHOS/xxvi.html
Aquatic Worm • http://people.virginia.edu/~sos-iwla/Stream-Study/Catalog/FGWorm.HTML • http://lakes.chebucto.org/ZOOBENTH/BENTHOS/xxv.html
Videos of many of these organisms can also be found on the web.
Act 2 Resources for Research Project.doc 3

Student Guide Activity 2 Cascade Brook - Living in Water
Aquatic Animals in Cascade BrookYour first study site is Cascade Brook in Black Rock Forest, a protected 4000-acre reserve about 50 miles north of New York City. The Forest contains a variety of aquatic environments (ponds, streams, reservoir) - you’ll focus on the Brook for this study.
Watch the slideshow Introducing Cascade Brook, looking for clues about the Brook as a home for aquatic animals. What kinds of aquatic animals might you find if you went collecting in Cascade Brook?
The chart below lists animals often found in streams or ponds. Some of them may be in the Brook. In future activities, you’ll look at data from Cascade Brook to find out whether these animals could survive there. First we need to find out more about each organism.
You’ll notice that the list includes both vertebrates (in this case fish and salamanders) and also a group called macroinvertebrates. (macro means you can see them easily with your naked eye, and invertebrate means they don’t have bones.)
Macroinvertebrates include insects, worms and leeches, and sometimes snails and clams. Most of the macroinvertebrates on the list are the larval stage of flying insects. These larvae spend their early life stages underwater. When it’s time to become adults they crawl out of the water and fly away. The larvae of dragonflies and mosquitoes are examples of macroinvertebrates.
Illustrations of some macroinvertebrates: http://www.cacaponinstitute.org/Benthics/Cast_of_Characters.html
For illustrations of these animals in their habitat, go to this site and scroll down: http://ecologyadventure2water.edublogs.org/macroinvertebra-information/Also look at the diagrams further down this site showing life cycles of some of the insects. This page was posted by high school students.
Act 2 Stud Guide Living in Water.doc 1
List of Aquatic Organisms Vertebrates
Brook Trout Black Nose DaceCreek ChubNorthern Two-lined Salamander
MacroinvertebratesStonefly larvaMayfly larvaCaddisfly larvaHellgrammite Dragonfly larvaScud (amphipod)Whirligig beetleWater boatmanMosquito larvaLeechAquatic Worm

Macroinvertebrates are important as food for other animals, but they are also important in another way. Some of these organisms can live in warm streams whereas others require cold, oxygen-rich water. Some can survive in acidic conditions while others would die. Some insects are sensitive to pollution while others can tolerate moderate amounts. We can survey a stream to see which insects are present and use this information to decide on the stream’s water quality.
Aquatic Animals Research ProjectChoose an animal from the above list to research and consider how you’d like to eventually share your research with other students. You might choose to write a paper, make a PowerPoint presentation, create a large illustrated poster or any combination of these. Talk it over with your teacher if you’re not sure what to do. You’ll find references in the Resources for Research Project but you can also conduct your own web searches.
However you present your results, be sure to include the information below:• Common and scientific names of the animal.• What are its physical characteristics? Find at least one adaptation this
animal has for the life it lives.• What does it eat and how does it get it?• Is it a larva or an adult? If it’s a larva, what does it turn into?• If the animal you are researching is a macroinvertebrate, how sensitive is it
to pollution or to poor water conditions? • Include a photograph or drawing.
To get started, watch a slide show with photographs and information about many of the animals on the list: http://www.mbgnet.net/fresh/rivers/animals/index.htm To reach this slide show, you’ll need to select River Creatures on the sidebar, then click on Aquatic Critters Slide Show in the new window which comes up.
Act 2 Stud Guide Living in Water.doc 2

Student Guide Activity 3 Cascade Brook Water Temperature
Like all bodies of water, Cascade Brook is important to supporting life. You’ll start your investigation of the Brook’s water quality by examining water temperature during one year (2009). The data was collected hourly by sensors at the Brook and then transmitted to a computer where it is stored. Later in the year you’ll visit the Forest to make field observations of the area’s physical and biological characteristics.
How do you think Cascade Brook water temperature will change during one year? In your Journal, sketch the way you think the graph will look. Use months as the labels on the x-axis and degrees on the y-axis (either Celsius or Fahrenheit are fine right now).
Compare your graph with graphs made by other students. Talk about how they’re similar and how they’re different from each other. What factors might be affecting temperature during the year? Describe those factors in the Journal.
A. Use the Graphing Tool to construct the water temperature graph based on real data You’ll use the period 1/2/2009 to 12/31/2009 (for some reason there’s no data for January 1). Follow the steps below to set up your graph:
1. In the title section, type "Cascade Brook Water Temp".2. Click on the "Time Series" button.3. From the list of data sets, click on "Cascade Brook Temp" to highlight it.4. Click in the box under "Start" to select a starting date. A calendar pops
up. 5. Navigate to January 2009 and click on “2”6. Click in the box under "End" to select an ending date.7. Navigate to December and click on “31”.8. Click on the green "Create Graph" button.
The graph takes several seconds to appear at the bottom of the screen. Look at the overall shape of the graph and compare it to the graph you sketched earlier. Record your comparison in the Journal.
B. Getting detailed information from the graphThe x-axis is labeled by months. The y-axis has numbers representing temperatures from 0 to 25 degrees Celsius. Practice moving the cursor along the graph and notice that you can get detailed information as you do so. Use this feature to find the extremes of temperature (maximum and minimum) during 2009 and when they occurred. Record those in your Journal.
Act 3 Stud Guide Cascade Brook Water Temp.doc 1

C. Download the graph into your JournalFind the icon In the upper right hand portion of the graphing area that shows a downward-pointing arrow over a horizontal bar. Click on this icon and notice the choices of format you might use. Because of differences in computers and word processing software, your teacher will advise you on the best format to use. Insert the graph into your Journal in the space provided.
D. Which organisms can live in Cascade Brook? (Class discussion)Examine the Water Temperature graph you made and the Temperature Range Chart below. Would your organism be healthy, stressed or unable to survive in Cascade Brook, just on the basis of temperature? [There may be other factors that might still make life impossible for your animal but we‘ll consider those at a later time.] If your organism has different temperature needs at different stages of its life, be sure to mention them.
As a group, compile a list of the organisms that could survive in Cascade Brook and enter the list in your Journal.
Act 3 Stud Guide Cascade Brook Water Temp.doc
Aquatic Organisms Temperature RangeVERTEBRATES
Brook Trout 5 to 20°C
Black Nose Dace 12 to 24°C
Creek Chub 12 to 24°C
Northern Two-lined Salamander
5 to 20°C
MACROINVERTEBRATES
Stonefly larva 10 to 25°C
Mayfly larva 10 to 25°C
Caddisfly larva 10 to 25°C
Hellgrammite 10 to 25°C
Dragonfly larva 10 to 25°C
Scud (amphipod) 10 to 25°C
Whirligig beetle 10 to 25°C
Water boatman 10 to 26°C
Mosquito larva 10 to 26°C
Leech 10 to 30°C
Aquatic Worm 10 to 30°C
2

E. Air temperature graph It’s interesting to think about how the temperature of the air might affect water temperature in Cascade Brook. How do you think a graph of air temperature for 2009 would look? Sketch your ideas in your Journal.
Air temperature was not actually measured at Cascade Brook but we do have data collected at the Open Lowland Station nearby. Follow the instructions above for using the Graphing Tool but select BRF Lowlands Temp as the parameter and Air Temp as the title. Keep the dates the same. In your Journal, compare the actual graph with your predicted graph.
F. Compare air temperature and water temperature graphsDownload the air temperature graph to your Journal. If possible, place it directly below the Water Temperature graph so that the vertical axes line up directly above each other. Compare the two graphs by answering the questions in the Journal.
Act 3 Stud Guide Cascade Brook Water Temp.doc 3

Act 4 Stud Guide pH.doc 1
Student Guide Activity 4 pH: Acidity and Aquatic Environments A. Introduction to pH and the pH Scale pH is one of the parameters measured at Cascade Brook. pH is a measure of how acid or alkaline (basic) a solution is. The pH scale goes from 0 to 14. Acid substances, such as lemon juices and vinegar have a pH lower than 7. Substances with a pH higher than 7 are called bases. Examples of these are baking soda and bleach. Any substance having a pH of 7, such as pure water, is neutral. The pH scale seems to go from 0 to 14, one unit at a time. Actually, the numbers go up by powers of ten (100, 1000, etc) For example, pH 4 is 10 times more acidic than pH 5, and 100 times more acidic than pH 6. This is called a logarithmic scale, and it means that even a small change in pH can have a very strong effect, especially for living organisms. Answer the question below in your Journal.
1. For an animal living in pH 7 water, how much more acidic is pH 5 water? You can review the pH scale and compare the pH of other familiar substances in the first activity on this site (but don’t go on to the lab) http://www.emu.dk/gsk/fag/fys/ckf/fase1/1fokv/syrer_og_baser/indledning_pH.swf B. pH in the Environment Most living things can only survive within a specific pH range, usually somewhere between pH 5 and pH 9. Pure water, at pH 7, is within this range. But when other substances dissolve in water, they often release ions into the water that cause the mixture to become acidic or basic. pH can be raised or lowered both by natural substances in the environment and by man-‐made chemicals. Go to: http://www.water-‐research.net/Watershed/pH.htm and read the section What Causes the pH of a Stream to Vary? Then answer the questions below in your Journal:
2. What are two natural factors that could affect the pH of a stream? 3. What are two examples of human activities that can change the pH of a stream?
C. Acid Rain In the 1970s people noticed that plants and animals were dying in forests and lakes in the eastern United States. Scientist discovered that the cause was a very particular kind of smoke. Coal-‐fired plants in the upper Midwest were releasing smoke that contained chemicals like sulfur dioxide and nitrous oxides, compounds that react with water molecules to produce acids. When it rained, these acids landed on trees, buildings, and rivers In New York State. This acid rain has caused extensive damage to buildings and monuments, killed trees and lowered the pH of lakes, rivers and streams. In 1990 a

Act 4 Stud Guide pH.doc 2
study showed that one quarter of the 3000 lakes and streams in the Adirondack Mountains had become too acidic to support fish life. The diagram below shows the range of pH considered to be acid rain. Other common substances are shown for comparison. Use the diagram to answer the questions below in your Journal.
4. What is the pH range of normal precipitation (rain and snow not affected by acid
rain)? If you’re surprised that the pH of rain is not 7, remember that rain water contains dissolved gases and other impurities. Carbon dioxide in the atmosphere, combined with water, makes a very mild acid called carbonic acid. Answer the questions below in your journal.
5. According to this diagram, approximately what is the pH range of a normal stream—a stream not affected by acid rain?
6. What is the pH range of Acid Rain, as shown on this diagram?

Act 4 Stud Guide pH.doc 3
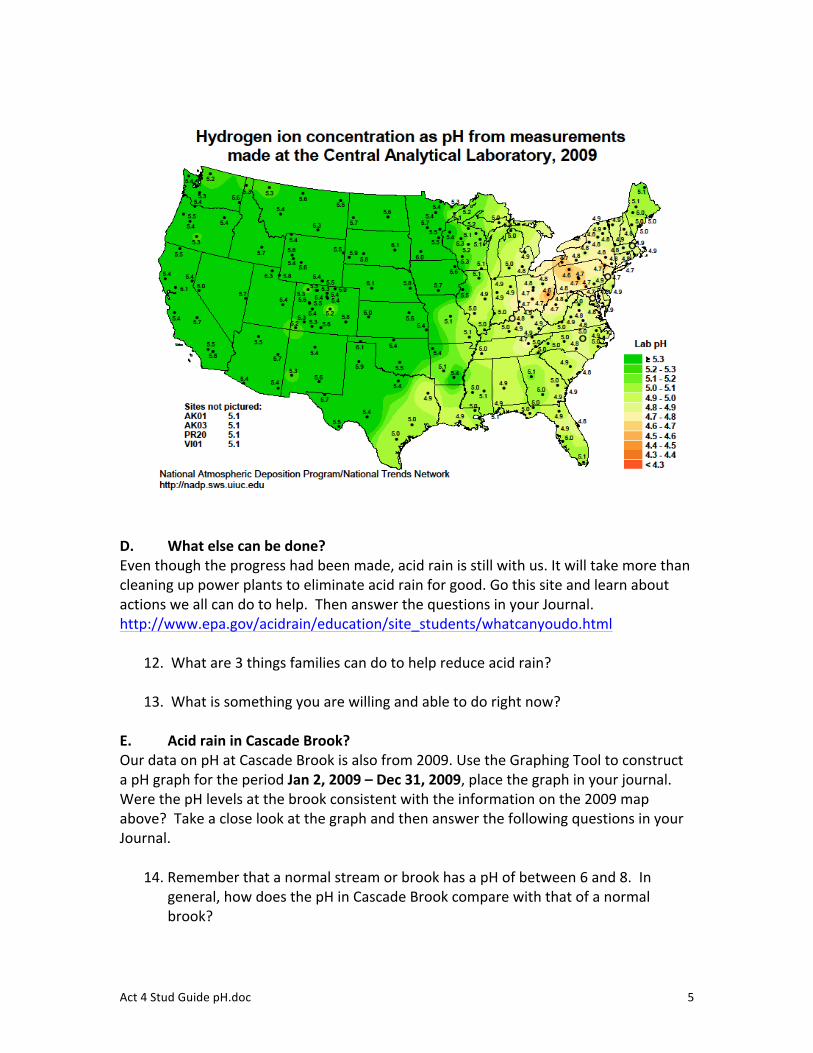
Below is a map showing the pH of rain samples from across the continental US in 1994.
Answer the questions below in your Journal.
7. What do you notice about the differences in the pH of rainfall across the country in 1994? Which part of the country had rainfall with the lowest pH?
8. What was average the pH of rainfall in New York?

Act 4 Stud Guide pH.doc 4
Fortunately several laws were passed a few years earlier which were causing power plants to reduce their emissions of sulfates and nitrous oxides. Compare the 1994 map above with a similar map produced in 2009, seen below. Answer these questions in your Journal.
9. How has the picture changed in 16 years?
10. What was the pH of rain falling in New York in 2009?
11. Compare this figure with the level defined as acid rain on the diagram you looked at earlier. Would you say that the acid rain problem in New York was over in 2009, or was New York still experiencing acid rain?
Act 4 Stud Guide pH.doc 5
D. What else can be done? Even though the progress had been made, acid rain is still with us. It will take more than cleaning up power plants to eliminate acid rain for good. Go this site and learn about actions we all can do to help. Then answer the questions in your Journal. http://www.epa.gov/acidrain/education/site_students/whatcanyoudo.html
12. What are 3 things families can do to help reduce acid rain?
13. What is something you are willing and able to do right now? E. Acid rain in Cascade Brook? Our data on pH at Cascade Brook is also from 2009. Use the Graphing Tool to construct a pH graph for the period Jan 2, 2009 – Dec 31, 2009, place the graph in your journal. Were the pH levels at the brook consistent with the information on the 2009 map above? Take a close look at the graph and then answer the following questions in your Journal.
14. Remember that a normal stream or brook has a pH of between 6 and 8. In general, how does the pH in Cascade Brook compare with that of a normal brook?

Act 4 Stud Guide pH.doc 6
15. Did the pH in Cascade Brook ever fall within the pH range for acid rain, as indicated on the chart above? On what dates did this happen?
16. Notice that on some of these dates the graph shows sharp downward spikes.
What are some possible causes of these abrupt low pH events? To find out whether downward spikes in pH are associated with rainfall, let’s look more closely at some dates they occurred. One of them was on October 29th. Make a graph with October 24th as the start date, November 3rd as the end date, and Cascade Brook pH as the parameter. Print this graph or copy it into your Journal. Now keep the dates the same and make a second graph, this time using BRF Lowlands Rainfall as the parameter. Print it or copy it below the first graph in your Journal. Compare the two graphs and then answer the question below in your Journal.
17. What do you observe about the timing of rainfall with the pH changes on October 29th? What’s a possible explanation?
Let’s look at another downward spike in pH, this time the one on August 20th. Make a graph of pH using August 15th as the start date and August 24th as the end date. Then use the same dates to make a graph of rainfall. Again either print or copy them so you can compare them easily. Answer the question below in your Journal.
18. Is there any correspondence between the drop in pH and rainfall on August 20th? What’s going on? pH in places like Cascade Brook is determined by many factors, and acid rain or surface water is just one. It is influenced by the chemical characteristics of soils and rocks and decomposing organic matter. The pH of rain may vary, and the amount of acidity washing into a stream during a storm can vary too, depending on how long it’s been since the last time it rained. Even the monitoring equipment itself could be responsible for occasional high or low readings. F. Aquatic animals and pH How does pH in Cascade Brook affect aquatic animals? The chart below shows the set of animals you and your classmates reported on, back in Activity 2. In the second column you’ll find the pH range that’s part of a healthy environment for each animal. Go back to the graph you made earlier of pH over the full year at Cascade Brook and find out how it compares with the information on this chart.

Act 4 Stud Guide pH.doc 7
Aquatic Organisms Optimum PH Range Can survive 0.5 above or below
Vertebrates Brook Trout 6.5—7.5 Black Nose Dace 6.0—8.5 Creek Chub 6.0—8.5 Northern Two-‐lined Salamander 5.5—8.5 Macroinvertebrates Stonefly larva 5.0—8.5 Mayfly larva 5.0—8.5 Caddisfly larva 5.0—8.5 Hellgrammite 4.5—8.5 Dragonfly larva 4.5—8.5 Scud (amphipod) 5.5—8.5 Whirligig beetle 4.5—8.5 Water boatman 5.0—8.5 Mosquito larva 4.5—8.5 Leech 4.5—8.5 Aquatic Worm 4.5—8.5
Answer these questions in your Journal. 19. Was the pH at Cascade Brook ever outside the optimum range for your
organism?
20. Would your study organism have experienced pH stress at any times during this period? Indicate those times on the graph using a red pencil or pen. What might it have done to try to minimize the effects of stress?
21. Compare your animal with someone else’s. Would their animal survive or
experience stress?

Student Guide Activity 5 Introduction to Dissolved Oxygen
The next parameter we will look at is Dissolved Oxygen, often abbreviated as DO. Before looking at the data, we’ll start with a review of what we mean by dissolved oxygen.
First open and print a copy of the Student Journal page and answer the questions as well as you can. It is not a test! It’s simply a chance to check your own knowledge. You’ll have a chance to correct any answers that require it in a little while.
Next open and read the Student Reading entitled Oxygen Underwater.
Finally, make any changes you’d like to the answers you gave earlier on the Student Journal page.
Act 5 Stud Guide Intro to DO.doc 1

Oxygen Underwater
What is Oxygen?Oxygen is essential to all life. All living things—plants, animals, and microorganisms—need oxygen in order to break down organic molecules (such as carbohydrates and fats) to get energy.
We call this processRespiration.
Photosynthesis is the source of the oxygen.
Only organisms that can engage in photosynthesis (such as green plants) can produce oxygen. In photosynthesis, plants use light energy to make organic molecules, which can be used as an energy source later. Oxygen is the “waste product” of photosynthesis.
Oxygen is found in many common molecules, including water (H2O) and carbon dioxide (CO2). But the form of oxygen we need constantly is pure oxygen (O2), a gas. It consists of two oxygen atoms joined together:
Oxygen in the Atmosphere and Under Water Those of us who live on land seldom need to worry about having enough oxygen. Oxygen gas makes up about 20% of the earth’s atmosphere, so unless you are climbing a high mountain or working deep in a mine, there is usually enough oxygen around you to keep you alive—although when you’re exercising strenuously, it doesn’t always feel that way!
http://www.streetsblog.org/2006/11/22/sacrificing-central-park-to-appease-the-traffic-gods/
But if you live under water, it’s a very different story. Oxygen molecules can dissolve in water, and we refer to this as “dissolved oxygen” or “DO”. But dissolved oxygen is only present in very small amounts.
Imagine just one oxygen molecule surrounded by 100,000 water molecules. This represents a DO concentration of only one part in 100,000 –or it can be expressed as 10 parts per million. Yet 10 parts per million, or 10 mg/L, is an excellent level of dissolved oxygen and is plenty for the needs of fish and other aquatic animals. With their gills and other adaptations they can easily extract such small amounts of DO from water. But when DO levels dip below 5 mg/L, many species struggle to survive. Still,
Act 5 Stud Reading Intro to DO.doc 1
CO2
O2

some organisms are able to live at lower DO levels than others, so the amount of DO in water often determines exactly which species can live in a particular aquatic environment.
How does Dissolved Oxygen get into the water?The main way water picks up dissolved oxygen is when water mixes with air. Fast currents, waterfalls, waves, bubbles, even raindrops falling through the atmosphere bring oxygen and water together.
This explains why streams, with flowing water, usually have higher levels of DO than lakes, where the water barely moves.
http://www.publicdomainpictures.net/viewimage.php?image=11863&picture=waterfall
Plants in the water are also an important source of dissolved oxygen as they carry out photosynthesis. Aquatic plants may be microscopic such as tiny plankton, or they may be macroscopic (visible without magnification). Like plants on land, they can only produce oxygen during daylight. During the night, plants use oxygen and perform respiration until the light returns the next day.
What Removes Dissolved Oxygen from Water?Dissolved oxygen is absorbed by living things as they carry out respiration. They take up oxygen and release carbon dioxide in its place.
Bacteria can rapidly deplete dissolved oxygen from waterways as they decompose organic matter. When human activities cause large amounts of organic matter to enter waterways, decomposition by bacteria can lower DO to far below the levels fish and other aquatic life need to survive. These conditions are called “anoxic” (without oxygen), and places where this occurs are often called “dead zones”. In recent years, dead zones have appeared in lakes, in estuaries and inland bays, and in coastal areas around the world.
http://sharon-taxonomy2009-p3.wikispaces.com/Bacteria
There are several other factors that can lower the ability of water to hold dissolved oxygen. We will look at some of them in later activities.
Act 5 Stud Reading Intro to DO.doc 2

Act 6 A Daily DO Cycle Stud.doc 1
A Daily DO Cycle (Student Copy)
What effect do plants have on dissolved oxygen levels? At what time of day should DO be increasing if it’s caused by the photosynthetic activity of plants? At what time will it start to drop? When would you expect DO to be at its highest and lowest?
Notice on the graph above, how dissolved oxygen begins rising early in the morning. It continues rising all day and then begins to drop by evening. This pattern often occurs as aquatic plants carry out photosynthesis in the daytime, releasing oxygen and thus driving up the dissolved oxygen content of the water. But at night there is typically a loss of dissolved oxygen since no oxygen is being added and animals and bacteria keep taking up oxygen to use for respiration. In situations where there is a lot of bacterial decomposition, such as when excess nutrients cause big blooms of short-‐lived algae (eutrophication) and the dead algae are consumed by decomposers, the dissolved oxygen levels can get so low in the middle of the night that fish and other aquatic animals cannot survive.

Act 6 Stud Guide Cascade Brook DO.doc 1
Student Guide Activity 6 Cascade Brook DO In the last activity you looked at how oxygen gets into water. Since DO is so important to aquatic life, it’s important to find out what makes its levels change. In this activity you’ll investigate some of the factors that might be responsible. What’s causing DO in Cascade Brook to change? 1. Make a graph of DO in Cascade Brook over a period of days, not months. Use at least 7
days, but no more than 14, sometime during the summer (May to mid-‐September). Copy and paste the graph into your Journal.
2. Do you think the shape of the graph shows that plants in the Brook are releasing DO as they
photosynthesize? Remember, plants begin releasing oxygen in the morning when the sun rises and they don’t stop releasing it until sunset. If you need a reminder of what that looks like, open A Daily DO Cycle Stud and compare that graph with the graph you just made.
3. If you think that plants are not causing the changes in your graph, what else might be
influencing DO in Cascade Brook? Use the Graphing Tool to compare the other Cascade Brook parameters with dissolved oxygen over the same time period. Do any of them show a positive correlation (a pattern similar to the DO graph)? Do any show a negative correlation (the opposite pattern)?
4. If you find a parameter that seems to have either a positive correlation or a negative
correlation with the DO, then use the Graphing Tool to construct a scatter plot with those two parameters. A rising regression line means that there is a positive correlation, a falling regression line means there’s negative correlation.
5. Once you find a parameter that correlates with DO, try making a scatter plot again but using
other dates. Does the correlation you found continue? What about at different times of the year?
If you don’t find a parameter that seems to be causing the patterns in your graph, try experimenting with different dates. And don’t worry if your results are different from those of other students! Remember, the natural environment is complex, with many variables. There’s seldom one simple explanation for the things we observe.
6. Write a report in your Journal describing your investigation of What Factors Influence DO in
Cascade Brook? Include the following topics in your report:
Procedure What steps did you take to carry out your investigation? (Your procedure might not be the same as someone else’s.)

Act 6 Stud Guide Cascade Brook DO.doc 2
Results What factor or factors seem to influence DO in Cascade Brook, and in what way? What evidence did you find for these conclusions (include any graphs that support your conclusions here.) Discussion What else did you notice as you investigated the graphs? Did you run into any problems—such as evidence that wasn’t consistent? Is there any other information about Cascade Brook that would have been useful to have?

Student Guide Activity 7 Dissolved Oxygen and Aquatic Animals
A. How do aquatic organisms get oxygen?You’ve seen that even in healthy environment like Cascade Brook, DO levels go up and down. How exactly do the macroinvertebrates and fish living underwater get the oxygen they need?
Aquatic insects and other invertebrates have some interesting ways of getting oxygen. Visit http://www.cals.ncsu.edu/course/ent425/tutorial/aquatic.html to see pictures of four animals, each with a special adaptation for getting or holding onto oxygen:
1. The first picture is of a mayfly larva. Notice how much of its body is covered with gills! Mayfly larvae can only live in streams with water constantly flowing past them. Why do you think they’re not able to live in places without flowing water?
2. The second is a mosquito larva. It has gills too, but it also has something the mayfly larva doesn’t have. What is it, and how does it help the mosquito larva live in places with low DO?
3. The third picture shows two diving beetles. Notice that the beetles have something attached to the backs of their wing covers. What is it and how do they use it? Do you think these diving beetles are affected by low DO? Explain.
4. The last picture shows some bloodworms, a kind of aquatic worm that lives in mud with extremely low DO. Unlike most other invertebrates they have blood with hemoglobin. Hemoglobin is what makes our own blood red. In our bodies it is hemoglobin that binds quickly with oxygen in our lungs and stores it in the bloodstream. How do you think hemoglobin helps a bloodworm live where oxygen is scarce?
If you’ve ever caught or cleaned a fish you probably know what a fish’s gills look like. Pull back one of the gill covers behind the fish’s eye and you’ll see them, deep red and packed with blood vessels. Look closer and you’ll see they look a little like rows of delicate feathers.
When water passes through the gills, dissolved oxygen from the water moves across the thin gill membrane into the blood. There it quickly attaches to hemoglobin molecules in the fish’s blood and is carried to other parts of the body.
Act 7 Stud Guide DO and Aquatic Animals.doc 1
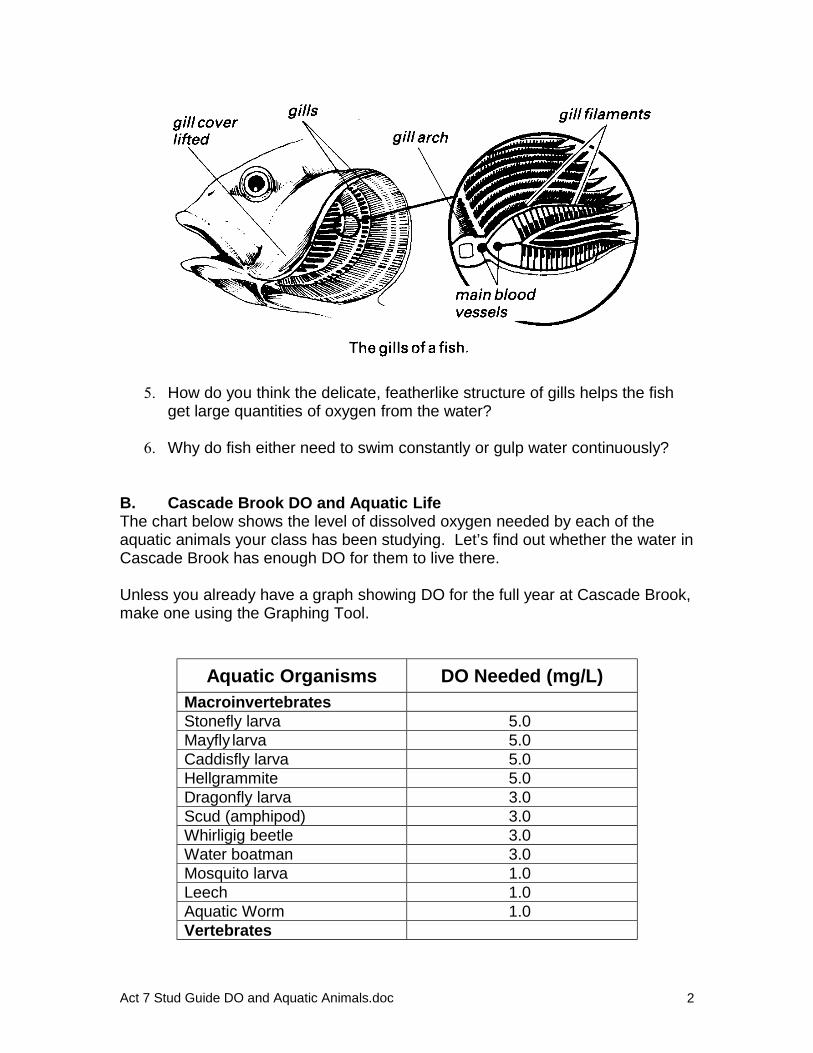
5. How do you think the delicate, featherlike structure of gills helps the fish get large quantities of oxygen from the water?
6. Why do fish either need to swim constantly or gulp water continuously?
B. Cascade Brook DO and Aquatic Life The chart below shows the level of dissolved oxygen needed by each of the aquatic animals your class has been studying. Let’s find out whether the water in Cascade Brook has enough DO for them to live there.
Unless you already have a graph showing DO for the full year at Cascade Brook, make one using the Graphing Tool.
Aquatic Organisms DO Needed (mg/L)MacroinvertebratesStonefly larva 5.0 Mayfly larva 5.0 Caddisfly larva 5.0 Hellgrammite 5.0 Dragonfly larva 3.0 Scud (amphipod) 3.0 Whirligig beetle 3.0 Water boatman 3.0 Mosquito larva 1.0 Leech 1.0 Aquatic Worm 1.0 Vertebrates
Act 7 Stud Guide DO and Aquatic Animals.doc 2
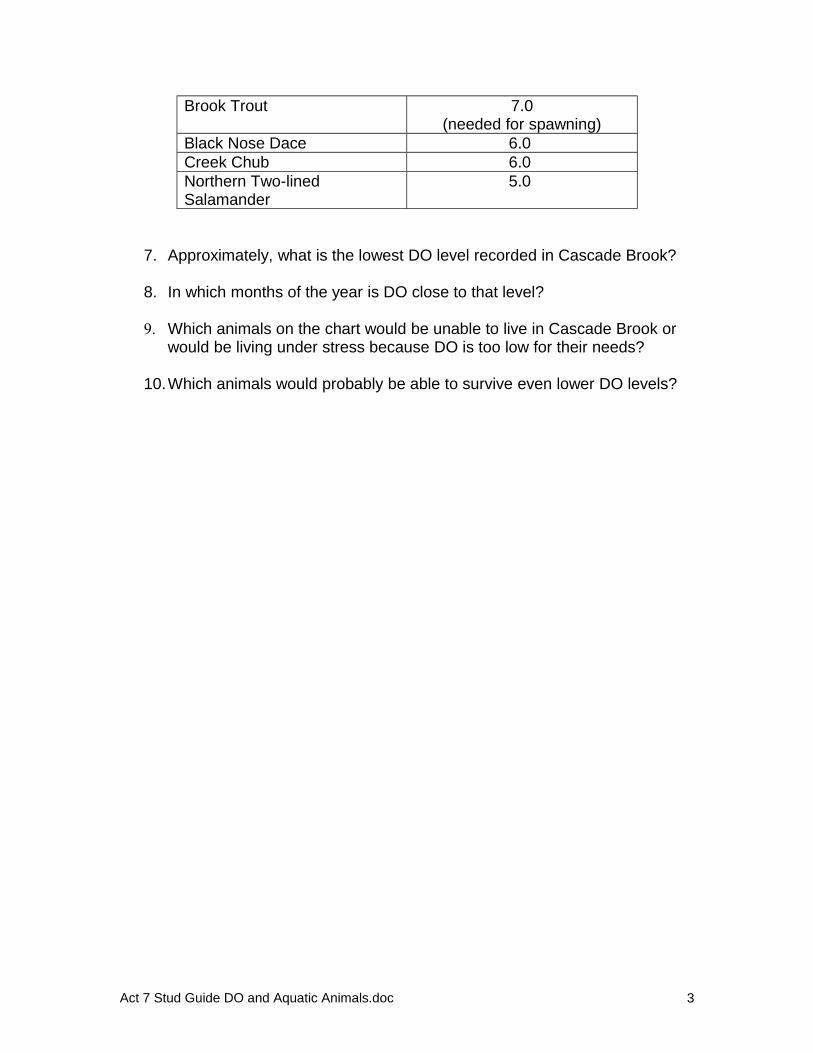
Brook Trout 7.0(needed for spawning)
Black Nose Dace 6.0 Creek Chub 6.0 Northern Two-lined Salamander
5.0
7. Approximately, what is the lowest DO level recorded in Cascade Brook?
8. In which months of the year is DO close to that level?
9. Which animals on the chart would be unable to live in Cascade Brook or would be living under stress because DO is too low for their needs?
10.Which animals would probably be able to survive even lower DO levels?
Act 7 Stud Guide DO and Aquatic Animals.doc 3

Estuary Layers: salt water and fresh water
MATERIALS:Clear plastic tray2 paper cups Table salt Teaspoon measure Food coloring Straight pin
What happens in an estuary when fresh water coming down the river meets ocean water? Try these two experiments to find out.
Experiment #11. Fill the tray with fresh water about half way up the sides and add 2
Tablespoons of salt. 2. Add fresh water and 3 drops of food coloring to the cup. Fill the cup so that
the water level is deeper than the water in the tray.3. Place the cup to one side in the tray.4. Push a pin through the side of the cup and let it stand a minute until the
water stops moving. 5. When the water is still, slowly pull the pin out.6. Watch from the side.
Record your observations.
Experiment #21. Fill the tray with fresh water about half way up the sides. 2. Add fresh water, 2 teaspoons of salt, and 3 drops of food coloring to the cup.
Fill the cup so that the water level is deeper than the water in the tray.3. Place the cup to one side in the tray.4. Push a pin through the side of the cup and let it stand a minute until the water
stops moving. 5. When the water is still, slowly pull the pin out.6. Watch from the side.
Record your observations.
Act 8 Estuary Layers.doc 1

Estuary Layers: warm water and cold water
MATERIALS:Clear plastic tray2 paper cups Ice water and warm waterFood coloring Straight pin
What happens in an estuary when warm water meets colder water? Try these two experiments to find out.
Experiment #11. Fill the tray with cold water about half way up the sides. .
2. Add warm water and 3 drops of food coloring to the cup. Fill the cup so that the water level is deeper than the water in the tray.
3. Place the cup to one side in the tray.4. Push a pin through the side of the cup and let it stand a minute until the
water stops moving. 5. When the water is still, slowly pull the pin out.6. Watch from the side.
Record your observations.
Experiment #21. Fill the tray with warm water about half way up the sides.2. Add cold water and 3 drops of food coloring to the cup. Fill the cup so that
the water level is deeper than the water in the tray.3. Place the cup to one side in the tray.4. Push a pin through the side of the cup and let it stand a minute until the water
stops moving. 5. When the water is still, slowly pull the pin out.6. Watch from the side.
Record your observations.
Act 8 Estuary Layers.doc 2
Estuary Layers: salinity and temperature layers
In an estuary, water of different salinities AND different temperatures often come together. What combination causes the water to mix together? What combination makes the water form very distinct layers that don’t mix?
Design your own experiment to find out what you can about water in estuaries. In the space below, list your materials and the steps to be followed.
Act 8 Estuary Layers.doc 3

Student Guide Activity 8 Hudson River Estuary - Salinity and Tides
Introduction You’ll use a web-based Animation to explore some dramatic changes that happen every day – in fact, twice a day – in New York City (NYC) and its surrounding waters. We’ll be focusing on the lower part of the Hudson River Estuary. An estuary is a place where fresh water and salt water mix. We’ll use the word salinity to describe this mixture more precisely as a measure of the amount of dissolved salts in water. Salinity is measured in practical salinity units (psu) and usually written just as a number without “psu”.
Explore a satellite image of salinity in the Hudson River EstuaryOpen this site:http://hudson.dl.stevens-tech.edu/maritimeforecast/maincontrol.shtml
In the blue box on the right side of the screen, enter the following:Region: NY/NJ Harbor EstuaryParameter: Surface SalinitySelect Station: Leave as isUnits: psuDate: 2009 July 17Time: 00:00
You’ll see a satellite image of the New York-New Jersey-Long Island Sound area. Take a few minutes to orient yourself to familiar landmarks like Central Park (in the middle of Manhattan), Brooklyn and the Bronx. Then focus on the major bodies of water: the Atlantic Ocean, the Hudson River, and Long Island Sound. Only the western end of Long Island Sound is visible in the area shown on the Animation. Examine the map of Long Island Sound shown below. Notice that the Sound is an arm of the Atlantic Ocean and that its water flows through the East River into New York Harbor.
Act 8 Stud Guide Hudson River Estuary.doc 1

Source: http://en.wikipedia.org/wiki/File:Long_Island_Road_Map.gif
Don’t start the Animation yet. Notice the vertical colored salinity bar on the left, showing salinities from 15 (purple) to 30 (deep red). Complete Observations 1-3, below, on the Journal page now.
1. Describe the areas of highest salinity (26 – 30) on the satellite photo. You can refer to any place names you know or use place names from the blue map above.
2. Where are the areas of lowest salinity (15 – 18)?
3. Compare the surface salinities of the Atlantic Ocean and the small part of Long Island Sound visible on the satellite image. What are some possible reasons for any differences you notice?
Start the Surface Salinity Animation Click on the small red arrow in the blue box. Watch the animation for some time. You can stop the animation at any time by clicking on the red square button and can re-start it by clicking the arrow again.
Watch the pulsing colors changing over time. As the tide comes in from the Atlantic Ocean and from Long Island Sound, high salinity ocean water (red in the animation) moves towards NYC. As the tide goes out, that high salinity ocean water retreats. Each day has two advancing tides and two retreating tides. Watch the animation for a few minutes and see if you can spot these tidal changes.
Act 8 Stud Guide Hudson River Estuary.doc 2

Focus on the Hudson River and watch the salinity of its surface waters change. Then do the same for the East River (on the opposite side of Manhattan). Record observations 4 and 5, below, in your Journal.
4. Describe the changes in surface salinity you saw in the Hudson River.
5. Describe the changes in surface salinity you saw in the East River (on the opposite side of Manhattan).
Change the parameter from Surface Salinity to Bottom Salinity, keep everything else the same but don’t start the Animation yet. First record observations 6 and 7 in your Journal.
6. Before starting the animation, describe the bottom salinity of the Atlantic Ocean near New York Harbor. Compare your results with the answer to #3 above.
7. Before starting the animation, describe the bottom salinity of Long Island Sound where it enters NYC. Compare your results with the answer to #3 above.
Now start the Animation and observe it for several minutes. Then record observations 8 – 12 in your Journal.
8. Describe the bottom salinity changes you observe in NY Harbor
9. How do those changes compare with the surface salinities you examined earlier?
10. Focus on the Hudson River and describe the changes in bottom salinity you see.
11. How do those changes compare with the surface salinity changes in the Hudson River that you observed earlier?
12. How would you explain the differences you observed between surface salinity and bottom salinity in both places?
Act 8 Stud Guide Hudson River Estuary.doc 3

Student Guide Activity 9 Hudson River Fish Life Cycles and Habitat
IntroductionIn the previous activity, you looked at the constantly changing salinity in the Hudson River Estuary. Can fish adapt to such conditions? Are there some fish that simply cannot survive in such conditions? Do they need different environments at different stages of their lives? In this activity, you’ll learn about several fish in the Estuary and River, and try to find answers to these questions.
Fish in the Hudson RiverThere are more than 210 species of fish living in the Hudson River, each having a wide variety of requirements. Some must be in cold water while others have a wide temperature tolerance. Some are bottom feeders while others feed in the water column between the surface and bottom. Some are native species while others have been introduced and have become invasive (they compete with local species). Almost all have specific requirements for fresh and /or salt water.
Below is a typical fish life cycle, from egg to hatchling (larva) to juvenile to adult and then to spawning (depositing eggs and sperm in water). Some fish need fresh river water for all these life stages while others require salt water in the Atlantic Ocean. Many need the brackish water (a mixture of fresh and salt water) found in the Estuary. Some fish need one type of water for certain life stages and a different type of water for others.
Source: http://www.megahowto.com/how-to-understand-the-development-of-the-fryA. Research Project - Fish Habitat Requirements at Different Life Stages
Act 9 Stud Guide Hudson River Fish Life Cycles.doc 1

Below is a list of thirteen fish commonly found in the Hudson River. You and your classmates will use the Resources listed below to learn about the life stages of these fish and which environments they need – river, estuary or ocean - for each stage. Use your Journal to describe your findings.
You may find that some sources give specific salinity ranges (15-20, for example) while others just say “river” or “estuary.” Write down whichever is offered and use the chart below to help you enter the details in your report:
Salinity ChartType of water
Where found Salinity
Fresh water Rivers, lakes, ponds
0 - .5
Brackish Estuary .5 - 30Salt Ocean 30 - 50
Your teacher will help you select which fish to research so that the class will eventually have complete information on all the fish on the list.
American eelAmerican shadAtlantic sturgeonBlueback herringBluefishCarpChannel catfish
MummichogShortnose sturgeonSpottail shinerStriped bassWhite catfishYellow perch
Your class will decide how to present the results - as written or oral reports, as a PowerPoint presentation, in a group chart or in some other way that everyone agrees upon. When the chart is complete, decide whether each of the fishes are anadromous (migrating from salt water to fresh water to spawn) or catadromous (migrating from fresh water to salt water to spawn) or neither.
B. Which Fish Can Live Near the Hudson River George Washington Bridge site?The Animation gave you a rapid look at the river’s changing salinity but did not give precise data that would enable you to know which fish can survive in its waters. To figure that out, you’ll examine the salinity graph of data collected during 2009 and try to match the fish requirements found above to that data.
Use the Graphing Tool to select Hudson River salinity as the parameter to be graphed, for the dates July 17-24, 2009. Then use the graph, together with the chart your class developed, to find which fish might be found in the waters near this site. Record the names and life cycle stages of those fish below the graph.Resources
Act 9 Stud Guide Hudson River Fish Life Cycles.doc 2
American Eel http://209.191.9.69/Education/Lesson_Plans/Key/American_Eel.pdfhttp://www.fws.gov/northeast/newsroom/facts.html5-minute videohttp://www.dec.ny.gov/dectv/dectv76.html
American Shadhttp://www.dec.ny.gov/lands/66628.htmlhttp://www.chesapeakebay.net/bfg_american_shad.aspxhttp://www.fish.state.pa.us/anglerboater/2005/04julaug/play2cycle.pdf
Atlantic Sturgeonhttp://en.wikipedia.org/wiki/Atlantic_sturgeonhttp://www.dec.ny.gov/lands/5084.html http://www.dec.ny.gov/animals/7025.html http://www.dec.ny.gov/lands/66626.html
Blue Back Herring http://www.dec.ny.gov/animals/7043.htmlhttp://fishing.about.com/od/fishfacts/a/bluebackherring.htmhttp://www.dnr.state.md.us/streams/pdfs/BBHFactSheet.pdf
Bluefishhttp://www.edc.uri.edu/restoration/html/gallery/fish/blue.htmhttp://en.wikipedia.org/wiki/Bluefishhttp://portal.ncdenr.org/web/mf/bluefish
Carphttp://www.in.gov/dnr/files/COMMON_CARP.pdfhttp://hudson-river-fishing.com/tag/hudson-river-carphttp://www.ehow.com/how_2077042_identify-freshwater-carp.html
Channel catfishhttp://www.dec.ny.gov/animals/7046.htmlhttp://www.dec.ny.gov/animals/52882.htmlhttp://dnr.wi.gov/fish/pubs/catfish.pdf
Mummichoghttp://pond.dnr.cornell.edu/nyfish/Cyprinodontidae/mummichog.html
Act 9 Stud Guide Hudson River Fish Life Cycles.doc 3

http://www.ceoe.udel.edu/kiosk/mummichog.htmlhttp://www.ehow.com/about_5336848_mummichog-life-cycle.html
Shortnose sturgeonhttp://www.conservewildlifenj.org/species/fieldguide/view/Acipenser%20brevirostrum/http://www.dec.ny.gov/animals/26012.htmlhttp://en.wikipedia.org/wiki/Shortnose_sturgeon
Spottail Shinerhttp://www.dec.ny.gov/animals/52663.htmlhttp://www.oars3rivers.org/river/wildlife/fish/description/spottailshiner
Striped basshttp://www.dec.ny.gov/lands/66623.htmlhttp://www.dec.ny.gov/animals/7018.htmlhttp://www.arkansasstripers.com/striped-bass-life-cycle.htm
Three-spined sticklebackhttp://www.gma.org/fogm/Gasterosteus_aculeatus.htmhttp://www.ehow.com/about_5344206_stickleback-life-cycle.htmlhttp://en.wikipedia.org/wiki/Three-spined_stickleback
White catfish http://www.dec.ny.gov/animals/7046.htmlhttp://www.dnr.state.md.us/fisheries/fishfacts/whitecatfish.asphttp://www.catfishangling.com/white-catfish-facts/
Yellow Perchhttp://www.ontariofishspecies.com/perch.htmlhttp://www.utahoutdoors.com/pages/perchfacts.htmhttp://www.gotmyfishon.com/washington/fish/yellow-perch#size
Act 9 Stud Guide Hudson River Fish Life Cycles.doc 4

Pollution
Sourcesof Nitrogen and Phosphorus Pollution
1. Agricultural tile drainge
2.Agricultural runoff
3. Livestock in streams
4. Onsite wastewater systems (e.g., septic systems)
5. Pet waste
6. Garbage disposals
7. Fertilizer usage
8. Electricity usage
9. Detergents and soaps
10.Car washing
11.Municipal wastewater treatment plants
12.Boating
13.Electricity Generation
1
3
4
5
7
6
8 9
1112
13
2
10

Student Guide Activity 10 DO: How Low Will it Go?
In previous activities you learned that DO is extremely important to aquatic life and that DO levels are very sensitive to other environmental conditions. One of these is eutrophication, a process whereby bodies of water receive an excess of nutrients, which causes excessive plant growth.
You’ll use an interactive map to find out how places around the world and in the Hudson River Estuary are affected by eutrophication. Then you’ll graph DO data from the Hudson River George Washington Bridge (GWBr) monitoring site to examine conditions there.
A. Interactive Map of EutrophicationThe on-line map you’ll use shows locations around the world with low DO levels caused by eutrophication. Each place is marked on the map by a colored dot. The color of the dot indicates how each place has been classified.
• Yellow Dot = Eutrophic —places with high nutrient levels and abnormal algae growth. Still, DO levels there aren’t low enough to label them “Hypoxic.”
• Red Dot = Hypoxic —places with extremely low dissolved oxygen due to eutrophication.
• Blue Dot = Improved —places that were hypoxic at one time but are now improving, usually because of some environmental action.
The Interactive Map of Eutrophication has some of the same navigation tools you used in Google Earth. Here is the website: http://www.wri.org/project/eutrophication/map.
Move slowly around the world, noticing the parts of the world that seem to have the most colored dots. Click on one of the dots to open an information frame where you’ll find a photo of the location and a summary of the problem there.
Find your way to the Hudson River. The alphabetical scroll bar on the right is an easy way to get there. Just scroll most of the way down until you get to US locations, then continue scrolling down by state until you reach US-New York-Hudson River. Click on that location. You’ll zoom in and an information frame opens. You can close the information frame to see where the marker is located, and then click on the marker again to bring back the information frame. The Hudson River marker is high in the watershed, but the information given is for the entire Hudson River.
On this map you may disagree with where some of the some markers have been placed. This sometimes happens when people send GPS coordinates to the website that aren’t exact.
Act 10 Stud Guide DO How Low Will it Go.doc 1

In addition to the Hudson River marker, you will also visit the Narrows, Harlem River, and East River. Use the information at these locations to answer the following questions in your Journal:
Hudson River 1. The Hudson River has been labeled as improved on this map. What change led to an improvement in water quality in the Hudson River?
2. Does the Hudson River still have a problem with eutrophication? Explain.
The Narrows 3. Water moves back and forth through the Narrows, as you saw in the tidal Animation. In places like this, algae and plants often get washed away before they have time to cause problems. Yet water in the Narrows gets hypoxic every summer. What source of organic material is making this water hypoxic?
Harlem River 4. What two rivers does the Harlem River connect with?
5. What classification was the Harlem River given in the Interactive?
To answer the next question, close the information frame and move the map slightly so you can see the very large bay to the east, Long Island Sound. (On the map, it’s to your right.) Long Island Sound is very often hypoxic and sometimes even anoxic (DO level of zero, or a level so low that no life form requiring oxygen can survive).
6. Do you think the Harlem River is ever affected by water conditions in Long Island Sound? Explain your reasoning.
East River 7. When did the East River first start having very low DO levels?
8. The East River was once very polluted. How is it classified now? How did this change occur?
B. Hudson River DO GraphWhat will a graph of DO from the Hudson River (GWBr) monitoring site show? Find out by using the Graphing Tool to make a graph of DO in the Hudson River. Data from this monitoring site is only available from June through December, so select 2009-06-01 as the start date for your graph, select 2009-12-31 as the end date, and select Hudson River DO as your parameter.
You’ll notice several places where the graph seems to drop to zero. Dissolved oxygen didn’t really drop to zero at those times; these are actually data gaps,
Act 10 Stud Guide DO How Low Will it Go.doc 2

times that no measurement was taken. The recorder entered zero instead. Just ignore them.
Take a close look at the graph and answer questions 9 and 10 in your Journal.9. Did DO at George Washington Bridge ever drop below 3 mg/L? (You’ll probably need to run the cursor over the graph, looking at the numbers that appear in the small box above it). Did DO at this site ever drop below 4 mg/L?
10. What was the lowest DO level recorded at George Washington Bridge, and what date was it recorded on?
Now copy the graph of George Washington Bridge DO in the space below question 12 in your Journal.
Next, make a graph of Cascade Br DO using the same dates you used for GW Bridge DO. (Keep the same start and end dates but use Cascade Br DO as the series.) Then answer questions 11 and 12 in your Journal.
11. Did DO at Cascade Brook ever drop below 4 mg/L?
12. What was the lowest DO level recorded at Cascade Brook, and what date was it recorded on?
Copy the graph of Cascade Br DO into your Journal, directly below your graph of Hudson River and use the two graphs to answer these questions.
13. Look at the overall patterns you see on the DO graphs of Hudson River and Cascade Brook. What similarities and what differences do you notice between them?
14. Based on those observations, what are some factors (besides eutrophication in the Hudson River) that you think might also be influencing DO at that site?
Act 10 Stud Guide DO How Low Will it Go.doc 3
Student Guide Activity 11 Harlem River – Student Monitoring and Data
A. Explore the Harlem River The Harlem River separates Manhattan from the Bronx. It is not a true river since it has no source and does not always flow into another body of water. It really is a “strait” or passageway, about 8 miles long, between the Hudson River and the East River.
Open Google Earth and re-visit the Harlem River monitoring site you marked at the beginning of this study. Explore the River from the southern to the northern end. Then return to the monitoring site and zoom in fairly close.
B. The Frederick Douglass Academy (FDA) Student Monitoring ProjectThis monitoring site is run by high school students who attend the Frederick Douglass Academy nearby. The students have been monitoring DO, salinity and temperature since March 2009. Their equipment consists of several probes placed in a piece of PVC pipe suspended 20 feet below the surface. The probes record water quality data and wireless technology sends the data to a computer onshore.
Watch this 3- minute video to learn about the project. It shows the students going under the freeway to collect data from the sensor attached to a bridge piling. http://www.ny1.com/content/special_reports/connect_a_million_minds/124107/students-use-harlem-river-as-source-of-scientific-exploration/
C. View Harlem River in Salinity AnimationStart by finding out how water moves through the Harlem River and where the water is coming from. To do this you’ll use the salinity animation you used in Activity 8.
Open this site: http://hudson.dl.stevens-tech.edu/maritimeforecast/maincontrol.shtml
In the blue box on the right of the screen, enter the following:Region: NY/NJ Harbor EstuaryParameter: Surface SalinityTime Series: IgnoreUnits: psu Date: 2009 June 18Time: 00:00
Don’t start the animation yet; take a few minutes to reorient yourself to the map
Act 11 Stud Guide Harlem River Stud Monitoring.doc 1

and familiar landmarks and to locate the Harlem River.
1. Before you start the Animation compare the surface salinity of the Harlem River with surface salinity of the Hudson River, on the other side of Manhattan. What do you notice?
Now start the animation and watch for a while. 2. Which river seems to have a higher surface salinity – Harlem or Hudson?
3. Now switch the parameter to bottom salinity. Does this change your answer to the last question?
4. What’s a possible explanation for the differences in salinity between the Harlem River and the Hudson River?
Now watch the movement of salt water as it moves back and forth in both the Hudson River and the Harlem River.
5. Does ocean water flow into the Harlem River and the Hudson River at the same time?
6. What do you think is happening to water in the Harlem River when salt water moves up into the Hudson River?
7. Do you think that water in the Harlem River always flows in the same direction? Explain your reasoning.
C. Do other parameters in the Harlem River change along with salinity? We know that as the tides change, the Harlem River sometimes receives very salty water coming from the ocean and at other times, it gets water with far less salt from the Hudson River. Is the water from these two sources different in other ways? Making and comparing several Harlem River graphs will help answer this question.
Use the Graphing Tool to make a graph of Harlem River Salinity. Label your graph: Harlem River Salinity, choose Harlem River Salinity as the series and select 2009-06-18 and 2009-06-25 as start and end dates.
Copy and paste the Harlem River Salinity graph into your Journal. Then return to the Graphing Tool and make a graph of Harlem River Water Temperature,
Act 11 Stud Guide Harlem River Stud Monitoring.doc 2
keeping the dates the same but changing the parameter from Harlem River Salinity to Harlem River Temp.
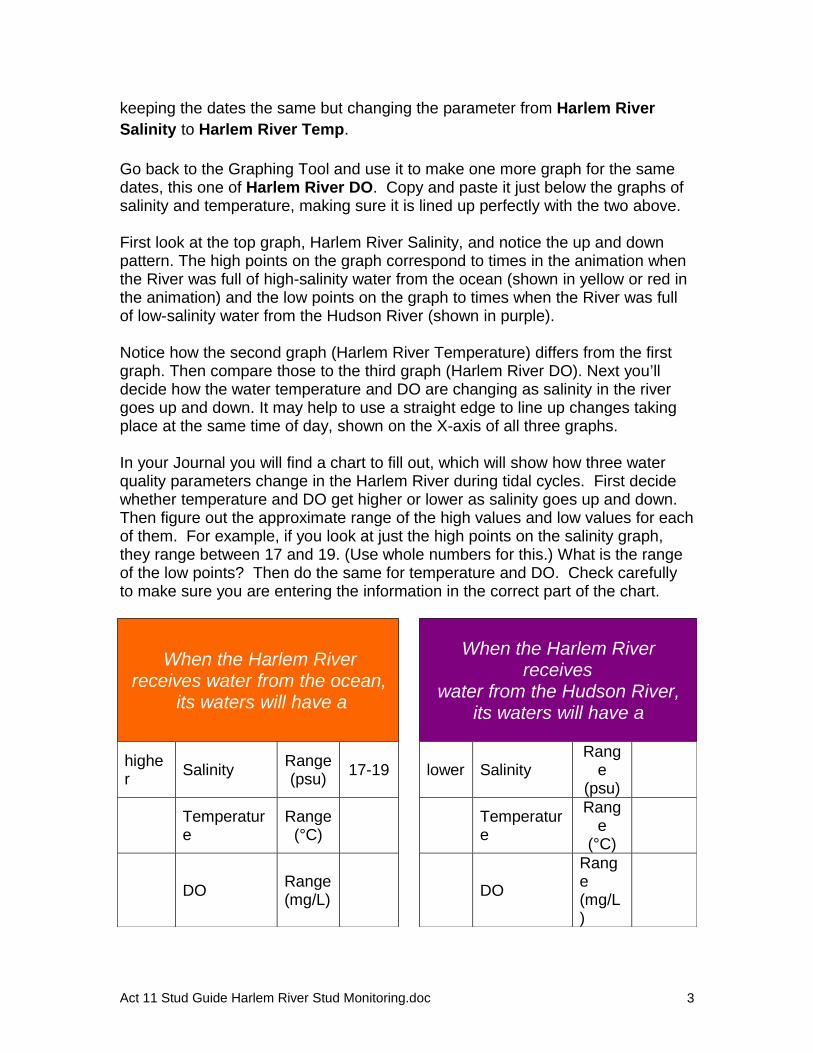
Go back to the Graphing Tool and use it to make one more graph for the same dates, this one of Harlem River DO. Copy and paste it just below the graphs of salinity and temperature, making sure it is lined up perfectly with the two above.
First look at the top graph, Harlem River Salinity, and notice the up and down pattern. The high points on the graph correspond to times in the animation when the River was full of high-salinity water from the ocean (shown in yellow or red in the animation) and the low points on the graph to times when the River was full of low-salinity water from the Hudson River (shown in purple).
Notice how the second graph (Harlem River Temperature) differs from the first graph. Then compare those to the third graph (Harlem River DO). Next you’ll decide how the water temperature and DO are changing as salinity in the river goes up and down. It may help to use a straight edge to line up changes taking place at the same time of day, shown on the X-axis of all three graphs.
In your Journal you will find a chart to fill out, which will show how three water quality parameters change in the Harlem River during tidal cycles. First decide whether temperature and DO get higher or lower as salinity goes up and down. Then figure out the approximate range of the high values and low values for each of them. For example, if you look at just the high points on the salinity graph, they range between 17 and 19. (Use whole numbers for this.) What is the range of the low points? Then do the same for temperature and DO. Check carefully to make sure you are entering the information in the correct part of the chart.
Act 11 Stud Guide Harlem River Stud Monitoring.doc
When the Harlem River receives water from the ocean,
its waters will have a
When the Harlem River receives
water from the Hudson River,its waters will have a
higher
Salinity Range (psu)
17-19 lower SalinityRang
e (psu)
Temperature
Range(°C)
Temperature
Range
(°C)
DORange (mg/L)
DO
Range (mg/L)
3

Look at these results, think about the questions below and then record your responses in your Journal:
8. Did these results surprise you? (Did you see anything that seems inconsistent with what you have seen in other sites?) If so, explain your thinking.
If these results didn’t surprise you, why do they make sense to you? Explain why you think these results are reasonable to expect.
E. Hypoxia in the Harlem River? Recall from Activity 10 that hypoxia conditions (extremely low DO) are most common in late summer. Find out whether DO in the Harlem River ever dropped into the hypoxia range, which is 1 to 3 mg/L. Use the Graphing Tool to examine Harlem River DO during the months of July and August.
If you find hypoxia, make a graph of the period in which it occurred, and copy it into your Journal. Then answer the questions below in your Journal.
9. On what dates—or range of dates—was water in the Harlem River hypoxic?
10.What’s a likely reason the Harlem River has problems with low DO levels?
Act 11 Stud Guide Harlem River Stud Monitoring.doc 4

Student Guide Activity 12 Students’ Research Questions
It may surprise you to learn that many scientists ask questions, conduct investigations and find answers without ever collecting the data themselves. They do it by exploring data that already exists. With the experiences you have gained, you can do this, too.
You’ll start by deciding on a research question. Your question needs to be one you can answer using the data available on the Graphing Tool. Here is a summary of the data you can work with:
Cascade Brook, Jan . 2, 2009 - Dec. 31 , 20 09 Cascade Brook Temp (°Celsius)Cascade Brook DO (mg/L)Cascade Brook pH (pH)BRF Lowlands Temp (°Celsius)BRF Lowlands Rainfall (mm)
Hudson River (GWBr) , June 1, 2009 - Dec. 3, 2009 Hudson River Temp (°Celsius)Hudson River DO (mg/L)Hudson River Salinity (psu)
Harlem River, June 4 , 2009 - Sept . 17, 2009 Harlem River Temp (°Celsius)Harlem River DO (mg/L)Harlem River Salinity (psu)
Open your Journal to start keeping track of your work by answering the questions below:
1. What is your research question, or what information would you like to try to find out?
2. What’s the first thing you’ll do to try to answer the question?
3. As you conduct your investigation, record the steps you take as you take them – not afterwards. List and describe each step below. If you make any changes in your investigation, that’s fine – but explain why you made those changes.
4. When you finish your investigation answer the questions below. They will help you record both your results and your analysis:
a. Were you able to answer your original question? If so, how would you answer it? If you weren’t able to answer the original question, explain what you found out instead.
Act 12 Stud Guide Students Research Questions.doc 1

b. What evidence did you find in the data to help you with your investigation? Paste copies here of any graphs that gave you information related to your question.
c. How would you explain what you found out? (If your results make sense to you, explain why they do. If they were a surprise, what are some possible explanations for what you observed?)
d. Is there any other kind of data that would help you know whether your explanation is valid? If so, what kind of data would that be?
e. What questions do you still have? These might be questions that remain unanswered or they might be new questions.
Act 12 Stud Guide Students Research Questions.doc 2


![See Hudson Run, Run Hudson, Run [SELF 2010]](https://img.dokumen.tips/doc/110x75/55834740d8b42afc7d8b5130/see-hudson-run-run-hudson-run-self-2010.jpg)