Embed Size (px)
Citation preview

Student Choice & Course Enrollment
PlanningBob Cox
University of California, Los Angeles
California Association for Institutional ResearchNovember 22, 2013 Napa

A Step Back & A Step Up Today UCLA’s Future Course Planner (FCP) survey tool
Designed to help with course enrollment planning Can also be ‘flipped’ to address a perennial question: Are students are getting the classes they need and want?
How FCP supports campus planning and operations Limited uses in rich local contexts (identifying anomalies)
What types of analyses can be done when ‘flipped’ Facing complexity: More questions than definitive answers
But why is this work needed; why is it being done? The forward-looking new main line of IR work at UCLA

The New Main Line at UCLA Rapid, Progressive & Permanent UG Enrollment Growth
IR Program Focus Shifts from Macro- to Micro-Analysis
Supporting Departments in Course Enrollment Planning Supporting Deans in Coordinating Budget Operations Tracing Undergraduate Pathways Course by Course
Maintaining Access and High Quality in UG Programs Supporting Campus Goals for Enrollment Management

Supporting Student Choice:Access to Programs and Courses
Offering orderly access to chosen majors & minors Enabling students to make orderly progress in same Providing courses needed to support student progress Providing guidance needed to make best use of options
Maintaining expected quality in instructional programs Maintaining or improving: … Graduation Rates … Time to Degree …. Student Satisfaction with Educational Experience

Supporting Campus Goalsfor Enrollment Management
Operating effective and efficient instructional programs
Managing access to the university and its programs
Offering the right number of seats in courses … in the right courses … in the right season … at the right time and place … and being able to account for the costs of doing so

Third-Week Seats Seats Seats % Headcount Seats Seats Seats Sections Seats Seats SeatsFinals Offered Filled Open Open Enrollment Offered Filled Open Offered Offered Filled Open
Fall 2007 98,220 86,591 11,629 11.8 25,928 3.79 3.34 0.45 1,681 58.4 51.5 6.9 Fall 2008 98,009 88,609 9,400 9.6 26,536 3.69 3.34 0.35 1,642 59.7 54.0 5.7 Fall 2009 98,558 89,701 8,857 9.0 26,687 3.69 3.36 0.33 1,586 62.1 56.6 5.6 Fall 2010 97,920 87,812 10,108 10.3 26,162 3.74 3.36 0.38 1,548 63.3 56.7 6.5 Fall 2011 105,730 92,420 13,310 12.6 27,199 3.89 3.40 0.49 1,606 65.8 57.5 8.3 Fall 2012 109,915 95,613 14,302 13.0 27,941 3.93 3.42 0.51 1,641 67.0 58.3 8.7
Fall 2013 113,842 97,861 15,981 14.0 28,667 3.97 3.41 0.56 1,681 67.7 58.2 9.5 vs. Fall 2012 3,927 2,248 1,679 726 40
Third-Week Seats Seats Seats % Headcount Seats Seats Seats Sections Seats Seats Seats Seats SectionsFinals Offered Filled Open Open Enrollment Offered Filled Open Offered Offered Filled Open Filled Offered
Fall 2007 57,355 52,497 4,858 8.5 25,928 2.21 2.02 0.19 2,334 24.6 22.5 2.1 60.6 1.39 Fall 2008 58,381 54,635 3,746 6.4 26,536 2.20 2.06 0.14 2,352 24.8 23.2 1.6 61.7 1.43 Fall 2009 59,837 56,268 3,569 6.0 26,687 2.24 2.11 0.13 2,315 25.8 24.3 1.5 62.7 1.46 Fall 2010 59,920 56,150 3,770 6.3 26,162 2.29 2.15 0.14 2,284 26.2 24.6 1.7 63.9 1.48 Fall 2011 66,159 59,673 6,486 9.8 27,199 2.43 2.19 0.24 2,504 26.4 23.8 2.6 64.6 1.56 Fall 2012 71,135 64,553 6,582 9.3 27,941 2.55 2.31 0.24 2,656 26.8 24.3 2.5 67.5 1.62
Fall 2013 72,846 64,909 7,937 10.9 28,667 2.54 2.26 0.28 2,749 26.5 23.6 2.9 66.3 1.64
vs. Fall 2012 1,711 356 1,355 726 93
Excluded from the framework of this analysis are courses that operate without fixed schedules or definite enrollment capacities, such as independent study courses, SRP tutorials, Honors Contract courses, off-campus courses, and all courses numbered 195 and above. ROTC courses and undergraduate-level coursesdesigned for graduate students are also excluded. The framework does include several courses featuring online operations in primary classes and/or secondary sections.
Sections, Seats Offered, and Seats Filled in Undergraduate CoursesThird-Week Finals Fall 2007 to Fall 2013
Primary Class Sections Average Seats per Capita Average Seats per Section
Secondary Sections Average Seats per Capita Average Seats per Section


Structuring Student Choice:A Host of Mechanisms for Guidance and Control
• Admissions Programming – Pathways for Freshmen and Transfers• New Student Orientation Counseling• Counseling and Advising throughout the Undergraduate Career• General Degree Requirements: Math, Writing, General Education• Course Unit Values and ‘Expected Cumulative Progress’• Courses as Prerequisites for Other Courses• Major Program Requisite and Prerequisite Courses• Minor Programs, Honors Programs, Other Special Tracks• Courses Cross-Listed• Upper Division Distribution Requirements (‘Allied Fields’, etc.)• Residency Regulations Limiting Extension & CCC Exposure• What is offered: Course Frequency in Regular and Summer Terms• What is offered: Course Footprints in Time and Space, Coordination

N 4 Yr 4 Yr Enrolled Enrolled Target Target vs. Target vs. Est Admit % NRT Est NRTMaj Ad Rate Rg Rate 4 Yr Avg Fall 2012 Fall 2013 4 Yr Avg Fall 2012 Fall 2013 4 Yr Avg Fall 2013
AFRO-AMERICAN ST 1 51 75 18 20 20 2 - 27 - - ANTHROPOLOGY 2 60 67 216 236 205 (11) (31) 308 5 11 ASIAN AMERICAN ST 1 44 63 15 16 15 1 (1) 24 29 4 CHICANA & CHICANO ST 1 55 72 23 24 25 2 1 35 1 - COMMUNICATION ST 1 12 67 76 91 80 5 (11) 119 26 21 ECONOMICS 3 16 51 237 246 195 (42) (51) 392 42 82 GENDER ST 1 55 72 60 56 55 (5) (1) 76 7 4 GEOGRAPHY 2 62 59 49 52 50 1 (2) 84 11 6 HISTORY 1 44 66 165 150 150 (15) - 227 3 4 POLITICAL SCI 1 35 56 220 178 175 (45) (3) 310 6 11 SOCIOLOGY 1 22 65 102 123 125 23 2 192 14 17
HUMANITIES 47 52 57 644 636 600 (44) (36) 1,043 10 56 LIFE SCIENCES 12 25 66 550 506 465 (85) (41) 711 10 45 PHYSICAL SCIENCES 22 47 52 462 509 460 (2) (49) 881 28 126 SOCIAL SCIENCES 16 27 61 1,184 1,200 1,100 (84) (100) 1,801 15 160 INTERNATIONAL INST 6 32 51 81 77 75 (6) (2) 149 21 17
COLLEGE + INTL 104 33 59 2,930 2,933 2,705 (225) (228) 4,591 15 405
ENGINEERING 9 20 40 146 131 85 (61) (46) 217 32 27 ARTS 7 11 75 65 77 75 10 (2) 106 8 4 TFT 2 6 80 35 21 25 (10) 4 32 15 4 NURSING 1 9 84 20 20 10 (10) (10) 10 7 -
UCLA 123 29 58 3,195 3,182 2,900 (295) (282) 4,956 16 440
Setting Fall 2013 Transfer Enrollment Targets

secondary roomsubject course short title GE sections cap NSTP Other Total Offered Filled Open
HIST 0001A WESTERN CIVILIZATN Y 15 290 60 300 360 300 249 51 HIST 0001C WESTERN CIVILIZATN Y 12 290 60 180 240 240 229 11 HIST 0003A INTRO HIST SCIENCE Y 6 229 20 160 180 120 115 5 HIST 0005 HOLOCAUST 4 144 40 200 240 80 60 20 HIST 0008A COLONIAL LATIN AMER Y 12 419 40 260 300 240 228 12 HIST 0009D NEAR & MIDDLE EAST Y 6 181 25 125 150 150 73 77 HIST 0010A M AFRICA TO 1800 Y 3 129 40 60 100 31 31 - HIST 0011A HIST-CHINA TO 1000 Y 3 98 20 100 120 60 58 2 HIST 0013A US&COLONIAL ORIGINS Y 6 115 40 200 240 120 89 31 HIST 0020 WRLD HIST TO AD 600 Y 19 406 20 300 320 380 380 - SOCIOL 0001 INTRODUCTORY SOCIOL Y 15 406 150 150 300 300 297 3 SOCIOL 0001 INTRODUCTORY SOCIOL Y 15 320 150 150 300 300 282 18 SOCIOL 0020 INTRO SOC RSCH MTHD 6 177 75 75 150 150 150 - SOCIOL 0111 SOCIAL NETWORKS 3 141 35 40 75 90 90 - SOCIOL 0124A M CONVRSTNL STRCTRS 1 6 129 50 70 120 121 121 - SOCIOL 0133 COLLECTIVE BEHAVIOR 6 157 50 100 150 155 155 - SOCIOL 0151 COMPRTV IMMIGRATION 6 141 50 100 150 150 145 5 SOCIOL 0173 ECONOMY AND SOCIETY 6 188 50 100 150 150 137 13
CAMPUS TOTALS 1,360 19,310 23,756 43,066 42,130 38,739 3,391
Initial Seat Planning Third Week Seats
Primary Classes Served by New Student and Transition Programs for Fall 2013 Initial Seat Planning Targets Compared to Third Week Seats Offered, Filled, and Open

Step Back Four Years

Shaken & StirredDepressed Conditions and
New Engagements forInstitutional Research
Bob Cox – UCLAwith special guest
Van Novack – Cal State Long BeachCalifornia Association for Institutional Research
November 20, 2009 SacramentoFull presentation now posted at
http://www.cair.org/conferences/cair2009/pres/Cox_Shaken%20and%20Stirred.pdf

Shaken - Summer 2008
Financial news - cuts to academic unit budgets
Enrollment news – projected 1,500 FTE over “budget”
News from the Scheduling Office – cancelled classes
News from Orientation – tight space at summer’s end
A Shocking Realization – for the first time in its history, UCLA may be at risk of entering a term in which there are not enough seats offered in classes to meet aggregate undergraduate demand


Stirred - Summer 2008
Tap into course scheduling system records of seats offered and seats filledin every undergraduate course on a repeated basis in advance of an upcoming term
A new data source for IR / Learning how to use it
Circulate summary reports on the evolving situation for campus leadership and detailed reports to managers responsible for course offerings
Project aggregate demand / Benchmark proposed seat offerings against comparable past term seats offered and seats filled
Department managers use detailed reports to formulate funding requests
Funding distributed - most serious shortages and bottlenecks addressed

Assembling the Components
Fundamental Measures of Instructional Activity Undergraduate Courses Offered, Term by Term Primary Classes and Secondary Sections Seats Offered, Seats Filled, Seats Open Average Primary and Secondary Enrollments per Student Average Enrollment per Primary and Secondary Section Ratios and Subsets (e.g. Courses Offering Secondary Sections)
Measures Combined and Compared at Different Levels Specific Courses, Course Subjects, Departments and Programs Schools and Divisions, Campus Totals Special Groups (e.g. Courses for General Education Credit)

New Engagements 2008-09
Course previews for upcoming terms now a standard issue
Enrollment Planning Committee formed in the College to investigate and recommend measures to protect undergraduate access to courses and maintain high rates of academic progress
Many accomplishments in a year of work Recommendations led to major overhaul of “enrollment priority” system
Development of a wide variety of new reports in support of planning
Full-year course offerings Multi-year course rotations General Education courses Critical courses for entering freshmen and transfers Term-by-term instructor staffing patterns

Step Ahead Two Years

The Management of Undergraduate Course Offerings and the Rise of
Future CourseBob Cox
UCLA Office of Analysis and Information Management
California Association for Institutional ResearchNovember 11, 2011 Rohnert Park
Full presentation now posted at: http://www.cair.org/conferences/cair2011/pres/Cox_FutureCourse_11.11.pdf

Non-Resident Enrollment Plans
Non-Resident Workgroup (2009-10) Target +2,400 Non-Res UG by 2013-14 From 9% to 18% of UG Enrollment While maintaining Cal Resident access Non-Res Implementation Task Force Outreach /Services/Academic Programs Preparation for Innovation
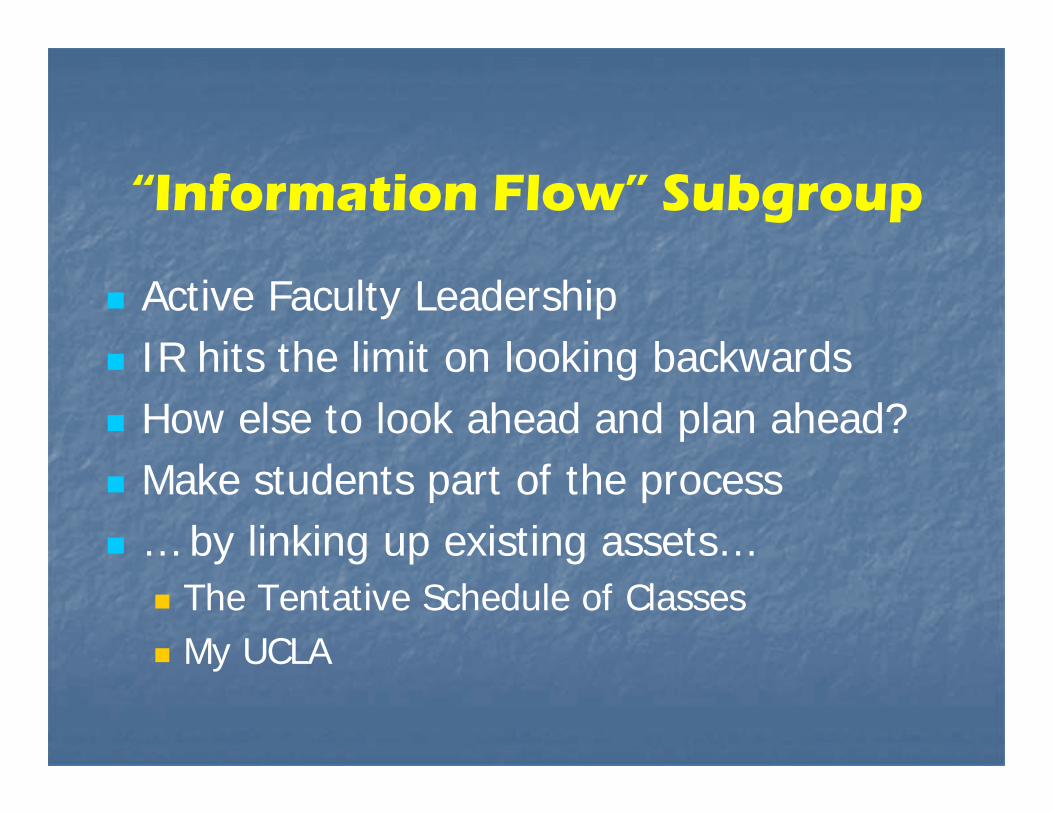
“Information Flow” Subgroup
Active Faculty Leadership IR hits the limit on looking backwards How else to look ahead and plan ahead? Make students part of the process … by linking up existing assets…
The Tentative Schedule of Classes My UCLA


Something New Under the Sun
The “Future Course Planner” at UCLA A simple survey mechanism, built into Each student’s personal campus webpage Gathers information on course preferences Two or three terms in advance, to help Departments adjust section/seat offerings

MyUCLA Class Planner andFuture Course Planner Enhancements
Chris SpreitzerDirector, Educational Information Technology
Departmental Counselors and Advisors Fall Quarter MeetingNovember 1, 2011

• Sample Future Course Report(legend will show color mappings: red – rank 1, orange – rank 2, etc.)

New Analytical Support for Planning
Future Course updates over the Summer Analysis of “response rates” by major, etc. Sorting out the implications Supplement, not substitution Circulating relevant materials To people making decisions on the ground

Future Course Planner for Winter 2012 FCP Response Rates in Relation to
Fall 2011 Undergraduate Population Totals **
FCP NOT ALL % FCP
All Undergraduates 12,717 14,532 27,249 46.7
Major Department FCP NOT ALL % FCP
Applied Linguistics 17 17 34 50.0
Art History 116 103 219 53.0
Asian L&C 69 78 147 46.9
Classics 29 29 58 50.0
Comparative Literature 25 30 55 45.5
English 421 605 1,026 41.0
French & Francophone 28 17 45 62.2
Germanic Languages 10 5 15 66.7
Italian 14 9 23 60.9
Linguistics 176 123 299 58.9
Musicology 21 29 50 42.0
Near Eastern L&C 19 24 43 44.2
Philosophy 191 196 387 49.4
Scandinavian Section 2 2 -
Slavic L&L 6 14 20 30.0
Spanish & Portuguese 80 91 171 46.8
Study of Religion 14 24 38 36.8
Undeclared - Humanities 196 274 470 41.7
Humanities Subtotal 1,432 1,670 3,102 46.2 Computational & Systems 20 11 31 64.5
Ecology & Evolutionary Biology 718 822 1,540 46.6
Integrative Biology & Physiology 514 513 1,027 50.0
MIMG 299 236 535 55.9
MCD Biology 252 228 480 52.5
Neuroscience 340 291 631 53.9
Psychology 1,245 1,416 2,661 46.8
Society & Genetics 11 3 14 78.6
Undeclared - Life Science 231 281 512 45.1
Life Sciences Subtotal 3,770 3,918 7,688 49.0 Atmospheric & Oceanic 16 12 28 57.1
Chemistry & Biochemistry 719 665 1,384 52.0
Earth & Space 37 23 60 61.7
Mathematics 583 552 1,135 51.4
Physics 168 145 313 53.7
Statistics 61 42 103 59.2
Undeclared - Physical Science 109 177 286 38.1
Physical Sciences Subtotal 1,693 1,616 3,309 51.2


2010-11 Earthquake Update
Benchmarking for Bridge Funding Campus maintains performance levels Four-Year Grad Rate rises to 70% Minerva’s Owl may fly at dusk, but IR… Is not short for “In the Rearview Mirror” It must engage in forward operations Where profiles and projections are used To frame planning and funding decisions


March 2011 -- UAIF• UCLA Today• Apr 05, 2011 By Cynthia Lee
• Funds redirected to maintain high quality of undergraduate education
• UCLA’s largest incoming freshman class projected to enroll this fall, senior leaders have taken steps to ensure that there will be enough seats for first-year students in critically needed lower-division courses, including General Education courses; skill courses such as composition, foreign languages and quantitative reasoning; and preparation classes for impacted majors.
•• Chancellor Gene Block and Executive Vice Chancellor and Provost Scott Waugh have decided to convert
temporary resources, known as bridge funding, to a new pool of funds to meet key student enrollment needs in both core lower- and upper-division courses for all undergraduates to make sure they can graduate in a timely manner.
•• This new resource, called the Undergraduate Academic Incentive Funds, will also be used to provide seed
funding for innovative projects that can potentially increase the efficiency of courses and curricula. Last year, roughly $7 million in bridge funding was distributed.
•• "Maintaining a high-quality undergraduate program is one of our highest priorities and these funds will support that
goal," Waugh said. Undergraduate Academic Incentive Funds (UAIF) will be allocated annually after deans of the College of Letters and Science submit their requests each year for funding of courses they feel are critical to undergraduate education. Requests for funding for this year’s allocation are due by April 11.


Fall 11 - Planned Growth PLUS!
Planned for 5250 new freshmen Fall 2011 But SIRs show many more are coming Actually enrolled 5825 (= last year +26%) Record number of Internationals Record number of Cal Residents Expanded responsibilities for Orientation Identification of “CRITICAL COURSES”

Critical Courses to Support the Expansion of Freshman Access to UCLA in Fall 2011Primary Class Sections, Seats Offered, and Seats Filled -- Fall 2011 Compared to Fall 2010
by Academic Unit and by GE Foundation Area
ACADEMIC UNIT Primary Classes Seats Offered Percent Seats Filled Percent
Fall 2010 Fall 2011 Gain Fall 10 Fall 11 Gain Gain Fall 2010 Fall 2011 Gain Gain
Humanities 50 55 6 5,011 6,754 1,743 35 4,897 5,996 1,099 22
Life Sciences 14 18 4 3,183 4,509 1,326 42 3,133 4,258 1,125 36
Physical Sciences 77 85 8 12,204 14,070 1,866 15 11,970 13,029 1,059 9
Social Sciences 31 33 2 7,448 8,539 1,091 15 7,215 7,557 342 5
GE Clusters 9 9 - 1,932 2,044 112 6 1,890 1,788 (102) (5)
English Composition and ESL 48 63 15 1,035 1,282 247 24 1,019 1,271 252 25
Other College 3 4 1 409 376 (33) (8) 382 363 (19) (5)
College 231 267 36 31,222 37,574 6,352 20 30,506 34,262 3,756 12
SEAS 5 3 (2) 401 408 7 2 368 404 36 10
SOAA 9 9 - 1,303 1,538 235 18 1,285 1,445 160 12
STFT 2 2 - 286 413 127 44 286 410 124 43
Others - - - - - - - - - - -
Schools 15 13 (2) 1,990 2,359 369 19 1,939 2,259 320 17
All Critical Courses 246 280 34 33,212 39,933 6,721 20.2 32,445 36,521 4,076 12.6
GE FOUNDATION AREA Primary Classes Seats Offered Percent Seats Filled Percent
Fall 2010 Fall 2011 Gain Fall 2010 Fall 2011 Gain Gain Fall 2010 Fall 2011 Gain Gain
Literary & Cultural Analysis (LC) 38 41 3 5,011 5,936 925 18 4,881 5,157 276 6
Philosophical & Linguistic Analysis (PL) 13 13 - 1,849 2,606 757 41 1,809 2,494 685 38
Visual & Performance Arts A&P (VP) 17 19 2 3,302 4,660 1,358 41 3,228 4,181 953 30
Historical Analysis (HA) 20 26 6 4,194 5,373 1,179 28 4,152 4,519 367 9
Social Analysis (SA) 31 31 - 6,428 7,208 780 12 6,247 6,630 383 6
Life Science (LS) 20 25 5 4,443 5,457 1,014 23 4,373 5,068 695 16
Physical Science (PS) 41 45 4 8,010 9,138 1,128 14 7,808 8,266 458 6
Foundations / Arts & Humanities (unduplicated) 57 65 8 8,280 10,896 2,616 32 8,105 9,748 1,643 20
Foundations / Society & Culture (unduplicated) 46 50 4 9,240 10,947 1,707 18 9,039 9,727 688 8
Foundations / Scientific Inquiry (unduplicated) 52 60 8 10,721 12,633 1,912 18 10,454 11,568 1,114 11
All GE Courses (unduplicated) 134 147 13 24,611 29,298 4,687 19.0 24,047 26,463 2,416 10.0
Other Critical Courses -- Not GE 112 133 21 8,601 10,635 2,034 23.6 8,398 10,058 1,660 19.8
All Critical Courses 246 280 34 33,212 39,933 6,721 20.2 32,445 36,521 4,076 12.6

Step Ahead Again to …


Profiles, Projections, and Stress Tests:Pathways to Institutional Effectiveness
Bob CoxUniversity of California, Los Angeles
California Association for Institutional ResearchNovember 9, 2012 Anaheim
Full presentation now posted at:http://www.cair.org/conferences/cair2012/pres/54_Cox.pdf
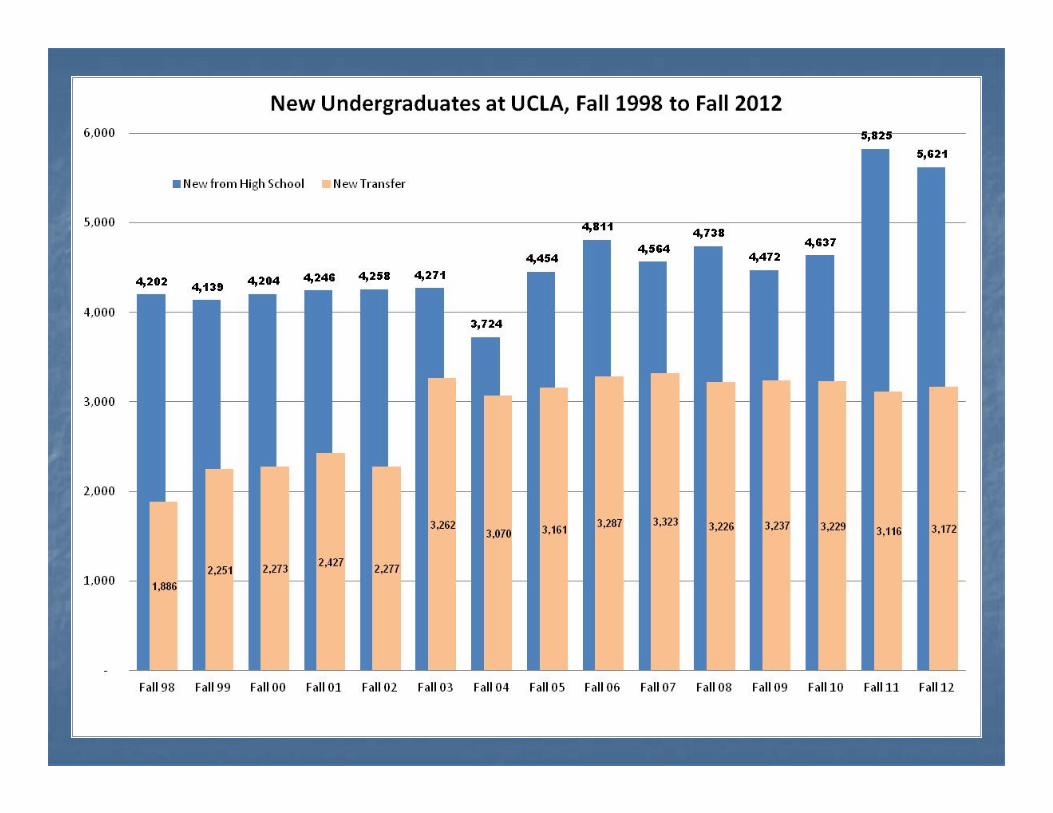
4,202 4,139 4,204 4,246 4,258 4,271
3,724
4,454
4,811
4,564 4,738
4,472 4,637
5,825 5,621
5,500 5,500
1,886 2,251 2,273 2,427 2,277
3,262 3,070 3,161 3,287 3,323 3,226 3,237 3,229 3,116 3,172
2,700 2,600
-
1,000
2,000
3,000
4,000
5,000
6,000
Fall 98 Fall 99 Fall 00 Fall 01 Fall 02 Fall 03 Fall 04 Fall 05 Fall 06 Fall 07 Fall 08 Fall 09 Fall 10 Fall 11 Fall 12 Fall 13 Fall 14
New Undergraduates at UCLA, Fall 1998 to Fall 2012
New from High School New Transfer

1,886
2,251 2,273 2,427 2,277 3,262 3,070 3,161 3,287 3,323 3,226 3,237 3,229 3,116 3,172 2,700 2,600
1,820
1,840
1,860
1,880
1,900
1,920
1,940
1,960
1,980
2,000
Fall 98 Fall 99 Fall 00 Fall 01 Fall 02 Fall 03 Fall 04 Fall 05 Fall 06 Fall 07 Fall 08 Fall 09 Fall 10 Fall 11 Fall 12 Fall 13 Fall 14
New Non-Resident Undergraduates at UCLA, Fall 1998 to Fall 2012
New from High School New Transfer

Apr 12, 2012 By UCLA Today staff UCLA leaders commit funds to maintain high-quality undergraduate education
As state support for the University of California declines, campus leaders are making supplemental funding available to maintain
UCLA's high-quality undergraduate education and provide the classroom seats needed to ensure that first-year students make timely
progress to graduation.
Deans have submitted comprehensive proposals to utilize funding to be allocated by Chancellor Gene Block and Executive Vice
Chancellor and Provost Scott Waugh in the next few weeks. While the exact amount to be allocated has not been determined,
campus leaders last April made $16 million av ailable for use during the current academic year.
"We want to provide a sufficient number of courses and the right kinds of courses to enable undergraduates to move in a timely
manner toward completing their degrees," Waugh said. "Maintaining a high-quality undergradua te education is one of our highest
priorities."
The supplemental funding has allowed the campus to accommodate a larger-than-expected freshman class. Deans and department
chairs are using the funding to hire the additional instructors and teaching assistants necessary to increase core course offerings in
key fields, including General Education courses; skill courses such as composition, foreign languages and quantitative reasoning;
and preparation classes for impacted majors.
By paying close attention to course enrollment patterns, deans and department chairs regularly make adjustments to ensure that
entering students have the courses they need and to facilita te the progress of continuing students. In recent years, careful attention
to enrollment and course planning has helped students achieve the highest-ever four-year graduation rate in UCLA history.
"Approximately 91 percent of our freshman class now earns a bachelor’s degree at UCLA. And of those who graduate, three-quarters
(75 percent) graduate in four years or less, 21 percent graduate in five years and three percent graduate beyond the fifth year," Dean
and Vice Provost of Undergraduate Education Judith Smith said. "Our goal is to increase the number of freshman students who
graduate in four years and work more closely with those interested in the option of graduating in three years," she said, noting that
timely graduation helps to ensure access for additional incoming freshmen.
As per-student state support for the University of California system ha s declined by about half over the past decade, the UC Board of
Regents has increased tuition to help fil l the gap with some of the revenue necessary to maintain academic excellence. But while
some college campuses have had to drastically cut back on course offerings, UCLA has used careful planning and supplemental
funding to meet important student enrollment needs.
"That doesn’t mean that every student gets every course she or he wants at the time they want it," Smith said. "But it does mean that
we have worked very hard to determine what classes are needed and to manage course enrollment so that students’ needs are met."

Stress Tests in an IR Context
Assessing the capacity of academic units to adapt to challenges specified by alternative models of future conditions
Most useful in uncertain times, times of crisis or rapid change
Focused here on problems of maintaining quality and effectiveness in undergraduate instructional programs
Stress tests combine IR skills used to prepare academic unit profiles with methods used to project future distributions of population and instructional workload

Stress Tests in Context at UCLA
Stress tests mark the opening of a new stage in the academic planning process at UCLA
Building upon collaborative efforts that have enabled the campus to target instructional resources allocation far more effectively
But the campus must rely on the departments to take the initiative in planning for changes in instructional workload delivery
Stress tests, to be effective, should be developed in dialog with departments, mediated by the deans

Lessons from Life Sciences
• Different Departments – Different Stress Points• Psychology Dept. will be overwhelmed by a giant
rising junior cohort seeking to enter the major• Classroom space and availability of TAs at issue• Familiar resource ratios thrown into disequilibrium• New summer offerings might (or might not) help• Limits on teaching lab space and pressures on
major advising and staffing• Questions about cadavers

Now Flash Forward to …

Planning for 2013-14• IR projects growth in course enrollment demand for 2013-14• … based on course enrollment history by cohort and major mobility
• Provost requests detailed UAIF funding proposals from Deans
• Assistant Deans use IR projections to evaluate responses to the RFP
• IR and Budget Office collaborate to design uniform reporting format
• Planned expenditures are detailed by course level & instructor type
• March 2013: Budget Office receives and evaluates proposals• May 2013: Provost approves $38m in UAIF funding for 2013-14


Third-Week Seats Seats Seats % Headcount Seats Seats Seats Sections Seats Seats SeatsFinals Offered Filled Open Open Enrollment Offered Filled Open Offered Offered Filled Open
Fall 2007 98,220 86,591 11,629 11.8 25,928 3.79 3.34 0.45 1,681 58.4 51.5 6.9 Fall 2008 98,009 88,609 9,400 9.6 26,536 3.69 3.34 0.35 1,642 59.7 54.0 5.7 Fall 2009 98,558 89,701 8,857 9.0 26,687 3.69 3.36 0.33 1,586 62.1 56.6 5.6 Fall 2010 97,920 87,812 10,108 10.3 26,162 3.74 3.36 0.38 1,548 63.3 56.7 6.5 Fall 2011 105,730 92,420 13,310 12.6 27,199 3.89 3.40 0.49 1,606 65.8 57.5 8.3 Fall 2012 109,915 95,613 14,302 13.0 27,941 3.93 3.42 0.51 1,641 67.0 58.3 8.7
Fall 2013 113,842 97,861 15,981 14.0 28,667 3.97 3.41 0.56 1,681 67.7 58.2 9.5 vs. Fall 2012 3,927 2,248 1,679 726 40
Third-Week Seats Seats Seats % Headcount Seats Seats Seats Sections Seats Seats Seats Seats SectionsFinals Offered Filled Open Open Enrollment Offered Filled Open Offered Offered Filled Open Filled Offered
Fall 2007 57,355 52,497 4,858 8.5 25,928 2.21 2.02 0.19 2,334 24.6 22.5 2.1 60.6 1.39 Fall 2008 58,381 54,635 3,746 6.4 26,536 2.20 2.06 0.14 2,352 24.8 23.2 1.6 61.7 1.43 Fall 2009 59,837 56,268 3,569 6.0 26,687 2.24 2.11 0.13 2,315 25.8 24.3 1.5 62.7 1.46 Fall 2010 59,920 56,150 3,770 6.3 26,162 2.29 2.15 0.14 2,284 26.2 24.6 1.7 63.9 1.48 Fall 2011 66,159 59,673 6,486 9.8 27,199 2.43 2.19 0.24 2,504 26.4 23.8 2.6 64.6 1.56 Fall 2012 71,135 64,553 6,582 9.3 27,941 2.55 2.31 0.24 2,656 26.8 24.3 2.5 67.5 1.62
Fall 2013 72,846 64,909 7,937 10.9 28,667 2.54 2.26 0.28 2,749 26.5 23.6 2.9 66.3 1.64
vs. Fall 2012 1,711 356 1,355 726 93
Excluded from the framework of this analysis are courses that operate without fixed schedules or definite enrollment capacities, such as independent study courses, SRP tutorials, Honors Contract courses, off-campus courses, and all courses numbered 195 and above. ROTC courses and undergraduate-level coursesdesigned for graduate students are also excluded. The framework does include several courses featuring online operations in primary classes and/or secondary sections.
Sections, Seats Offered, and Seats Filled in Undergraduate CoursesThird-Week Finals Fall 2007 to Fall 2013
Primary Class Sections Average Seats per Capita Average Seats per Section
Secondary Sections Average Seats per Capita Average Seats per Section

Future Course Planner Functions in Brief
FCP Responses are -Summarized by Student CohortSubjected to Response Rate AnalysisTransformed into Estimates of DemandCompared to Course Enrollment HistoriesCirculated to Deans and Departments
Student Participation Rates Average 35% across Cohorts
Analysis of ‘Flipped’ FCP Initiates a New Phase of Operations
Start by Determining Simple ‘Hit Rates’ , that is…Actual Course Enrollments as a % of Courses Named in FCPBut with many qualifications, not yet fully explored

One Example of Demand Estimates Circulated to Deans
and Departments

FCP Response >> 23% 43% 40% 36% 28% 40% N/A est. FCP Week 2 est. FCP Capacity vs. FCPCOURSE HS 1 HS 2 HS 3 HS + TR 1 TR + GR Win 13 Fall 11 Win 12 Spr 12 Fall 12 Win 13 Win 13 Win 13EE BIOL 116 - 2 45 70 4 33 9 163 203 163 180 17 LIFESCI 1 260 223 70 34 25 15 6 633 524 658 544 642 633 720 87 LIFESCI 2 106 343 30 3 50 10 - 542 632 633 720 642 542 648 106 LIFESCI 3 4 690 75 22 61 30 9 891 569 733 491 598 891 760 (131) LIFESCI 4 - 209 223 20 90 40 3 585 488 520 488 542 585 576 (9) LIFESCI 15 66 53 3 6 4 5 - 137 284 214 217 286 137 216 79 LIFESCI 0023L - 219 45 3 22 8 - 297 309 285 329 297 - (297) MCD BIO 0165A - 2 40 28 22 48 6 146 162 159 146 162 16 MIMG 102 - 2 43 101 7 15 3 171 171 300 129 MIMG 0185A - - 30 53 4 23 3 113 118 116 87 113 120 7 NEUROSC 0101B M 9 - 120 31 22 45 3 230 172 230 160 (70) PHYSCI 5 70 46 13 31 4 8 - 172 420 412 416 420 172 418 246 PHYSCI 0111A - 7 188 17 22 5 3 242 289 242 290 48 PHYSCI 167 - 2 53 171 4 45 - 275 364 275 350 75 PSYCH 10 154 55 5 8 - 5 - 227 638 541 513 682 227 450 223 PSYCH 0100A 48 253 18 11 32 3 3 368 478 244 303 499 368 250 (118) PSYCH 0100B 9 200 93 6 248 10 3 569 239 319 253 279 569 210 (359) PSYCH 110 4 21 115 64 25 53 - 282 200 192 188 154 282 160 (122) PSYCH 115 - 14 78 48 47 30 3 220 105 294 183 220 200 (20) PSYCH 0119E - 7 13 95 18 30 - 163 120 163 50 (113) PSYCH 0119Q - 5 30 126 32 25 3 221 56 221 50 (171) PSYCH 0120A 4 18 75 112 58 115 - 382 310 304 292 382 240 (142) PSYCH 126 4 - 13 48 14 63 - 142 21 21 27 21 142 24 (118) PSYCH 0127A 4 18 33 20 29 8 - 112 224 199 179 247 112 200 88 PSYCH 135 4 28 48 14 72 20 - 186 305 173 153 400 186 160 (26) PSYCH 0136A - 2 13 90 11 63 3 182 27 26 25 182 48 (134) PSYCH 0137C - 18 43 31 22 20 6 140 411 164 140 400 260
Comparing 'Top Three' Future Course PlannerEstimated Demand for Winter 2013 to
Actual Enrollment by Quarter 2011-12 - 2nd Week Enrollment Fall 2012and Stated Course Enrollment Capacities for Winter 2013 at October 16
148 Courses Cited by 40+ Students in the Future Course Planneras a 'Top Three' Selection for Winter 2013 - by Student Cohort Type
to Provide a First Order Estimate of Total 'Top Three' Demand for Each CourseWith FCP Selection Count Multiplied by the Inverse of the Cohort Type Response Rate

Working with the ‘Flipped’ FCP:Initial Analytical Findings
2012-13 Course Enrollments for 5,012 FCP Respondents Looking for ‘hits’ Summer through Spring
71% naming only one course enrolled in that course 52% naming two courses enrolled in both
While 34% enrolled in one of two 39% naming three courses enrolled in all three
While 35% enrolled in two and 19% in one of three

- 1 one - 1 2 two - 1 2 3 three - 1 2 3 4 four - 1 2 3 4 5 five all
HS 2 32 82 114 21 59 104 184 31 78 165 177 451 7 64 147 215 203 636 41 105 201 269 289 171 1,076 2,461 HS 3 27 69 96 23 43 63 129 19 50 83 123 275 15 42 80 130 97 364 55 92 123 141 108 53 572 1,436 HS 4 26 54 80 14 41 50 105 15 50 77 61 203 14 57 64 77 45 257 35 99 149 105 58 24 470 1,115
Combined 85 205 290 58 143 217 418 65 178 325 361 929 36 163 291 422 345 1,257 131 296 473 515 455 248 2,118 5,012
- 1 one - 1 2 two - 1 2 3 three - 1 2 3 4 four - 1 2 3 4 5 five all
HS 2 1 3 5 1 2 4 7 1 3 7 7 18 0 3 6 9 8 26 2 4 8 11 12 7 44 100 HS 3 2 5 7 2 3 4 9 1 3 6 9 19 1 3 6 9 7 25 4 6 9 10 8 4 40 100 HS 4 2 5 7 1 4 4 9 1 4 7 5 18 1 5 6 7 4 23 3 9 13 9 5 2 42 100
Combined 2 4 6 1 3 4 8 1 4 6 7 19 1 3 6 8 7 25 3 6 9 10 9 5 42 100
- 1 one - 1 2 two - 1 2 3 three - 1 2 3 4 four - 1 2 3 4 5 five
HS 2 28 72 100 11 32 57 100 7 17 37 39 100 1 10 23 34 32 100 4 10 19 25 27 16 100 HS 3 28 72 100 18 33 49 100 7 18 30 45 100 4 12 22 36 27 100 10 16 22 25 19 9 100 HS 4 33 68 100 13 39 48 100 7 25 38 30 100 5 22 25 30 18 100 7 21 32 22 12 5 100
Combined 29 71 100 14 34 52 100 7 19 35 39 100 3 13 23 34 27 100 6 14 22 24 21 12 100
Full Year Course Hits for 5,012 Spring 2012 Respondents in Three Cohorts to the Future Course Planner for Fall 2012

Working with the ‘Flipped’ FCP:Several Significant Analytical Findings
93% of respondents enrolled in at least one FCP course 55% managed to enroll in at least three FCP courses
Or in all courses named, if fewer than three
Distributions of simple hit rates by major program Majors with strong linear structures show higher hit rates
Particularly when it comes to getting three or more FCP courses Engineering, Nursing, most of the STEM majors Why? Majors themselves have ‘narrower’ course channels And? Students consequently have better idea of what lies ahead

Zero One+ Three+ Base Zero One+ Three+ Base
HS 2 132 2,329 1,510 2,461 5 95 61 100 HS 3 139 1,297 784 1,436 10 90 55 100 HS 4 104 1,011 474 1,115 9 91 43 100
Combined 375 4,637 2,768 5,012 7 93 55 100
Number and Percentage of Respondents with Zero, One+ and Three+ Course Hits


But Analytical Work is Only Beginning and May Never Reach Full Closure
Many, many reasons why students might not score a ‘hit’ Courses listed in FCP tentative schedule may not actually be offered Other, more attractive courses may be offered that were not posted in FCP Students may only be able to choose one or the other of two FCP courses FCP does not show who is teaching; when this is known, preferences may shift Students entering or changing programs may reorder priorities -- and, of course … Students are free (within limits) to simply change their minds, make new choices
Many, many ways in which a ‘non-hit’ may really be a ‘hit’ Different courses may be functionally equivalent in many different ways Satisfying, for example, the same General Education requirements Or the same major program or minor program or distribution requirements Students planning to place at one level may step up or down (Math 3 not Math 2) Etc. Etc.


A Happy Ending? Supporting Student Choice
Access to Programs and Courses that Attract Students to the Institution Offering Freedom to Explore, to Change, to Find the Best Fit
Supporting Campus Goals for Enrollment Management Operating Effective and Efficient Instructional Programs Excellence and Accountability in Course Enrollment Planning
Achieving Dual Institutional Objectives Not Necessarily Compatible The Forward-Looking New Main Line of IR Activity at UCLA The IR Program Expands; Focus Shifts from Macro- to Micro-Analysis Supporting Deans and Departments in Course Enrollment Planning Tracing Undergraduate Pathways Course by Course
Difficulties Leading to Rewards Nothing like a wedding to illustrate the joining of choice to a structured outcome The story of a broadminded and headstrong UCLA girl who is getting it done

Mabel Ko and Tom ThackerNov.10, 2013 (Read all about it in the New York Times – Vows, Nov. 17, 2013)

Student Choice & Course Enrollment
PlanningBob Cox
University of California, Los Angeles
California Association for Institutional ResearchNovember 22, 2013 Napa


![[XLS] · Web view59.287999999999997-158.607 197 64.73-156.93 161 58.4-156.4 49 60.82-152.30000000000001 39 60.168999999999997-154.32300000000001 873 62.88-149.83000000000001 1250](https://img.dokumen.tips/doc/110x75/5b3dfc307f8b9a560a8e66f3/xls-web-view59287999999999997-158607-197-6473-15693-161-584-1564-49.jpg)