Embed Size (px)
Citation preview

IIIN
131
225
STUD-25$ ON EODINE
COMPLEXES 0F SUBSUTUTED PYREDENES
THOSE ‘50.!" fin Dawn 0% M. S.
MICBEGAN STATE UNEE’ERSEY‘Z
Ming Keong Wang
1965

MICHIGAN STATE UNIVERSITY
EAST LANSING. MICHIGAN
wESIS
,. 4Emu


ABSTRACT
STUDIES ON IODINE
COMPLEXES OF SUBSTITUTED PYRIDINES
by Ming Keong Wong
Halogen and interhalogen compounds can act as Lewis acids and
form molecular complexes with.ebctron donors. Aromafic nitrogen-
containing organic compounds such as pyridine or substituted pyridines,
are stronger electron donors than their carbon analogs, and hence
they form stronger molecular complexes with Lewis acids.
Of all the halogens iodine forms relatively weak molecular com—
plexes with organic bases. On the other hand it is not as strong a
halogenating agent as the stronger Lewis acids such as iodine mono—
chloride or iodine monobromide. It is, therefore, easier to work with
since the probability of side reactions is minimized.
The mole ratio method was used for the determination of formation
constants of iodine with h-picoline, 2,h-lutidine, 3,5—lutidine, 2,3,6—
collidine, h-phenylpyridine, and 3,5—dichloropyridine. Spectrophoto-
metric measurements were made on solutions of iodine and the respective
pyridine bases in carbon tetrachloride solutions. From plots of
amine/iodine mole ratio, the molar absorptivities of the undissociated
complexes were obtained. These values were then used for the calcula-
tion of degrees of dissociation and formation constants of the com—
plexes. For very weak complexes (such as the iodine - 3,5-dichloro-
pyridine complex) Ketelaar's modification of Benesi-Hildebrand method
was used. In the case of h—phenylpyridine, neither method gave satis—
factory results. This is probably due to the formation of two complexes,
Py'IZ and Py-2IZ.

Ming Keong Wong
The strength of the iodine—pyridine base complexes decreases in
the order 3,5-lutidine > 2,b—lutidine > h—picoline > 2;%6-collidine >
3,5—dichloropyridine. The order of basicity of the compounds is as
follows: 2,3,6—collidine > 2,b-lutidine > 3,5—lutidine > L—picoline >
L—phenylpyridine > 3,5-dichloropyridine.

STUDIES ON IODINE
COMPLEXES OF SUBSTITUTED PYRIDINES
By
Ming Keong Wong
A THESIS
Submitted to
Michigan State University
in partial fulfillment of the requirements
for the degree of
MASTER OF SCIENCE
Department of Chemistry
June 1965

ACKNOWLEDGMENT
I wish to express my very sincere appreciation and thanks to
Dr. A. I. POpov, for his constant help and guidance throughout the
course of my studies here and during the preparation of this thesis.
Acknowledgment is given to the Asia Foundation and the
Singapore Government for the scholarship which made this study possible.
ii

TABLE OF CONTENTS
Page
HISTORICAL INTRODUCTION . . . . . . . . . . . . . . . . . . . 1
EXPERIMENTAL PROCEDURE . . . . . . . . . . . . . . . . . . . 9
EXPERIMENTAL RESULTS . . . . . . . ... . . . . . . . . . . . 15
DISCUSSION OF RESULTS . . . . . . . . . . . . . . . . . . . . 38
BIBLIOGRAPHY . . . . . . . . . . . . . . . . . . . . . . . . A2

LIST OF TABLES
Table Page
\]
l pKa values of some substituted pyridines . . . . . . .
2 Formation constants of some substituted pyridine -
iodine complexes . . . . . . . . . . . . . . . . . . . 5
3 Spectrophotometric data of mole ratio method on the
pyridine - iodine system in carbon tetrachloride . . . 17
b Spectrophotometric data of mole ratio method on the
2,h—lutidine - iodine system in carbon tetrachloride . 21
5 Spectrophotometric data of mole ratio method on the
3,5-lutidine - iodine system in carbon tetrachloride . 2b
6 Spectrophotometric data of mole ratio method on the
2,3,6—collidine - iodine system in carbon tetrachloride 27
7 Spectrophotometric data for Ketelaar's Plouson the
b-phenylpyridine - iodine system in carbon
tetrachloride . . . . . . . . . . . . . . . . . . . . 31
8 Spectrophotometric data for Ketelaar's Plots on the
3,5-dichloropyridine - iodine system in carbon
tetrachloride . . . . . . . . . . . . . . . . . . . . 3h
9 Degree of dissociation and formation constants of
iodine-substituted pyridine complexes . . . . . . . . 37
iv

LIST OF FIGURES
Figure page
1 Absorption spectra of b-Picoline - Iodine system in
carbon tetrachloride . . . . . . . . . . . . . . . 16
2 Mole Ratio method on the h—Picoline — Iodine system in
carbon tetrachloride . . . . . . . . . . . . . . . 18
3 Absorption spectra of 2,b-Lutidine - Iodine system
in carbon tetrachloride . . . . . . . . . . . . . . 20
A Mole Ratio method on the 2,L—Lutidine — Iodine
system in Carbon tetrachloride . . . . . . . . . . 22
5 Absorption spectra of 3,5—Lutidine - Iodine system
in carbon tetrachloride . . . . . . . . . . . . . . 23
6 Mole Ratio method on the 3,5-Lutidine - Iodine
system in carbon tetrachloride . . . . . . . . . . 25
I Absorption spectra of 2,3,6-Collidine - Iodine
system in Carbon tetrachloride . . . . . . . . . . 26
8 Mole Ratio method on the 2,3,6-Collidine — Iodine
system in carbon tetrachloride . . . . . . . . . . 28
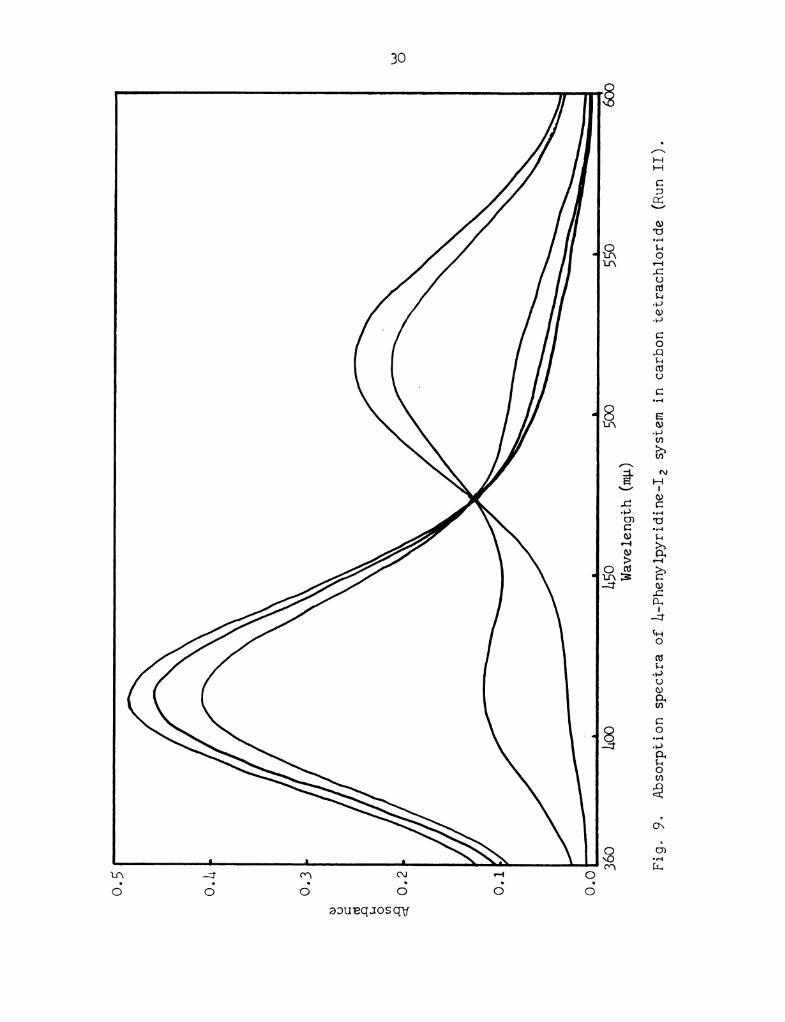
9 Absorption spectra of h-Phenylpyridine - Iodine
system in carbon tetrachloride . . . . . . . . . . 30
IO Ketelaar's Plousfor h—Phenylpyridine — Iodine
system in carbon tetrachloride . . . . . . . . . . 32
ll Absorption spectra of 3,5—Dichloropyridine -
Iodine system in carbon tetrachloride . . . . . . . 33
12 Ketelaar's Plodsfor 3,5-Dichloropyridine - Iodine
system in carbon tetrachloride . . . . . . . . . . 35

HISTORICAL INTRODUCTION
The Lewis acid character of certain halogen and interhalogen com-
pounds has long been amply illustrated by the large number of complexes
which they form with electron donors. Among the halogens, iodine is
the strongest Lewis acid, due to the ease of which it expands its
octet and accommodates extra electron pairs. The donor strength of
Lewis bases as well as the influence of molecular structure on the
donor strength can be conveniently illustrated by the relative strength
of their halogen complexes. Because of the reactivity of the halogens,
such studies must be made in chemically inert solvents.
Since the classic Spectrophotometric studies of complexing re-
action of iodine with benzene and some other aromatic hydrocarbons by
Benesi and Hildebrandl, a large amount of work on complex formatiOn
involving halogens and interhalogens has been reported by many in-
vestigators. A large number Of organic Lewis bases were investigated
and their relative basic strength determined.
Aromatic nitrogen—containing organic compounds are known to be
more basic than their carbon analogs. Consequently, they form stronger
complexes with halogens and interhalogens. This is evidenced by the
fact that relatively stable solid complexes of organic bases with
halogens had been reported many years before the work of Benesi and
Hildebrand.
The existence of a solid molecular addition compounds of iodine
with pyridine was reported in 1933 by Chateletz, and the composition
(C5H5N)2—I2 was assigned to the crystals obtained. Chatelet also

2
reported isolation of two hydrated complexes which he identified as
IZ-Py(HZO)6 and Iz—Py4(HZO)24.
Most of the evidence for the formation of addition compounds of
iodine with organic bases come from spectral studies. Zingaro, Vander-
Werf and Kleinberg3 have investigated the behavior of iodine in pyri-
dine solutions and postulated the reaction to be:
2 12 + Py > IPy+ + I,‘
Infrared studies of iodine with pyridine and 2-picoline in carbon
tetrachloride by Mulliken, Gluster, and Thompson4 showed a definite
shift of absorption band from those of the individual compounds upon
the addition of iodine to the respective organic base. The shift of
absorption bands was attributed to the formation of halogen-amine
complex.
Mulliken and Reid5, in their study of the pyridine-iodine system
in heptane, reported the existence of a 1:1 molecular complex. Upon
the addition of pyridine the 520 mu peak of iodine in heptane was
shifted to D22 mu. This peak was attributed to the absorption by the
complex, and the association constant for the complex was calculated
to be 290 at 16.70.
Since iodine is a relatively weak Lewis acid, its molecular
complexes with organic bases are likewise weak, and with few exceptions,
spectrOphotometric studies by mole ratio method and method of contin-
uous variation do not give satisfactory results. The strongest
iodine charge—transfer complex reported in literature is the molecular
complex between iodine and triethylamine6 with equilibrium constant5
of about b.61 x 103 (liter/mole) at 250. However, other studies using

3
stronger interhalogen Lewis acids such as iodine monochloride and
iodine monobromide, do show the formation of 1:1 molecular complex7.
Moreover, in determining the equilibrium constants of iodine—organic
base molecular complex, consistent values are obtained by calculations
at different wavelengths based on the assumption of 1:1 complex.
Mulliken5>8 suggested the existence of two types Of complex for
the pyridine—iodine system: an "outer complex" (A) and an "inner
complex" (B) with the structures
/I I// ' :- : +
(A) (B)
Glusker and Miller9 isolated two different addition compounds
formed by h-picoline and iodine: Compound I has an ionic structure
and compound II is a molecular addition compound, analogous to the
addition compound of pyridine and iodine prepared by many workers.
Their studies have led to the postulation that compound II is an inter-
mediate in the formation of compound I, and the mechanism of the reac—
tion is as follows:
CH3 CH3 CH3
I2 + I ———> I <._———————> I + I9
/ Te») 1“ N61 solution ,
]I&3 I
1
I
Compound II

CH3 CH3 CH3
\. \\+ -———————> I :jj:
Q) N H I
l " t
I I63I
Compound I
X-ray studies by Hassel, Roemming and Tuftelo on the 1:1 addition
compound of h-picoline and iodine showed that the I-I-N arrangement
in compound II is linear with the I-I distance of 2.83 A while the
I-N distance is 2.31 X. Investigations by Hassel and Hope11 on the
reaction product of pyridine and iodine prompted them to postulate
the cation of compound I has a similar linear structure as that of
(H3C—<\ />N - I - N<\ /> -CH3)
instead of the d-addition arrangement as proposed by Glusker and Miller9.
compound II:
The strength of the molecular complexes formed by iodine and
organic bases depends primarily on two factors, the donor strength of
the base and on steric effects. Brown, Schlesinger and Cardonlz
studied the reactions of boron trifluoride with pyridine and 2,6—1uti-
dine and reported that pyridine forms a stronger molecular complex
than 2,6—lutidine, though the latter is a stronger base than pyridine.
Studies by POpov and Rygg7 on iodine and interhalogen complexes
of substituted pyridines also show the effect of steric hindrance.
They reported the order of stability of the complexes in each of the
iodine or interhalOgen series with the three pyridines as follows:
2—Picoline > pyridine > 2,6—1utidine. The order of basic strength is:
2,6—Lutidine > 2-picoline > pyridine.

S
S. Basu and J. N. Chandhuri13 investigated the charge-transfer
interaction between iodine and a number of substituted pyridines in
chloroform solutions. They found the logarithms of equilibrium con-
stants of the complexes to be approximately proportional to the pKa
values of the respective amine. The equilibrium constants for 2,6-
lutidine and 2,h,6—collidine were found to be much less than those
expected from the corresponding pKa values. They attributed the dis-
crepancies to steric effect of the.methyl groups at 2 and 6 positions.
Halleuxl4 reported that in the reaction between phenol and pyri-
dine bases
< CSHSOH + B C6H50H ——- B
the strength of the hydrogen bonds formed varies in the following
order: 3,5—lutidine > h—picoline > 2,6—lutidine > 2—picoline >
pyridine. The basic strength of the compounds is, 2,6-lutidine >
3,5—lutidinerv b—picolinelv 2-picoline > pyridine.
The above mentioned investigations showed that steric hindrance
is the main factor in the observed discrepancies between basic strength
and strength of the complexes. In the determination of basic strength,
very small proton is involved, and there is little steric effect
present. Brown and Mihm15 reported absence of any important steric
effects in the addition of the proton to pyridine, 2,6—1utidine and
monoalkylpyridines. Sacconi, Paoletti and Ciampolini16 studied the
heats of neutralization in water of a series of pyridine bases which
include pyridine, picolines and lutidines. They found that for
pyridine, picolines and lutidines, a linear relationship between the
heats of neutralization and basicity constants is followed, indicating
the absence of steric effect in the reactions. For large iodine or

O
interhalogen molecules, the presence of substituent groups adjacent
to nitrogen atom will invariably hinder the combination of the Lewis
acid with the base, and thus weakening the molecular complex formed.
This present study was intended to determine, by spectrophotometric
measurements, the relative strength of the complexes formed in carbon
tetrachloride solutions between iodine and the following pyridine
bases: h—Picoline, 2,h—lutidine, 3,5-lutidine, 2,3,6—collidine, h—
phenylpyridine, and 3,5-dichloropyridine. Such studies should yield
interesting data on the effects of the basic strength of the organic
compounds, and of the steric configuration, on the strength of the
molecular complexes formed.
The base ionization constants of some methylpyridines have been
investigated by several workers.12,14‘2° Their values are not always
in exact agreement, but comparison of available data on some of the
methylpyridines show that there is a basic agreement as to the order
of basicity. The pKa values of methylpyridines quoted in Table I are
mostly taken from reference 18. The sources of other data are listed
immediately after the name of the compound. It should be emphasized
that these data do not allow precise comparisons since some of the
values have been obtained by different investigators using different
methods and different solvents.
The pKa of 3,5-dichloropyridine is not available in the literature.
However, it is reasonable to conclude from the structure that the de—
crease in pKa value of pyridine by 3,S-dichloro-substitution will be
about twice that caused by 3-chloro-substitution.

7
Table I. pKa values of some substituted pyridines
Compound pK
Pyridine5.30
2-Picoline
b-Picoline
3,5—Lutidine
2,6-Lutidine
2,b-Lutidine
2,3,6-Collidine
h-Phenylpyridine(2l)
2—Chloropyridine(22)
3-Chloropyridine(22)
3,5-Dichloropyridine
mOUI-xl0\0\0\0\\n
oo
O
From the pKa values, it is seen that the substitution of phenyl
group in the h-position of pyridine ring causes a slight decrease in
basicity, and according to values given by Favini21, the decrease in
basicity is more pronounced when phenyl group is in positions 2 and
3 of the ring. Favini also attributed the observed bathochromic
shift in ultraviolet spectra of L—phenylpyridine to a quinoid structure
contribution. Indeed the substitution of a phenyl group in the para
position has changed greatly the nature of the pyridine ring, so that
the ultraviolet absorption spectrum of the compound is similar to the
spectrum of biphenyl.23,24
Since benzene is known to form weak complex with iodine, it is
expected that for h-phenylpyridine, two reaction sites will be avail-
able to coordinate with iodine in the phenylpyridine molecule. It has
long been regarded that the linearity of the Benesi—Hildebrand plots
provides evidence for the presence of only one 1:1 molecular complex25‘28.
Johnson and Bowen29, by using synthetic data, showed that linearity of
the Benesi—Hildebrand plot is not by itself sufficient for asserting

8
the presence or absence of more than one molecular complex in solution.
, They examined the system tetracyanoethylene-naphthalene-carbon tetra-
chloride and found a systematic variation of equilibrium constant with
wavelength. Thus they emphasized the necessity to examine the variation
of equilibrium constant with wavelength before asserting the presence
or absence of equilibria other than 1:1 stable charge-transfer complexes.
The h—phenylpyridine-iodine—carbon tetrachloride system will provide
interesting data for further examination of the above mentioned rela-
tionships.
The substitution of electron-withdrawing chlorine atom to the
pyridine ring decreases markedly the basicity, the effect being greatest
at d-position and smallest at y-position.
The formation constants of some of the organic base-iodine complexes
as reported by Popov and Rygg are listed in Table II. The 2-chloro-
pyridine—iodine system in n-heptane has been investigated by Witmer
and Zingaro30, and the reported Kf for the 1:1 complex is also listed:
Table II. Formation constants of some iodine-substituted pyridine
complexes.
Complex Kf
Pyridine-iodine lOl (25°)
2-Picoline-iodine 150 (25°)
2,6—Lutidine—iodine 50-8(25°)
2-Chloropyridine-iodine 3.3(280)

EXPERIMENTAL PROCEDURE
Reagents
Carbon Tetrachloride. Carbon tetrachloride used in this study
was purified by refluxing it with alkaline potassium permanganate for
2h hours, washing with water, further refluxing with barium oxide for
10 hours, and then distilling two times from fresh barium oxide. The
final distillation was done using one meter fractionating column
packed with glass beads.
Iodine. Iodine obtained from J. T. Baker Chemical Co. was puri-
fied by sublimation from a mixture of twenty grams of iodine, four
grams of calcium oxide, and four grams of potassium iodide. The
iodine thus Obtained was resublimed without adding calcium oxide and
potassium iodide.
b-Picoline. Aldrich Chemical Company 95% pure h—picoline was
stored over sodium hydroxide pellets for ten days and then twice dis-
tilled from fresh sodium hydroxide, using one meter packed fractionat-
ing column. The fraction boiling at 11430 at 760 mm was used for sub—
sequent spectrophotometric measurements. Reported boiling point of
the liquid is lh2—lh3°.31 It was also reported that a sample of
picoline of 99.88 moles % purity had a boiling point of th.356° at
760 mm."52
2,A~Lutidine. One hundred grams of 2,h—lutidine (Aldrich Chemical
Company) was refluxed over barium oxide for three hours, and then

lO
fractionally distilled through a one meter fractionating column. The
middle fraction, boiling at 156.50 at 755 mm (reported value is 157.10
at 760 mm32) was collected and used for subsequent measurements.
3,5-Lutidine. The purification procedure was analogous to that
used for 2,h-lutidine. The fraction boiling at 1710 at 756 mm was
collected and used. The reported boiling point is 171.60 at 760 mm.32
2,3,6-Collidine. One hundred grams of collidine (Aldrich Chemical
Company) was refluxed with barium oxide for two hours and then distilled
through a one meter fractionating column. The fraction boiling at
1690 at 733 mm was collected and used. Literature value for the boil—
ing point is 168—1700 at 730 mm.33
h—Phenylpyridine. This chemical was obtained from L. Light and
Co. Ltd., England. Initially recrystallization from n-heptane was used
in an attempt to purify the compound.32 However, after two recrystal—
lizations the crystals obtained were still slightly yellow. The com-
pound was finally purified by recrystallizing it from hot water.34
After two recrystallizations, the crystals obtained were pure white
and their melting point was 7h.5° (uncorrected). (Lit. val. 7&035
and 77-78032.)
3,5—Dichloropyridine. This compound (Aldrich Chemical Company)
was purified by two recrystallizations from 95% ethanol. The product
was dried in a desiccator over calcium chloride for 6-8 hours. The
solid compound seemed to have a fairly high vapor pressure at room
temperature. The pure white crystals obtained had a melting point of
65° (uncorrected). (Lit. val. 6b-65036 and 66-67037.)

11
Preparation of Solutions
Stock solutions of iodine of concentrations ranging from 1.0 x 10⁻³
to 2.0 x 10—3 mole/liter were prepared by dissolving a known weight of
iodine in carbon tetrachloride in volumetric flasks. The exact concen-
tration of the solutions was determined by titration with standard
sodium thiosulfate solution.
Stock solutions of h-picoline, 2,h-lutidine, 3,5—lutidine, 2,3,6—
collidine, b-phenylpyridine and 3,5—dichloropyridine were prepared by
dissolving a known weight of the respective substance in an appropriate
volume of carbon tetrachloride.
The solutions for Spectrophotometric measurement were prepared
by mixing proper aliquots of the two desired stock solutions and then
diluting to the desired concentration with the solvent.
Spectrophotometric Measurements
All spectrophotometric measurements were made on a Cary recording
spectrophotometer, Model lb, using silica cells of 1.00 i 0.01 cm.
path-lengths. The absorption spectra were measured between BOO mu
and 600 mu. All the measurements were made at room temperature vary—
ing between 23—2OOC. The absorption of each solution was measured
against a reference cell containing the pure solvent.
Applications of Spectrophotometric Data
Since all the pyridine bases studied form relatively weak complex
with iodine, the formula of the molecular complex in solution cannot
be.determined by mole ratio method. However, it is feasible to determine

12
the degree of dissociation and formation constant of the individual
molecular complex by the mole ratio method, assuming 1:1 complex is
being formed in the solution.
Measurements and Calculations of Equilibrium Constants
It has been fairly well established in a number of previous in-
vestigationsl‘lo, that in reasonably dilute solutions (f 10"2 M)
heterocyclic amines form l:l complexes with halogens and interhalogens.
Thus, the measurements of the complex formation constant were reduced
to the determination of the equilibrium concentrations of the complex,
I
of the free base and of the free halogen in a solution containing known
v‘
infijal amounts of the two reagents.
At a given wavelength the total absorbance (A) of a halogen-amine
solution is
A = EBb[B] + €X2b[X2] + EBX2b[BX2]
where b is the pathlength of the cell, EB , 6X2 , and EBXZ are
the molar absorptivities of the base (B), the halogen (X2), and the
complex (BXZ) respectively. If
CB = initial concentration of the base,
CX = initial concentration of the halogen, and
2
CC = equilibrium concentration of the complex, then
A = eBb(cB — cc) + EX2b(CX2 — CC) + EBXZbCC.
If
we can express the concentration of free base and that of free halogen

13
by OC, where d 2 degree of dissociation of the complex. The equi—
librium becomes:
A = EBbaC + de + X2bC(l - G).ex 2 EB
Since 6B Of the pyridine bases is negligible between 300-600 mu,
the wavelength region selected for this study, the equation reduces
further to:
A = :XZde + eszbCa—a).
The molar absorptivity for the undissociated complex, EBXZ’ is ob-
tained from the mole ratio method plots, the molar absorptivity of
the iodine, 6X2 , is readily measured, and C is known. Thus, the
value of the degree of dissociation, d , can be determined from the
above equation. The formation constant was calculated from the
equation:
OZC
For extremely weak complex such as 3,5-dichloropyridine—iodine
system, the limiting value of molar absorptivity could not be reached
even when excess of more than two thousand mole ratio of the base was
used. Consequently,the molar absorptivity of the complex, as well as
the formation constant, was calculated using Ketelaar's modification
of the Benesi-Hildebrand method. For the reaction in this present
study:
A + B ———> AB<.__
Ketelaar, Stolpe, Goudsmit and chubas38 have shown that if
CB(total) >> CIZ(total)’ then CB T’CB(total)’ the following equation
can be derived:

1A
1 l l l—— : — X __ +
6t ‘ 6x 6c ‘ Ex KfCB EC ‘ Ex
where 6t is the apparent molar absorptivity of iodine (i.e. measured
absorbance of the solution divided by the total concentration of
iodine), EX is the molar absorptivity of iodine, EC is the molar
absorptivity of the complex, and CE is the equilibrium concentration
of the base. The unknowns are E and K 1C f . A p101; Of Fm VS.
1C_ gives a straight line, of which the intercept yields the value of
EC and the slope, that of Kf .

EXPERIMENTAL RESULTS
Spectrophotometric Measurements on the Individual Components
The absorptions of b-picoline, 2,h-lutidine, 3,5—lutidine, 2,3,6-
collidine and 3,5—dichloropyridine were practically zero between 300 mu
to 600 mu. At 300 mu, h-phenylpyridine had a molar absorptivity of
about 70; at 310 mu, the molar absorptivity decreased to about 7, and
above 325 mu, the absorption was practically zero.
The solution of iodine in carbon tetrachloride showed an absorp-
tion maximum at 517 mu, with a molar absorptivity of 930. The result
agrees with the values given by Benesi and Hildebrand (E = 93O)1, and
Popov and Rygg (E = 92O)7.
Spectrophotometric Measurement on the Molecular Complexes
In all the runs of the mole ratio method on the iodine-pyridine
base systems, the concentration of iodine was held constant and the
mole ratio of pyridine base to iodine was increased until the limit-
ing absorbance was obtained. The absorption spectra of all the solu-
tions were obtained during a period of one to eight hours after prep-
aration.
h-Picoline - Iodine Complex. The absorption spectra showed a
maximum at b08 mu and an isosbestic point at L72 mu. The molar absorp-
tivity of the complex at h08 mu was 1710. The absorption spectra, with
the isosbestic point, are shown in Fig. 1. The absorbance and molar
absorptivity values, at four wavelengths, for the different runs are
shown in Table 3 and the plots of the molar absorptivity values vs.
the mole ratio of h-pic/IZ are shown in Fig. 2.
15

0.5
0.3
’
(\J
O
aouquosqw
0.11..
0.0
s
360
A00
A50
500
550
600
Wavelength
(mu)
Fig,
1.
Absorption
Spectra
of
h—Picoline
~I2
system
inCarbon
tetrachloride
(Run
III).
16

1 7
Table 3. Spectrophotometric data of mole ratio method on the 8-picoline -
7 12 system in CC14
Conc. M.R. of 808 mu 820 mu 850 mu 517 mu
of I2 eric/IZ .As e As e As 6 As 6
Run I 0.0 0.007 18 0.016 31 0.086 165 0.882 923
1.0 .092 177 .095 182 .118 227 .837 836
.0005215 M 5.1 .309 593 .308 583 .215 813 .331 635
20.3 .610 1170 .591 1133 .385 662 .176 337
50.7 .738 1810 .712 1365 .396 760 .110 211
96.0 .790 1515 .770 1877 .825 815 .083 159
192 .833 1598 .800 1535 .835 835 .065 125
287 .83 1600 .797 1530 .825 815 .057 109
383 .85 1680 .811 1556 .825 815 .053 102
880 .869 1668 .820 1572 .832 826 .053 102
752 .863 1657 .810 1553 .825 815 .053 102
1028 .878 1686 .820 1572 .825 815 .053 102
1688 .892 1711 .810 1553 .390 787 .087 90
Run II 0.0 .009 17 .018 27 .081 156 .883 930
1.0 .089 171 .091 175 .118 228 .880 886
.0005196 M 38.0 .685 1320 .667 1283 .372 716 .180 270
85.0 .776 1892 .750 1882 .810 788 .090 173
200 .831 1600 .795 1530 .823 815 .065 125
500 .868 1672 .816 1571 .828 828 .058 108
800 .872 1678 .811 1561 .813 798 .050 96
1000 .887 1706 .823 1585 .815 798 .089 98
1200 .896 1723 .820 1578 .800 770 .087 90
1800 .908 1780 .822 1583 .800 770 .087 90
Run III 0.0 .008 18 .008 29 .087 169 .260 935
1.0 .030 108 .032 115 .057 205 .287 887
.0002781 M '31.8 .302 1085 .293 1052 .175 628 .110 395
95.8 .395 1820 .382 1378 .216 776 .065 238
223 .838 1562 .819 1508 .225 809 .085 162
353 .883 1595 .826 1531 .231 830 .038 137
705 .860 1655 .838 1578 .233 837 .038 122
1058 .866 1675 .880 1581 .230 826 .032 115
1810 .871 1695 .883 1595 .230 826 .030 108
1765 .877 1715 .882 1588 .230 826 .030 108
2115 .878 1723 .838 1578 .219 787 .025 90
2820 .877 1715 .831 1550 .205 737 .022 79
Run Iv 0.0 .010 18 .018 26 .113 163 .686 930
1.0 .188 207 .186 210 .170 288 .578 832
.0006951 M 38.2 .978 1807 .950 1367 .527 758 .169 283
189 1.119 1610 1.078 1550 .578 832 .088 127
887 1.170 1683 1.113 1603 .585 881 .072 108
786 1.195 1720 1.108 1595 .550 792 .068 92
882 1.200 1727 1.108 1595 .580 777 .068 92
1100 1.215 1788 1.113 1603 .585 788 .058 83

1800+
Fig.
2.
A
VW
.4
Ll
200
800
600
dole
Ratio
Method
on
the
8-Pic01ine
~
808
mu
1\
A20
mu
h850
mu
517
mp
o
L—
800
1000
1200
Mole
Ratio
of
8—Picoline
to
12
fi-
*2
system
in
carbon
tetrachloride.
1800
1600
l8

l9
2,8-Lutidine - Iodine Complex. The absorption spectra showed a
maximum at 812 mu, and the molar absorptivity of the complex at this
wavelength was 1680. The isosbestic point showed by all the runs was
at about 873 mu. The absorption spectra, with the isosbestic point,
are shown in Fig. 3. The absorbance and molar absorptivity values,
at four wavelengths, for the different runs are given in Table 8 and
the plots of the molar absorptivity values vs. the mole ratio of
2,8-lut/I2 are shown in Fig. 8.
3,5—Lutidine - Iodine Complex. The maximum absorption wavelength
of the complex was at 809 mo, and the molar absorptivity at that wave-
length was 1690. The isosbestic point was at about 872 mu. The ab—
sorption spectra, with the isosbestic point, are shown in Fig. 5. The
absorbance and molar absorptivity values, at four wavelengths, for
the different runs are given in Table 5 and the plots of the molar
absorptivity values vs. the mole ratio of 3,5—1ut/I2 are shown in
Fig. 6.
2,3,6-Collidine - Iodine Complex. The absorption spectra of
the complex showed a maximum at 822 mu, and the isosbestic point was
at about 879 mu. The molar absorptivity at 822 mu was 1600. The ab-
sorption Spectra, with the isosbestic point, are shown in Fig. 7. The
absorbanceewfl.molar absorptivity values, at four wavelengths, for the
different runs are given in Table 6 and the plots of the molar ab-
sorptivity values vs. the mole ratio of 2,3,6-coll/I2 are shown in
Fig. 8.

0.5
0.8t
aouquosqv
tl
A1
360
Fig.
3.
800
850
500
550
Wavelength
(mu)
Absorption
spectra
of
2,8-Lutidine
-12
system
in
carbon
tetrachloride
(Run
I).
20

21
Table 8. Spectrophotometric data of mole ratio method on the 2,8—1utidine -
12 system in CC14
Conc. M.R. of 800 mu 8l2 mu 880 mu 517 mu
of I2 2,8—Lut/I2 As 6 As 6 As 6 As 6
Run I 0.0 0.000 0 0.001 8 0.028 86 0.256 920
1.0 .033 119 .037 133 .086 165 .280 862
.0002781 M 5.7 .137 892 .150 580 .120 832 .189 680
53.8 .352 1265 .385 1388 .278 985 .070 252
188 .395 1820 .830 1585 .302 1085 .088 158
370 .820 1510 .857 1688 .318 1128 .038 122
555 .819 1508 .858 1650 .321 1158 .030 108
780 .827 1537 .859 1658 .320 1150 .027 97
Run II 0.0 .008 8 .013 13 .091 88 .950 915
1.0 .310 298 .350 337 .307 295 .766 737
.001039 M 89.5 1.505 1850 1.627 1565 1.186 1108 .189 188
188 1.578 1520 1.705 1680 1.185 1180 .118 110
288 1.627 1565 1.738 1673 1 200 1155 .105 101
308 1.632 1571 1.737 1672 1.177 1133 .100 96
810 1.655 1592 1.767 1700 1.175 1130 .098 98
513 1.683 1620 1.770 1705 1.180 1135 .095 92
Run III 0.0 .006 11 .010 19 .089 98 .888 933
1.0 .111 212 .122 233 .121 231 .831 826
.0005230 M 87.7 .733 1801 .790 1510 .558 1058 .088 168
209 .808 1585 .868 1610 .595 1137 .060 115
318 .815 1558 .878 1670 .596 1139 .055 105
818 .819 1565 .879 1679 .596 1139 .053 101
523 .835 1595 .886 1693 .595 1137 .050 96
Run Iv 0.0 .008 6 .008 13 .058 87 .575 922
. 1.0 .189 239 .163 261 .157 252 .898 793
.0006236 M 80.0 .850 1362 .925 1882 .650 1082 .120 192
175 .950 1522 1.028 1682 .713 1185 .070 112
263 .960 1538 1.035 1660 .710 1138 .067 107
382 .970 1555 1.088 1675 .708 1135 .063 101
512 1.000 1602 1.067 1710 .708 1130 .058 93
577 .992 1590 1.066 1709 .710 1138 .057 91

L
1800
812
mu
1600’
800
mu
<5 13
11100
PQ
1200-
880
mu
1000
.
OL
Ln
1n
L
O100
200
300
800
500
600
Mole
Ratio
of
2,8—Lutidine
to
12
Fig.
8.
Mole
Ratio
Method
on
the
2,8—Lutidine
—I2
system
in
carbon
tetrachloride
79
22

aoueqdosqv
0.3-
0.2'
p—"""”’flfiydfl'rfi
‘
0.0
‘4
360
800
850
500
550
600
Wavelength
(mu)
lA
Fig.
5.
Absorption
spectra
of
3,5-Lutidine
-I2
system
in
carbon
tetrachloride
(Run
IV).
23

28
Table 5. Spectrophotometric data of mole ratio method on the 3,5-1utidine -
12 system in CC14.
Conc. M.R. of 809 mp 830 mu 860 mu 517 mu
of I2 3,5-Lup/IZ As 6 As e As 6 As 6
Run I 0.0 0.006 12 0.022 88 0.138 268 0.870 927
1.0 .137 273 .125 289 .158 316 .801 800
.0005018 M 5.0 .819 838 .350 698 .212 823 .263 525
20.0 .672 1380 .552 1100 .257 513 .125 250
50.0 .779 1555 .635 1267 .283 568 .080 160
101 .815 1627 .660 1316 .288 575 .068 128
201 .888 1685 .675 1386 .285 568 .052 108
302 .882 1680 .670 1338 .275 588 .086 92
802 .836 1670 .660 1316 .275 588 .085 90
Run II 0.0 .005 10 .021 82 .128 256 .866 932
1.0 .130 260 .120 280 .153 306 .801 802
.0005005 M 5.1 .818 828 .350 700 .218 828 .271 582
20.5 .693 1386 .565 1130 .270 580 .138 268
101 .820 1680 .665 1330 .288 576 .065 130
202 .835 1670 .677 I358 .291 582 .058 108
303 .886 1692 .676 1352 .289 578 .051 102
808 .882 1688 .667 1338 .278 556 .086 92
505 .886 1692 .667 1338 .280 560 .086 92
Run III 0.0 .012 18 .080 88 .218 258 .773 930
1.0 .300 361 .270 325 .273 328 .625 752
.0008318 M 25.6 1.275 1535 1.038 1289 .860 553 .188 178
156 1.807 1692 1.118 1385 .868 568 .088 101
312 1.826 1715 1.113 1380 .851 582 .077 93
390 1.838 1730 1.123 1352 .858 586 .075 90
868 1.867 1763 1.130 1360 .860 553 .075 90
Run IV 0.0 .009 32 .017 61 .076 275 .260 935
1.0 .056 201 .058 198 .085 305 .280 862
,9002781 M 6.1 .193 693 .163 585 .111 800 .168 608
153 .860 1652 .370 1330 .161 578 .080 188
257 .865 1670 .378 1358 .163 585 .038 122
350 .867 1678 .372 1338 .159 572 .031 112
867 .876 1711 .378 1358 .160 575 .030 108
583 .888 1755 .388 1381 .163 585 .030 108

1800
16
1800I
1200’
ni109
mp.
830
mu
860
mu
C)
‘P
517
mu
Lk
—V
_v
Il
Fig.
6.
100
Mole
Ratio
Method
on
i
200
300
Mole
Ratio
of
3,5-Lutidine
to
IZ
the
3,5-Lutidine
—I2
system
in
carbon
tetrachloride.
800
25

J—
m
C
i
N
C)
aoueqjosqv
0.0
a
360
Fig.
7.
Ll
800
850
500
Wavelength
(mu)
Absorption
spectra
of
2,3,6-C011idine
—I2
system
550
in
carbon
tetrachloride
(Run
III).
26

27
Table 6. Spectrophotometric data of mole ratio method on the 2,3,6-collidine
- 12 system in CCl4
Conc. M.R. of 800 mu 822 mu 850 mu 517 mu
of I2 (kfllidine/Iz As 6 As 6 As 6 As 6
Run I 0.0 0.005 10 0.018 27 0.086 165 0.882 923
1.0 .022 82 .037 73 .100 192 .871 903
.0005215 M 5.0 .070 138 .105 201 .188 288 .880 888
9.9 .121 232 .176 337 .198 380 .803 777
50.0 .380 652 .857 875 .385 738 .250 878
96.3 .818 803 .570 1092 .870 900 .187 359
289 .525 1008 .706 1355 .555 1063 .118 226
883 .560 1075 .787 1833 .581 1115 .108 200
701 .590 1131 .767 1872 .592 1135 .095 182
1000 .618 1176 .786 1510 .595 1180 .088 169
1850 .663 1271 .809 1552 .598 1188 .083 159
1982 .653 1252 .805 1582 .592 1135 .081 155
3820 .776 1890 .858 1686 .592 1135 .073 180
Run II 0.0 .008 8 .027 26 .170 168 .970 933
1.0 .062 60 .103 99 .218 210 .919 885
.0010393 M 28.9 .670 685 .916 882 .772 782 .886 868
96.8 1.010 972 1.337 1287 1.060 1020 .330 318
802 1.210 1165 1.588 1890 1.180 1135 .180 173
810 1.370 1320 1.613 1552 1.185 1180 .160 158
1215 1.885 1830 1.685 1620 1 200 1155 .157 151
1620 1 627 1565 1.730 1665 1.180 1135 .186 181
2025 1.828 1780 1.785 1718 1.182 1137 .188 139
Run III 0.0 .001 8 .008 28 .086 165 .262 981
1.0 .006 22 .013 87 .089 176 .258 913
.0002781 M 37.2 .108 378 .185 521 .180 503 .187 672
130 .187 672 .272 977 .230 827 .122 838
583 .270 970 .371 1335 .302 1085 .078 282
905 .299 1075 .395 1820 .308 1108 .057 205
1510 .380 1221 .817 1500 .315 1133 .050 180
1880 .360 1293 .830 1585 .322 1157 .089 176
2255 .359 1290 .829 1582 .320 1150 .087 169
2570 .388 1251 .825 1530 .320 1150 .087 169
Run Iv 0.0 .006 11 .015 27 .090 162 .518 928
1.0 .028 50 .082 76 .106 191 .503 903
.0005561 M 83.3 .383 617 .875 853 .810 736 .278 500
130 .500 900 .678 1220 .550 988 .172 309
260 .571 1028 .755 1358 .600 1078 .132 237
758 .663 1198 .838 1508 .688 1158 .100 180
1138 .800 1880 .890 1598 .652 1171 .098 169
1520 .828 1890 .900 1618 .650 1168 .087 156
2085\ .832 1896 .907 1630 .687 1162 .086 188

1800
P
1600'
822
mu
‘0.--‘G
C)
1200
1000
n
2003’
IL_
&517
mu
‘V
fir
:r-mc
O,
LL
11.
.J
.A
'N'
.
O200
800
600
800
1000
1200
1800
1900
Mole
Ratio
of
2,3,6-Collidine
to
la
Fig.
8.
Mole
Ratic
method
on
the
2,3,6vCollidine
—I2
system
in
carbon
tetrachloride.
'l
28

29
8-Phenylpyridine — Iodine Complex. The absorption spectra of the
complex seemed to depend markedly on the concentrations of iodine and
8-phenylpyridine. From Runs II to V, the maximum absorption peak was
at about 810 mu, and the isosbestic point at 873 mu. The Ketelaar's
plots showed that a straight line generally could not be obtained.
In the wavelength region between 810 mu and 830 mu, a fairly straight
line might be drawn through the points. However, the formation con-
stants calculated at 810 to 830 mu differ widely, ranging from about
80 to 200 (liter/mole), and the values were reproducible for runs (IV
and V) with approximately equal iodine concentration. The absorption
spectra, with the isosbestic point, are shown in Fig. 9. The data for
the Ketelaar's plots, at six wavelengths, are given in Table 7 and the
Ketelaar's plots are shown in Fig. 10.
3,5—Dichloropyridine — Iodine Complex. The absorption spectra of
the complex showed a maximum at 880 mu, and the isosbestic point was
at 885 mu. The molar absorptivity at 880 mu was 1320. The absorption
Spectra of the complex are shown in Fig. 11. The data for Ketelaar's
plotg at four wavelengths, for the different runs are shown in Table 8
l
— Ex
and the Ketelaar's plots of E
t
vs. are shown in Fig. 12..1.
CB
Detailed study of change in absorbance of the solutions with time
was not carried out. About half of the solutions of every complex were
rerun after a period of twenty—four to thirty hours. With the excep—
tion of 8—picoline and 8-phenylpyridine, only slight changes (from 0.3
to 8 per cent) in absorbance were observed. For 8-picoline and 8—
phenylpyridine, greater changes in absorbance (from 5 to 8 per cent)
were observed for several solutions. No correlation of change in
aouquosqw
0.5
0.8
-
0.3
.-.
0.0‘
i.
360800
850
500
550
Wavelength
(mu)
Fig.
9.
Absorption
spectra
of
8-Phenylpyridine—I2
system
in
carbon
tetrachloride
(Run
II).
30

31
Table 7. Spectrophotometric data for Ketelaar's plots on 8—phenyl—
pyridine - 12 system in CCl4
Conc. M.R. of _l_ 1 4
of I2 B/IZ CB at - exx 10
390 800 810 820 830 850
mu mu mu mu mu mu
Run I 20 100 9.65 8.30 7.92 8.36 9.76 17.60
50 80 6.72 5.99 5.82 6.19 7.15 12.99
.0005010 M 200 10 5.03 8.83 8.75 5.09 5.90 10.10
399 5 3.88 3.61 3.98 8.37 5.22 9.20
898 8 3.08 3.28 3.61 8.12 8.93 8.77
Run II 73 89.5 9.88 7. 83 6.88 7.13 8.12 15.15
185 28.8 8.08 6. 61 6.11 6.82 7.36 13.65
.0002781 M 298 12.2 7.88 6. 23 5.79 6.08 6.95 12.82
882 8.1 7.19 5. 97 5.60 5. 89 6.79 12.67
735 8.9 6.85 5. 82 5.50 5. 78 6.73 12 67
Run III 198 28.7 8.08 6.60 6.11 6.38 7.20 13.30
587 8.16 6.98 5.85 5.88 5.70 6.52 12.02
.0002086 M 980 8.88 6.12 5.26 5.08 5.31 6.18 11.15
1372 3.89 5.63 8.92 8. 73 5.02 5.79 10.88
Run IV 192 15.1 7.86 6.32 5.78 6.01 6.95 12.75
319 9.02 7.02 5.88 5.52 5.76 6.63 12.09
.0003880 M 887 6.85 6.88 5.76 5 88 5.70 6. 58 12.09
578 5.02 6.87 5.53 5.16 5.52 6. 82 11.78
Run v 171 16.9 7.67 6.38 5. 90 6.17 7.07 13 03
256 11.3 7.30 6.12 5 78 5.98 6.92 12.68
.0003865 M 381 8.85 6.98 5.82 5. 88 5.78 6.68 12.05
512 5.68 6.55 5. 56 5.30 5. 50 6.88 11.75
683 8.23 6.12 5. 23 5.10 5. 82 6.35 11.52

x104
’—
L/
"'4 l
32
18
13- 1 /e’
,r'
C) ’1
/
/
z’
12. ,z’ 45”
/0//
/ O
V, ”’ 1. 850 mo
11” 2. 390 mu
3. 830 mu
8. 800 mu
10’ 5. 820 mu
6. 810 mu
9.
8,
LL 1 1 J 41 J .—
0 3 6 1 9 l2 15 10
CB
Fig. 10. Ketelaar's Plotsfor 8-Phenylpyridine—Iz system in
carbon tetrachloride (Run V).

0.5
0.2r
aouquosqV
0.0
360
Fig.
11.
800
850
5110
550
Wavelength
(mu)
Absorption
spectra
of
3,5-Dichlorophyridine-I2
system
in
carbon
tetrachloride
(Run
I).
33

38
Table 8. Spectrophotometric data for Ketelaar's plots on 3,5-dichlor0-
pyridine - 12 system in CCl4
___l___ 3
Conc. M.R. 0f .3; 6t - E X 10
of I 2 B/I 2 c X
B 800 mu 820 mu 880 mu 860 mu
Run I 282 9.97 6.62 3.60 3.11 8.83
362 6.65 8.67 2.63 2.38 3.32
.0008157 M 883 8.97 3.85 2.22 1.96 2.77
1078 2.23 2.62 1.89 1.33 1.89
1615 1.89 2.27 1.30 1.17 1.68
Run II 1.0 -- -- -- -- ~-
361 10 5.67 3.16 2.88 8.03
.0002781 M 722 8.97 3.71 2.08 1.85 2.67
1070 3.36 3.03 1.70 1.58 2.21
1775 2.03 2.38 1.39 1.25 1.79
2820 1.89 2.16 1.25 1.18 1.65
2880 1.27 2.18 1.22 1.11 1.62
Run III 158 15.60 7.58 8.29 3.80 5.88
231 10.80 5.56 3.16 2.80 3.98
.0008171 M 308 7.80 8.85 2.53 2.28 3.22
388 6.28 3.88 2.19 1.97 2.81
615 3.90 3.00 1.73 1.57 2.22

35
0 2 8 6 1 8 10
CB
Fig. 12. Ketelaar's Plotsfor 3,5-Dichloropyridine - I2 system
in carbon tetrachloride (Run III).
12 18

36
absorbance with concentrations of iodine and pyridine bases could be
observed. However, there was a tendency that greater changes were
observed for solutions of high concentration of pyridine base (high
pyridine—base/IZ mole ratio).
The degree of dissociation and formation constant values for the
five complexes are listed in Table 9. For 8—phenylpyridine-iodine
system, because of non—linearity of Ketelaar's plots and variation
of formation constant value with wavelength, no meaningful values of
formation constant can be given.

Table 9. Degree of dissociation, formation constants of Iodine - sub-
stituted pyridine complexes in carbon tetrachloride.
Complex Run ancquf 0 K Kf
2 Average
I .0005215 0.908 225
. . II .0005196 .908 226
L‘P1C°llne ‘ 12 III .0002781 .985 222 223
IV .0006951 .882 218
I .0002781 .923 325
. . II .0010390 .813 290
2’h"L”tld1“€ ‘ 12 III .0005230 .871 325 317
IV .0006236 .852 327
I .0005018 .883 881
. . II .0005005 .888 822
3’5‘LUt1dlne ' 12 III .0008318 .780 835 838
IV .0002781 .898 855
I .0005215 .9g8 i2.8
. . II .0010390 .9 3 9.7
2,3,6-C0111d1ne - 12 III .0002781 .987 148.1 50.9
IV .0005561 .972 53.2
I .0008157 -- 3.63
3,5—Dichloropyridine - I2 II .0002781 -— 3.89 3.77
III .0008171 -- 3.78

DISCUSSION OF RESULTS
The complex formation of iodine with certain substituted pyridines
have been studied in carbon tetrachloride solutions. In each case a
1:1 complex between the amine and the halogen was expected7'10. As
will be shown below, in the case of 8-phenylpyridine some evidence was
obtained for the formation of higher complexes.
In most cases the molar absorptivity of the complex was obtained
by the extrapolation of the mole-ratio plots.7 It should be noted that
in the case of very weak complexes, such as 2,3,6—collidine-iodine
complex, very large excess of the base had to be added (up to 2000 fold
excess) before the absorbance became reasonably constant. Under these
conditions the solutions were quite concentrated in the base and small
deviations in the molar absorptivity were observed, which could be due
to the change of the refractive index of the solution7,34. In any
case the change in the extrapolated molar absorptivity was quite small
and should not affect the calculated value of the complex formation
constant.
The data obtained in this investigation indicated that the posi-
tions of the absorption maximum as well as those of the isosbestic
. point are somewhat related to the strength of the complex. Thus for
3,5-lutidine—iodine complex, which is the strongest complex in the
series, both maximum absorption peak and isosbestic point are at shorter
wavelengths than that of the other complexes, while 3,5—dichloropyridine
has the longest wavelengths for its maximum absorption peak and its
isosbestic point.
38

39
The 8—phenylpyridine-iodine complex offers an interesting example
of a case where more than one complex can be expected to form in solu-
tion. It has long been regarded that the presence of only one absorb—
ing complex was evidenced by a straight line resulting from the Benesi-
Hildebrand plot.25728 Recently, however, Johnson and Bowen29, using
synthetic data, showed that a straight line could be obtained from the
Benesi—Hildebrand plot even though two different complexes might be
present in solution. They concluded that constancy of formation constant
calculated at different wavelengths was a better criterion for assert—
ing the presence of only one complex. This present study of 8—phenyl-
pyridine-iodine complex showed that at low iodine concentration a
fairly straight line could be obtained between 810 mu to 830 mu, using
Ketelaar's modification of Benesi—Hildebrand plots. At other wave—
length regions studied, reasonably straight lines generally could not
be obtained. However, even in the region that gave fairly straight
lines, the resulting formation constant calculated at different wave-
lengths differed widely, ranging from 80 to 200 (l/m). From Runs IV
and V, with approximately equal concentration of iodine and excess 8-
phenylpyridine, the results were reproducible. The values varied with
iodine concentration and also were affected by the concentration of
the base. In Run I, at higher iodine concentration, the maximum ab-
sorption peak shifted from 810 mu at 8-phenylpyridine/iodine mole ratio
of 20 to about 375 mu at mole ratio of 500. This drastic shift of
maximum absorption was not observed in the other compounds studied.
The presence of more than one absorbing complex was further affirmed
by the high molar absorptivities obtained from Ketelaar's plots. It

80
is likely that at relatively low iodine/base mole ratios, the complexa-
tion occurs primarily through the nitrogen of the pyridine ring. At
higher concentration of iodine, the complexation of phenyl group with
iodine becomes more extensive and thus causes a change in molar ab-
sorptivity and shift of maximum absorption peak to lower wavelength.
Due to lack of time the study of the two 8-phenylpyridine-iodine
complexes were not pursued further.
From Table I, it is seen that 2,8-lutidine is slightly more
basic than 3,5-lutidine. However, due to the presence of one methyl
group adjacent to the complexing nitrogen atom, the complex formation
is slightly hindered. Thus 2,8—1utidine forms a weaker complex than
3,5—1utidine. The effect of steric hindrance is more pronounced for
2,3,6—collidine, in which two methyl groups are adjacent to the com—
plexing nitrogen atom. Thus though 2,3,6—collidine is the strongest
base, it forms the weakest complex among the four methyl pyridines
studied. Comparison between the formation constants of iodine with
3,5—dichlor0pyridine and 2—ch10ropyridine also reveal the steric
effect of the chlorine atom adjacent to complexing nitrogen atom. Al-
though 2-chlor0pyridine is more basic than 3,5-dichloropyridine, steric
hindrance again renders the 2—chloropyridine-iodine complex to be
slightly weaker than that of the 3,5-dichloropyridine.
The strength of the iodine-pyridine base complexes follows the
order 3,5-lutidine > 2,8—lutidine > 8—picoline > 2,3,6-collidine >
3,5—dichloropyridine. The order of basic strength is as follows:
2,3,6—collidine > 2,8—1utidine > 3,5-lutidine > 8-picoline > 8—phenyl-
pyridine > 3,5-dichloropyridine.

81
In summary, the investigations of the interaction of iodine with
some substituted pyridines have shown the following: (1) The Lewis
acid—base interaction of pyridines with iodine does not parallel
their basic strength. This is probably due to steric effects. (2)
Iodine—8—phenylpyridine system cannot be explained on the basis of a
simple 1:1 complex formation. It is possible that the results are
indicative of the presence of more than one complex.

la.
1b.
2b.
10.
ll.
12.
13.
18.
15.
16.
17.
18.
H.
BIBLIOGRAPHY
.A. Benesi and J. H. Hildebrand, J. Am. Chem. Soc., 19, 2832
(1988).
Ibid., 7;, 2703 (1989).
M. Chatelet, Compt. rend. $96, 1821 (1933).
Ibid., 196, 1607 (1933).
R.
O.
H.
. Hassel, Chr. Roemming and T. Tufte, Acta Chem. Scand., 15
. Sacconi, P. Paoletti and M. Ciampolini, J. Am. Chem. Soc., 82
A. Zingaro, C. A. Vander Werf and J. Kleinberg, J. Am. Chem.
Soc., 73, 88 (1951).
. L. Glusker, H. W. Thompson and R. S. Mulliken, J. Chem. Phys.,
3;, 1807 (1953).
. Reid and R. S. Mulliken, J. Am. Chem. Soc., 16, 3869 (1958).
. Nagakura, J. Am. Chem. Soc., 89, 520 (1958).
. I. Popov and R. H. Rygg, J. Am. Chem. Soc., 72, 8622 (1957).
. S. Mulliken, J. Am. Chem. Soc., 16, 811 (1952).
. L. Glusker and A. Miller, J. Chem. Phys., 39, 331 (1957).
3
967 (1961).
Hassel and H. HOpe, Acta Chem. Scand., 15, 807 (1961).
C. Brown, H. I. Schlesinger and S. Z. Cardon, J. Am. Chem.
Soc., 66, 325 (1982).
. Basu and J. N. Chandhuri, Trans. Faraday Soc., 55, 898 (1959).
. Halleux, Bull. Soc. Chim. Belges, 66, 381 (1959).
. C. Brown and X. R. Mihm, J. Am. Chem. Soc., 11, 1723 (1955).
)
3831 (1960).
. Gero and J. Markham, J. Org. Chem., 16, 1835 (1951).
. Ikekawa, Y. Sato and T. Maeda, Pharm. Bull. (Japan), 2, 205 (1958).
cf. C. A., 59, 998f (1956).
82

19.
20.
21.
22.
23.
28.
25.
26.
27.
28.
29.
30.
31.
32.
33.
38.
35.
36.
37.
38.
83
. Nakajima and A. Pullman, J. Chim. phs., 55, 793 (1958).
. C. Brown, D. H. McDaniel and 0. Hafliger, in E. A. Brande and
F. C. Nachod, "Determination of Organic Structures by
Phydical Methods," Academic Press, Inc., New York, N.Y.,
1955.
. Favini, Gazz, Chim. Ital., 23, 635 (1963).
. C. Brown and D. H. McDaniel, J. Am. Chem. Soc., 11, 3752 (1955).
. Krumholz, J. Am. Chem. Soc., 25, 3887 (1951).
. Sobczyk, Bull. Acad. Polon. Sci. Ser. Sci. Chim., 2, 237 (1961).
cf. C. A., 59, 7388h (1963).
. M. Keefer and L. J. Andrews, J. Am. Chem. Soc., 22: 8677 (1950).
Ibid., 13, 862 (1951).
A.
R.
I.
. E. Merrifield and W. D. Philips, J. Am. Chem. Soc., 69, 2778
(1958).
. M. Voigt, ibid., 86, 3611 (1968).
. D. Johnson and R. E. Bowen, J. Am. Chem. Soc., 61, 1655 (1965).
. B. Witmer and R. A. Zingaro, J.Imme and Nuclear Chem., 15,
82 (1960).
. R. Clemo and W. M. Gourlay, J. Chem. Soc., 878 (1938).
. H. Rodd, Editor, Chemistry of Carbon Compounds, Vol. IVA,
Elsevier Publishing Company, London, 1957.
. L. Kotlyarevski, E. K. Vasil'er and L. I. Vereskchagin, C.A.
56, 9916a (1960).
N. Sharpe and S. Walker, J. Chem. Soc., 2978 (1961).
Forsyth and F. L. Pyman, J. Chem. Soc., 2912 (1926).
Heilbron, Editor, Dictionary of Organic Compounds, Vol. II,
Oxford University Press, New York, N.Y.
Beilstein Handbuch der Organischen Chemie, Band XX, 231, II 152,
J.
Springer-Verlag, Berlin, Germany, 1935, 1958.
A. A. Ketelaar, C. v.d. Stolpe, A. Goudsmit and W. chubas,
Rec. trav. Chim., Z}, 1108 (1952).

CHEMISTRY LIIM