Embed Size (px)
DESCRIPTION
ppt
Citation preview

David McWilliamsClinical Specialist Physiotherapist - UHB ACPRC Critical Care Champion

What do we know…- Muscle atrophy (2% loss per day)- VO2 Max (↓ 0.9% per day)- Bone demineralisation (6mg/day calcium) = Approx
2% bone mass/month (Up to 2 years to recover)- ↑ HR (required to maintain resting VO2)- ↓ SV (Approx 28% after 10 days bed rest)
(Compensated by ↑ Ejection Fraction)
* Note all these results involve healthy individuals, disease, malnutrition, sedatives, paralytics and sepsis all have the potential to increase these responses

Prolonged ventilation in critical care is associated with impaired health related quality of life up to 3 years after discharge, even when patients are living independently at home
(Coombes et al 2003)
Persistent functional disability demonstrated over 5 years following discharge in ARDS patients
(Herridge et al 2003 & 2008)
Long Term Effects - Physical
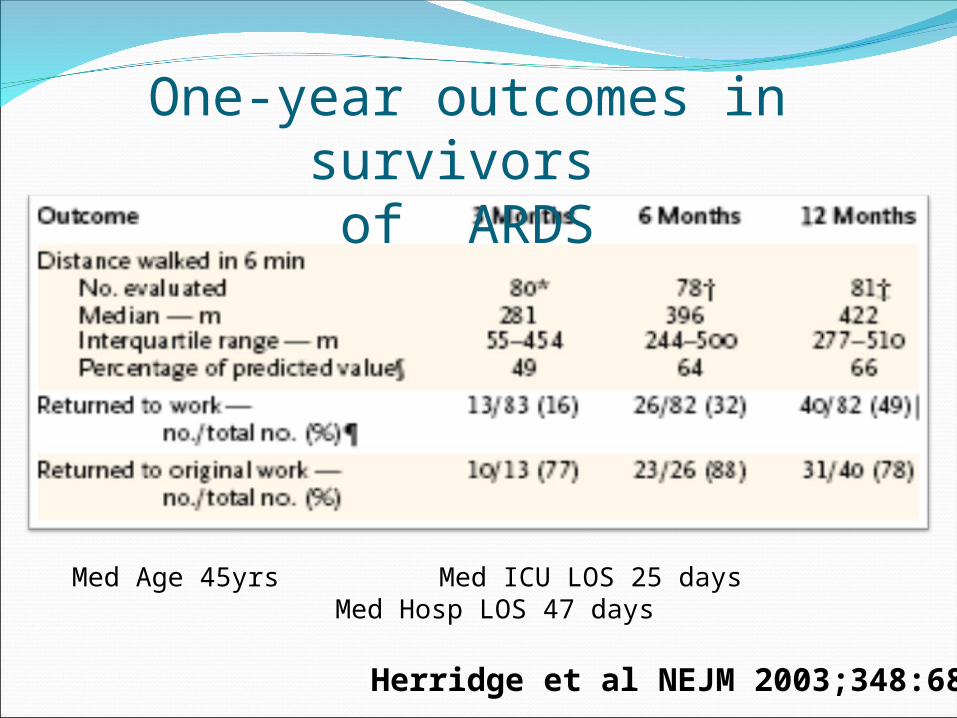
One-year outcomes in survivors of ARDS
Herridge et al NEJM 2003;348:683
Med Age 45yrs Med ICU LOS 25 days Med Hosp LOS 47 days

The negative effects of intensive care may take months to recover and are more likely with prolonged ICU stays and longer hours of ventilation
……EVERY DAY COUNTS!!

NICE CG83- Advocated early and
structured rehabilitation programmes for patients admitted to critical care
- Importance of Key workers
- MDT working / Communication
- Closer links to ward and community

The evidence

Morris et al (2008)
University Medical ICU in USADoes mobility protocol increase proportion of
patients receiving physical therapy330 subjects recruited and randomisedAn ICU Mobility team initiated protocol
within 48 hours of mechanical ventilation

LEVEL 1 LEVEL 4LEVEL 2 LEVEL 3
Can move arms
against gravity
Can move legs
against gravity
Morris et al - Early Therapeutic Mobility Protocol.
Unconscious Conscious Conscious Conscious
Turn every 2hr Turn every 2hr Turn every 2hr Turn every 2hr
Passive ROM exercises
Sitting position min 20 minutes 3x daily
Sitting position min 20 minutes 3x day.
Sitting position min 20 minutes 3x day.Sitting on edge of bed with Physical therapist
Active resistance range of motion (ROM) with physical therapy or RN daily
Sitting on edge of bed with Physical therapist
Active Transfer to Chair (OOB) with Physical Therapist Minimum 20 minutes

ResultsOutcome Protocol Control P Value
Proportion of patients receiving physical therapy
80% 47% p<0.001
Therapy initiated on ICU 91% 13% p<0.001
Ventilator days 8.8 10.2 p=0.163
ICU LOS (days) 5.5 6.9 p=0.025
Hospital LOS (days) 11.2 14.5 p=0.006

Schweickert et al (2009)“Early physical and occupational therapy inMechanically ventilated, critically ill patients: arandomised controlled trial”
- >18 years- Ventilated <72hrs but expected to cont >24hrs
- Randomly assigned to:- Intervention (PT & OT with daily sedation holds)
n=49- Control (Physician ordered sedation holds and
therapy sessions) n=55
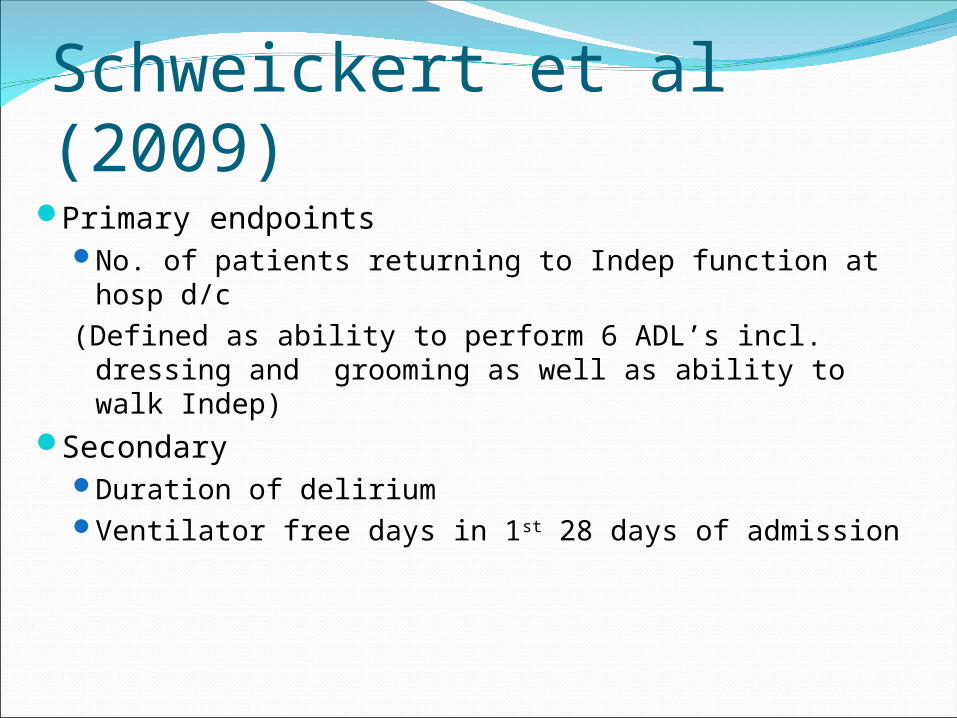
Schweickert et al (2009)Primary endpoints
No. of patients returning to Indep function at hosp d/c
(Defined as ability to perform 6 ADL’s incl. dressing and grooming as well as ability to walk Indep)
Secondary Duration of deliriumVentilator free days in 1st 28 days of admission

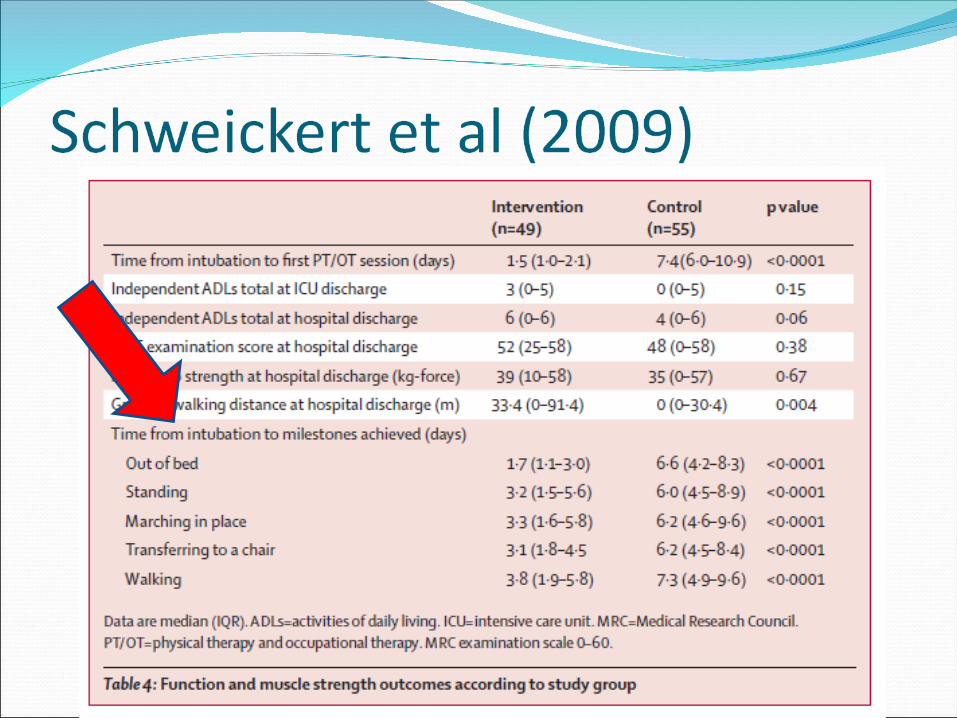
ResultsIntervention (n=49)
Control (n=55) p value
Time from intubation to first OT / PT session
1.5 days (1.0 – 2.1)
7.4 days(6.0 – 10.9)
<0.0001
Return to independent functional status at hospital discharge
29 (59%) 19 (35%) 0.02
Barthel Index score at hospital discharge
75 (75-95) 55 (0-85) 0.05
Duration of delirium 2.0 days 4.0 days 0.02
Ventilator free days 23.5 (7.4–25.6) 21.1 (0.0-23.8) 0.05
Length of stay in ICU (days) 5.9 (4.5-13.2) 7.9 (6.1-12.9) 0.08
Hospital mortality 9 (18%) 14 (25%) 0.53
Data are n (%), median (IQR), or mean (SD).


McWilliams & Pantelides (2008)
65 Patients admitted to ICU from 20th Jun - 20th Sept 2005
(Exclusions: Patients ventilated on ITU for < 48 hours)
Objectives:To identify limiting factors to early mobilisation & facilitate methods to decrease these
To identify whether sitting patients on the edge of the bed or out in a chair within the first 5 days of admission decreases length of stay on ITU

Results17 patients sat on edge/ out by day 5 on ITU (26%)
48 did not
So what?

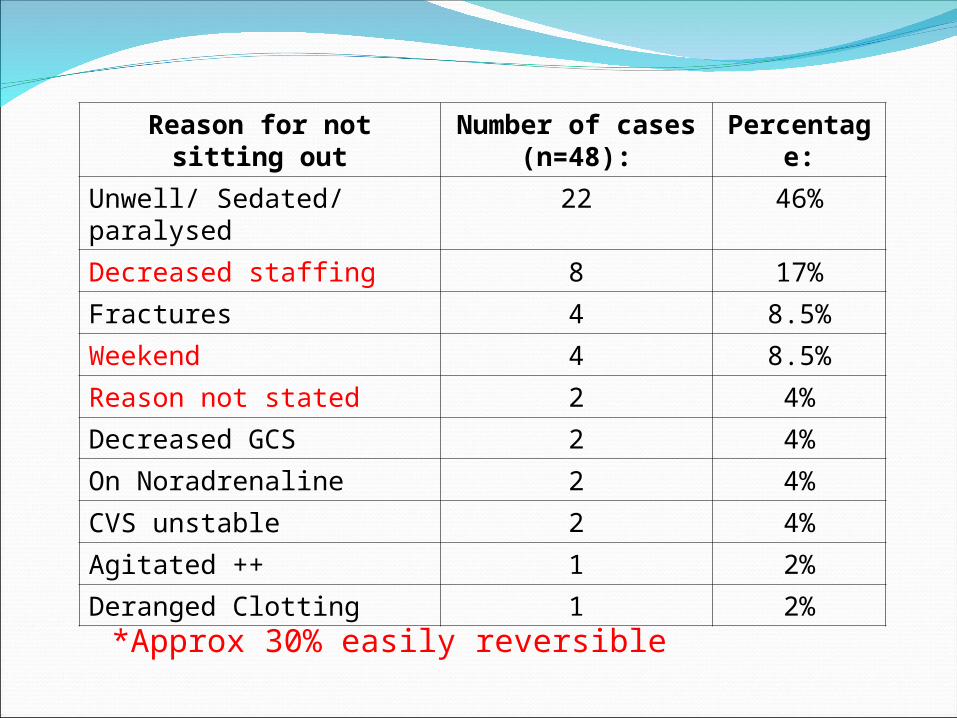
Reason for not sitting out Number of cases (n=48):
Percentage:
Unwell/ Sedated/ paralysed 22 46%
Decreased staffing 8 17%
Fractures 4 8.5%
Weekend 4 8.5%
Reason not stated 2 4%
Decreased GCS 2 4%
On Noradrenaline 2 4%
CVS unstable 2 4%
Agitated ++ 1 2%
Deranged Clotting 1 2%
Reason for not sitting out Number of cases (n=48):
Percentage:
Unwell/ Sedated/ paralysed 22 46%
Decreased staffing 8 17%
Fractures 4 8.5%
Weekend 4 8.5%
Reason not stated 2 4%
Decreased GCS 2 4%
On Noradrenaline 2 4%
CVS unstable 2 4%
Agitated ++ 1 2%
Deranged Clotting 1 2%
*Approx 30% easily reversible

Met
standardMet
StandardDid not meet
standard
Mobilisation took place
By the 5th day
Not by 5th day
Not by the 5th day
No. of cases 17/65 (26%)
14/65 (22%)
34/65 (52%)
Mean LOS 5.7 days 12.9 days 21.1 days
Range (LOS) 2-18 days 3-29 days 5-86 days
Results

ConclusionSmall numbersNumerous variablesBUTSignificant difference for those patients
mobilised (approx 7 days)7 days = £10,00014 pts = £140,000 over 3 months= £560,000 p/a potentially avoidable with ↑
staff/ resources

But…..What does early really mean and how can we
measure it?????

Time To Mobilise

Time To MobiliseMorris et al 2008 - 1st day out of
bed - Day 5 vs day 11
(p<0.001)- Doesn’t then
however show ongoing rehab level acheived

What about overall level achieved…
Needham et al. Early Physical Medicine and Rehabilitation for Patients With Acute Respiratory failure: A Quality Improvement Programme. Arch Phys Med Rehabil Vol 91, April 2010
McWilliams DJ, Westlake EV. The effect of a structured rehabilitation programme for patients admitted to critical care. Intensive Care Med. 2011 Sep;37 (Supp)
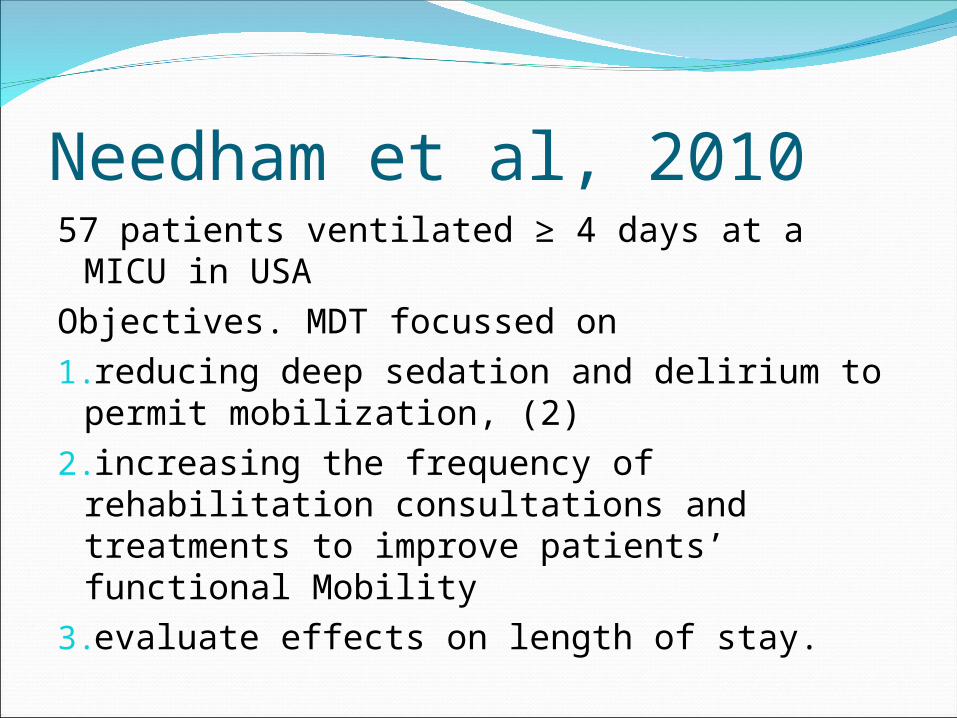
Needham et al, 201057 patients ventilated ≥ 4 days at a MICU
in USAObjectives. MDT focussed on1.reducing deep sedation and delirium to
permit mobilization, (2) 2.increasing the frequency of rehabilitation
consultations and treatments to improve patients’ functional Mobility
3.evaluate effects on length of stay.


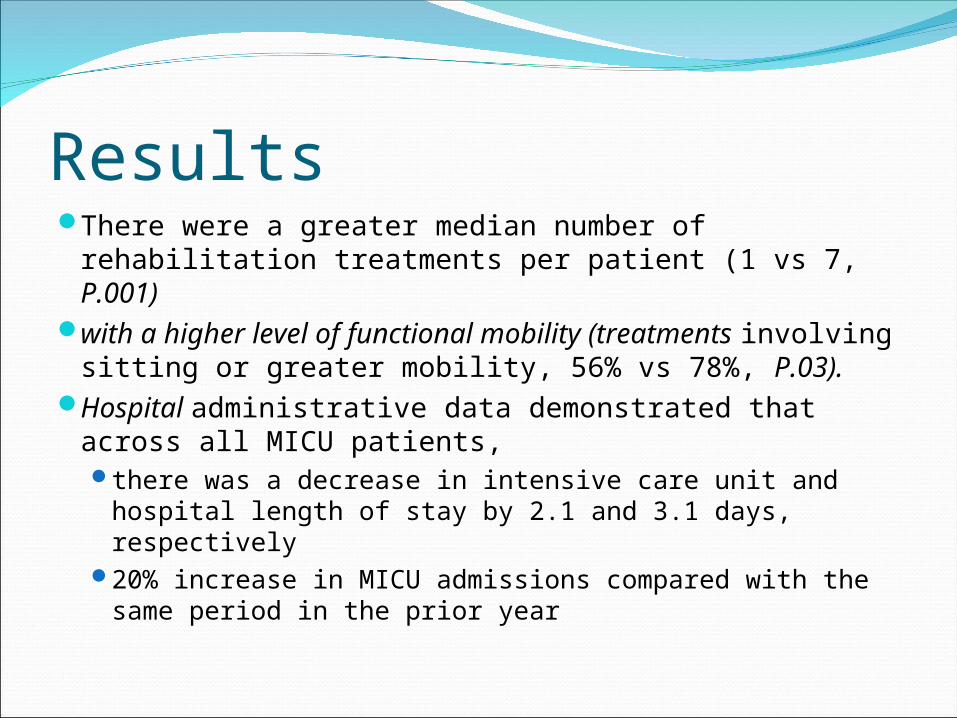
ResultsThere were a greater median number of
rehabilitation treatments per patient (1 vs 7, P.001) with a higher level of functional mobility
(treatments involving sitting or greater mobility, 56% vs 78%, P.03).
Hospital administrative data demonstrated that across all MICU patients,there was a decrease in intensive care unit and
hospital length of stay by 2.1 and 3.1 days, respectively
20% increase in MICU admissions compared with the same period in the prior year

McWilliams & westlake, 2011A more structured
programme of rehabilitation was implemented at CMFT the beginning of 2008.
This was achieved throughUse of rehab
keyworkersstructured and
documented rehabilitation plans
weekly goal setting meetings
specific MDT training and education sessions.

MethodsAll patients admitted > 5 days and surviving to ICU
discharge between 1st June and 30th September from 2007 to 2010 were included in the study.
Primary outcome measures used were Mean physical function at ICU discharge, assessed
via the Manchester Mobility Score (MMS), Mean ICU LOS and post ICU LOS
Baseline data for 2007 was obtained retrospectively, with annual figures presented for the three years following the introduction of the rehabilitation programme.

Manchester Mobility ScoreDeveloped due to a lack of robust / useful
outcome measures in ICULooks at stages of rehabilitationQuick and simple bedside measurementUses
Monitoring rehab on unitBenchmarking against other centresTime to rehabPredictor of outcome / Screening tool

Manchester Mobility Score1 – Passive Movements, Active exercise,
chair position in bed2 – Sit on edge of bed3 – Hoisted to chair (incl. standing Hoist)4 – Standing practice5 – Transfers with assistance 6 – Mobilising with or without assistance7 – Mobilising > 30mA – AgitatedU - Unwell
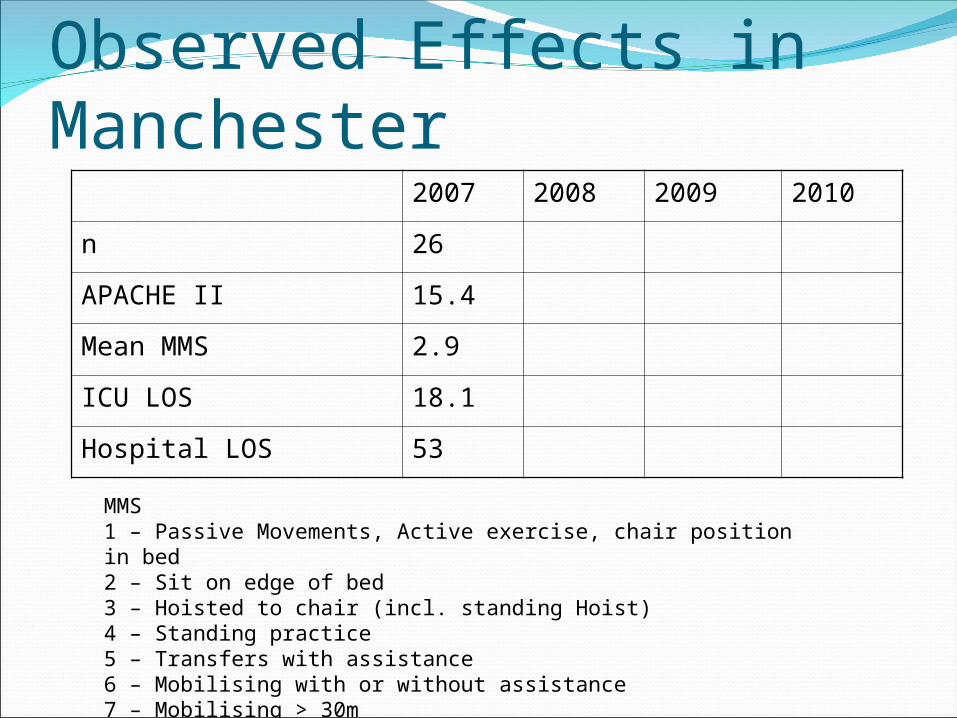
Observed Effects in Manchester2007 2008 2009 2010
n 26
APACHE II 15.4
Mean MMS 2.9
ICU LOS 18.1
Hospital LOS 53
MMS1 – Passive Movements, Active exercise, chair position in bed2 – Sit on edge of bed3 – Hoisted to chair (incl. standing Hoist)4 – Standing practice5 – Transfers with assistance 6 – Mobilising with or without assistance7 – Mobilising > 30m
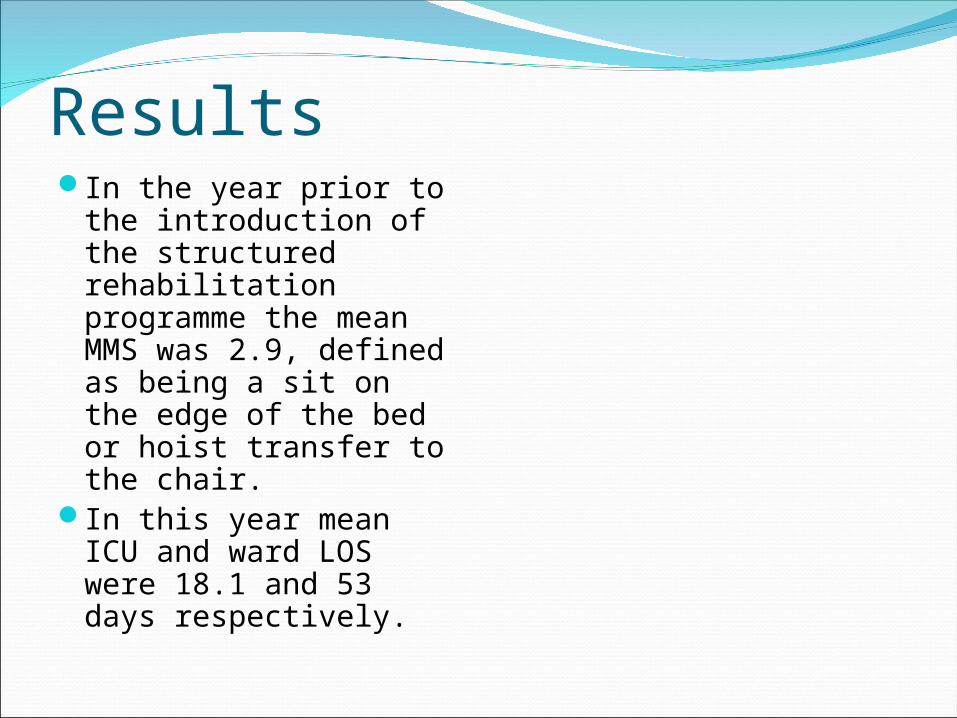
ResultsIn the year prior to the
introduction of the structured rehabilitation programme the mean MMS was 2.9, defined as being a sit on the edge of the bed or hoist transfer to the chair.
In this year mean ICU and ward LOS were 18.1 and 53 days respectively.
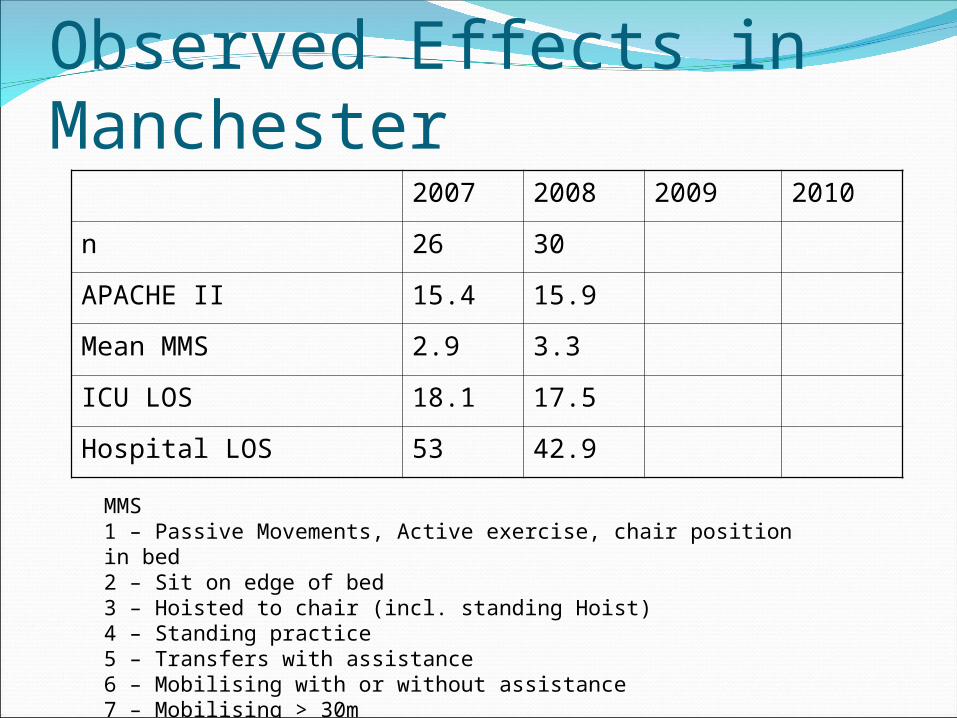
Observed Effects in Manchester2007 2008 2009 2010
n 26 30
APACHE II 15.4 15.9
Mean MMS 2.9 3.3
ICU LOS 18.1 17.5
Hospital LOS 53 42.9
MMS1 – Passive Movements, Active exercise, chair position in bed2 – Sit on edge of bed3 – Hoisted to chair (incl. standing Hoist)4 – Standing practice5 – Transfers with assistance 6 – Mobilising with or without assistance7 – Mobilising > 30m

Observed Effects in Manchester2007 2008 2009 2010
n 26 30 38
APACHE II 15.4 15.9 16.9
Mean MMS 2.9 3.3 4.0
ICU LOS 18.1 17.5 15.2
Hospital LOS 53 42.9 29.8
MMS1 – Passive Movements, Active exercise, chair position in bed2 – Sit on edge of bed3 – Hoisted to chair (incl. standing Hoist)4 – Standing practice5 – Transfers with assistance 6 – Mobilising with or without assistance7 – Mobilising > 30m
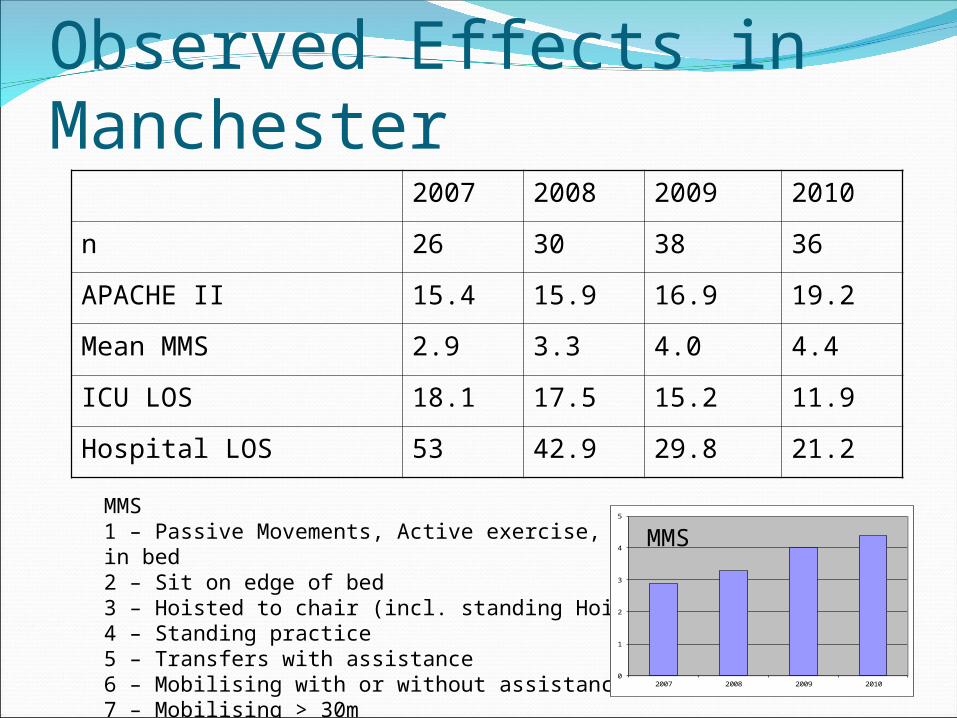
Observed Effects in Manchester2007 2008 2009 2010
n 26 30 38 36
APACHE II 15.4 15.9 16.9 19.2
Mean MMS 2.9 3.3 4.0 4.4
ICU LOS 18.1 17.5 15.2 11.9
Hospital LOS 53 42.9 29.8 21.2
MMS1 – Passive Movements, Active exercise, chair position in bed2 – Sit on edge of bed3 – Hoisted to chair (incl. standing Hoist)4 – Standing practice5 – Transfers with assistance 6 – Mobilising with or without assistance7 – Mobilising > 30m
0
1
2
3
4
5
2007 2008 2009 2010
MMS
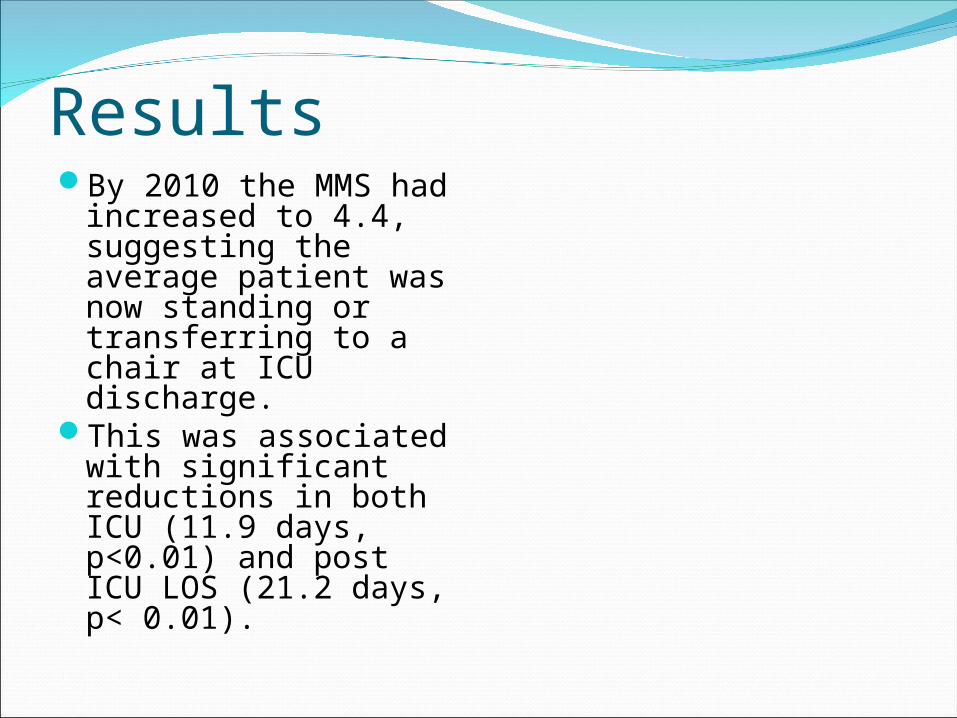
ResultsBy 2010 the MMS had
increased to 4.4, suggesting the average patient was now standing or transferring to a chair at ICU discharge.
This was associated with significant reductions in both ICU (11.9 days, p<0.01) and post ICU LOS (21.2 days, p< 0.01).
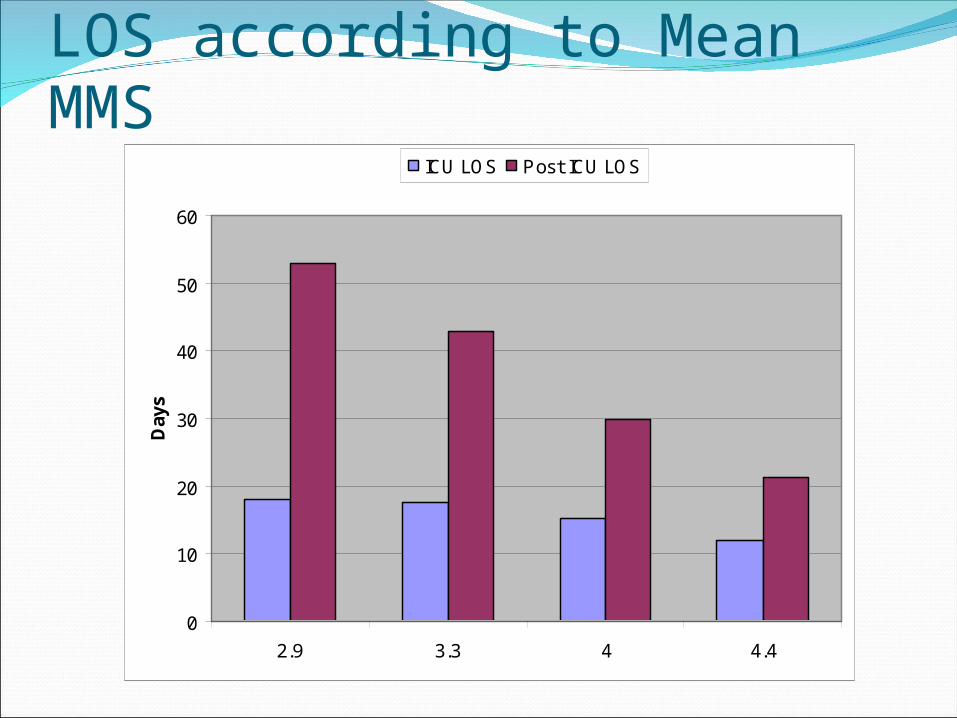
LOS according to Mean MMS
0
10
20
30
40
50
60
2.9 3.3 4 4.4
Day
sICU LOS Post ICU LOS

Observed Effects in Manchester2007 2008 2009 2010
n 26 30 38 36
APACHE II 15.4 15.9 16.9 19.2
Mean MMS 2.9 3.3 4.0 4.4
ICU LOS 18.1 17.5 15.2 11.9
Hospital LOS 53 42.9 29.8 21.2
MMS1 – Passive Movements, Active exercise, chair position in bed2 – Sit on edge of bed3 – Hoisted to chair (incl. standing Hoist)4 – Standing practice5 – Transfers with assistance 6 – Mobilising with or without assistance7 – Mobilising > 30m
0
1
2
3
4
5
2007 2008 2009 2010
MMS

ConclusionsStructured programmes of rehabilitation can
significantly increase the functional status of patients at ICU discharge.
This improvement was associated with a significant reduction in both ICU and ward length of stay.
This is at a time when patient illness severity was observed to be higher with a yearly increase to APACHE II scores.

Any Questions