Embed Size (px)
Citation preview

Structure, formation, and interactions
of ultracold polar molecules
Johannes Deiglmayr
Fakultat fur Mathematik und Physik
Albert-Ludwigs-Universitat Freiburg
Faculte des Sciences
Universite Paris-Sud XI


Structure, formation, and interactionsof ultracold polar molecules
INAUGURAL-DISSERTATION
zurErlangung des Doktorgrades
der Fakultat fur Mathematik und Physikder Albert-Ludwigs-Universitat
Freiburg im Breisgau
vorgelegt vonDipl.-Phys. Johannes DEIGLMAYR
aus Augsburg
im Oktober 2009
Promotion durchgefuhrt als Cotuelle an den Instituten
Laboratoire Aime Cotton, CNRS,Universite Paris Sud XIBat 505 Campus d’Orsay91405 Orsay CedexFrance
und
Physikalisches InstitutFakultat fur Mathematik und PhysikHermann-Herder-Str. 379104 Freiburg i.Brsg.Deutschland
Dekan : Prof. Kay KonigsmannLeiter der Arbeit : Prof. Matthias Weidemuller und
Dr. Olivier DulieuReferent : Prof. Matthias WeidemullerKoreferent : Dr. Olivier DulieuPrufer : Prof. Matthias Weidemuller
Prof. Andreas BuchleitnerDr. Roland WesterDr. Olivier DulieuDr. Olivier GorceixDr. Jacques Robert
Tag der Verkundigungdes Prufungsergebnisses : 19. November 2009

These
Presentee pour obtenir
LE GRADE DE DOCTEUR EN SCIENCES
DE L’UNIVERSITE PARIS-SUD XISpecialite : Physique
Ecole doctorale : Ondes et Matiere
par
Johannes DEIGLMAYR
Structure, formation, and interactions
of ultracold polar molecules

These preparee en cotutelle a
Laboratoire Aime Cotton, CNRS,Universite Paris Sud XIBat 505 Campus d’Orsay91405 Orsay CedexFrance
et
Physikalisches InstitutFakultat fur Mathematik und PhysikHermann-Herder-Str. 379104 Freiburg i.Brsg.Deutschland
Soutenue le 19/11/2009 devant la comission d’examenM. Olivier Dulieu (Directeur de these)M. Olivier Gorceix (Rapporteur)M. Jacques RobertM. Andreas BuchleitnerM. Matthias Weidemuller (Co-Directeur de these, Rapporteur)M. Roland Wester

I
Part of the work presented in this thesis has been published in the following articles :
– J. Deiglmayr, M. Repp, A. Grochola, K. Mortlbauer, C. Gluck, O. Dulieu, J. Lange , R. Wes-ter, M. Weidemuller, Formation of ultracold dipolar molecules in the lowest vibrationallevels by photoassociation, Faraday Discussions 142, 335 (2009)
– J. Deiglmayr, P. Pellegrini, A. Grochola, M. Repp, R. Cote, O. Dulieu, R. Wester, M. Wei-demuller, Influence of a Feshbach resonance on the photoassociation of LiCs, New Jour-nal of Physics 11, 055034 (2009)
– A. Grochola, A. Pashov, J. Deiglmayr, M. Repp, E. Tiemann, R. Wester, M. Weidemuller,The B1Π state in LiCs studied by photoassociation spectroscopy, Journal of ChemicalPhysics 131, 054304 (2009)
– J. Deiglmayr, A. Grochola, M. Repp, K. Mortlbauer, C. Gluck, J. Lange , O. Dulieu, R.Wester, M. Weidemuller, Formation of ultracold polar molecules in the rovibrationalground state, Physical Review Letters 101, 133004 (2008)
– J. Deiglmayr, M. Aymar, R. Wester, M. Weidemuller, O. Dulieu, Calculations of static di-pole polarizabilities of alkali dimers. Prospects for alignment of ultracold molecules,Journal of Chemical Physics 129, 064309 (2008)
– S. D. Kraft, J. Mikosch, P. Staanum, J. Deiglmayr, J. Lange, A. Fioretti, R. Wester, M. Wei-demuller, A high resolution time-of-flight mass spectrometer for the detection of ultra-cold molecules, Applied Physics B 89, 453 (2007)
In addition, the author has contributed to the following publications :– R. Guerout, M. Aymar, J. Deiglmayr, O. Dulieu, Core repulsion effects in alkali trimers,
International Journal of Quantum Chemistry, 109 3387 (2009 )
– M. Aymar, J. Deiglmayr, O. Dulieu, Systematic trends in electronic properties of alkalihydrides, Canadian Journal of Physics, in press (2009)
– M. Reetz-Lamour, T. Amthor, J. Deiglmayr, M. Weidemuller, Rabi oscillations and excita-tion trapping in the coherent excitation of a mesoscopic frozen Rydberg gas, PhysicalReview Letters 100, 253001 (2008)
– M. Reetz-Lamour, J. Deiglmayr, T. Amthor, M. Weidemuller, Rabi oscillations betweenground and Rydberg states and van der Waals blockade in a mesoscopic frozen Ryd-berg gas, New Journal of Physics 10, 045026 (2008)

II
Zusammenfassung. Diese Arbeit untersucht theoretische und experimentelle Aspekte ultrakalterAlkali Dimere. In einem ersten, theoretischen Teil wird die Bildung ultrakalter LiCs Molekuledurch Photoassoziation (PA) betrachtet. Eine systematische Analyse aller Alkali Dimere (Ay-mar and Dulieu, 2005) wird mit der Berechung der statischen Dipol-Polarisierbarkeit fortgesetzt(Deiglmayr et al., 2008a). Ein umfangreicher Vergleich mit publizierten Arbeiten bestatigt die Zu-verlassigkeit des gewahlten Zugangs. Basierend auf diesen Berechnungen wird eine Moglichkeitaufgezeigt, ein Ensemble ultrakalter polare Molekule in externen Feldern auszurichten. Im zwei-ten, experimentellen Teil wird die Bildung polarer LiCs Molekule durch PA untersucht. Mittels PASpektroskopie wird die Bestimmung des B1Π Zustand vervollstandigt, sowie der Wert der Disso-ziationsenergie des X1Σ+ Zustands prazisiert (Grochola et al., 2009). Die Besetzung rovibronischerZustande im Grundzustand wird mit der von Kombination resonant uberhohter Mehrphotonenio-nisation und Entvolkerungs-Spektroskopie untersucht. Es wird ein einfacher Weg aufgezeigt, ul-trakalte LiCs Molekule im absoluten Grundzustand X1Σ+,v′′=0,J′′=0 zu bilden (Deiglmayr et al.,2008b). LiCs Molekule werden in einer quasi-elektrostatischen Falle, geformt durch einen CO2
Laser, gebildet und gefangen. Die Lebensdauer von τ=24(3)s in der Falle ist limitiert durch Stoßemit Hintergrundgas, Ratenkoeffizienten fur inelastische Stoße zwischen LiCs in hoch angeregtenSchwingungsniveaus und Cesium werden bestimmt. Die lange Lebensdauer in der Falle ermoglichtdie Beobachtung des radiativen Zerfalls polarer Grundzustandsmolekule.
Abstract. In this thesis properties of ultracold alkali dimers are studied both theoretically and ex-perimentally. In the first, theoretical, part, the prospects for the formation of ultracold LiCs dimersin deeply bound vibrational levels using photoassociation (PA) are investigated. Furthermore aprevious systematic investigation of the structure of all alkali dimers (Aymar and Dulieu, 2005)is extended by the ab initio calculation of static dipole polarizabilities. An extensive comparisonwith other published results supports the reliability of the chosen method. Based on these results anexperimental scheme for the creation of an sample of oriented ultracold dipolar molecules is devel-oped (Deiglmayr et al., 2008a). In the second, experimental part the formation of LiCs ground statemolecules by PA is investigated. PA spectroscopy is used to improve the accuracy of the potentialenergy curve for B1Π and the value of the dissociation energy of X1Σ+ state significantly (Grocholaet al., 2009). The rovibrational distribution of ground state molecules is probed in a combinationof resonance-enhanced multi-photon ionization and depletion spectroscopy. A simple scheme isfound to form ultracold polar LiCs molecules in the absolute ground state X1Σ+,v′′=0,J′′=0 (Dei-glmayr et al., 2008b). In a quasi-electrostatic trap created by a CO2 laser, LiCs molecules areformed and stored. A lifetime of τ=24(3)s, limited by collisions with background gas, is observedand rate coefficients for inelastic collisions between LiCs in high vibrational states and Cs atoms aredetermined. The long storage time facilitates the observation of radiative decay of polar moleculestowards lower vibrational levels.

III
Resume Dans cette these, nous avons etudie les proprietes d’un gaz ultra-froid de moleculesdiatomiques polaires d’alcalins a la fois experimentalement et theoriquement. Dans la premierepartie theorique, nous avons examine les mecanismes possibles de formation de molecules ultra-froides stables de LiCs dans des niveaux rovibrationnels tres lies, par l’intermediaire de la photo-association de paires d’atomes Li et Cs. Nous avons aussi etendu l’etude ab initio des proprieteselectroniques de tous les dimeres alcalins entreprise au Laboratoire Aime Cotton (Aymar andDulieu, 2005), au calcul de leurs polarisabilites dipolaires statiques. Dans la seconde partieexperimentale, la formations de molecules LiCs ultra-froides est exploree par photo-associationdans un gaz mixte d’atomes ultra-froids de Li et Cs. Nous avons ameliore la courbe de potentielde l’etat moleculaire excite B1Π, et nous avons decouvert un schema simple de formation deLiCs dans leur etat fondamental absolu X1Σ+,v′′=0,J′′=0 (Deiglmayr et al., 2008b). Le momentdipolaire de ces molecules dans les plus bas niveaux vibrationnels de l’etat fondamental a en-suite ete determine par spectroscopie Stark, et compare a nos calculs theoriques. Les moleculesLiCs ultra-froides ont ete conservees dans un piege dipolaire quasi-electrostatique cree par unlaser hors resonance. Nous avons observe un long temps de piegeage, caracterise par une dureede vie τ=24(3)s limitee par les collisions avec les atomes du gaz residuel. Cela nous a per-mis d’observer la desexcitation radiative des niveaux vibrationnels de l’etat fondamental de cesmolecules polaires. La section efficace de collisions inelastique ultra-froide entre molecules deLiCs dans des niveaux vibrationnels eleves de l’etat fondamental et les atomes de Cs a aussi etemesuree.

IV

V
Il faut s’imaginer Sisyphe heureux.
Man muss sich Sisyphos als glucklichen Menschen vorstellen.
– Albert Camus

VI
Contents
1 Introduction 1
I Ab initio calculation of structure and dynamics of alkali dimers 7
2 Forming ground state molecules by photoassociation 112.1 Molecular concepts . . . . . . . . . . . . . . . . . . . . . . . . . . . . . 11
2.2 Nuclear motion . . . . . . . . . . . . . . . . . . . . . . . . . . . . . . . 13
2.3 Photoassociation and molecular formation rates . . . . . . . . . . . . . . 14
2.4 Population-distribution of ground state levels . . . . . . . . . . . . . . . 21
3 Static dipole polarizability of alkali dimers 233.1 Computational method . . . . . . . . . . . . . . . . . . . . . . . . . . . 25
3.2 Static polarizability functions for X1Σ+ and a3Σ+ states . . . . . . . . . . 28
3.3 Static polarizabilities at the molecular equilibrium distance . . . . . . . . 31
3.4 Comparison with experiments . . . . . . . . . . . . . . . . . . . . . . . 36
3.5 Alignment and orientation of alkali dimers . . . . . . . . . . . . . . . . . 42
II Formation and interactions of ultracold LiCs molecules 45
4 Experimental setup 514.1 Mixture of ultracold Li and Cs atoms . . . . . . . . . . . . . . . . . . . . 51
4.2 Formation of LiCs molecules . . . . . . . . . . . . . . . . . . . . . . . . 56
4.3 Detection of LiCs ground state molecules . . . . . . . . . . . . . . . . . 58
4.4 High resolution spectroscopy of LiCs ground state molecules . . . . . . . 60
VII

VIII CONTENTS
5 Photoassociation spectroscopy in LiCs 635.1 Temperature determination by photoassociation spectroscopy . . . . . . . 665.2 Spectroscopy of the B1Π state of LiCs . . . . . . . . . . . . . . . . . . . 69
6 Ultracold LiCs in the rovibrational ground state 756.1 Determination of the vibrational population-distribution . . . . . . . . . . 756.2 Determination of absolute rates . . . . . . . . . . . . . . . . . . . . . . . 796.3 Evidence for LiCs in the rovibrational ground state . . . . . . . . . . . . 83
7 Interactions of ultracold LiCs molecules 897.1 Determination of the permanent electric dipole moment . . . . . . . . . . 897.2 Optical dipole trap for ultracold molecules . . . . . . . . . . . . . . . . . 937.3 Formation and detection of LiCs molecules in the dipole trap . . . . . . . 1027.4 Ultracold Atom-molecule collisions . . . . . . . . . . . . . . . . . . . . 1057.5 Vibrational relaxation of ground state LiCs molecules . . . . . . . . . . . 109
8 Conclusion and outlook 113
A Potential energy curve of the B1Π state 119
B Dark SPOT for Cs 121
C Setup for depletion spectroscopy 127
D Experimental control 131
Bibliography 135
Resume substantiel (Francais) 153
Ausfuhrliche Zusammenfassung (Deutsch) 161
Acknowledgements 169

Chapter 1
Introduction
The field of cold and ultracold molecules is quite a young one, yet already numerousarticles have reviewed its fast and intriguing development. The introductory review byDoyle et al. (2004) for the first special issue on cold molecules already referenced 161relevant works. Today it has itself more than 200 citations and has become the by farmost cited article in the European Physical Journal D 1. A recent highlight of research inthe field was the first formation of rovibrational ground state molecules of four differentspecies, more or less simultaneously realized by several groups in the last summer (2008).Cs2 molecules produced by photoassociation were vibrationally cooled into X1Σ+
g ,v′′=0by Viteau et al. (2008). LiCs molecules were directly formed in the absolute rovibrationalground state using a single step of photoassociation, which was a central result of thisthesis (Deiglmayr et al., 2008b). Magnetoassociation and consecutive steps of coherenttransfer were used to produce dense gases of ultracold KRb molecules in the absoluteground state (Ni et al., 2008), of Rb2 molecules in the lowest level of the triplet state (Langet al., 2008), and of Cs2 molecules in deeply bound levels (Danzl et al., 2008). Thesebreakthroughs attracted also the interest of the broader public: the American Institute ofPhysics selected the report on these dense gases as one of the top ten physics news storiesof 2008 (AIP, 2009) and the formation of ultracold molecules in the absolute ground statewas covered among others by ScienceNews, a popular news magazine for “Science andThe Public” (Sanders, 2008).
So let’s join Friedrich and Doyle (2009) and ask “Why are Cold Molecules so Hot?”.The answer to this questions given by different researchers in the field could probably be
1. According to the ISI Web of Knowledge, http://apps.isiknowledge.com
1

2 CHAPTER 1. INTRODUCTION
condensed into two aspects: precision and control. The precision is increased by lowertemperatures in a twofold manner: the spectroscopic resolution is enhanced by the van-ishing Doppler broadening and interaction times can be lengthened with slow or trappedsamples. This is of major relevance for high-resolution spectroscopy of molecules (Stwal-ley and Wang, 1999), which is also a tool for the search for the permanent dipole momentof the electron (DeMille et al., 2000), for studying the possible time dependence of fun-damental constants (Chin et al., 2009), or for the search of parity violation (Kozlov andLabzowsky, 1995). The precision of such measurements is often further increased byprecise knowledge about the internal state of the molecule, which brings us to the secondpromise of cold molecules: control. The possibility of control applies to several degrees offreedom: first many cooling techniques prepare the molecules in a single internal quan-tum state, details will be given in part II of this thesis. This is of great interest in e.g.collision physics, where the scattering from a single initial state into different rotationallyexcited states could be directly detected in crossed beams of Stark-decelerated OH andXe (Gilijamse et al., 2006). As second very important degree of freedom, the velocity ofthe OH molecules was controlled precisely in this experiment. This made it possible todirectly observe the opening of the different scattering channels as the collision energywas increased, indicating the advent of cold controlled chemistry.
The external degree of freedom can be further restricted by confining molecules in atrap. Traps for neutral molecules with significant electric or magnetic dipole moment havetypically a depth of below 1 K. The depth of the more general optical dipole trap rarelyexceeds 1 mK. Therefore the molecules have to be cold (T<1 K) or ultracold (T<1 mK)already before they can be trapped. An elegant way to produce trapped samples of ul-tracold molecules is to form them directly in the trap by associating trapped ultracoldatoms, an approach which has been successfully followed for many of the alkali dimers.As one highlight, the determination of the cross sections for inelastic collisions betweenultracold Cs2 molecules and Cs atoms in different internal states shall be mentioned. Themolecules were formed in the X1Σ+
g state by photoassociation from laser cooled cesiumatoms in an optical dipole trap. The population of their rovibrational levels was mod-ified by choosing different PA resonances (Staanum et al., 2006; Zahzam et al., 2006).Although the different rovibrational distributions showed significantly differing collisionrates with background gas (probably due to the difference in the geometric cross section),the rate coefficients for collisions with cesium atoms were found to be identical withinthe experimental uncertainty and unitary limited. A later experiment on RbCs+Rb/Cs

3
collisions (Hudson et al., 2008) yielded similar results for different, weakly bound a3Σ+
molecules. In this thesis, rate coefficients for LiCs+Cs collisions were measured. In con-trast to the works just mentioned above, a significant deviation in the collision rate fordifferent distributions of internal states was observed in this system (chapter 7). Thesetype of collision experiments could be seen as a first step towards ultracold chemistry,where the rate of a reaction does not simply depend on the available energy (e.g. temper-ature) but can be strongly modified by quantum effects such as tunneling or many-bodyinteractions.
Polar ultracold molecules are of special interest. The dipole-dipole interaction in agas of polar molecules varies with the molecular separation r as 1/r3 and can thus be verylong-range. The interactions between polar molecules can additionally be modified byexternal fields. For example subtle modifications of the molecular potential surface byexternal magnetic and electric fields can lead to the appearance of bound states, termed“field-linked states” (Avdeenkov and Bohn, 2003). Stronger external fields can modifythe vibrational relaxation of polar molecules (Gonzalez-Ferez et al., 2006) or enhance theformation of molecules by PA (Gonzalez-Ferez et al., 2007). It was also predicted thatthe cross section for inelastic collisions of polar molecules can be strongly reduced bysuitable combinations of static electric and microwave fields, an approach labeled “blueshielding” (Gorshkov et al., 2008). This would allow to suppress attractive interactionsand enhance elastic cross sections, thus facilitating efficient evaporative cooling towardsquantum degeneracy. Novel features recently observed in the collapse dynamics of a dipo-lar BEC of chromium, which has a large magnetic dipole moment, illustrate the drasticinfluence of dipolar interactions on the stability and the collapse dynamics of a BEC. Thecollapse involved an anisotropic, d-wave symmetric, explosion of the condensate (La-haye et al., 2008). In a degenerate gas of polar molecules, the dipole-dipole interactionis additionally tunable and could thus allow for a larger control over the dynamics of thedipolar BEC. At higher phase-space densities, novel quantum phases are predicted to ap-pear, e.g. stable three-dimensional crystalline phases, formed by self-organization of thestrongly-interacting dipoles (Pupillo et al., 2008a). Similar structures can be realized byconfining polar molecules in an optical lattice. The dynamics of those gases can not bedescribed semi-classically any more, a full quantum mechanical description is required.Therefore systems in this strong-coupling regime are ideal candidates for the realizationof a quantum simulator, a system designed to represent numerically unsolvable Hamil-tonians, which are of relevance e.g. in solid-state physics (Pupillo et al., 2008b). The

4 CHAPTER 1. INTRODUCTION
dipole interaction also allows to tune a strongly-interacting system through novel quan-tum phase-transitions (Menotti et al., 2007). Furthermore the possible combination ofspatial confinement, precise control of the internal state, and tunable long-range inter-actions makes ultracold polar molecules ideal candidates for the realization of quantumcomputing schemes (DeMille, 2002; Rabl et al., 2006; Yelin et al., 2006).
Among the alkali dimers, LiCs has the largest permanent electric dipole moment, pre-dicted as 5.5 Debye by Aymar and Dulieu (2005). Thus ultracold LiCs molecules in theabsolute ground state, where the absence of internal excitations suppresses inelastic col-lision channels, would be an ideal candidate for investigating dipolar gases. However atthe beginning of this thesis, in the spring of 2006, little was known about how to produceultracold LiCs molecules, let alone in the absolute ground state. Spontaneous formationof LiCs molecules had been observed in two overlapped magneto-optical traps at verylow rates (Kraft et al., 2006). Spectroscopy of hot LiCs molecules, formed in a heat-pipe,had been used to determined potential energy curves of the two lowest states, X1Σ+ anda3Σ+ (Staanum et al., 2007). Only for one excited state, the B1Π state, a preliminarypotential energy curve was available (Stein et al., 2008). Potential energy curves of LiCshad been computed ab initio by Korek et al. (2000). However relativistic effects wereneglected in this study, which can strongly modify the excited potential energy curves,especially close to the atomic asymptotes. Furthermore it turned out that also the struc-tural information about the other alkali dimers was far from complete. Thus there wasobviously a need for new, systematic structure calculations. Previously the theoreticalgroup in Orsay had started such a systematic investigation of dipole moments in all alkalidimers (Aymar and Dulieu, 2005). Here this study was extended by the calculation ofstatic dipole polarizabilities, and parameters relevant for the trapping and alignment ofalkali dimers in different vibrational levels were determined (Deiglmayr et al., 2008a). Inthe experiments in Freiburg the formation of ultracold LiCs molecules by photoassocia-tion (PA) could then be demonstrated for the first time (Lange, 2007). The spectroscopicinformation from extensive PA scans was used to significantly improve the description ofthe excited B1Π state in LiCs (Grochola et al., 2009). With the guidance from this accu-rate potential curve and the previous determination of the one for the X1Σ+ state (Staanumet al., 2007), ultracold LiCs could then be formed for the first time in the rovibrationalground state after a single step of PA (Deiglmayr et al., 2008b, 2009b). Formation ratesof 100 molecules/s in the rovibrational ground state v′′=0, J′′=0 and 5 000 molecules/s inthe rotationally excited level v′′=0, J′′=2 were observed. Also the rate coefficients for the

5
PA of LiCs molecules via the B1Π state were determined from a careful analysis of theformation and detection process (Deiglmayr et al., 2009a). As a next step towards theformation of a dense ultracold gas of LiCs molecules in the rovibrational ground state,the PA of ultracold LiCs molecules in a dipole trap could be demonstrated in this thesis.
This thesis is structured into two parts: the ab initio calculation of structure and dy-namics of alkali dimers in part I and the experimental investigation of ultracold LiCsmolecules in part II. The first part introduces first briefly the concepts for describingmolecular properties of alkali dimers. Then a quantitative model for the formation ofground state molecules by PA is presented, rate coefficients for the PA process itself andthe formation rate for ground state molecules are derived in chapter 2. In the remainder ofthis part, the prospects for alignment or orientation of ultracold alkali dimers are studied:in a systematic calculation the R-depended form of the polarizability tensor is determinedfor all alkali dimers, these results are then used to derive realistic experimental parametersfor the orientation of dipolar molecules in combined electro-static and laser fields (chap-ter 3). The second part starts with an introduction to the experimental setup and recentmodifications (chapter 4). Chapter 5 presents the use of PA as a spectroscopic tool for thedetermination of an improved potential energy curve for the excited B1Π state in LiCs. Inchapter 6 the ionization spectroscopy of the X1Σ+ state is introduced. The combination ofthese techniques is then used for the formation and detection of ultracold LiCs moleculesin the absolute ground state. The second part concludes with the study of interactions ofultracold LiCs molecules. The Stark-shift of levels is observed by high-resolution deple-tion spectroscopy and an experimental value for the permanent electric dipole moment ofLiCs in deeply bound levels is determined. Furthermore LiCs molecules are formed inan optical dipole trap, where rate coefficients for inelastic LiCs+Cs collisions are deter-mined. The long lifetime of the molecules in the optical dipole trap makes it possible toobserve the vibrational relaxation levels in the X1Σ+ state (chapter 7). This thesis endswith concluding remarks on the results presented here and future perspectives.

6 CHAPTER 1. INTRODUCTION

Part I
Ab initio calculation of structure anddynamics of alkali dimers
7


9
The hydrogen-like alkali atoms are arguably among the simplest chemical structures.Their chemical properties are dominated by a single valence electron and the influenceof the closed shells is well approximated by a polarizable core potential (Weeks et al.,1969). Dimers composed of alkali atoms can thus be treated as effective two electronsystems, even if they contain more than hundred electrons as in the case of Cs2. Recentlythe increasing availability of powerful computational facilities has made it possible to userelativistic all-electron methods to calculate ground state properties also of larger alkalidimers. Employing LiCs as a test case, good agreement was found with previous re-sults using atomic pseudo potentials and two-electron configuration interaction (Sorensenet al., 2009), confirming the validity of these numerically significantly less demandingapproximations. In the last years an increasing interest in the spectroscopy of these sys-tems has become visible through a growing number of both theoretical and experimentalpublications. This interest has been mostly stimulated by the advances in the field ofultracold atoms and molecules: cross sections determined in ultracold atom-atom colli-sions provide stringent tests of the long-range behavior of molecular potentials (Hutsonand Soldan, 2006; Weck and Balakrishnan, 2006) and new spectroscopic methods suchas photoassociation spectroscopy probe uncharted regions with highest precision (Joneset al., 2006; Stwalley and Wang, 1999; Weiner et al., 1999), requiring extended theoreti-cal models. On the other hand these experiments need precise theoretical guidance for theinterpretation and assignment of observed spectra, for finding the optimal route towardsthe formation of deeply bound molecules and for the assessment of wanted and unwantedcollisional channels (e.g. for the sympathetic cooling between molecules and atom).
In this thesis properties of alkali dimers were investigated through ab initio calcula-tions. The work was performed in the group of Olivier Dulieu at the Laboratoire AimeCotton in Orsay. Specifically the formation of ultracold ground state molecules via pho-toassociation was studied numerically. Rates for the photoassociation process itself andthe formation of ground state molecules are given and the influence of spin-orbit mixingin the excited state is investigated in chapter 2. A systematic calculation of the staticdipole polarizability of all alkali dimers is presented in chapter 3, the reliability of themethod is investigated by an extensive comparison with existing measurements and cal-culations. The chapter concludes with a proposal for the experimental manipulation ofthe orientation of ultracold dipolar molecules through external fields.

10

Chapter 2
Forming ground state molecules byphotoassociation
2.1 Molecular concepts
In its most general form, the chemical binding of atoms is described by the interactionbetween all electrons and the positively charged cores through the Coulomb forces and thecoupling of all angular momenta. In this formulation the many-body problem is in almostall cases unsolvable, however, as mentioned above, the complexity can be significantlyreduced. The fundament is laid out by the Born-Oppenheimer (BO) approximation: inthis approximation the total molecular wave function Ψtot of nuclei with coordinates ~Riand electrons with coordinates ~ri separates into
Ψtot(~Ri,~r j) = Φ(~Ri,~r j) ·Ψ(~Ri) (2.1)
where Φ(~Ri,~r j) is the electronic contribution and Ψ(~Ri) the contribution from the nuclearmotion. Basically this approach assumes that the motion of the nuclei always followsadiabatically the Coloumb potential created by the electrons. For diatomic molecules theBO approximation yields in general an accurate description of the full system, howeverdeviations occur for high rotationally excited states (leading to the so called Λ-doubling)or for electronically excited states (crossing potentials of same symmetry). In the BOpicture the dynamics of the nuclear motion is determined by the potential energy surfaceV(~Ri) created by the electrons. For the calculation of these potential energy surfaces theelectronic wave functions need to be determined. In the following only alkali dimers shall
11

12 CHAPTER 2. FORMING GROUND STATE MOLECULES BY PHOTOASSOCIATION
be discussed, the nuclear motion can then be reduced to the study of the relative motionof one particle with reduced mass in a potential V(R), where R is the relative coordinate,i.e. the internuclear separation. The chemical properties of alkali atoms are mostly de-termined by a single valence electron, with perturbations due to the closed shells, whichgreatly reduces the computational effort. Furthermore the electronic wave functions haveto fulfill several symmetry constraints, quantum mechanically they correspond to goodquantum numbers. Which numbers those are depends on the nature of molecular cou-pling and generally varies with the internuclear separation R. Several different couplingschemes have been identified by Hund (1926), they are labeled as Hund’s cases a) toe). For short internuclear separations the electron wave functions of the two atoms over-lap and the coupling of the orbital angular momentum to the internuclear axis exceedsthe spin-orbit coupling energy of the electrons. This region is generally best describedin the terms of Hund’s case a). The orbital angular momenta li of the single electronscouple to a total electronic angular momentum L. Only its projection Λ (see figure 2.1)on the internuclear axis is conserved (by definition Λ ≥0 always holds). Further goodquantum numbers are the total electron spin S , its projection Σ onto the internuclear axis,and the projection of the total angular momentum of the electrons on the intermolecularaxis Ω = |Λ+Σ|. Σ can take the values −S , −S + 1,. . . , S − 1, S . Thus each spin Scorresponds to a multiplet of 2S +1 sub states. Corresponding to the different quantumnumbers Λ, the states are labeled in analogy to the atomic states as Σ, Π, ∆, Φ, et cetera.In Hund’s case a) an electronic state is fully specified by the label
2S+1Λ±u,g (2.2)
where ± denotes the parity according to a reflection at any plane containing the internu-clear axis for states with Λ=0. The symmetry property u/g is only defined for homonu-clear dimers. It labels the parity of the electronic wave function under a point reflectionat the origin, corresponding to the exchange of the two nuclei.
At larger distances the spin-orbit coupling in excited states becomes stronger than thecoupling of the orbital angular momentum to the internuclear axis. This case is describedby the Hund’s case c), the electron angular momenta la and the spins sa couple separatelyto the electronic angular momenta ja. The projection of the total electronic angular mo-mentum Ja=∑a ja on the molecular axis, Ω , remains the only good quantum number. Thedifferent states are then labeled as
Ω±u,g (2.3)

2.2. NUCLEAR MOTION 13
(a) Hund’s case a) (b) Hund’s case c)
Figure 2.1: Symbolic representation of the different coupling schemes for the total elec-tronic angular momentum L, the electron spin S and the angular momentum N of the molec-ular rotation around the internuclear axis.
where ± and u/g are defined as above.
Additionally the molecule can rotate around an axis perpendicular to the internuclearaxis with an angular momentum N. The total angular momentum J is the vector additionof the total electronic angular momentum Ω and N. Since N is perpendicular to theinternuclear axis and thus to Ω, J can only take values equal or higher to Ω, i.e. J=Ω,Ω+1, Ω+2, . . . . The different coupling cases are illustrated in figure 2.1
2.2 Nuclear motion
In order to find the eigenvalues and eigenfunctions of the nuclear motion in the po-tential of a given state, one needs to solve the Schrodinger equation. For this purpose themapped Fourier grid Hamiltonian (MFGH) method was chosen: it facilitates solving thetime-independent radial Schrodinger equation numerically for a single channel problemas well as for coupled systems. Here the main aspects of the MFGH method will be pre-sented, details can be found in e.g. (Dulieu and Julienne, 1995; Marston and Balint-Kurti,1989). The total Hamiltonian H
H =p2
2m+V(R) (2.4)

14 CHAPTER 2. FORMING GROUND STATE MOLECULES BY PHOTOASSOCIATION
for the motion of a reduced mass m in a potential V is represented in basis functions
φ(R) = δ(R−Ri), i = 1, . . . ,N (2.5)
where the Ri define a grid of length L with N equidistant points. The potential energyoperator V(R) is diagonal in this representation, the momentum operator p is conve-niently evaluated by using the Fourier transform of the basis. The eigenenergies andeigenfunctions are then derived by diagonalizing the resulting N×N matrix. The numer-ical efficiency of the procedure can be optimized by adapting locally the spacing of thegrid points to the variation of the potential. Note that the local length scale is the DeBroglie wavelength, which is related to the local kinetic energy. A mapping procedurebased on this idea was proposed by Kokoouline et al. (1999) and is implemented in thenumerical code used for the calculations here. This mapping procedure makes the MFGHmethod a very efficient tool for the calculation of bound states close to dissociation thresh-old and even continuum states, which are relevant in the following for the prediction ofphotoassociation rates. The MFGH method can be easily extended to many-channel prob-lems, providing the solution for p coupled Schrodinger equations by diagonalization of apN×pN matrix.
The calculation yields the energies Eν of bound vibrational levels in a given potentialand the corresponding wave functions φν. The rotational constants Bν are then calculatedas
Bν = 〈φν| h2
2mR2|φν〉. (2.6)
For a rigid rotor the rotational constant of a given vibrational level is independent of therotation, the energies of rovibrational levels are then given by Eν,J = Eν+ Bν J(J + 1).Ultracold dimers are typically in states with low angular momentum, so the values of Jare small and the rigid rotor model describes the rovibrational spectra sufficiently well.
2.3 Photoassociation and molecular formation rates
As mentioned in the introduction, one way to produce ultracold molecules is the as-sociation of ultracold atoms to molecules via absorption of a photon, called photoassoci-ation (PA), followed by stabilization through spontaneous emission. The process of PAhas been originally proposed by Thorsheim et al. (1987) as laser-induced radiative associ-ation. It has been very successfully applied for the study of near-threshold collisions and

2.3. PHOTOASSOCIATION AND MOLECULAR FORMATION RATES 15
R
En
erg
y ÑΩ
A+B
A*+BAB*
(a) Photoassociation
RE
ner
gy
AB*
AB
(b) Spontaneous decay
Figure 2.2: Schematic illustration of the cold molecule formation by PA: a) a colliding pairof atoms A and B is excited by a photon with energy hω into a bound molecular level AB∗
(PA). b) The excited molecule decays then spontaneously into a bound ground state levelAB.
spectroscopy of excited states, which can not be studied by conventional spectroscopy.Several review articles have described the method and its application for spectroscopy indetail, e.g. references (Stwalley and Wang, 1999) and (Jones et al., 2006). PA followed bystabilization through spontaneous decay was also quickly discovered as a tool to form coldground state molecules (Masnou-Seeuws and Pillet, 2001), which was applied to most ofthe homonuclear dimers. In more recent years, formation of ground state molecules byPA was demonstrated successfully also for several heteronuclear species. Ground statemolecules of KRb (Mancini et al., 2004b; Wang et al., 2004), NaCs (Haimberger et al.,2004), RbCs (Kerman et al., 2004), and LiCs (Kraft et al., 2006) were detected after PA.
In a PA process, an excitation from an unbound scattering state of two atoms A and Binto a bound excited molecular level AB∗ occurs:
A+B+ hω→ AB∗. (2.7)
The process is depicted schematically in figure 2.2 a). From the modulation of the wavefunctions shown in this figure one can already deduce that the PA is most efficient for tran-sitions into long-ranging molecular levels as the amplitude of the scattering wavefunctionquickly decreases in the range of chemical bonding.

16 CHAPTER 2. FORMING GROUND STATE MOLECULES BY PHOTOASSOCIATION
The rate for PA from an initial scattering continuum state to an excited vibrationallevel ν′, Kv′
PA, is obtained using the cross section σν′
PA of two atoms colliding in the pres-ence of a laser field, and average it over the relative velocity distribution vrel, Kv′
PA =
〈vrelσν′PA〉. For a thermal atomic gas, a Maxwell-Boltzmann distribution characterized by
a temperature T is appropriate. Assuming a PA laser beam of negligible linewidth andresonant for the transition to ν′ one finds (Napolitano et al., 1994)
Kν′PA(T, I) =
1hQT
∫ ∞
0dε e−ε/kBT γν′γs
ε2 +(γν′+γs
2 )2, (2.8)
where QT = (2πmkBT/h2)3/2, h and kB are the Planck and Boltzmann constant, respec-tively, ε = mv2
rel/2 is the relative kinetic energy of the colliding pair of atoms of reducedmass m, and γν′ is the natural linewidth of the photoassociated level.
Using Fermi’s Golden Rule, one obtains an expression for the stimulated emissionwidth γs in terms of the initial scattering state Ψε,l at energy ε and total angular momentum`, and the excited vibrational state φν′,J′
γs =πIε0c
|〈φν′,J′|D(R)|Ψε,`〉|2. (2.9)
Here I is the intensity of the PA laser, and ε0 and c are the vacuum permittivity and speedof light, respectively. In the case of ultracold collisions it is often justified to restrict thecalculation to s-wave scattering in the entrance channel, and thus to set `=0.
In the experiments presented in part II, PA into the B1Π state of 7Li133Cs, correlated tothe first excited asymptote, will be investigated systematically. Here the presented frame-work will be used to estimate rates for this process. The excited state has singlet scatter-ing, thus only scattering in the singlet ground state X1Σ+ is considered. An overview overthe relevant potential energy curves is shown in figure 2.3. In order to obtain reasonableresults, realistic experimental parameters are used wherever possible: the potential energycurves are taken from experimental measurements (see Staanum et al. (2007) for X1Σ+
and appendix A for B1Π). The R-dependent transition dipole moment µ(R) is taken fromthe ab initio calculation of Aymar and Dulieu (2005), however its value does not deviateby more than 20% from its asymptotic value of 4.48 ea0, the transition dipole moment ofthe atomic D2 line of cesium. The natural line width of the excited state was assumed tobe constant and γ=10 MHz, roughly twice the atomic one. This is certainly a simplifica-tion, but will eventually be experimentally justified (see section 5.1). Also the PA laser

2.3. PHOTOASSOCIATION AND MOLECULAR FORMATION RATES 17
4 6 8 10 12
-5000
0
5000
10000
15000
R @ÞD
En
erg
y@c
m-
1 D
X1S+
A1S+
C1S+
a3S+
c3S+
e3S+
b3P
d3P
B1P
D1P
LiH2sL+CsH6sL
LiH2sL+CsH6pL
LiH2sL+CsH5dL
Figure 2.3: Potential energy curves for Σ+ and Π states of LiCs correlating to the threelowest asymptotes. The relevant states B1Π and X1Σ+ are marked bold.
intensity of 30 W/cm2 is chosen based on typical experimental values. Finally the contin-uum wave function Ψε,l is calculated at an energy ε=500 µK. The resulting rate constantsfor transitions into different vibrational levels of the B1Π state are shown in figure 2.4.For levels close to the asymptote one finds PA rates on the order of 10−10 cm3s−1. Similarrate constants have been observed experimentally in the PA of Cs2 (Drag et al., 2000b;Wester et al., 2004) or KRb (Mancini et al., 2004a). As mentioned above, the rate quicklydecreases towards lower, more closely bound levels. Below ν′ ' 24 this calculation yieldsrates, which are too small to be experimentally detectable.
The PA rate calculated above is the rate for the formation of molecules in the excitedstate B1Π. In order to derive the formation rate of ground state molecules, one needs toalso consider the spontaneous decay of the excited molecules, either leading to bound lev-els of the ground state or back into a free pair of atoms. The fraction of excited moleculesthat decay into the bound molecules ΓBound/ΓTotal can be approximated for a given vibra-

18 CHAPTER 2. FORMING GROUND STATE MOLECULES BY PHOTOASSOCIATION
æ
æ
æ
æ
æ
æ
æ
æ
æ
æ
æ
æ
æ
æ
æ
æ
æ
æ
æ
æ
æ æ
æ
æ
æ æ
æ
æ
æ
æ
æ
æ
æ
æ
æ
æ
æ
0 5 10 15 20 25 30 35
10-22
10-20
10-18
10-16
10-14
10-12
10-10
v' in B1P
PA
Rat
eK
PA@c
m3s-
1D
Figure 2.4: Calculated PA rates for a pair of Li-Cs atoms colliding at a temperature of500µK in the singlet channel X1Σ+. The rates for PA into different vibrational levels of theB1Π are shown as dots, the dashed line is drawn to guide the eye.
tional level ν′ by the sum ∑ν′′〈ν′|ν′′〉 over the FC factors for all transitions from ν′ intobound ground state levels ν′′. For the B1Π state in LiCs the calculated fraction is shownin figure 2.5, it is almost unity for states below ν′=26 and approaches 0.5 for higher lyingstates. This is in contrast to the behavior typically found for homonuclear molecules (seee.g. Drag et al. (2000a) for Cs2), where this fraction often stays below unity and decreasestowards deeper bound levels. This general trend can be understood by considering thepotentials associated to the first X(S )+Y(P) asymptote of a dimer XY (due to the largetransition dipole moment this is the most favorable asymptote for PA): while the heteronu-clear dimers interact via van-der-Waals forces, which show a 1/R6 behavior, homonucleardimers exhibit a 1/R3 long-range behavior due to the degeneracy of the X(S )+X(P) andX(P)+X(S ) asymptotes allowing resonant dipole energy transfer. Therefore the excitedstate wave functions typically have a larger extent in homonuclear than in heteronucleardimers which favors PA at larger distances and therefore larger pair-densities. In contrastthe ground state potential of alkali dimers always shows a leading C6 coefficient in themultipole expansion. Thus in heteronuclear dimers the excited state wave functions areoften better matched to the ground state wave functions due to the identical long range

2.3. PHOTOASSOCIATION AND MOLECULAR FORMATION RATES 19
0 5 10 15 20 25 30 350.0
0.2
0.4
0.6
0.8
1.0
Ν' in B1P
GB
ound
,sin
gletG
Tot
al
Figure 2.5: Ratio of decay into the X1Σ+ state ΓBound,singlet over the total decay rate of theexcited state, Γtotal for the vibrational levels of B1Π.
behavior, favoring the decay into bound molecules versus the decay back into free pairs.A quantitative analysis by Azizi et al. (2004) showed that overall one can expect similarcold molecule formation rates for hetero- and homonuclear alkali dimers, albeit spectralfeatures specific to some dimers which can significantly alter the formation rate.
Spin-Orbit interactions
Up to now spin-orbit coupling in the excited state was neglected. In Hund’s case c)the B1Π state couples together with the triplet states b3Π and c3Σ+ (see figure 2.3) to astate with projection of the total angular momentum on the internuclear axis Ω=1. Thecouplings can be approximated in an asymptotic LCAO model (linear combination ofatomic orbitals) taking the atomic finestructure constant of cesium A=554.04 cm−1 ascoupling strength (Bergeman et al., 2002). The resulting Schrodinger equation for thecoupled system with
V(R) =
V(B1Π) A/2 −A/2A/2 V(b3Π) A/2−A/2 A/2 V(c3Σ+)
(2.10)

20 CHAPTER 2. FORMING GROUND STATE MOLECULES BY PHOTOASSOCIATION
2 4 6 8 10 12
4000
6000
8000
10000
12000
14000
Li(2S1/2
)+Cs(6P3/2
)
E [c
m-1
]
R [Å]
1(2)
2(0-) 2(0+)
2(1)
3(0+)3(1)
3(0-)
4(1)
Li(2S1/2
)+Cs(6P1/2
)
Figure 2.6: States in Hund’s case c) correlated to the first two excited asymptotesLi(2S1/2)+Cs(6P1/2) and Li(2S1/2)+Cs(6P3/2) (adapted from Lange (2007)). The states arelabeled by (Ω) and are consecutively numbered, e.g. the B1Π state is correlated at shortinternuclear distances to the fourth Ω = 1 state, labeled “4(1)”.
is solved by the FGH method described above, the Hund’s case (a) potential energycurves are taken from ab initio potentials, calculated as described by Aymar and Dulieu(2005). The resulting potential energy curves for Hund’s case c) are shown in figure 2.6(labeled as 2(1), 3(1), and 4(1)). The levels in the coupled system, which have the largestoverlap with the B1Π channel, will be labeled as 1(B). The perturbation of the B1Π levelsis of global character, i.e. a slowly, monotonously increasing modification of level en-ergies and rotational constants as the asymptote is approached. The increasing strengthof the spin-orbit coupling for larger internuclear separations also manifests itself in anincreased amplitude of the 1(B) wave functions on the triplet channels. This triplet ad-mixture is given by
α1(B),Triplet =∣∣〈1(B)|b3Π〉
∣∣+∣∣〈1(B)|c3Σ+〉
∣∣ . (2.11)
Figure 2.7 shows this amplitude for the vibrational levels 1(B) (right scale, red dashes).For states above ν′ ∼20 this admixture becomes sizable. This is also visible in the cold

2.4. POPULATION-DISTRIBUTION OF GROUND STATE LEVELS 21
à à à à à à à à à à à à à à à à ààààà
àà
à
à
à
à
à
à
à
à à
à à
à
ò ò ò ò ò ò ò ò ò ò ò ò ò òò òòòòòòòòòò òò òòò ò ò ò
ò
ò
ììììììììììììììììììììììììììììììììììì
á á á á á á á á á á á á á á á á á á á á á á á á áá á
áá
á
ááá á
á
---------------------
-
-
-
-
-
-
-
-------
0 5 10 15 20 25 300.0
0.2
0.4
0.6
0.8
1.0
0.
0.2
0.4
0.6
0.8
1.
Ν' in 1HBL
GB
ound
GT
otal
ΑT
riple
t
-ΑTriplet
á Sv "XB1
PÈX1S
+,v"\ì Sv "X1HBL,c
3S
+Èa3
S+,v"\
ò Sv "X1HBL,b3
PÈa3S
+,v"\
à Sv "X1HBL,B1
PÈX1S
+,v"\
Figure 2.7: Left axis: cold molecule formation ratio ΓBound/ΓTotal for vibrational levelsof 1(B): (filled squares) decay into X1Σ+ from the B1Π component, (triangles) decay intoa3Σ+ from the b3Π and (diamonds) from the c3Σ+ component. For comparison the ratiosfor B1Π in Hund’s case a) are also shown (open squares, see figure 2.5). Right axis: totalamplitude of the 1(B) wave functions on the triplet channels (dashes).
molecule formation rates plotted in the same figure for the decay into X1Σ+ from thesinglet components of 1(B) and into a3Σ+ from the triplet components of 1(B). Of largestrelevance is the fraction of excited molecules, which decays into the singlet ground state:this number is significantly reduced for the levels in Hund’s case c) (filled squares) whencompared with the unperturbed case (open squares).
2.4 Population-distribution of ground state levels
So far only the total rate for decay into the singlet ground state was considered. Inorder to predict the distribution of populated levels, the rate for spontaneous decay, givenby the Einstein A coefficients, needs to be calculated as
Aν′,ν′′ =23
ω3ν′,ν′′
ε0hc3
∣∣⟨φν′∣∣µ(R)∣∣φν′′
⟩∣∣2 (2.12)

22 CHAPTER 2. FORMING GROUND STATE MOLECULES BY PHOTOASSOCIATION
aL bLR-dependent dipole
constant dipole
0 5 10 15 200.
0.1
0.2
0.3
v" in X1S+
Rel
ativ
eP
opul
atio
n
PA via B1P,v'=4
PA via B1P,v'=26
0 5 10 15 20 25 30 35 40 45 50 550.
0.1
0.2
0.3
v" in X1S+
Rel
ativ
eP
opul
atio
n
Figure 2.8: X1Σ+ level populations after PA, normalized to unity: a) influence of theR-dependence of the transition dipole moment on the expected distribution after PA viaB1Π,v′=4; b) comparison of the expected level population after PA via B1Π,v′=4 and v′=26.
with ων′,ν′′ = Eν′ −Eν′′ being the transition frequency between two levels ν′ and ν′′, andµ(R) the transition dipole moment. The relative population of a ground state level ν′′ isthen given by the ratio of Aν′,ν′′/∑ν′′ Aν′,ν′′ , where the summation is performed over allground state levels ν′′. In figure 2.8 a) the relative population after PA via B1Π,v′=4 isshown, the small influence of a calculation with R-dependent versus constant dipole mo-ment becomes visible here. Figure 2.8 b) compares the normalized population of X1Σ+
levels after PA via B1Π,v′=4 and B1Π,v′=26. While in both cases low lying vibrationallevels are populated, one notes that after PA via B1Π,v′=4, more than 20% of the ex-cited molecules should decay into the lowest vibrational level v′′=0. This will be of greatrelevance for the experiments described in part II.

Chapter 3
Static dipole polarizability of alkalidimers
The most intriguing property of heteronuclear alkali dimers is, of course, the fact thattheir absolute ground states has a permanent electric dipole moment. Several authorshave recently addressed the possibility of observing peculiar properties of ultracold gasesof dipolar molecules if they can be partially aligned or oriented in the lab frame (De-Mille, 2002; Santos et al., 2000) to enhance their mutual interaction. The obvious wayto create oriented sampled of molecules is called ”brute force technique”: a strong staticelectric field is applied, which leads to a hybridization of the field-free rotor states. Inthe asymptotic limit of infinite electric field the Hamiltonian approaches the limit of atwo-dimensional oscillator and the body-fixed dipole moment librates around the electricfield axis (Loesch, 1995). However, as will be shown later (section 3.5), the required fieldstrengths constrain the applicability of this technique. Other methods exist for the align-ment of molecules: pulsed laser fields with typical peak intensities of 1012 W/cm2 havebeen used to align molecules (Stapelfeldt and Seidema, 2003), however the alignmentis adiabatic and generally lasts only for the duration of the laser pulse, typically femto-to nanoseconds. These timescales are not compatible with typical interaction times inultracold trapping experiments, which range from milliseconds to seconds. For complete-ness, another approach for the alignment of molecules should be mentioned: the use of ahexapole guide to filter only the wanted orientation out of a molecular beam Parker andBernstein (1989).
In this context it is worthwhile to revisit the idea proposed by Friedrich and Her-
23

24 CHAPTER 3. STATIC DIPOLE POLARIZABILITY OF ALKALI DIMERS
schbach (Friedrich, 2000; Friedrich and Herschbach, 1999a,b) for aligning polar moleculesby combining an intense laser field and a static electric field. In an intense laser field thefast-oscillating electric field averages its interaction with the permanent dipole momentof polar molecules to zero, so that only the quadratic interaction through the static polar-izability persists. If this interaction is strong enough (the relevant energy scale is given bythe rotational constant of the molecule), pendular states are created and the molecules arealigned. In this case the dipole moment vectors are arbitrarily aligned parallel or antipar-allel to the laser field. In order to orient all dipole moments in one direction, an additionalelectric field is applied. It only has to be strong enough to break the symmetry of thequadratic interaction between laser field and the polarizability of the molecule. The firstexperimental evidence of this effect was reported on the HXeI complex by Friedrich et al.(2003) and Nahler et al. (2003). Alkali dimer ground states have an advantage here, asthey combine a large anisotropy of the polarizability tensor, which reduce the requiredintensities for alignment, with large permanent dipole moments, which make permanentorientation of molecules in combined continuous fields possible. Also non-polar speciescan be manipulated by strong electric fields produced by far-off resonant laser fields. Ex-perimentally this is often used to trap atoms as well as molecules in a strongly focused,off-resonant laser beam (Grimm et al., 2000). Details can be found in chapter 7.
In order to investigate the possibility of creating aligned or oriented samples of ul-tracold molecules, the static electric polarizability and (if present) the permanent electricdipole moment have to be known for all species. In a previous work in the theory groupat Laboratoire Aime Cotton, the permanent electric dipole moments for all polar alkalidimers were calculated (Aymar and Dulieu, 2005). As detailed later, various authors havecomputed the static dipole polarizabilities of homonuclear alkali dimers while results onheteronuclear dimers are scarcer. Therefore a systematic study similar to the one onelectric dipole moments was performed determining the static polarizability for all alkalipairs. In this chapter, the computational method will be introduced first, then the de-pendence of the polarizabilities for homo- and heteronuclear systems on the internuclearseparation will be calculated. These results will be compared to available experimentaland theoretical values. Finally these numbers will be used to derive experimental con-ditions under which those molecules can be aligned in a combination of a static electricfield and a strong laser field.

3.1. COMPUTATIONAL METHOD 25
3.1 Computational method
All ab initio calculations were performed with the CIPSI package (ConfigurationInteraction by Perturbation of a multiconfiguration wave function Selected Iteratively)(Huron et al., 1973). The approach is based on the `-dependent pseudopotentials of Du-rand and Barthelat (1974, 1975) for atomic core representation, Gaussian basis sets, andeffective potentials to account for core polarization (CPP) (Foucrault et al., 1992; Mullerand Meyer, 1984). Molecular orbitals are determined by restricted Hartree-Fock single-electron calculations, yielding the potential curves for the relevant molecular cations. Afull valence configuration interaction (CI) is then performed for each involved molecu-lar symmetry, providing potential curves and permanent and transition dipole moments.For the calculation of atomic and molecular static dipole polarizabilities, the finite-fieldmethod (Cohen and Roothaan, 1965) was additionally implemented: for each molecu-lar system the energies were calculated for several values of the external electric field(1×10⁻⁴ to 5×10⁻⁴ a.u. depending on the molecule, with 1 a.u.w 5.1422×10¹¹ V.m−1)in the perturbative regime. The polarizability was then extracted from the quadratic de-pendence of the eigenenergies on the electric field magnitude. If the z axis is chosenalong the internuclear axis in a molecule-fixed reference frame (x,y,z), there are two in-dependent components of the molecular polarizability tensor, i.e., the parallel componentα‖ ≡ αzz and the perpendicular one α⊥ ≡ αxx = αyy. Two related quantities are usuallydefined: the average polarizability α = (αzz + 2α⊥)/3 and the polarizability anisotropyγ = α‖−α⊥.
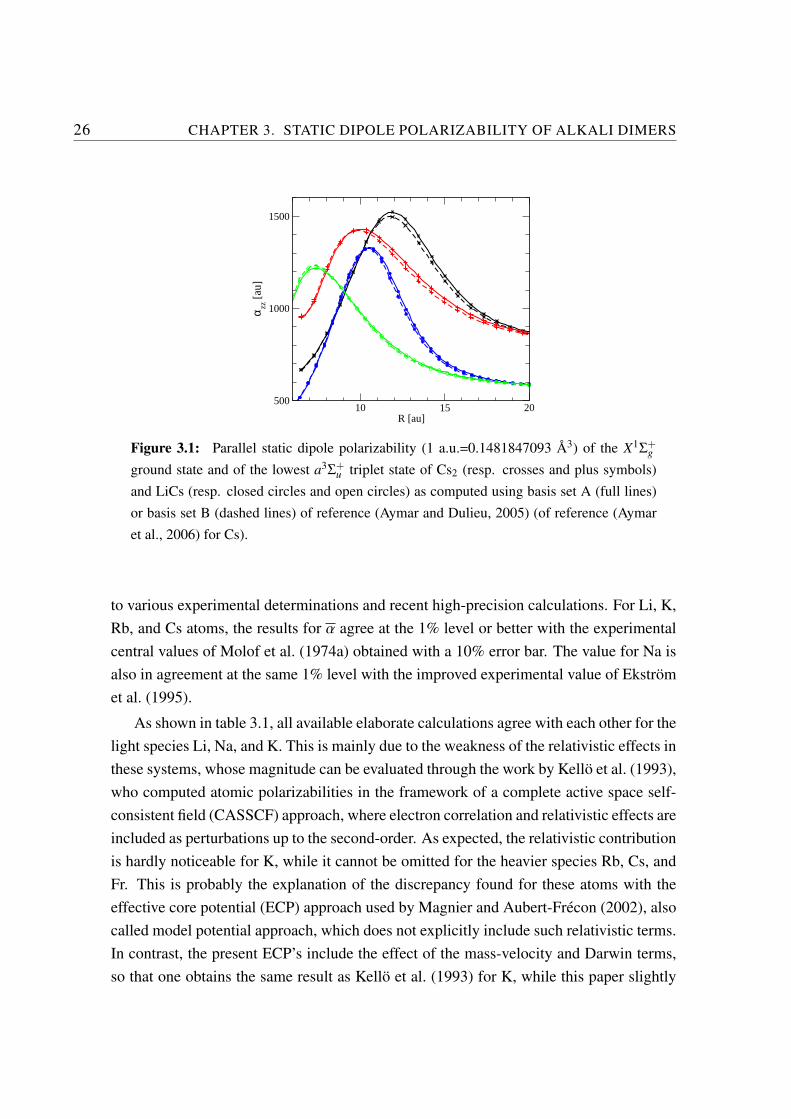
As for dipole moments, the dependence of the resulting polarizabilities on the size ofthe basis set was checked, using both basis sets labeled A and B as defined in (Aymar andDulieu, 2005). The basis sets A is a smaller basis set containing contracted orbitals, whilethe basis sets B is uncontracted. For the B sets the calculated dipole moment functionswere found to be fully converged by Aymar and Dulieu (2005). Figure 3.1 illustrates theinfluence of the basis size on the R-dependence of α‖ for Cs2 and LiCs ground state andlowest triplet state: the difference between the two calculations never exceeds 1%, whichcan be considered as non-significant for the present purpose.
The quality of the atomic representation produced by the chosen molecular basis wasdetermined by computing the static dipole polarizabilities for all alkali atoms (Li to Fr).The values were first checked against the size of the basis set: the differences in the ob-tained values never exceeded 1% when using basis A or B. Table 3.1 compares the results
26 CHAPTER 3. STATIC DIPOLE POLARIZABILITY OF ALKALI DIMERS
10 15 20R [au]
500
1000
1500
α zz [
au]
Figure 3.1: Parallel static dipole polarizability (1 a.u.=0.1481847093 A3) of the X1Σ+g
ground state and of the lowest a3Σ+u triplet state of Cs2 (resp. crosses and plus symbols)
and LiCs (resp. closed circles and open circles) as computed using basis set A (full lines)or basis set B (dashed lines) of reference (Aymar and Dulieu, 2005) (of reference (Aymaret al., 2006) for Cs).
to various experimental determinations and recent high-precision calculations. For Li, K,Rb, and Cs atoms, the results for α agree at the 1% level or better with the experimentalcentral values of Molof et al. (1974a) obtained with a 10% error bar. The value for Na isalso in agreement at the same 1% level with the improved experimental value of Ekstromet al. (1995).
As shown in table 3.1, all available elaborate calculations agree with each other for thelight species Li, Na, and K. This is mainly due to the weakness of the relativistic effects inthese systems, whose magnitude can be evaluated through the work by Kello et al. (1993),who computed atomic polarizabilities in the framework of a complete active space self-consistent field (CASSCF) approach, where electron correlation and relativistic effects areincluded as perturbations up to the second-order. As expected, the relativistic contributionis hardly noticeable for K, while it cannot be omitted for the heavier species Rb, Cs, andFr. This is probably the explanation of the discrepancy found for these atoms with theeffective core potential (ECP) approach used by Magnier and Aubert-Frecon (2002), alsocalled model potential approach, which does not explicitly include such relativistic terms.In contrast, the present ECP’s include the effect of the mass-velocity and Darwin terms,so that one obtains the same result as Kello et al. (1993) for K, while this paper slightly

3.1. COMPUTATIONAL METHOD 27
overestimates the polarizabilities for Rb, Cs, and Fr. Note that as already predicted in thelatter paper, the francium polarizability does not follow a monotonic increase along theseries of alkali atoms due to relativistic effects; it is about 22% smaller than the cesiumone.
Li Na K Rb Cs FrThis work 164.4 164.1 294.3 318.1 406.1 316.6
Miffre et al. (2006) (E) 164.2(1)Ekstrom et al. (1995) (E) 162.7(8)Molof et al. (1974a) (E) 164(3) 159(3) 293(6) 319(6) 402(8)Hall and Zorn (1974) (E) 165(11) 305(22) 329(23) 427(31)
Derevianko et al. (1999) (T) 162.6(3) 290.2(8) 318.6(6) 399.9(1.9) 317.8(2.4)Kello et al. (1993)a (T) 301.0 410.3 491.3 552.0Kello et al. (1993)b (T) 295.6 330.0 413.7 325.9
Safronova et al. (1999) (T) 163.07 290.10 317.39 399.8 314.8Magnier and Aubert-Frecon (2002) (T) 164 165 302 335 434
Table 3.1: Static dipolar polarizabilities (in atomic units) of alkali atoms compared toavailable experimental (E) and recent theoretical (T) works. Both non-relativistic (a) andrelativistic (b) values calculated by Kello et al. (1993) are displayed.
One finds very good agreement between the values calculated with the here presentedapproach and those of Safronova et al. (1999) and Derevianko et al. (1999). These authorsused the relativistic single-double all-order (SD-AO) method combined with relativisticrandom-phase approximation (RRPA). In the latter paper, the authors claim that theirtheoretical values are in agreement but more accurate than the experimental ones fromMolof et al. (1974a), as they introduced experimental values for energy levels and high-precision experimental values for dipole matrix elements of the principal transition in thecomputation of the polarizability. The uncertainty on their values is then directly relatedto the uncertainty of these experimental data. The difference with the presented valuesremains within a 1% to 2% range. One of the largest discrepancy is found for Cs, whichcould be due to the fact that the employed basis set does not use relativistic atomic orbitals,in contrast with francium for which an averaged relativistic core pseudopotential wasdesigned previously (Aymar et al., 2006). Nevertheless, the results confirm that in alkalispecies, relativistic effects beyond mass-velocity and Darwin terms can be accounted forthrough an averaged effective core potential, which would be certainly relevant for Cs infurther calculations.
To summarize, the atomic calculations seem to correctly account for relativistic effects

28 CHAPTER 3. STATIC DIPOLE POLARIZABILITY OF ALKALI DIMERS
when they are noticeable, and represent a satisfactory starting point for the computationof molecular polarizabilities.
3.2 Static polarizability functions for X1Σ+ and a3Σ+ states
Homonuclear alkali dimers
Most available calculations of molecular static polarizabilities are restricted to theirvalue at the equilibrium distance. In figure 3.2 the variation of α‖ and α⊥ with the in-ternuclear distance is shown, respectively for the X1Σ+
g ground state and for the lowesta3Σ+
u triplet state of the homonuclear alkali dimers. The results for the heavy species Rb2,Cs2, and Fr2 are presented for the first time, only one other theoretical determination wasfound for the ground state of the light species Li2, Na2, and K2 (Muller and Meyer, 1986),and for the lowest triplet state of Li2, Na2 (Rerat and Bussery-Honvault, 2003), and K2
(Merawa et al., 2003b).The R-variation of α‖ and α⊥ is similar for all systems, and their magnitude increases
10 20 30R [au]
500
1000
1500
stat
ic p
olar
izab
ility
[au
]
Re
Li 2
Na 2
K2
Rb 2
Cs 2
Fr2
Li2
Na2
K2
Rb2
Cs2
Fr2
(a) ground states X1Σ+g
10 20 30R [au]
200
400
600
800
1000
1200
1400
1600
stat
ic p
olar
izab
ility
[au
]
Li2
Na2
K2
Rb2
Cs2
Fr2
(b) lowest triplet states a3Σ+u
Figure 3.2: Parallel (full lines) and perpendicular (dashed lines) static dipole polarizabilityfunctions for the X1Σ+
g ground state and the a3Σ+u lowest triplet state of homonuclear alkali
dimers, as computed in the present work. Experimental equilibrium distances are alsoindicated for further discussion in the text.

3.2. STATIC POLARIZABILITY FUNCTIONS FOR X1Σ+ AND A3Σ+ STATES 29
5 10 15 20R [au]
500
1000
stat
ic p
olar
izab
ility
[au
]
(a) Comparison for the X1Σ+ state
5 10 15 20R [au]
500
1000
stat
ic p
olar
izab
ility
[au
]
(b) Comparison for the a3Σ+ state
Figure 3.3: Comparison of the present α‖(R) (full lines) and α⊥(R)(dashed lines) functionsof Li2, Na2 and K2 (a) with those of Muller and Meyer (1986) (symbols) for the groundstate, and (b) with those of Rerat and Bussery-Honvault (2003) and Merawa et al. (2003b)(symbols) for the lowest triplet state. Crosses, closed circles, and plus signs hold for Li2,Na2, and K2 respectively.
with increasing mass, as expected when the electronic clouds become larger and larger. Asseen above for the francium atom, the francium dimer polarizability is predicted to havethe same magnitude than the Rb2 one, which is again a manifestation of the contractionof electronic orbitals due to relativistic effects. The parallel polarizabilities for the groundstate exhibits a maximum at a distance around 1.3 to 1.5 times the equilibrium distance Re
of the dimers. In contrast the perpendicular components always have a smaller magnitudethan α‖, and monotonically increase towards the asymptotic limit. At large distances, thepolarizability components converge toward twice the atomic values αat, and as alreadynoted by Merawa et al. (2003b), the parallel component varies two times faster than theperpendicular one and with an opposite variation. This is a well-known result of theasymptotic atom-atom picture, which yields α‖ = 2αat+4α2/R3 and α⊥ = 2αat−2α2/R3.
The magnitude and variations of the polarizabilities for the triplet state are very similarto those of the ground state. However, the maximum in the parallel component occurs inthe region of the repulsive wall of the triplet state, so that it monotonically decreases withincreasing R over the range of the triplet potential well.
In figure 3.3 a), the calculated R-dependent polarizabilities are compared to those com-puted with the finite-field method (Cohen and Roothaan, 1965) by Muller and Meyer(1986) for the Li2, Na2, and K2 ground state, obtained by all-electron ab initio calcula-

30 CHAPTER 3. STATIC DIPOLE POLARIZABILITY OF ALKALI DIMERS
tions which include the complete valence self-consistent approach, configuration inter-action, and core-polarization potentials to account for core-valence correlation (Mullerand Meyer, 1984). The functions for the Li2, Na2 and K2 lowest triplet states are com-pared in figure 3.3 b) to the determination from Rerat and Bussery-Honvault (2003) andMerawa et al. (2003b), based on an asymptotic expression for static polarizabilities (Heij-men et al., 1996). In both cases, the agreement among all these quite different approachesis very good, which is a convincing argument to assess the accuracy of the presentedresults for the heavier species.
Heteronuclear alkali dimers
The R-dependent static polarizabilities for all heteronuclear alkali pairs except NaLi(see Antoine et al. (1999) and Merawa et al. (2003a)) are computed here for the first time.Indeed, the main response of such systems to external electric fields is expected fromtheir permanent dipole moments, on which most theoretical studies concentrated in thepast. However, as already discussed above, the interaction via the static polarizability canalso be important: e. g. optical dipole traps for ultracold atomic or molecular systemsrely on the magnitude of static polarizabilities. Also the above mentioned proposal byFriedrich and Herschbach (Friedrich and Herschbach, 1999b) to manipulate polar or non-polar molecules with a combination of a strong laser field and a weak static field reliesboth on the interaction via the electric dipole moment and the dipole polarizability.
As it can be seen in figure 3.4, the R-variation of the static polarizability componentsare similar to those for the homonuclear species: the same shift by a factor of 1.3 to1.5 of the maxima of the parallel component compared to the equilibrium distance isvisible for the ground state, while the maxima in the triplet state lies in the range of therepulsive wall of the triplet state. As expected, the pairs containing heavy species aremore polarizable than those including light species. The RbCs ground state is then foundwith the highest parallel polarizability around the equilibrium distance, with the samemagnitude as that of KCs and LiCs. In contrast, for all other cases the hierarchy among thepolarizabilities is governed by the ordering of the sum of atomic polarizabilities. As theatomic polarizability of lithium and sodium are almost equal and the smallest of the alkaliatoms, pairs involving Li or Na and either a K, Rb, or Cs atom, exhibit a polarizabilitymagnitude quite close to each other, i.e., dominated by the polarizability of the heavy atominside the pair. It is noteworthy that for each heteronuclear AB molecule the maximum

3.3. STATIC POLARIZABILITIES AT THE MOLECULAR EQUILIBRIUM DISTANCE 31
400
600
800
1000
1200
1400
α zz [
au]
LiRbLiNaLiKLiCsKRbKCsNaKNaRbNaCsRbCs
5 10 15 20 25R [au]
200
400
600
α xx=
αyy
[au
]
(a) X1Σ+ ground states
400
600
800
1000
1200
1400
α zz [
au]
LiRbLiNaLiKLiCsKRbKCsNaKNaRbNaCsRbCs
10 15 20 25R [au]
400
600
α xx=
αyy
[au
]
(b) Lowest a3Σ+ triplet states
Figure 3.4: Parallel (upper panel) and perpendicular (lower panel) static dipole polarizabil-ity functions for the X1Σ+ ground state and for the lowest a3Σ+ triplet state of heteronuclearalkali dimers, as computed in the present work.
value of α‖ is given, to a good approximation, by the averaged values of the correspondinghomonuclear A2 and B2 species.
3.3 Static polarizabilities at the molecular equilibriumdistance
In contrast with previous sections, much more work has been devoted to the computa-tion of the static polarizabilities at the equilibrium distance of the alkali pairs, as it is thevalue which could be accessible for instance from deflection experiments of molecules inthe lowest vibrational level of their ground state. In this respect, there is an interestingoutput of the present systematic study performed with comparable accuracy for all alkalipairs. It is well-known from classical electrostatics that the polarizability of a charge dis-

32 CHAPTER 3. STATIC DIPOLE POLARIZABILITY OF ALKALI DIMERS
500 1000 1500 2000 2500 3000
Ve (a
0
3)
0
500
1000
pola
riza
bilit
y co
mpo
nent
(a.
u.)
LiN
a
LiK LiR
b
Cs 2
RbC
s
KC
s
Rb 2
KR
b
K2
NaC
s
LiC
s
NaR
bN
aK
Na 2
Li 2
Fr2
Figure 3.5: Parallel (full circles) and perpendicular (open circles) static dipole polariz-abilities as functions of Ve = 4πR3
e/3, where Re is the equilibrium distance of the groundstate of every alkali pair. The straight lines show a linear fit of this variation excluding Fr2
values, corresponding to the formula (in atomic units): α‖ = 0.31Ve +153.5 (dashed line)and α⊥ = 0.16Ve +71.2 (full line).
tribution is proportional to its volume. If one plots the ground state polarizabilities at theequilibrium distance Re of homonuclear alkali and heteronuclear alkali dimers as a func-tion of (Re)
3 (figure 3.5), it is striking that all species are well aligned. A linear fit showsthat the parallel component varies two times faster than the orthogonal component. Asexpected, the francium dimer deviates from this phenomenological law, due to its strongrelativistic character.
Many authors already worked at designing models to relate the polarizability of atomicand molecular systems to an effective volume. Politzer et al. (2002) have shown thatatomic polarizabilities are proportional to an atomic volume derived from the mean radiiof Hartree-Fock outer-shell orbitals. For different types of molecules, Laidig and Bader(1990) and Brinck et al. (1993) have also found a proportionality between polarizabilitiesand molecular volume calculated within a self-consistent field approach. Specific studiesperformed on hydrocarbons molecules (Gough, 1989) or on sodium clusters (Chandraku-
3.3. STATIC POLARIZABILITIES AT THE MOLECULAR EQUILIBRIUM DISTANCE 33
mar et al., 2004) have found a linear correlation between the molecular polarizability anda characteristic volume. Other models have been elaborated in different contexts, based onthe electrostatics of an ellipsoidal charge distribution like the jellium model (Apell et al.,2002). For instance, Ambjornsson and Apell (2003) investigated the drift of ellipsoidalpolarizable particles through a viscous fluid induced by an electric field gradient. Ko-rnyushin (2004) proposed a general model for dipole plasma oscillations in an ellipsoidalsample. Following the latter author, one can derive an expression for the polarizabilitycomponents αb and αa along the principal axis of a symmetrical ellipsoid with a longitu-dinal radius b and a transverse radius a:
α⊥ ≡ αa = (2a2
b2 +1)V4π
α‖ ≡ αb = (b2
a2 +2)V4π
(3.1)
where V = 4π3 ab2 is the volume of the ellipsoid. One immediately sees on this ex-
pression than the ratio of 2 between both components is obtained if b =√
2a. It is notstraightforward however to deduce an effective radius for each alkali pair from the fittingformula reported in figure 3.5, as the lines do not go through the origin.
Various theoretical methods have been used to compute the two components of thestatic dipole polarizabilities of alkali dimers, several of them are collected in the followingtables to compare with the values calculated in the present work. Generally, the extractionof static polarizabilities relies on two steps: the calculation of electronic structure, forwhich almost all available modern methods have been considered, and the extraction ofthe polarizability values themselves through a perturbative approach in most cases.
Bishop and Pouchan (1984) have employed a pseudopotential treatment for core elec-trons and included core-valence correlation through a configuration interaction (CI) treat-ment. In a follow-up paper, Bishop et al. (1985) have performed all-electron self-consistentfield (SCF) and CI calculations for electronic structure (just like in the work of Mullerand Meyer (1986)), and extracted the polarizability values via a charge perturbation ap-proach, deduced from the energies of the system perturbed by a charge -1 located at 25a0
(a0 =0.0529177 nm) from the center of the molecule. Spelsberg et al. (1993) extendedthe work of Muller and Meyer (1986) by computing static polarizabilities for Li2, Na2,and K2 at different levels of approximation in their full CI treatment. Polarizabilities ofNa2 and Na3 have been determined by Moullet et al. (1989) using pseudopotential local-spin density (LSD) calculations. The CIPSI approach for molecular electronic structurehas been combined with the time-dependent gauge invariant method (TDGI) by Merawa

34 CHAPTER 3. STATIC DIPOLE POLARIZABILITY OF ALKALI DIMERS
and Dargelos (1998) to calculate static polarizabilities, dynamic polarizabilities and Vander Waals coefficients Li, Na, Li2 Na2 and NaLi, while Antoine et al. (1999) used Den-sity Functional Theory (DFT) and CI for the same purpose. An SCF and many-bodyperturbation theory (MBPT) treatment, combined with finite-field method has been usedby Maroulis (1988, 2004) for Li2 and Na2 molecules. Urban and Sadlej (1995) com-bined the MBPT and coupled-cluster (CC) theories at different levels of approximationand finite-field perturbation to determine static polarizabilities of homonuclear and het-eronuclear dimers not involving the Cs atom. More recently, newly adjusted energy-consistent nine-valence-electron scalar pseudopotentials including effective CPP (Mullerand Meyer, 1984) have been developed by Lim et al. (2005) to investigate the proper-ties of alkali dimers from K2 to Fr2. Calculation of spectroscopic properties includingstatic dipole polarizabilities have been done using various models based on CC and DFTtheories, combined with the finite-field method.
Table 3.2 compares the here calculated values for the two components α‖ and α⊥,and for the average polarizability α and its anisotropy γ taken either at the experimentalequilibrium distance (when available) or at the computed one (Aymar and Dulieu, 2005)of each pair, with the previous theoretical determinations quoted above, in the case of theground state homonuclear alkali dimers. Due to the number of papers already publishedon Li2, only the most recent data is quoted. A more complete compilation of older workscan be found in the paper by Muller and Meyer (1986). These authors often reportedseveral polarizability values obtained within various approximations; only the values cor-responding to their most elaborate model are displayed in table 3.2.
One immediately sees in table 3.2 the broad dispersion of the reported values, whichcan be understood by looking again at figure 3.2. The equilibrium distance is locatedin the steep part of the polarizability functions, so that any small difference between theelectronic wave functions yielded by the various methods will result in a large variationof the polarizability components, which will become more accentuated for the averagepolarizability and the anisotropy. For the lighter species Li2 and Na2, the values of α‖and α⊥ calculated here agree well with those of Muller and Meyer (1986) and of Urbanand Sadlej (1995), as well as with the other recent determinations. However, for K2 thevalue of Ref. (Urban and Sadlej, 1995) deviates by about 7%, and by about 16% for Rb2.The values of Lim et al. (2005) for Rb2 are about 3% larger than the ones calculatedhere and about 6% larger for Cs2 respectively, while the situation in Fr2 is less clear, asequilibrium distances differ significantly between Ref. (Lim et al., 2005) and the present
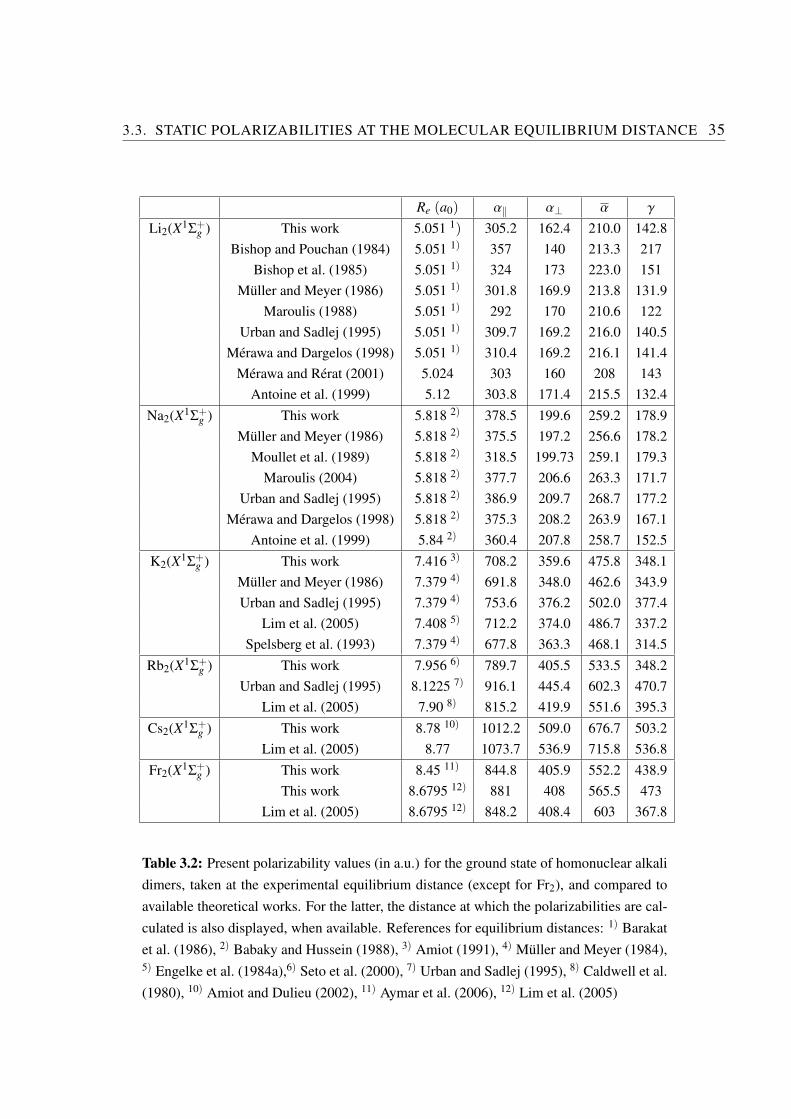
3.3. STATIC POLARIZABILITIES AT THE MOLECULAR EQUILIBRIUM DISTANCE 35
Re (a0) α‖ α⊥ α γ
Li2(X1Σ+g ) This work 5.051 1) 305.2 162.4 210.0 142.8
Bishop and Pouchan (1984) 5.051 1) 357 140 213.3 217Bishop et al. (1985) 5.051 1) 324 173 223.0 151
Muller and Meyer (1986) 5.051 1) 301.8 169.9 213.8 131.9Maroulis (1988) 5.051 1) 292 170 210.6 122
Urban and Sadlej (1995) 5.051 1) 309.7 169.2 216.0 140.5Merawa and Dargelos (1998) 5.051 1) 310.4 169.2 216.1 141.4
Merawa and Rerat (2001) 5.024 303 160 208 143Antoine et al. (1999) 5.12 303.8 171.4 215.5 132.4
Na2(X1Σ+g ) This work 5.818 2) 378.5 199.6 259.2 178.9
Muller and Meyer (1986) 5.818 2) 375.5 197.2 256.6 178.2Moullet et al. (1989) 5.818 2) 318.5 199.73 259.1 179.3
Maroulis (2004) 5.818 2) 377.7 206.6 263.3 171.7Urban and Sadlej (1995) 5.818 2) 386.9 209.7 268.7 177.2
Merawa and Dargelos (1998) 5.818 2) 375.3 208.2 263.9 167.1Antoine et al. (1999) 5.84 2) 360.4 207.8 258.7 152.5
K2(X1Σ+g ) This work 7.416 3) 708.2 359.6 475.8 348.1
Muller and Meyer (1986) 7.379 4) 691.8 348.0 462.6 343.9Urban and Sadlej (1995) 7.379 4) 753.6 376.2 502.0 377.4
Lim et al. (2005) 7.408 5) 712.2 374.0 486.7 337.2Spelsberg et al. (1993) 7.379 4) 677.8 363.3 468.1 314.5
Rb2(X1Σ+g ) This work 7.956 6) 789.7 405.5 533.5 348.2
Urban and Sadlej (1995) 8.1225 7) 916.1 445.4 602.3 470.7Lim et al. (2005) 7.90 8) 815.2 419.9 551.6 395.3
Cs2(X1Σ+g ) This work 8.78 10) 1012.2 509.0 676.7 503.2
Lim et al. (2005) 8.77 1073.7 536.9 715.8 536.8Fr2(X1Σ+
g ) This work 8.45 11) 844.8 405.9 552.2 438.9This work 8.6795 12) 881 408 565.5 473
Lim et al. (2005) 8.6795 12) 848.2 408.4 603 367.8
Table 3.2: Present polarizability values (in a.u.) for the ground state of homonuclear alkalidimers, taken at the experimental equilibrium distance (except for Fr2), and compared toavailable theoretical works. For the latter, the distance at which the polarizabilities are cal-culated is also displayed, when available. References for equilibrium distances: 1) Barakatet al. (1986), 2) Babaky and Hussein (1988), 3) Amiot (1991), 4) Muller and Meyer (1984),5) Engelke et al. (1984a),6) Seto et al. (2000), 7) Urban and Sadlej (1995), 8) Caldwell et al.(1980), 10) Amiot and Dulieu (2002), 11) Aymar et al. (2006), 12) Lim et al. (2005)

36 CHAPTER 3. STATIC DIPOLE POLARIZABILITY OF ALKALI DIMERS
Re (a0) α‖ α⊥ α γ
Li2(a3Σ+u ) This work 7.88 1) 700.3 252.2 401.6 448.2
Merawa and Rerat (2001) 7.88 1) 698 252 401 446Rerat and Bussery-Honvault (2003) 7.88 1) 695.8 253.1 400.7 442.7
Na2(a3Σ+u ) This work 9.62 2) 495.0 278.2 350.4 216.9
Rerat and Bussery-Honvault (2003) 9.62 2) 487.7 276.9 347.2 210.7K2(a3Σ+
u ) This work 10.9 3) 956.4 477.3 637.0 479.1Merawa et al. (2003b) 10.9 3) 953.8 476.8 635.8 477.0
Rb2(a3Σ+u ) This work 11.4 4) 1016.4 508.0 677.5 508.4
Cs2(a3Σ+u ) This work 11.9 5) 1322.8 641.2 868.4 681.5
Table 3.3: Same as table 3.2 for the lowest triplet state of Li2, Na2, K2, Rb2 and Cs2.References for equilibrium distances: 1) Linton et al. (1989), 2) Li et al. (1985), 3) Li et al.(1990), 4) Aymar et al. (2006), 5) Li and Krems (2007).
ones. However the differences observed among the average polarizabilities stay within a10% range representative of the typical uncertainty of the experimental values. Only fewresults have been published for the lowest triplet state (table 3.3), and the values presentedhere agree well with them, within a few percent range.
A similar table was set up for polarizabilities of the ground state of heteronuclear al-kali pairs (table 3.4), for which very few other theoretical values are available (except forLiNa): Urban and Sadlej (1995) considered the six molecules LiNa, LiK, LiRb, NaK,NaRb, and KRb, in their coupled-cluster approach, while Tarnovsky et al. (1993) pro-posed an estimate of the average polarizability α based on their measurements of polariz-abilities for homonuclear species (see next section). All determinations are consistent forthe lightest species LiNa, while the values of Urban and Sadlej (1995) are significantlylarger than the one from the present calculation for the heavy species LiRb, NaRb, andKRb.
3.4 Comparison with experiments
In most experiments the only accessible physical quantity is the average polarizabilityof the molecule measured for a given vibrational level, while the alignment property iscontrolled by the anisotropy of the polarizability. These quantities are determined by

3.4. COMPARISON WITH EXPERIMENTS 37
Re (a0) α‖ α⊥ α γ
LiNa This work 5.4518 1) 347.6 181.8 237.0 165.8Urban and Sadlej (1995) 5.4518 1) 352.1 188.8 243.2 163.2
Merawa and Dargelos (1998) 5.4518 1) 351.7 191.5 249.9 160.2Merawa et al. (2003a) 5.4518 1) 350.6 187.7 242.0 162.9Antoine et al. (1999) 5.4518 1) 352.2 188.9 234.4 163.3
LiK This work 6.268 2) 489.7 236.2 320.7 253.5Urban and Sadlej (1995) 6.268 2) 484.8 246.6 326.0 238.2
LiRb This work 6.5 3) 524.3 246.5 339.1 277.8Urban and Sadlej (1995) 6.609 558.2 268.7 365.2 289.5
LiCs This work 6.93 4) 597.0 262.5 374.0 334.5NaK This work 6.61 5) 529.2 262.3 351.3 266.9
Urban and Sadlej (1995) 6.61 5) 537.5 279.6 365.5 257.9NaRb This work 6.88 6) 572.0 280.3 377.5 291.7
Urban and Sadlej (1995) 6.967 606.3 303.2 404.2 303.1NaCs This work 7.27 7) 670.7 304.2 426.4 366.5KRb This work 7.688 8) 748.70 382.9 504.8 365.8
Urban and Sadlej (1995) 7.786 842.4 411.5 555.1 430.9KCs This work 8.095 9) 822.3 425.62 571.1 436.7RbCs This work 8.366 10) 904.0 492.3 602.8 491.7
Table 3.4: Present polarizability values (in a.u.) for the ground state of heteronuclear alkalidimers, taken at the experimental (when available) or the theoretical (from reference (Ay-mar and Dulieu, 2005)) equilibrium distances, and compared to other published theoreticalresults. References for equilibrium distances: 1) Engelke et al. (1982), 2) Engelke et al.(1984b), 3) Aymar and Dulieu (2005), 4) Staanum et al. (2007), 5) Krou-Adohi and Giraud-Cotton (1998), 6) Kasahara et al. (1996), 7) Diemer et al. (1984), 8) Ross et al. (1990),9) Ferber et al. (2009), 10) Gustavsson et al. (1988).

38 CHAPTER 3. STATIC DIPOLE POLARIZABILITY OF ALKALI DIMERS
averaging their R-dependence over the vibrational wave functions |v〉 of the electronicground state and of the lowest triplet state of the molecules, i.e.: βv ≡ 〈v|β(R)|v〉, whereβ is one of the quantities α‖, α⊥, α, γ (the calculation of the vibrational wavefunctionswas described in chapter 2). Thus it is assumed that the the vibrational motion is notdistorted by the polarization of the molecule, following the discussion by Bishop andKirtma (1991). In any case, the potential curves computed with a non-zero electric fieldare always found very close to the field-free ones.
Singlet ground state Lowest triplet statemolecule α|v=0 γ|v=0 αmax |v = γmax |v = α|v=0 γ|v=0
Li2 226.8 169.6 359.0 23 339.2 16 399.4 438.6Na2 259.7 179.5 357.5 40 299.3 28 347.9 200.7K2 473.0 343.7 601.2 61 496.4 43 636.6 476.4Rb2 530.6 378.8 656.1 88 526.2 63 685.5 493.5Cs2 670.3 490.8 819.2 110 677.1 79 865.4 667.6
LiNa 236.5 166.6 339.2 37 286.3 27 365.0 288.6LiK 318.7 250.3 474.2 38 451.5 29 514.6 442.5LiRb 340.4 280.4 504.5 39 499.3 30 535.5 429.0LiCs 368.8 326.7 594.2 42 654.9 33 631.0 533.7NaK 352.3 261.4 472.1 54 407.1 38 485.8 303.5NaRb 375.6 288.2 501.5 61 443.1 44 510.1 310.1NaCs 421.9 359.4 584.1 64 567.0 46 589.7 351.3KRb 502.0 360.3 629.1 71 511.2 51 661.5 484.6KCs 566.0 426.7 712.0 76 609.3 54 749.2 564.3RbCs 597.6 440.9 737.3 74 609.4 53 773.2 567.5
Table 3.5: Average polarizabilities and anisotropies computed in the present work for thesinglet ground state and lowest triplet states of all alkali pairs. Values are listed for thelowest vibrational level (v = 0), and for the level where the maximum value is reached forthe ground state.
Figure 3.6 illustrates the dependence of these quantities for the two lowest electronicstates of all pairs with the vibrational level, while table 3.5 summarizes the main rele-vant features of these variations. As expected from their monotonic R-dependence, theaverage polarizability of the lowest triplet states is slowly decreasing down to the sumof atomic values with increasing vibrational index, while the anisotropy monotonically

3.4. COMPARISON WITH EXPERIMENTS 39
0 50 100 150
200
400
600
800
0 50 100 150
0
200
400
600Li2
Na2
K2
Rb2
Cs2
0 50 100vibrational index
200
400
600
aver
age
pola
riza
bilit
y (a
.u.)
0 50 100vibrational index
0
200
400
600
anis
otro
py (
a.u.
)
LiNaLiKLiRbLiCsNaKNaRbNaCsKRbKCsRbCs
0 10 20 30 40 50vibrational index
300
400
500
600
700
800
900
aver
age
pola
riza
bilit
y (a
.u.)
0 10 20 30 40 50vibrational index
0
100
200
300
400
500
600
700
anis
trop
y (a
.u.)
(a) (b)
(c) (d)
(e) (f)
Figure 3.6: Dependence of average polarizabilities and anisotropies as functions of vibra-tional levels: (a)-(d)for the singlet ground state, (e),(f) for the lowest triplet state.

40 CHAPTER 3. STATIC DIPOLE POLARIZABILITY OF ALKALI DIMERS
drops to zero. In contrast, both quantities exhibit a maximum for quite a high vibrationallevel of the electronic ground state, due to the combined influence of the above mentioneddifference between the equilibrium distance and the position of the maximum value of theparallel component, and to the increase of the perpendicular component with the distance.From the previous section it is not obvious how to discriminate between the various the-oretical determinations. In the following it will be investigated if reported experimentalworks can be helpful for this purpose. Only few experimental works reported values forthe average polarizability of alkali dimers. Molof et al. (1974b) and Tarnovsky et al.(1993) measured the deflection of a thermal molecular beam of alkali dimers in an inho-mogeneous electric field, and both investigated the series of homonuclear species fromLi2 to Cs2. In addition, Tarnovsky et al. (1993) also studied the NaK and KCs systems,and extracted an average static polarizability from their measurement by subtracting theeffect of the permanent dipole moment as calculated in by Igel-Mann et al. (1986). Us-ing the same technique in their cluster experiment, Antoine et al. (1999) reported averagepolarizabilities for Na2, Li2 and NaLi from a thermal molecular beam. The drawback ofusing a thermal beam is that the deduced values depend on the temperature of the beam,i.e. of the population of vibrational levels above the lowest one. In contrast in their exper-iment on sodium and potassium clusters, Knight et al. (1985) reported on the deflectionof a supersonic molecular beam, in which dimers can safely be considered as being in thev = 0 level (i.e. at T = 0 K). All these values typically have an error of 10%, and they arecompiled in tables 3.6 and 3.7, together with the present computed average polarizabilitiesfor the v = 0 level of the ground state of all alkali pairs.
First note that the values of Knight et al. (1985) agree well with those of Tarnovskyet al. (1993) extrapolated to T = 0 K for Li2, Na2 and K2, which then validates the proce-dure proposed by Igel-Mann et al. (1986). Tarnovsky et al. suggested that the low valuesof Molof et al. may be due to deviation from the thermodynamic equilibrium betweenmonomers and dimers in the latter work. Even though no values were available for Rb2
and Cs2 that had been extrapolated to T = 0 K, our results still lie within the somewhatlarge error bars obtained in the thermal beam of reference (Tarnovsky et al., 1993). Thiscan be understood from the previous figures since the polarizability smoothly increasesfor the lowest vibrational levels. The same conclusion holds for the NaK and KCs valuesmeasured by the same authors, while the two measured values for LiNa are significantlylarger than the prediction presented here. All the other values for Rb2 and Cs2 and for theheteronuclear species displayed by Tarnovsky et al. (1993) are obtained from an empirical

3.4. COMPARISON WITH EXPERIMENTS 41L
i 2N
a 2K
2R
b 2C
s 2α| v=
022
6.8
259.
747
353
0.6
670.
3Ta
rnov
sky
etal
.(19
93)(
a)22
9±20
(948
K)
270±
20(6
76K
)51
9±41
(542
K)
533±
41(5
27K
)70
1±54
(480
K)
Tarn
ovsk
yet
al.(
1993
)(b)
216±
20(0
K)
256±
20(0
K)
499±
41(0
K)
553±
41(e
st.)
675±
54(e
st.)
Mol
ofet
al.(
1974
b)22
9±20
(990
K)
202±
20(7
36K
)41
1±34
(569
K)
459±
34(5
34K
)61
4±54
Kni
ghte
tal.
(198
5)26
3±20
(0K
)49
9±41
(0K
)A
ntoi
neet
al.(
1999
)22
1±10
(110
0K
)26
9±10
(110
0K
)
Tabl
e3.
6:Pr
esen
tave
rage
pola
riza
bilit
yα| v=
0(i
na.
u.)
for
the
grou
ndst
ate
ofho
mon
ucle
aral
kali
dim
ers,
com
pute
dfo
rth
eir
v=
0le
vel.
The
valu
esfo
rαar
eco
mpa
red
toth
eex
peri
men
talm
easu
rem
ents
ofM
olof
etal
.(19
74b)
,Kni
ghte
tal.
(198
5),a
ndTa
rnov
sky
etal
.(19
93)
(row
(a))
atva
riou
ste
mpe
ratu
res
ofth
eir
ther
mal
beam
,and
extr
apol
ated
toT=
0K
follo
win
gM
ulle
ran
dM
eyer
(198
6)an
dTa
rnov
sky
etal
.(19
93)
(row
(b))
,i.e
.fo
rth
ev=
0le
vel.
Inth
isre
spec
t,th
esu
pers
onic
beam
used
byK
nigh
teta
l.(1
985)
isco
nsid
ered
tobe
atT=
0K
.
NaK
KC
sL
iNa
LiK
LiR
bα| v=
035
2.3
566
236.
531
8.7
340.
4Ta
rnov
sky
etal
.(19
93)(
a)39
1±20
(est
.)60
7±54
(est
.)25
0±20
(est
.)37
8±34
(est
.)38
5±40
(est
.)Ta
rnov
sky
etal
.(19
93)(
b)34
4±27
(612
K)
600±
47(4
94K
)G
raff
etal
.(19
72)
270±
30A
ntoi
neet
al.(
1999
)26
3±10
(110
0K
)
LiC
sN
aRb
NaC
sK
Rb
RbC
sα| v=
036
8.8
375.
642
1.9
502
597.
6Ta
rnov
sky
etal
.(19
93)
466±
54(e
st.)
398±
40(e
st.)
479±
54(e
st.)
526±
40(e
st.)
614±
54(e
st.)
Tabl
e3.
7:Pr
esen
tave
rage
pola
riza
bilit
yα| v=
0(i
na.
u.)
grou
ndst
ate
ofhe
tero
nucl
ear
alka
lidi
mer
s,co
mpu
ted
for
thei
rv=
0le
vel.
As
for
the
hom
onuc
lear
sth
eex
peri
men
tal
valu
esfo
rN
aKan
dK
Cs
are
repo
rted
,as
wel
las
the
estim
ates
for
all
the
hete
ronu
clea
rspe
cies
from
Tarn
ovsk
yet
al.(
1993
)(se
ete
xtan
dta
ble
3.6,
and
the
expe
rim
enta
lval
uefr
omA
ntoi
neet
al.(
1999
)fo
rNaL
i.

42 CHAPTER 3. STATIC DIPOLE POLARIZABILITY OF ALKALI DIMERS
rules involving polarizabilities of homonuclear species and permanent dipole moments ofheteronuclear pairs known at the time of that work. Their validity is difficult to estimate.However, as a systematic investigation of all alkali pairs with similar numerical conditionswas performed here, one might come to the conclusion that such an empirical rule gen-erally overestimates the average polarizabilities, even if the calculated values stay withinthe estimated uncertainty, apart from LiK, LiRb, and LiCs. In conclusion, the presentstudy show that more experimental work would be needed, for instance using supersonicbeams of alkali pairs, if they were available.
3.5 Alignment and orientation of alkali dimers
The previous sections introduced many computational procedures and numerical re-sults. Although arguably somewhat bulky, these preparations were necessary to tacklethe question addressed in the beginning of section 3: is it feasible to prepare alignedand oriented samples of ultracold alkali dimers using either only static electric fields or acombination of strong laser fields and static electric fields as proposed by Friedrich andHerschbach (1999a)? With all necessary quantities at hand, this section will discuss thisquestion in detail.
The interactions between a molecule and external fields can be characterized by twodimensionless parameters ωor for orientation and ∆ωal for alignment:
ωor =µεS
Bv∆ωal =
γIL
2Bv(3.2)
They are related to the interaction potential of the molecule in a vibrational level v withpermanent dipole moment µ, anisotropy γ, and rotational constant Bv with an externalstatic electric field of amplitude εS , and with a laser field of intensity IL. The val-ues of these orientation and alignment parameters can be conveniently evaluated withpractical units according to: ωor = 0.0168µ(Debye)εS (kV/cm)/B(cm−1), and ∆ωal =
10−11γ(A3)IL(W/cm−2)/B(cm−1). Table 3.8 gives the required amplitudes of the fieldsyielding ωor = 1 and ∆ωal = 1 for all alkali pairs, which can easily be scaled to any fieldstrength appropriate for the considered experimental arrangement. Friedrich and Her-schbach (1999a) displayed such a table for typical values of static fields and laser pulseintensities for a series of linear polar molecules such as alkali halides or molecules ofatmospheric relevance.
3.5. ALIGNMENT AND ORIENTATION OF ALKALI DIMERS 43
The pendular hybridization of polar molecules using only an electric field, also calledthe ”brute force technique”, requires the interaction parameter ωor to be larger thanroughly 10 to observe sizable orientation (Nahler et al., 2003). From the values reportedin table 3.8 it becomes immediately clear that this requires field strengths above 10 to40 kV/cm, depending on the specific alkali dimer. While these field strengths are cer-tainly achievable in certain setups (e. g. molecular beam machines), they are often notcompatible with constraints of setups for the formation of ultracold molecules (i. e. goodoptical access, ultra high vacuum, usage of glass cells, . . . ).
In the following experimental parameters for the orientation of polar alkali dimersin combined electric and laser fields are given, using RbCs as an example. RbCs hasa favorable ratio of anisotropy to rotational constant and has already been produced atultracold temperatures in the absolute ground state X1Σ v=0, using photoassociation anda coherent transfer process (Sage et al., 2005). In order to reach nearly perfect orientationof the molecules, the interactions with the external fields have to reach at least ωor = 1and ∆ωal = 20. According to table 3.8, ωor = 1 is already reached for a static electric fieldof 1.4 kV/cm which can be easily realized, even by largely spaced electrodes which donot reduce the optical access to the sample. In order to reach ∆ωal = 20, a laser intensityof roughly 109 W/cm2 is necessary. Such intensities can be reached continuously in aresonator-enhanced dipole trap: Mosk et al. (2001) have coupled a 1.2 W Nd:YAG laserbeam into an actively stabilized confocal resonator. The intensity in the anti-nodes of thestanding wave inside the resonator is then given by
I0 = 4×A× 2PL
πω02 (3.3)
where the factor 4 is due to the coherent addition of fields in a standing wave, A is thepower enhancement factor of the resonator, PL the laser power coupled into the cavity andω0 the waist in the focus of the cavity. Mosk et al. (2001) report a power-enhancementof nearly A=150. Using such a setup with currently available laser powers of the order of100 W, the required intensity of 109 W/cm2 is reached at a realistic focus size of ∼60µm.Additionally to the alignment of the molecules, the anti-nodes of the standing wave wouldalso trap the molecules via the interaction with the average polarizability α (Grimm et al.,2000). This leads to the formation of a stack of pancake-shaped, individually alignedensembles at distances of λ/2 where λ is the wavelength of the alignment laser. Also thelowest triplet states of alkali dimers appear to be good candidates for this proposal despitetheir very low dipole moment. For LiCs values of ωal = 10 and ωor = 0.1 seem feasible.

44 CHAPTER 3. STATIC DIPOLE POLARIZABILITY OF ALKALI DIMERS
XXX1Σ+ v0 γ (a.u.) Bv (×10−2cm−1) Ial (×108W/cm2) dv (Debye) Eor (kV/cm)RbCs 0 441 2.90 0.44 -1.237 1.4KCs 0 427 3.10 0.49 -1.906 1.0KRb 0 360 3.86 0.72 -0.615 3.7NaCs 0 359 5.93 1.1 -4.607 0.8NaRb 0 288 7.11 1.7 -3.306 1.3NaK 0 261 9.62 2.5 -2.579 2.2LiCs 0 327 19.4 4.0 -5.523 2.1LiRb 0 280 22.0 5.3 -4.165 3.1LiK 0 250 26.1 7.1 -3.565 4.4LiNa 0 167 38.0 15 -0.566 39.9RbCs 77 488 1.65 0.23 -0.906 1.1KCs 78 483 1.71 0.24 -0.843 1.2KRb 73 400 2.07 0.35 -0.257 4.8NaCs 63 483 3.46 0.48 -2.375 0.9NaRb 61 355 3.82 0.73 -1.558 1.5NaK 55 321 4.98 1.0 -1.254 2.4LiCs 41 565 10.8 1.3 -3.051 2.1LiRb 39 415 11.8 1.9 -1.947 3.6LiK 39 352 12.7 2.4 -1.205 6.3LiNa 38 211 16.4 5.3 -0.026 374.9
aaa3Σ+ γ (a.u.) Bv (×10−2cm−1) Ial (×108W/cm2) dv (Debye) Eor (kV/cm)RbCs 568 1.46 0.17 0.0003 -2887.9KCs 564 1.53 0.18 -0.013 69.9KRb 485 1.81 0.25 -0.011 98.1NaCs 351 2.60 0.50 0.005 -309.3NaK 303 3.87 0.86 0.008 -287.6NaRb 310 2.97 0.65 -0.002 883.2LiCs 534 9.27 1.2 -0.145 38.1LiRb 429 9.72 1.5 -0.123 47.1LiK 443 11.5 1.8 -0.113 60.6LiNa 289 14.1 3.3 -0.068 123.6
Table 3.8: Summary of the properties (anisotropy γ, rotational constant Bv, permanentdipole moment dv) of mixed alkali pairs relevant for their orientation and alignment inducedby external fields, for the lowest vibrational level of their X1Σ+ ground state (upper table)and their lowest triplet state a3Σ+ (lower table). The values for the laser intensity Ial of a cwlaser field, and for an external static electric field Eor correspond to ∆ωal = 1 and ωor = 1respectively (see text). Also reported are such properties for the vibrational level with thelowest required intensity for alignment.

Part II
Formation and interactions of ultracoldLiCs molecules
45

47
The previous section treated the formation and manipulation of ultracold moleculestheoretically. This section reports on the experimental investigation of ultracold LiCsmolecules, performed in the group of Matthias Weidemuller at the University of Freiburgas part of this thesis. Before plunging into the details of the experiments, a broaderoverview over the experimental methods in the field of cold and ultracold molecules shallbe given. Further references can be found e.g. in the very recent reviews by Carr et al.(2009) and Dulieu and Gabbanini (2009). Basically there are only two approaches to-wards the creation of cold or ultracold samples of molecules. As John Bohn (2009) put itat the occasion of a workshop on cold molecules:
The hottest new thing in the world of cold matterIs to join pairs of atoms that are trying to scatter;
Or else to begin with a molecule firstAnd to bring it to rest, being gently coerced.
Let’s start with the second verse, paraphrasing the concept of direct cooling of molecules.Several approaches have been developed to cool internal and external degrees of freedomof molecular samples, among others there are:
Stark deceleration of polar molecules. The principle idea is very simple: first pack-ages of internally cold, polar molecules are created in a super sonic expansion. Thenthe external energy (the kinetic energy in the laboratory frame) is removed by the forceexerted on the polar molecules by an electric field gradient. It is however not possibleto create a single sufficiently strong field gradient or to maintain it over such a long dis-tance that the molecules come to a stand still (the resulting absolute voltages would betechnically unfeasible). Therefore the gradient field is split into several stages (on theorder of a hundred) and the voltages are switched alternatingly between these stages sothat one “synchronous” package of molecules always has to climb a potential hill. Thisis of course a very simple picture which does not do justice to the delicate design andoperation of these machines, a detailed review has been published by van de Meerakkeret al. (2006). This technique has been applied successfully to several species (CO, ND3,OH, YbF, H2CO, NH, SO2, and LiH). Some of them were consequently trapped in staticor time-averaged electric fields, or in magnetic traps. Final temperatures and densities aretypically around 1 K and 109 cm−3, respectively. Also H2 molecules in highly polarizableRydberg states have been decelerated using the Stark effect (Yamakita et al., 2004). Avariation of this scheme is based on the Zeeman effect, in which paramagnetic molecules

48
are slowed in magnetic field gradients (Vanhaecke et al., 2007).
Buffer-gas cooling is maybe closest to the conventional picture of cooling: mole-cules are brought into thermal contact with a cold refrigerant, typically cryogenic cooledhelium gas. Due to elastic collisions the two ensembles thermalize, effectively coolingthe species of interest to the temperature of the bath, which can be as low as 240 mK (for3He). Paramagnetic molecules are then cold enough to be trapped in a magnetic trap atdensities of 108-1013 cm−3 (Weinstein et al., 1998). Molecules can also be extracted fromthe buffer gas chamber with a quadrupole guide, providing a continuous beam of coldpolar molecules (Rangwala et al., 2003).
Helium nanodroplets are created in a free jet expansion of helium at temperaturesdown to 150 mK. These droplets can then be seeded with different molecules, which arecooled to the temperature of the droplet. The excess energy is removed by evaporation ofHe atoms. Also alkali dimers are observed to form on droplets, which are seeded with theconstituent atoms. Again the binding energy is removed by evaporation of He atoms. Asthe triplet state is far more weakly bound than the singlet one in alkali dimers, the formeris dominantly populated. Although internally cold, the molecules are still moving veryfast in the lab frame. An extensive review of this field can be found in (Stienkemeier andLehmann, 2006).
Billiard-like collisions, as the name suggests, are a technique inspired by classicalmechanics: if two equal masses hit under certain conditions, chances are that one comesto a standstill while the partner caries away all the momentum. This was successfullydemonstrated for collisions of NO with Argon, where samples of up to 109 atoms at atemperature of 35 mK could be created (Strecker and Chandler, 2008).
The previously described approaches all aim at removing kinetic energy from exist-ing, yet hot molecules. In stark contrast, the methods of photo- and magnetoassociationstart out with already ultracold atoms and associate them into molecules (which havebasically the same temperature as the constituent atoms). This obviously limits this tech-nique to molecules “built” from laser-coolable atoms. In the case of magnetoassociation,the coupling between a scattering state and a bound level is used to form very weaklybound macro-dimers. Such a Fano-Feshbach resonance is typically created by tuning thebinding energy of a bound vibrational level with an external magnetic field to the asymp-totic energy of a different hyperfine asymptote (with differing magnetic moment). Atompairs colliding in this continuum state can then be adiabatically transferred into the bound

49
state by sweeping the magnetic field over the resonance. At phase-space densities closeto quantum degeneracy such a conversion can occur with near unity transfer efficiency,however the resulting macro dimers are very weakly bound. Using coherent optical trans-fer schemes, these Feshbach molecules can then be transferred into deeper bound lev-els (Danzl et al., 2008; Winkler et al., 2007) and even into the lowest ones (Lang et al.,2008; Ni et al., 2008). While these schemes require very complex sequences of cooling,trapping, and manipulation of atoms and molecules through external magnetic and opti-cal fields, they can yield dense samples of ultracold molecules with phase-space densitiesclose to quantum degeneracy.
The second method for association uses a field-induced resonance between the scatter-ing continuum state and an electronically excited molecular level, where the coupling iscreated by resonant photons, hence the name photoassociation (PA). Stable ground statemolecules are then formed after spontaneous decay from the excited molecular level.Note that the theoretical aspects of this method have already been covered in the firstpart (section 2.3), an extensive review can be found in (Jones et al., 2006). The forma-tion of ultracold molecules using PA was first demonstrated for cesium dimers (Fiorettiet al., 1998) and later shown for many other homo- and heteronuclear alkali dimers. Theformed molecules are typically in different vibrational and rotational levels, however theabsolute ground state can also be efficiently populated: for K2 (Nikolov et al., 2000) andLiCs (Deiglmayr et al., 2008b) this was achieved by PA via states with favorable Franck-Condon factors for the decay. Coherent and incoherent transfer schemes were used totransfer photoassociated molecules of RbCs (Sage et al., 2005) and Cs2 (Viteau et al.,2008) into the lowest vibrational level.
In the following part, the PA of ultracold 7Li133Cs will be discussed. Chapter 4presents the experimental setup for laser cooling of the two atomic species, the formationof molecules using PA and the detection of ground state molecules based on photoioniza-tion and high-resolution mass spectrometry. A detailed analysis of the PA process, an ac-curate determination of the potential energy curve of the B1Π state, and the first detectionof LiCs molecules in the absolute rovibrational ground state are presented in chapters 5and 6. In chapter 7, interactions of ultracold LiCs molecules are studied. First the per-manent electric dipole moment of the ground state is determined by Stark-spectroscopy,then the formation and trapping of LiCs molecules in an optical dipole trap is realized. Inthis trap, atom-molecule collisions are investigated quantitatively.

50

Chapter 4
Experimental setup
The basic setup used for the experiments presented here has been described in detail intwo previous theses by Stephan Kraft (Kraft, 2006) and Jorg Lange (Lange, 2007). Thissection will give a brief overview over the experimental setup and introduce the recentchanges implemented in the course of this thesis in more detail. The starting point forthe formation of ultracold LiCs molecules is the trapping and cooling of the constituentatoms, lithium and cesium. All following experiments are based on this step and thus it isof special importance to optimize it both with respect to the number and density of trappedatoms as well as the stability of these numbers. Significant improvements were achievedby implementing a dark spontaneous force optical trap (’dark SPOT’) for cesium, increas-ing both the number of simultaneously trapped lithium and cesium atoms as described insection 4.1. The molecules are subsequently formed by photoassociation (PA), ionizedby a pulsed laser and finally detected in a time-of-flight detector. The different steps willbe discussed in detail in sections 4.2 and 4.3. A broadly tunable continuous-wave (cw)dye laser was added to the setup to perform high resolution spectroscopy of the formedground state molecules (section 4.4).
4.1 Mixture of ultracold Li and Cs atoms
Li and Cs atoms are evaporated in a double species oven, then slowed down in aZeeman slower and trapped in an overlapped conventional magneto-optical trap for 7Liand a dark spontaneous force optical trap (Ketterle et al., 1993) for 133Cs. A generaloverview over the experimental chamber is shown in figure 4.1 and figure 4.2 shows the
51

52 CHAPTER 4. EXPERIMENTAL SETUP
Figure 4.1: Experiment chamber without mounted optics and oven section. The lithiumand cesium atoms are evaporated from the oven on the right (see also figure 4.2). In theZeeman slower, the atoms are slowed down below the trapping velocity of the MOTs. Thedouble MOT for lithium and cesium is located in the central area of the main chamber inthe left part of the image.
double-species oven in detail.
The construction of the oven follows closely the design by Stan and Ketterle (2005),details are given in reference (Lange, 2007). The oven features two separate reservoirs forlithium and cesium. Both are connected to a mixing chamber: the cesium reservoir onlyvia a thin capillary while the flow from the lithium reservoir is not restricted. The lithiumvapor-pressure in the mixing chamber is therefore only determined by the temperature ofthe reservoir. The same holds for cesium, as long as the cesium pressure in the mixingchamber does not saturate, which requires that the flow through the nozzle is larger thanthe flow through the capillary. Normal operating parameters are given in the caption offigure 4.2. Typical pressures in the oven section are below 5x10⁻⁹ mbar if the reservoirsare cold, around 1x10⁻⁷ mbar if only lithium is kept at operating temperature, and around5x10−6 mbar if both lithium and cesium reservoirs are at their operating temperature.The performance of the oven is very satisfactory after the temperature stabilization ofthe different oven sections was optimized. Previously a combination of various PID-controllers in combination with band heaters was used for this purpose. As most of thecontrollers employed mechanical relays for current switching, stuck relays frequently lead

4.1. MIXTURE OF ULTRACOLD LI AND CS ATOMS 53
to an overheating of parts of the oven. Also it was difficult to assure constant temperaturegradients when heating up or cooling down the oven, as no central control was possible.A new 6-channel PID controller 1 with solid state relays and computer interface (RS-232)solved these issues. A self-written LabView
TM(National Instruments) interface facilitates
the interaction with the controller: different temperature settings can be loaded into thecontroller with a single click (constant temperature gradients are ensured by the controlleritself), and automatic alarm messages are sent out via SMS and e-Mail, if the controllerdetects a broken sensor or an over-temperature.
Figure 4.2: Double-species oven for lithium and cesium without band heaters and insula-tion. The flange on the left is connected to the remainder of the vacuum apparatus (rightedge of figure 4.1). The positions of the five temperature sensors used for stabilization areindicated in red, an additional sensor (drawn in blue) is used for monitoring only. Typi-cal operating parameters are: nozzle 450, mixing chamber 440, capillary 450, lithiumreservoir 400, cesium reservoir 100 (all values in degree Celsius).
After the oven section, a differential pumping section ensures ultra-high vacuumconditions in the main chamber. Typical pressures in the main chamber are around2x10−11 mbar during normal operation and below 1x10⁻¹¹ mbar (the lower end of themeasurement range of the installed pressure gauge) when the valve to the oven sectionis closed. After the differential pumping section the atoms are decelerated in a Zeeman-slower, which has been characterized in detail in references (Engler, 1997, 2000). For
1. Schoen Elektrotechnik, RS2400-626 with solid state relays SSR-231-09555

54 CHAPTER 4. EXPERIMENTAL SETUP
the experiments presented here it was mostly operated at currents of 5.6 A for the gradi-ent coils, 0.5 A for the offset-coil, and 8.7 A for the compensation coil. The detuning ofthe light for slowing the lithium was optimized to -90 MHz from the atomic resonancesF=2→F∗ and F=1→F∗ 2 respectively, the detuning of the cesium slower to -30 MHz fromthe atomic resonance F=4→F∗=5. The repumping light in the cesium slower is providedby the MOT repumper, so the detuning is not separately optimized.
The atomic beam from the oven is eventually ’dumped’ on the viewport through whichthe Zeeman-slowing light passes. The viewport is made from sapphire, which is supposedto resist alkali metals longer than regular glass, and is always kept at a temperature of100 C. While in earlier experiments the fast built-up of a metal coating on the viewportwas observed, in the last two years of continuously running the experiment this did notoccur. Only small aggregates of metal seem to form on the viewport, but not a closedcoating. This could be both due to a higher temperature of the viewport (100 C instead ofpreviously 80 C) and to a lower flux of atoms: previously the lithium (cesium) reservoirhad a typical temperatures of 440 C (130 C), while now it is kept at 400 C (100 C).Irradiating the viewport with a halogen bulb from close distance from time to time alsohelped to reduce the number of metal aggregates on the viewport. This effect is morelikely due to the additional heating of the glass substrate than to light-induced desorptionof alkali metals observed in other experiments (Anderson and Kasevich, 2001; Klemptet al., 2006).
The magneto-optical traps (MOTs) for lithium and cesium are overlapped in the centerof the main experimental chamber. They share the same magnetic gradient field createdby a pair of coils in anti-Helmholtz configuration (typical current 23 A, correspondingto a gradient of 20 G/cm in the z-direction), mounted outside of the vacuum. The lightfor laser cooling of cesium is created by several DBR (distributed Bragg reflector) laserdiodes and is transported to the experimental chamber through three fibers for the cooling,the repumping, and the light for the Zeeman-slower (combining slowing and repumpinglight). The trap is operated in a five-beam geometry: four pair-wise counter-propagatingbeams in the plane of the optical table and a retro-reflected beam for the vertical axis. De-tails can be found in references (Lange, 2007) and (Gluck, 2008). This setup was changedfrom a conventional MOT to a dark spontaneous force optical trap (dark SPOT) to increase
2. The hyperfine splitting of the excited state 2p3/2 in 7Li is comparable to the natural linewidthΓ/2π=5.9 MHz. Therefore the hyperfine manifold can not be resolved spectroscopically and is labeledsimply F∗

4.1. MIXTURE OF ULTRACOLD LI AND CS ATOMS 55
0 50 100 150 200 2500
1x10
8
4x10
7
a)Li MOT
onlyCs MOT+ Li MOT
Cs MOTonly
Seconds
0
#Li
#Cs
0 50 100 150 200 2500
b)
1x10
8
4x10
7
#Li
#Cs Li MOT
onlyCs SPOT+ Li MOT
Cs SPOTonly
Seconds
0
Figure 4.3: Loading curves for overlapped lithium and cesium traps: a) First only thecesium MOT is loaded, then additionally the lithium MOT. The number of trapped cesiumatoms is reduced by roughly a factor of two. After blocking the cesium MOT, roughly a9-fold increase in the number of trapped lithium atoms is observed, indicating very highlosses due to Li-Cs collisions. b) The same sequence with overlapped forced dark SPOTfor cesium and identical lithium MOT. Only a weak suppression of trapped atom numbersis observed when loading both traps simultaneously.
the atomic density and to reduce losses due to interspecies collisions: in overlapped MOTstraps for different atomic species, high loss rates due to inelastic interspecies collisionsare a well known experimental difficulty (Mancini et al., 2004b). Figure 4.3 a) demon-strates the importance of these losses for the setup used in previous experiments (Kraftet al., 2006). For the case of Li-Cs, the dominant loss channel has been identified as in-elastic collisions between excited Cs(6P3/2) and ground state Li(2S1/2) atoms (Schloderet al., 1999) (collisions between excited Li and ground state Cs atoms are dominated bythe elastic channel). As in a dark SPOT only a very small fraction of the atoms is in anelectronically excited state, these inelastic interspecies collisions are greatly suppressed,as demonstrated in figure 4.3 b). Therefore substantially more atoms of both species canbe trapped in the same volume. Typically the parameters were chosen such that 97% ofthe cesium atoms were kept in the dark state, a detailed characterization of the dark SPOTis given in appendix B. The distinction between the terms dark SPOT and MOT will notbe kept strict throughout this thesis, often the cesium dark SPOT will also be referred as”magneto optical trap”. However all experiments in this thesis have been performed with

56 CHAPTER 4. EXPERIMENTAL SETUP
the dark SPOT setup for cesium, if not stated otherwise.The trap for the lithium atoms is operated in a three-beam geometry (all beams are
retro-reflected) and the light is brought to the trap without fibers, as the laser sourcesprovide only 30 mW and 20 mW for the two cooling transitions (Lange, 2007). The beamprofile of the trapping laser was problematic: the thin beam-splitters (4x4 cm size, 1 mmthickness) used for separating the beam for the Zeeman-slower and the three beams forthe MOT were always slightly bent in their respective mounts, even after very carefuladjustment. They therefore acted as cylindrical lenses (with long focal lengths though)and effectively reduced the volume of the trap. The thin beam-splitters were thereforereplaced by thick ones (3x5 cm size, 4 mm thickness), leading to an increase in the numberof trapped atoms by roughly a factor of two in the steady-state. A remaining issue are theweak interference fringes created by reminiscent reflection from the second, in principleanti-reflection coated, surface of the beam-splitter. They result in fast fluctuations of theMOT fluorescence (less than 5% variation of the absolute amplitude) which did howevernot significantly disturb the normal operation. The detunings of the lasers were optimizedto -16 MHz (2.7 Γ) from the atomic resonance F=2→F∗ and to -8 MHz (1.4 Γ) from theatomic resonance F=1→F∗ respectively.
The loading rates and the numbers of the trapped atoms were routinely monitored withtwo separate photodiodes equipped with line-filters for the fluorescence from lithium andcesium at 672 nm and 852 nm respectively. For the cesium trap, number, density, and tem-perature of the trapped atoms were additionally determined by absorption imaging. De-tails are given in references (Giese, 2006; Gluck, 2008). Typically 4×10⁸ cesium atomsare trapped at a density of 3×109 cm−3 and a temperature of 250(50)µK. For lithiuma calibration of the photodiode to previous measurements and fluorescence images areused (Kraft, 2006), typically around 108 lithium atoms are trapped at a density of 1010
cm−3. The temperature of the lithium atoms was estimated to be on the order of severalhundred µK, a more precise value can be gained from the careful analysis of temperature-broadened photoassociation resonances (see section 5.1).
4.2 Formation of LiCs molecules
The method of photoassociation (PA) for the formation of ultracold molecules hasbeen introduced in section 2.3. Here the experimental realization will be discussed. Thelight for PA is created by a commercial Ti:Sa resonator (Coherent MBR-110), which is

4.2. FORMATION OF LICS MOLECULES 57
pumped by 9 to 12 W from a Coherent Verdi V18. This systems provides typically 1.2 Wdirectly behind the resonator. After the light passes a tunable isolator, a glass plate isused to pick off two weak sample beams. One is used for stabilizing the laser frequencyto an optical transfer cavity: using the Pound-Drever-Hall method (Drever et al., 1983)an error signal is derived which is used to keep the Ti:Sa resonator always in resonancewith a mode of the transfer cavity. The transfer cavity itself is stabilized to a diode laser,which is in turn stabilized via an frequency off-set lock to the cesium master laser. Thissetup makes it possible to stabilize the Ti:Sa resonator to any arbitrary frequency witha remaining variation of less than 1 MHz. Details of the setup are given in reference(Giese, 2006). With the Ti:Sa resonator locked this way, its frequency can also be tunedelectronically with highest precision: by simply varying the frequency of the voltage-controlled oscillator used in the setup for off-set locking the reference laser, it is possibleto control the absolute laser frequency to a level below 1 MHz (see section 7.1). Thefringes of the stabilized transfer cavity are also used for monitoring frequency scans ofthe Ti:Sa resonator with high accuracy. The second sample beam is coupled into a home-built wavemeter, details of the setup can be found in (Deiglmayr, 2006) and referencestherein. The readout software for the wavemeter was extended, so that it can now writethe measured wavelengths to a DataSocket
TMserver (National Instruments) running on
any computer reachable via a network connection. This value is then available to anyother DataSocket-Client, e.g. it is read automatically by the experimental control softwareand then stored together with all other acquired data. The wavemeter is calibrated to anatomic cesium resonance with an accuracy of 10−8. This very high accuracy (on the orderof 30 MHz) can only be achieved if the measurement is averaged over a long time and therefractive index of the air in the laboratory is calculated accurately (Bonsch and Potulski,1998).
The main beam from the Ti:Sa resonator is coupled into a high power optical fiberwhich transfers the light to the experimental chamber. A fast shutter based on a modifiedloudspeaker (Singer et al., 2002) is used to block the beam if necessary. After the fiber,the light is collimated and has a waist of 1.0 mm at the trap location. It is aligned topass through the center of the overlapped cesium and lithium MOT’s by optimizing thedepletion of trapped cesium atoms with resonant light. Typical laser powers of around500 mW are measured behind the chamber.
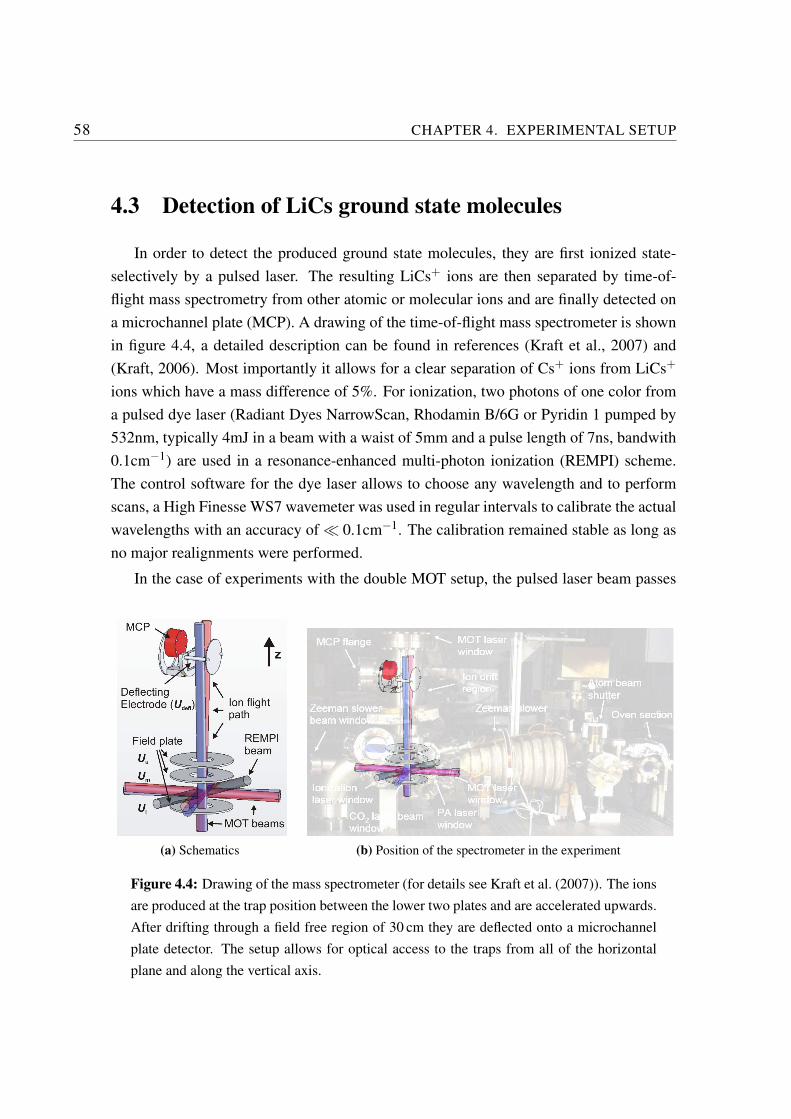
58 CHAPTER 4. EXPERIMENTAL SETUP
4.3 Detection of LiCs ground state molecules
In order to detect the produced ground state molecules, they are first ionized state-selectively by a pulsed laser. The resulting LiCs+ ions are then separated by time-of-flight mass spectrometry from other atomic or molecular ions and are finally detected ona microchannel plate (MCP). A drawing of the time-of-flight mass spectrometer is shownin figure 4.4, a detailed description can be found in references (Kraft et al., 2007) and(Kraft, 2006). Most importantly it allows for a clear separation of Cs+ ions from LiCs+
ions which have a mass difference of 5%. For ionization, two photons of one color froma pulsed dye laser (Radiant Dyes NarrowScan, Rhodamin B/6G or Pyridin 1 pumped by532nm, typically 4mJ in a beam with a waist of 5mm and a pulse length of 7ns, bandwith0.1cm−1) are used in a resonance-enhanced multi-photon ionization (REMPI) scheme.The control software for the dye laser allows to choose any wavelength and to performscans, a High Finesse WS7 wavemeter was used in regular intervals to calibrate the actualwavelengths with an accuracy of ¿ 0.1cm−1. The calibration remained stable as long asno major realignments were performed.
In the case of experiments with the double MOT setup, the pulsed laser beam passes
(a) Schematics (b) Position of the spectrometer in the experiment
Figure 4.4: Drawing of the mass spectrometer (for details see Kraft et al. (2007)). The ionsare produced at the trap position between the lower two plates and are accelerated upwards.After drifting through a field free region of 30 cm they are deflected onto a microchannelplate detector. The setup allows for optical access to the traps from all of the horizontalplane and along the vertical axis.

4.3. DETECTION OF LICS GROUND STATE MOLECULES 59
(a) Only Cs+ (b) Cs+ and LiCs+
Figure 4.5: Time-of-flight traces recorded with and without the formation of LiCsmolecules. Both graphs show overlays of 600 individual time of flight traces (grey) andaveraged signal (black). In figure b) a dashed line marks the window set for detection ofLiCs+.
roughly one beam diameter below the trapped atom clouds to reduce excessive ionizationof cesium and lithium atoms which would saturate the detector. Additionally the numberof cesium ions is reduced by blocking the repumping light with a rotating chopper wheel.The cooling laser together with the depumper used in the forced dark-spot setup thenquickly pumps all trapped cesium atoms into the lower hyperfine state F=3, so that thetrapping laser is now off-resonant and the atoms remain in the electronic ground state fromwhich only three photon ionization is possible. In contrast to two-photon ionization fromthe excited 6P3/2 state, this process is strongly suppressed and therefore the possible effecton the detected LiCs+ signal is minimized. Using a photodiode and some home-builtelectronics, the ionization laser is synchronized with a delay of 600 µs to the beam beingblocked by the chopper wheel. After the ionization pulse, the chopper wheel unblocksthe repumper beam within 300µs and nearly all cesium atoms are recaptured in the MOT.Using a chopper wheel instead of mechanical shutters (Lange, 2007) made it possibleto increase the repetition rate of the experiment from 10 to 20 Hz, while concurrentlymaintaining a larger number of Cs atoms in the shuttered trap. In order to further suppressa background from fast Cs+ ions arriving at the time of the expected LiCs signal, modifiedvoltages are applied to the field plates. Large absolute values of the voltages lead to animproved energy focusing; changing the ratio of the field plate voltages UL/UM shiftsthe arrival of the fast ions to earlier times at the cost of none-optimal time focusing. Forall experiments with the double MOT setup, voltages of UL=800 V for the lower and

60 CHAPTER 4. EXPERIMENTAL SETUP
UM=610 V for the middle field-plate were used. Figure 4.5 shows the time-of-flight tracefor these settings. The ions arriving in the gated window are then detected in a single-ioncounting setup (Lange, 2007). As the employed counter is not fast enough to reliablydetect more than one ion in a window of a few 100 ns, care was always taken to keep therate of ions below one ion per shot. This made it necessary to average over many cycles,typically 50-100, which corresponds to a measurement time of 2.5-5.0 s per data point.
4.4 High resolution spectroscopy of LiCs ground statemolecules
An additional broadly tunable but narrow-band cw dye laser (Radiant Dyes) was in-stalled and put into operation during this thesis. This narrow band laser was used toperform high-resolution spectroscopy of deeply bound ground state molecules. For theseexperiments, Rhodamin 6G in Ethylen-Glycol was pumped with typically 7 W at 532 nmfrom a Coherent Verdi V18 system. At the gain maximum of the dye and nozzle pressuresof 6 bar, up to 500 mW of optical power were measured behind the optical diode (LinosFI-500/820-5 SV). The bandwidth on the order of a few MHz is more than sufficient toresolve rotational transitions. The light from the laser is brought to the experiment by afiber, after which it is collimated (the waist at the trap position is 0.7 mm). It is alignedcollinear with the PA laser by maximizing the depletion of the ion signal on resonance.The frequency of this laser is measured with a wavemeter (Burleigh WA-1000, relativestability 500 MHz) and scans are monitored additionally with a reference cavity (freespectral range 750 MHz), which is actively stabilized to an atomic cesium resonance viaan offset-locked diode laser. Both the measured wavelength and the transmission sig-nal from the reference cavity are read out by the experimental control software via serialport and AD-converter respectively and are recorded together will all other relevant ex-perimental data. Details of the optical and electronic setup can be found in (Mortlbauer,2008) and references therein, schematics of the optical setup are discussed in appendix C.For some experiments (see e.g. section 7.1) additionally the intensity of the cw dye laserlight at the experiment is stabilized: an electro-optical modulator (EOM) combined witha polarizer in front of the fiber to the experiment is used to control the intensity. Afterthe fiber, a beam sampler reflects a portion of the beam onto a photodiode (PD). The PDprovides the feedback signal in a PI-control loop.

4.4. HIGH RESOLUTION SPECTROSCOPY OF LICS GROUND STATE MOLECULES 61
All frequency scans are controlled externally via the analog scan input of the lasercontroller. An input signal from -5.0 V to 5.0 V controls the position of the laser fre-quency within a manually set scan range. For coarse scans (typically over 10 GHz), thissignal was generated by the experimental scan control software using an analog outputchannel of the National Instruments card USB-6009. For very fine scans, the laser waslocked to a transfer cavity (see figures C.1 and C.2) and the frequency was scanned overa range of up to 450 MHz using an additional acousto-optical modulator (AOM) as fre-quency shifter in the lock branch. Changes in the laser frequency can then be controlledabsolutely with an accuracy below 1 MHz by measuring the frequency of the rf signalwith a standard frequency counter. This guarantees an excellent reproducibility of thescans and a very precise determination of relative frequencies as required, for example,for the determination of line shifts (see section 7.1).

62 CHAPTER 4. EXPERIMENTAL SETUP

Chapter 5
Photoassociation spectroscopy in LiCs
This chapter presents the formation of ultracold molecules using photoassociation(PA). In order to find the frequency of PA resonances, it is very helpful to have spec-troscopic information on the excited states. For LiCs this is especially true, as the compa-rably small reduced mass of the dimer leads to a large vibrational spacing and thereforethe density of resonances per frequency interval is significant smaller than in other sys-tems. Until now only four electronic states of LiCs were examined experimentally withhigh resolution, namely the two lowest states X1Σ+ and a3Σ+ (Staanum et al., 2007),and the two excited singlet states B1Π and D1Π (Stein et al., 2008). These potentialcurves have been derived from transitions observed in laser-induced fluorescence (LIF)from molecules formed in a heat-pipe. Some information about excited triplet states isavailable from the spectroscopy of LiCs molecules formed in helium nano-droplets (Mu-drich et al., 2004a), where mostly vibrational levels in the d3Π state were identified. Anoverview over selected potential energy curves of LiCs is shown in figure 5.1 (the sub-figures have already been introduced in section 2.3).
The excited singlet states are of most interest for the formation of molecules in theelectronic ground state X1Σ+. For the D1Π state, Stein et al. (2008) report strong per-turbations of the rovibrational levels due to spin-orbit coupling to nearby triplet states.These perturbations reduce the probability for decay into the lowest singlet state and alsoreduce the accuracy of an extrapolation from the highly excited rotational levels observedin a heat-pipe experiment to the lowest rotational levels addressable by PA. However suchperturbations leading to levels with mixed singlet and triplet character might be of greatinterest for future experiments: levels with a strong singlet-triplet mixing are possible
63

64 CHAPTER 5. PHOTOASSOCIATION SPECTROSCOPY IN LICS
4 6 8 10 12R @ÞD
-5000
0
5000
10000
15000
En
erg
y@c
m-
1 D
X1S+
A1S+
C1S+
a3S+
c3S+
e3S+
b3P
d3P
B1P
D1P
LiH2sL+CsH6sL
LiH2sL+CsH6pL
LiH2sL+CsH5dL
10250 10500 10750 11000 11250 11500 11750
PA wavelength @cm-1D
0.2
0.4
0.6
0.8
Ion
Sig
nal@a
rb.u
.D
v’=0 v’=4 v’=10 v’=26
aL bL
2 4 6 8 10 12
4000
6000
8000
10000
12000
14000
R [Å]
E [c
m-1] 2(0-) 2(0+)
2(1)
3(0+)
3(1)
3(0-)
4(1)
b)
Figure 5.1: a) Potential energy curves for Σ+ and Π states of LiCs correlating to thethree lowest asymptotes. The relevant states B1Π and X1Σ+ are marked bold. b) Statesin Hund’s case c) correlated to the first two excited asymptotes Li(2S1/2)+Cs(6P1/2) andLi(2S1/2)+Cs(6P3/2) (adapted from Lange (2007)). The B1Π state is correlated at shortinternuclear distances to the 4(1) state.
candidates for the transfer of weakly bound, magneto-associated molecules into the abso-lute ground state (Danzl et al., 2008; Ni et al., 2008; Stwalley, 2004). The states favorablefor magneto-association of molecules are typically dominated by triplet character, whilethe absolute ground state of the system is the lowest rovibrational level of the singletX1Σ+ state (neglecting hyperfine interactions). For a significant transfer efficiency fromthe triplet-dominated Feshbach molecules to absolute ground state molecules one there-fore requires an intermediate state coupling the singlet and triplet systems. In LiCs, levelsin the D1Π state could provide such a coupling. In contrast to the D1Π state, no signifi-cant perturbations of the levels of the B1Π state were reported in reference (Stein et al.,2008), allowing for an extrapolation of level energies to low rotational states with highprecision and favoring the spontaneous decay into the X1Σ+ ground state. The availablespectroscopic information for the B1Π state covers a large energy range from the bottomof the potential up to the vibration level v′ = 25, about 350 cm−1 below the dissociationasymptote Li(2s)+Cs(6p). The experimental uncertainty of the levels energies is on theorder of 0.01 cm−1 = 300 MHz. However there is an additional uncertainty on the dissoci-

65
ation energy of the molecular ground state of up to 1 cm−1 and therefore a correspondinguncertainty in the PA wavelength which refers to the atomic asymptote. Once however afew levels have been observed and assigned, this dissociation energy can be known withhigh accuracy and all other levels should be found easily.
For the assignment of observed PA resonances, ab initio calculated potential curveswere used. With the up-to-date methods presented in part I, the typical uncertainty ofthe calculated potentials is on the order of 100 cm−1, which is still too large to guidean initial experimental search. However the vibrational spacings, related to the shape ofthe potentials, are determined much more precisely. Therefore, ab initio potential curvesprovide a good estimate of the typical number of expected PA resonances in a given energyrange, with an uncertainty for hitting one of them on the order of the vibrational spacing.Once a vibrational progression is observed, they help to identify the character of the PAresonances and the prediction of further vibrational levels.
Close to atomic asymptotes the density of vibrational levels is high and continuousscans for PA resonances are feasible. Figure 5.2 shows an (almost) continuous scan from9 GHz below the asymptote down to a detuning of 11 cm−1 = 330 GHz. Typical scanspeeds are around 0.2 GHz/min, acquiring the full spectrum took around 30 hours. Thetemporary assignment of PA resonances shown in figure 5.2 is based on the shape of theresonances and vibrational spacings calculated from ab initio potentials. The ionizationlaser was always kept at 14693.7cm−1. Thus the relative strengths of resonances fromdifferent states cannot be directly related to the cross section for PA into different molec-ular states, but one would have to consider the whole process of PA, spontaneous decayand REMPI ionization. Nevertheless is is clear from this spectrum that the lines identi-fied as belonging to the Ω=1 (B1Π) state yield the strongest signal. This could be dueboth to a higher decay rate into bound ground state molecules or to an increased detectionefficiency for the produced ground state molecules (i.e. an advantageous ionization mech-anism). The levels identified as belonging to the Ω=1 (b3Π) state yield a lower molecularsignal as expected, because the decay into bound triplet molecules is inhibited by unfa-vorable Franck-Condon factors. Why not more levels belonging to Ω=0+/− states areobserved remains an open question.

66 CHAPTER 5. PHOTOASSOCIATION SPECTROSCOPY IN LICS
11721.5 11722.0 11722.5 11723.0 11723.5 11724.0 11724.50
20406080
100
11725.0 11725.5 11726.0 11726.5 11727.0 11727.5 11728.0 11728.50
20406080
100
11729.0 11729.5 11730.0 11730.5 11731.0 11731.5 11732.00
20406080
100
Cs ghosts Unidentified
=1 (B1
=0(+/-)
=1 (b3
cts.
[arb
.u.]
PA laser wavenumber [cm-1]
Figure 5.2: PA scan close to the atomic asymptote Li(22S1/2)+Cs(62P3/2). The black arrowin the lowest panel marks the transition frequency from Cs(62S1/2,F=4)→Cs(62P3/2,F∗),9,1 GHz below the molecular asymptote (the PA starts from Li(22S1/2)+Cs(62S1/2,F=3)).The different colors indicate a temporary assignment of PA resonances. The lines markedas ”Cs ghosts” arise from the PA of Cs2 molecules, which are then dissociated duringionization, leading to a strong signal from Cs+ ions ’spilling’ into the time-of-flight windowfor the detection of LiCs+ ions. The molecules are ionized by two photons at 14693.7cm−1.
5.1 Temperature determination by photoassociation spec-troscopy
In figure 5.3 an individual resonance in a scan of the PA laser is shown. As thePA laser becomes resonant with a transition from a colliding atom pair to an excitedmolecular level, the number of detected LiCs+ ions increases, indicating the formationof ground state molecules. The ion signal has to arise from ground state molecules andnot from excited molecules, as the PA and ionization laser are spatially separated and the

5.1. TEMPERATURE DETERMINATION BY PHOTOASSOCIATION SPECTROSCOPY 67
-100 -50 0 50 100PA frequency detuning @MHzD
0
0.5
1
1.5
2
2.5io
ns
pu
lse
Figure 5.3: Temperature-broadened PA resonance (dots) together with an plot of equation(5.1) (solid line). Best agreements was achieved for Trel=580(80)µK and Γ=10(3)MHz.The thin dashed lines illustrate the contribution to the PA line shape from atom pairswith discrete collisions energies. The frequency axis shows detuning from the setpointof 11632.11cm−1. The molecules are ionized by two photons at 14693.7cm−1.
molecules do not move significantly over the lifetime of the excited level.
The resonance of figure 5.3 does not show further substructure, i.e. no molecular hy-perfine structure, indicating zero electronic angular momentum and therefore an Ω=0+/−
character. As only a single rotational component was observed for this line, no furtherassignment is possible. Nevertheless an accurate analysis of the PA line shape can yieldimportant information about the atomic scattering state. More specifically, the asymmet-ric broadening of the line towards red detunings indicates the influence of the collisionenergy on the PA line shape and can therefore be used as a measure for the relative tem-perature of the two species. As discussed by Jones et al. (1999), an accurate model ofPA lines shapes can be derived from Wigner’s law. It states that for low collision ener-gies ε the amplitude of the scattering wavefunction with angular momentum ` scales asε(`+1/2)/2. With the probability to have a collision with energy ε given by the Boltzmann

68 CHAPTER 5. PHOTOASSOCIATION SPECTROSCOPY IN LICS
factor e−ε/T , the shape of a PA resonance is then described by
Wl( f , f0) = B∫ ∞
0e−ε/Tε(`+1/2)LΓ( f , f0 −ε)dε, (5.1)
where LΓ( f , f0) is the discrete energy Lorentzian with natural linewidth γ and centralfrequency f0. Figure 5.3 shows the temperature broadened PA resonance together withthe model from equation (5.1) taking only s-wave scattering (`=0) into account. Optimaladjustment of the parameters yields realistic values for T=580(80) µK and Γ=10(3) MHz.Adding higher partial waves did not improve the fit.
Jones et al. also derive a limit on the collision energy ε, for which Wigner’s law holds:
hεkB
¿ Ecol
kB
2(0.6−A0/R0)2
where
R0 =
(2µC6
h2
)1/4
and E0 =h
2µR20.
For 7Li133Cs the reduced mass µ and the C6 dispersion coefficient (Marinescu et al., 1994)are well known. However there are only two experimental values for the scattering lengthA0, namely A0,singlet=50(20)a0 from high-resolution spectroscopy of the singlet groundstate potential (Staanum et al., 2007) and A0,eff=180(40)a0 from the thermalization of 7Liand 133Cs atoms in an optical dipole trap (Mudrich et al., 2002). While the first valueyields an upper limit of roughly 0.8K, well above the temperature in our experiment, thelatter one yields 1.7mK, closer to the fitted temperature. As a second condition the long-range wavefunction of the ground state has to be linear near the outer turning point ofthe PA level. The PA for the fitted resonance was performed at a detuning of more than100 cm−1 from the asymptote where the excited potential energy curves are already quitesteep. Therefore the vibrational wavefunction is very localized at the outer turning pointand this second condition should be well fulfilled. If the relevant scattering length for ourexperiment lies between A0,singlet and A0,eff, the derived collision energy of T=580(80)µKshould be a realistic estimate for the experimental conditions.
This relatively high temperature has to be seen in relation to the centrifugal barrier E`for collisions with higher angular momentum `:
E` =(
h2`(`+1)3µ(2C6)1/3
)3/2
. (5.2)

5.2. SPECTROSCOPY OF THE B1Π STATE OF LICS 69
For p-wave scattering this yields E`=1=1.6mK (barrier peaked at 103a0), for d-wave scat-tering E`=2=8.5mK (barrier peaked at 78a0), and for f -wave scattering E`=3=24.7mK(barrier peaked at 66a0). The measured collision temperature is well below the p-wavelimit, so that one can expect to observe dominantly s-wave scattering. Assuming a Boltz-mann distribution of kinetic energies, in roughly 6% of the collisions the energy lies abovethe p-wave barrier, so that one can expect a small contribution from `=1 but none fromhigher partial waves.
Using the above measured value of the collision temperature, one can draw furtherconclusions about the temperature of the lithium atoms and give an estimate on the tem-perature of the formed molecules. A simple approximation assumes an average collisionangle between lithium and cesium atoms of 90. The relative kinetic energy is then givenby
Erel =12
mLimCs
mLi +mCs(v2
Li + v2Cs) (5.3)
and therefore the collisional temperature
Trel =mCsTLi +mLiTCs
mLi +mCs(5.4)
is dominated by the lighter lithium. Solving this equation for TLi with TCs=250µK andTrel=580µK yields TLi=600µK, which seems reasonable. For the center of mass motionof the formed molecules one finds
Ec.m. =12(mLi +mCs)(
mLi~vLi +mCs~vCs
mLi +mCs)2. (5.5)
Therefore the molecular temperature
Tc.m. =mLiTLi +mCsTCs
mLi +mCs(5.6)
is dominated by the heavier cesium. The above determined temperatures TLi and TCs
result in a molecular temperature of 270(60)µK.
5.2 Spectroscopy of the B1Π state of LiCs
The following discussion will focus on the PA spectroscopy of the B1Π state. For largeinternuclear separations, the spin-orbit interaction couples this state to neighboring tripletstates. Asymptotically it then correlates to the atomic asymptote Li(22S1/2)+Cs(62P3/2).

70 CHAPTER 5. PHOTOASSOCIATION SPECTROSCOPY IN LICS
For convenience it will always be referred to as the B1Π state. Possible PA wavelengthswere calculated from the potential curves published in references (Staanum et al., 2007)and (Stein et al., 2008) and extensive spectroscopy was performed around these levelspositions, until a reliable assignment of PA resonances was achieved. This made it pos-sible to improve the value of the ground state dissociation energy and to predict linepositions with higher accuracy (see section 5). Additionally to the vibrational levelsv′ = 0− 25 identified in reference (Stein et al., 2008), vibrational levels v′ = 26− 35were found, where the last level v′ = 35 is bound by less than 1 cm−1. It was sug-gested in (Stein et al., 2008) that higher-lying vibrational levels (above v′=25) could bestrongly broadened by predissociation in the region between the fine structure asymptotesLi(22S1/2)+Cs(62P3/2) and Li(22S1/2)+Cs(62P1/2). In the PA spectra recorded in the herepresented experiments no such broadening was observed. Note that an initial assignmentof observed resonances in (Lange, 2007) had to be revised: the resonance originally iden-tified as B1Π,v′=25,J′=1 has been now identified as B1Π,v′=25,J′=2, the resonance origi-nally identified as B1Π,v′=25,J′=2 is an unidentified Ω=0+/− level (shown in figure 5.3).Also the resonance labeled B1Π,v′=26,J′=2 had to be reassigned to B1Π,v′=26,J′=3. Anoverview over all observed resonances is given in figure 5.4.
The observed PA resonances in the B1Π state show a rich substructure due to molec-ular hyperfine interactions as expected for a state with electronic angular momentum. Noline-broadening due to electric or magnetic stray fields is expect, as the electric extrac-tion fields for the detection are switched on only 500µs before the dye laser pulse, whichionizes all molecules that have been produced within the last 20ms. Therefore the PA isperformed mainly under electric-field-free conditions. Also magnetic fields should notinfluence the measured PA spectra. The magnetic field gradient for trapping the atoms isapplied constantly, but residual fields in the trap center (where the gradient field reacheszero) have been compensated to below a few Gauss.
The resolution of the experiment allows the hyperfine structure for most of the mea-sured rovibrational levels to be distinguished, however it is not completely resolved for allof them. The first example of a PA resonance, v′=18, J′=1, is presented in the Fig. 5.5(a).The energy refers to the hyperfine asymptote Li(2S2S1/2, F=2)+Cs(6S2S1/2, F=3). Theoverall triplet structure in the spectrum resembles the coupling of the nuclear spin iCs=7/2of Cs with the rotational angular momentum J′=1, yielding the intermediate quantumnumbers f= 5/2, 7/2 and 9/2, which couple further to the unresolved hyperfine interac-tion with the nuclear spin of Li iLi=3/2. For this main hyperfine energy one expects the

5.2. SPECTROSCOPY OF THE B1Π STATE OF LICS 71
Ν'=0 Ν'=5 Ν'=10 Ν'=15 Ν'=20 Ν'=25
10 500 11 000 11 5000.0
0.2
0.4
0.6
0.8
PA wavelength @cm-1D
Ion
Sig
nal@a
rb.u
.D
Figure 5.4: Overview over all observed PA resonances in the B1Π state. Molecules aredetected under different conditions, for details see section 6.2
contribution (Townes and Schawlow, 1955)
Whfs =aΩ
J′(J′+1)f ( f +1)− J′(J′+1)− i(i+1)
2(5.7)
where a is the effective hyperfine coupling constant for the B state and Ω the projectionof the electronic angular momentum on the molecular axis. This structure appears for allv≤ 21 while for higher values the components begin to split further, which is probably dueto significant mixing of triplet character. Another check of the applicability of equation(5.7) is to compare its prediction with observations on J′=2. In figure 5.5(b) v′=8,J′=2 ischosen as an example, the overall splitting is reduced as expected from the factor J′(J′+1)in the denominator of eq.(5.7) and the number of components is increased, where thetwo components f=3/2 and 5/2 are not resolved. Similarly to J′=1 this structure appearsfor low vibrational levels and develops to a complex structure by unresolved additionalhyperfine structure from the nuclear spin of 7Li.
Combining all observed PA resonances with the data from reference (Stein et al.,2008), it was possible to construct a potential energy curve which reproduces all observed

72 CHAPTER 5. PHOTOASSOCIATION SPECTROSCOPY IN LICS
11399,61 11399,62 11399,63
0,0
0,1
0,2
0,3
0,4
0,5
0,6
ions
/ pu
lse
E [cm-1]
(a) B1Π: v′=18, J′=1
10869.195 10869.200 10869.205-0.05
0.00
0.05
0.10
0.15
0.20
0.25
0.30
0.35
0.40
ions
/ pu
lse
E [cm-1]
(b) B1Π: v′=8, J′=2
Figure 5.5: Examples of PA resonances together with their estimated center of gravitymarked with dashed (red) lines
transitions with a standard deviation of 0.0065 cm−1 over the whole range of the poten-tial (Grochola et al., 2009). A full description of the potential is given in appendix A.With the same data set, the dissociation energy De of the X1Σ+ could be determined as5875.542 cm−1. It is in a very good agreement with the previous spectroscopic value of5875.455(100) cm−1 (Staanum et al., 2007). The uncertainty can be estimated from thestandard deviation of the De values determined from different PA measurements. Thisuncertainty includes the experimental error in the frequency determination of the PA linesand also the uncertainty in the extrapolation towards the low J′ levels from the poten-tial. The standard deviation of the 31 De values is 0.005 cm−1. The calibration error of0.001 cm−1 for the employed wavemeter does not play a significant role compared to theincomplete analysis of the observed hyperfine structure. For the overall estimate of theuncertainty of De however, one should take also into account the uncertainty in the formof the bottom of the ground state potential, which was taken as a reference. Therefore, itis better to give the value of the dissociation energy of the ground state with respect to thelowest rovibrational levels (v′′=0, J′′=0), D0 = 5783.495(5) cm−1.
The fact that the whole set of experimental energy levels for the excited state B1Πcan be described with a single channel approach shows clearly that local perturbationsaround any rovibrational level do not play a role. The large variation of the q-factorfor the Λ-doubling given in (Stein et al., 2008) however indicates already that non-local

5.2. SPECTROSCOPY OF THE B1Π STATE OF LICS 73
perturbations from the neighboring states are likely. They are expected especially close tothe B state asymptote, where the separation between different potential curves becomesvery small and the observed hyperfine structure indicates recoupling.
These non-local perturbation become evident also in the observed rotational structure:for low lying levels v′<25, rotational components J′=1 and 2 were observed, for levelsv′≥25 a weaker J′=3 component and for the last bound levels rotational components upto J′=5 were visible. Additionally it was observed that, while for the higher lying state theJ′=1 component is the stronger one, for levels below v′=16, the J′=2 component is clearlydominant. As discussed previously (section 5.1), the collision energy was measured tobe below the barrier for p-wave collisions between Li and Cs and therefore the observedspectra should be dominated by PA from scattering states with zero angular momentum.However in Hund’s case (a), J′=L′ · S ′ ≥2 cannot be reached from atomic states with`=0. Furthermore, the Condon-points even of the highest vibrational levels lie well withinthe centrifugal barrier for higher angular momenta in the scattering continuum. Closeto the asymptote (v′≥26) the observation of higher J′ components can be attributed tothe recoupling of all angular momenta as the molecules become less tightly bound. Forthe lower vibrational levels on the other hand, Hund’s case (a) should be a very goodapproximation. This indicates that a single-channel treatment for both the continuumand the excited state can not completely describe the observed PA spectra. This will bediscussed in more detail in section 6.2.

74 CHAPTER 5. PHOTOASSOCIATION SPECTROSCOPY IN LICS

Chapter 6
Ultracold LiCs in the rovibrationalground state
This chapter will discuss in detail the mechanism of detecting ground state molecules.It is important to keep in mind that in all experiments presented in this thesis only moleculesin the two lowest states X1Σ+ and a3Σ+ were detected. The detection of PA resonancestherefore always strongly depends on the spontaneous decay of the formed moleculesinto ground state levels, which are then detected by photoionization. This aspect will beilluminated in the following: after a qualitative discussion of ionization spectra for differ-ent distributions of populated ground state levels, a quantitative analysis of measured ionrates will yield absolute molecule formation rates and PA cross sections. This quantitativeunderstanding of the state-selective detection method reveals the direct formation of polarmolecules in the lowest vibrational level after a single PA step. High-resolution depletionspectroscopy of the electronic ground state molecules is used to confirm the populationof the absolute ground state level X1Σ+,v′′=0,J′′=0 and higher rotational level, absoluteformation rates are given.
6.1 Determination of the vibrational population-distribution
LiCs molecules in the lowest electronic states X1Σ+ and a3Σ+ can be ionized at thefirst ion threshold Li(2 2S1/2)+Cs+(1S0) by two photons with roughly 15700 to 18640 cm−1
energy each, depending on the binding energy of the molecules. This corresponds to arange of wavelengths from 637 nm to 536 nm, which is easily accessible with dye lasers.
75

76 CHAPTER 6. ULTRACOLD LICS IN THE ROVIBRATIONAL GROUND STATE
The ionization probability can be significantly enhanced if the first photon is in resonancewith an intermediate level, this scheme is called resonance-enhanced multi-photon ion-ization (REMPI). It is a somewhat lucky coincidence that for the two-photon ionization ofthe lowest vibrational levels in the X1Σ+ state one can use intermediate levels in the B1Πstate. As both states are spectroscopically very well known (see section 5), it is in princi-ple possible to predict precisely the position of ionization resonances and to quantitativelymodel the experimental ionization spectra.
Figure 6.1 shows three scans of the REMPI laser over the same frequency range.The strong differences between the different spectra stem from the fact that the detectedmolecules were produced via PA in different excited levels: B1Π,v′=4, 10, and 26. Asalready discussed in section 2.4, the distribution of populated levels after spontaneous de-cay depends on the Franck-Condon overlap between the excited vibrational level and theground state levels. Thus the relative strength of ionization resonances between the differ-ent scans depends on the relative population strength of the vibrational level from whichthe produced ions originate. When comparing the positions of observed resonances withthe calculated transition frequencies between X1Σ+ and B1Π one realizes that the as-signment of resonances to ground state levels is often ambiguous and that a number ofunpredicted resonances indicate the importance of intermediate states other than B1Π.Nevertheless quite a few clear progressions are visible: in figure 6.1 a), resonances fromX1Σ+,v′′=0 to B1Π,v′=13-17 and X1Σ+,v′′=2 to B1Π,v′=17-21 can be identified; in fig-ure 6.1 b), in addition to the resonances originating from v′′ = 2, resonances from v′′=1 tov′=14-21 are visible; and in figure 6.1 c), in addition to molecules in v′′=1 and v′′=2, alsomolecules in v′′=3 are ionized through v′=22-29.
The ionization probabilities for different intermediate B1Π levels are hard to estimate.This complicates an analysis of the relative populations of vibrational ground state levelsfrom the observed ionization spectra. However, one can establish at least a qualitativeagreement with the predictions of section 2.4. In figure 6.2, the average peak value foreach of the above identified transition band originating from ground state levels v′′=0-3is shown. While the unknown ionization probabilities of intermediate levels impede thedirect extraction of the level population from the measured spectra, it is still possible todeduce the population strength of a single level after PA via different excited levels andcompare it with our prediction. As can be seen in figure 6.2, the relative ordering ofthe line strengths for each level v′′ is described correctly by the theory, while the relativeratios show deviations. This is very likely due to saturation of the photoionization and a

6.1. DETERMINATION OF THE VIBRATIONAL POPULATION-DISTRIBUTION 77
1680
016
850
1690
016
950
1700
017
050
1710
017
150
0
1.0
2.0
3.0
4.0
5.0
LiCs+
ionsRempipulse
v"=
0v"=
1v"=
2v"=
3
1314
1516
17
1718
1920
2114
1516
1718
1920
21
2223
2425
2627
2829
1680
016
850
1690
016
950
1700
017
050
1710
017
150
0
0.2
0.4
0.6
0.81
LiCs+
ionsRempipulse
v"=
0v"=
1v"=
2v"=
3
1314
1516
17
1718
1920
2114
1516
1718
1920
21
2223
2425
2627
2829
1680
016
850
1690
016
950
1700
017
050
1710
017
150
0
0.1
0.2
0.3
0.4
0.5
0.6
0.7
LiCs+
ionsRempipulse
v"=
0v"=
1v"=
2v"=
3
1314
1516
17
1718
1920
2114
1516
1718
1920
21
2223
2425
2627
2829
aL bL cL
Figu
re6.
1:R
eson
antly
-enh
ance
dtw
o-ph
oton
ioni
zatio
nsp
ectr
aof
grou
ndst
ate
mol
ecul
esaf
ter
phot
oass
ocia
tion
via
a)B
1 Π,v′ =
4,J′
=2,
b)v′
=10,
J′=2
,an
dc)
v′=2
6,J′
=2ov
erth
esa
me
rang
eof
ioni
zatio
nen
ergi
es.
Inth
eup
per
part
ofth
egr
aphs
,tr
ansi
tions
from
alll
evel
sv′′ i
nX
1 Σ+to
assi
gned
inte
rmed
iate
leve
lsv′
inB
1 Πar
em
arke
d(n
ote
that
this
can
noty
ield
afu
llas
sign
men
toft
heob
serv
edlin
es,a
sot
heri
nter
med
iate
stat
esar
ene
glec
ted)
.

78 CHAPTER 6. ULTRACOLD LICS IN THE ROVIBRATIONAL GROUND STATE
non-optimal signal-to-noise level.The identification of the observed ionization resonances also yields information about
the lowest state of the ion LiCs+, the X2Σ+ state. The energy of two photons fromX1Σ+,v′′=0 (via intermediate level B1Π,v′=13) leads to ionization at a detuning of -3385cm−1 from the Li(2 2S1/2)+Cs+(1S0) threshold at 31406.71cm−1 (Moore, 1958).Therefore the X2Σ+ state of the ion has a depth of at least 3385cm−1, favoring the predic-tions of Szentpaly et al. (1982, De=3468cm−1), Korek et al. (2006, De=3578cm−1), andAzizi et al. (2007, De=3564cm−1) over calculations of Patil and Tang (2000, De=2662cm−1)and Bellomonte et al. (1974, De=2984cm−1).
0 1 2 3v" in X1
S+
0
0.1
0.2
0.3
0.4
0.5
0.6
0.7
0.8
aver
age
line
stre
ngth
0 1 2 3v" in X1
S+
0
0.1
0.2
0.3
0.4
0.5
0.6
0.7
0.8
calc
ulat
edpo
pula
tion
v’=4v’=10v’=26
Figure 6.2: Comparison of detected ground state levels for different photoassociation res-onances with predictions. Left panel: averaged peak value for the transition bands originat-ing in X1Σ+,v′=0-3 as discussed in the text (normalized to unity for every PA resonance);Right panel: calculated ground state population, normalized to the summed population inlevels v′=0-3 (see Sect. 2.4).

6.2. DETERMINATION OF ABSOLUTE RATES 79
6.2 Determination of absolute rates
The following section will present a more quantitative analysis of the combined PAand detection process. In order to reduce the influence of the varying hyperfine structure,the spectrum for the PA resonance of each ro-vibrational level is background-subtractedand integrated, therefore summing up the contributions from all hyperfine components.In order to directly compare the line strength of PA resonances measured under differentexperimental conditions, the integrated peak area is normalized to the intensity of boththe PA laser and the ionization laser. At a strong line it was confirmed for both the PAand the REMPI step that the molecule formation rate is indeed linear in both intensities.For the two-photon ionization, this indicates that the first resonance-enhanced transitionis strongly saturated and therefore the probability for this transition does not depend onthe intensity of the ionization laser above a certain, not determined threshold. The PAlaser intensities were chosen for each resonance in such a way that the maximum countrate does not exceed 0.5 ions/pulse to avoid saturation of the single ion detection. Thestrengths of the PA resonances are shown in figure 6.3 for all observed v′, J′=1 and J′=2levels. The last bound level v′=35 was excluded from the analysis, as the cesium MOT isstrongly perturbed by the PA laser at small detunings from the atomic asymptote. The PAstrength decreases towards lower vibrational states, which are excited at shorter internu-clear distance corresponding to lower pair density. Below v′ =25 a change occurs towardsa distinct oscillatory pattern in the rates. While some vibrational levels show rates varyingby no more than one order of magnitude, adjacent levels are below the detection thresh-old of the experiment. For very deeply bound levels v′≤6 the PA rate appears to increaseagain.
In order to derive absolute molecule formation rate, one needs to make assumptionsabout the detection efficiency for photoassociated molecules. As discussed already above,the detection efficiency depends both on the distribution of populated ground state levelsafter spontaneous decay and the wavelength of the REMPI laser. However in all per-formed REMPI scans (see e.g. figure 6.1) the modulation of the REMPI signal neverexceeded a factor of ten. This is in contrast to a much higher signal modulation observedin scans of the PA laser, thus it is not a limit of the ion detection itself. So it seems that thetypically employed intensities of the ionization laser always lead to strong off-resonantionization of several different ground state levels, which reduces the dependency on boththe exact frequency of the REMPI laser and the population of ground state levels. Al-
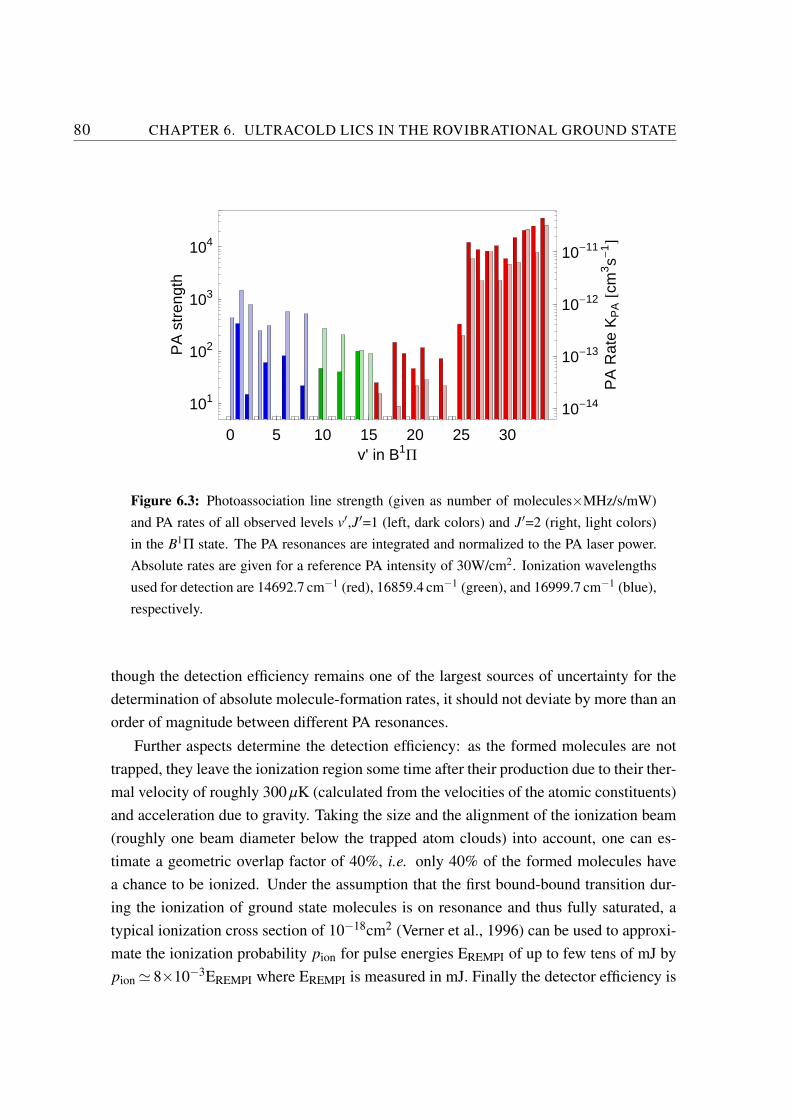
80 CHAPTER 6. ULTRACOLD LICS IN THE ROVIBRATIONAL GROUND STATE
0 5 10 15 20 25 30v' in B1
P
101
102
103
104
PA
stre
ngth
10-14
10-13
10-12
10-11
PA
Rat
eK
PA@c
m3s-
1D
Figure 6.3: Photoassociation line strength (given as number of molecules×MHz/s/mW)and PA rates of all observed levels v′,J′=1 (left, dark colors) and J′=2 (right, light colors)in the B1Π state. The PA resonances are integrated and normalized to the PA laser power.Absolute rates are given for a reference PA intensity of 30W/cm2. Ionization wavelengthsused for detection are 14692.7 cm−1 (red), 16859.4 cm−1 (green), and 16999.7 cm−1 (blue),respectively.
though the detection efficiency remains one of the largest sources of uncertainty for thedetermination of absolute molecule-formation rates, it should not deviate by more than anorder of magnitude between different PA resonances.
Further aspects determine the detection efficiency: as the formed molecules are nottrapped, they leave the ionization region some time after their production due to their ther-mal velocity of roughly 300 µK (calculated from the velocities of the atomic constituents)and acceleration due to gravity. Taking the size and the alignment of the ionization beam(roughly one beam diameter below the trapped atom clouds) into account, one can es-timate a geometric overlap factor of 40%, i.e. only 40% of the formed molecules havea chance to be ionized. Under the assumption that the first bound-bound transition dur-ing the ionization of ground state molecules is on resonance and thus fully saturated, atypical ionization cross section of 10−18cm2 (Verner et al., 1996) can be used to approxi-mate the ionization probability pion for pulse energies EREMPI of up to few tens of mJ bypion ' 8×10⁻³EREMPI where EREMPI is measured in mJ. Finally the detector efficiency is

6.2. DETERMINATION OF ABSOLUTE RATES 81
around 20% (Fraser, 2002), leading to an overall efficiency of the detection setup on theorder of 10−3 for typical experimental parameters.
The rate constant KPA for the PA process is extracted by first linearly scaling the num-ber of produced molecules per second to a reference PA intensity (chosen to be 30 W/cm2)yielding a molecular formation rate k. In the given experimental geometry the diameterof the PA laser beam and of the lithium MOT are both larger than the size of the cesiumMOT. The rate coefficient KPA is then simply given by KPA = k/nLi/NCs with the peaklithium density nLi and the cesium particle number NCs. The measured rate coefficientsare shown in figure 6.3 (right axis). For the last bound states we observe PA rate con-stants on the order of 4×10⁻¹¹cm3/s. These are of the same order of magnitude as therate constants observed in the PA of Cs2 (Drag et al., 2000b; Wester et al., 2004) andKRb (Mancini et al., 2004a), as was predicted by Azizi et al. (Azizi et al., 2004). Forthe v′=1,J′=1 level at a detuning of more than 1.400 cm−1 a PA rate coefficient on theorder of 4×10⁻¹³cm3/s was determined. This is unexpectedly high, as the single channelscattering calculation performed in section 2.3 predicts a rate constant below 10−19cm3/sdue to the low Franck-Condon overlap between the rapidly oscillating singlet scatteringwave function and the excited state wave function at short internuclear distances.
6.2.1 Comparison with trap loss
In order to asses the reliability of the above determined molecular formation rates,one can compare them with rates derived from the loss of trapped atoms during PA. Onlyfor strong PA resonances close to the asymptote, the formation of excited molecules isalso visible in an increased loss of trapped atoms. For the second to last bound levelv′=34, bound by slightly more than 1 cm−1, one observes a reduction of the fluorescencefrom trapped lithium atoms by roughly 10% when the PA laser is on resonance. Dueto the configuration of the SPOT for cesium, this loss was not visible on the cesiumfluorescence. On the peak of the v′=34,J′=2 resonance, the loss rate was measured as1.0+5.0
−0.8·106 lithium atoms/s with a large errorbar due to the uncertainty on the calibrationof the lithium fluorescence versus the number of trapped atoms. Determining the fractionof excited molecules, which decays into ground state molecules (and not into pairs of freeatoms), requires some theoretical considerations. Close to the asymptote, the spin-orbitcoupling between the B1Π state and the close-by b3Π state is very strong. As discussedin section 2.3, the description of the molecular states has to be changed from Hund’s case

82 CHAPTER 6. ULTRACOLD LICS IN THE ROVIBRATIONAL GROUND STATE
a) to Hund’s case c), where the B1Π state can still be identified as an Ω=1 state withup to 50% projection on the triplet components. The overlap of the triplet componentsof the excited wavefunction with the lowest triplet state a3Σ+ is small, so most of theexcited atoms decay into free pairs of atoms. For the singlet component, the overlapwith the X1Σ+ ground state depends strongly on the position of the last bound level in theground state. Based on an experimentally determined potential (Staanum et al., 2007), thisoverlap can be estimated to be between 10% and 100%. So overall 5%-50% of the excitedmolecules should decay into ground state molecules, which corresponds to 0.5+2.0
−0.4·105 -0.5+2.0
−0.4·106 molecules/s. The number of produced ground state molecules was determinedunder exactly the same experimental conditions from the number of detected LiCs+ ionsas described above, which yields a formation rate of 1·104 molecules/s. Even though themargin of error is arguably large, one still finds acceptable agreement between the twomethods, where the number of produced ground state molecules from the REMPI signalseems to be somewhat underestimated.
6.2.2 Comparison with theory
In figure 6.4 the absolute rate coefficients for PA into B1Π as determined above arecompared to the theoretical calculation from section 2.3. While asymptotically the resultsare in good agreement, below v′ ∼22 theory and experiment start to deviate significantly:the experimentally determined rate coefficients exceed the theoretical ones by more thanfive orders of magnitude. It is therefore obvious that the simple single channel picturedoes not sufficiently describe the experimental observation. In a previous work this en-hancement was attributed to singlet-triplet mixing in the scattering state due to the pres-ence of a Feshbach resonance (Deiglmayr et al., 2009a), however it turned out that anincorrect transformation matrix was used in the calculation, rendering the results of theextended model irrelevant (an erratum containing a corrected and more detailed investi-gation is currently in preparation). Nevertheless the spuriously introduced “echo” of thetriplet wavefunction in the singlet channel at the inner turning point of the a3Σ+ potentialreproduced the experimental rates and especially the observed oscillations in the rate co-efficient to a very high degree. Therefore it remains an open question, wether this model,though erroneous, might have lead to the right physical effect. In fact, if one, completelyarbitrarily, calculates Franck-Condon factors between a scattering wave function in thea3Σ+ state and the levels of the B1Π state, the oscillatory pattern of PA rates for low lev-

6.3. EVIDENCE FOR LICS IN THE ROVIBRATIONAL GROUND STATE 83
els is reproduced accurately. The oscillations are due to the lobe of the scattering wavefunction at the inner turning point of the a3Σ+ potential, which is “scanned” by the wavefunctions of the levels in the B1Π state. In contrast, the largest contribution to the overlapbetween the a3Σ+ scattering wave function and the triplet components of the Ω=1(B1Π)levels comes from larger internuclear distances and varies more smoothly with v′. Thisindicates that the perturbation leading to the observed high PA rates is indeed localized inthe entrance channel.
ñ
ñ
ñ ñ
ññ ñ
ñ
ñ
ñ
ñññññ
ñ
ñ ñ ñ ñ ññ ññ ñ
ð
ðð
ð ðð ð
ð ðð ð
ððð ð ð
ð
ðð
ð
ðð ð
ðð
ð
x
xx x x x
x
x xx
x
0 5 10 15 20 25 30
10-22
10-20
10-18
10-16
10-14
10-12
10-10
v' in B1P
PA
Rat
eK
PA@c
m3s-
1D
Figure 6.4: Comparison of the data from figure 6.3 for J′=1 (open boxes) and J′=2 (closedboxes) with the calculation from section 2.3 (solid line). The arrows indicate the sensitiv-ity of the experiment under the assumption that a signal of 20% of the one observed forneighboring levels could have been detected.
6.3 Evidence for LiCs in the rovibrational ground state
Depletion spectroscopy was employed to further identify the internal quantum statesof the ultracold ground state molecules (Wang et al., 2007): an additional narrow bandlaser optically pumps population out of rovibrational levels of the X1Σ+ ground state
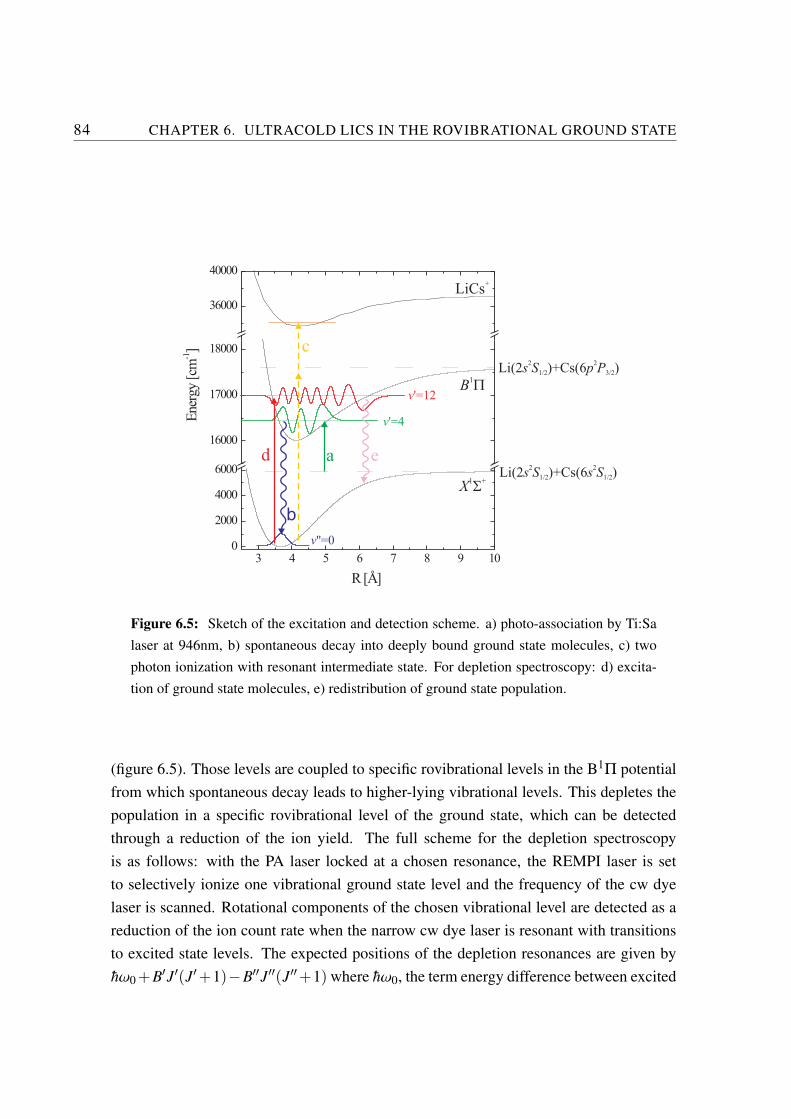
84 CHAPTER 6. ULTRACOLD LICS IN THE ROVIBRATIONAL GROUND STATE
3 4 5 6 7 8 9 10
0
1000
2000
3000
4000
5000
36000
40000
3 4 5 6 7 8 9 100
2000
4000
6000
16000
17000
18000
Ene
rgy
[cm
-1]
R [Å]
ad e
X1 +S
B1P
LiCs+
c
b
Li(2 )+Cs(6 )s S p P2 2
1/2 3/2
Li(2 )+Cs(6 )s S s S2 2
1/2 1/2
v'=4
v'=12
v''=0
Figure 6.5: Sketch of the excitation and detection scheme. a) photo-association by Ti:Salaser at 946nm, b) spontaneous decay into deeply bound ground state molecules, c) twophoton ionization with resonant intermediate state. For depletion spectroscopy: d) excita-tion of ground state molecules, e) redistribution of ground state population.
(figure 6.5). Those levels are coupled to specific rovibrational levels in the B1Π potentialfrom which spontaneous decay leads to higher-lying vibrational levels. This depletes thepopulation in a specific rovibrational level of the ground state, which can be detectedthrough a reduction of the ion yield. The full scheme for the depletion spectroscopyis as follows: with the PA laser locked at a chosen resonance, the REMPI laser is setto selectively ionize one vibrational ground state level and the frequency of the cw dyelaser is scanned. Rotational components of the chosen vibrational level are detected as areduction of the ion count rate when the narrow cw dye laser is resonant with transitionsto excited state levels. The expected positions of the depletion resonances are given byhω0+B′J′(J′+1)−B′′J′′(J′′+1) where hω0, the term energy difference between excited

6.3. EVIDENCE FOR LICS IN THE ROVIBRATIONAL GROUND STATE 85
and ground state vibrational level, and B′ (B′′), the excited state (ground state) rotationalconstant, are calculated from the experimental potential energy curves (see chapter 2).The setup for the additional depletion laser was described in section 4.4.
Depletion scans were performed for X1Σ+,v′′=0 molecules, ionized via the inter-mediate B1Π,v′=14 level at an ionization wavelength of 16999.4 cm−1. In the scan ofFig. 6.6 b), the molecules are produced by PA via B1Π,v′=4,J′=2. One can observe thatexcitation of X1Σ+,v′′=0,J′′=2 to B1Π,v′=12,J′=1-3 reduces the ion count rate down tothe background level. Therefore, the ions at this REMPI resonance originate predomi-nantly in the X1Σ+,v′′=0 level. The depletion resonances are broadened due to strongsaturation of the transition. From the measured spectrum we derive the excited staterotational constant B′′=3.10(5) GHz in excellent agreement with the calculated value of3.096 GHz. In combination with the calculated ground state rotational constant B′′ onefinds hω0=16895.75(2) cm−1 which is also in very good agreement with the expectedvalue of 16895.77 cm−1.
7 8 9 10 11 12 13 14 15 160.00
0.01
0.02
0.03
J'=1 (-)J'=1 (+)
Frequency of depletion laser [cm-1]a)
1-20-12-3
background ions
LiC
s+ ions
/ R
EMPI
pul
se
Frequency of depletion laser - 506,517.346 [GHz]
16895.9 16896.0 16896.1
-30 -25 -20 -15 -10 -5 0 5 10 150.00
0.08
0.16
0.24
0.32
b) Frequency of depletion laser [cm-1]
1-12-32-2
3-42-1
1-2
3-3
background ions
LiC
s+ ions
/ R
EMPI
pul
se
Frequency of depletion laser - 506,517.346 [GHz]
16894.8 16895.2 16895.6 16896.0
Figure 6.6: Depletion laser scan with the PA laser resonant to the B1Π,v′=4,J′=1 level (a)and to the v′=4,J′=2 level (b). Triangles mark calculated wavelengths for transitions fromX1Σ+,v′′=0,J′′ to B1Π,v′=12,J′ (labeled J”-J’). The dotted and dash-dotted grey lines in (a)are fitted spectra (see text for details) assuming PA via the (+) or (-) parity component ofJ’=1 respectively, offset for visibility. The dashed (red) line is a fit combining both parities.The background at large formation rates as in (b) is dominated by LiCs+ ions from off-resonant excitation of other vibrational ground state levels.For small formation rates as in(a), spurious detection of fast Cs+ ions constitutes the main background (Kraft et al., 2007).

86 CHAPTER 6. ULTRACOLD LICS IN THE ROVIBRATIONAL GROUND STATE
It is noteworthy that the spontaneous decay of the B1Π,v′=4,J′=2 level seems to occuronly via the Q-branch (4J=0) leading to the population of only J′′=2 rotational levels, asshown by the rotational assignment in Fig. 6.6 b). This clearly indicates the excitation ofa single parity component of B1Π: for even rotational levels in 1Π, the odd parity com-ponent decays only via the Q-branch into 1Σ+ while the even parity component decaysvia the P- and R-branch. Odd parity levels of 1Π only couple to even partial waves ofthe scattering continuum. As J′=2 can not be excited from continuum states with angularmomentum `=0 via a dipole transition, the excitation can only originate in `=2. Due to thelow temperatures (see section 5.1), this partial wave should be strongly suppressed in Li-Cs collisions. A possible explanation could be the presence of a d-wave shape resonance.Note that e and f parity components of the PA resonances are not spectroscopically re-solved, as the Λ doubling is on the order of 1 MHz (Stein et al., 2008) and thus below thenatural line width.
Fig. 6.6 a) shows a depletion scan for v′′=0 molecules produced via the PA resonanceB1Π,v′=4,J′=1. With hω0 and B′ from the depletion spectrum of Fig. 6.6 b) and the cal-culated value for B′′, the exact positions of the depletion resonances are known. Usingthe widths found for the J′=2 depletion resonances and relative population strengths fromHonl-London-Factors, the spectra for different excited state parities are fitted to the datain Fig. 6.6 a). The only free fit parameters are the level of the undepleted ion signal andthe depletion depth. The precisely known positions of the depletion resonances make asingle excited state parity unlikely and the observed spectrum can be attributed to PA viaboth parity components with equal strength leading to population of X1Σ+,v′′=0,J′′=0,1and 2 states. The strong d-wave contribution to the PA via B1Π,v′=4,J′=2 (see above)couples also to the negative parity component of B1Π,v′=4,J′=1. Decay from this compo-nent populates X1Σ,v′′=0,J′′=0,2 as observed. The additional population of J′′=1 can beexplained by p-wave contributions to the continuum wave function. For molecules in theabsolute ground state X1Σ+,v′′=0,J′′=0, produced by PA via B1Π,v′=4,J′=1, on average5×10−3 LiCs+ ions are detected per ionization pulse. Since the experiment is running at20 Hz this yields a detection rate of 0.1 ions/s. With the detection efficiency derived insection 6.2 this results in a production rate of about 1×10² molecules/s in the v′′=0,J′′=0absolute ground state. For molecules in v′′=0,J′′=2 produced by PA via B1Π,v′=4,J′=2, onaverage 0.2 LiCs+ ions per ionization pulse are detected. This results in a production rateof about 5×10³ molecules/s in the ground state level v′′=0, comparable to the rate givenin Ref. (Sage et al., 2005) for RbCs and roughly a factor 20 smaller than the rate given

6.3. EVIDENCE FOR LICS IN THE ROVIBRATIONAL GROUND STATE 87
0.0
0.1
0.2
0.3
16894.87 16894.88 16894.89 16894.90
Ions
/ P
ulse
11112.63 11112.64 11112.650.0
0.1
0.2
0.3
Photoassociation frequency [cm-1]
Depletion frequency [cm-1]
Ions
/ P
ulse
Figure 6.7: Depletion scan of X1Σ+,v′′=0,J′′=2 molecules via B1Π,v′=12,J′=1 (uppertrace) aligned to a PA scan of the same excited level (lower trace). The depletion laserintensity is 26 mW/cm2, the PA intensity 25 W/cm2. The molecules are detected at differ-ent ionization wavelengths.
in Ref. (Viteau et al., 2008) for the homonuclear Cs2. A direct comparison is howeverdifficult, as here rates are derived for the population of a single vibrational and rotationalstate, while in the cited references the produced molecules are distributed over a range ofrotational states.
Figure 6.7 shows a high-resolution scan of the depletion resonance (X1Σ+,v′′=0,J′′=2→ B1Π,v′=12,J′=1). The depletion intensity was reduced to 26 mW/cm2 to avoid satura-tion. The remaining width of the depletion resonances results from unresolved hyperfinestructure of the B1Π state (see section 5.2). The hyperfine structure of deeply boundground state levels is expected to be below 1 MHz and is therefore not resolved here. Acomparison with the resonance (B1Π,v′=12,J′=1) observed in PA spectroscopy startingfrom the atomic asymptote Li(2 2S1/2,F=2)+Cs(6 2S1/2,F=3) yields the binding energyof the X1Σ+,v′′=0,J′′=2 level as 5782.40(3) cm−1 with respect to the hyper-fine asymp-tote of the X1Σ+ state. Using the calculated rotational constant Bv′′=0=0.1874cm−1 forX1Σ+, v′′=0, this gives a hyperfine averaged value for the binding energy of the lowestvibrational level DX
0 =5783.53(3) cm−1. This agrees within the experimental uncertaintywith the value derived in section 5.2.

88 CHAPTER 6. ULTRACOLD LICS IN THE ROVIBRATIONAL GROUND STATE

Chapter 7
Interactions of ultracold LiCs molecules
As already mentioned several times, LiCs molecules in low vibrational levels are ex-pected to have a very significant permanent electric dipole moment. The interaction ofthis dipole moment with an external electric field is used in the following to measure itsabsolute value. Furthermore the formation and trapping of LiCs molecules in an opticaldipole trap will be demonstrated for the first time. In this setup, inelastic collisions be-tween ultracold LiCs molecules and Cs atoms are studied and the radiative decay betweenlevels in the electronic ground state is observed.
7.1 Determination of the permanent electric dipole mo-ment by Stark spectroscopy
It can be shown (Townes and Schawlow, 1955) that no linear molecule can exhibit afirst-order Stark effect, but that any dipole moment must be first induced by polarizing themolecule in an electric field. This leads to a Stark effect in second order of the electricfield:
∆W =− µ2E2
2hBJ(J+1)J(J+1)−3M2
(2J−1)(2J+3)(7.1)
Here ∆W denotes the change of energy of a level with electric dipole moment µ,rotational constant B, angular momentum J, and its projection M on the field axis of theexternal field E. For the special case J=0 one finds (Townes and Schawlow, 1955)
∆W =−µ2E2
6hB(7.2)
89

90 CHAPTER 7. INTERACTIONS OF ULTRACOLD LICS MOLECULES
This splitting or shift of transitions in an electric field can be measured spectroscop-ically. Such a ”Stark spectroscopy” yields direct information about the electric dipolemoment of a molecule. Theory predicts an especially large electric dipole moment forLiCs molecules in the ground state of µ=5.5 Debye (Aymar and Dulieu, 2005), howeverup to now no experimental measurement confirms this. Using realistic numbers for LiCsin the lowest vibrational states (µ=5.5 Debye, B=0.183 cm−1) and a maximum voltage of2.4 kV, one calculates a splitting (or shift for J=0) of 14, 25, and 84 MHz for J′′=2, 1,and 0 respectively. For molecules in J′′=0 the expected change in energy is thereforesignificantly larger than the width of the depletion features (around 20 MHz) (e.g. shownin figure 6.7) and should be easily observable. A stronger effect for higher J’s would ofcourse be caused by higher voltages, however this would require substantial modifica-tions of the experimental setup. As reported in the previous section, molecules in J′′=0could indeed be observed in depletion scans with high resolution. More specifically thosemolecules were in X1Σ+,v′′=0, 2, and 3 (J′′=0). A sufficiently high signal-to-noise ratiofor the accurate determination of small shifts in the depletion spectra was achieved forv′′=2,J′′ = 0 and v′′=3,J′′ = 0, produced by PA through B1Π,v′′=18,J′=1.
300 350 400 450 500 550 6000
50
100
150
Depletion Laser detuning @MHzD
Det
ecte
dIo
ns
0 kVcm
225 kVcm
331 kVcm
437 kVcm
488 kVcm
(a) Depletion scans for different fields(dots, lower traces offset for clarity) andfits to the data (solid lines)
0 100 200 300 400 500
-60
-40
-20
0
Electric field @VcmD
Line
shift@M
HzD
(b) Fitted resonance positions (symbols) to-gether with a fit to equation 7.2 (solid line).
Figure 7.1: Stark shift of the X1Σ+,v′′=3,J′′=0→B1Π,v′=18,J′=1 transition.

7.1. DETERMINATION OF THE PERMANENT ELECTRIC DIPOLE MOMENT 91
To determine the relative line shifts between different scans with high accuracy, anacousto-optical modulator was used as frequency shifter to control the frequency of thedepletion laser electronically with highest precision (see section 4.4). The magnitudeof the applied fields is calculated using the commercial software SimION 8.0 and mea-sured geometries and voltages (using a high-voltage probe on the vacuum feed-throughs)of the field plates. Molecules in X1Σ+,v′′=3 are selectively detected at a REMPI wave-length of 16 886.3cm−1. The intermediate level is a vibrational level in a Ω=0 state,probably associated to A1Σ+. This intermediate levels was later also identified in PA ata detuning of 100.20 cm−1 from the hyperfine averaged Li(2S 1/2)+Cs(6P3/2) asymptote.Figure 7.1 a) shows depletion scans of the central hyperfine component of the transitionX1Σ+,v′′=3,J′′=0→B1Π,v′=18,J′=1 in different electric fields. The shift of the depletionresonance with increasing field is clearly visible in the shown spectra. One might alsonote a second, smaller peak which does not change its position with increasing field. Thispeak is a technical artefact of the detection method: the same field plates which are usedfor the application of the Stark field are also used for the extraction of the ions in the time-of-flight detector setup. For detection the field is switched to a specific value (∼50 V/cm),this happens roughly 500 µs before the REMPI pulse arrives. Therefore a certain portionof the detected molecules is depleted at this detection field and thus experiences basicallyno Stark shift. In order to extract the positions of the shifted resonances, two Lorentzianpeaks are fitted to the data where the position of one peak and the width of both peaks isfixed to the zero-field value. Furthermore the relative amplitude of both peaks is fixed tothe fitted value at highest field. A third depletion feature, which appears for high fields atthe lower end of the scan range, stems from the lower hyperfine component of the excitedB1Π level which is shifted into the fixed scan range. This dip is not included in the fit.The observed shifts in the transition frequency for the depletion feature originate in thecombined Stark shifts of the X1Σ+ level and the excited B1Π level used for depletion.In a separate measurement PA scans of the excited level B1Π,v′=18,J′=1 were performedat the same field values as the depletion scans in figure 7.1 a). For these scans the fre-quency of the PA laser was also tuned with high precision by varying electronically thedetuning of the off-set locked reference laser in the locking scheme for the PA laser (seesection 4.2). Only a very slight broadening of the resonance and a line shift of ∼2 MHzwas observed, which is negligible in comparison with a typical uncertainty of 5 MHz forthe measured Stark shifts of the ground state. Thus the shifts observed in the depletionscans can be attributed purely to the Stark shift of the ground state levels. Figure 7.1 b)

92 CHAPTER 7. INTERACTIONS OF ULTRACOLD LICS MOLECULES
shows the resulting line shifts together with a fit of equation 7.2. This fit yields a dipolemoment of µ=5.5(2) Debye for v′′=3 where the reported error stems from the fit of equa-tion 7.2 to the data.
The same measurement was performed for molecules in X1Σ+,v′′=2,J′′=0 (shown infigure 7.2). The determined value is µ=5.5(2) Debye, within the experimental uncertaintyidentical to the one obtained for v′′=3. This agrees with the predicted weak dependenceof the permanent electric dipole moment on the vibrational quantum number, i.e. thecalculated dipole moments of vibrational levels below v′′=20 deviate by not more than4% (Aymar and Dulieu, 2005). Also the absolute values determined here are in excellentagreement with predictions from ab initio calculations of Igel-Mann et al. (1986), Aymarand Dulieu (2005), and Sorensen et al. (2009). Using different approaches all three worksfind a value of 5.5 Debye.
350 400 450 500 550 6000
20
40
60
80
100
120
140
Depletion Laser detuning @MHzD
Det
ecte
dIo
ns
0 kVcm
225 kVcm
331 kVcm
437 kVcm
488 kVcm
(a) Depletion scans for different fields(dots, lower traces offset for clarity) andfits to the data (solid lines)
0 100 200 300 400 500
-60
-40
-20
0
Electric field @VcmD
Line
shift@M
HzD
(b) Fitted resonance positions (symbols) to-gether with a fit to equation 7.2 (solid line).
Figure 7.2: Stark shift of the X1Σ+,v′′=2,J′′=0→B1Π,v′=18,J′=1 transition.

7.2. OPTICAL DIPOLE TRAP FOR ULTRACOLD MOLECULES 93
7.2 Optical dipole trap for ultracold molecules
In the previous measurements ultracold LiCs molecules were formed by PA of atomscooled and trapped in magneto-optical traps. The advantage of this setup is the fast ex-perimental cycle (the MOTs are operated continuously) making detailed PA, REMPI, anddepletion scans feasible. However the formed molecules are not trapped and leave thedetection volume quickly due to gravity and their finite temperature. A natural extensionof the setup is therefore the addition of a trap, which can hold both atomic species and theformed molecules at the same time. An ideal candidate is the QUEST (quasi-electrostaticdipole trap) which is realized by a strongly focused laser beam from a high-power CO2
laser operating at a wavelength of 10.6 µm. This wavelength is very far red-detuned fromany relevant atomic transition. Also the electronic excitation of molecules in levels ofX1Σ+ or a3Σ+ is not possible. However as the ground state of LiCs possesses a perma-nent electric dipole moment, vibrational heating of trapped molecules is a possibility (Mu-drich, 2003). A QUEST was previously used at this experiment to investigate collisionsbetween trapped lithium and cesium atoms (Mudrich et al., 2002), the photoassociationof Cs2 molecules (Wester et al., 2004) and collisions between Cs2 molecules and cesiumatoms (Staanum et al., 2006).
The principles of optical dipole traps have been review in detail by Grimm et al.(2000), thus only the basic principles will be introduced here. As already denoted earlier(section 3.5), the interaction between a polarizable object and a laser field with intensityI is given by U = αI/(2ε0c), where α denotes the static polarizability for atoms andthe average static polarizability for molecules. For a red-detuned laser field, this potentialbecomes attractive and a minimum can be easily formed by focusing the laser. The spatialintensity distribution of a focused beam with power P is given by
I(r,z) =2P
πω2(z)exp
(−2
r2
ω2(z)
)(7.3)
where z denotes the propagation direction and r the radial coordinate. The 1/e2-radiusω(z) then varies with the propagation coordinate z as
ω(z) = ω0
√1+
(zzR
)2
. (7.4)
The constant ω0 is called beam waist, and z(R) = πω20/λ the Rayleigh range. If one
includes the quality factor M2, which describes the deviation from an ideal gaussian beam,

94 CHAPTER 7. INTERACTIONS OF ULTRACOLD LICS MOLECULES
the previous equation transforms into
ω(z) = ω0
√√√√1+(
zλM2
πω20
)2
. (7.5)
The maximum interaction strength at z = 0,r = 0 is called the trap depth
U0 = αP/(πε0cω20). (7.6)
As long as the thermal energy of the trapped sample is much smaller than this value, thetrap is well approximated by a harmonic potential
U(r,z) = −U0
(1− 2r2
ω20− z2
z2R
)where (7.7)
ωrad =√
4U0/(mω20) ωax =
√2U0/(mz2
R) (7.8)
are the radial and axial oscillation frequencys respectively.The optical dipole trap used in the presented experiments is based on the ”AOM
QUEST” described by Mudrich (2003). It was dismantled when the experiment movedfrom the ”Max-Planck Institut fur Kernphysik” in Heidelberg to its current location inFreiburg. In this thesis the AOM QUEST was rebuild with slight modifications, the newsetup is shown in figure 7.3. The light for trapping is provided by an industrial CO2 laser(Synrad Evolution 100) with a maximum power of 130 W running in a single longitu-dinal mode at a wavelength of 10.6 µm. The beam contains apart from TEM00 highertransversal modes (specified M2 <1.2), however they are damped out by letting the beampropagate over a longer distance and then blocking these higher transversal componentswith an aperture. In the current setup, this aperture is provided by the watercooled hous-ing of the AOM (IntraAction AGM-408BB1). While this AOM allows fast switching ofthe trap and therefore precise measurements of temperature and trap frequencies, it alsoacts as astigmatic lens due to thermal effects in the large and asymmetrically cooled crys-tal. Furthermore the characteristics of this lens depend on the applied laser and rf power,i.e. a beam path properly aligned at low power might experience shifts of several mil-limeters when the full power is applied. These issues can be partially avoided by alwaysrunning laser and AOM driver at maximum power. A clever trick devised by Gehm (2003)makes this possible while still being able to vary continuously the power delivered to theexperiment: the rf fed to the AOM contains two frequency components with a variable

7.2. OPTICAL DIPOLE TRAP FOR ULTRACOLD MOLECULES 95
power ratio, so that the total rf power remains constant. For the relevant frequency rangethe heating of the crystal does not depend on the frequency but only on the total powerof the rf, so that the heat load on the crystal (and therefore the formed thermal lens) re-mains constant. The optical output power can then be controlled by changing the ratio ofthe two frequency components. Note that the angles of the AOM in the beam path canonly be optimized for one frequency, so the second frequency leads to relatively weakdiffraction of the incident beam. Best results were achieved with 30 MHz for the ”pas-sive” component and 40 MHz, the design value for the AOM, for diffraction of the beaminto the experiment. The electronics for the creation of the mixed rf signal are describedin appendix D.2.
The AOM still acts as an astigmatic lens, however the resulting astigmatism of thebeam can be mostly compensated by a slightly tilted telescope after the AOM. The beamis then further expanded and consecutively focused by a 254 mm lens to a waist of fewtens of micrometers in the center of the vacuum chamber. In an optical layout identicalto the one of the experiment (except for the view ports) the waist of the focused beamwas determined by knife edge measurements at different positions. The resulting beamwidths are shown in figure 7.4. If one fits the propagation behavior of an ideal gaussianbeam (equation 7.4) to the measurement one finds ω0=73± 5µm, if one incorporates anM2 of 1.2 for a real Gaussian beam one finds ω0,R=89±4 µm. The latter fit is shown to-gether with the data in figure 7.4. Waist measurements of the beam perpendicular andparallel to the optical table agree within the error margins, indicating a good compensa-tion of the astigmatism introduced by the AOM. The results are also in agreement withmeasurements in a previous version of the setup (Mudrich, 2003), although the laser tubeof the CO2 laser and the AOM crystal were replaced in the meantime and distances inthe optical layout differ. This indicates that the observed waist is close to the diffractionlimit imposed by the different apertures in the beam path, especially the last lens and theentrance view port.
The power in front and behind the chamber was measured to be 72(3) W and 56(3) Wrespectively. The resulting power at the trap position can thus be estimated as 64(4) W.Based on equation 7.6, the measured values for ω0,R and P, and the calculated values forthe polarizabilities (section 3), one can now estimate the trap depths and frequencies forthe different species. The results are shown in table 7.1. It is noteworthy that the trapdepth differs strongly for LiCs molecules in different vibrational states, however the trapshould be sufficiently deep to trap all of them.

96 CHAPTER 7. INTERACTIONS OF ULTRACOLD LICS MOLECULES
Figure 7.3: Extended setup for the CO2 laser. As described in the text, the radio frequencydriving the AOM contains two frequency components A (40 MHz) and B (30 MHz). Thezeroth diffraction order and the first order of frequency B are reflected into a beam dump,the first order of frequency B is used in the experiment. The small telescope after the AOMis adjusted to compensate achromatism introduced by thermal lensing in the AOM. Thebeam is then deflected upwards (indicated by the axis break in the center of the figure),expanded by a second telescope and is finally focused again with a f =254 mm lens. It isthen deflected with a final mirror into the chamber. After the chamber it is dumped at awater cooled copper block.
7.2.1 Transfer of cesium and trap characterization
Loading cesium and lithium atoms into the QUEST starts with trapping and pre-cooling the atoms in the magneto-optical traps, the two species are then transferred intothe dipole trap sequentially. The cesium atoms are transferred first, then the lithium atomsfollow. This was found to be the optimal loading scheme for a Li-Cs mixture in (Mudrich,2003). In this section the transfer of cesium will be described and the dipole trap will becharacterized. For loading the dipole trap, the cesium dark SPOT was replaced by aconventional MOT again, as the latter has a faster loading rate and reaches lower tem-peratures. In order to increase the transfer efficiency, a molasses phase is added before

7.2. OPTICAL DIPOLE TRAP FOR ULTRACOLD MOLECULES 97
ò
ò
ò
ò
ò
ò
ò
òò
ò
ò
òò
ò
ò
ò
ò
àà
à
à
à
à
àà à
à
à
à
à
à
5 10 15 20 250.0
0.1
0.2
0.3
0.4
0.5
0.6
0.7
z @mmD
Ω@m
mD
Figure 7.4: 1/e2 radii of the CO2 laser beam measured around the focus position witha knife-edge parallel to the laser polarization (black squares) and perpendicular to it (redtriangles). The solid lines are fits of equation 7.5 for M2=1.2.
transfer by switching off the magnetic field gradient of the MOT and rapidly increasingthe red-detuning of the cooling laser from 2.6 Γ to 21.0 Γ. This phase is triggered as soonas the fluorescence level of the MOT reaches a specified level, typically corresponding to2×107 cesium atoms in the MOT. About 100 ms before the cooling phase, the CO2 laser(normally running at 80% of its power) is ramped up to 100% power. After the molassespulse, all cesium lasers are extinguished with mechanical shutters or AOMs. By blockingthe cooling laser 0.5 ms after the repump laser, all atoms are pumped into the lowest hyper-fine state, F=3. An additional molasses pulse is applied 500 ms after the transfer to further
Species Li Cs LiCs(X1Σ+,v′′=0) LiCs(X1Σ+,v′′=42) LiCs(a3Σ+,v′′=0)Trap depth [µK] 194(21) 479(53) 435(48) 700(77) 744(82)
ωrad/2π [1/s] 1729(166) 623(60) 579(55) 735(70) 758(73)ωax/2π [1/s] 47(7) 17(2) 16(2) 20(3) 20(3)
Table 7.1: Trap depths and frequencies of the QUEST for different species. Estimatebased on theoretical values for the polarizability (section 3) and experimental parametersfor power and waist of the trapping laser. The given error is based on the experimental un-certainties only, no error on the theoretical values was assumed. X1Σ+,v′′=42 was selectedbecause it experiences the maximum trap depth of all X1Σ+ levels.

98 CHAPTER 7. INTERACTIONS OF ULTRACOLD LICS MOLECULES
cool the sample in the trap. The number of transferred atoms is determined either by di-rect absorption imaging of the atoms in the CO2 trap or from fluorescence after recaptureinto the MOT. Both methods yield atoms numbers around 8× 10⁵ atoms, correspondingto a transfer efficiency of 4%. The temperature of the trapped atoms is measured by imag-ing the ballistic expansion of the atom cloud after extinguishing the CO2 laser with theAOM. The final temperature in the trap can be optimized to 33(4)µK; typical day-to-dayvalues are around 45(5)µK. This discrepancy is probably due to instabilities of magneticfields and beam pointing of the trapping lasers. As observed previously, the field of theCO2 laser seems to perturb the efficiency of the molasses phase, as in free space molassestemperatures down to 8(3) µK are observed.
The radial trap frequency for the cesium atoms was determined as follows: radial os-cillations are excited by turning off the trapping potential for 0.5 ms. After a varying holdtime the atoms are then released from the trap and after 0.5 ms an absorption image istaken. Due to this expansion time the width of the imaged cloud is a convolution of thespatial width of the cloud and its momentum distribution. The radial widths of the ex-panded cloud are extracted by fitting a 2D Gaussian to the absorption images. The result-ing widths are shown in figure 7.5 together with a fit to a damped oscillation (the dampingis due to anharmonicities of the potential). The frequency from this fit corresponds totwice the radial trap frequency, the latter is then found to be ωrad/2π=664(7) Hz. This isin good agreement with the value of ωrad/2π=623(60) Hz derived above from power andwaist of the trapping laser.
The experimental parameters reported in this section were all found to be in very goodagreement with the values reported for the previous setup (Mudrich, 2003). As a lastand very stringent test, a previous measurement of the two-body rate coefficient G(4,4) forhyperfine-changing collisions between cesium atoms in the upper hyperfine state F=4 wasrepeated. A detailed model for these collisions in a dipole trap is developed in reference(Mudrich et al., 2004b), whereas here only the main results are summarized. The rateequation for spin-changing collisions in a homonuclear sample is found to be
N =−2GN2/V(T ) (7.9)
with particle number N, rate coefficient G and temperature dependent effective volumeV(T ). Under further assumptions about the relation between particle number and temper-ature due to relaxation heating one finds
N = AN NxN (7.10)

7.2. OPTICAL DIPOLE TRAP FOR ULTRACOLD MOLECULES 99
è
è
è
è
è è è
è
è
è
è
è
è
è
è
è è
è
è
è
èè
è
èè
è
0.0 0.5 1.0 1.5 2.0 2.520
40
60
80
100
120
140
Hold time @msD
Ωra
d@Μ
mD
Figure 7.5: Waists from fits to absorbtion pictures taken after 0.5 ms of free ex-pansion (dots). The solid line is a fit to a damped oscillation with a frequency ofω/2π=2×664(7) Hz.
with AN =−2Gω2radωax(mNq−1
0 /(4πkBT0))3/2 and xN =−3(q−1)/2+2. The reduction
factor q is introduced to account for the anisotropy of the collision process: as collisionsoccur preferentially in the dense center of the trap, the mean potential energy of a collidingpair of atoms is below the mean potential energy of the full ensemble. For the averagedensity n one can find the somewhat simpler expression
˙n =−2Gn2 (7.11)
with the reduced rate coefficient G = (5−3q)G/2.Experimentally the atoms are transferred into the dipole trap in F=3 and are then
optically pumped into F=4 with a 10 ms light pulse from the MOT repumper. Aftervarying hold times the average density of the sample is determined from absorption im-ages. Figure 7.6 a) shows the data together with a fit of equation 7.11 yielding a re-duced rate coefficient G(4,4)=(2.7±0.3±0.5)×10−11cm3/s. The first error is the statisti-cal uncertainty of the fit, the second error stems from the estimated uncertainty of thedensity measurement. This is in good agreement with the previously determined valueof G(4,4)=(1.9±0.2±0.3)×10−11cm3/s (Mudrich et al., 2004b). In figure 7.6 b) the atomnumbers determined in the same experiment are shown together with a fit of equation 7.10.The only free parameters in the fit are N0 and q, while the other parameters ωrad, ωax, and
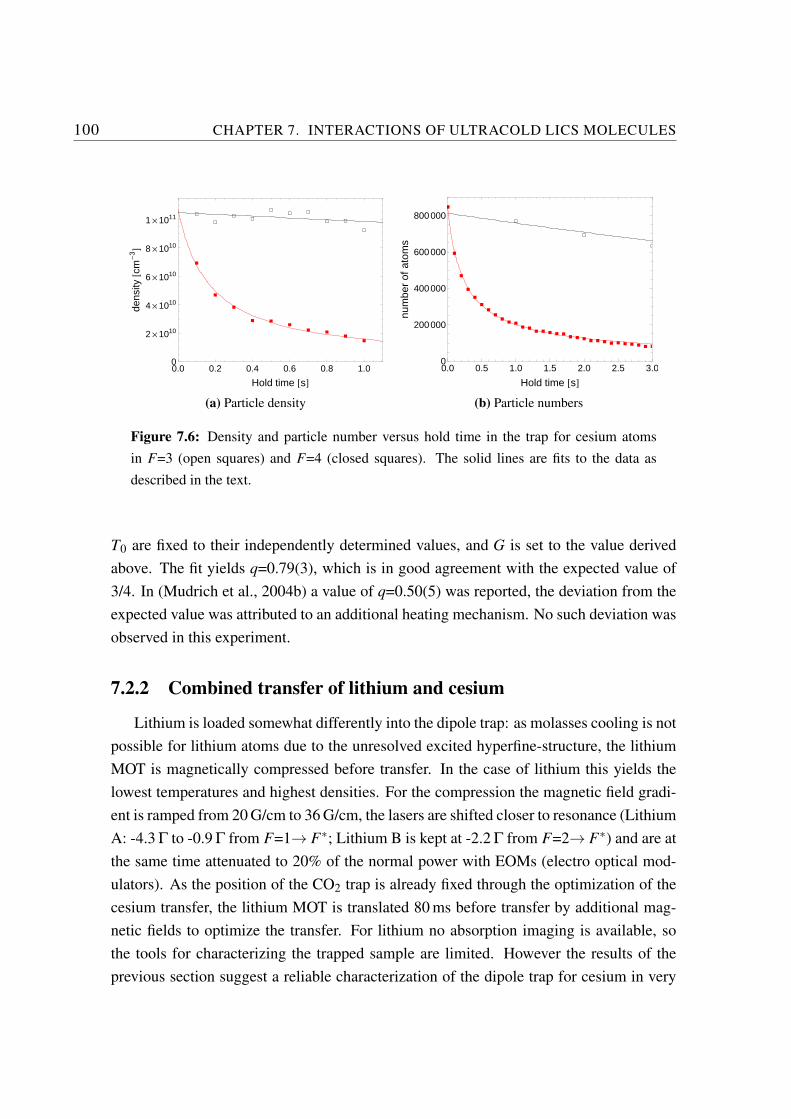
100 CHAPTER 7. INTERACTIONS OF ULTRACOLD LICS MOLECULES
á
á
áá
áá á
á á
á
à
à
à
à àà
àà
à
à
0.0 0.2 0.4 0.6 0.8 1.00
2´1010
4´1010
6´1010
8´1010
1´1011
Hold time @sD
dens
ity@c
m-
3D
(a) Particle density
á
á
á
á
à
à
à
à
à
à
à
à
àà à
à àà à à à à
à à àà à à à à à à à à à
0.0 0.5 1.0 1.5 2.0 2.5 3.00
200000
400000
600000
800000
Hold time @sD
num
ber
ofat
oms
(b) Particle numbers
Figure 7.6: Density and particle number versus hold time in the trap for cesium atomsin F=3 (open squares) and F=4 (closed squares). The solid lines are fits to the data asdescribed in the text.
T0 are fixed to their independently determined values, and G is set to the value derivedabove. The fit yields q=0.79(3), which is in good agreement with the expected value of3/4. In (Mudrich et al., 2004b) a value of q=0.50(5) was reported, the deviation from theexpected value was attributed to an additional heating mechanism. No such deviation wasobserved in this experiment.
7.2.2 Combined transfer of lithium and cesium
Lithium is loaded somewhat differently into the dipole trap: as molasses cooling is notpossible for lithium atoms due to the unresolved excited hyperfine-structure, the lithiumMOT is magnetically compressed before transfer. In the case of lithium this yields thelowest temperatures and highest densities. For the compression the magnetic field gradi-ent is ramped from 20 G/cm to 36 G/cm, the lasers are shifted closer to resonance (LithiumA: -4.3 Γ to -0.9 Γ from F=1→ F∗; Lithium B is kept at -2.2 Γ from F=2→ F∗) and are atthe same time attenuated to 20% of the normal power with EOMs (electro optical mod-ulators). As the position of the CO2 trap is already fixed through the optimization of thecesium transfer, the lithium MOT is translated 80 ms before transfer by additional mag-netic fields to optimize the transfer. For lithium no absorption imaging is available, sothe tools for characterizing the trapped sample are limited. However the results of theprevious section suggest a reliable characterization of the dipole trap for cesium in very
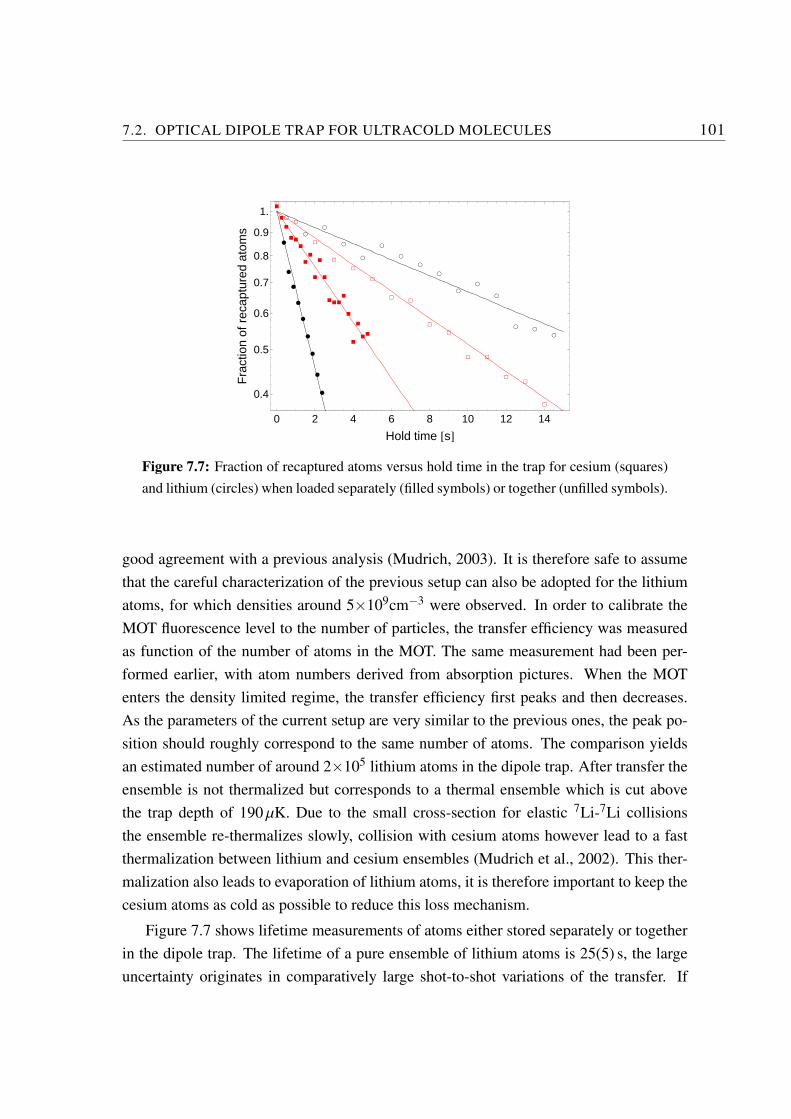
7.2. OPTICAL DIPOLE TRAP FOR ULTRACOLD MOLECULES 101
ç
ç
ç
ç
ç
ç
ç
ç
ç
ç
ç
ç
çç
ç
æ
æ
æ
æ
æ
æ
æ
æ
æ
á
á
á
á
á
á
áá
á
á
á á
áá
á
à
à
à
àà
à
à
à
à
à
à
ààà
à
à
à
à
àà
0 2 4 6 8 10 12 14
0.4
0.5
0.6
0.7
0.8
0.9
1.
Hold time @sD
Fra
ctio
nof
reca
ptur
edat
oms
Figure 7.7: Fraction of recaptured atoms versus hold time in the trap for cesium (squares)and lithium (circles) when loaded separately (filled symbols) or together (unfilled symbols).
good agreement with a previous analysis (Mudrich, 2003). It is therefore safe to assumethat the careful characterization of the previous setup can also be adopted for the lithiumatoms, for which densities around 5×109cm−3 were observed. In order to calibrate theMOT fluorescence level to the number of particles, the transfer efficiency was measuredas function of the number of atoms in the MOT. The same measurement had been per-formed earlier, with atom numbers derived from absorption pictures. When the MOTenters the density limited regime, the transfer efficiency first peaks and then decreases.As the parameters of the current setup are very similar to the previous ones, the peak po-sition should roughly correspond to the same number of atoms. The comparison yieldsan estimated number of around 2×10⁵ lithium atoms in the dipole trap. After transfer theensemble is not thermalized but corresponds to a thermal ensemble which is cut abovethe trap depth of 190 µK. Due to the small cross-section for elastic 7Li-7Li collisionsthe ensemble re-thermalizes slowly, collision with cesium atoms however lead to a fastthermalization between lithium and cesium ensembles (Mudrich et al., 2002). This ther-malization also leads to evaporation of lithium atoms, it is therefore important to keep thecesium atoms as cold as possible to reduce this loss mechanism.
Figure 7.7 shows lifetime measurements of atoms either stored separately or togetherin the dipole trap. The lifetime of a pure ensemble of lithium atoms is 25(5) s, the largeuncertainty originates in comparatively large shot-to-shot variations of the transfer. If

102 CHAPTER 7. INTERACTIONS OF ULTRACOLD LICS MOLECULES
only cesium atoms are stored in the trap, their lifetime was determined as 14(1) s., sig-nificantly smaller than the lithium lifetimes. As one would expect similar lifetimes dueto collisions with background gas, the increased decay rate could be due to residual lightleaking through the AOM used for switching the repump laser. Also the fast loss oflithium atoms in the case of combined storage could be partially explained by this resid-ual repump light: the released internal energy in a collision of a cesium atom in F=4and a lithium atom in F=3 is large enough to eject both atoms out of the trap. As therate coefficient GLiCs
(1,4) for spin-changing collisions between lithium and cesium atoms wasfound to be about two times larger than the rate coefficient for homonuclear collisionsGCs(4,4) between cesium atoms (Mudrich et al., 2004b), this is an important effect. In later
experiments an additional mechanical shutter was installed to block this repumping light.However a significant enhancement of the lithium lifetime during combined storage wasonly reached by continuously shining in the additional cesium depumping laser. In thiscase both the lifetime of lithium and cesium during combined storage was found to bein agreement with τ=8(2) s, probably limited by the sympathetic evaporation of lithiumatoms by cesium atoms during the thermalization of both ensembles, as discussed above.
7.3 Formation and detection of LiCs molecules in the dipoletrap
For PA in the dipole trap, the light from the TiSa is focused with a 500 mm lens to awaist of 100 µm at the trap position. The beam is overlapped with the atom trap by maxi-mizing the loss of trapped cesium atoms when the PA laser is close to an atomic resonance.For PA the two species are loaded into the trap as described above and 500 ms after thelithium transfer the PA laser is switched on using a fast mechanical shutter (Singer et al.,2002). The frequency of the PA laser is scanned stepwise between consecutive experi-mental cycles with a typical step width of 5 MHz. In the dipole trap the atoms collide onthe Li(S1/2,F=1)+Cs(S1/2,F=3) asymptote instead of on the Li(S1/2,F=2)+Cs(S1/2,F=3)asymptote. Thus all PA resonances found in the double MOT setup will be shifted bythe hyperfine splitting of the lithium ground state, +803 MHz. During PA, an additionaldepumper is shined on the trap (”QUEST depumper”). It pumps cesium atoms, whichhave been off-resonantly excited by the PA laser, back into the F=3 ground state. Theduration of the PA pulse depends on the lifetime of the formed molecules in the trap: as

7.3. FORMATION AND DETECTION OF LICS MOLECULES IN THE DIPOLE TRAP 103
21.5 22.0 22.5 23.0
-10
-8
-6
-4
-2
0
Time of flight @ΜsD
MC
Pvo
ltage@m
VD
LiCs+ peak:22.321 ± 0.036Μs
Cs+ peak:21.740 ± 0.167Μs
Figure 7.8: Time of flight trace of molecules ionized in the dipole trap. All cesium atomsare removed before ionization, thus the observed Cs+ ions have to originate from dissoci-ated LiCs molecules. The additional energy due to the dissociation leads to a broadeningof the atomic peak, while the molecular LiCs+ peak is as narrow as expected (Kraft et al.,2007). The asymmetry is due to a non-optimal energy-focusing.
long as the PA laser is on, molecules are formed and trapped continuously. However atthe same time the already formed molecules collide with trapped atoms and are mostlylost due to the release of internal energy. The number of formed molecules thus saturateson the same timescale as the lifetime of the molecules in the trap. Typical PA times arearound 300 ms, this will be investigated in more detail in the next section.
The detection of molecules from the dipole trap is much more straightforward than thedetection of molecules from the double MOT setup (see section 4.3). All atoms remainingin the trap are removed by short pulses of resonant light before the ionizing laser pulsearrives, therefor the detection of molecules is intrinsically background free. Thereforethe optimal voltages of UL=300 V and UM=200 V (Kraft et al., 2007) were used for theWiley-McLaren mass spectrometer. Figure 7.8 shows an averaged time-of-flight trace forthis configuration, illustrating the high resolution of the detector. The REMPI laser isaligned to the trap by maximizing the ion yield from cesium atoms deliberately left in thetrap. As the preparation of the ultracold Li-Cs mixture in the dipole trap typically requires5 s per cycle, the single-ion counting method used in the double MOT setup could not beused. Instead the relevant part of the time-of-flight trace was recorded for every ionization

104 CHAPTER 7. INTERACTIONS OF ULTRACOLD LICS MOLECULES
pulse with an oscilloscope, read out by the experiment control software and stored for lateranalysis. By analysis of selected time-of-flight traces the signal produced by a single ionwas determined to be 0.41(3) Vns. The full timing sequence for combined transfer, PAand consecutive REMPI detection of formed molecules can be found in appendix D.1.The REMPI wavelength and intensity was always kept at the same conditions as in thedouble MOT setup (e.g. at wavelength of 14692.7 cm−1 and an intensity on the order of1 J/cm2), if not otherwise stated.
As an example for PA resonances observed in the dipole trap, B1Π,v′=26,J′=1 andJ′=2 are shown in figure 7.9. The comparison with the same resonances observed inthe double MOT setup reveals several differences. First the number of hyperfine com-ponents is reduced in the case of the dipole trap. This can be qualitatively explained bythe different entrance channels for PA in the two setups: while the total hyperfine spinFLiCs = FCs + FLi of the entrance channel is 3+1=4 in the dipole trap , it is 3+2=5 inthe double MOT setup. Furthermore the single hyperfine components are significantlynarrower in PA from the dipole trap than from the double MOT setup. This is due to themuch lower collision energies in the dipole trap: even if the lithium ensemble did notcompletely thermalize with the cesium atoms, the mean collision energy is well below200 µK (the trap depth for lithium). If one applies the model of section 5.1, this does notlead to an observable asymmetry of the PA resonances. The temperature of the formedmolecules is then again dominated by the temperature of the heavier cesium atoms, i.e.around 50 µK.
For the double MOT setup it was shown in section 5 that molecules produced throughexcited levels as low as v′=0 could be observed. In the dipole trap molecule formationthrough excited levels from v′=26 to v′=30 was observed, other levels were not system-atically investigated. However it turned out that in the current setup the increase of theatomic pair density in the dipole trap is not sufficiently large to compensate for the lowerexperimental sensitivity due to smaller particle numbers and significantly longer cycletimes. In section 6.2 it was found that the PA rate for v′=4,J′=1 is roughly a factor 100smaller than the one for v′=26,J′=1. One would therefore need a similar increase in pairdensity to observe directly the formation of absolute ground state molecules, which wasnot achieved in the current setup. A new experiment is currently under construction at thenew location of the group in Heidelberg, which will produce significantly denser atomicsamples.

7.4. ULTRACOLD ATOM-MOLECULE COLLISIONS 105
æææææææææææ
ææææ
æ
æææ
ææææ
ææ
ææææ
ææ
æ
æææ
æææ
æ
ææ
æ
æ
æ
æ
ææ
æ
æ
æ
æ
æ
ææ
æ
ææææ
æ
æ
æ
ææ
æ
æ
æ
æ
æ
æææææææ
æ
æ
æ
æ
æ
æ
ææ
æ
ææ
æ
æææææ
ææææ
æ
ææ
æ
æææ
ææ
ææ
ææ
æ
ææ
æ
æ
æ
æ
æ
æ
æ
æ
æ
æ
æ
æ
æ
æ
æ
æ
ææææææææ
æ
æææææ
æ
ææ
æ
ææ
ææ
ææ
æ
ææ
ææ
ææ
ææ
æ
ææææ
ææ
æ
æ
æææææææ
ææ
ææ
æææææææ
ææ
ææ
ææææææææææææææææææææææ
ààààààààààààààààà
ààààààààààààààààààà
àààààà
àà
àààààà
à
ààààààààààààà
àààààààààààààààà
àààààààà
à
ààààààààààààààààààà
à
àààààààà
àààà
àààààààààà
à
à
àà
à
à
à
à
à
à
àà
à
à
àà
àà
àààààààà
à
àààààààààààààààààààààààààààààààààààà
ààààààààààà
àà
à
àà
à
à
à
àà
à
àà
à
àà
àà
àààà
à
àà
à
ààà
ààà
ààààààààà
à
à
à
à
à
à
àà
à
àà
àà
àà
à
à
àà
à
àààààààà
àààààààààààààààààààààà
0.8 1.0 1.2 1.4 1.6
PA laser detuning @GHzD
Ion
yiel
d
(a) B1Π,v′′=26,J′′=1
æææææææ
ææææææææ
æææææææææææ
ææ
ææææ
æ
æ
ææ
ææ
æ
ææ
ææ
æ
ææ
ææ
æ
æ
æ
æ
ææ
æ
ææ
æ
æææææ
æ
æ
æææææ
ææ
æææ
ææ
ææ
ææææææ
æææ
æ
æ
æ
ææ
æ
æææ
æ
ææ
æ
ææ
æ
ææ
æ
æ
æ
æ
ææææ
ææææææ
ææ
ææææ
æ
æææææææææ
æææææææææææææææ
ææææææææææææ
æ
àààààààà
à
àà
àà
àààà
à
à
à
à
à
à
ààà
à
à
à
àà
à
à
à
à
à
à
à
à
àà
à
à
à
à
àà
à
à
à
ààààààà
àààà
à
à
àà
ààààààà
7.4 7.6 7.8 8.0 8.2
PA laser detuning @GHzD
Ion
yiel
d
(b) B1Π,v′′=26,J′′=2
Figure 7.9: Qualitative comparison of PA scans in the double MOT setup (upper traces, red)and in the dipole trap (lower traces, blue). The spectra from the double MOT are shiftedby +803 MHz to account for the difference in the hyperfine asymptotes of the continuumstates.
7.4 Ultracold Atom-molecule collisions
In order to measure the lifetime of molecules in the optical dipole trap, molecules areformed by a 300 ms PA pulse. Subsequently all atoms are removed from the trap by ashort pulse of resonant light. If a pure ensemble of LiCs molecules produced either viav′=26 or v′=28,J′=1 is stored in the trap, one observes an exponential decay with a lifetimeof τ=24(3) s (figure 7.10). It matches the lifetime of a pure sample of lithium atoms inthe trap and is very likely limited by collisions with background gas. From the measuredion yield and an detection efficiency of 1% (see the discussion in section 6.2) one canestimate that around 5000 molecules are stored in the trap. This corresponds to roughly10% of the number of trapped cesium atoms. As the trapping potentials for cesium andLiCs are nearly identical (see table 7.1) and LiCs and Cs temperatures are very close, themolecular density is at least one order of magnitude smaller than the cesium density. Thisyields an upper limit of 5×109 cm−3 for the LiCs density. It is therefore not likely thatmolecule-molecule collisions are observable in the current experiment.
In figure 7.11 the number of molecular ions is detected after combined storage of LiCs

106 CHAPTER 7. INTERACTIONS OF ULTRACOLD LICS MOLECULES
molecules and cesium atoms in F=3. The molecules are either produced via v′=26,J′=1or v′=28,J′=1. After 300 ms of PA, the PA laser is extinguished and the lithium atoms areremoved by a pulse of resonant light. After a varying hold time, the cesium atoms arealso removed by resonant light and the remaining molecules are detected by REMPI ion-ization. Both decay curves are in agreement with an exponential decay, yielding lifetimesof τ26=0.45(3) s and τ28=0.21(2) s , respectively. It was estimated above that the densityof molecules is significantly smaller than the atomic one. The temporal evolution of thenumber of molecules can thus be described by a simple rate equation
Nmol =−[
8√27βnat +Γmol
]Nmol (7.12)
where β is the atom-molecule inelastic collision rate coefficient, Γmol the loss rate dueto collisions with background gas and nat the atomic density (Staanum et al., 2006). Inprinciple nat is time-dependent due to collisions of cesium with background gas, howeverthis is negligible on the time-scale of the molecular decay. The factor 8√
27is due to spatial
averaging over atomic and molecular densities under the assumption of equal tempera-tures, which is well justified here. Fits of equation 7.12 to the data sets are also shown in
æ
æ
æ
ææ
æ
æ
æ
æ
0 5 10 15
4
8
10
12
6
14
Hold time after PA @sD
Ion
yiel
d@V
nsD
Figure 7.10: Molecular lifetime measurement in the dipole trap for a pure LiCs ensemble(lifetime τ=24(3) s). Each point is an average over 9 measurements, the given error bars arethe standard deviations of the data sets.
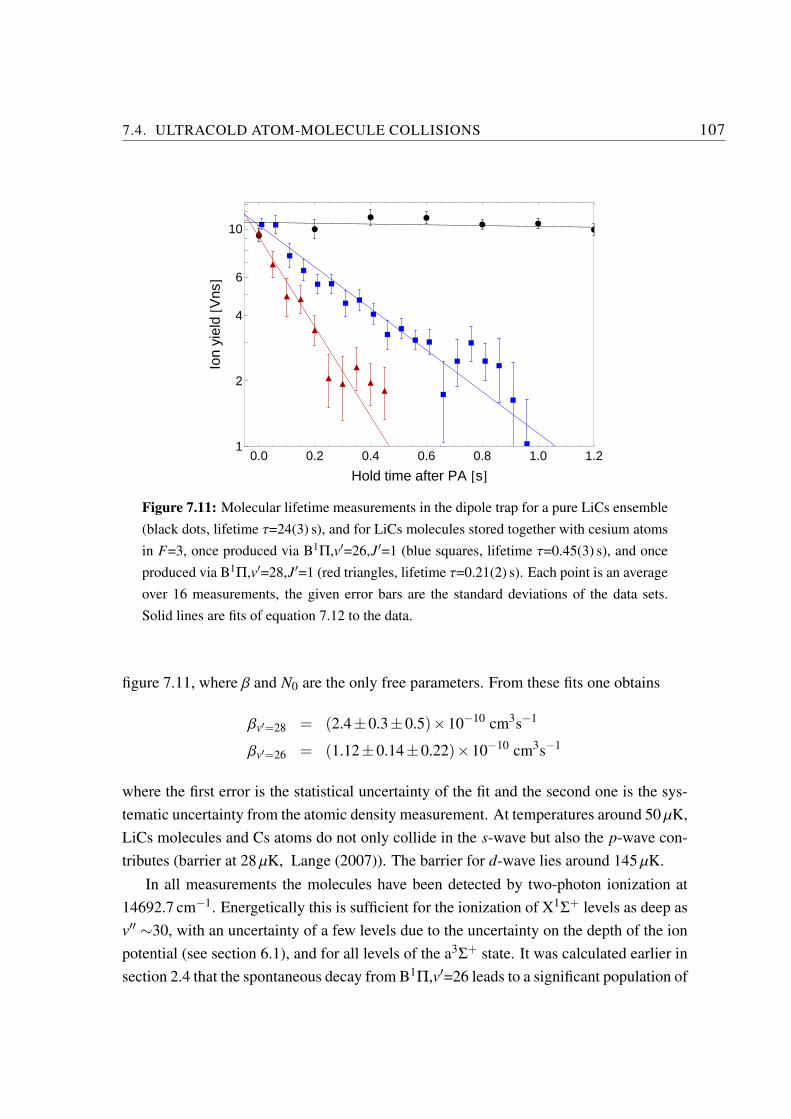
7.4. ULTRACOLD ATOM-MOLECULE COLLISIONS 107
ææ
æ ææ æ
æà à
à
à
à à
àà
à
àà
à à
à
à
à
àà
à
à
ò
ò
ò ò
ò
òò
ò
òò
0.0 0.2 0.4 0.6 0.8 1.0 1.21
2
4
10
6
Hold time after PA @sD
Ion
yiel
d@V
nsD
Figure 7.11: Molecular lifetime measurements in the dipole trap for a pure LiCs ensemble(black dots, lifetime τ=24(3) s), and for LiCs molecules stored together with cesium atomsin F=3, once produced via B1Π,v′=26,J′=1 (blue squares, lifetime τ=0.45(3) s), and onceproduced via B1Π,v′=28,J′=1 (red triangles, lifetime τ=0.21(2) s). Each point is an averageover 16 measurements, the given error bars are the standard deviations of the data sets.Solid lines are fits of equation 7.12 to the data.
figure 7.11, where β and N0 are the only free parameters. From these fits one obtains
βv′=28 = (2.4±0.3±0.5)×10−10 cm3s−1
βv′=26 = (1.12±0.14±0.22)×10−10 cm3s−1
where the first error is the statistical uncertainty of the fit and the second one is the sys-tematic uncertainty from the atomic density measurement. At temperatures around 50 µK,LiCs molecules and Cs atoms do not only collide in the s-wave but also the p-wave con-tributes (barrier at 28 µK, Lange (2007)). The barrier for d-wave lies around 145 µK.
In all measurements the molecules have been detected by two-photon ionization at14692.7 cm−1. Energetically this is sufficient for the ionization of X1Σ+ levels as deep asv′′ ∼30, with an uncertainty of a few levels due to the uncertainty on the depth of the ionpotential (see section 6.1), and for all levels of the a3Σ+ state. It was calculated earlier insection 2.4 that the spontaneous decay from B1Π,v′=26 leads to a significant population of

108 CHAPTER 7. INTERACTIONS OF ULTRACOLD LICS MOLECULES
levels X1Σ+,v′′ <10 and v′′ ≥48 (maximum population of 30% in v′′=48). For B1Π,v′=28one finds significant population in levels v′′ <10 and v′′ ≥49 with the largest populationof 47% in v′′=50. Note that v′′=48 is already bound by 42 cm−1 and v′′=50 is still boundby 13 cm−1. The decay into triplet states was not investigated systematically, howeverthe simple model for spin-orbit mixing in excited state developed in section 2.3 predictsthat for v′=26 and v′=28 roughly a quarter and a third, respectively, of the ground statemolecules are formed in the a3Σ+ state. The measured rate coefficients are thereforeeffective rates for high lying levels of X1Σ+, most likely with a contribution from a3Σ+.Neglecting the triplet contribution for the moment, one finds that the average geometriccross sections of the vibrational levels X1Σ+,v′′ >48, populated by the spontaneous decayfrom v′=26 or v′=28, differ by approximately 40%, where the latter obviously has thelarger cross section. This alone is therefore not sufficient to explain the difference of afactor of two in the observed rates. The role of the triplet contribution or the density oflevels was not investigated yet.
The observed rate coefficients differ by no more than a factor of three from the onesmeasured for Cs2+Cs (Staanum et al., 2006; Zahzam et al., 2006) and RbCs+(Rb/Cs) (Hud-son et al., 2008) collisions at comparable temperatures. This confirms an argument re-cently reintroduced by Paul Julienne (Julienne and Mies, 1989; Julienne, 2009): in mostinelastic collisions in ultracold experiments the probability for an event leading to an ob-servable trap loss is almost unity if two atoms (or molecules) get closer than the rangeof chemical bonding. Therefore the rate coefficient for this loss is only determined bythe probability for the pair of particles to reach such a close distance, which correspondsquantum mechanically to the magnitude of the flux of the scattering wave function whichis not reflected from the long-range part of the van-der-Waals potential. In essence therate coefficient for a collision can thus be accurately estimated from nothing more thanthe C6 coefficient of the interaction potential. For typical alkali dimer-atom collisions thisyields rate coefficients on the order of 10−10 cm3s−1. The validity of this picture was alsovery nicely confirmed in the paper by Hudson et al. (2008) cited above.

7.5. VIBRATIONAL RELAXATION OF GROUND STATE LICS MOLECULES 109
7.5 Vibrational relaxation of ground state LiCs molecules
The molecules detected in the previous section all originated from high lying levels ofthe ground state v′′ ≥48. These levels only have a very small dipole moment of less than0.8 Debye (Aymar and Dulieu, 2005). However after spontaneous decay from B1Π,v′=26around 15% of the ground state molecules are found in levels v′′ <10, which have a sig-nificant dipole moment of 4.6(3) Debye as measured in section 7.1. Figure 7.12 comparesREMPI scans of molecules produced by PA via v′=26,J′=1 in the dipole trap and in thedouble MOT setup. In the dipole trap molecules are formed by 300 ms of PA, then allatoms are removed and the molecules are ionized after typically 100 ms. Some of theresonances observed in the double MOT spectra seem to be missing in the scan from thedipole trap, however the signal-to-noise ratio of the latter measurement is not sufficient tospeculate about differences in the ground state population.
As the ion signal from molecules out of the dipole trap is basically background free,much higher ionization intensities are possible than in the double MOT setup. Figure 7.13shows a REMPI scan at the largest ionization intensity of 350 J/cm2. The differencesto the spectra recorded at low intensity are striking: only few, but much more intensefeatures are visible. Also most of the detected ions are actually Cs+ ions. This indi-cates that at these high intensities the LiCs molecules are first dissociated, followed byionization of the atomic cesium (it was checked that without PA laser no ions are de-
16850 16900 16950 17000 17050 171000
1
2
3
4
Rempi wavelength @cm-1D
Ion
yiel
d@V
nsD
ô
Figure 7.12: REMPI spectra of molecules produced by PA via B1Π,v′=26,J′=1 (blackline), averaged over three scans. For comparison also the corresponding spectrum from thedouble MOT setup is shown (light gray). Both scans are performed at low REMPI intensity(∼ 2 J/cm2). The triangle marks the REMPI position where the scan of figure 7.14 wasperformed.
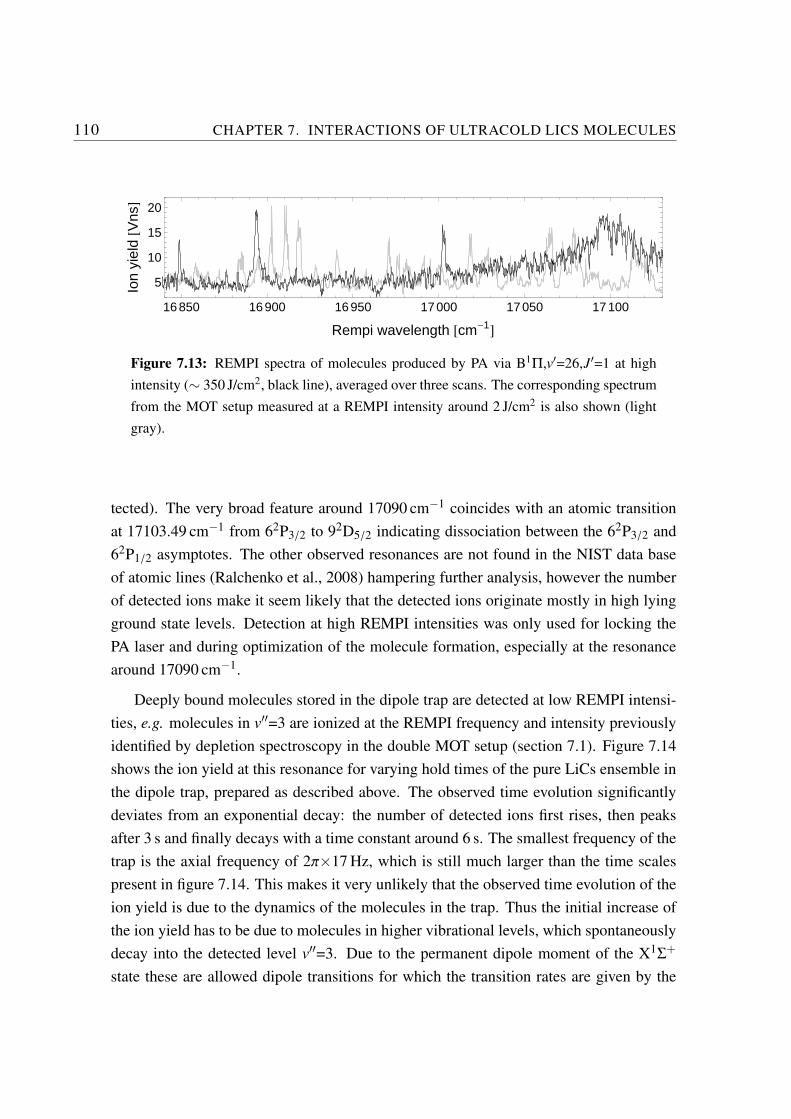
110 CHAPTER 7. INTERACTIONS OF ULTRACOLD LICS MOLECULES
16850 16900 16950 17000 17050 17100
5
10
15
20
Rempi wavelength @cm-1D
Ion
yiel
d@V
nsD
Figure 7.13: REMPI spectra of molecules produced by PA via B1Π,v′=26,J′=1 at highintensity (∼ 350 J/cm2, black line), averaged over three scans. The corresponding spectrumfrom the MOT setup measured at a REMPI intensity around 2 J/cm2 is also shown (lightgray).
tected). The very broad feature around 17090 cm−1 coincides with an atomic transitionat 17103.49 cm−1 from 62P3/2 to 92D5/2 indicating dissociation between the 62P3/2 and62P1/2 asymptotes. The other observed resonances are not found in the NIST data baseof atomic lines (Ralchenko et al., 2008) hampering further analysis, however the numberof detected ions make it seem likely that the detected ions originate mostly in high lyingground state levels. Detection at high REMPI intensities was only used for locking thePA laser and during optimization of the molecule formation, especially at the resonancearound 17090 cm−1.
Deeply bound molecules stored in the dipole trap are detected at low REMPI intensi-ties, e.g. molecules in v′′=3 are ionized at the REMPI frequency and intensity previouslyidentified by depletion spectroscopy in the double MOT setup (section 7.1). Figure 7.14shows the ion yield at this resonance for varying hold times of the pure LiCs ensemble inthe dipole trap, prepared as described above. The observed time evolution significantlydeviates from an exponential decay: the number of detected ions first rises, then peaksafter 3 s and finally decays with a time constant around 6 s. The smallest frequency of thetrap is the axial frequency of 2π×17 Hz, which is still much larger than the time scalespresent in figure 7.14. This makes it very unlikely that the observed time evolution of theion yield is due to the dynamics of the molecules in the trap. Thus the initial increase ofthe ion yield has to be due to molecules in higher vibrational levels, which spontaneouslydecay into the detected level v′′=3. Due to the permanent dipole moment of the X1Σ+
state these are allowed dipole transitions for which the transition rates are given by the
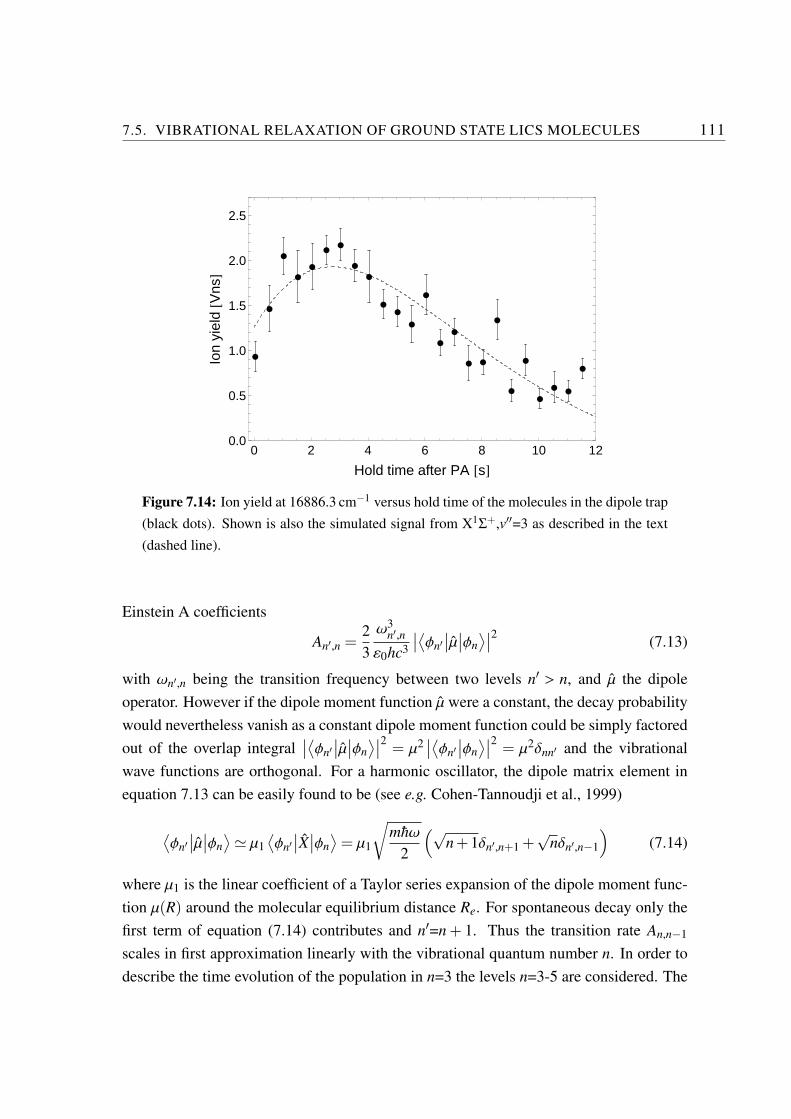
7.5. VIBRATIONAL RELAXATION OF GROUND STATE LICS MOLECULES 111
æ
æ
æ
æ
æ
ææ
æ
æ
æ
æ
æ
æ
æ
æ
æ æ
æ
æ
æ
æ
ææ
æ
0 2 4 6 8 10 120.0
0.5
1.0
1.5
2.0
2.5
Hold time after PA @sD
Ion
yiel
d@V
nsD
Figure 7.14: Ion yield at 16886.3 cm−1 versus hold time of the molecules in the dipole trap(black dots). Shown is also the simulated signal from X1Σ+,v′′=3 as described in the text(dashed line).
Einstein A coefficients
An′,n =23
ω3n′,n
ε0hc3
∣∣⟨φn′∣∣µ∣∣φn
⟩∣∣2 (7.13)
with ωn′,n being the transition frequency between two levels n′ > n, and µ the dipoleoperator. However if the dipole moment function µ were a constant, the decay probabilitywould nevertheless vanish as a constant dipole moment function could be simply factoredout of the overlap integral
∣∣⟨φn′∣∣µ∣∣φn
⟩∣∣2 = µ2∣∣⟨φn′
∣∣φn⟩∣∣2 = µ2δnn′ and the vibrational
wave functions are orthogonal. For a harmonic oscillator, the dipole matrix element inequation 7.13 can be easily found to be (see e.g. Cohen-Tannoudji et al., 1999)
⟨φn′
∣∣µ∣∣φn
⟩' µ1⟨φn′
∣∣X∣∣φn
⟩= µ1
√mhω
2
(√n+1δn′,n+1 +
√nδn′,n−1
)(7.14)
where µ1 is the linear coefficient of a Taylor series expansion of the dipole moment func-tion µ(R) around the molecular equilibrium distance Re. For spontaneous decay only thefirst term of equation (7.14) contributes and n′=n+ 1. Thus the transition rate An,n−1
scales in first approximation linearly with the vibrational quantum number n. In order todescribe the time evolution of the population in n=3 the levels n=3-5 are considered. The
112 CHAPTER 7. INTERACTIONS OF ULTRACOLD LICS MOLECULES
time evolution vn(t) of the population in these levels is then described by the followingrate equations
v3(t) = −A3,2v3(t)+A4,3v4(t)−ΓBC v3(t)
v4(t) = −A4,3v4(t)+A5,4v5(t)−ΓBC v4(t)
v5(t) = −A5,4v5(t)−ΓBC v5(t) (7.15)
where the rate coefficients An′,n = n′A are proportional to n′ (ωn′,n is constant in theharmonic approximation) and ΓBC is the loss rate due to background collisions. Theinitial populations are fixed to the calculated distribution after spontaneous decay fromB1Π,v′=26 and ΓBC is fixed to its value measured for high lying levels (see above), sothe only free parameters are the reduced transition rate A and a scaling factor between thecalculated population and the detector signal. A fit of this model to the data is shown infigure 7.14; the agreement is rather convincing.
Currently an extended model is in preparation, which will include all vibrational andalso rotational levels populated by the PA step and the consecutive radiative decay inthe electronic ground state. The vibrational wave functions and Einstein A coefficientswill be calculated from an experimental potential curve (Staanum et al., 2007) and the R-dependent form of the permanent electric dipole moment (Aymar and Dulieu, 2005). Aspointed out by Vanhaecke and Dulieu (2007), black-body radiation might have a signifi-cant influence on deeply bound LiCs molecules which will be further investigated. Such acomplete model promises to yield a good estimate for the linear dependence µ1 of the per-manent electric dipole moment of the ground state. Together with the measurement of theconstant value µ0 presented in chapter 7.1 this might eventually yield a stringent test forthe ab initio calculation of the electric dipole moment of LiCs in the ground state (Aymarand Dulieu, 2005).

Chapter 8
Conclusion and outlook
In this thesis ultracold alkali dimers were investigated both theoretically and experi-mentally.
In the first, theoretical, part, ab initio calculations of molecular dynamics and structurewere performed. The former focused on the quantitative analysis of the cold molecule for-mation rate in LiCs by photoassociation via the Ω=1 (B1Π) state. Using experimentallydetermined potential energy curves, wherever possible, and realistic experimental param-eters, a photoassociation rate coefficient on the order of 10−10 cm3s−1 for states close tothe asymptote was found. Around 50% of the associated, excited molecules decay intobound ground state molecules, with roughly equal parts in the singlet and triplet system.For deeper bound molecules below v′ ∼30 the probability for decay into the singlet sys-tem raises, below v′ ∼20 more than 90% of the photoassociated molecules decay into theX1Σ+ state. For v′=4 it was predicted that more than 20% of the excited molecules decayinto the lowest vibrational level X1Σ+,v′′=0. However the rate for photoassociation de-creases quickly for deeper bound levels in the Ω=1 (B1Π) state: below v′ ∼24 the singlechannel calculation predicts rate coefficients of less than 10−14 cm3s−1, which are toosmall to be measured experimentally.
The first part was completed by the calculation of the R-dependent static electricdipole polarizability of X1Σ+ and a3Σ+ states of all alkali dimers. This study contin-ued a previous systematic investigation of structural properties of the alkali dimers. Anextensive comparison with other theoretical calculations confirmed the accuracy of thecomputational method. Note that for most species the functional form of the static dipolepolarizability was published here for the first time. The chosen systematic approach al-
113
114 CHAPTER 8. CONCLUSION AND OUTLOOK
lowed the identification of several general trends: e.g. the static polarizability at themolecular equilibrium distance Re was found to depend linear on the effective volumeV = 4πR3
e/3 of the molecule, where the parallel polarization is varying twice as fast as theperpendicular one. This suggested the description of the electronic orbitals at the equi-librium distance as ellipsoidal charge distribution with a ratio of
√2 between major an
minor axis. Also expectation values for average value and anisotropy of the polarizabilitytensor were calculated for all vibrational levels of X1Σ+ and a3Σ+ states. Good agree-ment between the calculation and available experimental values was found. The averagestatic polarizability of molecules in different vibrational levels was found to vary signif-icantly, this is of great relevance for the trapping of ultracold molecules in far detunedoptical dipole traps. Finally previous results on dipole moments and the here calculatedstatic polarizabilities were combined to propose a realistic experimental scheme for thepreparation of an aligned or oriented sample of ultracold alkali dimers.
In the second, experimental, part, the formation and interactions of an ultracold dipo-lar gas of LiCs molecules were investigated. Photoassociation (PA) spectroscopy wasused to complete a previous description of the potential energy curve of the Ω=1 (B1Π)state and to improve the potential energy curve of the X1Σ+ ground state. It is noteworthythat the combination of classical spectroscopy using laser-induced fluorescence and PAspectroscopy yielded a single potential energy curve, which describes accurately the B1Πpotential over the full energy range from v′=0 to the asymptote. In contrast to the predic-tions from the single channel calculation performed in part one, PA was observed for lev-els as deep as v′=0 in the B1Π state. This clearly indicates the importance of perturbationsin the PA step, the observed oscillatory pattern of the PA rate suggest those to occur in thecollisional entrance channel. For the first time, the formation of ultracold LiCs moleculesin the rovibrational ground state was achieved. After PA via v′=4, the formation of polarmolecules in the rovibrational ground state could be detected at a rate of 100 molecules/sat typical atomic densities of 1010 cm−3. Formation rates of up to 5 000 molecules/s inv′′=0, J′′=2 were also observed. These rates can be significantly enhanced by starting outwith denser atomic gases, providing a route for the efficient formation of dense samples ofdipolar molecules without internal excitation. The dipole moment of deeply bound LiCsmolecules was determined by high-resolution spectroscopy in external electric fields. Avalue of 5.5(2) Debye was found which is in very good agreement with theoretical pre-dictions. Furthermore the formation and trapping of LiCs molecules in an optical dipoletrap was demonstrated, rate coefficients for inelastic collisions between LiCs molecules

115
in different states and Cs atoms were determined. In contrast to previous experiments astrong variation of the rate coefficient on the internal state of the molecules was found.Further investigations are necessary to interpret this observation. Finally the vibrationalrelaxation of electronic ground state molecules was directly observed in the optical dipoletrap. A detailed simulation of the decay mechanism will yield a further estimate on thepermanent electric dipole moment of LiCs in the lowest vibrational levels.
Outlook
The structure calculations presented in this thesis neglect spin-orbit interactions.Simple models such as the one employed for the dynamics calculation in chapter 2 assumea constant strength of the spin-orbit interaction. This is a strong assumption, which isnevertheless often justified for large internuclear separations. However, in the short rangethis assumption is generally not valid any more, and one needs to include the relativisticeffects into the structure calculation itself. This is often done by including an effectiveHamiltonian. A disadvantage of this approach is that the effective Hamiltonian has to bespecifically designed for every system under investigation. We recently implemented anapproach to include spin-orbit coupling into the quantum chemistry code CIPSI used atLAC for structure calculations, which will facilitate a systematic calculation of potentialenergy curves and coupling matrix elements for all alkali dimers. The approach is basedon the determination of quasi-diabatic states, which express the molecular orbitals in anatomic basis (Angeli and Persico, 1996). In this representation LCAO is an exact theory,the atomic coupling terms are simply added between the corresponding states in the quasi-diabatic Hamiltonian. Diagonalization then yields the potential energy curves includingspin-orbit interactions. Also coupling matrix elements between Hund’s case a) states canbe extracted by retransformation into the molecular basis. The remaining source of errorin this approach is the quality of the atomic representation by quasi-diabatic states. Angeliand Persico (1996) have applied this method very successfully to the pure van-der-Waalsmolecules NaCd. First results for the dimers Cs2, Rb2, and LiCs acquired here, indicatethat the approach yields reliable results for the long-range behavior of the potential energycurves. The applicability in the region of covalent binding is currently under investigation.For a quantitative analysis of the Cs+LiCs collisions presented in this thesis, an accuratepotential energy surface for the LiCs2 trimer is required. The group in Orsay has recentlystarted to investigated the applicability of the CIPSI approach, which was previously and

116 CHAPTER 8. CONCLUSION AND OUTLOOK
also in this thesis very successfully applied to alkali dimers, to the structure calculationof trimers. The results for the test case Cs3 were found to be very encouraging (Gueroutet al., 2009), as a next step the lowest quartet state of the heteronuclear LiCs2 trimer willbe investigated.
Concerning future perspectives for the experiments presented here in this thesis, thefield seems wide open. The results of this thesis have shown a way to form ultracold polarLiCs molecules in the absolute ground state. The current experimental setup has arguablyreached its limitations, especially with respect to the achievable densities and tempera-tures of the atomic gases. Thus currently a new machine is under construction at the newlocation of the group in Heidelberg, which will produce degenerate gases of ultracoldlithium and cesium atoms. They will provide an excellent starting point for the formationof a dense gas of polar molecules by PA. The improved value for the dissociation energyof the X1Σ+ in 7Li133Cs, determined in this thesis, has helped to improve the predictionof Feshbach resonances in the collision of 7Li and 133Cs atoms (E. Tiemann, 2009, priv.comm.). Several resonances seem to be reachable by moderate magnetic fields, facili-tating the formation of LiCs molecules using magnetoassociation. Depending on thecharacter of these resonances, a coherent transfer of these weakly bound molecules intothe absolute ground state via the B1Π state could be feasible. Either way, the preparationof a dense sample of ultracold LiCs molecules seems within reach. The large permanentelectric dipole moment of LiCs in the ground state, determined experimentally in this the-sis as 4.6 Debye, makes it an ideal candidate for the realization of various proposals forexperiments with ultracold polar molecules:
As already mentioned in the introduction, external electric fields can induce boundstates, so called field-linked states Avdeenkov and Bohn (2003). More generally the in-teraction of the dipole moment with external fields allows to vary collisions in a numberof ways, which can be summarized as controlled chemistry (Krems, 2005). The inelasticand elastic cross sections for collisions of polar molecules can be stronger modified bycanceling the leading dipole-dipole interaction with a suitable combination of static elec-tric and microwave fields. This technique was labeled blue shielding (Gorshkov et al.,2008). A detailed analysis of experimental constraints revealed that only LiCs providesthe required combination of rotational constant and dipole moment to realize this scheme(H. P. Buchler, 2008, priv. comm.). The technique promises to suppress attractive in-teractions and enhance elastic cross sections, facilitating efficient evaporative cooling to-wards quantum degeneracy and the creation of stable three-dimensional crystalline

117
phases (Pupillo et al., 2008a). This strong-coupling regime can also be reached by LiCsmolecules confined in an optical lattice. This allows the construction of a quantumsimulator, i.e. a system designed to represent computationally unsolvable Hamiltoni-ans (Pupillo et al., 2008b). The tunable dipole interactions will make it possible to tunesuch systems through novel quantum phase-transitions (Menotti et al., 2007).

118 CHAPTER 8. CONCLUSION AND OUTLOOK

Appendix A
Potential energy curve of the B1Π state
In this appendix an improved potential energy curve for the B1Π state is presented: itwas found as best fit to the combined data from the PA measurements shown in section 5.2and published data (Stein et al., 2008). For intermediate R the potential is defined by a setof grid points connected by a cubic spline function. For the long range region (R > Rout)this form is smoothly extended by the widely accepted asymptotic form:
ULR(R) = U∞ − C6
R6 − C8
R8 − C10
R10 . (A.1)
Here U∞ is the energy of the atomic asymptote with respect to the minimum of theX1Σ+ state potential, i.e. the sum of the ground state dissociation energy plus the fre-quency of the Cs 6s2S1/2 → 6p2P3/2 transition without the hyperfine structure (11732.307cm−1 Gerginov et al. (2004)). In this way, similarly to the ground state potential, the cen-ter of gravity for the excited asymptote Li(2s2S1/2)+Cs(6p2P3/2) is taken for the dissoci-ation limit of the B state. The parameters C6, C8 and C10 are the conventional dispersioncoefficients. In the work by Stein et al. (2008) the dispersion coefficients were kept fixedto the calculated values from reference (Marinescu and Sadeghpour, 1999), because theexperimental data were not sufficiently close to the asymptote for the determination of theshape of the long range potential. This is different for the data from the PA: the outer clas-sical turning point of the highest observed level (v′=35, J′=2) is at about 22 A, thereforeone should consider the possibility to fit also the dispersion coefficients. The theoreticalcoefficients were calculated actually without considering the spin-orbit coupling, so theyare Hund’s case (a) coefficients instead of Hund’s case (c) which is considered in thisanalysis. U∞ was always fixed to the calculated value 17607.849 cm−1.
119

120 APPENDIX A. POTENTIAL ENERGY CURVE OF THE B1Π STATE
In table A.1 the final potential for the B1Π (Ω= 1) state is presented. It reproduces theexperimental data with a standard deviation of 0.0065 cm−1 and a dimensionless standarddeviation of 0.67. In order to interpolate within the grid points one must connect allpoints from the table with a natural cubic spline (i.e. with second derivatives set to zeroin the first and the last points of the total grid in the table). For R > 12.14968 A the longrange expression (A.1) is valid with the coefficients from the same table. The value ofthe leading term C6 is changed by only 3% (4.26×107 cm−1A6 from the value given byMarinescu and Sadeghpour (1999)), however C8 is about 4 times larger than the calculatedvalue (2.55×108 cm−1A8) from the same reference. As already stated, the theoreticalcoefficients are calculated under different assumptions, therefore a direct comparison isnot justified here.
R [A] U [cm−1] R [A] U [cm−1] R [A] U [cm−1]2.60000 24810.7730 4.35282 16060.3152 7.77846 17379.51872.71429 22610.9559 4.52410 16137.5679 8.12103 17431.58892.82857 20968.4969 4.69538 16231.5682 8.46359 17471.07232.94286 19725.3101 4.86667 16331.4748 8.80615 17500.85673.05714 18782.5718 5.03795 16430.8699 9.14800 17523.27253.17143 18022.1045 5.38051 16615.0586 9.91200 17556.24813.28571 17474.1878 5.72308 16774.1470 10.68400 17575.28553.40000 17026.8091 6.06564 16910.4414 11.45600 17586.55523.53923 16611.1252 6.40820 17029.1861 12.22800 17593.58993.66769 16342.5072 6.75077 17135.1496 13.00000 17597.97413.83897 16124.0377 7.09333 17230.1708 14.00000 17601.58724.01026 16027.2807 7.43590 17312.4809 15.00000 17603.70974.18154 16015.9798
Rout= 12.14968 A; U∞=17607.849 cm−1; C6=4.3905·107 cm−1 A6
C8=9.73726·108 cm−1 A8; C10=-6.098115·1010 cm−1 A10
Table A.1: Pointwise potential energy curve for the B1Π state of 7Li133Cs with respect tothe bottom of the ground state potential. This curve is based on the f -parity levels. Detailsare given in (Stein et al., 2008).
Appendix B
Dark SPOT for Cs
In this appendix, the new dark spontaneous force optical trap (dark SPOT) (Ketterleet al., 1993) for cesium shall be discussed in more detail. A dark SPOT is very similarto a MOT, but while in a MOT all atoms are exposed to trapping and repumping light atthe same time, in a dark SPOT the central part of the trap is shielded from the repumpinglight. Therefore already trapped atoms are rapidly pumped into the dark state. This hasseveral consequences, most importantly an increase of the density of the trapped atomsample; the ultimate density-limiting factor in both MOT and dark SPOT setups is there-absorption of spontaneously emitted photons, inducing an additional heating and a netpressure towards the outside of the trap. Keeping a large fraction of the atoms in the darkstate reduces the intensity of spontaneously emitted photons and allows for an increaseof density by typically one order of magnitude (Haimberger et al., 2004; Kerman et al.,2004; Wang et al., 2005). As already mentioned in section 4.1, the main advantage in thecurrent setup is the reduction of losses caused by interspecies collisions.
All details about the experimental realization of the dark SPOT for Cs have beensummarized in the diploma thesis of Christian Gluck (Gluck, 2008), therefore only themain results shall be recalled here. In a ’pure’ dark SPOT setup, the transfer into thedark state occurs via off-resonant excitation of hyperfine components which can decayout of the closed two-level cooling transition. For cesium the large hyperfine splitting atthe excited Cs(6P3/2) asymptote causes the off-resonant excitation rate to be very small.For keeping a high fraction of the atoms in the dark state, an additional laser is necessarywhich acts as depumper. The level scheme of Cs with the relevant transitions is shown infigure B.1. Additionally the dark state fraction (fraction of atoms in the dark state) can be
121

122 APPENDIX B. DARK SPOT FOR CS
Figure B.1: Schematic level scheme of Cs with the relevant transitions for cooling, re-pumping and depumping.
increased by detuning the repumping laser. This configuration is called a detuned forceddark SPOT.Especially in the case of a forced dark SPOT it is important to achieve a verygood suppression of the repumping light in the center of the trap. Residual repumpinglight can together with the depumping light drive a cyclic transition leading to additionalheating of the sample. A high opacity of the material used for the spot is therefore crucial 1
as well as an accurate imaging of the shadow onto the trap center. For all three repumpingbeams (two for the trap, one for the Zeeman slower) the extinction ratio of the spot waschecked beforehand by scanning a pinhole and a power meter through the beam. FigureB.2 shows an exemplary result of the measurements.
Further complications arise from the loading scheme of our setup, in which the atomsare loaded from an evaporation oven through a Zeeman slower. The beam for the Zeemanslowing contains both slowing and repumping light. The two beams are already superim-posed in front of the fiber which transfers the Zeeman beam to the experiment table, sothey cannot be blocked separately. Hence the spot in the Zeeman slowing beam not onlyblocks the repumping light, but creates a cigar shaped hole 2 in the Zeeman slowing beam,thereby decreasing the loading efficiency. However it turns out that the reduced loadingis more than compensated by the reduced loss rates due to collisions involving excited Cs
1. It turned out that the best extinction ratio of 1:104 at the trap position was obtained by using theplastic from the protective slider of an old floppy disk.
2. The Rayleigh range of the imaging focus is a few centimeters.

123
Figure B.2: Exemplary result of the extinction measurements. Shown are beam profiles,measured by scanning a pinhole through the beam at the position of the trap. The blackcurve is a measurement without the spot, the red curve is the same measurement with thespot imaged onto the trap plane. Inset: image of the shadow on a CCD chip at the trapposition.
atoms.
The different parameters for the dark SPOT setup were determined experimentally byfinding the best compromise between a maximum number of trapped atoms, a maximumfraction of atoms in the dark state, fast loading of the trap, and a high atomic density.A combination of fluorescence detection for fast, sensitive measurements and absorptionimaging for calibration of the fluorescence photo diode as well as density and temperaturemeasurements was used. The fraction of atoms in the dark state is measured by comparingfluorescence values from the dark spot with the fluorescence level after pumping all atomsbright with an additional fill-in laser. We also use absorption imaging (again comparingabsorption by bright atoms in the dark SPOT with absorbtion after all atoms had beenpumped bright) and find good agreement between both methods, however the absorptionmeasurement is less accurate for large dark state fractions, as the small number of atoms inthe bright state is more difficult to detect in absorption than in fluorescence. The relevantparameters for the dark SPOT and their optimal values are reported in the following:
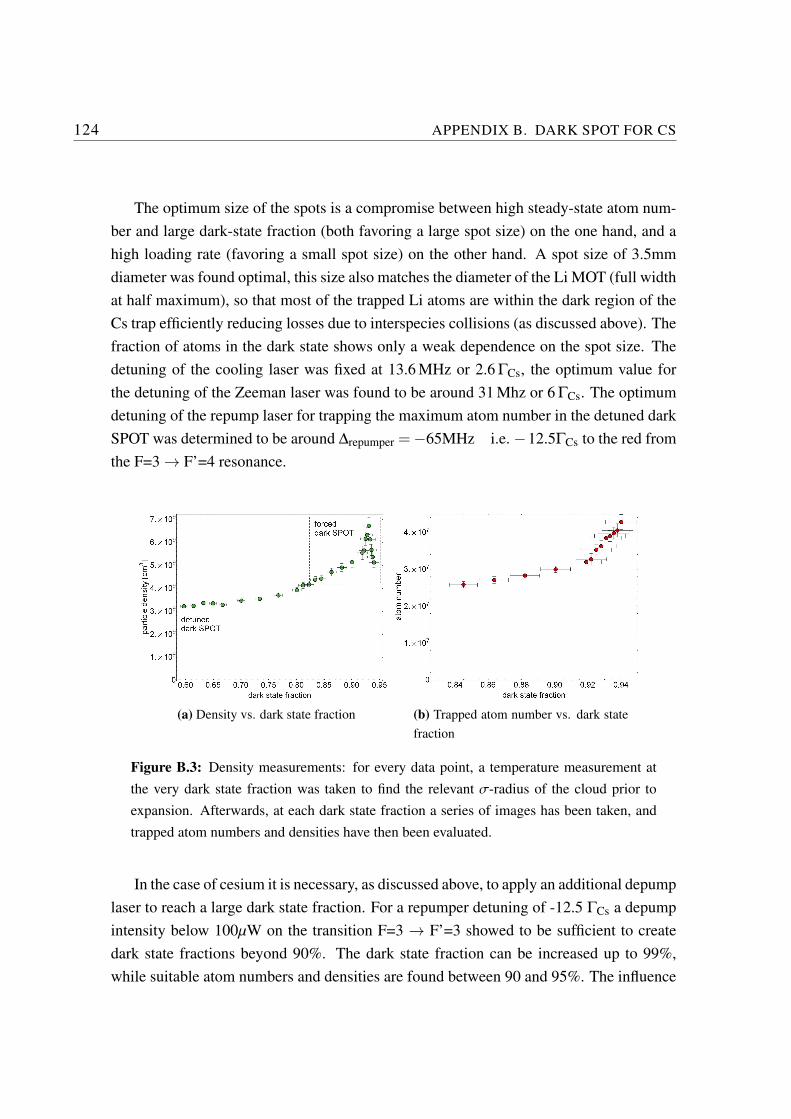
124 APPENDIX B. DARK SPOT FOR CS
The optimum size of the spots is a compromise between high steady-state atom num-ber and large dark-state fraction (both favoring a large spot size) on the one hand, and ahigh loading rate (favoring a small spot size) on the other hand. A spot size of 3.5mmdiameter was found optimal, this size also matches the diameter of the Li MOT (full widthat half maximum), so that most of the trapped Li atoms are within the dark region of theCs trap efficiently reducing losses due to interspecies collisions (as discussed above). Thefraction of atoms in the dark state shows only a weak dependence on the spot size. Thedetuning of the cooling laser was fixed at 13.6 MHz or 2.6 ΓCs, the optimum value forthe detuning of the Zeeman laser was found to be around 31 Mhz or 6 ΓCs. The optimumdetuning of the repump laser for trapping the maximum atom number in the detuned darkSPOT was determined to be around ∆repumper =−65MHz i.e. −12.5ΓCs to the red fromthe F=3 → F’=4 resonance.
(a) Density vs. dark state fraction (b) Trapped atom number vs. dark statefraction
Figure B.3: Density measurements: for every data point, a temperature measurement atthe very dark state fraction was taken to find the relevant σ-radius of the cloud prior toexpansion. Afterwards, at each dark state fraction a series of images has been taken, andtrapped atom numbers and densities have then been evaluated.
In the case of cesium it is necessary, as discussed above, to apply an additional depumplaser to reach a large dark state fraction. For a repumper detuning of -12.5 ΓCs a depumpintensity below 100µW on the transition F=3 → F’=3 showed to be sufficient to createdark state fractions beyond 90%. The dark state fraction can be increased up to 99%,while suitable atom numbers and densities are found between 90 and 95%. The influence

125
of the dark-state fraction on the atomic density and the number of trapped atoms is shownin figure B.3. Under varying experimental conditions, the depumping intensity is opti-mized on-line by maximizing the number of atoms in the trap, which leads to a somewhatreduced density. Typically a dark-state fractions of 95% was achieved. Due to the verylow required depumping intensities, and due to the large deviations of the dark state frac-tion caused by intensity drifts of the depumper laser, the intensity of the depumper laseris stabilized via a servo loop using a photodiode, which picks up some of the laser lightin front of the chamber, and an acusto-optic modulator in front of the fiber to control thelaser power.
As mentioned above, the depumping of the atoms into the dark state heats the trapsince a second closed cycle with the repumping light is formed, both at the outer surfaceof the dark region in the trap and in the trap center through residual repumping light.Figure B.4 shows a measurement of the caused heating. Already the Cs MOT is relativelyhot, in particular its temperature does not fall below the Doppler limit. Based on theseconditions, the temperatures in the dark SPOT are as well not as cold as reported by othergroups.
Figure B.4: Heating of the trap due to depumping of the trapped atoms

126 APPENDIX B. DARK SPOT FOR CS
Appendix C
Setup for depletion spectroscopy ofground state molecules
This appendix presents the optical setup for the narrow band cw dye laser as describedin section 4.4. Figure C.1 illustrates the scheme for frequency stabilization of the laser. Ina first step the laser is stabilized to an optical transfer cavity (resonator 2). The mirrors ofthis cavity have a combined broadband coating for 450-700 nm and 852 nm with a partialreflectivity of ∼95%. The resulting line widths of the cavity modes are on the order of20 MHz, matched to the requirements of monitoring coarse scans and easy locking. Theerror signal is created by a Pound-Drever-Hall setup (Drever et al., 1983), where the lightfrom the laser is frequency modulated at ∼10 MHz using an electro-optical modulator(EOM). The error signal is fed back to the laser via the external scan input of its controller.The length of the transfer cavity is regulated by a piezo actuator, it is stabilized to areference laser using another Pound-Drever-Hall setup. Again the light from the referencelaser is frequency modulated at ∼10 MHz, the error signal is fed back to the piezo actuatorthrough a high-voltage amplifier. The reference laser is a diode laser running at 852.3 nm,it is stabilized to the cesium master laser via a frequency-offset lock. Note that the samereference laser is used for the frequency stabilization of the Ti:Sa laser. In order to be ableto lock Ti:Sa and cw dye laser independently at arbitrary frequencies, an acusto-opticalmodulator (AOM) in double-pass configuration was added to the lock branch of the cwdye laser acting as frequency shifter (tuning range ∼450 MHz) (figure C.2). In order tomaintain a stable lock over the full frequency range of the AOM (with varying diffractionefficiency), an automatic gain control based on an Analog devices AD734 divider circuit
127

128 APPENDIX C. SETUP FOR DEPLETION SPECTROSCOPY
Figure C.1: Optical and electronic setup for the frequency stabilization of the cw dyelaser. The shown EOMs are used to modulate the frequency of the passing light with afunction generator (sine waves around 10 MHz). The phase-angle between the modulatingsignal and the intensity variation after the resonator, detected with fast PDs, is measuredwith phase detectors (Mini-Circuits ZRPD-1). The low-frequency component (<100 kHz)of this signal is used for stabilizing first the length of the resonator to the diode laser, andthen to stabilize the frequency of the cw dye laser to a fringe of the resonator.
was added to the PID control loop.For some experiments it was necessary to stabilize the intensity of the depletion laser:
the intensity at the experimental table was monitored in front of the chamber with a beamsampler (a 50-50 splitter) and a photodiode. The signal from the photodiode was fedinto a PID controller, the control signal was applied to an intensity modulating EOM infront of the fiber via a high-voltage amplifier. The total bandwidth of the lock circuit wasestimated from lock-in measurements to be around 70 kHz.

129
Figure C.2: Optical setup for the combined frequency stabilization of Ti:Sa resonator andcw dye laser. The diode laser is stabilized to an atomic resonance (not shown) and is thereference frequency for the length stabilization of both resonators 1 and 2. The AOM in thepath of the cw dye laser beam allows to lock dye laser and Ti:Sa resonator to completelyindependent frequencies. The stabilization of the dye laser intensity at the experiment re-quires additional components (marked in green): an EOM and a polarizer in front of thefiber to the experiment and at PD after the fiber. Electronics components for frequency andintensity stabilization are not shown.

130 APPENDIX C. SETUP FOR DEPLETION SPECTROSCOPY

Appendix D
Experimental control
This appendix describes the modifications to the experimental controls described in(Engler, 2000) and (Lange, 2007). The former control system is based on an ADwincard from Jager Messtechnik, Lorsch. It provides several analog and digital input andoutput channels, which can be read or set with a time resolution of 100 µs. While thissystem is ideally suited for timing complex sequences for absorption images or operationof the dipole trap (chapter 7), it was not extendable enough for including scan controland data acquisition from three spectroscopy lasers (Ti:Sa oscillator for photoassociation,pulsed dye laser for ionization and detection, cw dye laser for depletion spectroscopy),readout of two wavemeters (for Ti:Sa and cw dye), and readout of an oscilloscope fortime-of-flight traces or of a counter for ion counting. All these tasks were performed bya new scan control software realized in LabView 7.1 (National Instruments), interfacingthe hardware via a NationalInstruments USB-2009 DAQ card, an 8-port RS-232 expandercard and DataSocket (National Instruments) network connections. The operation of thiscontrol system was described already by Lange (2007).
For the experiments with the optical dipole trap presented in chapter 7, the two ex-perimental control systems were merged using a DataSocket (NationalInstruments) basedprotocol. The main scan control is still performed by the new setup, it now additional trig-gers the run of an experimental cycle through the old scan control. The communicationprotocol is designed fault-tolerant, so that all recorded sequences can be unambiguouslyassigned to a given parameter set.
131

132 APPENDIX D. EXPERIMENTAL CONTROL
D.1 Timing sequences for transfer
A full timing sequence for combined transfer, PA and REMPI detection of LiCsmolecules through the old experimental control solution is shown in figure D.1. Thenumbered channels <39 are digital output channels, the channels with numbers ≥39 areanalog output channels.
I II III IV
0.0 0.2 0.4 0.6 0.8 1.0 1.2
0: Dye shutter opener2: Dye shutter closer
3: MOT field5: Field plates
7: Cs Zeeman D8: Cs Zeeman A
11: Atom beam shutter12: Li-A EOM13: Li-B EOM
15: Cleaning shutter16: Li RF freq AOM A17: Li RF freq AOM B
18: Li RF ampl AOM Z19: Shutter TiSa
21: Cs-H depumper AOM22: Cs-F detuning
26: CO2-Laser 10027: Cs shutter A28: Cs shutter F34: Shutter Li-A35: Shutter Li-B
37: Zeeman fields39: MOT B-field ana
40: z-field ana41: x-field ana45: y-field ana
Time @sD
Cha
nnel
Figure D.1: Experimental timings for combined transfer, PA and REMPI detection of LiCsmolecules. Marked are: (I) cesium molasses phase and transfer, (II) lithium compressedMOT phase and transfer, (III) additional cesium molasses pulse after lithium transfer, (IV)cleaning pulses removing lithium and cesium atoms from the trap, ionization and detection.The red lines in front of sequences (I) and (II) indicated times, where the sequence is puton hold until the atomic fluorescence has reached a given threshold.

D.2. TWO FREQUENCY AOM DRIVER 133
D.2 Two frequency AOM driver
The experimental control of the CO2 laser was modified as described in chapter 7.2.Previously the control input of the laser controller was used to switch the laser between80% and 100% of the maximum power. For adjustments of the beam pointing the powerwas further reduced using the control input of the AOM. As noted by Mudrich (2003),this lead to strong drifts in the beam pointing due to varying thermal effects in the AOM.As a solution the rf power fed into the AOM was kept constant, but it was decomposedinto two frequencies: the “active frequency” which was used for diffraction of the laserlight towards the experiment, and the “passive frequency” which was mostly absorbed bythe AOM crystal without leading to diffraction. These two frequency components wereprepared using MiniCircuits components, as shown in figure D.2. The circuits shown infigure D.3 were built to provide suitable control voltages and currents for the MiniCircuitcomponents. Using a TTL signal, the available laser power at the experiment can beswitched between two preset levels while the total rf power fed to the AOM remainsconstant.
Figure D.2: Block diagram of the circuit for feeding two frequencies with variable powersto the AOM. The frequency of the two voltage-controlled Oscillators (VCO) is set by con-trol voltages Vctrl,1/2, the power is regulated by two attenuators (ATT) which are regulatedthrough currents Ictrl,1/2. The two rf signals are then mixed and amplified to a level of up to50 W. The last step is still performed by the original AOM driver (IntraAction GE-4050),all other components are standard parts from MiniCircuits.

134 APPENDIX D. EXPERIMENTAL CONTROL
Figure D.3: Schematics for the circuits, which provide the control voltages and currentsfor the MiniCircuits components shown in figure D.2.

Bibliography
AIP (2009). The top ten physics news stories of 2008. Online athttp://www.aip.org/pnu/2008/split/879-1.html.
Ambjornsson, T. and Apell, S. P. (2003). Ellipsoidal particles driven by intensity gradientsthrough viscous fluids. Phys. Rev. E, 67:031917.
Amiot, C. (1991). The X1Σ+g electronic state of K2. J. Molec. Spect., 147:370.
Amiot, C. and Dulieu, O. (2002). The Cs2 ground state by fourier transform spectroscopy:dispersion coefficients. J. Chem. Phys., 117:5155.
Anderson, B. P. and Kasevich, M. A. (2001). Loading a vapor-cell magneto-optic trapusing light-induced atom desorption. Phys. Rev. A, 63:023404.
Angeli, C. and Persico, M. (1996). Quasi-diabatic and adiabatic states and potential en-ergy curves for Na-Cd collisions and excimer formation. Chem. Phys., 204(1):57–64.
Antoine, R., Rayane, D., Allouche, A. R., Aubert-Frecon, M., Benichou, E., Dalby, F. W.,Dugourd, P., Broyer, M., and Guet, C. (1999). Static dipole polarizability of smallmixed sodium–lithium clusters. J. Chem. Phys., 110:5568.
Apell, S. P., Sabin, J. R., Trickey, S. B., and Oddershede, J. (2002). Shape-dependentmolecular polarizabilities. Intern. J. Quantum Chem., 86:35.
Avdeenkov, A. V. and Bohn, J. L. (2003). Linking ultracold polar molecules. Phys. Rev.Lett., 90:043006.
Aymar, M. and Dulieu, O. (2005). Calcutation of accurate permanent dipole momentsof the lowest 1,3Σ+ states of heteronuclear alkali dimers using extended basis sets. J.Chem. Phys., 122:204302.
135

136 BIBLIOGRAPHY
Aymar, M., Dulieu, O., and Spiegelman, F. (2006). Electronic properties of franciumdiatomic compounds and prospects for cold molecule formation. J. Phys. B, 39:S905.
Azizi, S., Aymar, M., and Dulieu, O. (2004). Prospects for the formation of ultracoldground state polar molecules from mixed alkali atom pairs. Eur. Phys. J. D, 31:195–203.
Azizi, S., Aymar, M., and Dulieu, O. (2007). Electronic structure of alkali polar ions. AIPConf. Proc., 935:164.
Babaky, O. and Hussein, K. (1988). The ground state 1XΣ+g of Na2. Can. J. Phys., 67:912.
Barakat, B., Bacis, R., Carrot, F., Churassy, S., Crozet, P., Martin, F., and Verges, J.(1986). Extensive analysis of the X1Σ+
g ground state of 7Li2 by laser-induced fluores-cence fourier transform spectrometry. Chem. Phys., 102:215.
Bellomonte, L., Cavaliere, P., and Ferrante, G. (1974). Alkali molecular ion energies andexpectation values in a model-potential treatment. J. Chem. Phys., 61:3225.
Bergeman, T., Julienne, P. S., Williams, C. J., Tiesinga, E., Manaa, M. R., Wang, H.,Gould, P. L., and Stwalley, W. C. (2002). Predissociation and 0+u and 1g states of K2.J. Chem. Phys., 117.
Bishop, D. M., Chaillet, M., Larrieu, C., and Pouchan, C. (1985). Charge perturbationapproach to the calculation of molecular polarizabilities: Application to Li2. Phys. Rev.A, 31:2785.
Bishop, D. M. and Kirtma, B. (1991). A perturbation method for calculating vibrationaldynamic dipole polarizabilities and hyperpolarizabilities. J. Chem. Phys., 95:2646.
Bishop, D. M. and Pouchan, C. (1984). The static dipole polarizabilities of the lithiumdimer, its cation and anion. J. Chem. Phys., 80:789.
Bohn, J. (2009). Ode to cold molecules. Online at http://jilawww.colorado.edu/cocomo/.
Bonsch, G. and Potulski, E. (1998). Measurement of the refractive index of air and com-parison with modified edlen’s formulae. Metrologia, 35:133.
Brinck, T., Murray, J. S., and Politzer, P. (1993). Polarizability and volume. J. Chem.Phys., 98:4305.
BIBLIOGRAPHY 137
Caldwell, C. D., Engelke, F., and Hage, H. (1980). High-resolution spectroscopy in su-personic nozzle beams - the Rb2 B1Πu - X1Σ+
g band system. Chem. Phys., 54:21.
Carr, L. D., DeMille, D., Krems, R. V., and Ye, J. (2009). Cold and ultracold molecules:science, technology and applications. New Journal of Physics, 11(5):055049 (87pp).
Chandrakumar, K. R. S., Ghanty, T. K., and Ghosh, S. K. (2004). Static dipole polariz-ability and binding energy of sodium clusters Nan (n = 1-10): A critical assessment ofall-electron based post Hartree-fock and density functional methods. J. Chem. Phys.,120:6487.
Chin, C., Flambaum, V. V., and Kozlov, M. G. (2009). Ultracold molecules: new probeson the variation of fundamental constants. New Journal of Physics, 11(5):055048(14pp).
Cohen, H. D. and Roothaan, C. C. J. (1965). Electric dipole polarizability of atoms by theHartree-Fock method. I. Theory for closed-shell systems. J. Chem. Phys., 43:S34.
Cohen-Tannoudji, C., Diu, B., and Laloe, F. (1999). Quantenmechanik, Tl.1. de Gruyter,Berlin.
Danzl, J. G., Haller, E., Gustavsson, M., Mark, M. J., Hart, R., Bouloufa, N., Dulieu,O., Ritsch, H., and Nagerl, H.-C. (2008). Quantum gas of deeply bound ground statemolecules. Science, 321:1062.
Deiglmayr, J. (2006). Coherent excitation of an ultracold gas of Rydberg atoms. Diplomathesis, Physikalisches Institut, Universitat Freiburg.
Deiglmayr, J., Aymar, M., Wester, R., Weidemuller, M., and Dulieu, O. (2008a). Cal-culations of static dipole polarizabilities of alkali dimers: Prospects for alignment ofultracold molecules. J. Chem. Phys., 129:064309.
Deiglmayr, J., Grochola, A., Repp, M., Mortlbauer, K., Gluck, C., Lange, J., Dulieu, O.,Wester, R., and Weidemuller, M. (2008b). Formation of ultracold polar molecules inthe rovibrational ground state. Phys. Rev. Lett., 101:133004.
Deiglmayr, J., Pellegrini, P., Grochola, A., Repp, M., Cote, R., Dulieu, O., Wester, R., andWeidemuller, M. (2009a). Influence of a feshbach resonance on the photoassociationof LiCs. New Journal of Physics, 11(5):055034.

138 BIBLIOGRAPHY
Deiglmayr, J., Repp, M., Grochola, A., Mortlbauer, K., Gluck, C., Lange, J., Dulieu, O.,Wester, R., and Weidemuller, M. (2009b). Formation of ultracold dipolar molecules inthe lowest vibrational levels by photoassociation. Faraday Discussions, 142:335.
DeMille, D. (2002). Quantum computation with trapped polar molecules. Phys. Rev.Lett., 88:067901.
DeMille, D., Bay, F., Bickman, S., Kawall, D., Krause, D., Maxwell, S. E., and Hunter,L. R. (2000). Investigation of PbO as a system for measuring the electric dipole momentof the electron. Phys. Rev. A, 61(5):052507.
Derevianko, A., Johnson, W. R., Safronova, M. S., and Babb, J. F. (1999). High-precisioncalculations of dispersion coefficients, static dipole polarizabilities, and atom-wall in-teraction constants for alkali-metal atoms. Phys. Rev. Lett., 82(18):3589.
Diemer, U., Weickenmeier, H., Wahl, M., and Demtroder, W. (1984). Sub-doppler spec-troscopy of the NaCs molecule. Chem. Phys. Lett., 104:489.
Doyle, J., Friedrich, B., Krems, R. V., and Masnou-Seeuws, F. (2004). Editorial: Quovadis, cold molecules? The European Physical Journal D - Atomic, Molecular andOptical Physics, 31(2):149–164.
Drag, C., Tolra, B. L., Dulieu, O., Comparat, D., Vatasescu, M., Boussen, S., Guibal,S., Crubellier, A., and Pillet, P. (2000a). Experimental versus theoretical rates forphotoassociation and for formation of ultracold molecules. IEEE J. Quantum Electron.,36:1378.
Drag, C., Tolra, B. L., T’Jampens, B., Comparat, D., Allegrini, M., Crubellier, A., andPillet, P. (2000b). Photoassociative spectroscopy as a self-sufficient tool for the deter-mination of the Cs triplet scattering length. Phys. Rev. Lett., 85:1408.
Drever, R., Hall, J., Kowalski, F., Hough, J., Ford, G., Munley, A., and Ward, H. (1983).Laser phase and frequency stabilization using an optical resonator. Appl. Phys. B,31:97–105.
Dulieu, O. and Gabbanini, C. (2009). The formation and interactions of cold and ultra-cold molecules: new challenges for interdisciplinary physics. Reports on Progress inPhysics, 72(8):086401.

BIBLIOGRAPHY 139
Dulieu, O. and Julienne, P. S. (1995). Coupled channel bound states calculations for alkalidimers using the fourier grid method. J. Chem. Phys., 103:60.
Durand, P. and Barthelat, J. (1974). New atomic pseudopotentials for electronic structurecalculations of molecules and solids. Chem. Phys. Lett., 27:191.
Durand, P. and Barthelat, J. (1975). A theoretical method to determine atomic pseudopo-tentials for electronic structure calculations of molecules and solids. Theor. chim. Acta,38:283.
Ekstrom, C. R., Schmiedmayer, J., Chapman, M. S., Hammond, T. D., and Pritchard,D. E. (1995). Measurement of the electric polarizability of sodium with an atom inter-ferometer. Phys. Rev. A, 51:3883.
Engelke, F., Ennen, G., and Meiwes, K. H. (1982). Laser induced fluorescence spec-troscopy of NaLi in beam and bulk. Chem. Phys., 66:391.
Engelke, F., Hage, H., and Schuhle, U. (1984a). The K2 B1Πu-X1Σ+g band system
- crossed laser molecular-beam spectroscopy using doppler-free 2-photon ionization.Chem. Phys. Lett., 106:535.
Engelke, F., Hage, H., and Sprick, U. (1984b). The B1Π-X1Σ+ system of 39K6Li and39K7Li: high-resolution laser excitation and fluorescence spectroscopy. Chem. Phys.,88:443.
Engler, H. (1997). Aufbau eines Zeeman-Abbremsers und Inbetriebnahme einer mag-netooptischen Falle fur Lithium-Atome. Master’s thesis, Ruprecht-Karls-UniversitatHeidelberg.
Engler, H. (2000). A quasi-electrostatic trap for neutral atoms. PhD thesis, Max-Planck-Institut fur Kernphysik Heidelberg.
Ferber, R., Klincare, I., Nikolayeva, O., Tamanis, M., Knockel, H., Tiemann, E., andPashov, A. (2009). Ground electronic state of KCs studied by fourier transform spec-troscop. Phys. Rev. A, in press.
Fioretti, A., Comparat, D., Crubellier, A., Dulieu, O., Masnou-Seeuws, F., and Pillet, P.(1998). Formation of Cold Cs2 Molecules through Photoassociasion. Phys. Rev Lett.,80:4402.

140 BIBLIOGRAPHY
Foucrault, M., Millie, P., and Daudey, J. (1992). Nonpertubative method for core-valencecorrelation in pseudopotential. J. Chem. Phys., 96:1257.
Fraser, G. W. (2002). The ion detection efficiency of microchannel plates (MCPs). Int. J.Mass Spect., 215:13–30.
Friedrich, B. (2000). Slowing of supersonically cooled atoms and molecules by time-varying nonresonant induced dipole forces. Phys. Rev. A, 61:025403.
Friedrich, B. and Doyle, J. M. (2009). Why are Cold Molecules so Hot? Chem. Phy.Phys. Chem., 10(4):604–623.
Friedrich, B. and Herschbach, D. (1999a). Enhanced orientation of polar moleculesby combined electrostatic and nonresonant induced dipole forces. J. Chem. Phys.,111:6157.
Friedrich, B. and Herschbach, D. (1999b). Manipulating molecules via combined staticand laser fields. J. Phys. Chem. A, 103:10280.
Friedrich, B., Nahler, N. H., and Buck, U. (2003). The pseudo-first-order stark effect andthe orientation of HXeI molecules. J. Mod. Opt., 50:2677.
Gehm, M. E. (2003). Preparation of an Optically-Trapped Degenerate Fermi Gas of6Li: Finding the Route to Degeneracy. PhD thesis, Duke University, Durham, NorthCarolina, USA.
Gerginov, V., Tanner, C., Diddams, S., Bartels, A., and Hollberg, L. (2004). Opticalfrequency measurements of the 6s2S1/2 - 6p2P3/2 transition in a 133Cs atomic beamusing a femtosecond laser frequency comb. Phys. Rev. A, 70:042505.
Giese, C. (2006). Resonance Enhanced Multiphoton Ionization Spectroscopy on ultracoldCs2. Master’s thesis, Albert-Ludwigs-Universitat Freiburg.
Gilijamse, J. J., Hoekstra, S., van de Meerakker, S. Y. T., Groenenboom, G. C., andMeijer, G. (2006). Near-threshold inelastic collisions using molecular beams with atunable velocity. Science, 313(5793):1617–1620.
Gluck, C. (2008). Quenching of light-assisted collisions in an optical two-species atomtrap. Diploma thesis, Albert-Ludwigs-Universitat Freiburg.
BIBLIOGRAPHY 141
Gonzalez-Ferez, R., Mayle, M., and Schmelcher, P. (2006). Rovibrational dynamics ofLiCs dimers in strong electric fields. Chemical Physics, 329(1-3):203–215.
Gonzalez-Ferez, R., Weidemuller, M., and Schmelcher, P. (2007). Photoassociation ofcold heteronuclear dimers in static electric fields. Phys. Rev. A, 76(2):023402–9.
Gorshkov, A. V., Rabl, P., Pupillo, G., Micheli, A., Zoller, P., Lukin, M. D., and Buchler,H. P. (2008). Suppression of inelastic collisions between polar molecules with a repul-sive shield. Phys. Rev. Lett., 101:073201.
Gough, K. M. (1989). Theoretical analysis of molecular polarizabilities and polarizabilityderivatives in hydrocarbons. J. Chem. Phys., 91:2424.
Graff, J., Dagdigian, P., and Wharton, L. (1972). Electric resonance spectrum of NaLi. J.Chem. Phys., 57:710.
Grimm, R., Weidemuller, M., and Ovchinnikov, Y. B. (2000). Optical dipole traps forneutral atoms. In Bederson, B. and Walther, H., editors, Advances in Atomic, Molecularand Optical Physics, volume 42, page 95. Academic Press, San Diego.
Grochola, A., Pashov, A., Deiglmayr, J., Repp, M., Tiemann, E., Wester, R., and Wei-demuller, M. (2009). The B1Π state in LiCs studied by photoassociation spectroscopy.J. Chem. Phys., 131:054304.
Guerout, R., Soldan, P., Aymar, M., Deiglmayr, J., and Dulieu, O. (2009). Core repulsioneffects in alkali trimers. Int. J. Quant. Chem., 109:3387–3398.
Gustavsson, T., Amiot, C., and Verges, J. (1988). Lif spectroscopy of RbCs using an Ar+laser. Rotational analysis of the X1Σ+
g ground state for J′′ up to 66. Chem. Phys. Lett.,143:101.
Haimberger, C., Kleinert, J., Bhattacharya, M., and Bigelow, N. P. (2004). Formation anddetection of ultracold ground-state polar molecules. Phys. Rev. A, 70:021402(R).
Hall, W. D. and Zorn, J. C. (1974). Measurement of alkali-metal polarizabilities by de-flection of a velocity-selected atomic beam. Phys. Rev. A, 10:1141.
Heijmen, T. G. A., Moszynski, R., Wormer, P. E. S., and Avoird, A. V. D. (1996).Symmetry-adapted perturbation theory applied to interaction-induced properties of col-lisional complexes. Mol. Phys., 89:81.

142 BIBLIOGRAPHY
Hudson, E. R., Gilfoy, N. B., Kotochigova, S., and andD. DeMille, J. M. S. (2008). In-elastic collisions of ultracold heteronuclear molecules in an optical trap. Phys. Rev.Lett., 100:203201.
Hund, F. (1926). Zur Deutung einiger Erscheinungen in den Molekulspektren. Zeitschriftfur Physik, 36:657.
Huron, B., Malrieu, J.-P., and P.Rancurel (1973). Iterative perturbation calculations ofground and excited state energies from multiconfigurational zeroth-order wavefunc-tions. J. Chem. Phys., 58:5745.
Hutson, J. M. and Soldan, P. (2006). Molecule formation in ultracold atomic gases. Int.Rev. Phys. Chem., 25(4):497–526.
Igel-Mann, G., Wedig, U., Fuentealba, P., and Stoll, H. (1986). Ground-state propertiesof alkali dimers xy (x,y=Li to Cs). J. Chem. Phys., 84:5007–5012.
Jones, K. M., Lett, P. D., Tiesinga, E., and Julienne, P. S. (1999). Fitting line shapes inphotoassociation spectroscopy of ultracold atoms: A useful approximation. Phys. Rev.A, 61:012501.
Jones, K. M., Tiesinga, E., Lett, P. D., and Julienne, P. S. (2006). Ultracold photoasso-ciation spectroscopy: Long-range molecules and atomic scattering. Rev. Mod. Phys.,78(2):483–53.
Julienne, P. and Mies, F. (1989). Collisions of ultracold trapped atoms. J. Opt. Soc. Am.B, 6(11):2257–2269.
Julienne, P. S. (2009). Ultracold molecules from ultracold atoms: a case study with thekrb molecule. Faraday Discussions, 142:361.
Kasahara, S., Ebi, T., M.Tanimura, Ikoma, H., Matsubara, K., Baba, M., and Kato, H.(1996). High-resolution laser spectroscopy of the X1Σ+ and a3Σ+ states of 23Na85Rbmolecule. J. Chem. Phys., 105:1341.
Kello, V., Sadlej, A. J., and Jr., K. F. (1993). Electron-correlation and relativistic contri-butions to atomic dipole polarizabilities: Alkali-metal atoms. Phys. Rev. A, 47:1715.

BIBLIOGRAPHY 143
Kerman, A. J., Sage, J. M., Sainis, S., Bergeman, T., and DeMille, D. (2004). Productionand state-selective detection of ultracold RbCs molecules. Phys. Rev. Lett., 92:153001.
Ketterle, W., Davis, K. B., Joffe, M. A., Martin, A., and Pritchard, D. E. (1993). Highdensities of cold atoms in a dark spontaneous-force optical trap. Phys. Rev. Lett.,70(15):2253–2256.
Klempt, C., van Zoest, T., Henninger, T., Topic, O., Rasel, E., Ertmer, W., and Arlt, J.(2006). Ultraviolet light-induced atom desorption for large rubidium and potassiummagneto-optical traps. Phys. Rev. A, 73:013410.
Knight, W. D., Clemenger, K., de Heer, W. A., and Saunders, W. A. (1985). Polarizabilityof alkali clusters. Phys. Rev. B, 31:2539.
Kokoouline, V., Dulieu, O., Kosloff, R., and Masnou-Seeuws, F. (1999). Mappedfourier methods methods for long-range molecules: Application to perturbations inthe Rb2(0+u ) photoassociation. J. Chem. Phys., 110:9865.
Korek, M., Allouche, A. R., Fakhreddine, K., and Chaalan, A. (2000). Theoretical studyof the electronic structure of LiCs, NaCs and KCs molecules. Can. J. Phys., 78:977–988.
Korek, M., Moghrabi, A. M., Allouche, A. R., and Frecon, M. A. (2006). Theoreticalstudy with rovibrational and electronic transition moment calculation of the ion LiCs+.Can. J. Phys., 84(11):959–971.
Kornyushin, Y. (2004). Plasma oscillations in porous samples. Science of Sintering,36:43.
Kozlov, M. G. and Labzowsky, L. N. (1995). Parity violation effects in diatomics. J. Phys.B, 28:1933–1961.
Kraft, S. (2006). Formation, trapping and interaction of ultracold molecules. PhD thesis,Albert-Ludwigs-Universitat Freiburg.
Kraft, S., Mikosch, J., Staanum, P., Deiglmayr, J., Lange, J., Fioretti, A., Wester, R., andWeidemuller, M. (2007). A high-resolution time-of-flight mass spectrometer for thedetection of ultracold molecules. Appl. Phys. B, 89(4):453–457.

144 BIBLIOGRAPHY
Kraft, S. D., Staanum, P., Lange, J., Vogel, L., Wester, R., and Weidemuller, M. (2006).Formation of ultracold LiCs molecules. J. Phys. B, 39:S993.
Krems, R. (2005). Molecules near absolute zero and external field control of atomic andmolecular dynamics. Int. Rev. Phys. Chem., 24:99–118.
Krou-Adohi, A. and Giraud-Cotton, S. (1998). The ground state X1Σ+g of NaK revisited.
J. Molec. Spect., 190:171.
Lahaye, T., J, M., Frohlich, B., Koch, T., Griesmaier, A., Pfau, T., Saito, H., Kawaguchi,Y., and Ueda, M. (2008). d-wave collapse and explosion of a dipolar Bose-Einsteincondensate. Phys. Rev. Lett, 101:080401.
Laidig, K. E. and Bader, R. F. W. (1990). Properties of atoms in molecules: Atomicpolarizabilities. J. Chem. Phys., 93:7213.
Lang, F., Winkler, K., Strauss, C., Grimm, R., and Denschlag, J. H. (2008). Ultracoldtriplet molecules in the rovibrational ground state. Phys. Rev. Lett., 101:133005.
Lange, J. (2007). Erzeugung ultrakalter LiCs-Molekule durch Photoassoziation. PhDthesis, Albert-Ludwigs-Universitat Freiburg.
Li, L., Lyyra, A. M., Luh, W. T., and Stwalley, W. C. (1990). Observation of the 39K2
a3Σ+u state by perturbation facilitated optical-optical double resonance resolved fluo-
rescence spectroscopy. J. Chem. Phys., 93:8452.
Li, L., Rice, S. F., and Field, R. W. (1985). The Na2 a3Σ+u state. Rotationally resolved
OODR 3Πg-a3Σ+u fluorescence spectroscopy. J. Chem. Phys., 82:1178.
Li, Z. and Krems, R. V. (2007). Electric-field-induced feshbach resonances in ultracoldalkali-metal mixtures. Phys. Rev. A, 75(3):032709–8.
Lim, I. S., Schwerdtfeger, P., Sohnel, T., and Stoll, H. (2005). Ground-state properties andstatic dipole polarizabilities of the alkali dimers from Kn
2 to Frn2 (n=0,+1) from scalar
relativistic pseudopotential coupled cluster and density functional studies. J. Chem.Phys., 122:134307.
Linton, C., Murphy, T. L., Martin, F., Bacis, R., and Verges, J. (1989). Fourier transformspectroscopy of the 13Σ+
g - a3Σ+u transition of the 6Li2 molecule. J. Chem. Phys.,
91:6036.

BIBLIOGRAPHY 145
Loesch, H. (1995). Orientation and alignment in reactive beam collisions - recentprogress. Ann. Rev. Phys. Chem., 46:555–594.
Magnier, S. and Aubert-Frecon, M. (2002). Static dipolar polarizabilities for variouselectronic states of alkali atoms. J. Quant. Spec. Rad. Transf., 75:121.
Mancini, M. W., Caires, A. R. L., Telles, G., Bagnato, V. S., and Marcassa, L. G. (2004a).Trap loss rate for heteronuclear cold collisions in two species magneto-optical traps.Eur. Phys. J. D, 30:105–116.
Mancini, M. W., Telles, G. D., Caires, A. R. L., Bagnato, V. S., and Marcassa, L. G.(2004b). Observation of ultracold ground-state heteronuclear molecules. Phys. Rev.Lett., 92:133203.
Marinescu, M. and Sadeghpour, H. R. (1999). Long-range potentials for two-speciesalkali-metal atoms. Phys. Rev. A, 59(1):390–404.
Marinescu, M., Sadeghpour, H. R., and Dalgarno, A. (1994). Dispersion coefficients foralkali-metal dimers. Phys. Rev. A, 49:982.
Maroulis, G. (1988). SDTQ-MPPT(4) electric moments and static polarizabilities for Li2X1Σ+
g . Mol. Phys., 63:299.
Maroulis, G. (2004). Bonding and (hyper)polarizability in the sodium dimer. J. Chem.Phys., 121:10519.
Marston, C. C. and Balint-Kurti, G. G. (1989). The Fourier grid hamiltonian method forbound state eigenvalues and eigenfunctions. J. Chem. Phys., 91:3571.
Masnou-Seeuws, F. and Pillet, P. (2001). Formation of ultracold molecules (T ≤ 200 µK)via photoassociation in a gas of laser-cooled atoms. Adv. At., Mol., Opt. Phys., 47:53–127.
Menotti, C., Trefzger, C., and Lewenstein, M. (2007). Metastable states of a gas of dipolarbosons in a 2D optical lattice. Physical Review Letters, 98(23):235301.
Merawa, M., Begue, D., and Dargelos, A. (2003a). High-correlation methods for-thecalculations of the ground X1Σ+ and first low-lying excited a3Σ+ and A1Σ+ statesdipole polarizabilities of NaLi. Chem. Phys. Lett., 372:529.

146 BIBLIOGRAPHY
Merawa, M. and Dargelos, A. (1998). Dynamic polarizabilities and Van der Waals coef-ficients for alkali atoms Li, Na and alkali dimer molecules Li2, Na2 and NaLi. J. Chim.Phys. Phys. Chim. Bio., 95:1711.
Merawa, M. and Rerat, M. (2001). Ab initio calculation of excited state dipole polariz-ability - Application to the first 1,3Σ+
g,u states of Li2. Eur. Phys. J. D, 17:329.
Merawa, M., Rerat, M., and Bussery-Honvault, B. (2003b). Intramolecular dependenceof the frequency-dependent polarizabilities of K2 a3Σ+
u and van der waals dispersioncoefficients for X-K2, X2-K, and X2-K2 (X = Li,Na,K). J. Molec. Struct., 633:137.
Miffre, A., Jacquey, M., Buchner, M., Trenec, G., and Vigue, J. (2006). Measurement ofthe electric polarizability of lithium by atom interferometry. Phys. Rev. A, 73:011603.
Molof, R. W., Miller, T. M., Schwartz, H. L., Bederson, B., and Park, J. T. (1974a).Measurements of the average electric dipole polarizabilities of the alkali dimers. J.Chem. Phys., 61:1816.
Molof, R. W., Schwartz, H. L., Miller, T. M., and Bederson, B. (1974b). Measurements ofelectric dipole polarizabilities of the alkali-metal atoms and the metastable noble-gasatoms. Phys. Rev. A, 10:1131.
Moore, C. E. (1958). Atomic Energy Levels, volume III. National Bureau of Standards,Washington.
Mortlbauer, K. (2008). Frequenzstabilisierung eines Dauerstrich-Farbstofflasers zurErzeugung von LiCs-Molekulen im rovibronischen Grundzustand. Master’s thesis,Leopold-Franzens-Universitat Innsbruck.
Mosk, A., Kraft, S., Mudrich, M., Singer, K., Wohlleben, W., Grimm, R., and Wei-demuller, M. (2001). Mixture of ultracold lithium and cesium atoms in an opticaldipole trap. Appl. Phys. B, 73:791.
Moullet, I., Martins, J. L., Reuse, F., and Buttet, J. (1989). Static electric dipole polariz-ability of small sodium aggregates. Z. Phys.D, 12:353.
Mudrich, M. (2003). Interactions in an optically trapped mixture of ultracold lithium andcesium atoms: Thermalization, spin-exchange collisions and photoassociation. PhDthesis, Universitat Heidelberg.

BIBLIOGRAPHY 147
Mudrich, M., Bunermann, O., Stienkemeier, F., Dulieu, O., and Weidemuller, M. (2004a).Formation of cold bialkali dimers on helium nanodroplets. Eur. Phys. J. D, 31(2):291–299.
Mudrich, M., Kraft, S., Singer, K., Grimm, R., Mosk, A., and Weidemuller, M. (2002).Sympathetic cooling with two atomic species in an optical trap. Phys. Rev. Lett.,88:253001.
Mudrich, M., Kraft, S. D., Lange, J., Mosk, A., Weidemuller, M., and Tiesinga, E.(2004b). Hyperfine-changing collisions in an optically trapped gas of ultracold cesiumand lithium. Phys. Rev. A, 70:062712.
Muller, W. and Meyer, W. (1984). Ground-state properties of alkali dimers and theircations from ab initio calculations with effective core polarization potentials. J. Chem.Phys., 80:3311.
Muller, W. and Meyer, W. (1986). Static dipole polarizabilities of Li2, Na2, and K2. J.Chem. Phys., 85:953.
Nahler, N. H., Baumfalk, R., Buck, U., Z.Bihary, Gerber, R. B., and Friedrich, B. (2003).Photodissociation of oriented HXeI molecules generated from HXen clusters. J. Chem.Phys., 119:224.
Napolitano, R., Weiner, J., Williams, C. J., and Julienne, P. S. (1994). Line shapes ofhigh resolution photoassociation spectra of optically cooled atoms. Phys. Rev. Lett.,73:1352.
Ni, K.-K., Ospelkaus, S., de Miranda, M. H. G., Pe’er, A., Neyenhuis, B., Zirbel, J. J.,Kotochigova, S., Julienne, P. S., Jin, D. S., and Ye, J. (2008). A high phase-space-density gas of polar molecules. Science, 322:231.
Nikolov, A. N., Ensher, J. R., Eyler, E. E., Wang, H., Stwalley, W. C., and Gould, P. L.(2000). Efficient production of ground-state potassium molecules at sub-mk tempera-tures by two-step photoassociation. Phys. Rev. Lett., 84:246.
Parker, D. and Bernstein, R. (1989). Oriented molecule beams via the electrostatichexapole - preparation, characterization, and reactive scattering. Ann. Rev. Phys. Chem.,40:561–595.

148 BIBLIOGRAPHY
Patil, S. H. and Tang, K. T. (2000). Simple model potential and model wave functions for(H-alkali)+ and (alkali-alkali)+ ions. J. Chem. Phys., 113:676.
Politzer, P., Jin, P., and Murray, J. S. (2002). Atomic polarizability, volume and ionizationenergy. J. Chem. Phys., 117:8197.
Pupillo, G., Griessner, A., Micheli, A., Ortner, M., Wang, D.-W., and Zoller, P.(2008a). Cold atoms and molecules in self-assembled dipolar lattices. Phys. Rev. Lett.,100:050402.
Pupillo, G., Micheli, A., Buchler, H. P., and Zoller, P. (2008b). Condensed matter physicswith cold polar molecules. In Krems, R. V., Friedrich, B., and Stwalley, W. C., editors,Cold molecules: Creation and applications. Taylor & Francis. [available online athttp://arxiv.org/abs/0805.1896].
Rabl, P., DeMille, D., Doyle, J. M., Lukin, M. D., Schoelkopf, R. J., and Zoller, P. (2006).Hybrid quantum processors: Molecular ensembles as quantum memory for solid statecircuits. Physical Review Letters, 97(3):033003.
Ralchenko, Y., Kramida, A., Reader, J., and Team, N. A. (2008). Nist atomic spectradatabase (version 3.1.5), [online]. http://physics.nist.gov/asd3 [2009, August 17].
Rangwala, S. A., Junglen, T., Rieger, T., Pinkse, P. W. H., and Rempe, G. (2003). Con-tinuous source of translationally cold dipolar molecules. Phys. Rev. A, 67(4):043406.
Rerat, M. and Bussery-Honvault, B. (2003). Intramolecular dependence of the frequencydependent polarizabilities of Li2 and Na2 a3Σ+
u and van der Waals dispersion coeffi-cients for atom-diatom and diatom-diatom alkali. Mol. Phys., 101:373.
Ross, A. J., Effantin, C., Crozet, P., and Boursey, E. (1990). The ground state of KRbfrom laser-induced fluorescence. J. Phys. B, 23:L247.
Safronova, M. S., Johnson, W. R., and Derevianko, A. (1999). Relativistic many-bodycalculations of energy levels, hyperfine constants, electric-dipole matrix elements, andstatic polarizabilities for alkali-metal atoms. Phys. Rev. A, 60:4476.
Sage, J. M., Sainis, S., Bergeman, T., and DeMille, D. (2005). Optical production ofultracold polar molecules. Phys. Rev. Lett., 94:203001.

BIBLIOGRAPHY 149
Sanders, L. (2008). Physicists hot for ultracold. ScienceNews, 174(13):22.
Santos, L., Shlyapnikov, G. V., Zoller, P., and Lewenstein, M. (2000). Bose-Einsteincondensation in trapped dipolar gases. Phys. Rev. Lett., 85(9):1791–1794.
Schloder, U., Engler, H., Schunemann, U., Grimm, R., and Weidemuller, M. (1999). Coldinelastic collisions between lithium and cesium in a two-species magneto-optical trap.Eur. Phys. J. D., 73:802.
Seto, J. Y., Roy, R. J. L., Verges, J., and Amiot, C. (2000). Direct potential fit analysis ofthe X1Σ+
g state of Rb2: Nothing else will do! J. of Chem. Phys., 113:3067.
Singer, K., Jochim, S., Mudrich, M., Mosk, A., and Weidemuller, M. (2002). A low costmechanical shutter. Rev. Sci. Instrum., 73:4402.
Sorensen, L. K., Fleig, T., and Olsen, J. (2009). Spectroscopic and electric properties ofthe LiCs molecule: a coupled cluster study including higher excitations. J. Phys. B,42(16):165102.
Spelsberg, D., Lorenz, T., and Meyer, W. (1993). Dynamic multipole polarizabilities andlong range interaction coefficients for the systems H, Li, Na, K, He, H-, H2, Li2,Na2,and K2. J. Chem. Phys., 99:7845.
Staanum, P., Kraft, S. D., Lange, J., Wester, R., and Weidemuller, M. (2006). Experimen-tal investigation of ultracold atom-molecule collisions. Phys. Rev. Lett., 96:023201.
Staanum, P., Pashov, A., Knockel, H., and Tiemann, E. (2007). X1Σ+ and a3Σ+ states ofLiCs studied by Fourier-transform spectroscopy. Phys. Rev. A, 75(4):042513–9.
Stan, C. A. and Ketterle, W. (2005). Multiple species atom source for laser-cooling ex-periments. Rev. Sci. Instr., 76:063113.
Stapelfeldt, H. and Seidema, T. (2003). Colloquium: Aligning molecules with stronglaser pulses. Rev. Mod. Phys., 75:543.
Stein, A., Pashov, A., Staanum, P., Knockel, H., and Tiemann, E. (2008). The B1Π andD1Π states of LiCs studied by Fourier-transform spectroscopy. Eur. Phys. J. D, 48:177.
Stienkemeier, F. and Lehmann, K. (2006). Spectroscopy and dynamics in helium nan-odroplets. J. Phys. B, 39(8):R127–R166.
150 BIBLIOGRAPHY
Strecker, K. E. and Chandler, D. W. (2008). Kinematic production of isolated millikelvinmolecules. Phys. Rev. A, 78(6):063406.
Stwalley, W. C. (2004). Efficient conversion of ultracold feshbach-resonance-related polarmolecules into ultracold ground state. Eur. Phys. J. D, 31(2):221–225.
Stwalley, W. C. and Wang, H. (1999). Photoassociation of ultracold atoms: A new spec-troscopic technique. J. Mol. Spec., 195:194–228.
Szentpaly, L. V., Fuentealba, P., Preuss, H., and Stoll, H. (1982). Pseudopotential calcu-lations on Rb+2 , Cs+2 , RbH+, CsH+ and the mixed alkali dimer ions. Chem. Phys. Lett.,93:555.
Tarnovsky, V., Bunimovicz, M., Vuskovic, L., Stumpf, B., and Bederson, B. (1993).Measurements of the dc electric dipole polarizabilities of the alkali dimer molecules,homonuclear and heteronuclear. J. Chem. Phys., 98(5):3894–3904.
Thorsheim, H. R., Weiner, J., and Julienne, P. S. (1987). Laser-induced photoassociationof ultracold sodium atoms. Phys. Rev. Lett, 58:2420.
Townes, C. H. and Schawlow, A. L. (1955). Microwave Spectroscopy. McGraw-HillBook Company.
Urban, M. and Sadlej, A. J. (1995). Electronic structure and electric properties of thealkali metal dimers. J. Chem. Phys., 103:9692.
van de Meerakker, S., Vanhaecke, N., and Meijer, G. (2006). Stark deceleration andtrapping of OH radicals. Ann. Rev. Phys. Chem., 57:159–190.
Vanhaecke, N. and Dulieu, O. (2007). Precision measurements with polar molecules: therole of the black body radiation. Molecular Physics, 105(11):1723–1731.
Vanhaecke, N., Meier, U., Andrist, M., Meier, B. H., and Merkt, F. (2007). MultistageZeeman deceleration of hydrogen atoms. Phys. Rev. A, 75(3):031402.
Verner, D. A., Ferland, G. J., Korista, K. T., and Yakovlev, D. G. (1996). Atomic data forastrophysics. ii. new analytic fits for photoionization cross sections of atoms and ions.Astrophys. J., 465:487.
BIBLIOGRAPHY 151
Viteau, M., Chotia, A., Allegrini, M., Bouloufa, N., Dulieu, O., Comparat, D., and Pillet,P. (2008). Optical Pumping and Vibrational Cooling of Molecules. Science, 321:232.
Wang, D., Eyler, E. E., Gould, P. L., and Stwalley, W. C. (2005). State-selective de-tection of near-dissociation ultracold KRb X1Σ+ and a3Σ+ molecules. Phys. Rev. A,72:032502.
Wang, D., Kim, J. T., Ashbaugh, C., Eyler, E. E., Gould, P. L., and Stwalley, W. C. (2007).Rotationally resolved depletion spectroscopy of ultracold KRb molecules. Phys. Rev.A, 75(3):032511–5.
Wang, D., Qi, J., Stone, M. F., Nikolayeva, O., Wang, H., Hattaway, B., Gensemer, S. D.,Gould, P. L., Eyler, E. E., and Stwalley, W. C. (2004). Photoassociative production andtrapping of ultracold KRb molecules. Phys. Rev. Lett., 93:243005.
Weck, P. F. and Balakrishnan, N. (2006). Importance of long-range interactions in chemi-cal reactions at cold and ultracold temperatures. Int. Rev. Phys. Chem., 25(3):283–311.
Weeks, J. D., Hazi, A., and Rice, S. A. (1969). On the use of pseudopotentials in thequantum theory of atoms and molecules. In Prigogine, I. and Rice, S. A., editors,Advances in Chemical Physics, volume 16, page 283. Interscience, New York.
Weiner, J., Bagnato, V. S., Zilio, S., and Julienne, P. S. (1999). Experiments and theoryin cold and ultracold collisions. Rev. Mod. Phys., 71(1):1–85.
Weinstein, J. D., R. de Carvalho, Guillet, T., Friedrich, B., and Doyle, J. M. (1998). Mag-netic trapping of calcium monohydride molecules at millikelvin temperatures. Nature,395:148.
Wester, R., Kraft, S. D., Mudrich, M., Staudt, M. U., Lange, J., Vanhaecke, N., Dulieu, O.,and Weidemuller, M. (2004). Photoassociation inside an optical dipole trap: absoluterate coefficients and Franck-Condon factors. Appl. Phys. B, 79:993.
Winkler, K., Lang, F., Thalhammer, G., v. d. Straten, P., Grimm, R., and Denschlag, J. H.(2007). Coherent optical transfer of Feshbach molecules to a lower vibrational state.Phys. Rev. Lett., 98(4):043201–4.

152 BIBLIOGRAPHY
Yamakita, Y., Procter, S., Goodgame, A., Softley, T., and Merkt, F. (2004). Deflectionand deceleration of hydrogen Rydberg molecules in inhomogeneous electric fields. J.Chem. Phys., 121(3):1419–1431.
Yelin, S. F., Kirby, K., and Cote, R. (2006). Schemes for robust quantum computationwith polar molecules. Phys. Rev. A, 74:050301.
Zahzam, N., Vogt, T., Mudrich, M., Comparat, D., and Pillet, P. (2006). Atom-moleculecollisions in an optically trapped gas. Phys. Rev. Lett., 96:023202.

Resume substantiel
Dans cette these, nous avons etudie les proprietes d’un gaz ultra-froid de moleculesdiatomiques polaires d’alcalins a la fois experimentalement et theoriquement. Dans lapremiere partie theorique, nous avons examine les mecanismes possibles de formation demolecules ultra-froides stables de LiCs dans des niveaux rovibrationnels tres lies, par l’in-termediaire de la photo-association de paires d’atomes Li et Cs. Nous avons aussi etendul’etude ab initio des proprietes electroniques de tous les dimeres alcalins entreprise auLaboratoire Aime Cotton (Aymar and Dulieu, 2005), au calcul de leurs polarisabilitesdipolaires statiques. Dans la seconde partie experimentale, la formations de moleculesLiCs ultra-froides est exploree par photo-association dans un gaz mixte d’atomes ultra-froids de Li et Cs. Nous avons ameliore la courbe de potentiel de l’etat moleculaire exciteB1Π, et nous avons decouvert un schema simple de formation de LiCs dans leur etatfondamental absolu X1Σ+,v′′=0,J′′=0 (Deiglmayr et al., 2008b). Le moment dipolaire deces molecules dans les plus bas niveaux vibrationnels de l’etat fondamental a ensuite etedetermine par spectroscopie Stark, et compare a nos calculs theoriques. Les moleculesLiCs ultra-froides ont ete conservees dans un piege dipolaire quasi-electrostatique creepar un laser hors resonance. Nous avons observe un long temps de piegeage, caracterisepar une duree de vie τ=24(3)s limitee par les collisions avec les atomes du gaz residuel.Cela nous a permis d’observer la desexcitation radiative des niveaux vibrationnels del’etat fondamental de ces molecules polaires. La section efficace de collisions inelastiqueultra-froide entre molecules de LiCs dans des niveaux vibrationnels eleves de l’etat fon-damental et les atomes de Cs a aussi ete mesuree.
153

154 RESUME SUBSTANTIEL
Calcul ab initio de proprietes electroniques des dimeres al-calins
Afin d’estimer les taux de formation de molecules froides de LiCs par PA, les etatslies et du continuum sont calcules par la methode de representation de l’Hamiltoniensur grille de Fourier a pas variable (Marston and Balint-Kurti, 1989). En utilisant lemodele developpe dans la reference (Napolitano et al., 1994) incluant les parametresexperimentaux pour les etats moleculaires impliques, l’intensite laser, et la temperature dugaz, nous avons obtenu des taux de PA realistes. Par exemple, le taux de PA s’etablit a en-viron 10−10 cm3s−1 pour les niveaux de l’etat B1Π proches de l’asymptote, et decroit rapi-demment pour les niveaux plus profonds. Cependant, en dessous du niveau v′ '24, un cal-cul a une seule voie predit des taux trop faibles pour etre detectables experimentalement.Nous avons estime la population des niveaux vibrationnels de l’etat fondamental de LiCsapres emission spontanee depuis differents niveaux de l’etat B1Π (figure 2.8). En parti-culier, 20% des molecules formees apres desexcitation du niveau ,v′=4 de l’etat B1Π setrouvent dans le niveau vibrationnel le plus bas ,v′′=0 de l’etat fondamental X1Σ+.
aL bLR-dependent dipole
constant dipole
0 5 10 15 200.
0.1
0.2
0.3
v" in X1S+
Rel
ativ
eP
opul
atio
n
PA via B1P,v'=4
PA via B1P,v'=26
0 5 10 15 20 25 30 35 40 45 50 550.
0.1
0.2
0.3
v" in X1S+
Rel
ativ
eP
opul
atio
n
Figure 2.8 : Population (normalisee a 1) des niveaux vibrationnels de l’etat X1Σ+ apresphoto-association : a) influence de la dependance du moment de transition en fonction de ladistance internucleaire sur la population apres PA vers le niveau B1Π,v′=4 ; b) comparaisonde la population apres PA dans les niveaux B1Π,v′=4 and v′=26.

RESUME SUBSTANTIEL 155
500 1000 1500 2000 2500 3000
Ve (a
0
3)
0
500
1000po
lari
zabi
lity
com
pone
nt (
a.u.
)
LiN
a
LiK LiR
b
Cs 2
RbC
s
KC
s
Rb 2
KR
b
K2
NaC
s
LiC
s
NaR
bN
aK
Na 2
Li 2
Fr2
Figure 3.5 : Polarisabilite dipolaire statique parallele (cercles pleins) and perpendiculaire(cercles clairs) en fonction du volume moleculaire effectif defini par Ve = 4πR3
e/3, ou Re
est la distance d’equilibre de l’etat fondamental de chaque molecule. Les lignes droitesmontrent un fit lineaire de ces quantites, en excluant Fr2, correspondant a la formule :(en unites atomiques) : α‖ = 0.31Ve + 153.5 (ligne tiretee) et α⊥ = 0.16Ve + 71.2 (lignecontinue).
Afin d’etudier la possibilite de creer un ensemble de molecules polaires ultra-froidesalignees et orientees, nous avons calcule, par une approche de chimie quantique disponibledans le groupe du LAC, les polarisabilites dipolaires statiques de toutes les moleculesdiatomiques d’alcalins pour toutes les distances internucleaires. Ces resultats sont pu-blies pour la premiere fois pour plusieurs d’entre elles. Une etude systematique a misen evidence une tendance generale : la dependance lineaire de la polarisabilite a la dis-tance d’equilibre en fonction d’un volume moleculaire effectif (figure 3.5). Ces fonctionssont ensuite moyennees sur les fonctions vibrationnelles, pour obtenir des quantites ob-servables experimentalement. Nous avons trouve un bon accord avec les quelques valeursdisponibles dans la litterature. Sur la base du modele decrit dans la reference (Friedrichand Herschbach, 1999a) et en utilisant ces nouvelles donnees, nous avons propose uneapproche experimentale pour preparer des molecules polaires froides dans un etat aligne

156 RESUME SUBSTANTIEL
et oriente, et pour les pieger, a l’aide d’un laser continu amplifie par cavite combine a deschamps electriques statiques d’intensite moderee.
Etude experimentale des molecules LiCs ultra-froides
Les experiences sont realisees dans le groupe de Matthias Weidemuller a Freiburg. Lemontage existant au debut de ce travail(Kraft, 2006; Lange, 2007; Mudrich, 2003) a eteenrichi par un piege magneto-optique selon la technique du “dark SPOT” pour le cesium,qui accroit sensiblement le nombre d’atomes pieges, par un montage base sur un lasercontinu pour la spectroscopie laser a haute resolution, et par un piege a force dipolaireameliore.
0 5 10 15 20 25 30v' in B1
P
101
102
103
104
PA
stre
ngth
10-14
10-13
10-12
10-11
PA
Rat
eK
PA@c
m3s-
1D
Figure 6.3 : Intensite des raies de PA (exprimee en molecules×MHz/s/mW) et taux de PApour tous les niveaux observes v′,J′=1 (a gauche, couleurs sombres) et J′=2 (a droite, cou-leurs claires) de l’etat B1Π. Les raies de PA sont integrees et normalisees par la puissancedu laser de PA. Les taux absolus sont donnes pour une intensite de reference de 30W/cm2.Les longueurs d’onde du laser d’ionisation utilisees pour la detection sont 14692.7 cm−1
(rouge), 16859.4 cm−1 (vert), et 16999.7 cm−1 (bleu).
A l’aide de ce montage, nous avons realise la spectroscopie par PA de l’etat B1Π,qui a permis la determination d’une courbe de potentiel amelioree pour cet etat, et d’unevaleur plus precise de l’energie de dissociation de l’etat fondamental X1Σ+ (Grocholaet al., 2009). Contrairement aux predictions du modele theorique a une voie evoque plus

RESUME SUBSTANTIEL 157
haut, la photo-association des niveaux les plus profonds (jusqu’a v′=0) de l’etat B1Π estobservable (figure 6.3), ouvrant la voie a la formation de molecules froides dans leur etatfondamental absolu par une seule etape de PA. La population des niveaux rovibrationnelsdes molecules formees dans leur etat fondamental est analysee par spectroscopie du signald’ionisation resonante a deux photons, combinee a une spectroscopie de ”depopulation”.Pour l’etat X1Σ+,v′′=0,J′′=0 un taux de formation de 100 molecules/s est mesure, et ilatteint 5 000 molecules/s pour l’etat X1Σ+,v′′=0,J′′=2 (Deiglmayr et al., 2008b). Le mo-ment dipolaire de ces niveaux profonds est determine par spectroscopie Stark, et atteint lavaleur de 5.5(2) Debye.
ææ
æ ææ æ
æà à
à
à
à à
àà
à
àà
à à
à
à
à
àà
à
à
ò
ò
ò ò
ò
òò
ò
òò
0.0 0.2 0.4 0.6 0.8 1.0 1.21
2
4
10
6
Hold time after PA @sD
Ion
yiel
d@V
nsD
Figure 7.11 : Mesures de la duree de vie des molecules dans le piege dipolaire pour un en-semble pur de molecules LiCs (points noirs, τ=24(3) s), et pour des molecules LiCs piegeesavec des atomes de cesium dans l’etat hyperfin F=3, quand elles sont produites par PAvers B1Π,v′=26,J′=1 (carres bleus, τ=0.45(3) s), et par PA vers B1Π,v′=28,J′=1 (trianglesrouges, τ=0.21(2) s). Chaque point resulte d’une moyenne sur 16 enregistrements. Lesbarres d’erreur representent la deviation standard des donnees experimentales. Les lignescontinues sont des fits utilisant l’equation S 7.12.
A l’aide du piege optique dipolaire hors resonance, nous avons observe pour la premierefois le piegeage de molecules LiCs ultra-froides. Les molecules sont formees par PAdans le piege, et ont une duree de vie de τ=24(3) s, limitee par les collisions avec le

158 RESUME SUBSTANTIEL
gaz residuel. Le taux de collisions inelastiques entre Cs et LiCs dans le piege est me-sure pour des molecules formees par PA vers differents niveaux de l’etat B (figure 7.11).Contrairement aux observations precedentes (Hudson et al., 2008; Staanum et al., 2006;Zahzam et al., 2006), nous avons observe une variation significative du taux en fonctionde l’etat interne de la molecule. Les valeurs mesurees sont βv′=28 = (2.4± 0.3± 0.5)×10−10 cm3s−1 et βv′=26 = (1.12± 0.14± 0.22)× 10−10 cm3s−1, en bon accord avec lespredictions theoriques (Julienne, 2009).
æ
æ
æ
æ
æ
ææ
æ
æ
æ
æ
æ
æ
æ
æ
æ æ
æ
æ
æ
æ
ææ
æ
0 2 4 6 8 10 120.0
0.5
1.0
1.5
2.0
2.5
Hold time after PA @sD
Ion
yiel
d@V
nsD
Figure 7.14 : Signal d’ion mesure a 16886.3 cm−1 en fonction du temps de piegeage desmolecules (points noirs), ainsi que le signal simule comme indique dans le texte, pour l’etatX1Σ+,v′′=3 (ligne tiretee).
La longue duree de vie des molecules dans le piege a permis l’observation de ladesexcitation radiative de ces molecules polaires vers des niveaux vibrationnels plus pro-fonds (figure 7.14). Les courbes de decroissance enregistrees sont correctement decritespar un simple modele analytique.
Conclusion
Les etudes theoriques et experimentales presentees dans cette these ouvre la voiepour la formation d’un echantillon dense de molecules polaires ultra-froides piegees.

RESUME SUBSTANTIEL 159
Les resultats experimentaux demontrent la possibilite de former une gaz de moleculespolaires ultra-froides dans leur etat fondamental absolu apres une seule etape de photo-association. L’augmentation necessaire des densites atomiques pour atteindre le meme butdans un piege dipolaire sera obtenue apres une amelioration du montage actuellement encours de mise en place. Les interactions entre molecules polaires dans un tel gaz densepourront etre controlees a l’aide d’une combinaison de champs electriques statiques etvariables, conformement a la proposition faite dans la premiere partie de la these, dansla perspective d’observer des phases quantiques nouvelles et des effets a N-corps (Carret al., 2009).

160 RESUME SUBSTANTIEL

Ausfuhrliche Zusammenfassung
Diese Arbeit untersucht theoretische und experimentelle Aspekte ultrakalter AlkaliDimere. In einem ersten, theoretischen Teil wird die Bildung ultrakalter LiCs Molekuledurch Photoassoziation (PA) betrachtet. Eine systematische Analyse aller Alkali Dimere(Aymar and Dulieu, 2005) wird mit der Berechung der statischen Dipol-Polarisierbarkeitfortgesetzt (Deiglmayr et al., 2008a). Ein umfangreicher Vergleich mit publizierten Ar-beiten bestatigt die Zuverlassigkeit des gewahlten Zugangs. Basierend auf diesen Berech-nungen wird eine Moglichkeit aufgezeigt, ein Ensemble ultrakalter polare Molekule inexternen Feldern auszurichten. Im zweiten, experimentellen Teil wird die Bildung pola-rer LiCs Molekule durch PA untersucht. Mittels PA Spektroskopie wird die Bestimmungdes B1Π Zustand vervollstandigt, sowie der Wert der Dissoziationsenergie des X1Σ+
Zustands prazisiert (Grochola et al., 2009). Die Besetzung rovibronischer Zustande imGrundzustand wird mit der Kombination von resonant uberhohter Mehrphotonenionisa-tion und Entvolkerungs-Spektroskopie untersucht. Es wird ein einfacher Weg aufgezeigt,ultrakalte LiCs Molekule im absoluten Grundzustand X1Σ+,v′′=0,J′′=0 zu bilden (Deigl-mayr et al., 2008b). LiCs Molekule werden in einer quasi-elektrostatischen Falle, geformtdurch einen CO2 Laser, gebildet und gefangen. Die Lebensdauer von τ=24(3)s in der Fal-le ist limitiert durch Stoße mit Hintergrundgas, Ratenkoeffizienten fur inelastische Stoßsezwischen LiCs in hoch angeregten Schwingungszustanden und Cesium werden bestimmt.Die lange Lebensdauer in der Falle ermoglicht die Beobachtung des radiativen Zerfallspolarer Molekule in tiefere Schwingungszustande.
161

162 AUSFUHRLICHE ZUSAMMENFASSUNG
Ab initio Berechnung der elektronischen Struktur von Al-kali Dimeren
Zur Abschatzung der Molekulbildungsrate durch PA ultrakalter LiCs Molekule wer-den Streuzustande des Kontinuums und die Wellenfunktionen gebundener Zustande be-rechnet. Zur Berechnung wird die Schrodingergleichung auf einem Fourier-Gitter mitangepasster Schrittweite gelost (Marston and Balint-Kurti, 1989). Unter Verwendung desvon Napolitano et al. (1994) entwickelten Modells fur den PA Prozess und experimentel-ler Parameter fur Molekulpotentiale, Laserintenstitat und Temperatur der atomaren Gasewird eine realistische Molekulbildungsrate bestimmt. Die PA-Rate fur Vibrationsniveausdes B1Π Zustandes nahe der Asymptote liegt in der Grossenordnung von 10−10 cm3s−1
und nimmt fur tiefer gebundene Vibrationsniveaus schnell ab. Unterhalb des Zustandesv′ '24 sagt diese Berechnung eines einzigen Streukanals Raten voraus, die zu klein sind,um experimentell nachgewiesen werden zu konnen. Weiterhin wurde die Besetzung derverschiedenen Niveaus des X1Σ+ Grundzustandes von LiCs nach spontanem Zerfall ausverschiedenen Vibrationsniveaus des B1Π Zustandes bestimmt (Abbildung 2.8). Bemer-kenswert ist, dass sich nach spontanem Zerfall des Niveaus v′=4 des B1Π Zustandes 20%der gebildeten Grundzustandsmolekule im absoluten Grundzustand X1Σ+,v′′=0 befinden.
Weiterhin wurde die Moglichkeit untersucht, ein Ensemble geordneter und ausge-richteter ultrakalter dipolarer Molekule zu erzeugen. Hierzu wurde mittels einer am La-boratoire Aime Cotton verfugbaren quantenchemischen Methode die statische Dipol-Polarisierbarkeit samtlicher Alkali-Dimere fur alle relevanten Abstande berechnet. Furmehrere Systeme wurden diese Werte zum ersten Mal veroffentlicht. Eine systemati-sche Untersuchung offenbarte eine generelle Tendenz: die Polarisierbarkeit am Gleich-gewichtsabstand hangt linear von einem effektiven Molekulvolumen ab (Abbildung 3.5).Die funktionale Form der Dipol-Polarisierbarkeiten wurde zudem uber die Vibrations-wellenfunktionen gemittelt, um experimentell beobachtbare Großen zu erhalten. Soweitverfugbar wurde eine gute Ubereinstimmung mit veroffentlichten Werten gefunden. AufGrundlage des Modells, das in (Friedrich and Herschbach, 1999a) vorgeschlagen wurde,und unter Verwendungen dieser neuen Daten, wurde eine experimentelle Vorgehensweisevorgeschlagen, um ultrakalte polare Molekule mittels eines resonant-uberhohten Dauer-strichlasers und moderater elektrischer Felder parallel auszurichten und zu orientieren.

AUSFUHRLICHE ZUSAMMENFASSUNG 163
aL bLR-dependent dipole
constant dipole
0 5 10 15 200.
0.1
0.2
0.3
v" in X1S+
Rel
ativ
eP
opul
atio
n
PA via B1P,v'=4
PA via B1P,v'=26
0 5 10 15 20 25 30 35 40 45 50 550.
0.1
0.2
0.3
v" in X1S+
Rel
ativ
eP
opul
atio
n
Abbildung 2.8: Besetzung (zu 1 normalisiert) der Vibrationsniveaus des Zustands X1Σ+
nach PA: a) Einfluss der Kernabstandsabhangigkeit des Ubergangsdipolmoments auf dieZustandsbesetzung nach PA mittels des Niveaus B1Π,v′=4; b) Vergleich der Zustandsbeset-zung nach PA mittels der Niveaus B1Π,v′=4 und v′=26.
Experimentelle Untersuchung ultrakalter LiCs Molekule
Die Versuche wurden in der Gruppe von Matthias Weidemuller in Freiburg durch-gefuhrt. Der bereits existierende Aufbau (Kraft, 2006; Lange, 2007; Mudrich, 2003) wur-de um eine magneto-optische Falle nach dem “dark SPOT” Prinzip fur Casium erweitert,welche Zahl und Dichte der gespeicherten Atome deutlich erhohte. Weiterhin wurde einDauerstrich-Laser fur hochauflosenden Spektroskopie und eine verbesserte optische Di-polfalle hinzugefugt.
Mit Hilfe dieses Aufbaus wurde der B1Π Zustand von LiCs spektroskopisch unter-sucht und eine verbesserte Beschreibung der Potentialkurve fur diesen Zustand gefun-den, sowie ein genauerer Wert fur die Dissoziationsenergie des X1Σ+ Zustandes be-stimmt (Grochola et al., 2009). Im Unterschied zu den oben beschriebenen Vorhersa-gen des theoretischen Einkanalmodells wurde die PA uber tiefliegende Zustande bis zuB1Π,v′=0 beobachtet (Abbildung 6.3). Dies eroffnete die Moglichkeit, mittels eines ein-zigen PA-Schrittes ultrakalte Molekule ohne innere Schwingungs- und Rotationsanre-gung zu erzeugen. Die Besetzung der Vibrationsniveaus der im X1Σ+ Zustand gebil-deten Molekule wurde mittels Rensonz-uberhohter Mehrphotonen-Ionisation in Verbin-

164 AUSFUHRLICHE ZUSAMMENFASSUNG
500 1000 1500 2000 2500 3000
Ve (a
0
3)
0
500
1000
pola
riza
bilit
y co
mpo
nent
(a.
u.)
LiN
a
LiK LiR
b
Cs 2
RbC
s
KC
s
Rb 2
KR
b
K2
NaC
s
LiC
s
NaR
bN
aK
Na 2
Li 2
Fr2
Abbildung 3.5: Parallele (offene Kreise) und orthogonale (geschlossene Kreise) statischeDipol-Polarisierbarkeit in Abhangigkeit vom effektiven Molekulvolumen, definiert als Ve =
4πR3e/3. Hierbei ist Re der Gleichgewichtsabstand des Grundzustandes des jeweiligen Mo-
lekuls. Die Linien zeigen eine lineare Kurvenanpassung an diese Großen, unter Ausschlussvon Fr2, entsprechend den Gleichungen (in atomaren Einheiten): α‖ = 0.31Ve +153.5 (ge-strichelte Linie) und α⊥ = 0.16Ve +71.2 (durchgezogene Linie).
dung mit Entvolkerungs-Spektroskopie untersucht. Im Zustand X1Σ+,v′′=0,J′′=0 wur-de eine Molekulbildungsrate von 100 Molekulen/s gemessen, fur X1Σ+,v′′=0,J′′=2 wur-den 5 000 Molekule/s beobachtet (Deiglmayr et al., 2008b). Das permanente elektri-sche Dipol-Moment dieser tiefgebundenen Niveaus wurde mittels Stark-Spektroskopiezu 5.5(2) Debye bestimmt.
Mit Hilfe der weit verstimmten optischen Dipol-Falle wurde zum ersten Mal die Spei-cherung ultrakalter LiCs Molekule beobachtet. Die Molekule werden mittels PA in derFalle gebildet und weisen eine Lebensdauer von τ=24(3) s auf, die durch Stoße mit demHintergrundgas limitiert ist. Der Ratenkoeffizient fur inelastische Stoße zwischen Cs undLiCs wurde fur Molekule, gebildet mittels verschiedener PA-Resonanzen des Zustan-des B1Π, in der Falle gemessen. (Abbildung 7.11). Im Gegensatz zu vorherigen Versu-chen (Hudson et al., 2008; Staanum et al., 2006; Zahzam et al., 2006) wurde eine deutliche

AUSFUHRLICHE ZUSAMMENFASSUNG 165
0 5 10 15 20 25 30v' in B1
P
101
102
103
104
PA
stre
ngth
10-14
10-13
10-12
10-11
PA
Rat
eK
PA@c
m3s-
1D
Abbildung 6.3: Starke der PA-Resonanzen (ausgedruckt in Molekulen×MHz/s/mW) undPA-Rate fur alle Rotations-Schwingungszustande v′,J′=1 (links, dunkle Farben) und J′=2(rechts, helle Farben) des B1Π Zustandes. Die PA-Resonanzen wurden uber das Linien-profil integriert und auf eine Intensitat des PA-Lasers von 30W/cm2 bezogen. Die benutz-ten Wellenlangen des Ionisierungslasers sind 14692.7 cm−1 (rot), 16859.4 cm−1 (grun), et16999.7 cm−1 (blau).
Abhangigkeit der Molekulbildungsrate vom internen Zustand des Molekuls beobachtet.Die gemessenen Ratenkoeffizienten sind βv′=28 = (2.4± 0.3± 0.5)× 10−10 cm3s−1 undβv′=26 = (1.12± 0.14± 0.22)× 10−10 cm3s−1, in guter Ubereinstimmung mit theoreti-schen Vorhersagen (Julienne, 2009).
Die lange Lebensdauer der Molekule in der Falle ermoglicht die Beobachtung desradiativen Zerfalls dieser dipolaren Molekule in tiefer liegende Vibrationsniveaus (Abbil-dung 7.14). Die beobachteten Zerfallskurven lassen sich gut durch ein einfaches analyti-sches Modell beschreiben.
Zusammenfassung
Die in dieser Arbeit vorgestellten theoretischen und experimentellen Arbeiten ebnenden Weg zur Erzeugung und Speicherung eines dichten ultrakalten Gases dipolarer Mo-lekule. Die experimentellen Ergebnisse zeigen eine Moglichkeit auf, ein ultrakaltes Gaspolarer Molekule im absoluten Grundzustand in einem einzigen PA-Schritt zu erzeugen.

166 AUSFUHRLICHE ZUSAMMENFASSUNG
ææ
æ ææ æ
æà à
à
à
à à
àà
à
àà
à à
à
à
à
àà
à
à
ò
ò
ò ò
ò
òò
ò
òò
0.0 0.2 0.4 0.6 0.8 1.0 1.21
2
4
10
6
Hold time after PA @sD
Ion
yiel
d@V
nsD
Abbildung 7.11: Messung der Lebensdauer eines reinen LiCs Ensembles in der optischenDipol-Falle (schwarze Punkte, τ=24(3) s), und fur LiCs Molekule, die mit Casium Atomenim Hyperfine-Niveau F=3 gespeichert wurden, wenn sie mittels PA uber B1Π,v′=26,J′=1(blaue Rechtecke, τ=0.45(3) s), oder mittels PA uber B1Π,v′=28,J′=1 (rote Dreiecke,τ=0.21(2) s) gebildet wurden. Jeder Punkt ist das Ergebnis einer Mittelung uber 16 Mes-sungen. Die Fehlerbalken reprasentieren die Standard-Abweichung der Daten. Die durch-gezogenen Linien sind Kurvenanpassungen unter Benutzung von Geichung 7.12.
Ein im Aufbau befindliches Experiment wird die notwendige Erhohung der atomarenDichte erzielen, um das selbe Ziel in einer optischen Dipolfalle zu erreichen. Die Wech-selwirkungen zwischen den polaren Molekulen in einem solchen Gas konnen mit Hilfekombinierter elektro-statischer und Wechsel-Felder, wie im ersten Teil der Arbeit darge-stellt, kontrolliert werden, mit dem Ziel, neue Quantenphasen und Viel-Korper-Effektebeobachten zu konnen (Carr et al., 2009).

AUSFUHRLICHE ZUSAMMENFASSUNG 167
æ
æ
æ
æ
æ
ææ
æ
æ
æ
æ
æ
æ
æ
æ
æ æ
æ
æ
æ
æ
ææ
æ
0 2 4 6 8 10 120.0
0.5
1.0
1.5
2.0
2.5
Hold time after PA @sD
Ion
yiel
d@V
nsD
Abbildung 7.14: Ionen-Signal bei einer Ionisationswellenlange von 16886.3 cm−1 inAbhangigkeit von der Speicherzeit der Molekule in der Falle (Punkte), sowie ein mittelsdes im Text beschriebenen Modells simulierter Kurvenverlauf fur das VibrationsniveauX1Σ+,v′′=3 (gestrichelte Linie).

168 AUSFUHRLICHE ZUSAMMENFASSUNG

Acknowledgments
Research and progress in academia are not possible without mentors and advisors,colleagues, assistants, and friends. I want to take this opportunity to thank some peoplewho have been important to my dissertation work. First and foremost I want to thankmy two advisors Matthias Weidemuller and Olivier Dulieu for giving me the chance towork on this project, it was a great time. Olivier, I want to thank you especially for thewarm welcome in Orsay, your great support in dealing with all formalities, your enormouspatience in introducing me to molecular physics, and of course for all the fun besidesphysics. Matthias, I want to thank you for the trust you always put in me, the encouragingenthusiasm about the advances in the lab, and the occasional reminder that no project inthe lab is worth risking ones health.
Of course such a project can not be undertaken without funding. The European Train-ing and Research Network “Cold Molecules” supported my six-month long stay in theLaboratoire Aime Cotton. The experiments at the University of Freiburg were supportedby the Deutsche Forschungsgemeinschaft (grant WE2661/6-1) in the framework of thecollaborative research project QuDipMol within EuroQUAM, an ESF project. I’m grate-ful for additional support from the German-French University Saarbrucken and the Euro-pean Graduate College “Interference and Quantum Application”.
During my thesis I profited enormously from many discussions with researchers out-side of the two groups. I want to thank especially Fernand Spiegelman (Toulouse) forthe very instructive discussions about CIPSI and the diabatization procedure at the be-ginning of my thesis, Eberhard Tiemann (Hannover) for his willingness to explain atmany occasions the small details (and big concepts) of molecular spectroscopy, AsenPashov (Sofia) and Alexander Stein (Hannover) for the extremely helpful cooperationduring the spectroscopy of the B1Π state, and Philippe Pellegrini (Storrs) and RobinCote (Storrs) for the intense discussions about possible rate-enhancing mechanisms.
I want also to thank all the members of the theory group in the Laboratoire Aime
169

170 ACKNOWLEDGEMENTS
Cotton. We had many great discussions, and I’m especially thankful to Mireille Aymarfor the best basis sets and her extensive knowledge of relevant publications, RomainGuerout for his essential help in deciphering the details of the CIPSI code, and AndreasGerdes for his work on and with the autocip routines and for his enthusiasm. I’m alsovery grateful to Pierre Pillet for accommodating me at LAC and of course to all membersof the groupe de midi for all the joint activities, not only during lunch.
Many hands contributed to the success of the experiments in Freiburg. Especially Iwant to thank Roland Wester for many ideas, his commitment to thinking any problemthrough to the end, and of course for giving us shelter during the last year. I want tothank Jorg Lange, my PhD predecessor at the experiment, for tightly fixed mounts, thejoint time spent in the lab, and all the energy he invested to find the first PA resonancesin LiCs. I’m very thankful to Stephan Kraft for introducing me to dye lasers and foranswering many questions about the setup. Peter Staanum had already finished his post-doc in the group when I arrived, yet his work was very important for the success of thisthesis. I also had the pleasure to work with two very talented diploma students at the mix-tures experiments: Christian Gluck and Karin Mortlbauer. Thank you both for yoursuccessful work and the good atmosphere in the lab. I’m enormously grateful to “ourpostdoc” Anna Grochola for more than a year of great cooperation, especially for thelong days and nights spend together in lab and office, trying to make sense of molecularspectra and discussing not only physics. I’m very thankful that Marc Repp decided tojoin the group, even though the move to Heidelberg was already foreseeable. Thank youvery much for your great help in running the experiment and setting up the dipole trap.Good luck with the new machine, the same wish goes to Rico Pires and Silvania Alvesde Carvalho.
I also wish Simone Gotz, Georg Gunter, Christoph Hofmann, and Hanna Schemppgood luck with reinstalling their experiments in Heidelberg. Have fun!
I am very thankful for the great colleagues that I have in Freiburg: Terry Mullins,thank your for correcting most of the language and grammar errors in this thesis, andfor your willingness to help with any problem. I’m also extremely thankful to ThomasAmthor for his unlimited readiness to give advice on electronics and circuit diagrams,to set-up and support the groups web pages and internal databases, and to share LaTeXadvices. I also want to thank the current members of the NIMOS team, for bidirectionalsharing of lab-equipment and many advices on vacuum techniques: Martin Stei, RicoOtto, Sebastian Trippel and Thorsten Best.

ACKNOWLEDGEMENTS 171
I am very grateful to Marcel Mudrich and Frank Stienkemeier for the uncompli-cated exchange of lab-equipment and concepts. Another big “Thank You” goes to BrettDePaola and his students from Kansas State University, for providing integrated circuitsin times of need.
Several people have left the group in the last years. I want to thank Markus Reetz-Lamour for the great time in the group, and him and his family for many nice gamenights. I’m also grateful to Jochen Mikosch for his interest in other people and manyquestions. And of course I want to thank the many other people that have worked in ourgroup in Freiburg over the last years, for the good atmosphere and a lot of fun: MagnusAlbert (see you at the next conference), Christian Giese, Christian Greve, ChristophEichhorn, Ina Blank, Janne Denskat, Judith Eng, Katja Reiser, Markus Debatin,Petr Hlavenka, Sebastian Kaiser, Wendelin Sprenger, and last but not least WenzelSalzmann.
Großer Dank gebuhrt Uli Person fur die Hilfe bei vielen technischen Problemen. Ebensoein Dankeschon an Herrn Herrn Gotz fur die Wartung der Gruppenrechner. Herzlichstmochte ich mich bei den Mitarbeitern der Freiburger Werkstatten bedanken. Die mecha-nische Werkstatt unter der Leitung von Herrn Stoll und Herrn Großmann hat unsereBauplane stets kritisch beaugt, fix verbessert und rasant gefertigt, dafur ein großen Dank!Gleiches gilts naturlich fur die Elektronikwerkstatt unter Herrn Bergmann und HerrnKeilhauer, besonders fuer die schnellen Reparaturen defekter Gerate. Vielen Dank auchan Herrn Meyer fur seinen großen Uberblick uber den umfangreichen Materialfundusund die schnelle Hilfe bei der Beschaffung fehlender Teile. Und zuletzt geht naturlich einRiesen-Dank an Helga Muller, fur ihre große Geduld und immer gute Laune bei zahlrei-chen Bestellungen, Reise-Abwicklungen und andere Verwaltungsformalitaten (sowie dieausfuhrliche Erlauterung des jahrlichen Weihnachtsmenus).
Ich danke von ganzem Herzen Anne Meier fur die unersetzliche Unterstutzung in denletzten Jahren, die tolle gemeinsame Zeit und die Zukunft.