Embed Size (px)
Citation preview
Structure and the Performance of Public Organizations:
Task Difficulty and Span of Control
John Bohte
Dept. of Political ScienceOakland University
Rochester, MI 48309
and
Kenneth J. Meier
Dept. of Political ScienceTexas A&M University
College Station, TX 77843409-845-4232
Public Organization Review, (September 2001) Volume 1: 341-354
Financial support for this project was provided by the Department of Political Science at TexasA&M University. All data and documentation necessary to replicate this analysis is availablefrom the National Public Management Research Archive (http://www-bushschool.tamu.edu/pubman/).
Structure and the Performance of Public Organizations:
Task Difficulty and Span of Control
Abstract
Scholars of public organizations have long been interested in understanding how organizationalstructures shape organizational performance. This is an important question because if linksbetween structure and performance exist, then manipulating organizational structures may lead toimprovements in organizational performance. This study examines how one structural attribute,span of control, shapes performance in a large set of public organizations. Specifically, our focusis on how structure shapes performance when task difficulty varies. We hypothesize thatstructural attributes such as spans of control have limited effects on performance whenorganizations address very easy or very difficult tasks. When organizations address moderatelydifficult tasks, the impact of structure on performance should be greatest. Our analysis of 678school districts in Texas covering the years 1994 to 1997 reveals that span of control variableshave the greatest impact on student performance under moderately difficulty task scenarios.

1
Structure and the Performance of Public Organizations:
Task Difficulty and Span of Control
The National Performance Review is the latest in a long line of proposed structural
reforms for government agencies (Goodsell 1994, Moe 1994). Dating back to at least the
Brownlow Commission, efforts to make government work better or more efficiently have
frequently focused on how the work itself is organized. What we know about the relationship of
structure and performance, however, is based primarily on anecdotes and examples rather than
systematic research (Osborne and Gaebler 1992). Classic work on the private sector (Woodward
1980; Worthy 1959) indicates that structure affects performance, yet similar work on public
sector organizations is lacking.
This research attempts to bring some empirical analysis to bear on the question of
organizational structure and performance in the public sector. Using a single organizational
concept–span of control or unit size, this study illustrates how public management practice might
be guided by systematic research. First, we will review the literature to note exactly what is
known about span of control. Second, we will present a theoretical argument that structural
variables like span of control are likely to be conditioned by task difficulty. Third, we test this
theoretical argument with data from several hundred public organizations over a four year period.
Fourth, we consider whether or not the findings presented here might be generalizable to other
public organizations.
Span of Control: The Literature
Span of control, a classic concept in organization theory, is most closely associated with
V.A. Graicunius (1937) and Luther Gulick (1937). The term “span of control” refers to how
1One exception is the theoretical work by Golembiewski (1962) based on a case study ofthe Patent Office.
2
relationships are structured between leaders and subordinates in organizations. A wide span of
control exists when a person oversees many subordinates. A narrow span of control exists when a
leader oversees few subordinates. While a simple concept, span of control has significant
implications for organizational performance. Wide spans of control increase employee discretion
and often enhance employee morale (Worthy 1950; Golembiewski 1962: 202-4). Decisions on
how to structure spans of control affect how organizational resources are allocated. Narrow
spans of control, for instance, require large resource commitments to the task of employee
supervision rather than production. Span of control is also a central concept in understanding
organizational hierarchies because spans of control are directly related to workgroup size and,
thus, determine the number of levels in an organization (Perrow 1986, 30) and, therefore, the
complexity of the communications’ process (Golembiewski 1962: 202; Simon 1946).
Little systematic research has been conducted on span of control relationships in
organizations, due principally to Herbert Simon’s (1946) devastating critique of the principles of
management literature.1 The modest literature that does exist centers almost exclusively on the
search for an ideal ratio that neatly describes what a proper span of control between leaders and
subordinates in organizations should be. Answers to this question have ranged from three to
thirty (Gulick 1937; Bell 1967; Woodward 1980). While scholarly attention has focused
primarily on finding an ideal numerical span of control, relatively little attention has been given
to examining when and how spans of control actually shape organizational performance.
The classic study of span of control is Woodward’s (1980) assessment of English

2The A/P ratio has been criticized as merely an average of relationships and as anorganizational level concept that is difficult to apply across different types of organizations wherethe types of administrators and professionals might vary (Miller and Friesen 1984: 12-5). Because we examine only a single type of organization, the last criticism is not applicable here.
3
industrial firms. She grouped firms into three clusters based on technology--large batch, small
batch and continuous process. The most productive firms in each group had organizational
structures that approached the median for that group. The implication of Woodward’s finding is
that structure interacts with technology and that an optimal structure can be found for a firm.
Unfortunately, the work of Woodward was not followed up by other scholars.
A modest volume of research has examined a concept similar to span of control, the
Melman A/P (administrator/professional) ratio (see Melman 1956; Blau and Schoenherr 1971;
Blau 1973). The underlying idea behind the A/P ratio, that is how closely line personnel can be
supervised (Price and Mueller 1986, 29), is similar to that of span of control (Golembiewski
1962). Most A/P studies examined how the ratio changed as organizations became larger rather
than its impact on performance, our concern here.2
In an effort to reestablish empirical studies of structure and performance, we focus on the
nature of the tasks performed by public organizations. While spans of control are essential to
understanding how organizations are structured, structural variables are not always influential
determinants of organizational performance. Our premise in this study is that the effects of spans
of control on organizational performance are conditioned by task difficulty. Specifically, we
argue that when tasks are easy or extremely difficult, span of control should play a limited role in
shaping performance. The likelihood of span of control relationships exerting a substantial effect
on organizational performance is greatest when organizational tasks are moderately difficult.

3The logic of our argument is similar to that of the technology school (Perrow 1986, 142)but more nuanced. Their argument is that simple tasks are amenable to bureaucraticorganization. Our argument is that structure, whether bureaucratic or not, matters most whenconfronting tasks of moderate difficulty.
4
Span of Control and Task Difficulty
When organizational tasks are easy, spans of control, or other structural factors for that
matter, are unlikely to be influential determinants of organizational performance.3 Organizations
traditionally structure simple tasks though rules and standard operating procedures rather than
close supervision and tight spans of control (Perrow 1973; Van de Ven, Delbecq, and Koenig
1976). In the case of the U.S. Postal Service, procedures for assigning postage to parcels are very
straightforward and routinized. Weight, zip code of the destination, and class of postage are
simple rules that determine postage rates in a fully automated process. Rules and procedures also
govern how simple tasks are dealt with at McDonald’s. McDonald’s operations manual is six
hundred pages long and weighs four pounds. It includes detailed information about the proper
size of french fries, procedures for flipping hamburgers, and guidelines concerning the amount of
sauce to be placed on each hamburger bun (Wilson 1989, 114). In cases like these with simple
routinized tasks, tight spans of control between supervisors and production workers are
inefficient because rules and standard operating procedures supply workers with adequate
guidance on how to perform specific tasks. Varying the span of control is unlikely to affect
performance in these organizations.
When organizations are charged with addressing extremely difficult problems, spans of
control and other structural factors should also play a relatively small role in shaping
organizational performance because the costs of narrowing spans of control outweigh the
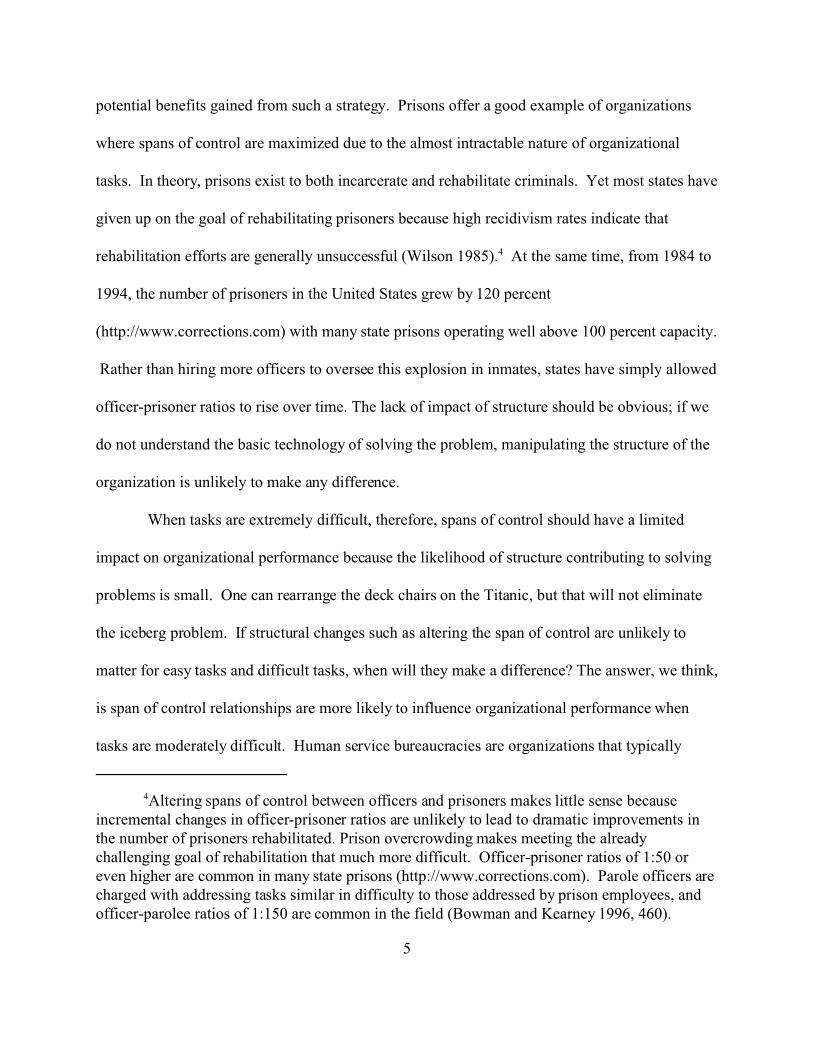
4Altering spans of control between officers and prisoners makes little sense becauseincremental changes in officer-prisoner ratios are unlikely to lead to dramatic improvements inthe number of prisoners rehabilitated. Prison overcrowding makes meeting the alreadychallenging goal of rehabilitation that much more difficult. Officer-prisoner ratios of 1:50 oreven higher are common in many state prisons (http://www.corrections.com). Parole officers arecharged with addressing tasks similar in difficulty to those addressed by prison employees, andofficer-parolee ratios of 1:150 are common in the field (Bowman and Kearney 1996, 460).
5
potential benefits gained from such a strategy. Prisons offer a good example of organizations
where spans of control are maximized due to the almost intractable nature of organizational
tasks. In theory, prisons exist to both incarcerate and rehabilitate criminals. Yet most states have
given up on the goal of rehabilitating prisoners because high recidivism rates indicate that
rehabilitation efforts are generally unsuccessful (Wilson 1985).4 At the same time, from 1984 to
1994, the number of prisoners in the United States grew by 120 percent
(http://www.corrections.com) with many state prisons operating well above 100 percent capacity.
Rather than hiring more officers to oversee this explosion in inmates, states have simply allowed
officer-prisoner ratios to rise over time. The lack of impact of structure should be obvious; if we
do not understand the basic technology of solving the problem, manipulating the structure of the
organization is unlikely to make any difference.
When tasks are extremely difficult, therefore, spans of control should have a limited
impact on organizational performance because the likelihood of structure contributing to solving
problems is small. One can rearrange the deck chairs on the Titanic, but that will not eliminate
the iceberg problem. If structural changes such as altering the span of control are unlikely to
matter for easy tasks and difficult tasks, when will they make a difference? The answer, we think,
is span of control relationships are more likely to influence organizational performance when
tasks are moderately difficult. Human service bureaucracies are organizations that typically

6
address moderately difficult tasks. The tasks of operators in human service bureaucracies are
governed by extensive rules and procedures, but operators often use their discretion in deciding
how these rules and procedures should be applied in particular circumstances (Lipsky 1980).
Discretion is needed because problems, while difficult, are solvable but the bureaucrat needs to
exercise judgment to do so. Police officers, for example, can choose among several alternatives
in deciding how to deal with a motorist caught speeding. One option is issuing a simple warning,
another is issuing a ticket, yet another is an making an arrest. Workers in welfare or public
housing agencies must follow rules in allocating client benefits, yet also have discretion in
determining client eligibility and the type of benefits clients receive (Lipsky 1980, 14). The
above situations are examples where operators have a great deal of discretion in carrying out their
duties, and altering spans of control between higher and lower level personnel may be
advantageous in ensuring that rules and procedures are carried out in a consistent manner across
cases.
Our argument about task difficulty and span of control is essentially that the impact of
structure varies by task and organization. This argument is similar to Worthy’s (1959) argument
about span of control in public versus private organizations. Worthy (1959: 108) contends
narrower spans of control are generally more appropriate in government due to government’s
multiple and conflicting goals and due to the complex nature of accountability in government. In
short, the impact of structure depends on the specific organizational context.
Span of Control, Task Difficulty and Public Schools
The examples of task difficulty discussed above are drawn from a variety of different
organizational settings. A more rigorous approach to understanding the relationship between

7
task difficulty and spans of control in organizations is to examine one type organization that
addresses a variety of tasks ranging from very easy to extremely difficult. In this study, we use
Texas school districts to study how span of control relationships affect organizational
performance across different tasks. The Texas school district data set has several desirable
features for studying the relationship between spans of control, task difficulty, and organizational
performance.
First, many span of control relationships are present in schools and school districts.
Working relationships exist between teachers and school administrators, campus administrators
and district administrators, and teachers and students. These relationships translate directly into
class size and school size. Variations in how spans of control among these personnel are
structured have implications for how schools perform in educating students. Various indicators
of student performance by grade level, ethnicity, and socioeconomic background are also
included in the data set, making it possible to examine linkages between span of control
relationships and organizational performance.
Another advantage of looking at schools is that they typically deal with tasks that vary in
complexity. For example, teaching elementary math is easier than teaching psysics or
biochemistry. Task difficulty in schools also often varies by grade level. As grade level
increases, task difficulty tends to increase. At lower grade levels, there is less student and
curricula variation and fewer serious problems that need to be solved. As an example, the need
for and types of remedial education at the second or third grade levels is not likely to be as great
as it is at the eighth or ninth grade levels. The core curricula is relatively simple and direct.
Student pregnancy, violence, and drug use are not pressing problems at lower grade levels either,
8
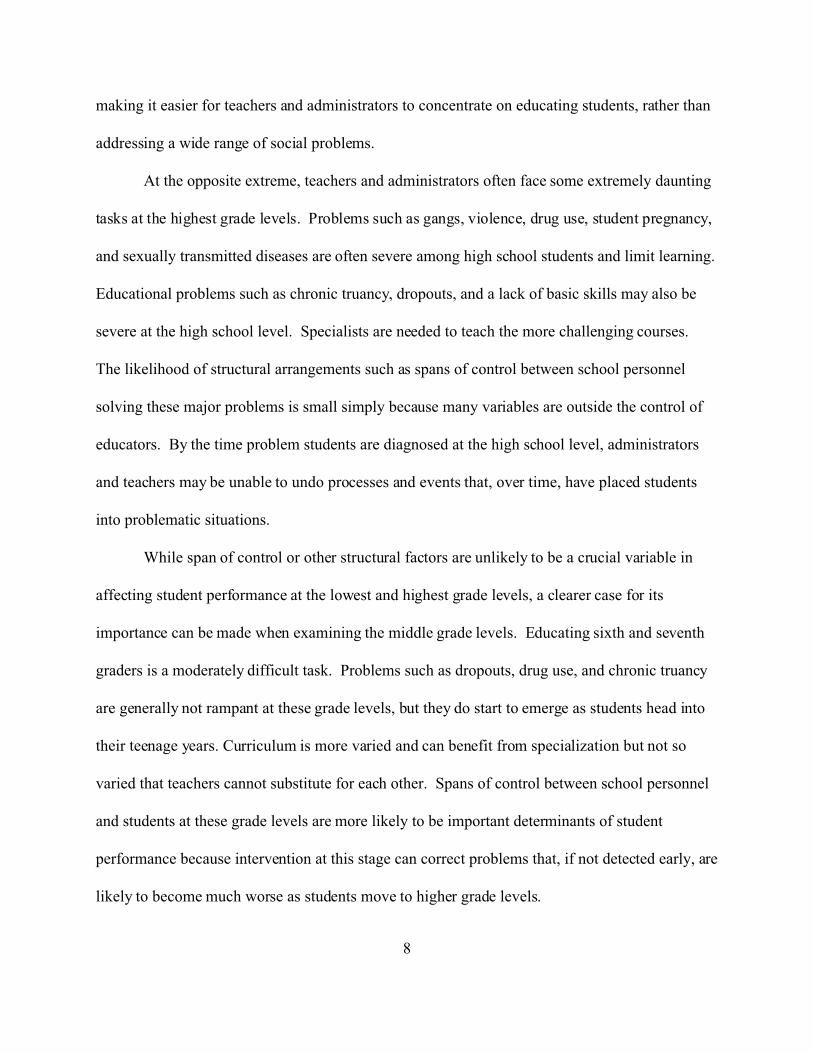
making it easier for teachers and administrators to concentrate on educating students, rather than
addressing a wide range of social problems.
At the opposite extreme, teachers and administrators often face some extremely daunting
tasks at the highest grade levels. Problems such as gangs, violence, drug use, student pregnancy,
and sexually transmitted diseases are often severe among high school students and limit learning.
Educational problems such as chronic truancy, dropouts, and a lack of basic skills may also be
severe at the high school level. Specialists are needed to teach the more challenging courses.
The likelihood of structural arrangements such as spans of control between school personnel
solving these major problems is small simply because many variables are outside the control of
educators. By the time problem students are diagnosed at the high school level, administrators
and teachers may be unable to undo processes and events that, over time, have placed students
into problematic situations.
While span of control or other structural factors are unlikely to be a crucial variable in
affecting student performance at the lowest and highest grade levels, a clearer case for its
importance can be made when examining the middle grade levels. Educating sixth and seventh
graders is a moderately difficult task. Problems such as dropouts, drug use, and chronic truancy
are generally not rampant at these grade levels, but they do start to emerge as students head into
their teenage years. Curriculum is more varied and can benefit from specialization but not so
varied that teachers cannot substitute for each other. Spans of control between school personnel
and students at these grade levels are more likely to be important determinants of student
performance because intervention at this stage can correct problems that, if not detected early, are
likely to become much worse as students move to higher grade levels.

5Texas school districts have improved dramatically on this test over the four year period. The inclusion of individual year dummy variables is also the traditional way to correct for serialcorrelation in panels such as this one with few years and many cross sections. The otherstatistical threat to panel analysis is heteroscedasticity (Stimson 1985). The panel contained amodest amount of heteroscedasticity, but this problem was not severe and did not affect theresults of the analysis.
9
Data and Methods
To what extent are span of control relationships influential in shaping organizational
performance under different task scenarios? Our strategy of analysis is to estimate an
organization production function whereby all factors known to influence outputs are used in a
regression to predict performance. Outputs in this case are defined as average district pass rates
on standardized skills comprehension exams. To this model of performance, we will add several
span of control variables also hypothesized to affect student performance. We will investigate
both linear and nonlinear relationships.
We use a sample of 678 Texas school districts with enrollments over 500 students
covering the years 1994 to 1997. The pooled nature of the data require an adjustment.
Autocorrelation is often a problem in pooled data. Accordingly, all models included a set of
three dummy variables representing individual years to control for serial correlation.5
Several span of control/unit size measures along with controls for school district
background characteristics were included in the analysis. Span of control, in general terms, can
be viewed as a set of ratios that link one level of organization with another level. Mintzberg’s
(1979) examination of structures suggests that span of control will vary at different levels within
an organization. Most span of control relationships should be linear, but at times factors outside
the control of the organization force it to increase spans of control far beyond what can be
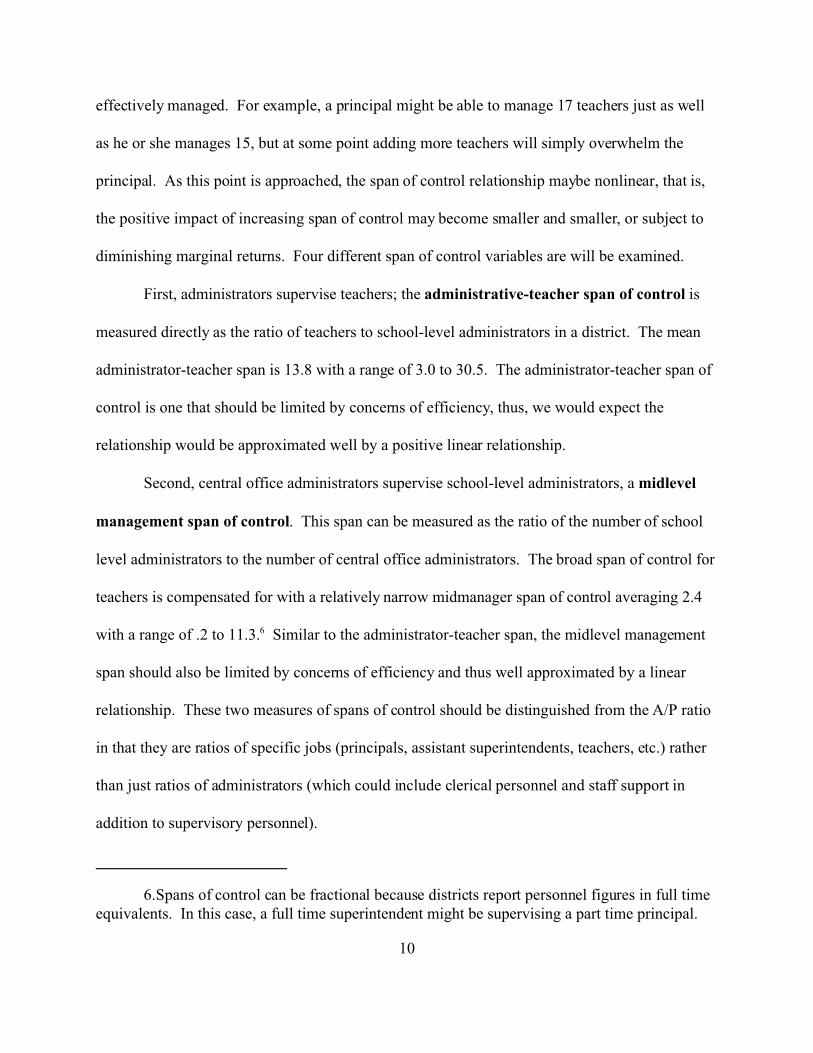
6.Spans of control can be fractional because districts report personnel figures in full timeequivalents. In this case, a full time superintendent might be supervising a part time principal.
10
effectively managed. For example, a principal might be able to manage 17 teachers just as well
as he or she manages 15, but at some point adding more teachers will simply overwhelm the
principal. As this point is approached, the span of control relationship maybe nonlinear, that is,
the positive impact of increasing span of control may become smaller and smaller, or subject to
diminishing marginal returns. Four different span of control variables are will be examined.
First, administrators supervise teachers; the administrative-teacher span of control is
measured directly as the ratio of teachers to school-level administrators in a district. The mean
administrator-teacher span is 13.8 with a range of 3.0 to 30.5. The administrator-teacher span of
control is one that should be limited by concerns of efficiency, thus, we would expect the
relationship would be approximated well by a positive linear relationship.
Second, central office administrators supervise school-level administrators, a midlevel
management span of control. This span can be measured as the ratio of the number of school
level administrators to the number of central office administrators. The broad span of control for
teachers is compensated for with a relatively narrow midmanager span of control averaging 2.4
with a range of .2 to 11.3.6 Similar to the administrator-teacher span, the midlevel management
span should also be limited by concerns of efficiency and thus well approximated by a linear
relationship. These two measures of spans of control should be distinguished from the A/P ratio
in that they are ratios of specific jobs (principals, assistant superintendents, teachers, etc.) rather
than just ratios of administrators (which could include clerical personnel and staff support in
addition to supervisory personnel).

7. The student teacher ratio will be significantly smaller than actual class sizes since anindividual teacher will not teach every hour that students attend classes. Other teachers onlyinteract with small numbers of distinct students (e.g., special education teachers). The currentmeasure is an overall mean of the mean class size in districts so the range is for district meansnot actual class sizes. Texas by comparison is among the leaders in small class sizes.
11
Third, class size can also be viewed as a span of control measure in an organization.
Class size is essentially a surrogate for the number of students a teacher must supervise and
instruct. For these organizations the mean student teacher ratio is 14.5 with a range from 8.9 to
19.1.7 Class size is a somewhat different type of span of control measure because larger spans
may actually reduce student performance and thus the relationship should be negative. At the
same time, class size reductions are expensive, and schools with limited resources could well be
forced by political realities to have classes larger than optimal (Wenglinsky 1997). This logic
suggests that environmental constraints force organizations to operate beyond optimal limits.
The class size relationship, as a result, should be nonlinear.
Fourth, schools are relatively flat organizations so that spans of control quickly translate
into a given size for the organization (see Mintzberg 1979: chapter 8). The education literature
has consistently found that smaller schools have a positive impact on students, an impact
attributed to the informal relationships between students, teachers and administrators that occur
in smaller organizations (Betts 1995). The negative relationship between school size and
performance, however, is one that is likely to be affected by other incentives to increase the size
of schools. A larger school with more students permits schools to compete more favorably with
other schools in athletic and academic competitions. The size of the school is probably also
reflected in higher salaries for administrators. These incentives suggest that school size would
increase beyond optimal levels, so that the relationships between school size and performance
12
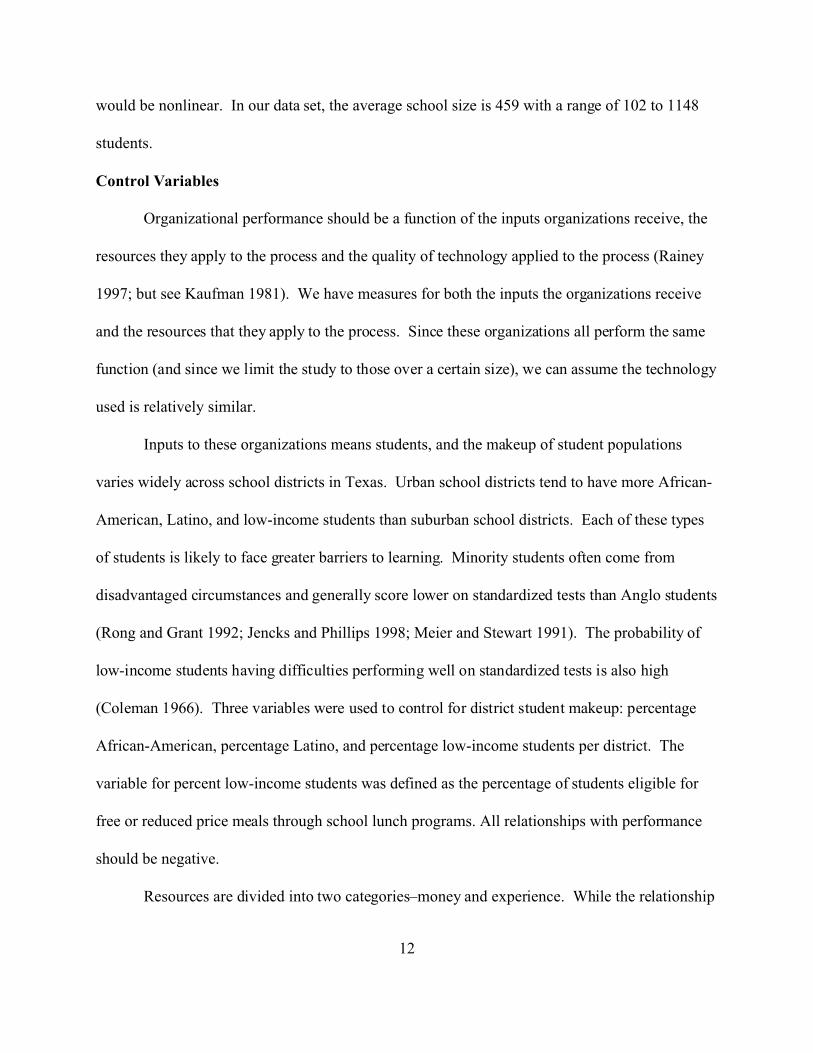
would be nonlinear. In our data set, the average school size is 459 with a range of 102 to 1148
students.
Control Variables
Organizational performance should be a function of the inputs organizations receive, the
resources they apply to the process and the quality of technology applied to the process (Rainey
1997; but see Kaufman 1981). We have measures for both the inputs the organizations receive
and the resources that they apply to the process. Since these organizations all perform the same
function (and since we limit the study to those over a certain size), we can assume the technology
used is relatively similar.
Inputs to these organizations means students, and the makeup of student populations
varies widely across school districts in Texas. Urban school districts tend to have more African-
American, Latino, and low-income students than suburban school districts. Each of these types
of students is likely to face greater barriers to learning. Minority students often come from
disadvantaged circumstances and generally score lower on standardized tests than Anglo students
(Rong and Grant 1992; Jencks and Phillips 1998; Meier and Stewart 1991). The probability of
low-income students having difficulties performing well on standardized tests is also high
(Coleman 1966). Three variables were used to control for district student makeup: percentage
African-American, percentage Latino, and percentage low-income students per district. The
variable for percent low-income students was defined as the percentage of students eligible for
free or reduced price meals through school lunch programs. All relationships with performance
should be negative.
Resources are divided into two categories–money and experience. While the relationship
8We are measuring performance rather than efficiency but efficiency is inherent in therelationship between inputs and outputs; that is, if an organization produces better test scoreswith the same level of inputs, it can be said to be more efficient than the organization thatproduces lower results with these same resources.
13
of money to educational performance is controversial (Hanushek 1986, 1996; Hedges and
Greenwald 1996), financial resources do provide organizations with more opportunities to deal
with a turbulent environment and should be linked to production. Our two measures of resources
are the average teacher salary and per student spending on education. The former recognizes that
educational systems are personnel intensive organizations; some scholars argue that teacher
salaries indicate how well school systems can compete in the market for scarce skills (Hanushek
and Pace 1995). Per student instructional costs are a reasonable measure of resources applied to
actually educating students because they do not include administrative expenses and
extracurricular activities. Teacher experience should be linked to learning on the job and the
ability to perform at higher levels. Our measure is the average number of years of teacher
experience for the district. All three measures should be positively related to organizational
performance.
Dependent Variable
We hypothesize that spans of control among actors in educational bureaucracies
significantly affect organizational performance.8 Our measure of organizational performance is
the percentage of students in each school district who pass standardized reading and mathematics
tests each year. While tests such as these clearly do not measure the entire student learning
experience, they do assess whether students are picking up basic academic skills from grade to
grade. At a minimum, schools are expected to produce students who have basic reading and

14
math skills, and pass rates on these exams serve as good indicators of how schools perform in
furnishing students with these skills. Since our primary concern is examining how span of
control variables affect performance when task difficulty varies, we run separate models for
student performance at the third, seventh and tenth grade levels. Our prediction is that span of
control or unit size will matter more for seventh grade student performance than it will for third
or tenth grade performance.
Findings
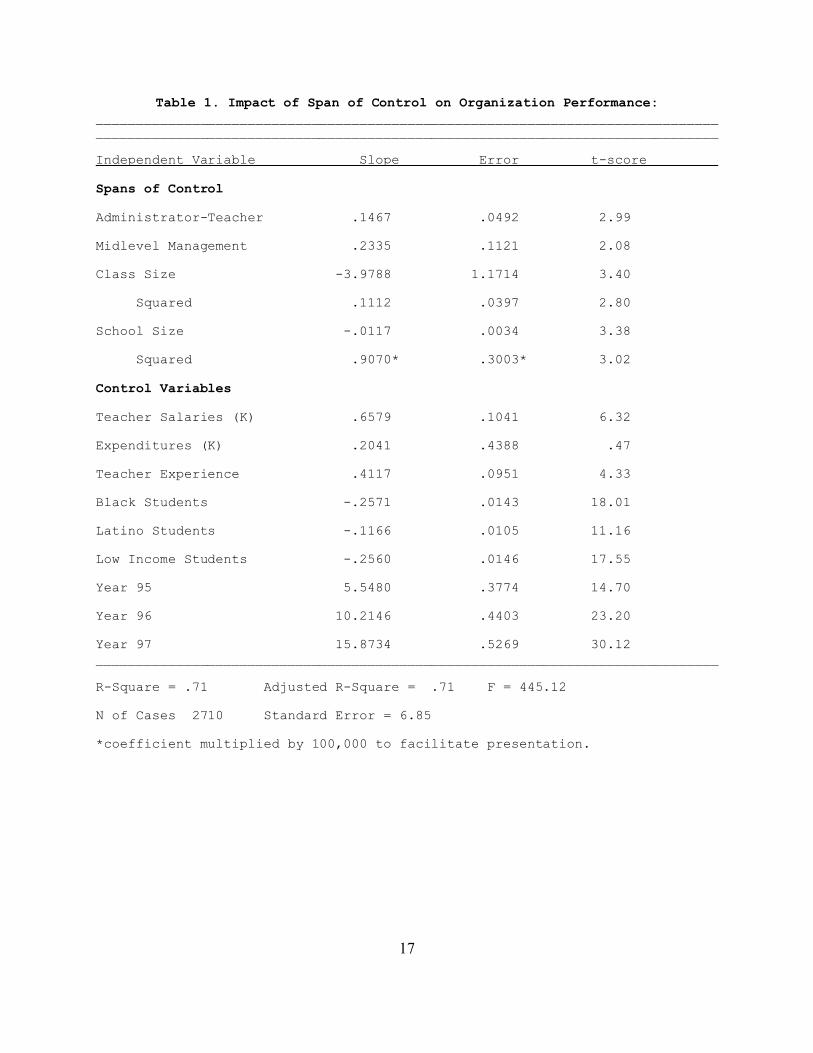
To provide a base of comparison for the impact of span of control as it interacts with task
difficulty, table 1 estimates our model for all test scores. The control variables are generally
consistent with theoretical expectations and will not be discussed here. Each span of control
variable works as predicted. The relationship for production level and midmanagement spans of
control with performance is positive, broader spans of control are associated with better student
performance. Both class size and school size have nonlinear relationships with student
performance. Student performance improves as schools and classes get smaller, but the impact
diminishes and eventually performance starts to degrade.
[Table 1 About Here]
The span of control relationships for grades three, seven and ten form the key test of
whether the relationship between structure and performance is contingent on task demands.
Table 2 reports the relationships for the span of control variables only (the control variable
relationships are not reported). For relatively easy tasks (grade 3) much of the impact of spans of
control disappear. Midlevel management and the two relationships for class size are no longer
significant. Span of control matters at this level, but less so than overall. For moderately

15
difficult tasks (grade 7) a reasonably strong set of relationships exist between spans of control
and student performance. Only the midmanagement level span of control is not significant. All
five other relationships are significant in the direction predicted. The clearest findings are for
more difficult tasks (grade 10). The only span of control variable that matters is school size; the
others fail to meet traditional standards of statistical significance.
[Table 2 About Here]
The overall results of table 2 are generally consistent with the notion that task difficulty
influences the relationship between structure and performance. For moderately difficult tasks,
the relationship between spans of control and student performance are strongest. For more
difficult tasks, the relationships are relatively weak with only one factor still important. For
relatively easy tasks, span of control matters some, but less than for moderately difficult tasks.
Can This Finding Be Generalized?
Although our study has focused on the effects span of control relationships have in one
type of organizational setting, the relationships between span of control and task difficulty found
here suggest some broader lessons about the strategies organizations can use to manage
problems. One lesson is that problem difficulty has implications for determining the extent to
which organizational resources should be directed to the establishment and maintenance of
organizational structures. When problems are insensitive to the manipulation of organizational
structures, management should not spend much time considering structural variables. One
possible direction for future research is examining the cost-benefit calculations organizations use
in determining which problems are likely to benefit from the manipulation of organizational
structures and which are not.

16
Our findings also suggest that when problems are extremely difficult, the best strategy for
organizations may be one of redefining these problems into ones that can be managed through
structural means. Prison officials recognize that rehabilitation is desirable but also recognize that
manipulating organizational structures (and virtually anything else) will likely do little to
advance this goal. Realizing the limits of structural solutions, prison officials move away from
the goal of rehabilitation and toward a strategy of controlling inmates, something that can be
dealt with through the manipulation of organizational structures. In a similar vein, school
administrators recognize that manipulating organizational structures is unlikely to cause dramatic
improvements in the performance of tenth or eleventh grade students from at-risk groups. Thus,
more resources may be directed to structural variables that meet simpler goals such as keeping
students in school, rather than those directed toward the goal of producing well-educated high
school students.
Finally, our findings indicate that structure is not a “one size fits all” solution to coping
with organizational problems (see also Worthy 1959). The impact of organizational structures on
performance varies with task difficulty. Using span of control as our structural variable, we
found that structure had a limited impact in improving student performance at the very early
grades as well at the high school level. The greatest effects of structure were felt in improving
student performance at the seventh grade, a moderately difficult task scenario. Although we only
demonstrated the interaction between structure and task difficulty with span of control, no logical
reason exists why this interaction will not hold for other structural variables. Only future
research, however, can confirm this speculation.
17
Table 1. Impact of Span of Control on Organization Performance:____________________________________________________________________________________________________________________________________________________________
Independent Variable Slope Error t-score
Spans of Control
Administrator-Teacher .1467 .0492 2.99
Midlevel Management .2335 .1121 2.08
Class Size -3.9788 1.1714 3.40
Squared .1112 .0397 2.80
School Size -.0117 .0034 3.38
Squared .9070* .3003* 3.02
Control Variables
Teacher Salaries (K) .6579 .1041 6.32
Expenditures (K) .2041 .4388 .47
Teacher Experience .4117 .0951 4.33
Black Students -.2571 .0143 18.01
Latino Students -.1166 .0105 11.16
Low Income Students -.2560 .0146 17.55
Year 95 5.5480 .3774 14.70
Year 96 10.2146 .4403 23.20
Year 97 15.8734 .5269 30.12______________________________________________________________________________
R-Square = .71 Adjusted R-Square = .71 F = 445.12
N of Cases 2710 Standard Error = 6.85
*coefficient multiplied by 100,000 to facilitate presentation.

18
Table 2. Span of Control and Task Difficulty: Third, Seventh, and Tenth Grades____________________________________________________________________________________________________________________________________________________________ Grade LevelSpan of Control Measure Third Seventh Tenth
Administrator-Teacher .1647 .2239 -.0559ns (.0783) (.0681) (.0717)
Midlevel Management .2558ns -.0530ns .1044ns (.1786) (.1553) (.1633)
Class Size -.7022ns -5.5731 -.9727ns (1.8633) (1.6274) (1.7089)
Squared .0246ns .1515 -.0050ns (.0631) (.0551) (.0579)
School Size -.0161 -.0147 -.0160 (.0054) (.0048) (.0050)
Squared 1.5260* .9336* 1.2040* (.4786) (.4159) (.4383)
______________________________________________________________________________
Adjusted R-Square .42 .62 .52
Standard Error 10.89 9.48 9.93
F 131.13 297.77 194.31
N 2707 2704 2690
*coefficient multiplied by 100,000 to facilitate presentation.
Control variables are omitted from the table.
Standard errors are in parentheses.
ns = not significant
19
References
Bell, Gerald. 1967. “Determinants of Span of Control.” American Journal of Sociology 73 (July): 90-101.
Betts, Julian R. 1995. “Does School Quality Matter? Evidence from the National Longitudinal Surveyof Youth.” Review of Economics and Statistics 77 (May): 231-50.
Blau, Peter M. 1973. The Organization of Academic Work. New York: John Wiley and Sons.
Blau, Peter M. and Richard A. Schoenherr. 1971. The Structure of Organizations. New York: BasicBooks.
Bowman, Ann O’M. and Richard Kearney. 1996. State and Local Government, 3rd ed. Boston, MA:Houghton-Mifflin.
Coleman, James S. et al., 1966. Equality of Educational Opportunity. Washington, D.C.: U.S.Government Printing Office.
Golembiewski, Robert T. 1962. Behavior and Organization: O&M and the Small Group. Chicago:Rand-McNally.
Goodsell, Charles. 1994. The Case for Bureaucracy, 3rd ed. Chatham, NJ: Chatham House Publishers,Inc.
Graicunius, V. A. 1937. “Relationship in Organization.” in Luther Gulick and Lydal Urwick, Eds.,Papers on the Science of Administration, pp. 183-187. New York. Institute of PublicAdministration, Columbia University.
Gulick, Luther. 1937. “Notes on the Theory of Organization” in Luther Gulick and Lydal Urwick Eds.,
Papers on the Science of Administration, pp. 191-5. New York. Institute of PublicAdministration, Columbia University.
Hammond, Thomas. 1990. “In Defence of Luther Gulick’s ‘Notes on the Theory of Organization.’”Public Administration, vol. 68, 143-173.
Hanushek, Erik. 1986. “The Economics of Schooling: Participation and Performance.” The Journal ofEconomic Literature, vol. 24: 1141-1177.
Hanushek, Erik. 1996. “School Resources and Student Performance.” In Does Money Matter?, GaryBurtless, ed. Washington, D.C.: Brookings Institution.
Hanushek, Erik, and Richard R. Pace. 1995. “Who Chooses to Teach (and Why)?” Economics ofEducation Review, vol. 14: 107-17.
Hedges, Larry V. and Rob Greenwald. 1996. “Have Times Changed? The Relation Between SchoolResources and Student Performance.” In Does Money Matter?, Gary Burtless, ed. Washington,D.C.: Brookings.
20
Jencks, Christopher, and Meredith Phillips Eds. 1998. The Black-White Test Score Gap. Washington,D.C.: The Brookings Institution.
Kaufman, Herbert. 1981. The Administrative Behavior of Federal Bureau Chiefs. Washington, D.C.: TheBrookings Institution.
Lipsky, Michael. 1980. Street-Level Bureaucracy: Dilemmas of the Individual in Public Services. NewYork: Russell Sage Foundation.
Meier, Kenneth J. and Joseph Stewart, Jr. 1991. The Politics of Hispanic Education. Albany: SUNYPress.
Melman, Seymour. 1956. Dynamic Factors in Industrial Productivity. Oxford: Basil Blackwell.
Miller, Danny and Peter H. Friesen. 1984. Organizations: A Quantum View. Englewood Cliffs:Prentice-Hall.
Mintzberg, Henry. 1979. The Structuring of Organizations. Upper Saddle River, NJ: Prentice Hall.
Moe, Ronald C. 1994. "The Reinventing Government Exercise: Misinterpreting the Problem, Misjudgingthe Consequences." Public Administration Review, 54: 111-122.
Osborne, David and Ted Gaebler. 1992. Reinventing Government: How the Entrepreneurial Spirit isTransforming the Public Sector. New York: Penguin Books USA.
Perrow, Charles. 1973. “A Framework for Comparative Analysis of Organizations.” In F.E. Kast and J.E.Rosenzweig (eds.), Contingency Views of Organization and Management. Chicago, ScienceResearch Associates.
Perrow, Charles. 1986. Complex Organizations: A Critical Essay, 3rd ed. New York: McGraw-Hill.
Price, James L. and Charles W. Mueller. 1986. Handbook of Organizational Measurement. WhitePlains, NY: Longman.
Rainey, Hal. G. 1997. Understanding and Managing Public Organizations, 2nd ed. San Francisco: Josey-Bass Publishers.
Rong, Xue Lan and Linda Grant. 1992. “Ethnicity, Generation, and School Attainment of Asians,Hispanics, and Non-Hispanic Whites.” Sociological Quarterly vol. 33, no. 4: 625.
Simon, Herbert. 1946. “The Proverbs of Administration.” Public Administration Review, vol 4. no. 1: 16-30.
Stimson, James. 1985. “Regression in Time and Space: A Statistical Essay.” American Journal ofPolitical Science, 29, no. 4: 914-947.
Van de Ven, Andrew H., Andre L. Delbecq, and Richard Koenig. 1976. “Determinants of Coordination

21
Modes Within Organizations.” American Sociological Review 41: 322-338.
Wenglinsky, Harold. 1997. How Educational Expenditures Improve Student Performance and How TheyDon’t. Princeton, NJ: Educational Testing Service.
Worthy, James. C. 1950. “Organizational Structure and Employee Morale.” American SociologicalReview, vol 15: 169-179.
Worthy, James C. 1959. Big Business and Free Men. New York: Harper and Brothers.
Wilson, James Q. 1989. Bureaucracy. New York: Basic Books.
Wilson, James Q. 1985. Thinking About Crime. New York: Vintage.
Woodward, Joan. 1980. Industrial Organization: Theory and Practice, 2nd ed. New York: OxfordUniversity Press.