Embed Size (px)
Citation preview
APPROVED: Darrell M. Hull, Major Professor Robin K. Henson, Committee Member Bertina Combes, Committee Member Prathiba Natesan, Committee Member Abbas Tashakkori, Chair of the Department
of Educational Psychology Jerry R. Thomas, Dean of the College of
Education James D. Meernik, Acting Dean of the
Toulouse Graduate School
STRUCTURAL VALIDITY AND ITEM FUNCTIONING
OF THE LOTI DIGITAL-AGE SURVEY
Vandhana Mehta, B.Sc. Honors, B.Ed. M.A.
Dissertation Prepared for the Degree of
DOCTOR OF PHILOSOPHY
UNIVERSITY OF NORTH TEXAS
May 2011

Mehta, Vandhana. Structural validity and item functioning of the LoTi digital-age survey
The present study examined the structural construct validity of the LoTi Digital-Age
Survey, a measure of teacher instructional practices with technology in the classroom. Teacher
responses (N = 2840) from across the United States were used to assess factor structure of the
instrument using both exploratory and confirmatory analyses. Parallel analysis suggests retaining
a five-factor solution compared to the MAP test that suggests retaining a three-factor solution.
Both analyses (EFA and CFA) indicate that changes need to be made to the current factor
structure of the survey. The last two factors were composed of items that did not cover or
accurately measure the content of the latent trait. Problematic items, such as items with cross-
loadings, were discussed. Suggestions were provided to improve the factor structure, items, and
scale of the survey.
.
Doctor of Philosophy (Education Research), May 2011, 122 pp., 11 tables, 5 illustrations,
reference list, 159 titles.

ii
Copyright 2011
by
Vandhana Mehta

iii
ACKNOWLEDGEMENTS
I would like to take this opportunity to thank everyone who helped make it possible for
me to complete this dissertation. First, I am very grateful to Dr. Darrell Hull, my major
professor, for his support and encouragement throughout this dissertation. He is an excellent
mentor and has really allowed me to seek my potential. Second, I would like to thank Dr. Robin
Henson, Dr. Prathiba Natesan, and Dr. Bertina Combes for participating in my dissertation
committee and providing valuable feedback. Third, I would like to thank The LoTi Connection,
Inc, Dr. Moersch, and Dennee Saunders for providing the dataset and letter of permission to
make this study possible. I would like to thank my boss, Dr. Dash Weersinghe, for his patience
and understanding during this time period, and allowing me to work a lighter schedule in order to
finish this dissertation.
I especially would like thank my husband, Sandeep, and my son, Sanil, for their patience
and understanding during this process. To my dear Sandeep, I could not have done this without
your dedication, commitment and encouragement. Finally, I would like to thank my Goddess,
Mata Durga, for strength, wisdom and power. I feel she is the one who gave me the ability to
manage to this doctoral program, a job, and now another pregnancy.

iv
TABLE OF CONTENTS
Page ACKNOWLEDGEMENTS ........................................................................................................... iii LIST OF TABLES ...........................................................................................................................v LIST OF ILLUSTRATIONS ......................................................................................................... vi A STRUCTURAL VALIDITY AND ITEM FUNCTIONING STUDY OF THE DIGITAL-AGE VERSION OF THE LOTI QUESTIONNAIRE ..............................................................................1
Introduction ..........................................................................................................................1 Method .................................................................................................................................3 Results ..................................................................................................................................5 Discussion ............................................................................................................................7 References ..........................................................................................................................15
Appendices
A. EXTENDED LITERATURE REVIEW ................................................................21 B. DETAILED MTHODOLOGY ..............................................................................63 C. UNABRIDGED RESULTS ...................................................................................71 D. OTHER ADDITIONAL MATERIAL ...................................................................84
COMPREHENSIVE REFERENCE LIST ...................................................................................106

v
LIST OF TABLES
Page 1. Exploratory Factor Analysis: GEOMIN Rotated Loadings for LoTi Digital-Age Items
............................................................................................................................................12
2. CFA Factor Loadings with respect to the Model shown in Figure 1 .................................13
A.1 Description of Each Factor in the LoTi Digital-Age Survey .............................................32
A.2 Framework for Analyzing Characteristics and Benchmarks of Technology Implementation According to the Teacher’s LoTi Level ..................................................34
A.3 Score Reliability (Cronbach’s Alpha) for Each Section and Overall LoTi Survey ...........36
A.4 Variables Involved in Confirmatory Factor Analysis ........................................................68
C.1 Estimated Item Parameters for the Modified Graded Response Model and Item Chi-Square Fit Statistics for Factor ...........................................................................................73
C.2 Estimated Item Parameters for the Modified Graded Response Model and Item Chi-Square Fit Statistics for Factor ...........................................................................................74
C.3 Estimated Item Parameters for the Modified Graded Response Model and Item Chi-Square Fit Statistics for Factor ...........................................................................................75
C.4 Estimated Item Parameters for the Modified Graded Response Model and Item Chi-Square Fit Statistics for Factor ...........................................................................................76
C.5 Estimated Item Parameters for the Modified Graded Response Model and Item Chi-Square Fit Statistics for Factor ...........................................................................................76

vi
LIST OF ILLUSTRATIONS
Page
1. Path diagram of a confirmatory factor model ....................................................................14
A.1 Original and revised versions of Bloom’s taxonomy ........................................................32
A.2 An example of an item characteristic curve for a 3-parameter logistic model ..................34
C.1 Item characteristic curve for Item Q40 ..............................................................................73
C.2 Item characteristic curve for Item Q17 ..............................................................................74
1
A STRUCTURAL VALIDITY AND ITEM FUNCTIONING STUDY OF
THE LOTI DIGITAL-AGE STUDY
Introduction
Many educators, policymakers, researchers, and government officials want to understand
teachers’ technology-related concerns and professional development needs, how teachers are
adapting technology in their classrooms, and how students are using the available technologies in
their classroom. Many research studies on the levels of technology implementation have
confirmed that use of technology in the classroom is a complex and multistage paradigm (Hope,
1997; Moersch, 2001; Mills, 2002; Mills & Tincher, 2003; Newhouse, 2001; Vaughan, 2002). In
the last 10 years, various instruments have been created to assess the level of technology use in
the classroom (Adams, 2003; Atkins & Vasu, 2000; Martin, 1989; Marcinkiewiez & Welliver,
1993; Mills, 2002), one of which is the LoTi framework and instrument (Moersch, 1995a,
1995b).
The Levels of Technology Implementation Framework and Questionnaire
The levels of technology implementation (LoTi) framework and questionnaire (Moersch,
1995a, 1995b) was developed in response to the federal No Child Left Behind Act (2001)
requiring the use of evaluation tools and techniques based on scientifically based research
(National Research Council, 2002). The LoTi framework and questionnaire is used to measure
specific levels of technology integration at the local, district and state level. The purpose of the
LoTi (Moersch, 2001), is to provide “policy makers, school administrators, and classroom
practitioners with the most consistent data to make informed decisions as to the real needs for
improving the technology infrastructure beyond hardware and software issues” and also to plan
for “the type of professional development interventions needed to maximize the level of
2
technology implementation in the classroom” (p. 97). As Moersch (2001) states, LoTi “… is a
conceptual model that focuses more on instruction and assessment and less on technology as a
detached phenomenon” (p. 93).
The LoTi framework can be viewed as a two by two cross-product based on Bloom’s
taxonomy and concerns-based adoption model (CBAM) levels (G. Knezek, personal
communication, November 27, 2009). LoTi is conceptually aligned and based on the levels of
innovation of the CBAM (Hall, Loucks, Rutherford & Newlove, 1975), research on the
implementation of multimedia/telecommunication in the classroom (Thomas & Knezek, 1991),
research results from Apple’s Classroom of Tomorrow (Dwyer, Reinstaff, & Sandholtz, 1992),
and his own research from observing hundreds of classrooms at the national level (Moersch,
1995a, 1995b).
The latest and most current version of the LoTi instrument is the LoTi Digital-Age
Survey. It has been redeveloped to be aligned with ISTE’s National Educational Technology for
Teachers (LoTi Connection, 2009). The acronym “LoTi” has been updated to represent “levels
of technology innovation” instead of “levels of technology implementation.” The LoTi
framework has evolved into a conceptual model to measure teachers’ technology implementation
in the classroom according to the National Educational Technology Standards for Teachers
(NETS-T). The new framework (LoTi Connection, 2009):
focuses on the delicate balance between instruction, assessment, and the effective use of
digital tools and resources to promote higher order thinking, engaged student learning,
and authentic assessment practices in all the classroom – all vital characteristics of the
21st Century teaching and learning.
The survey creates a personalized digital-age professional development profile and offers
recommendations aligned to the five popular instructional initiatives. As in the previous versions,

3
the survey provides separate Level of Teaching Innovation (LoTi), Current Instruction Practices
(CIP) and Personal Computer Use (PCU) scores.
An extensive literature search revealed no empirical work to support the factor structure
found in the digital-age version. Moreover, there have been changes to items in the digital-age
version of the LoTi Survey to reflect measures of teaching practices and technology use in the
classroom. The five factors proposed to be measured for the Digital-Age Survey (LoTi
Connection, n.d.) include:
Factor 1: Digital work and learning
Factor 2: Digital-age learning experience and Assessments
Factor 3: Student learning and creativity
Factor 4: Professional growth and leadership
Factor 5: Digital citizenship and responsibility
Purpose of the Study
The purpose of this study was to review the structural validity of the LoTi Digital-Age
Survey by conducting an exploratory factor analysis (Brown, 2006; Harrington, 2008;
Thompson, 2004) and a confirmatory factor analysis (Gorsuch, 1983; Kline, 1983; Loehlin,
2004; Thompson, 2004).
Method
Sample
Teachers (N = 2840) in the United States completed the LoTi Digital-Age Survey
between January 1 to June 30 2009. The sample contains 47% elementary school teachers, 21%
intermediate, and 24% secondary school teachers. About 3% of the sample considered
4
themselves as “all grade teachers” and approximately 5% of the teachers did not report grade
levels taught.
Instrument
The survey was completed entirely online through the publisher’s website. The survey
takes approximately 20 to 25 minutes to complete, and consists of 37 Likert-type items.
Categorical response options for all items are never, at least once a year, at least once a
semester, at least once a month, a few times a month, at least once a week, a few times a week,
and at least once a day that correspond with a numeric value from 0 to 7, respectively.
Data Analyses
Descriptive statistical analysis was conducted to investigate scaling, missing data,
collinearity, and outlier detection. The normality of the scores from items was investigated by
assessing skewness and kurtosis, where a normal distribution is indicated by values closer to 0.0
(Liu, 2009). An exploratory factor analysis (EFA) was performed on half of dataset (n = 1420)
and a confirmatory factor analysis (CFA) was conducted on the other half of dataset (n = 1420)
with the model derived from the EFA. Also, another CFA was conducted to investigate the factor
structure proposed by the publisher (LoTi Connection, n.d.). The path diagram representing the
hypothesized factor structure is shown in Figure 1. Data analyses for both CFAs used maximum
likelihood estimation and were conducted using LISREL 8.8. Multiple imputation was the
technique used to handle the missing data used for both analyses (EFA and CFA).
To assess the dimensionality of the items, an item-level factor analysis (Bernstein &
Teng, 1989; Muthén & Kaplan, 1992) was conducted for one to eight factors using Mplus
(Version 5). The resulting factor solutions (1-factor to 8-factor) were assessed against the
following criteria: (a) unrotated factors needed to satisfy Guttman’s (1954) criterion of
5
eigenvalues greater than 1.00, (b) solutions meeting Cattell’s (1966) minimum scree
requirement, (c) each rotated factor was required to include at least two pattern coefficients (i.e.,
loadings > 0.30), (d) the resulting factor solution was examined by parallel analysis (Hayton,
Allen, & Scarpello, 2004), and (e) the resultant factor solution should have a greater number of
factors than suggested by the minimum average partial (MAP) test (Townsend & Konold, 2010).
With respect to CFA, fit indices and parameter standard errors acquired from maximum
likelihood estimation were adjusted for nonnormality using Satorra-Bentler adjustments (Satorra
& Bentler, 1994). Several fit indices were used to evaluate model fit, including the Satorra-
Bentler chi-square (S-B χ2), standardized root mean residual (SRMR), root mean square error of
approximation (RMSEA), and comparative fit index (CFI). SRMR can be abstractly viewed as
the average difference between the correlations observed in the input matrix and the correlations
predicted by the model. The following cutoff criteria (Hu & Bentler, 1999) were used as
guidelines for reasonably good fit between the target model and the observed data: (1) SRMR
values close to 0.08 or below, (2) RMSEA values close to 0.06 or below, and (3) CFI and TLI
values close to 0.95 or greater. In addition, residuals and modification indices were examined to
detect local areas of misfit in CFA solutions.
Results
Internal consistency reliability of the scores obtained from items on the LoTi Digital-Age
survey with the present sample was 0.90. For 15 of the 37 questions, the skewness statistic was
less than -1.00 suggesting a skewed dataset. Furthermore, using LISREL, test of univariate and
multivariate normality for continuous variables were performed and indicated a highly skewed
6
data (p < 0.001). In order to be able to conduct the CFA, the asymptotic covariance matrix was
used instead of the raw data.
The EFA eigenvalues, screeplots, and pattern coefficients indicated that it is possible to
retain up to 7 factors. Three factors were retained based on the MAP test, whereas five factors
were retained with a parallel analysis. Since parallel analysis is considered to be one of the most
accurate methods (e.g., Velicer et al., 2000; Zwick & Velicer, 1986), the 5-factor model shown
in Figure 1 was examined relative to the items retain with the 5-factor EFA solution. The first
factor appears to be Student Learning and Creativity, second factor appears to be Digital-Age
Learning Experiences and Assessments, third factor appears to be Digital-Age Work and
Learning, fourth factor appear to be Professional Growth and Leadership, and the fifth factor
appears to be Digital Citizenship and Responsibility. It can be easily noted that not the exact
same items load onto the same factor as shown in Figure 1; for example, Item Q27 loads on
Student Learning and Creativity factor in the EFA solution and on Professional Growth and
Leadership factor (see Figure 1). This implies that this question is not measuring the intended
factor (Professional Growth and Leadership) and needs to be reworded. Also, several items
cross-loaded on the first and second factors, meaning that these items are likely measuring two
factors. Squared factor loadings were used to determine whether the measures were associated
with the latent dimension (Brown, 2006). Items 4, 5 and 40 have very high factor loadings and
explain 60% or more of the variance, whereas Items 6, 15 and 49 have much smaller loadings
and explain 10% of the variance of the first factor. Hence, Items 4, 5, and 40 are meaningful
associated with its latent dimension compared to Items 6, 15, and 49. Similarly, Items 31 and 50
are meaningful associated to the second factor, and Items 40 and 45 are meaningful associated
with the third factor. For the fourth factor, all the factor loadings are very small and indicate that
7
they each explain approximately 10% of the variance of this factor. This shows that the items on
Professional Growth and Leadership factor are not meaningfully associated with the latent trait.
For the fifth factor, Items 21, 25, and 42 explain from 16% to 20% of the variance of this factor.
Lastly, Item 48 did not load on any of the factors; therefore this item is already accounted by
another or several items (see Table 1).
A CFA was conducted on the empirically derived EFA solution, and based on the
Satorra-Bentler chi-square statistic and fit indices (S-B χ2 = 2053.18, df = 542, RMSEA = 0.044,
CFI = 0.97, SRMR = 0.053) the model possesses reasonably good fit with the observed data.
A CFA was also conducted on the model shown in Figure 1, and based on the Satorra-Bentler
chi-square statistic and fit indices (S-B χ2 = 4018.82, df = 612, RMSEA = 0.062, CFI = 0.94,
SRMR = 0.061) the model possesses marginally good fit with one of its factors completed
unmeasured by the items proposed. CFA factor loadings for this model are shown in Table 2.
Discussion
The current study is an important step toward gathering validity evidence for the LoTi
Digital-Age Survey. The results from this investigation reveal that the factor structure of this
survey should be reconsidered since in the 5-factor EFA solution one of the factors is
unmeasured by its items, and the CFA conducted on the 5-factor model shown in Figure 1 was
marginally acceptable. Parallel analysis suggests retaining a 5-factor model compared to the
MAP test for which three factors would be retained. Consequently, new items need to be
developed or changes need to be made to the existing items based on the item factor loadings in
the EFA. Lastly, the scale of the instrument should be revised to reflect a more straightforward
indication of the pattern of factors measured by the instrument.
8
From the EFA results (see Table 1), the first factor has approximately two-thirds of the
items loading on it. Some of these items can be categorized by the content of the question, such
as creative learning, problem solving, collaborative learning, or local/global communities For
example, five items (Q14, Q21, Q26, Q42 and Q43) cover content on using technology and
understanding local/global communities. It seems that the first factor is really composed of two
distinct constructs: (1) Student Learning and Creativity, and (2) Application to Global
Environments. With the second factor, all five items intended to measure this factor actually did
load on, yet none of these items mention use of technology. These items are questions about
teacher preparation for student instruction and assessment. Hence, the name of this factor might
be Instruction and Assessment, and all of the items should be rewritten to incorporate technology
use. With the third factor, Digital-Age Work and Learning, all of the items have to do with the
use of digital tools and resources to support student learning. Some of these items were cross-
loading with the first factor and it was difficult to determine if these items fall under the first or
third factor since they are covering similar content. In addition, the correlation between the first
and third factors was highest amongst all the factors at 0.412, indicating that the items are asking
similar questions. Therefore, items measuring the third factor should be placed under the first
factor. The fourth factor, Professional Growth and Leadership, is comprised of three items with
factor loadings around 0.3. None of these items measuring the fourth factor covered any content
on Professional Growth and Leadership and hence, it implies that this latent dimension does not
exist. This dimension should be removed or items need to be developed for this factor. Questions
should cover content on professional development opportunities accessible to teachers, such as
be around if teachers are attending workshops and if they are providing technology instruction to
other teachers. The last factor, Digital Citizenship and Responsibility, has two items with

9
positive factor loadings and two items with negative factor loadings. The two items with positive
factor loadings cross-load with the first factor, and are about technology use and application to
global communities. The two items with negative factor loadings are not reversed worded and
are about the ethical use of technology. The score reliability for this factor was extremely low.
An alpha of 0.094 was obtained when Item Q42 was removed. This indicates very poor
reliability of the subscale and the items that load on it. Given the inability to measure this
construct with the items available, this construct should be removed from the instrument.
As the survey currently stands, it is measured by a three-factor model. When considering
the content of items that measure these factors, it may be more helpful to consider renaming the
constructs measured as (a) Student Learning and Creativity, (b) Application to Global
Environments, and (c) Instruction and Assessment.
Several types of problematic items were observed. There were several items cross-
loading on two factors indicating that these items are addressing two factors. For example, Item
Q46 cross-loads on the first and second factors since it mentions about “problem solving” and
“higher-order thinking.” Items that cross-load should be rewritten to address only one factor.
Next, there are items that implying the same question within the same factor or a different factor.
For example, Items Q10 and Q21 both load on the first factor and address the same question.
Situations like these should be avoided and one of the items should be removed. The third
problem is that there were several questions loading on a factor, but did not fit the topic of the
factor. For example, Item Q31 loaded on the first factor and discussed teacher preparation rather
than student learning. The questions should be removed or rewritten according to the factor, in
this case Professional Growth and Development. Lastly, questions without mention of
technology should be removed since this is an educational technology implementation survey.
10
The scale of the survey (i.e., 0 for never to 7 for at least once a day) measures frequency;
that is, how often technology is being used in the classroom, not quality of implementation. In
other words, this instrument provides an understanding of the level of technology
implementation provided by the teacher, but it does not address the quality of the technology
implementation in the classroom. It is important for the scale to describe different levels of
technology implementation by a teacher. Since LoTi surveys are originally based on the CBAM
model (Hall et al., 1975), a scale of similar nature to the Levels of Use component should be
incorporated. In addition, future research should examine parameter invariance over time,
meaning the scale teachers are being measured on is invariant. In terms of the current scale and
observing current technology trends, teachers no longer use technology once a year or once a
semester, they most likely use it on a daily or at least weekly basis for student learning,
instruction, assessment, and lesson development. Therefore, the scale should be updated with
current practice since the level of technology use is evolving. Because of this, the survey results
from one year to the next could possibly contain measurement error and result in misleading
outcomes. Therefore, the item response continuum should be revised to reflect current practices
or represent quality of implementation of technology in the classroom. Furthermore, longitudinal
measurement invariance would reveal temporal changes in the representation of constructs over
time (Brown, 2006).
Educational administrators can expect this survey to provide reliable information on
frequency of technology implementation occurring in the classroom in three dimensions: Student
Learning and Creativity, Application to Global Environments, and Instruction and Assessment.
A principal might use this survey to assess how often technology is being used in the classroom
to enhance student learning and promote creative thinking. Since our economy has become more

11
globally competitive, administrators might use the results from the survey to assess how
technology is being used to assist students to understand these global environments or cultures.
This survey will also allow a principal to assess the amount of variation in instruction and
assessment using technology provided in the classroom. Although changes, as noted above, are
necessary for this sort of information to be available in teacher reports from the LoTi Digital-
Age Survey.
Following the recommendations here would require future examination of the constructs
measured by the LoTi Digital-Age Survey. It may be useful to conceptually reconsider the
number of factors desired to be assessed in technology implementation. This has implications for
standard setting institutions, such as ISTE, such that standards recommend for assessment has
practical attributes since organizations, such as LoTi, attempt to develop instruments to measure
these standards in the classroom.
Limitations
A central limitation in this study is the lack of demographic information about the
respondents. It is impossible to know if the sample generalizes to the entire educator population.
It would be helpful to consider establishing a norm-representative sample for LoTi, possibly
considering geographic region along with gender ethnic background, and age of respondents.
The data provided for this analysis contained some missing responses. For each of the 37
items, less than 1% of the responses were identified as missing.

12
Table 1
Exploratory Factor Analysis: GEOMIN Rotated Loadings for LoTi Digital-Age Items (N =
1420)
Loadings
Item Student learning
& creativity
Digital-age
learning
experiences & assessments
Digital-age
work &
learning
Professional
growth &
leadership
Digital
citizenship &
responsibility
Q1 0.237 0.152 0.428 0.014 -0.076
Q4 0.803 -0.140 -0.025 -0.060 -0.098
Q5 0.788 0.007 0.039 -0.292 -0.005
Q8 0.430 0.290 0.097 0.041 -0.070
Q10 0.676 0.036 -0.066 0.084 0.254
Q14 0.675 -0.020 0.057 0.095 -0.034
Q21 0.684 -0.038 -0.024 -0.057 0.402
Q22 0.572 0.168 -0.032 -0.002 -0.191
Q36 0.265 0.309 0.247 -0.069 -0.238
Q38 -0.011 0.137 0.573 -0.027 -0.094
Q40 0.760 -0.003 -0.135 0.012 -0.164
Q47 0.688 -0.097 0.100 0.048 0.055
Q6 0.324 0.431 0.017 0.019 0.138
Q20 0.287 0.532 -0.053 0.030 0.004
Q32 -0.032 0.650 0.016 -0.004 0.115
Q41 0.409 0.326 -0.030 0.000 0.177
Q50 -0.069 0.659 -0.051 0.105 -0.030
Q13 0.304 0.014 0.310 0.107 0.084
Q15 0.313 -0.046 0.432 0.104 0.081
Q18 0.275 0.028 0.378 0.017 0.025
Q26 0.419 0.109 0.142 0.028 0.252
Q43 0.533 0.270 -0.030 0.036 0.004
Q46 0.414 0.372 0.074 -0.010 -0.131
Q49 0.362 0.036 0.176 0.248 -0.058
Q16 -0.126 0.189 0.101 0.326 -0.032
Q17 0.074 -0.030 0.179 0.340 0.222
Q27 0.380 0.286 0.077 0.053 -0.181
Q30 0.023 0.397 0.305 -0.035 0.101
Q31 0.397 0.160 0.111 0.006 0.147
Q37 0.698 -0.021 0.167 -0.273 0.029
Q45 -0.031 -0.006 0.714 0.001 -0.099
Q12 0.078 0.131 -0.047 0.283 -0.314
Q19 0.001 0.410 0.255 -0.186 -0.051
Q23 0.016 -0.011 0.250 0.315 -0.207
Q25 0.050 0.205 0.085 0.063 -0.392
Q42 0.503 0.026 -0.036 -0.039 0.446
Q48 0.034 0.080 0.142 0.107 0.086
Note. Factor loadings > 0.30 are in boldface.

13
Table 2
CFA Factor Loadings with respect to Model shown in Figure 1 (N = 1420)
CFA Loading
Item Student
Learning &
Creativity
Digital-Age
Learning
Experiences & Assessments
Digital-Age Work &
Learning
Professional Growth &
Leadership
Digital Citizenship &
Responsibility
Q5 0.7110
Q47 0.7072
Q4 0.6962
Q14 0.6767
Q40 0.6748
Q22 0.6390
Q10 0.5874
Q21 0.5786
Q8 0.5363
Q1 0.5069
Q36 0.4881
Q38 0.3407
Q6 0.6282
Q41 0.6107
Q20 0.5531
Q32 0.4172
Q50 0.3305
Q43 0.6077
Q15 0.5457
Q46 0.5334
Q13 0.4703
Q18 0.4164
Q49 0.4097
Q37 0.6556
Q31 0.5261
Q27 0.5043
Q30 0.4367
Q45 0.3832
Q17 0.2905
Q16 0.1139
Q42 0.1224
Q19 0.0617
Q48 0.0609
Q23 0.0509
Q25 0.0507
Q12 0.0325

14
Digital-Age
Work &
Learning
Digital-Age
Learning Experiences &
Assessments
Student
Learning & Creativity
Professional
Growth &
Leadership
Digital
Citizenship &
Responsibility
Q13 Q15
Q18 Q26
Q6
Q20
Q32 Q41
Q46 Q43
Q49
Q16
Q50
Q4 Q1
Q17 Q12 Q19
Q27 Q30 Q23 Q25
Q42 Q48 Q31 Q37
Q45
Q5
Q14 Q10 Q8
Q36 Q22 Q21
Q47 Q40 Q38
Figure 1. Path diagram of a confirmatory factor model for the LoTi Digital-Age Survey.
15
References
Adams, N. B. (2003). Educational computing concerns of postsecondary faculty. Journal of
Research on Technology in Education, 34, 285-304.
Atkins, N. E., & Vasu, E. S. (2000). Measuring knowledge of technology usage and stages of
concern about computing: A study of middle school teachers. Journal of Technology and
Teacher Education, 8, 279-302.
Bernstein, I. H., & Teng, G. (1989). Factoring items and factoring scales are different: Evidence
for multidimensionality due to item categorization. Psychological Bulletin, 105, 465-477.
Brown, T.A. (2006). Confirmatory factor analysis for applied research. New York, NY:
Guilford Press.
Brown, M.W., & Cudeck, R. (1983). Alternating ways of assessing model fit. In. K. A. Bollen &
J.S. Long (Eds.), Testing structural equation models (pp. 445-455). Newbury Park, CA:
Sage.
Buja, A., & Eyuboglu, N. (1992). Remarks on parallel analysis. Multivariate Behavioral
Research, 27, 509-540.
Cattell, R.B. (1966). The scree test for the number of factors. Multivariate Behavioral Research,
1, 245-276.
Child, D. (1990). The essentials of factor analysis (2nd ed.). London: Cassel Educational
Limited.
Dwyer, D. C., Ringstaff, C., & Sandholtz, J. H. (1991). Changes in teachers’ beliefs and
practices in technology-rich classrooms. Educational Leadership, 48(8), 45–52.
Dwyer, D.C., Ringstaff, C., & Sandholtz, J.H. (1992). The evolution of teachers' instructional
16
beliefs and practices in high-access-to-technology classrooms first-fourth year findings.
Cupertino, CA: Apple Computer. Retrieved http://www.apple.com/education/
k12/leadership/acot/library.html
Eaton, C. A., Velicer, W. F., & Fava, J. L. (1999). Determining the number of components: An
evaluation of parallel analysis and the minimum average partial correlation procedures.
Unpublished manuscript.
Embretson, S.E., & Reise, S. P. (2000). Item response theory for psychologists. Mahwah, NJ:
Lawrence Erlbaum.
Geweke, J.F., & Singleton, K.I. (1980). Interpreting the likelihood ratio statistics in factor
models when sample size is small. Journal of the American Statistical Association, 75,
133-137.
Gorsuch, L.R. (1983). Factor analysis (2nd ed.). Hillsdale, NJ: Erlbaum.
Guttman, L. (1954). Some necessary conditions for common factor analysis. Psychometrika, 30,
179-185.
Hall, G. E., Loucks, S. F., Rutherford, W. L., & Newlove, B. W. (1975). Levels of use of the
innovation: A framework for analyzing innovation adoption. Journal of Teacher
Education, 26(1), 52–56.
Hambleton, R. K., Swaminathan, H., & Rogers, H. J. (1991). Fundamentals of item
response theory. Newbury Park, CA: Sage.
Harrington, D. (2008). Confirmatory factor analysis. New York, NY: Oxford University Press.
Hayton, J.C., Allen, D. G. & Scarpello, V. (2004). Factor retention decisions in exploratory
factor analysis: A tutorial on parallel analysis. Organizational Research Methods, 7, 191-
205.

17
Hope, W. C. (1997). Resolving teachers’ concerns about microcomputer technology. Computers
in the Schools, 13(3/4), 147-160.
Hu, L. & Bentler, P.M. (1998). Fit indices in covariance structure modeling: Sensitivity to
underparameterized model misspecification. Psychological Methods, 3, 424-453.
Hu, L. & Bentler, P.M. (1999). Cutoff criteria for fit indexes in covariance structure modeling:
Conventional criteria versus new alternatives. Structural Equation Modeling, 6, 1-55.
Kline, P. (1983). An easy guide to factor analysis. New York, NY: Routledge.
Liu, O.L. (2009). Evaluation of learning strategies scale for middle school students. Journal of
Psychoeducational Assessment, 27(4), 312-322.
Loehlin, J.C. (2004). Latent variable models: An introduction to factor, paths, and
structural equation analysis (4th ed.) Mahwah, NJ: Erlbaum.
Lord, F. M., & Novick, M. R. (1968). Statistical theories of mental test scores. Reading, MA:
Addison-Wesley.
LoTi Connection. (2009). LoTi (levels of technology innovation). Retrieved from
http://www.loticonnection.com
LoTi Connection. (n.d.). LoTi Digital-Age quick scoring device to create LoTi Digital-Age
professional development priorities graph.
Lyon, A.R. (2009). Confirmatory factor analysis of the School Refusal Assessment Scale-
Revised in an African American community sample. Journal of Psychoeducational
Assessment, 28, 511-523.
Marcinkiewicz, H. R. & Welliver, P. W. (1993). Procedures for assessing teachers' computer use
based on instructional transformations (pp. 7-8). New Orleans, LA: 15th National
Convention of the Association of Educational Communications and Technology.

18
Martin, J. B. (1989). Measuring the stages of concern in the development of computing
expertise (Unpublished doctoral dissertation). University of Florida, Gainesville, FL.
Mills, S. C. (2002). The technology implementation standards configuration matrix: A tool for
analyzing technology integration. National Forum of Applied Educational Research
Journal, 14(2). Retrieved from http://media.lsi.ku.edu/research/
NFAERJTechImp.html
Mills, S. C., & Tincher, R. C. (2003). Be the technology: A developmental model for evaluating
technology integration. Journal of Research on Technology in Education, 35(3).
Retrieved from http://media.lsi.ku.edu/research/JRTEBetheTechFinal.pdf
Moersch, C. (1995a). Levels of technology implementation (LoTi): A framework for
measuring classroom technology use. Retrieved from
http://loticonnection.com/ research.html
Moersch, C. (1995b). Levels of technology implementation (LoTi): A framework for measuring
classroom technology use [Supplement material]. Learning and Leading with
Technology, 23(4), 40-42. Retrieved from http://www.iste.org/inhouse/publications/
ll/26/8/40m/supplement/index.cfm?Section=LL_23_3
Muthén, B. O., & Kaplan, D. (1992). A comparison of some methodologies for the factor
analysis of non-normal Likert variables. British Journal of Mathematical and Statistical
Psychology, 38, 171-189.
National Research Council. (2002). Scientific research in education. In R. J. Shavelson, & L.
Towne (Eds.), Committee on scientific principles for educational research. Washington,
DC: National Academy Press.
Newhouse, C.P. (2001). Applying the concerns-based adoption model to research on
19
computers in classrooms. Retrieved from http://www.iste.org/Content/NavigationMenu/
Publications/JRTE/Issues/Volume_331/Number_5_Summer_2001/Applying_the_Concer
ns-Based_Adoption_Model_to_Research_on_Computers_in_Classrooms_Part_I.htm
Samejima, F. (1969). Estimation of latent ability using a response pattern of graded scores.
Psychometrika Monograph, No. 17.
Samejima, F. (1996). The graded response model. In W.J. van der Linden & Hambleton, R.K.
(Eds.), Handbook of modern item response theory. New York, NY: Springer.
Satorra, A., & Bentler, P.M. (1994). Corrections to test statistics and standard errors in
covariance structure analysis. In A. vonEye & C.C. Clogg (Eds.), Latent variable
analysis: Applications for developmental research (pp. 285-305). Thousand Oaks, CA:
Sage.
Stoltzfus, J. (2006). Determining educational technology and instructional learning skills sets
(DETAILS): A new approach to the LoTi Framework for the 21st century. Retrieved
from http://loticonnection.com/validandreliable.html
Thomas, Lajeane G., & Knezek, Don. (1991). Facilitating restructured learning
experiences with technology. The Computing Teacher, 18(6), 49–53.
Thompson, B. (2004). Exploratory and confirmatory factor analysis: Understanding concepts
and applications. Washington, DC: American Psychological Association.
Townsend, M. & Konold, T.R. (2010). Measuring early literacy skills: A latent variable
investigation of the phonological awareness literacy screening for preschool. Journal of
Psychoeducational Assessment, 28(2), 115-128.
U.S. Department of Education (1995). Elementary and secondary education act. Retrieved from
http://www.ed.gov/policy/elsec/leg/esea02/index.html

20
Van der Linden, W.J., & Hambleton, R. K. (1997). Handbook of modern item
response theory. New York, NY: Springer.
Vaughan, W. (2002). Professional development and the adoption and implementation of new
innovations: Do teacher concerns matter? International Electronic Journal for
Leadership in Learning, 6(5). Retrieved from http://www.ucalgary.ca/
~iejll/volume6/vaughan.html
Velicer, W.F. (1976). Determining the number of components from the matrix of partial
correlations. Psychometrika, 31, 321-327.
Velicer, W. F., Eaton, C. A., & Fava, J. L. (2000). Construct explication through factor or
component analysis: A review and evaluation of alternative procedures for determining
the number of factors or components. In R. D. Goffin & E. Helmes (Eds.), Problems and
solutions in human assessment: Honoring Douglas N. Jackson at seventy. Norwell, MA:
Kluwer Academic.
Zwick, W. R. & Velicer,W. F. (1986). Factors influencing five rules for determining the number
of components to retain. Psychological Bulletin, 99, 432-442.

21
APPENDIX A
EXTENDED LITERATURE REVIEW

22
The LoTi framework can be viewed as a two by two cross-product based on CBAM
levels and Bloom’s taxonomy. LoTi is conceptually aligned and based on the levels of
innovation of the CBAM (Hall, Loucks, Rutherford & Newlove, 1975), research on the
implementation of multimedia/telecommunication in the classroom (Thomas & Knezek, 1991),
and research results from Apple’s Classroom of Tomorrow (Dwyer, Reinstaff, & Sandholtz,
1992). This literature review discusses each of these studies and/or theories, and how it relates to
the LoTi framework and survey. Also, the original and Digital-Age versions of the LoTi
frameworks and surveys are presented. Background information for each statistical methodology
employed in the present study is discussed as well. Thus, this chapter contains the following
main sections: background of the LoTi framework and questionnaire, and background of the
statistical analyses.
Background of the LoTi Framework and Questionnaire
Concerns-Based Adoption Model (CBAM)
The CBAM was developed at Southwest Educational Development Laboratory of the
University of Texas. Many models that have been developed have been based on CBAM, such as
the Apple Classrooms of Tomorrow (ACOT) project, the instructional transformation model, the
project information technology (PIT) models developed in the Netherlands (Newhouse, 2001).
Most concerns-based models have grown from the concerns of teachers as they developed their
pedagogical skills (Fuller, 1969).
The CBAM model focuses on two main aspects: affective (or concerns) and behavioral
(levels of use). This model permits the researcher to learn what is happening with innovation and
integration of technology into teaching and learning, and at the same time provides some insights

23
as to why this is so. CBAM consists of three components: stages of concern (SoC), levels of use
(LoU), and innovation configurations (ICs). The SoU and LoU components were developed
earlier, whereas the IC component was developed at a much later time (Newhouse, 2001). The
SoU component is a measure of the perceptions and feelings toward innovation. The LoU
component is an assessment of the degree to which innovation is being implemented. The IC
component is a clarification as to the meaning of the innovation itself. All of these three
components together are able to provide a through description of the adoption process in an
educational setting (Newhouse, 2001). Each component of CBAM will be discussed in detail
below. With each component of CBAM, a specific research method and an instrument is used to
collect and analyze appropriate data. A key requirement using the CBAM is that the researcher
needs to be immersed “within the scene of the innovation and to continually refine judgments
associated with the diagnostic instruments” (Newhouse, 2001, CBAM Data, ¶1).
Fuller (1969) studied the concerns of teachers in the area of teacher preparation, which is
considered to be the foundation of CBAM. Fuller identified the four main clusters of teachers’
concerns regarding teaching: impact, task, self, and unrelated (Hall & Hord, 1987). With respect
to the CBAM model, the seven specific stages of concern about the innovation are refocusing,
collaboration, consequence, management, personal, informational, and awareness. A
questionnaire is used to collect appropriate data so that one can prepare a numerical and
graphical representation of the type and strengths of the teachers’ concerns.
A LoU interview is used to measure the levels of innovation use. It attempts to describe
the behaviors of participants in terms of the innovation. CBAM sees implementation of an
innovation as a process with different levels. The eight levels (Hall et al., 1975) are (in
hierarchical order): nonuse, orientation, preparation, mechanical, routine, refinement, integration,

24
and renewal. The first three levels describe the nonuser and the last five levels describe in the
user. A major limitation of the LoU interview is that it is extremely time consuming and requires
several days to be trained to be able to use it.
The IC is the last component of the CBAM and was not an original component of
CBAM. It was discovered from research investigating variations in the LoU into module use and
team teaching (Hall & Loucks, 1977). Researchers found that there was a large discrepancy
between ways in which teachers interpreted the innovation, which greatly affected the
measurement accuracy of the levels of use. Normally, a two dimensional map is considered the
suitable design of the IC that is created by teachers and researchers to be able to understand the
implementation of the innovation. The IC map is considered to be a useful tool for planning
professional development, providing coaching, and for conducting research (Hall & Hord, 2001).
LoTi Framework and CBAM
The levels of use component of CBAM provides very useful information to understand
“how people are acting with respect to a specified change” (Hall & Hord, 1987, p. 81). Many
research studies on levels of technology implementation have confirmed that use of technology
in the classroom is a complex and multistage paradigm and that the level of implementation is
low (see for example: Hope, 1997; Moersch, 2001; Mills, 2002; Mills & Tincher, 2003;
Newhouse, 2001; Vaughan, 2002). In the last 10 years, various measurement instruments have
been created to assess the level of technology use in the classroom (Adams, 2003; Atkins &
Vasu, 2000; Martin, 1989, Marcinkiewiez & Welliver, 1993; Mills, 2002), one of which is the
LoTi framework and instrument (Moersch, 1995a, 1995b). Since LoU represents behavior, Hall
and Hord (1987) have discouraged researchers from building paper and pencil self-report

25
questionnaires. The development of the levels of the LoTi framework is based on the original
CBAM levels, and its seven discrete implementation levels ranging from Nonuse (0) to
Refinement (6) are similar to levels of use of an innovation (Moersch,1997). The relationship
between CBAM and LoTi levels was compared by the RMC Research Corporation and
summarized in a tabular format (RMC, 2005).
Bloom’s Taxonomy
Bloom’s taxonomy of learning domains, widely known as Bloom’s taxonomy (1956) was
published under the direction of Dr. Benjamin S. Bloom. Three domains of educational activities
identified by Bloom and his researchers (1956) are cognitive, affective and psychomotor. The
committee then further divided the cognitive and affective domains into subcategories, starting
from the simplest behavior to the most complex (Clark, 2009). Bloom and his committee never
developed subcategories for psychomotor domain.
The cognitive domain (Bloom, 1956) involves knowledge, comprehension, and critical
thinking of a specific topic. In this domain, skills from the traditional education aspect is
emphasized, more specifically the lower-order objectives. There are six subdivisions or
categories (from the simplest to complex behaviors): knowledge, comprehension, application,
analysis, synthesis, and evaluation. The affective domain describes the manner in which people
deal with things emotionally, such as feelings, values, appreciation, enthusiasm, motivations and
attitudes (Krathwohl, Bloom, & Masia, 1973). There are five subdivisions from simplest to
complex behaviors): receiving phenomena, responding to phenomena, valuing, organization, and
internalizing values.

26
The psychomotor domain expresses the skill in which people are able to physically
manipulate a tool or instrument, for example a hammer (Clark, 2009). The objectives for the
psychomotor domain are usually centered on the change, development in behavior, and/or skills.
Since Bloom and his committee never developed subcategories for the psychomotor domain,
other researchers have developed their own taxonomies. The three most common taxonomies for
the psychomotor domain were created by Simpson (1972), Dave (1975), and Harrow (1972).
Bloom’s taxonomy has recently been revised (Anderson, 1990). The two most prominent
changes are (a) adjusting the category names from noun to verb forms and (b) a slight
rearrangement of the categories (Clark, 2009). The new taxonomy is more reflective of the active
form of thinking, and more accurately can provide a framework for planning (Pohl, 2000;
Anderson & Krathwohl, 2001; Wilson, 2006; Forehand, 2005). Figure A.1 presents the original
and revised versions of Bloom’s taxonomy.
Figure A.1 Original and revised versions of Bloom’s taxonomy.
LoTi Framework and Bloom’s Taxonomy
As mentioned above, the LoTi framework is considered to be a two by two matrix, with one
side representing CBAM levels and the other side representing Bloom’s taxonomy, more
specifically the Cognitive domain of Bloom’s taxonomy (Knezek, personal communication,
November 27, 2009). Hence, the descriptions provided for each LoTi level illustrate the teacher’s
Original Domain New Domain
Evaluation Creating
Synthesis Evaluation
Analysis Analyzing
Application Applying
Comprehension Understanding
Knowledge Remembering

27
progression of technology implementation in the classroom, which can be seen as moving up
through the categories of the cognitive domain of Bloom’s taxonomy. The updated LoTi
Framework includes the HEAT Framework (LoTi Connection, 2009). HEAT stands for higher-
order thinking, engaged learning, authentic learning, and technology use. The higher-order
thinking component of the HEAT framework is in essence the cognitive domain of Bloom’s
taxonomy.
LoTi Framework and Multimedia/Telecommunications Implementation in Classroom
The role of educators changes with technology emergence in schools (Thomas & Knezek,
1991). Restructured schools are characterized by reforms in five general areas: (a) learning
experiences, (b) teacher roles, (c) curriculum, (d) organization leadership and structure, and (e)
governance and funding (Thomas & Knezek, 1991). They feel the “heart” of restructuring is the
learning experiences of students. Telecommunications and multimedia are two particular
applications of technology that combine together to create learning experiences. During this
process, changes in the role and responsibilities of teacher, learning experiences, and curriculum
are observed. The changes in the role and responsibilities of teacher have been described as:
As teachers become more empowered by technology and as professionalism increases,
the traditional teaching role changes. The role of the teacher is that of facilitator of
learning rather than deliverer of information. Increase in human, technical, and
conceptual support empowers teachers to maximize student learning outcomes. (Thomas
& Knezek, 1991, p. 49)
They also feel that technology breaks down the boundaries imposed by traditional curriculum
(i.e., curriculum from different subject areas like math, science, social studies, language arts, and
fine arts) are not longer separated but combined. By using project-based activities based on a

28
main theme, technology-based activities give the opportunity for learning experiences to use
higher-order processes from several traditional disciplines.
An instrument can be used to measure progress from traditional to desired educational
practices that increase learning (for example, a student being a passive learner to an active
learner). As teachers implement technology in the classroom, the learning experiences, roles of
teachers and students all change, and furthermore, can support classroom instruction that
increase learning. Thomas and Knezek (1991) found the following:
As teachers facilitate learning experiences that are more student-directed, learners are no
longer passive receptors of visual and auditory signals but more active and motivated
thinkers and doers – partners in the learning process. When students are actively engaged
in learning, greater assimilation of information occurs. Thinking and doing provide
rehearsal needed to create connected mental maps for knowledge and skills. To meet the
challenges, teachers provide access to and guidance in using enabling technologies and
they facilitate student doing. (p.50)
Similar ideas can be viewed within the LoTi framework. They are
teachers’ role changing from a deliverer to a facilitator
delivery of instruction changing from teacher-centered to student-centered use of
computer technology to support and extend student understanding of material
traditional resources replaced by a wide-range of resources (such as internet)
student learning experiences changing from traditional activities to more real-life or
problem based learning
technology to eliminate barriers between different curriculums
LoTi Framework and Levels of Innovation
The levels of innovation that have been used in the LoU component of the CBAM model
have been identified by Hall et al. (1975). As mentioned above, the LoU component describes

29
the behaviors of the users with respect to the innovation (i.e., technology). It does not focus on
the user’s attitude, motivation or emotions.
The LoU framework includes a description of the typical behaviors at each level,
providing a framework of indices and decision points (Hall et al., 1975). Behaviors are
described, rather than internal attitudes or emotional states to increase the chance that the
phenomenon can be understood, and measured more accurately. Each level is further subdivided
into seven categories. The categories correspond to important functions that teachers carry out
when they are using an innovation. The seven categories are knowledge, acquiring information,
sharing, assessing, planning, status reporting, and performing. A user may not be at same level in
all seven categories. Decision points, presented in the LoU chart, are used to distinguish between
the eight levels of innovation use. An overall LoU can be quickly assigned to a user by referring
to these points. As mentioned above, the levels of LoTi framework is based on levels of the LoU
framework presented in the CBAM, which in turn is based on work by Hall et al. (1975).
LoTi Framework and Research Results From ACOT Study
The purpose of the ACOT projects was to investigate the changes in students and
teachers when they access technology as they need it, commonly referred to as “high-access-to-
technology environments” (Dwyer, Ringstaff, & Sandholtz, 1991). Two models were developed
from research conducted on the ACOT projects. The first was based on the progression of
teacher proficiency with technology and the stages are Survival, Mastery and Impact. The second
model was based on the pattern of instructional change (Newhouse, 2001). Changes in teachers’
instruction is an “evolutionary process” (Dwyer et al., 1991) and teachers move through several
stages before fully implementing technology in their teaching. The stages for the ACOT model
30
are: Entry, Adoption, Appropriation, and Intervention. This process was found to be slow since
teachers had to deal with their beliefs about schooling (Sandholtz, Ringstaff & Dwyer, 2000). As
mentioned previously, the ACOT model is also based on the CBAM model. One of the major
outcomes of the ACOT study is that levels of technology integration increased with unlimited
access to technology.
Teachers entered the ACOT program with the thought that technology would make their
lives easier. They did not believe it would alter instructional styles and broaden
perspectives regarding curriculum. Dwyer et al. (1991) state,
The direction of their change was toward child-centered rather than curriculum-centered
instruction; toward collaborative tasks rather than individual tasks; toward active rather
passive learning. (p. 50)
There are many similarities between the ACOT and LoTi frameworks: (1) the ability to
provide suggestions for professional development and support after determining which stage the
teacher is implementing technology in the classroom and (2) change in instruction style moving
away from passive learning to active learning; individual tasks to collaborative tasks; teacher-
directed learning to student-centered learning (i.e., role of the teacher changes).
National Educational Technology Standards for Teachers (NETS-T)
The International Society for Technology in Education (ISTE) is an organization for
educators interested in improving the quality of education by implementing technology. Their
mission statement is “ISTE advances excellence in learning and teaching through innovative and
effective uses of technology” (ISTE, 2010). ISTE developed the National Educational
Technology Standards for administrators (NETS-A; ISTE, 2009), teachers (NETS-T; ISTE,
2008), and students (NETS-S; ISTE, 2007). The Digital-Age version of the LoTi framework and

31
survey are aligned to the NETS-T. According to ISTE, it is expected that effective teachers
model and apply NETS-S as they create, implement, and evaluate lesson plans to improve
student engagement and learning and professional practice. There are five standards for NETS-T
are (1) Facilitate, and Inspire Student Learning and Creativity, (2) Design and Develop Digital-
Age Learning Experiences and Assessments, (3) Model Digital-Age Work and Learning, (4)
Promote and Model Digital Citizenship and Responsibility, and (5) Engage in Professional
Growth and Leadership. The latest version of the NETS-T was released in 2008 and was used to
provide “educators a framework as they transition their classrooms from the Industrial Age to the
Digital Age places of learning” (ISTE, 2010).
LoTi Framework and National Educational Technology Standards
The LoTi Digital-Age Survey is an instrument comprised of 37 items, organized into five
subscales intended to measure underlying constructs of technology implementation. The
publisher specifies the five subscales of the instrument as: (1) Digital-Age Work and Learning,
(2) Digital-Age Learning Experience and Assessments, (3) Student Learning and Creativity, (4)
Professional Growth and Leadership, and (5) Digital Citizenship and Responsibility (LoTi
Connection, 2009). Each of these subscales has been suggested by the publisher as a
unidimensional factor. The names of the factors from the LoTi Survey are similar to the names
of the NETS-T standards (ISTE, 2008), thereby providing construct-relevant descriptions for
each factor, as each one encompasses a description from the NETS-T standard, therefore a link is
provided from the standards to the hypothesized factor model for the instrument. A full
description of each factor and its relationship with ISTE’s National Education Technology
Standards for Teachers (NET-S) is provided in Table A.1.

32
Table A.1
Description of Each Factor in the LoTi Digital-Age Survey
Factors of LoTi
digital-age
LoTi digital-age factor level description
Digital-age work
and learning
According to the National Education Technology Standards for Teachers (NETS-T) from ISTE,Digital-Age
Work and Learning signifies a teacher's exhibition of the “knowledge, skills, and work processes
representative of an innovative professional in a global and digital society.” Based on this priority area, a
teacher is able to demonstrate fluency in a variety of technology systems ,communicate relevant
information and collaborate with others (e.g., students, parents, community members) using a variety of
digital tools and resources, and employ current and emerging technologies for data analysis purposes in
support of research and learning.
Digital-age
learning
experiences and
assessments
According to the National Education Technology Standards for Teachers (NETS-T) from ISTE, Digital-
Age Learning Experiences and Assessments signifies a teacher's ability to “design, develop, and evaluate
authentic learning experiences and assessments incorporating contemporary tools and resources to
maximize content learning....” Based on this priority area, a teacher is able to create and implement
engaging and relevant learning experiences that incorporate a variety of digital tools and resources, promote
learner-based investigations, and provide a myriad of formative and summative assessment schemes aligned
to the content and technology standards to improve and adjust future learning experiences.
Student learning
and creativity
According to the National Education Technology Standards for Teachers (NETS-T) from ISTE, Student
Learning and Creativity signifies a teacher's ability to “use their knowledge of subject matter, teaching and
learning, and technology to facilitate experiences that advance student learning, creativity, and innovation in
both face-to-face and virtual environments.” Based on this priority area, a teacher is able to promote,
support, and model creative and innovative thinking; engage students in real-world problem-solving and
issues resolution; model collaborative learning communities; and support student reflection using a variety
of collaborative tools and resources.
Professional
growth and
leadership
According to the National Education Technology Standards for Teachers (NETS-T) from ISTE
,Professional Growth and Leadership signifies a teacher's inclination to “continuously improve their
professional practice, model lifelong learning, and exhibit leadership in their school and professional
community by promoting and demonstrating the effective use of digital tools and resources.” Based on this
priority area, a teacher is able to participate in local and global learning communities, evaluate and reflect
on current research and professional practice involving the use of digital tools and resources, and exercise
leadership in promoting the technology skills of others as well as improvements to the teaching profession.
Digital citizenship
and responsibility
According to the National Education Technology Standards for Teachers (NETS-T) from ISTE, Digital
Citizenship and Responsibility signifies a teacher's understanding of the “local and global societal issues
and responsibilities in an evolving digital culture and (the ability to) exhibit legal and ethical behavior in
their professional practice.” Based on this priority area, a teacher is able to advocate, model, and teach safe,
legal, and ethical use of digital information and technology; employ learner-centered strategies to address
the diverse needs of all learners; promote and model digital etiquette; and promote Digital-Age
communication and collaboration tools with diverse groups and cultures.
Original LoTi Survey
The LoTi instrument is used to assess teachers’ level of technology integration in the
classroom. The instrument is based on the LoTi framework (see Table A.2) consisting of 50

33
questions with seven technology implementation levels. The idea behind the LoTi framework
described by Moersch (1995):
As the teacher progresses from one level to the next, a series of changes in the
instructional curriculum is observed. The instructional focus shifts from being teacher-
centered to being learner-centered. Computer technology is employed as a tool that
supports and extends students’ understanding of the pertinent concepts, processes, and
themes involved when using databases, telecommunications, multimedia, spreadsheets,
and graphing applications. Traditional verbal activities are gradually replaced by
authentic hands-on inquiry related to a problem, issue, or theme. Heavy reliance on
textbook and sequential instruction materials is replaced by use of extensive and
diversified resources … Traditional evaluation practices are supplemented by multiple
assessment strategies that utilize portfolios, open-ended questions, self-analysis, and peer
review and detailed description of the LoTi framework… (p. 42)
School districts should emphasize professional development that allows teachers to progress
through various levels of technology integration at their own pace (Moersch, 1997; OTA, 1995;
Grant, 1996). The LoTi framework (see Table A.2) is considered to be a measure that shows the
“progressive nature of teaching with technology” (Moersch, 1995, p. 93). The higher the level a
teacher is rated on the LoTi framework, the more the teacher is integrating technology in the
classroom and moving away from teacher-centered activities to student-centered activities.
The LoTi is divided into three sections: Levels of Technology (LoTi), Current
Instructional Practice (CIP), and Patterns of Computer Use (PCU). Approximately 80% of the
LoTi instrument (n = 40/50 items) focuses on technology integration issues in the classroom
(LoTi), 10% focuses on personal computer use (PCU; n = 5/50 items), and 10% focuses on
instructional patterns (CIP; n = 5/50 items; Moersch, 2002). The answer choices are presented on
a Likert scale where 0 represents no answer, 1-2 is not true of me now, 3-4-5 is somewhat true of
me now, and 6-7 is very true of me now. The participant selects a number that best signifies their
technology behaviors. The answers are then transferred to a response table that has arranged each
question according to its particular level of integration. Each LoTi level is

34
Table A.2
Framework for Analyzing Characteristics and Benchmarks of Technology Implementation
According to the Teacher’s LoTi Level
LoTi Level General
technology use
Description
0 – Nonuse
A perceived lack of access to technology-based tools or a lack of
time to pursue electronic technology implementation. Existing
technology is predominately text-based (e.g., ditto sheets,
chalkboard, overhead projector).
1 – Awareness The use of computers is generally one step removed from the
classroom teacher (e.g., integrated learning system labs, special
computer-based pullout programs, computer literacy classes, central
word processing labs). Computer-based applications have little or no
relevance to the individual teacher’s instructional program.
2 – Exploration Teacher-
centered
Technology-based tools serve as a supplement to existing
instructional program (e.g., tutorials, educational games,
simulations). The electronic technology is employed either as
extension activities or as enrichment exercises to the instructional
program.
3 – Infusion Teacher-
centered
Technology-based tools, including databases, spreadsheets, graphing
packages, probes, calculators, multimedia applications, desktop
publishing applications, and telecommunications applications,
augmented isolated instructional events (e.g., a science-kit
experiment using spreadsheets/graphs to analyze results or
telecommunications activity involving data-sharing among schools)
4 – Integration
4a – Mechanical
integration
4b – Routine
integration
Teacher-
centered
Technology-based tools are integrated in a manner that provide a
rich context for students’ understanding of the pertinent concepts,
themes, and processes. Technology (e.g., multimedia,
telecommunications, databases, spreadsheets, word processors) is
perceived as a tool to identify and solve authentic problems relating
to an overall theme/concept.
5 – Expansion Learner-
centered
Technology access is extended beyond the classroom. Classroom
teachers actively elicit technology applications and networking from
business enterprises, governmental agencies (e.g., contacting NASA
to establish a link to an orbiting space shuttle via the Internet),
research institutions, and universities to expand student experiences
directed at problem solving, issues resolution, and student activism
surrounding a major theme/concept.
6 – Refinement Learner-
centered
Technology is perceived as a process, product (e.g., invention,
patent, new software design), and tool to help students solve
authentic problems related to an identified real-world problem or
issue. Technology in this context, provides a seamless medium for
information queries, problem solving, and/or product development.
Students have ready access to and complete understanding of a vast
array of technology-based tools.

35
matched with five questions and represents a different level of implementation. Once the raw
scores are summed and averages are computed, the LoTi calculation key is utilized, and a final
LoTi, PCU and CIP scores are computed for each participant (Moses, 2006).
The results from the LoTi Survey provide a profile for the teacher across these three
domains: (a) the teachers’ LoTi, (b) PCU, and (c) CIP. The LoTi acronym is used in two ways:
(a) when referring to the domain of the survey that specifically involves technology
implementation and (b) in reference to the entire instrument where an overall score is computed
that combines the LoTi, PCU and CIP domains (Barron, Kemker, Harmes, & Kalaydjia, 2003).
The LoTi score (on a scale from 0 to 6) reports the level of implementation of technology in a
classroom for teaching and learning. The PCU score (on a scale from 0 to 7) reports how
comfortable teachers are in using technology tools involved in integration. The CIP score (on a
scale from 0 to 7) reports how a teacher delivers instruction in the classroom. It attempts to
identify classroom characteristics that promote constructivist classroom environments such as
student involvement in the decision-making process or evaluation process (Bashara, 2008).
Many studies have used the LoTi questionnaire, but few have reported the reliability
and/or validity of the scores from the LoTi instrument. Moersch (1995), Schechter (2000),
Griffin (2003), and Larson (2003) computed the internal consistency reliability of the scores
obtained from each factor and/or the entire instrument (see Table A.3).
There are multiple versions of the LoTi instrument depending upon the stakeholders, that
is, there is a version for higher education faculty, building administrators, media specialists,
instructional specialists, inservice teachers and preservice teachers. The inservice teacher survey

36
Table A.3
Score Reliability (Cronbach’s Alpha) for Each Factor and Overall LoTi Survey
LoTi PCU CIP Overall
(n items = 40) (n items = 5) (n items = 5) (n items = 50)
Moersch (1995) 0.74 0.81 0.73
Schechter (2000) 0.7427 0.8148 0.7353
Griffin (2003) 0.94
Larson (2003) 0.85
is the original instrument and the other five versions involve slight word adjustments to items
according to the professional background of the test-taker.
Digital-Age Version of the LoTi Framework and Questionnaire
The original Levels of Technology Implementation (LoTi) framework and questionnaire were
mainly used as a research tool to evaluate authentic use of technology in the classroom. The
LoTi framework has evolved into a conceptual model to measure teachers’ technology
implementation in the classroom according to the National Educational Technology Standards
for Teachers (NETS-T). The new framework (LoTi Connection, 2009):
focuses on the delicate balance between instruction, assessment, and the effective use of
digital tools and resources to promote higher order thinking, engaged student learning,
and authentic assessment practices in all the classroom – all vital characteristics of the
21st Century teaching and learning.
The LoTi framework (see Appendix D) has been updated. It provides the LoTi level, relation to
technology and content, and the HEAT framework. The HEAT, CIP and PCU frameworks have
been provided in Appendix D.
The newer and more recent version of LoTi instrument is called LoTi Digital-Age Survey
and is aligned to the NETS for Teachers (NETS-T). This survey creates a personalized digital-
age professional development profile and offers recommendations aligned to the five popular
37
instructional initiatives. As in the past, the survey provides separate Level of Teaching
Innovation (LoTi), Current Instruction Practices (CIP) and Personal Computer Use (PCU)
scores. A copy of the Digital-Age Survey is attached in Appendix D.
A criterion validity study was conducted on the LoTi Digital-Age Survey to demonstrate
that the core LoTi Level scores are a key component of the new LoTi Framework (Stoltzfus,
2009). All Texas teachers are required to complete the Teacher School Technology and
Readiness (STaR chart). It is a rubric that is designed to measure teachers’ levels of technology
implementation in four areas: (a) teaching and learning, (b) educator preparation and
development, (c) leadership administration and instructional support, and (d4) infrastructure for
technology. The STaR chart has four levels of progress in terms of teachers’ levels of technology
implementation, which are early tech, developing tech, advanced tech and target tech. These four
levels in the STaR chart and the first four levels in the LoTi are conceptually aligned. Two
statistical analyses were conducted using the LoTi levels and STaR charts. First, z tests for
proportions were used to compare the within-school frequency distribution of STaR chart and
first four LoTi levels. Second, the concurrent criterion validity was assessed using the
Spearman’s rank correlation coefficient, since the data were being collected at the same time.
Using the z-tests for proportions, it was found that there were not any significant differences in
the score distributions between the STaR chart and LoTi levels. The correlation analysis revealed
that there is a strong positive association between the two instruments (rs = 0.704, p < 0.0001),
which further indicates that the” two instruments share a robust degree of overlap in terms of
what they are measuring” (Stoltzfus, 2009). Hence, these results provide some preliminary
evidence of the criterion-related validity towards the first four LoTi levels. Furthermore, this

38
indicates the suitability of the LoTi levels in precisely capturing the teaching innovation of K –
12 practitioners, at least in the State of Texas.
The survey consists of 37 questions. The answer choices are still 0 to 7, but the answer
statements that match the numeric values have been changed to Never, At least once a year, At
least once a semester, At least once a month, A few times a month, At least once a week, A few
times a week, and At least once a day, respectively. Again, the participant selects a number that
best represents their technology practices. Answers are then transferred to a response table that
has arranged each question according to its particular level of integration. Each LoTi level, along
with PCU and CIP, is matched with five to 12 questions. Once the raw scores are summed and
averages are computed, the LoTi scoring device (see Appendix D) and calculation key are used,
a final LoTi, PCU and CIP scores are calculated for each participant.
Background to Statistical Analyses Employed
Confirmatory Factor Analysis
Factor analysis is a statistical technique used to examine how underlying constructs
influence the responses on a number of measured variables. There are two types of factor
analysis: exploratory and confirmatory. Exploratory factor analysis (EFA) has mostly been used
to explore the possible underlying factor structure of a set of observed variables without
imposing a preconceived structure on the outcome (Child, 1990). EFA is considered to be a data
driven approach. Confirmatory factor analysis (CFA) is a statistical technique that is used to
validate a hypothesized factor structure for a set of observed variables. CFA is considered to be
theory or hypothesis driven. The researcher proposes a relationship pattern a priori by referring
to existing theory, empirical research or both, and then tests the hypothesis statistically.

39
There are two approaches to conduct a CFA: one way is the traditional approach and the
other is the structural equation modeling (SEM) approach (Garson, 2010). The traditional
approach can provide more detail into the measurement model since it gives the factor loadings
of the indicator variables to verify if they load on the factors as expected by the researcher’s
model. This can be compared to the SEM approach that provides a single-coefficient goodness of
fit measures. The alternative approach uses structural equation modeling (SEM) to explore CFA
measurement models. This can be conducted using SEM packages, such as AMOS (Arbuckle,
2006), LISREL (Jöreskog & Sörbom, 2006; discussed in more detail below), or mPlus (Muthén
& Muthén, 2010). CFA is actually considered to be a special case of SEM, which is also known
as the covariance structure (McDonald, 1978) or the linear structural relationship (LISREL)
model (Jöreskog & Sörbom, 2006). SEM can be divided into two types of models: a
measurement model and a structural model. A measurement model in SEM links a set of
observed variables to a usually smaller set of latent variables. A structural model links the latent
variables through a series of recursive and nonrecursive relationships. In this case, a CFA
corresponds to the measurement model (Albright & Park, 2009).
Assessing the Fit of CFA
The model fit of a CFA can be assessed on three major aspects: (1) overall goodness of
fit, (2) the presence or absence of localized areas of strain in the solution, and (3) the
interpretability, size, and statistical significance of the model’s parameter estimates (Brown,
2006). There are a number of omnibus tests that exist to assess how well the model matches the
observed data. The most commonly used is χ2, which is a classic goodness-of-fit measure to
determine the overall fit. However, the χ2 test has been known to be problematic since it is

40
sensitive to sample size (Jöreskog, 1969). Also, this test may be invalid when distributional
assumptions are violated. Many alternative fit statistics have been developed due to the
drawbacks of χ2. These goodness-of-fit indices can generally be differentiated into three
categories: absolute fit, adjusting for model parsimony, and comparative fit. It is advised that at
least one index from each fit category should be measured since each index provides unique
information about the fit of the CFA solution.
Absolute fit statistics evaluate the model fit at an absolute level. An example of an
absolute fit index is χ2. Other absolute fit statistics are standardized root mean square residual
(SRMR) and root mean square residual (RMR). SRMR can be abstractly viewed as the average
difference between the correlations observed in the input matrix and the correlations predicted by
the model. RMR considered to be the average discrepancy between observed and predicted
covariances. SRMR is generally preferred over the RMR due to difficultly to interpret RMR
values. SRMR values range from 0 to 1, where 0 means a perfect fit.
Fit indices adjusting for model parsimony incorporate a penalty function for poor model
parsimony. The root mean square error of approximation (RMSEA) is a population-based
statistic that depends on the noncentral χ2 distribution, which is the distribution of the fitting
function when the model is not perfect (Brown, 2006). RMSEA is sensitive to the number of
parameters estimated and somewhat insensitive to the sample size. RMSEA values of 0 are
indicative of a perfect fit. The upper range of RMSEA is not bounded, yet it is uncommon to see
the RMSEA exceed values greater than 1.
Comparative fit indices assess the fit of a user-specified solution against a more
restricted, nested baseline solution, which is usually a null model where the covariances between
all input indicators are set equal to zero (Brown, 2006). Comparative fit index (CFI) and the
41
Tucker-Lewis index are two popular comparative fit indices. CFI values range from 0 implying
poor fit to 1 for a good fit. The Tucker-Lewis index has attributes that compensate for the effect
of model complexity, which means it incorporates a penalty function for adding freely estimated
parameters that do not noticeably improve the fit of the model (Brown, 2006). TLI values are
nonnormed, meaning values can exceed the range of 0 to 1. Yet, TLI values are interpreted
similarly as CFI values (i.e., values coming close to 1.0 are interpreted as a good fit).
Fit indices are uniquely affected by numerous features of the solution such as sample
size, model complexity, estimation method, amount and type of misspecification, normality of
data, and type of data (Brown, 2006). A study conducted on the cutoff criteria suggested the
following guidelines for reasonably good fit between the target model and the observed data
(assuming ML estimation) is attained in cases where (a) SRMR values are close to 0.08 or
below, (b) RMSEA values are close to 0.06 or below, and (c) CFI and TLI values are close to
0.95 or greater (Hu & Bentler, 1999). Some researchers have proposed a range of values instead
of exact cut-off values. For example, Brown and Cudeck (1993) propose RMSEA values less
than 0.08 implies adequate model fit, RMSEA values less than 0.05 indicates good model fit, and
that models with RMSEA values greater than or equal to 0.1 should be discarded. It is important
to consider fit indices from multiple fit categories and review other relevant features of the
solution (e.g., localized areas of ill fit; interpretability and size of parameter estimates),
especially when fit indices fall into marginal ranges.
A downside of goodness-of-fit statistics is that they provide a global indication of the
ability of the model to reproduce the variance-covariance matrix (Brown, 2006). These indices
are not able to offer information on the causes of inadequate model fit. Two most frequently used
statistics to detect local areas of misfit in a CFA solution are residuals and modification indices.

42
There are three matrices commonly seen in a CFA model, the sample variance-covariance
matrix, predicted variance-covariance matrix, and residual variance-covariance matrix. The
residual variance-covariance matrix is the difference between the sample and predicted variance-
covariance matrix, and gives detailed information regarding how well each variance and
covariance was reproduced by the parameter estimates of the model. Since these residuals are
difficult to interpret, they are standardized. These values are similar to standard scores in a
sampling distribution and can be interpreted similarly to z scores and can either have positive or
negative values. It is important to note that the size of standardized residuals is affected by the
sample size. Generally, larger sample sizes are related to larger standardized residuals since there
is an inverse relationship between the size of the standard errors of the fitted residuals and the
sample size (Brown, 2006).
Modification indices are for examining specific relationships in the CFA solution. An
index is computed for each fixed parameter and constrained parameter in the model. A
modification index, as Brown (2006) states, “reflects an approximation of how much the overall
model χ2 would decrease if the fixed or constrained parameter was freely estimated” (p. 119).
Generally, a model that fits well should produce modification indices that are small in size.
Modification indices are sensitive to sample size similar to standardized residuals. This is
addressed by the expected parameter change (EPC) value calculated for each modification index
and offers an estimate of the amount that the parameter is expected to alter in a positive or
negative direction if it were freely estimated in next analysis.
The next step in assessing the CFA is to review the direction, magnitude, and significance
of the parameter estimates (i.e., factor loadings, factor variances and covariances, and indicator
errors). Parameter estimates should make “statistical and substantive sense “(Brown, 2006, p.
43
126). Parameters should not take any out-of-range values, such as standardized factor
correlations greater than 1.0, negative factor variances or indictor error variances. With respect to
the substantive perspective, the direction of the parameter estimates should be line with the
prediction or theory. The standard error of the parameter estimates must be assessed to decide if
their magnitude is appropriate, or problematically too large or small. Small standard errors
signify substantial accuracy in the estimate of the parameter and excessively large standard
errors indicate inaccurate parameter estimates. There are no exact rules to point out if a standard
error is problematic. Standard errors that come close to zero or appear very large and are not
statistically significant should be reviewed. The completely standardized factor loading can be
viewed as a correlation between the indicator and latent factor. By squaring the completely
standardized factor loading, it will provide information on the proportion of variance of the
indicator that is explained by the latent factor (i.e., communality) and can also be considered to
be an estimate of the indicator’s reliability (Brown, 2006). These squared factor loadings could
be useful when determining whether the measures are meaningfully associated to their latent
dimensions.
Item Response Theory
Classical Test Theory versus Item Response Theory
Classical test theory (CTT), also known as true score theory, has defined most of the
standards for test development since the 1900s (Crocker & Algina, 1986). CTT is also known as
the weak test theory because the assumptions can easily be met. The assumptions are (a) true and
error scores are uncorrelated, (b) the average score on in the population is zero, and (c) error
scores on parallel test are uncorrelated (Hambleton & Jones, 1993).The CTT model is a simple
linear model which is the sum of the subject’s true test score (T) and error score (E) is equal to

44
the subject’s observed score (X). The CTT model can be expressed as X = T + E. For any given
test and subject, a subject’s true test score is assumed to be constant, and the observed score and
random error vary for that subject depending on the testing occasion
In the context of CTT, reliability of a test means the amount of measurement error
present in the scores produced by the test. Several factors can cause measurement error. First, the
items of the test only represent a sample of the items that are available that could be used to
measure the characteristic. If different items on the test are not comparable in how they sample
the domain of items, then measurement error can result. Second, test administrators failing to
administer the test consistently could possibly introduce measurement error. Third, test scorers
failing to follow consistent scoring procedures could also result in measurement error. Fourth,
testing conditions (e.g., noisy, temperature of room) could also introduce measurement error.
Fifth, measurement error could also be introduced because of how a subject feels (for example,
sick or having a headache). Again, CTT assumes that the measurement errors present in the test
scores are randomly distributed and unspecified. There are several approaches to measure test
score reliability under these assumptions. They are (a) alternate-form reliability, (b) test-retest
reliability, (c) internal consistency, and (d) intertester reliability (Gall, Gall & Borg, 2003).
There are some major disadvantages of using the CTT (Gall et al., 2003). First, the
reliability estimates derived for the test and item statistics (such as item difficulty and item
discriminating power) are sample dependent, and hence this reduces their utilization. This
implies if a researcher uses this test with a sample different from the population that it was
intended to be used with, then the reliability and item statistics may alter. Second, the test is
perhaps too easy or difficult for some examinees, and thus will produce a poor estimate of their
true score on the ability being measured. Third, CTT assumes the same amount of measurement
45
error for all examinees. However, in reality this is not the case; a test may have a greater
reliability for individuals at one level of the ability compared to another level of the ability.
Fourth, the correlation of subject’s performance on parallel (or alternate) forms of the test is used
to determine the amount of measurement error in the test items. But it has been found to be
difficult to create exactly parallel forms of a test, so it may not be possible to calculate the
reliability.
These weaknesses of CTT are avoided when using Item Response Theory (IRT). There
are many advantages of using IRT for test development. First, IRT offers information on the
amount of ability measured by the item. Second, individuals’ performance on the item provides
information about the amount of ability they possess (Gall et al., 2003). Suppose a researcher
creates an item bank, then IRT would be more advantageous to use since it can customize testing
for individuals of different levels of ability, construct many different parallel tests with equal
difficulty, and reduce the amount of measurement error for a particular individual by
administering only items within the range of difficulty the individual is likely to answer correct.
Item response theory (IRT) or latent trait theory is considered to be a general statistical
theory regarding the examinee item and test performance and how performance relates to the
abilities that are measured by the items in the test (Hambleton & Jones, 1993). Item response
models are referred as strong models since the underlying assumptions are stringent and hence
less likely to be met (Hambleton & Jones, 1993). IRT can be used with various item response
formats, dichotomous/polytomous, and discrete/continuous. The test can be measuring one or
many abilities, and there can be many ways the relationship between item responses and abilities
can be modeled. IRT models stipulate a nonlinear monotonic function to explain the relationship
46
between examinee level on a latent variable (represented by θ) and the probability of a particular
item response (Lord, 1980).
There four major assumptions in specifying an IRT model: (a) unidimensionality, (b)
local independence, (c) nature of the item characteristic curve, and (d) parameter invariance. The
first assumption is “appropriate” dimensionality, mainly unidimensionality is assumed in IRT
models. Unidimensionality means that a single variable is sufficient to explain the common
variance among item responses and when this condition is met, it means that the test scores are
definite indicators of a single construct (Embretson & Reise, 2000). Basically, this assumption
means that the test measures only one construct. The second assumption is local independence,
which means the probability of an examinee endorsing an item is not affected by his/her
responses to other test items. It is strictly determined by an examinee’s trait level(s). It is
important to note that local independence is related to unidimensionality such that if one trait
determines success on each item, then examinee ability is the only thing that systematically
affects item performance (Hull, 2010). The third assumption is the nature of the item
characteristic curve (ICC) or item characteristic function (ICF). The curve should show that the
probability of success is monotonically increasing with ability (i.e., higher ability results in a
higher probability of success) (Hull, 2010). The shape of the curve is an S-shaped curve and the
probability needs to lie between 0 and 1. The fourth assumption is parameter invariance. This
means that the item parameters are invariant over samples of examinees from the population for
whom the test is intended and the ability parameters are invariant over the samples of test items
from the population of items measuring the ability of interest (Hull, 2010). The same model
should fit for two groups of examinees with different distributions for the trait being measured.
It has been shown that these parameters have been estimated independently of the particular test
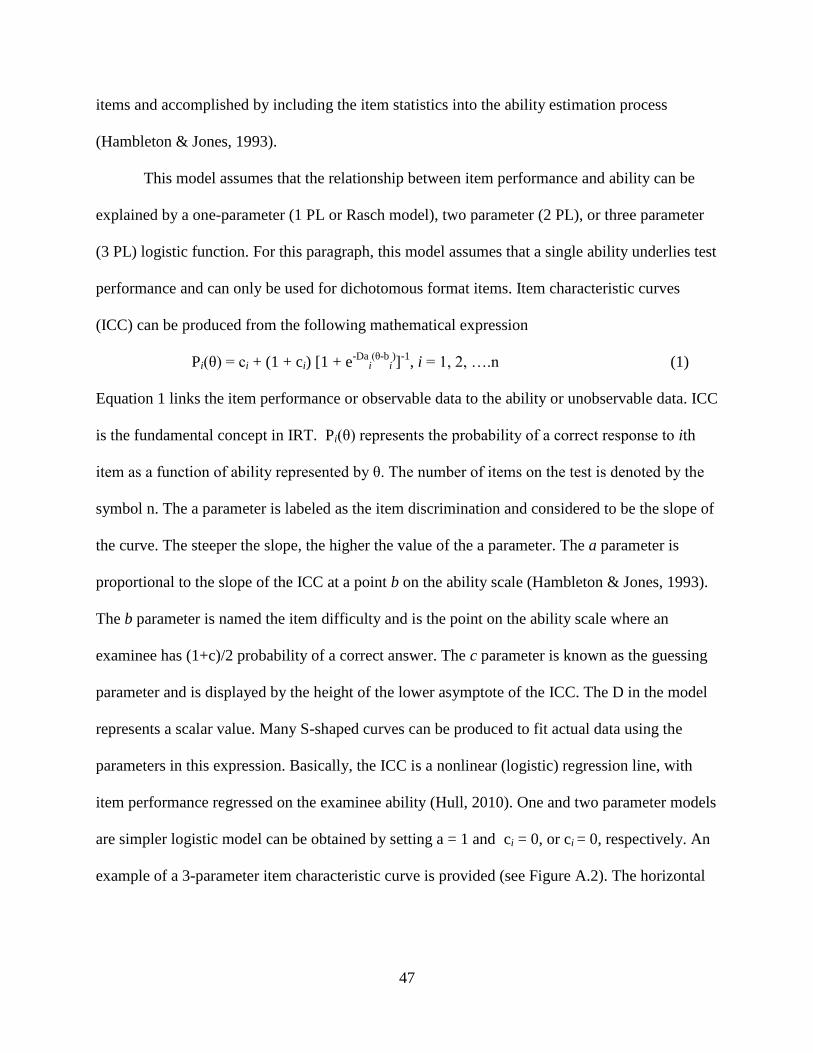
47
items and accomplished by including the item statistics into the ability estimation process
(Hambleton & Jones, 1993).
This model assumes that the relationship between item performance and ability can be
explained by a one-parameter (1 PL or Rasch model), two parameter (2 PL), or three parameter
(3 PL) logistic function. For this paragraph, this model assumes that a single ability underlies test
performance and can only be used for dichotomous format items. Item characteristic curves
(ICC) can be produced from the following mathematical expression
Pi(θ) = ci + (1 + ci) [1 + e-Da
i(θ-b
i)]
-1, i = 1, 2, ….n (1)
Equation 1 links the item performance or observable data to the ability or unobservable data. ICC
is the fundamental concept in IRT. Pi(θ) represents the probability of a correct response to ith
item as a function of ability represented by θ. The number of items on the test is denoted by the
symbol n. The a parameter is labeled as the item discrimination and considered to be the slope of
the curve. The steeper the slope, the higher the value of the a parameter. The a parameter is
proportional to the slope of the ICC at a point b on the ability scale (Hambleton & Jones, 1993).
The b parameter is named the item difficulty and is the point on the ability scale where an
examinee has (1+c)/2 probability of a correct answer. The c parameter is known as the guessing
parameter and is displayed by the height of the lower asymptote of the ICC. The D in the model
represents a scalar value. Many S-shaped curves can be produced to fit actual data using the
parameters in this expression. Basically, the ICC is a nonlinear (logistic) regression line, with
item performance regressed on the examinee ability (Hull, 2010). One and two parameter models
are simpler logistic model can be obtained by setting a = 1 and ci = 0, or ci = 0, respectively. An
example of a 3-parameter item characteristic curve is provided (see Figure A.2). The horizontal

48
axis represents the ability (θ) and the vertical axis represents the probability (P) of answering the
item correctly.
Item response models links item responses to ability and the item statistics are reported
on the same scale as ability. It can be precisely pointed out where an item is doing its best
measurement on the ability scale. One very valuable aspect of IRT is the test characteristic
function, which is the sum of the item characteristic functions that makes up the test. It can be
used to predict the score of the examinees at given ability levels. The test characteristic curve
explains the performance of an examinee given their ability level on different tests (i.e., harder or
easier tests). Another valuable aspect of item response theory models is item information
functions. Item information functions display the contribution of particular items to the
assessment of ability with respect to simple logistic models (Hambleton & Jones, 1993).
Generally, items with higher discriminating power tend to offer more to measurement precision
than items with lower discriminating power and items tend to provide their greatest input to
measurement precision around their b value on the ability scale. Another valuable aspect is test
information function (I(θ)), which is the sum of item information functions. This function
provides estimates of the errors associated with ability estimation (see Equation 2).
SE(θ) = [I(θ)]-1
(2)
Polytomous Item Response Theory Models
Most attitude and personality instruments include items with multiple response
categories, which allow researchers to gather more information compared to dichotomously
scored items. For these multiple-category response items, polytomous IRT models are used to

49
Figure A.2 An example of an item characteristic curve for a 3-parameter logistic model.
represent the nonlinear relationship between examinee trait level and the probability of
responding in a particular category (Embretson & Reise, 2000). There are many polytomous IRT
models available, but the most widely used polytomous models are the graded response model
(GRM; Samejima, 1969), modified graded response model (M-GRM; Muraki, 1992), partial
credit model (Masters, 1982), rating scale model (Andrich, 1978a; 1978b) and nominal response
model (Bock, 1972).
GRM (Samejima, 1969; 1996) is used when item responses considered to be ordered
categorical responses. Also, GRM does not require that the same number of responses for each
item in a measurement instrument. Whereas, a M-GRM was developed to aid in the analysis of
instruments that consisted of items that have the same number of responses (i.e., a Likert format
attitude scale). PCM is mainly used to analyze items that require several steps and partial credit
needed to be assigned in the solution process. It has been used to describe the item responses to
achievement tests, such as math tests. In this model, the raw scale score considered to be a
50
sufficient statistics for examinee trait level. PCM can be considered to be an extension of the
Rasch model since all items have the same slope. Rating Scale Model (RSM) is used when the
instrument is composed of items where each item has the same rating scale. Like the PCM, it
assumes all items have the same discrimination (slope) and the raw scale score is considered to
be the sufficient statistic to estimate the examinee trait level. The difference between the PCM
and RSM is that the PCM does not make any assumptions about the relative difficulties of the
steps within any item. Whereas, RSM assumes that a fixed set of rating points are used for the
entire item set. Nominal Response Model (NRM) is used to describe item responses in the case
when the responses are not necessarily ordered along a trait continuum (i.e., the response
categories are not ordered). The Digital-age version of the LoTi instrument is composed of items
that have the same number of responses (i.e., Likert questions), and therefore the M-GRM will
be used to describe the item responses. Before the M-GRM is presented, it is important to discuss
the GRM.
Graded Response Model
In the GRM, each scale item (i) is explained by an item slope parameter (αi) and j = 1
…mi between category threshold parameters (βij). It can be represented mi + 1 = Ki to be equal to
the number of item response categories. There are two steps needed to compute the category
response probabilities. One objective of fitting the GRM is to determine the location of the
category threshold parameters on the latent trait continuum. There are two steps in estimating the
response probabilities in the GRM. The first step involves the computation of mi curves for each
item using Equation 3. Each curve represents the probability of an examinee’s raw item response
(x) falling in or above a given category threshold (j = 1 …mi) conditional on the trait level (θ)

51
P*ix(θ) = {exp[αi(θ- βij)]}/{1 + exp[αi(θ- βij)]} (3)
where and j = 1 …mi. These P*ix(θ) curves are also known as “operating characteristic curves”
and one operating characteristic curve is estimated for each between category threshold. The
value of the between “category” threshold parameter represents the trait level necessary to
respond above threshold j with 0.50 probability. Basically in the GRM, the item is treated as a
series of dichotomies. The P*ix(θ) curves are approximated for each dichotomy with the
restriction that the slopes of the operating characteristic curves are the same within an item. Once
these curves are estimated, the actual category response probabilities are computed by subtracted
(see Equation 4):
Pix(θ) = P*ix(θ) - P*i(x+1)(θ) (4)
The probability of responding in or above the lowest category is P*i0(θ) = 1.0, and the probability
of responding above the highest category is P*i(x= m + 1)(θ) = 0.0. These curves are termed
category response curves (CRCs). They represent the probability of an examinee answering in a
particular category conditional on the examinee trait level. The βij parameters or category
threshold parameters represent the point on the latent trait scale where examinees have a 0.50
probability of responding in or above the category j = x (Embretson & Reise, 2000).
The shape and location of the category response curves and operating characteristic
curves are determined from the item parameters. Using the operating characteristic and category
response curves, one is able to determine how well an item discriminates. An item discriminates
reasonably well among trait levels when the operating characteristic curves are steeper (higher
slope parameters αi), and category response curves are more narrow and peaked. The between
category threshold parameter is used to determine the location of the operating characteristic

52
curves and where each of the category response curves for the middle response options peaks,
i.e., middle of two adjacent threshold parameters (Embretson & Reise, 2000).
Modified Graded Response Model
Modified Graded Response Model (M-GRM) was developed by Muraki (1990) to
describe responses to Likert format attitude scales. M-GRM aids in the analysis of questionnaires
where all items have the same number of response categories. M-GRM is considered to be a
restricted case of Samejima’s (1969) GRM. Both GRM and M-GRM allow the item-slope
parameters to vary across items. But in the M-GRM, the category threshold parameters (βij) of
GRM are partitioned into two terms - a location parameter (bi) for each item and a set of
category threshold parameters (cj) for the entire scale in the M-GRM. More specifically, βij = bi -
cj.
The operating characteristic curves for the M-GRM model is described by Equation 5.
P*ix(θ) = {exp[αi(θ-(bi – ci))]}/{1 + exp[αi(θ-(bi – ci))]} (5)
The probability of responding in a particular category (see Equation 6).
Pix(θ) = P*ix - P*i(x+1), (6)
compared to the GRM, where P*i(x=0)(θ) = 1.0 and P*i(x= m + 1)(θ) = 0.0. The slope parameter
indicates how quickly the expected item scores change as a function of trait level. The major
difference between the GRM and M-GRM are the estimation of category threshold parameters.
For the GRM, one set of category threshold parameters (βij) is estimated for each scale item. For
the M-GRM, one set of category threshold parameters (cj) is estimated for the entire scale and
one location parameter (bi) is estimated for each item (Embretson & Reise, 2000). The item
location parameter serves to move the category threshold parameters within an item along the
53
trait continuum (see Equation 5). Therefore, the item location parameter indicates the “difficulty”
or scale value of a particular item. Thus, the M-GRM is a “restricted” model since it assumes
that the category boundaries are equally distant from each other across scale items but in the
GRM they are free to vary across items (Embretson & Reise, 2000). As a result, the M-GRM
requires a smaller amount of parameter estimates than the GRM.
One advantage of the M-GRM over the GRM is its ability to separate the estimation of
item location and category threshold parameters. It is important to note that there some
uncertainty to the scale of the category threshold parameters (cj). The GRM is much easier to
implement compared to M-GRM when the measurement instrument contains items with different
response formats. If the M-GRM was used in this situation, items with the same formats would
be grouped together to be considered as a “block,” and then item and category parameters would
be estimated within these blocks. The item parameters (αi and bi) could not be compared between
the blocks. The item parameters from different blocks could only be compared if some type of
linking procedures are used to place the item parameters on the same metric. In the other case, if
the measurement instrument contains items with similar response formats, the M-GRM could
possibly provide advantages over the GRM due to its ability to estimate item location and
category threshold parameters separately. The item location parameters (bi) can be used to order
the items according to their difficulty. Plus, the category threshold parameters (cj) can provide an
estimate of the psychological distance between the scale points independent of the item
parameters (Muraki, 1990).

54
Assessing the Fit of IRT Models
It is very important to assess the fit of the IRT model and it is done in two major steps.
The first step would be to evaluate if all the IRT assumptions have been met before conducting
the analysis. There are four major assumptions used by most IRT models with respect to the
relationship between item responses and the latent trait(s). There are unidimensionality, local
independence, nature of the item characteristic curve, and parameter invariance. The second step
would be assessing the goodness-of-fit of IRT model, possibly at the item, person and model
levels.
One of the most common methods to evaluate dimensionality is conducting a factor
analysis. Most common type of factor analysis is the principal component analysis (PCA). Factor
analysis is used to uncover the latent structure or dimensions that are necessary to explain a
significant amount of total variance (Garson, 2010). PCA is a mathematical procedure that
transforms a number of (possibly) correlated variables into a (smaller) number of uncorrelated
variables (Hull, 2010). Local independence is violated when the examinee item responses depend
not just on their trait level but their responses to other test items (or combinations of items) or
other common factors. This is also called local dependence (LD). The presence of LD effects the
estimation of test information and item discrimination parameters, making then larger than they
need to be (Yen, 1993). This could further cause computer programs to identify wrong or not
desired latent trait dimension (Steinburg & Thissen, 1996). A list of testing features that may
lead to local dependence was catalogued and several testing features should be avoided to
eliminate the possibilities of LD (Yen 1993). The first testing feature is speeded testing situations
since it can be noticed that there will be low or no response probabilities to the last few items,
which would violate LD. The second testing feature is where there is differential practice or

55
exposure to material among students, which would lead to DIF (Embretson & Reise, 2000). The
third testing feature is if items are grouped together so that answering one item affects the
answers to other items. For example, in a single word passage several questions are embedded,
and the latter responses could be influenced by earlier responses. The Q3 statistic is used to
identify pairs of test items that display LD and is the correlation between items after removing
the latent trait variable (Yen, 1993). The expected value of Q3 under the hypothesis of local
independence is -1/(N-1) (Embretson & Reise, 2000). Therefore, in large samples a researcher
would expect Q3 to be around zero and large positive values indicate item pairs that share other
factor that may a cause of concern. LD is not only present in achievement tests, but also
personality assessments (Steinburg & Thissen, 1996). Research conducted on personality
instruments has found that examinee responses become more consistent as the assessment
progresses. This phenomenon definitely will lead to LD and should be avoided. A G2 statistic
was developed to identify LD and allows researchers to analyze the residuals after fitting the IRT
model (Chen & Thissen, 1997). It evaluates pairs of items looking for unexpected covariance
given the covariance among other items in the test (Embretson & Reise, 2000).
The third assumption is regarding the nature of the ICC (i.e., monotonically increasing
curve). Several checks can be employed to evaluate the nature of the ICC. First, check the
performance levels of low ability examinees, their conditional p-values should be close to zero
when fitting a 1- or 2-PL model (Hull, 2010). The nature of the ICC should show equal
discrimination under 1-PL model. This can be checked by computing item-total correlations and
noting if a homogeneous distribution is obtained. When fitting a 1-PL model, all “r” values
should be closely equivalent.

56
The fourth assumption is regarding parameter invariance (i.e., item and ability parameter
invariance). To check for the invariance of the ability parameter, the researcher needs to compare
examinee ability estimates on different sets of items from the pool of items calibrated on the
same scale (Hull, 2010). Different item samples should generate close to the same ability
estimates in the case when the model fits. The standard errors will change with shorter tests. A
scatterplot of examinee ability based on one set of items versus the other should demonstrate a
strong linear relationship. The linear relationship may not be perfect due to sampling error. The
examinee ability estimates found considerably off from the line of best fit will be considered to
be a violation of the ability parameter invariance. To check for the invariance of item parameters
(a, b, & c), the researcher would compare item statistics acquired in two or more groups, such as
gender, ethnicity, or grade levels. Different groups should still generate close to the same item
parameter estimates if the model fits. Again, a scatterplot between the item parameter (a vs. a, b
vs b, c vs. c) based on one sample of examinees versus the other should demonstrate to be a
strong linear relationship. Sampling error will be present that will cause an imperfect
relationship. A violation of the item parameter will happen when the estimates are found
considerably off from the line of best fit. Differential item functioning, as know as DIF, occurs
when examinees with equal ability, but from different groups have an unequal probability of
answering the item correctly. Two most common forms of DIF are uniform and nonuniform.
Uniform DIF is shown when the item is systematically more difficult for members of one group,
even after matching examinees on ability (Hull, 2010). This will cause a shift in the b-parameter.
Nonuniform DIF is shown when the shift in the item difficulty is inconsistent across the ability
scale. This will cause a shift in the a-parameter.

57
Once the researcher has validated the assumptions of the IRT model, then one can
evaluate the goodness-of-fit of the IRT model used. There are three perspectives the researcher
can employ to evaluate the IRT model employed at the item, person and model/test level. There
is no exact answer for the researcher to state that this model fits or does not fit. Hence, the
ultimate decision depends upon the researcher’s judgment. Typically, model fit is assessed at the
item level (Reise, Widaman, & Pugh, 1993).
For item fit assessment, there are basically two main ways to determine how well an IRT
model explains the responses to a particular item. There is a graphical technique using the item
response curve (IRC) and statistical technique. First, the graphical technique compares the
estimated IRC with the empirical IRC from the actual data source. There are several ways to
create the empirical IRC, but the most common way is the following. First of all, the examinees
sorted by their trait levels and divided up into trait level groups, for example 10, with an equal
number of examinees in each trait group. For each test item, the actual percentage of item
endorsements is computed within each trait level groups. On the same graph as the estimated
IRC, the empirical curve is plotted with the coordinates of the values of within-group median
trait level estimate and the proportion endorsed within a trait level. Discrepancies (or residuals)
will be exposed through this graph, which would indicate problems in the item fit that could be
due to one or more possible causes. The causes could be (a) unaccounted for
multidimensionality, (b) a failure to estimate enough item parameters, (c) nonmontonicity of
item-trait relations, (d) subgroup of examinees may be drawn from a different population and
display poor person-fit or (e) poor item construction (Embretson & Reise, 2000).
Several researchers have tried to develop statistical techniques to formalize a test for the
significance of residuals between the empirical IRCs with model-based IRC. Many researchers

58
find it useful to compute standardize residuals to evaluate item fit. The standardized residuals
should be homoscedastic for each item and follow an approximately standard normal distribution
across all items of the test when graphed (Hull, 2010). Since standardized residuals are computed
within each cell of the person by item matrix, they can be added together and used as an index of
item or person fit (Embretson & Reise, 2000).
Similarly for item fit assessment, test or model fit assessment is conducted using
standardized residuals. In this case, the expected proportion correct using the test characteristic
curve (TCC) is compared to the observed proportion correct (raw score/sample size). Again, the
standardize residuals across the test should be homoscedastic and follow an approximate normal
distribution (Hull, 2010). In actual fact, standardized residuals are prediction errors that have
been converted into z score. The sum of z scores follows a Chi-square distribution, which is a
method to determine the goodness-of-fit. If the chi-square test is found not to be significant then
this would indicate that the differences between observed and expected values are small. If the
chi-square test is found to be significant then this would imply that the differences between
observed and expected values are large, and the model does not do a good job in reproducing the
observed values. Statistical tests with respect to model fit assessment presents itself to an
interesting duality. These tests are very sensitive to sample size and usually any deviation of data
from the model will result in the rejection of the null hypothesis. With respect to small sample
sizes, the standard errors for items are large and the model-data misfit can be mistakenly ignored
(Hull, 2010). With respect to large sample sizes, there is an increased chance of having a misfit
model since as the sample size increases the standard error decreases and the standard residual
increases. Another method to conduct model fit assessment is to use the value “-2 times the log
of the likelihood function,” which is related to statistic G2. G
2 has a χ
2 distribution with the

59
degrees of freedom equal to the number of response patterns minus the number of estimates
made in the model (Reise et al., 1993). G2 values are indicative of the difference between the
frequency of observed response patterns and the frequency of these patterns predicted by the
estimated ICCs. Suppose there is a large difference between these patterns, then a higher value of
G2 results. G
2 is not a suitable statistic to judge the fit of baseline models with respect to large
item sets or polytomous item responses since there are too many unobserved response patterns
and the statistic will have no known reference distribution (Reise et al., 1993).
Significant research has been conducted on person-fit statistics, which attempts to assess
IRT model-fit at the level of the individual examinee. Many person-fit statistics have been
published and researched, for example; caution indices (Tatsuoka, 1984; 1996), appropriateness
measures (Levine & Rubin, 1979), and scalability indices (Reise & Waller, 1993). Regardless of
the different names, all person-fit indices are based on the consistency of an individual’s item
response pattern with some proposed model of valid item responding (Embretson & Reise,
2000). It is important to note that some person-fit indices are only applicable to certain types of
IRT models (Meijer, 1994). In addition, person-fit indices have been designed for specific item
response formats (i.e., there have been mostly developed for dichotomous response items).
Person-fit indices allow researchers to identify interesting test taking patterns, such as cheating,
response carelessness, or fumbling (Harnisch, 1983; Wright & Stone, 1979). Person-fit indices
have been used to recognize individual differences in the personality trait structure in the context
of the personality assessment (Reise and Walker, 1983). Lastly, some researchers have also used
person-fit indices as a way of detecting specific skill deficits or cognitive errors in achievement
tests (Tatsuoka & Tatsuoka, 1983).

60
Differential Item Functioning
Differential item functioning (DIF) happens when an item on an instrument does not have
the same relationship to a latent variable (or multidimensional latent vector) across two or more
examinee groups (Embretson & Reise, 2000). An item is identified to have DIF if either the IRC
differs or any item parameters differ across groups. A DIF analysis is carried out by collecting
data for both groups through the administration of an instrument, estimating item parameters for
the two or more groups, and then comparing the IRCs visually or using “linking” procedures.
Linking procedures are used because the item parameters are calibrated separately for two
groups are not on the same scale and cannot be directly compared (Embretson & Reise, 2000). In
order to compare IRCs, the item parameter estimates from different groups need to be placed on
the same scale. Assumptions are made that no DIF present in the items and the item parameters
have been well estimated. Most linking procedures center on the following transformations:
θ* = xθ + y (7)
β* = xβ + y (8)
α* = α/x (9)
c* = c (10)
The aim is to find the value of the linking constants (x and y) that allow the item parameters
from the different groups to be placed on the same scale. The two most commonly used methods
to estimate the linking constants are “mean and sigma” and “characteristic curve” methods.
There are two problems that have been identified with mean and sigma methods. First issue is
that it is greatly affected by outliers and differential standard errors of the item difficulty
estimations (Embretson & Reise, 2000). Second issue is only information with respect to the
item difficulty parameters are used to determine the linking constants. Whereas the characteristic

61
curve methods use all of the estimated item parameters to determine the appropriate linking
constants. Once on a common scale, IRCs across groups can be compared to identify DIF.
Differential Functioning of Items and Tests (DFIT)
There are several IRT methods for testing DIF, such as Lord’s chi-square (Cohen, Kim,
& Baker, 1993; Lord, 1980), the likelihood ratio test (Thissen, Steinburg, & Wainer, 1988), and
area measures (Cohen et al., 1993; Kim & Cohen, 1991; Raju, 1988, 1990; Raju et al., 2009).
These procedures have been shown effective in detecting DIF, but none of them provide a way to
reveal differential test functioning (DTF). DTF means systematic measurement errors found in
an entire instrument. DFIT has been shown an effective procedure to uncover DIF or DTF, and
offers several advantages compared to other DIF methods. First advantage is that it is able
evaluate differential functioning at the item and test levels. Second, it can be used with a wide
variety of data: dichotomous, polytomous, uni-dimensional, and multidimensional. Third,
noncompensatory differential item functioning (NCDIF) and compensatory differential item
functioning (CDIF) are two indices used for assessing DIF (Raju et al., 2009). The assumption
using the NCDIF index is that all test items except the item under consideration contains no DIF,
whereas CDIF does not make this assumption. DTF is the sum of CDIF indices across all items
in the test and provides a way to assess the overall effect of removing an item from a test.
NCDIF is defined as the average squared distance between ICF’s for the focal and reference
groups (Oshima & Morris, 2008). This value is squared so that the differences do not cancel
each other out in different directions, and allows for NCDIF to capture both uniform and
nonuniform DIF. CDIF takes into account item covariances, and relates item and test level
differential functioning.
62
Originally, Raju et al. (1995) developed significance tests for NCDIF and DTF based on
χ2 statistic. These tests were found to be overly sensitive especially in large samples and have
falsely identified items as having significant DIF. Then based on a simulation studies,
predetermined cutoff scores for NCDIF for both dichotomous and polytomous items were
recommended, but found that these values were not generalizable to other samples or items
(Raju et al., 2009). Recently, the item parameter method (IPR) was developed to handle both
dichotomous and polytomous items, and has been implemented in the software (DFIT8). The
item parameter replication method is used to obtain cutoff values that are suited to a particular
data set (Oshima, Raju, & Nanda, 2006). IPR method starts with item parameter estimates from
the focal group, and the sampling variances and covariances of these estimates. Estimates of the
item parameters and variances can be provided by PARSCALE.

63
APPENDIX B
DETAILED METHODOLOGY

64
Introduction
The current study has reviewed the internal validity of the Digital-Age version of the
LoTi questionnaire by conducting a CFA (Brown, 2006; Harrington, 2008; Thompson, 2004)
and an item analysis using IRT (Embretson & Reise, 2000). Data has already been provided by
the publisher. CFA was conducted to verify the factor structure of the Digital-Age version of the
LoTi questionnaire. An EFA was conducted to see how it compares with the factor structure of
the CFA. Once the factor structure was identified, an item analysis using IRT was conducted on
each factor separately to evaluate how well the items are measuring the intended latent
construct(s). This section presents the research questions, assumptions, limitations, sample,
instrument, and statistical analyses used for this study.
Research Questions
The following research questions will be examined:
1. Does the same factor structure hold as proposed by the publisher with the data provided
from the LoTi Digital-Age Survey? Do the same items load on their respective factors as
proposed by the publisher? What is the goodness-of-fit for the CFA model? Are any
assumptions violated (e.g., unidimensionality) that would alter an IRT examination?
What is the factor structure of the LoTi Digital-Age version that emerges using an
exploratory analysis? How does it compare to the factor structure proposed by the
publisher?
2. Using a modified graded response model (Muraki, 1990), what is the slope parameter and
category intersection parameters for each item on the LoTi Digital-Age Survey? How do
these values differ between different items on the survey?

65
3. Since the LoTi Digital-Age Survey is completed by teachers at all grade levels
(elementary, intermediate, and secondary), are the difficulty and discrimination
parameters for each item on the LoTi Digital-Age Survey equivalent or closely similar
for teachers from different grade levels (i.e., elementary vs. intermediate/secondary)? Are
the difficulty and discrimination parameters for the entire LoTi Digital-Age Survey
equivalent or closely similar for teachers from different grade levels (i.e., elementary vs.
intermediate/secondary)?
Sample
The LoTi Connection has provided a data set of approximately 2900 teachers that have
completed the LoTi Digital-Age Survey across the United States. The LoTi Connection is the
company that owns the LoTi surveys (original, DETAILS and Digital-Age versions of the LoTi
Survey), and will be identified as “the publisher” in the present study. The publisher has agreed
to provide this data and a formal agreement was reached with them. Permission from LoTi
Connection, Inc. for the researcher to publish the survey and supporting survey documents,
analyze the data from the LoTi Digital-Age Survey, and publish the findings are found in
Appendix D.
Assumptions
In the research conducted, the following assumptions were important to the validity of the
data being analyzed:
1. Participants understand the survey questions.
2. Participants respond honestly to the survey questions.
66
Limitations
The publisher provided a data set (n = 2900) for the Digital-Age version of the LoTi
questionnaire that consists of responses from teachers across the country. Demographic
information (such as school district, state, age, etc.) has not been provided due to confidentiality
reasons. These datasets were formed by teachers that expressed a personal interest in taking the
survey and/or district mandated teachers to take the survey to determine professional
development needs. Since the subjects were not randomly selected, the findings may not be
generalized to the entire educator population on manifest indicators. However, item parameters
estimated using IRT and latent trait distributions under CFA are generally assumed to be
invariant from sample to sample, thus the examination of DIF in the present sample.
Instrumentation
The instrument that was used to collect data for the present study is the LoTi Digital-Age
survey. A copy of this survey can be located in Appendix D.
Statistical Analysis
Confirmatory Factor Analysis
For Research Question 1, a CFA was conducted using the data from LoTi Digital-Age
survey. The first step was to conduct a preliminary descriptive statistical analysis that will point
out issues around scaling, missing data, collinearity issues, and outlier detection. Before the CFA
is conducted, these issues must be resolved.
The second step was to specify the model, which was the factor structure proposed by the
publisher (i.e., specify the path diagram for the confirmatory factor analysis; factor structure of

67
the LoTi Digital-Age Survey). The third step was to conduct the CFA in LISREL and estimate
the parameters (see Table A.4). The main idea behind a CFA is to be able to estimate the
parameters (i.e., factor loadings, factor variances and covariances, and indicator error variances),
so that the predicted covariance matrix is as close as possible to the sample covariance matrix.
Maximum likelihood (ML) is the fitting function that was used to determine the closeness of the
implied covariance matrix to the sample covariance matrix. Model convergence was attained
when the LISREL yields a set of parameter estimates that cannot be improved upon further
decrease the difference between the predicted covariance matrix and the sample covariance
matrix.
The last step was to assess model fit on three major aspects. For the overall goodness of
fit, it is suggested to use one index from the absolute fit, adjusting for model parsimony, and
comparative fit categories. The overall fit indices that were used are χ2, SRMR, RMSEA, and the
Tucker-Lewis Index (TLI). The following guidelines are suggested for reasonably good fit
between the target model and observed model using ML estimation is where (a) SRMR values
are close to 0.08 or below, (2) RMSEA values are close to 0.06 or below, and (3) TLI are close
to 0.95 or greater (Hu & Bentler, 1999). Also, residuals and modification indices were computed
to detect local areas of misfit in a CFA solution. Lastly, the direction, magnitude, and
significance of the parameter estimates were reviewed to ensure they make “statistical and
substantive sense” (Brown, 2006, p. 126).

68
Table A.4
Variables Involved in Confirmatory Factor Analysis
Description Variables
Latent variable ξ1, ξ2, ξ3, ξ4, ξ5
Observed variable Q13, Q15, Q18, Q26, Q43, Q46,Q49, Q6, Q20, Q32, Q41, Q50,
Q1, Q4, Q5, Q8, Q10, Q14, Q21, Q22,Q36, Q38, Q40, Q47,
Q16, Q17, Q27, Q30, Q31, Q37, Q45, Q12,Q19, Q23, Q25, Q42, Q48
Factor loadings λ13,1, λ15,1, λ18,1, λ26,1, λ43,1, λ46,1, λ49,1, λ6,2, λ20,2, λ32,2, λ41,2, λ50,2, λ1,3,
λ4,3, λ5,3, λ8,3, λ10,3, λ14,3, λ21,3, λ22,3, λ36,3, λ38,3, λ40,3, λ47,3, λ16,4,
λ17,4, λ27,4, λ30,4, λ31,4, λ37,4, λ45,4, λ12,5, λ19,5, λ23,5, λ25,5, λ42,5, λ48,5,
Factor variance and
covariance
ϕ21, ϕ32, ϕ43, ϕ54,
Error variance and
covariance
δ13, δ 15, δ 18, δ 26, δ 43, δ 46, δ 49, δ 6, δ 20, δ 32, δ 41, δ 50,
δ 1, δ 4, δ 5, δ 8, δ 10, δ 14, δ 21, δ 22, δ 36, δ 38, δ 40, δ 47,
δ 16, δ 17, δ 27, δ 30, δ 31, δ 37, δ 45, δ 12, δ 19, δ 23, δ 25, δ 42, δ 48
Item Response Theory
For Research Question 2, an item analysis, particularly (2-PL) M-GRM, was conducted
on all the items from Digital-Age version of the LoTi instrument since all the questions have the
same Likert-type format (i.e., same number of responses for each item). The model was
evaluated to determine if all the IRT assumptions have been met before conducting the analysis.
Also, the goodness-of-fit of each IRT model was assessed at the item and test level by using
standardized residuals and G2 statistic.
69
The analysis of the item responses was conducted in PARSCALE. This software
provided an estimate of item parameters for IRT models using data sets that are composed of
polytomous item response formats. Descriptive statistics was reported, including the number of
examinee responses, percentage endorsement in each response category, item means, initial slope
estimates, and Pearson and polyserial item-test correlations. Also, parameter estimates were
reported for each item, including an estimate and standard error item step, slope and location
parameters. In addition, chi-square item-fit statistics was reported.
For Research Question 3, a DIF analysis was conducted to determine if the parameters
are invariant at the item-level or in other words, determine if an item is performing differently
for one group compared to another. This was carried out by splitting teachers in two groups
according to grade levels (elementary and intermediate/secondary) and determining if any DIF
(uniform/nonuniform) is present. A DTF analysis was conducted to determine if the parameters
are invariant at the test-level or in other words, determine if the test is performing differently for
one group compared to another. Again, the two groups according to the teacher’s grade level was
used to carry out the analysis. The software DFIT 8 was used to conduct the DIF and DTF
analyses. The NCDIF and CDIF indices were computed. The item parameter replication (IPR)
method was used for significance testing provided by the software. Also, the POLYEQUATE
software was used for linking the focal and reference groups.
Missing Data
It is assumed data is missing completely at random (MCAR) and missing at random
(MAR). Missing data was initiating though to be handled by using full information maximum

70
likelihood (FIML) (Peugh & Enders, 2004). Since the matrix did not converge with this method,
Multiple Imputation was used instead.
Institutional Review Board
An application for permission to conduct the present study on a secondary data source
has been made to the Institutional Review Board (IRB). The study has been approved by IRB
and documentation (an email) has been provided in Appendix D.

71
APPENDIX C
UNABRIDGED RESULTS

72
Item Analysis
Before conducting the item analysis, a CFA was conducted on each factor and its
respective items separately in LISREL 8.8 to confirm that it is unidimensional factor and
determine the loadings of each item. Items that had loadings less than 0.30 were removed from
the factor in the item analysis. Item 16 was removed from the Professional Growth and
Leadership factor (Factor 4). Items 19, 42, and 48 were removed from the Digital Citizenship
and Responsibility factor (Factor 5). Next, an item analysis was conducted on the items that
loaded on to each factor from the Digital-Age version of the LoTi instrument (i.e., a total of five
item analyses were conducted). A 2-PL modified graded response model (M-GRM) was used
since all the items on this instrument have the same Likert-type format (i.e., same number of
responses for each item). M-GRM is considered to be a restricted case of Samejima’s (1969)
GRM.
The IRT model was assessed in two major steps. The first step was to evaluate if all the
IRT assumptions were met. The four major assumptions used by most IRT models with respect
to the relationship between item responses and the latent trait(s). There are unidimensionality,
local independence, nature of the item characteristic curve, and parameter invariance. The
second step was to assess the goodness-of-fit of the IRT model at the item level using chi-square
fit statistics. The analysis of the item responses was conducted in PARSCALE version 4.1. This
software provides an estimate of item parameters for IRT models using data sets that are
composed of polytomous item response formats. Since the response selections were from 0 to 7,
they needed to be rescaled to 1 to 8 since PARSCALE does not understand a response selection
of 0. Less than one percent of the responses were identified as missing and multiple imputation
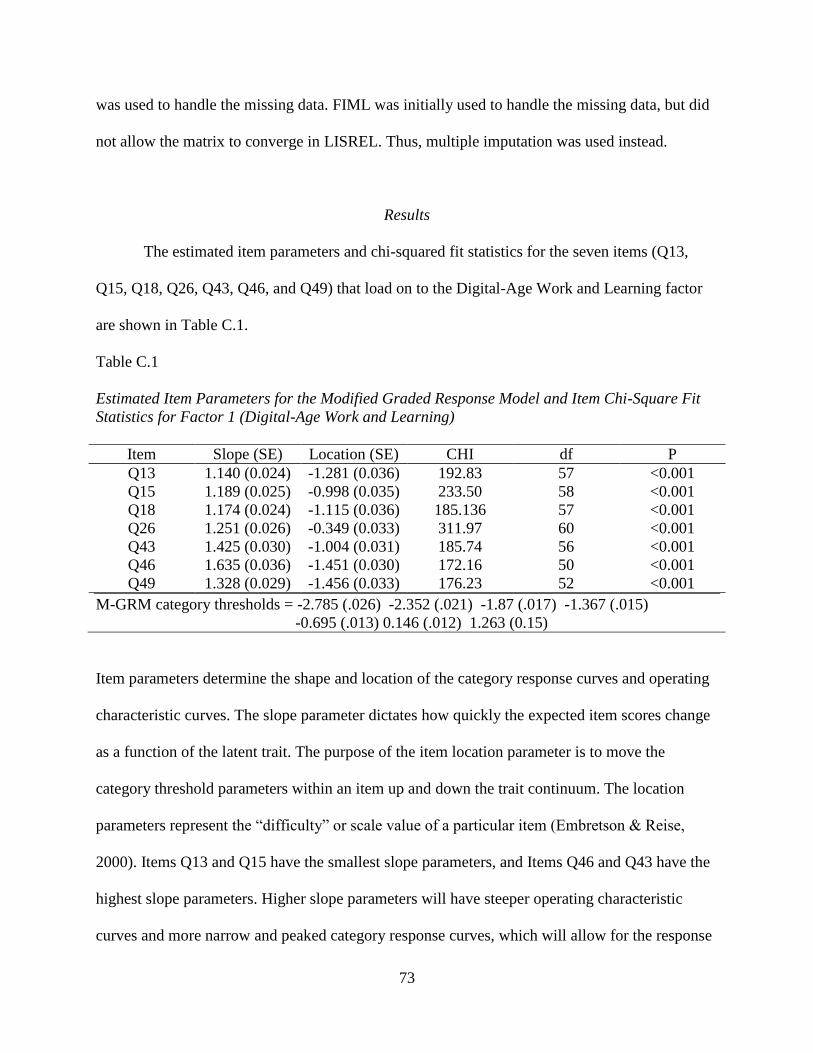
73
was used to handle the missing data. FIML was initially used to handle the missing data, but did
not allow the matrix to converge in LISREL. Thus, multiple imputation was used instead.
Results
The estimated item parameters and chi-squared fit statistics for the seven items (Q13,
Q15, Q18, Q26, Q43, Q46, and Q49) that load on to the Digital-Age Work and Learning factor
are shown in Table C.1.
Table C.1
Estimated Item Parameters for the Modified Graded Response Model and Item Chi-Square Fit
Statistics for Factor 1 (Digital-Age Work and Learning)
Item Slope (SE) Location (SE) CHI df P
Q13 1.140 (0.024) -1.281 (0.036) 192.83 57 <0.001
Q15 1.189 (0.025) -0.998 (0.035) 233.50 58 <0.001
Q18 1.174 (0.024) -1.115 (0.036) 185.136 57 <0.001
Q26 1.251 (0.026) -0.349 (0.033) 311.97 60 <0.001
Q43 1.425 (0.030) -1.004 (0.031) 185.74 56 <0.001
Q46 1.635 (0.036) -1.451 (0.030) 172.16 50 <0.001
Q49 1.328 (0.029) -1.456 (0.033) 176.23 52 <0.001
M-GRM category thresholds = -2.785 (.026) -2.352 (.021) -1.87 (.017) -1.367 (.015)
-0.695 (.013) 0.146 (.012) 1.263 (0.15)
Item parameters determine the shape and location of the category response curves and operating
characteristic curves. The slope parameter dictates how quickly the expected item scores change
as a function of the latent trait. The purpose of the item location parameter is to move the
category threshold parameters within an item up and down the trait continuum. The location
parameters represent the “difficulty” or scale value of a particular item (Embretson & Reise,
2000). Items Q13 and Q15 have the smallest slope parameters, and Items Q46 and Q43 have the
highest slope parameters. Higher slope parameters will have steeper operating characteristic
curves and more narrow and peaked category response curves, which will allow for the response

74
categories to differentiate among trait levels reasonably well (Embretson & Reise, 2000).
Therefore, Items Q13 and Q15 will provide more detail with respect to factor. Item Q26 has the
lowest item location parameter and items Q46 and Q49 has the highest item location parameter.
As shown in the item characteristic curves (ICC), response options At least once a year are At
least once a semester are overlapped by the response option Never, meaning that none of the
participants are selecting these two response options.
The estimated item parameters and chi-squared fit statistics for the five items (Q6, Q20,
Q32, Q41, Q50) that load on to the Digital-Age learning experiences and assessment factor are
shown in Table C.2. Item Q41 has the smallest slope parameters and item Q20 has the highest
slope parameter, which implies that Item Q20 is able to provide more detail with respect to the
factor. Item Q41 has the smallest item location parameter and item Q50 has the highest item
location parameter. Again, the same pattern is noticed with ICC, meaning the first response
option “Never” overlaps the second and third response options (At least once a year and At least
once a semester).
Table C.2
Estimated Item Parameters for the Modified Graded Response Model and Item Chi-Square Fit
Statistics for Factor 2 (Digital-Age Learning Experiences and Assessment)
Item Slope (SE) Location (SE) CHI df P
Q6 1.404 (0.031) -1.291 (0.032) 297.77 56 <0.001
Q20 1.491 (0.034) -1.739 (0.031) 269.56 46 <0.001
Q32 1.417 (0.035) -2.156 (0.033) 194.17 44 <0.001
Q41 1.169 (0.025) -1.043 (0.036) 376.43 63 <0.001
Q50 1.385 (0.041) -2.610 (0.036) 184.33 38 <0.001
M-GRM category thresholds = -3.62 (.046) -3.287 (.038) -2.655 (.028) -2.056 (.021)
-1.285 (.017) -0.307(.014) 0.836 (.015)
The estimated item parameters and chi-squared fit statistics for the 12 items (Q1, Q4, Q5,
Q8, Q10, Q14, Q21, Q22, Q36, Q38, Q40, and Q47) that load on to the Student Learning and

75
Creativity factor are shown in Table C.3. Item Q21 has the smallest slope parameters and Item
Q40 has the highest slope parameter, meaning Item Q40 provides the most amount of
information with respect to this factor. Item Q5 has the smallest item location parameter and item
Q36 has the highest item location parameter. The ICC presents the same nature of response
selections by the teachers, meanings the first response option Never overlaps At least once a year
and At least once a semester. Hence, these response options are undistinguishable.
Table C.3
Estimated Item Parameters for the Modified Graded Response Model and Item Chi-Square Fit
Statistics for Factor 3 (Student Learning and Creativity)
Item Slope (SE) Location (SE) CHI Df P
Q1 1.392 (0.031) -1.298 (0.033) 314.46 54 <0.001
Q4 1.662 (0.034) -0.099 (0.030) 219.97 57 <0.001
Q5 1.658 (0.034) -0.103 (0.029) 207.84 57 <0.001
Q8 1.751 (0.037) -1.192 (0.030) 245.30 50 <0.001
Q10 1.471 (0.030) -0.132 (0.033) 180.71 60 <0.001
Q14 1.748 (0.035) -0.493 (0.029) 181.75 55 <0.001
Q21 1.028 (0.028) 1.102 (0.042) 392.44 66 <0.001
Q22 1.809 (0.037) -0.913 (0.029) 169.24 51 <0.001
Q36 1.573 (0.038) -1.416 (0.033) 336.63 50 <0.001
Q38 1.269 (0.027) -1.371 (0.039) 422.02 54 <0.001
Q40 1.924 (0.040) -0.780 (0.028) 116.35 50 <0.001
Q47 1.556 (0.032) -0.181 (0.030) 265.68 58 <0.001
M-GRM category thresholds = -2.015 (0.013) -1.673 (.011) -1.226 (.010) -0.834 (.009)
-0.256 (.008) 0.48 (.008) 1.512 (.011)
The estimated item parameters and chi-squared fit statistics for the six items (Q17, Q27,
Q30, Q31, Q37, and Q45) that load on to the Professional Growth and Leadership factor are
shown in Table C.4. Item Q17 has the smallest slope parameters and Item Q27 has the highest
slope parameter, meaning Item Q27 is able to provide the most amount of information with
respect to the factor. Item Q31 has the smallest item location parameter and Item Q45 has the
higher item location parameter. Again, the ICC presents the same nature in response options. The

76
first three response options are not distinguishable; meaning the first response option Never
overlaps the second and third response options.
Table C.4
Estimated Item Parameters for the Modified Graded Response Model and Item Chi-Square Fit
Statistics for Factor 4 (Professional Growth and Leadership)
Item Slope (SE) Location (SE) CHI df P
Q17 0.764 (0.015) -1.637 (0.052) 278.65 63 <0.001
Q27 1.344 (0.030) -1.606 (0.034) 201.66 53 <0.001
Q30 1.331 (0.030) -1.754 (0.034) 237.13 51 <0.001
Q31 1.293 (0.028) -0.676 (0.033) 297.52 61 <0.001
Q37 1.037 (0.023) -0.161 (0.037) 409.36 65 <0.001
Q45 0.893 (0.020) -1.940 (0.044) 190.30 60 <0.001
M-GRM category thresholds = -3.182 (.031) -2.786 (.027) -2.2 (.022) -1.634 (.019) -0.848 (.016)
0.142 (.015) 1.436 (.018)
The estimated item parameters and chi-squared fit statistics for the three items (Q12,
Q23, and Q25) that load on to the digital citizenship and responsibility factor are shown in Table
C.5. The slope parameters and item location parameters are very similar for all the items. From
the ICC, the last three response options overlap the rest of the response options, which means the
teachers were not selecting the first five options.
Table C.5
Estimated Item Parameters for the Modified Graded Response Model and Item Chi-Square Fit
Statistics for Factor 5 (Digital Citizenship and Responsibility)
Item Slope (SE) Location (SE) CHI df P
Q12 1.177 (0.033) -2.960 (0.040) 742.78 33 <0.001
Q23 1.050 (0.025) -2.677 (0.042) 1386.64 39 <0.001
Q25 1.187 (0.030) -2.751 (0.039) 794.84 34 <0.001
M-GRM category thresholds = -4.849 (.112) -4.49 (.092) -3.931 (.069) -3.267 (.050)
-2.255 (.032) -1.047 (.023) 0.268 (.021)
One of the major advantages of M-GRM is to be able to compare the category thresholds or
psychological distance between the scale points for these five factors. It was found that Factor 3

77
has the smallest scale and Factor 5 has the largest scale; in other words, all of the items in Factor
3 fit in a smaller psychological distance compared to Factor 5. The rest of the factors (Factors 2,
3 and 4) have scales that lie between these two scales.
The four major assumptions made by IRT models are unidimensionality, local
independence, nature of the item characteristic curve, and parameter invariance. A CFA was
conducted on each factor separately to ensure the unidimensionality assumption was met. The
model suggested by the publisher has between 5 to 12 items loading onto each factor. The model
for each factor was statistically significant (p < 0.05) based on the Satorra-Bentler chi-square
statistic. The fit indices (SRMR, RMSEA and CFI) were also reviewed to assess the fit of the
CFA model. A study conducted on the cutoff criteria suggested the following guidelines for
reasonably good fit between the target model and the observed data (assuming ML estimation) is
attained in cases where (a) SRMR values are close to 0.08 or below, (b) RMSEA values are close
to 0.06 or below, and (c) CFI and TLI values are close to 0.95 or greater (Hu & Bentler, 1999).
It was found that almost all of the fit indices for each factor fell into the suggested guidelines to
suggest a reasonably good fit. This ensures that the unidimensionality assumption has been met
and that there is no other dimension present within any of these factors. This also meets the local
independence criteria since none of the examinee item responses depend on their responses to
other test items, combinations of items, or even other common factors.
The next assumption to investigate is the nature of item characteristic curve (ICC) for
each item. The ICC for each item is very characteristic of a polytomous IRT; hence, the
probability of selecting a response for an item is represented by a curve. It was observed with
many of the items that the probability of selecting the first response Never and the last couple of
responses At least once a week, A few times a week, and At least a day were a lot higher than the

78
other response selections (At least once a year, At least once a semester, and At least once a
month). In fact, the probability of selecting the other responses in some cases, were very small or
null. The last assumption is parameter invariance is currently being investigated by conducting a
differential item functioning analysis using DFIT 8 software. This will investigate if an item is
performing differently for one group compared to another, or in other words determine if the
parameters are invariant at the itemlevel. Lastly, the goodness-of-fit of the IRT model was
assessed at the item level using chi-squared statistics. According to the item-level chi-square fit
statistics, all of these items are not well represented by the estimated M-GRM item parameters (p
< 0.05), as shown in Tables 1-5.
Discussion
This current study shows how each of the items within their respective factors is
behaving. Some of the items have higher slope parameters compared to others, which allow them
to provide greater detail since they are able to better discriminate a teacher’s practice. The items
that have higher slope parameters within each factor should be examined more closely since they
provide the most amount of information with respect to that factor. Figures C.1 and C.2 displays
the item characteristic curves of an item with a high slope (Item 40) and an item with a low slope
(Item Q17). It can be easily noted that items with high slopes attempts to clearly distinguish
between the categories since the response curves have higher peaks and more separated
compared to items with low slopes. In addition, it was found that items with low slope
parameters had low factor loadings in the CFA, such as Item Q17. The difficulty parameter can
be used to order the items from most to least difficult within each factor, and allows to identify
items that seem to be more difficult to be answered by the teacher.
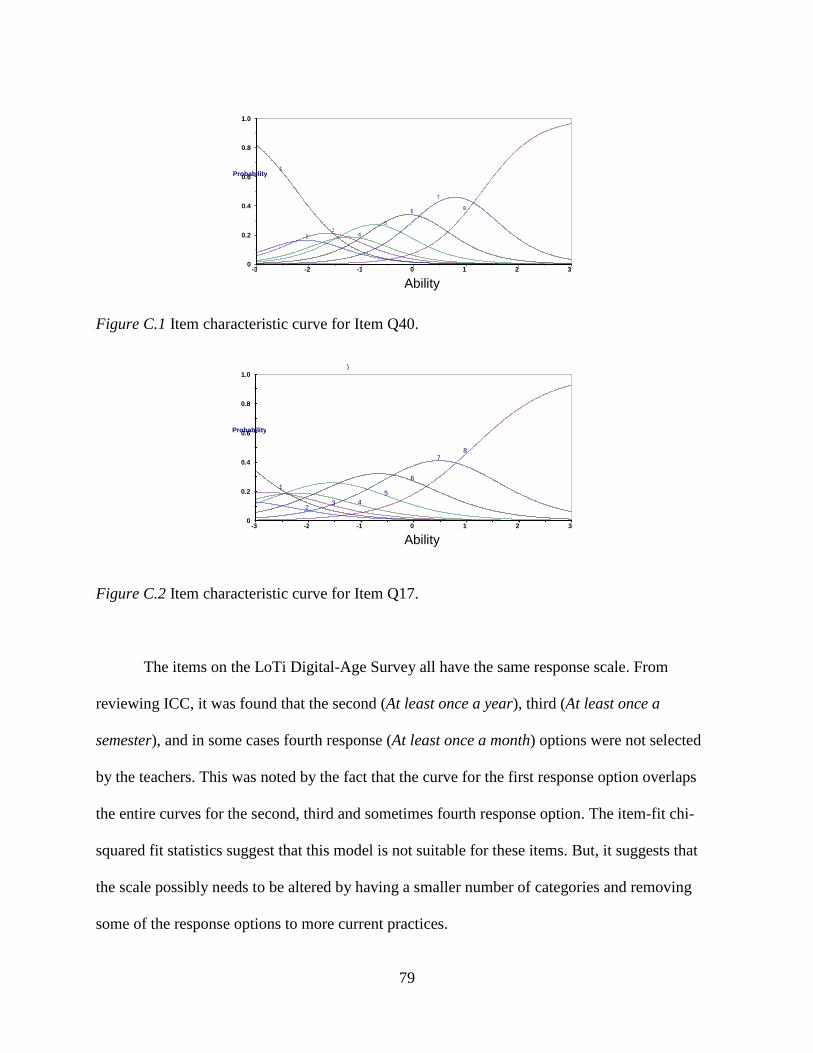
79
Figure C.1 Item characteristic curve for Item Q40.
Figure C.2 Item characteristic curve for Item Q17.
The items on the LoTi Digital-Age Survey all have the same response scale. From
reviewing ICC, it was found that the second (At least once a year), third (At least once a
semester), and in some cases fourth response (At least once a month) options were not selected
by the teachers. This was noted by the fact that the curve for the first response option overlaps
the entire curves for the second, third and sometimes fourth response option. The item-fit chi-
squared fit statistics suggest that this model is not suitable for these items. But, it suggests that
the scale possibly needs to be altered by having a smaller number of categories and removing
some of the response options to more current practices.
0
0.2
0.4
0.6
0.8
1.0
-3 -2 -1 0 1 2 3
1
2 3 4
5 6
7 8
Ability
Probability
0
0.2
0.4
0.6
0.8
1.0
-3 -2 -1 0 1 2 3
1
2 3 4 5
6
7 8
Ability
Probability
)
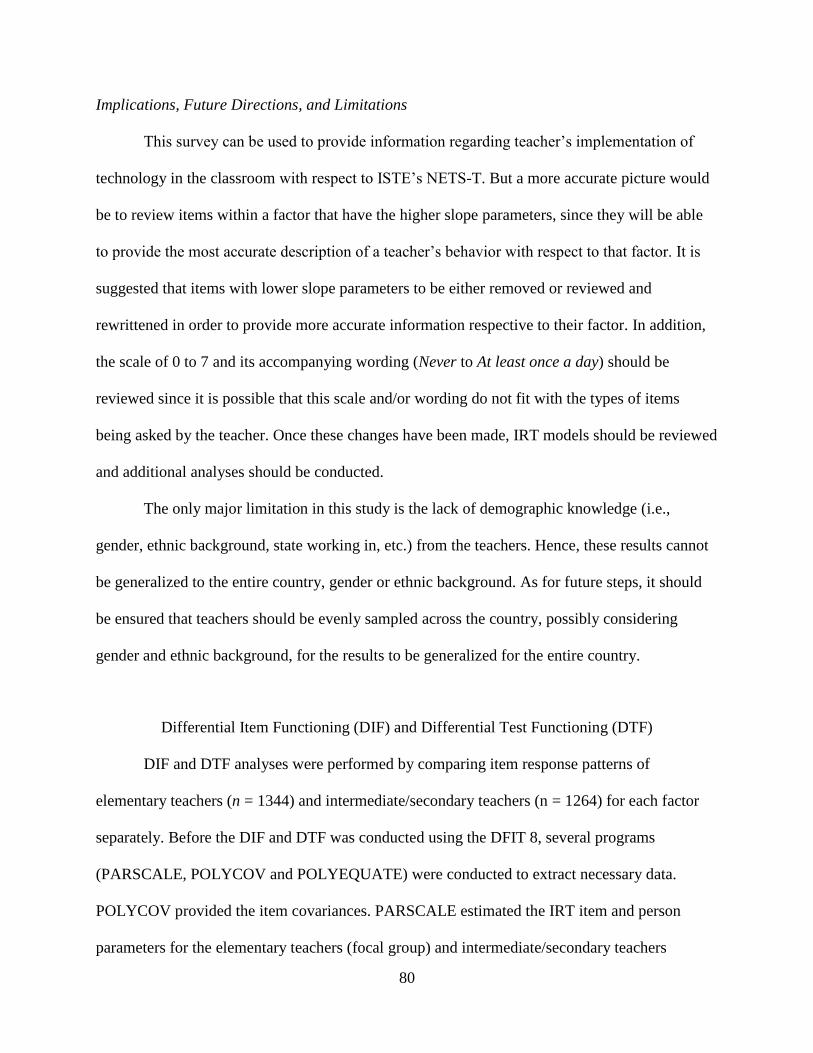
80
Implications, Future Directions, and Limitations
This survey can be used to provide information regarding teacher’s implementation of
technology in the classroom with respect to ISTE’s NETS-T. But a more accurate picture would
be to review items within a factor that have the higher slope parameters, since they will be able
to provide the most accurate description of a teacher’s behavior with respect to that factor. It is
suggested that items with lower slope parameters to be either removed or reviewed and
rewrittened in order to provide more accurate information respective to their factor. In addition,
the scale of 0 to 7 and its accompanying wording (Never to At least once a day) should be
reviewed since it is possible that this scale and/or wording do not fit with the types of items
being asked by the teacher. Once these changes have been made, IRT models should be reviewed
and additional analyses should be conducted.
The only major limitation in this study is the lack of demographic knowledge (i.e.,
gender, ethnic background, state working in, etc.) from the teachers. Hence, these results cannot
be generalized to the entire country, gender or ethnic background. As for future steps, it should
be ensured that teachers should be evenly sampled across the country, possibly considering
gender and ethnic background, for the results to be generalized for the entire country.
Differential Item Functioning (DIF) and Differential Test Functioning (DTF)
DIF and DTF analyses were performed by comparing item response patterns of
elementary teachers (n = 1344) and intermediate/secondary teachers (n = 1264) for each factor
separately. Before the DIF and DTF was conducted using the DFIT 8, several programs
(PARSCALE, POLYCOV and POLYEQUATE) were conducted to extract necessary data.
POLYCOV provided the item covariances. PARSCALE estimated the IRT item and person
parameters for the elementary teachers (focal group) and intermediate/secondary teachers

81
(reference group). Since the parameters for each group were estimated separately, they needed
to be transformed onto the same scale. This was accomplished by using POLYEQUATE since it
provides the linking coefficients (a multiplicative coefficient and an additive coefficient). Files
or information from these programs were used as input into DFIT 8, and allowed for the program
to determine which parameters are invariant at the item-level and test-level with respect to the
two groups (i.e., elementary vs. intermediate/secondary teachers). DIF was assessed based on
two indices: the noncompensatory differential item functioning (NCDIF) index and
compensatory differential item functioning (CDIF) index. It is important that the items used in
the equating process be DIF-free. Hence, the after the DIF/DTF analysis were performed, items
found to have significant DIF were removed, the scales were re-equated without those items, and
DIF/DTF analyses were repeated.
For Digital-Age Work and Learning Factor (Factor 1), the results indicated that the items
Q26, Q43, and Q46 have a significant NDCIF (p < 0.001). It also indicates DTF of 1.18 is
statistically significant (p < 0.001). For Digital-Age Learning Experiences and Assessments
Factor (Factor 2), the results indicated that the item Q32 has a significant NCDIF (p < 0.05), and
items Q6 and Q20 have a significant NCDIF (p < 0.001). It also indicates DTF of 0.01114 is
statistically significant (p < 0.001). For Professional Growth and Leadership Factor (Factor 4),
the results indicated that the items Q17, Q27, and Q45 have a significant NCDIF (p < 0.005), and
the items Q31 and Q37 have a significant NDCIF (p < 0.001). It also indicates a DTF of 0.98274
is statistically significant (p < 0.001). For Digital Citizenship and Responsibility (Factor 5), the
results indicated that the item Q12 has a significant NDCIF (p < 0.05) and the item Q25 has a
significant NDCIF (p < 0.001). It also indicates DTF of 0.341 is statistically significant (p <
0.001). For the Student Learning and Creativity Factor (Factor 3), the program did not converge

82
and therefore, no results can be stated. An item with a significant NCDIF implies that the item
performs differently for the two groups, or in other words, the difficulty and discrimination
parameters are significantly different for teachers from the different grade groups. An item with
a nonsignificant NCDIF implies that the item does not perform differently for the two groups, or
in other words, the difficulty and discrimination parameters are equivalent or closely similar for
teachers from the different grade groups. Hence, items Q6, Q12, Q17, Q20, Q25, Q26, Q27,
Q31, Q32, Q37, Q43, Q45, and Q46 perform differently for elementary and
intermediate/secondary teachers. A test with a significant DTF implies that the test performs
differently for the two groups. Hence, all the factors perform differently for the elementary and
intermediate/secondary teachers.
Discussion
When reviewing these questions that have been identified to have DIF, many of these
questions are geared towards activities that occur in an intermediate/secondary classroom rather
than an elementary classroom. For example, item Q6 asks the teachers if they provide multiple
and varied formative and summative assessment opportunities, and item Q37 asks if web-based
projects have been implemented in their classrooms. Items Q12 and Q25 also applies to more
senior students since it pertains to the ethical use of technology in the classroom. This really
would not be as great of a concern in elementary grades. Yet, it was found two of the items (Q17
and Q45) were geared towards activities that would occur in an elementary classroom.
Implications, Future Directions, and Limitations
The results from this DIF/DTF analysis can assist the publisher on how to best revise the
items on the survey. The psychometric analyses provide information about the item performance

83
with respect to the two groups, but to understand why this is happening requires an in depth
review of the items. Differential item functioning can occur due to various reasons, such as the
interpretation of the meaning of the items, appropriateness of the response scale (i.e., 0 to 7), and
data collection procedures (Moses, 2006). The next step would be to review the items that have
been identified having DIF and revise these items. Focus groups or interviews should be
conducted to understand the reasons for item differential functioning with these items and review
the revised items. Lastly, the DFIT 8 program used to conduct the DIF/DTF analyses required
input from three other programs, which allows for more human error. A future analysis would be
to conduct the DIF/DTF analysis with M-PLUS, since the entire analyses can be conducted
within this program.
84
APPENDIX D
OTHER ADDITIONAL MATERIALS
ALL LoTi Materials are reproduced with permission from LoTi Connection.
LoTi Connection, Inc. PO Box 130037 Carlsbad, CA 92013-0037 (V) 760-431-2232 (F) 760-946-7605 www.loticonnection.com
………………………………………………………… Permission for Use of the LoTi Survey and Frameworks March 25, 2011 To: Vandhana Mehta University of North Texas Dissertation Review Board Please accept this letter as notification that Ms. Vandhana Mehta is hereby granted permission to utilize the LoTi Framework and corresponding LoTi Digital Age Survey to collect and publish data for her doctoral dissertation study. Ms. Mehta is permitted to use the LoTi Digital Age Survey, the LoTi Framework, the CIP Framework, the PCU Framework, the HEAT Framework, and the LoTi Quick Scoring Device for the purposes of the study only. In addition, Ms. Mehta has permission to review all available survey results on the individuals taking place in his study. The guidelines for using LoTi Connection copyrighted material as part of this dissertation study are as follows:
1. Permission to reprint the LoTi Framework, the CIP Framework, the PCU Framework and the HEAT Framework is granted provided that the content remains unchanged and that attribution is given to LoTi Connection.
2. Permission to reprint the LoTi Digital Age Survey and the LoTi Quick Scoring Device in the Appendices of the study is granted provided that the content remains unchanged and that attribution is given to LoTi Connection.
3. LoTi Connection holds the right to restrict usage of any intellectual property if LoTi Connection finds that the content is being used in an inappropriate manner.
Sincerely,
Dennee Saunders Assistant Executive Director Date 03/25/11
85

Date 02/11/2010
LoTi Connection, Inc. PO Box 130037 Carlsbad, CA 92013-0037 (V) 760-431-2232 (F) 760-946-7605 www.loticonnection.com
………………………………………………………… February 11, 2010 Vandhana Mehta 4595 West Spring Creek Parkway Plano, Texas 75024 [email protected] Agreement to Analyze the LoTi Survey Instrument & Publish Findings Ms. Vandhana Mehta of Plano, TX has the permission of Dr. Christopher Moersch and LoTi Connection Inc. to conduct a dissertation study on reviewing the internal validity of the LoTi instrument as it relates to the LoTi DETAILS or LoTi Digital-Age professional development factors, which would include conducting a EFA, CFA and IRT analyses on the LoTi instrument. In addition, Ms. Mehta has conditional permission to publish the findings as agreed to by both parties below. Permission to Analyze the LoTi Survey Instrument Ms. Mehta has permission to conduct an exploratory and confirmatory factor analysis of the LoTi Digital-Age survey instrument to determine if the same factor structure is found as in Dr. Jill Stoltzfus’ 2006 study. In addition, Ms. Mehta has permission to conduct an item level analysis using IRT on the LoTi Digital-Age survey instrument to see how the items are performing. Data for the analyses will be provided by LoTi Connection Inc. Permission to Publish Findings Ms. Vandhana Mehta has permission to publish her findings under the following conditions: (1) LoTi Connection Inc. will have 45 days to review Ms. Mehta’s findings, consult with Dr. Jill Stoltzfus, if necessary, and make any necessary changes to the LoTi Digital-Age Survey consistent with Ms. Mehta's findings (2) Any changes made to the LoTi Digital-Age Survey based on Ms. Mehta's findings will be reported in the final draft of her dissertation.
86
Date 02/11/2010
(3) Ms. Mehta’s findings, conclusions, and recommendations related to the LoTi Digital-Age Survey are stated as a matter of her own conviction. As LoTi Connection wishes to ensure the integrity of the LoTi name and the survey’s continued use as a research tool, Ms. Mehta agrees to include a response from LoTi Connection for any findings that it considers unfavorable within the dissertation only. By signing below, LoTi Connection Inc. and Ms. Vandhana Mehta agree to the terms of this Agreement as outlined. LoTi Connection Inc. Independent Consultant
_________________________________________ _________________________________________ Chris Moersch Vandhana Mehta Executive Director Independent Consultant _________________________________________ __________________________________________ Title Title 05/20/2010 _________________________________________ __________________________________________ Date Date
87

©2009 LoTi Connection, Inc.
Page 1
Digital-Age Surveyfor Teachers
LoTi
Version 1.0©2009 LoTi Connection, Inc.
Page 1
88

©2009 LoTi Connection, Inc.
Page 2
LoTi Digital-Age Survey for Teachers
Using the LoTi Digital-Age Survey for professional development planning is part of an ongoing nationwide effort to sharpen educator skillsets as defined by the Partnership for 21st Century Skills. Individual information will remain anonymous, while the aggregate information will provide various comparisons for your school, school district, regional service agency, and/or state. Please fill out as much of the information as possible.
The LoTi Digital-Age Survey takes about 20-25 minutes to complete. The purpose of this questionnaire is to determine your current professional development priorities related to technology and instruction based on
your current position (;i.e., pre-service teacher, inservice teacher, building administrator, instructional specialist, media specialist, higher education faculty).
Completing the questionnaire will enable your educational institution to make better choices regarding staff development and future technology purchases. The questionnaire statements were developed from typical responses of educators who ranged from non-users to sophisticated users of technology in the classroom. Survey statements will represent different uses of technology that you currently experience or support, in varying degrees of frequency, and should be recorded appropriately on the scale.
Please respond to the statements in terms of your present uses or support of technology in the classroom. Use the scale to determine your response based on how frequently you experience the activities described in the statement.
Teacher Computer Use (TCU): How often are you (the teacher) using digital tools and resources during the instructional day?
o Nevero At least once a yearo At least once a montho At least once a weeko At least once a dayo Multiple times each day
Student Computer Use (SCU): How often are your students using digital tools and resources during the instructional day?
o Nevero At least once a yearo At least once a montho At least once a weeko At least once a dayo Multiple times each day
012345
012345
89

©2009 LoTi Connection, Inc.
Page 3
LoTi Digital-Age Survey for Teachers
Q1: I engage students in learning activities that require them to analyze information, think creatively, make predictions, and/or draw conclusions using the digital tools and resources (e.g., Inspiration/Kidspiration, Excel, InspireData) available in my classroom.
Q4: Students in my classroom use the digital tools and resources to create web-based
(e.g., web posters, student blogs or wikis, basic webpages) or multimedia presen-tations (e.g., PowerPoint) that showcase digitally their research (i.e., information gathering) on topics that I assign more than for other educational uses.
Q5: I assign web-based projects (e.g., web collaborations, WebQuests) to my students that emphasize complex thinking strategies (e.g., problem-solving, decision-making, experimental inquiry) aligned to the content standards.
Q6: I provide multiple and varied formative and summative assessment opportunities that encourage students to “showcase” their content understanding in nontraditional ways.
Q8: I use the digital tools and resources in my classroom to promote student creativity and innovative thinking (e.g., thinking outside the box, exploring multiple solutions).
Q10: My students identify important real world issues or problems (e.g., environmental pollution, elections, health awareness), then use collaborative tools and human resources beyond the school building (e.g., partnerships with business professionals, community groups) to solve them.
Q12: I promote, monitor, and model the ethical use of digital information and technology in my classroom (e.g., appropriate citing of resources, respecting copyright permissions).
Q13: I use different digital media and formats (e.g, blogs, online newsletters, online lesson plans, podcasting, digital documents) to communicate information effectively to students, parents, and peers.
Q14: My students propose innovative ways to use our school's advanced digital tools (e.g., digital media authoring tools, graphics programs, probeware with GPS systems) and resources (e.g., publishing software, media production software, advanced web design software) to address challenges/issues affecting their local and global communities.
Q15: I model and facilitate the effective use of current and emerging digital tools and resources (e.g., streaming media, wikis, podcasting) to support teaching and learning in my classroom.
Q16: Our classroom’s digital tools and resources are used exclusively for classroom management and professional communication (e.g., accessing the Internet, communicating with colleagues or parents, grading student work, and/or planning instructional activities).
Q17: The digital tools and resources in my classroom are used by me during the instructional day and not by my students.
Q18: I use different technology systems unique to my grade level or content area (e.g., online courseware, Moodle, WAN/LAN, interactive online curriculum tools) to support student success and innovation in class.
Q19: I employ learner-centered strategies (e.g., communities of inquiry, learning stations/centers) to address the diverse needs of all students using developmentally-appropriate digital tools and resources.
Q20: Students’ use of information and inquiry skills to solve problems of personal relevance influences the types of instructional materials used in my classroom.
Q21: My students participate in collaborative projects (e.g., Jason Project, GlobalSchool-Net) involving face-to-face and/or virtual environments with students of other cultures that address current problems, issues, and/or themes.
Q22: My students use the available digital tools and resources for (1) collaboration with others, (2) publishing, (3) communication, and (4) research to solve issues and problems of personal interest that address specific content standards.
Q23: I model for my students the safe and legal use of digital tools and resources while I am delivering content and/or reinforcing their understanding of pertinent concepts using multimedia resources (e.g., PowerPoint, Keynote), web-based tools (e.g., Google Presentations), or an interactive whiteboard.
01234567
Never
At least once a year
At least once a semester
At least once a month
A few times a month
At least once a week
A few times a week
At least once a day
90
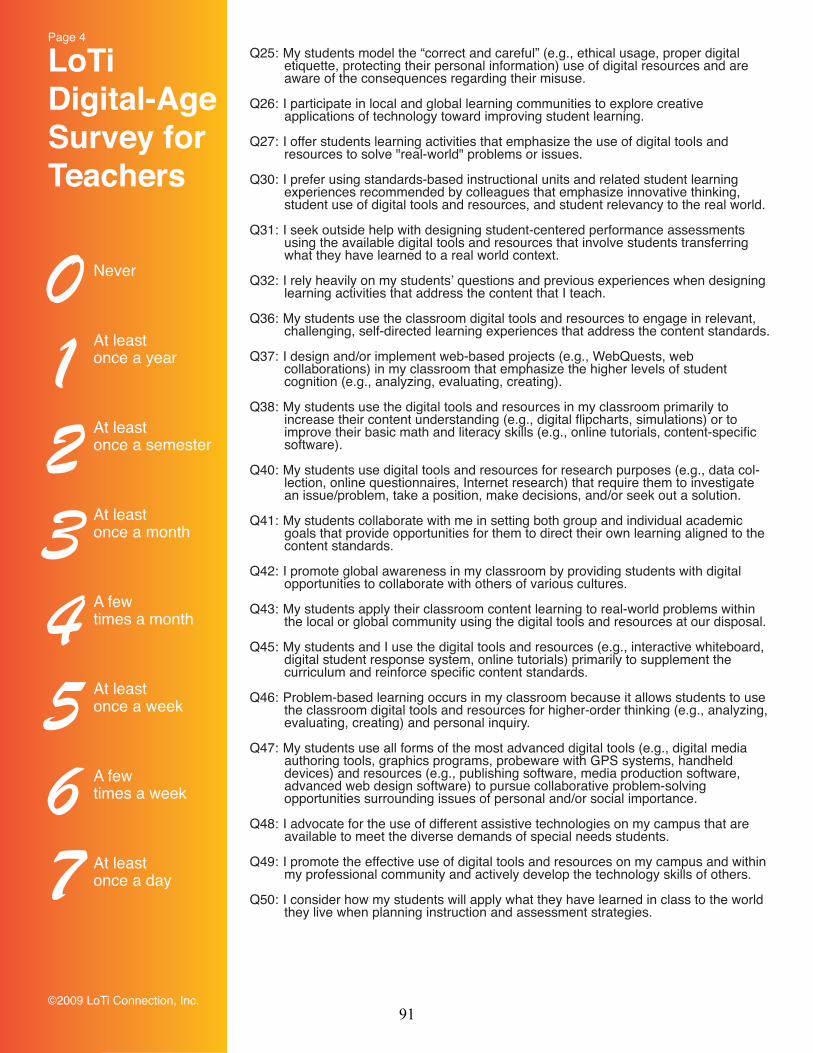
©2009 LoTi Connection, Inc.
Page 4
LoTi Digital-Age Survey for Teachers
Q25: My students model the “correct and careful” (e.g., ethical usage, proper digital etiquette, protecting their personal information) use of digital resources and are aware of the consequences regarding their misuse.
Q26: I participate in local and global learning communities to explore creative applications of technology toward improving student learning.
Q27: I offer students learning activities that emphasize the use of digital tools and resources to solve "real-world" problems or issues.
Q30: I prefer using standards-based instructional units and related student learning experiences recommended by colleagues that emphasize innovative thinking, student use of digital tools and resources, and student relevancy to the real world.
Q31: I seek outside help with designing student-centered performance assessments using the available digital tools and resources that involve students transferring what they have learned to a real world context.
Q32: I rely heavily on my students’ questions and previous experiences when designing learning activities that address the content that I teach.
Q36: My students use the classroom digital tools and resources to engage in relevant, challenging, self-directed learning experiences that address the content standards.
Q37: I design and/or implement web-based projects (e.g., WebQuests, web collaborations) in my classroom that emphasize the higher levels of student cognition (e.g., analyzing, evaluating, creating).
Q38: My students use the digital tools and resources in my classroom primarily to increase their content understanding (e.g., digital flipcharts, simulations) or to improve their basic math and literacy skills (e.g., online tutorials, content-specific software).
Q40: My students use digital tools and resources for research purposes (e.g., data col-lection, online questionnaires, Internet research) that require them to investigate an issue/problem, take a position, make decisions, and/or seek out a solution.
Q41: My students collaborate with me in setting both group and individual academic goals that provide opportunities for them to direct their own learning aligned to the content standards.
Q42: I promote global awareness in my classroom by providing students with digital opportunities to collaborate with others of various cultures.
Q43: My students apply their classroom content learning to real-world problems within the local or global community using the digital tools and resources at our disposal.
Q45: My students and I use the digital tools and resources (e.g., interactive whiteboard, digital student response system, online tutorials) primarily to supplement the curriculum and reinforce specific content standards.
Q46: Problem-based learning occurs in my classroom because it allows students to use the classroom digital tools and resources for higher-order thinking (e.g., analyzing, evaluating, creating) and personal inquiry.
Q47: My students use all forms of the most advanced digital tools (e.g., digital media authoring tools, graphics programs, probeware with GPS systems, handheld devices) and resources (e.g., publishing software, media production software, advanced web design software) to pursue collaborative problem-solving opportunities surrounding issues of personal and/or social importance.
Q48: I advocate for the use of different assistive technologies on my campus that are available to meet the diverse demands of special needs students.
Q49: I promote the effective use of digital tools and resources on my campus and within my professional community and actively develop the technology skills of others.
Q50: I consider how my students will apply what they have learned in class to the world they live when planning instruction and assessment strategies.
01234567
Never
At least once a year
At least once a semester
At least once a month
A few times a month
At least once a week
A few times a week
At least once a day
91

LoTi Digital-Age Quick Scoring Device to create LoTi Digital-Age Professional Development Priorities Graph
Digital-Age Work and Learning
(formally Teacher Proficiency with Technology Use)
Digital-AgeLearning
Experiences and Assessments
(formally Student Influences on Current Instructional Practices)
Student Learning and Creativity
(formally Using Technology for Complex
Thinking Projects)
Professional Growth and Leadership
(formally Locating Resources and/or
Assistance to Increase Existing Classroom Technology Use)
Digital Citizenship and Responsibility
(formally
Overcoming Challenges to
Beginning Classroom Technology Use)
Q13 _________ Q6 _________ Q1 _________ Q16 _________ Q12 _________
Q15 _________ Q20 _________ Q4 _________ Q17 _________ Q19 _________
Q18 _________ Q32 _________ Q5 _________ Q27 _________ Q23 _________
Q26 _________ Q41 _________ Q8 _________ Q30 _________ Q25 _________
Q43 _________ Q50 _________ Q10 _________ Q31 _________ Q42 _________
Q46 _________ Q14 _________ Q37 _________ Q48 _________
Q49 _________ Q21 _________ Q45 _________
Q22 _________
Q36 _________
Q38 _________
Q40 _________
Q47 _________
/ 49 / 35 / 84 / 49 / 42
________ % ________ % ________ % ________ % ________ %Report inverted per-centage from above
Report inverted per-centage from above
Report inverted per-centage from above
Report percentage above
Report inverted per-centage from above
Digital-Age Work and Learning
(formally Teacher Proficiency with Technology Use)
Digital-AgeLearning
Experiences and Assessments
(formally Student Influences on Current Instructional Practices)
Student Learning and Creativity
(formally Using Technology for Complex
Thinking Projects)
Professional Growth and Leadership
(formally Locating Resources and/or
Assistance to Increase Existing Classroom Technology Use)
Digital Citizenship and Responsibility
(formally
Overcoming Challenges to
Beginning Classroom Technology Use)
Use this Quick Scoring Device to get the percentages to graph each category of the LoTi Digital-Age Survey. Graph either the percentage or inverted percentage as described.
When creating the graph: - 0% to 33% equals “Low-level Priority” - 34% to 66% equals “Mid-level Priority” - 67% to 100% equals “High-level Priority”
92

LoTi Framework Levels of Teaching Innovation*
Revised 2009
LoTi Level Relation to Content Relation to Technology HEAT Intensity H igher-order thinking, Engaged learning, Authentic learning, Technology use. The H.E.A.T. Framework measures the integration of these four factors in classroom instruction.
LoTi 0 Non-use
At a Level 0 (Non-Use), the instructional focus can range anywhere from a traditional direct instruction approach to a collaborative student-centered learning environment. The use of research-based best practices may or may not be evident, but those practices do not involve the use of digital tools and resources.
The use of digital tools and resources in the classroom is non-existent due to (1) competing priorities (e.g., high stakes testing, highly-structured and rigid curriculum programs), (2) lack of access, or (3) a perception that their use is inappropriate for the instructional setting or student readiness levels. The use of instructional materials is predominately text-based (e.g., student handouts, worksheets).
HEAT Intensity Level 0 H Students taking notes only; no questions asked
(Bloom’s Taxonomy: not on scale) E Students report facts they have learned only A The learning experience is missing or too
vague to determine relevance T No technology use is evident by students or
teacher
LoTi 1 Awareness
At a Level 1 (Awareness), the instructional focus emphasizes information dissemination to students (e.g., lectures, teacher-created multimedia presentations) and supports the lecture/discussion approach to teaching. Teacher questioning and/or student learning typically focuses on lower cognitive skill development (e.g., knowledge, comprehension).
Digital tools and resources are either (1) used by the classroom teacher for classroom and/or curriculum management tasks (e.g., taking attendance, using grade book programs, accessing email, retrieving lesson plans from a curriculum management system or the Internet), (2) used by the classroom teacher to embellish or enhance teacher lectures or presentations (e.g., multimedia presentations), and/or (3) used by students (usually unrelated to classroom instructional priorities) as a reward for prior work completed in class.
HEAT Intensity Level 1 H Student learning/questioning at Knowledge
level of Bloom’s Taxonomy E Students report facts they have learned only A The learning experience is missing or too
vague to determine relevance to real world applications
T Little technology use by students is evident; Teacher uses technology for demonstration or lecture; Technology use by students is separate from the learning focus like a reward. Technology use occurs only at scheduled times.
LoTi 2 Exploration
At a Level 2 (Exploration) the instructional focus emphasizes content understanding and supports mastery learning and direct instruction. Teacher questioning and/or student learning focuses on lower levels of student cognitive processing (e.g., knowledge, comprehension) using the available
Digital tools and resources are used by students for extension activities, enrichment exercises, or information gathering assignments that generally reinforce lower cognitive skill development relating to the content under investigation. There is a pervasive use of student multimedia products,
HEAT Intensity Level 2 H Student learning/questioning at Knowledge or
Understanding level of Bloom’s Taxonomy E Students report facts they have learned only;
collaborate with others A The learning experience represents a group of
93

digital assets. allowing students to present their content understanding in a digital format that may or may not reach beyond the classroom.
connected activities, but provides no real world application
T Technology use is unrelated to the task; Technology supplements the existing instruction. Technology is used for low-level cognitive tasks like drill and practice.
LoTi 3 Infusion
At a Level 3 (Infusion), the instructional focus emphasizes student higher order thinking (i.e., application, analysis, synthesis, evaluation) and engaged learning. Though specific learning activities may or may not be perceived as authentic by the student, instructional emphasis is, nonetheless, placed on higher levels of cognitive processing and in-depth treatment of the content using a variety of thinking skill strategies (e.g., problem-solving, decision-making, reflective thinking, experimentation, scientific inquiry). Teacher-centered strategies including the concept attainment, inductive thinking, and scientific inquiry models of teaching are the norm and guide the types of products generated by students using the available digital assets.
Digital tools and resources are used by students to carry out teacher-directed tasks that emphasize higher levels of student cognitive processing relating to the content under investigation.
HEAT Intensity Level 3 H Student learning/questioning at Application or
Analysis level of Bloom’s Taxonomy E Students given options for projects or to solve
a problem A The learning experience provides limited real
world relevance, but does not apply the learning to a real world situation
T Technology use appears to be an add-on and is not needed for task completion; Technology is used for higher cognitive tasks like analysis and decision-making. Technology provides adaptations or alternatives in activities, assessments, and materials for special populations.
LoTi 4a Integration: Mechanical
At a Level 4a (Integration: Mechanical) students are engaged in exploring real-world issues and solving authentic problems using digital tools and resources; however, the teacher may experience classroom management (e.g., disciplinary problems, internet delays) or school climate issues (lack of support from colleagues) that restrict full-scale integration. Heavy reliance is placed on prepackaged materials and/or outside resources (e.g., assistance from other colleagues), and/or interventions (e.g., professional development workshops) that aid the teacher in sustaining engaged student problem-solving. Emphasis is placed on applied learning and the constructivist, problem-based models of teaching that require higher levels of student cognitive processing and in-depth examination of the content.
Students use of digital tools and resources is inherent and motivated by the drive to answer student-generated questions that dictate the content, process, and products embedded in the learning experience.
HEAT Intensity Level 4 H Student learning/questioning at Analysis,
Evaluation, or Create level of Bloom’s Taxonomy
E Students given options to solve a problem; collaborate with others
A The learning experience provides extensive real world relevance, but does not apply the learning to a real world situation
T Technology use is somewhat connected to task completion involving one or more applications; Technology use promotes collaboration among students for planning, implementing, and evaluating their work. Technology is used as a tool to help students identify and solve authentic problems relating to an overall theme/concept.
LoTi 4b Integration:
At a Level 4b (Integration: Routine) students are fully engaged in exploring real-world issues and solving authentic problems using digital tools and
Students use of digital tools and resources is inherent and motivated by the drive to answer student-generated questions that dictate the
HEAT Intensity Level 4 H Student learning/questioning at Analysis,
Evaluation, or Create level of Bloom’s
94
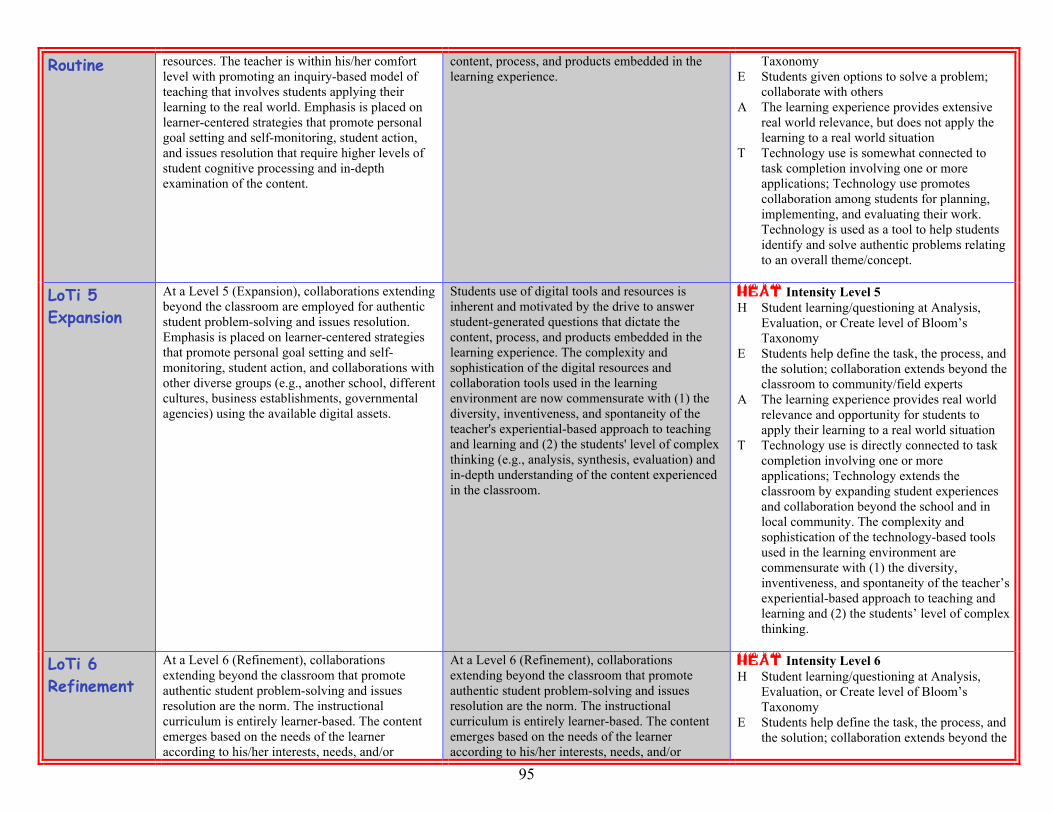
Routine resources. The teacher is within his/her comfort level with promoting an inquiry-based model of teaching that involves students applying their learning to the real world. Emphasis is placed on learner-centered strategies that promote personal goal setting and self-monitoring, student action, and issues resolution that require higher levels of student cognitive processing and in-depth examination of the content.
content, process, and products embedded in the learning experience.
Taxonomy E Students given options to solve a problem;
collaborate with others A The learning experience provides extensive
real world relevance, but does not apply the learning to a real world situation
T Technology use is somewhat connected to task completion involving one or more applications; Technology use promotes collaboration among students for planning, implementing, and evaluating their work. Technology is used as a tool to help students identify and solve authentic problems relating to an overall theme/concept.
LoTi 5 Expansion
At a Level 5 (Expansion), collaborations extending beyond the classroom are employed for authentic student problem-solving and issues resolution. Emphasis is placed on learner-centered strategies that promote personal goal setting and self-monitoring, student action, and collaborations with other diverse groups (e.g., another school, different cultures, business establishments, governmental agencies) using the available digital assets.
Students use of digital tools and resources is inherent and motivated by the drive to answer student-generated questions that dictate the content, process, and products embedded in the learning experience. The complexity and sophistication of the digital resources and collaboration tools used in the learning environment are now commensurate with (1) the diversity, inventiveness, and spontaneity of the teacher's experiential-based approach to teaching and learning and (2) the students' level of complex thinking (e.g., analysis, synthesis, evaluation) and in-depth understanding of the content experienced in the classroom.
HEAT Intensity Level 5 H Student learning/questioning at Analysis,
Evaluation, or Create level of Bloom’s Taxonomy
E Students help define the task, the process, and the solution; collaboration extends beyond the classroom to community/field experts
A The learning experience provides real world relevance and opportunity for students to apply their learning to a real world situation
T Technology use is directly connected to task completion involving one or more applications; Technology extends the classroom by expanding student experiences and collaboration beyond the school and in local community. The complexity and sophistication of the technology-based tools used in the learning environment are commensurate with (1) the diversity, inventiveness, and spontaneity of the teacher’s experiential-based approach to teaching and learning and (2) the students’ level of complex thinking.
LoTi 6 Refinement
At a Level 6 (Refinement), collaborations extending beyond the classroom that promote authentic student problem-solving and issues resolution are the norm. The instructional curriculum is entirely learner-based. The content emerges based on the needs of the learner according to his/her interests, needs, and/or
At a Level 6 (Refinement), collaborations extending beyond the classroom that promote authentic student problem-solving and issues resolution are the norm. The instructional curriculum is entirely learner-based. The content emerges based on the needs of the learner according to his/her interests, needs, and/or
HEAT Intensity Level 6 H Student learning/questioning at Analysis,
Evaluation, or Create level of Bloom’s Taxonomy
E Students help define the task, the process, and the solution; collaboration extends beyond the
95

aspirations and is supported by unlimited access to the most current digital applications and infrastructure available. The content and authenticity have more of a global emphasis.
aspirations and is supported by unlimited access to the most current digital applications and infrastructure available.
classroom to community/field experts; student problem-solving and issues resolution are the norm
A The learning experience is directly relevant to students and involves creating a product that has a purpose beyond the classroom that directly impacts the students and an authentic situation. Learning has a global emphasis.
T Technology use is directly connected and needed for task completion and students determine which application(s) would best address their needs; Technology is a seamless tool used by students through their own initiative to find solutions related to an identified “real-world” problem or issue of significance to them. Technology provides a seamless medium for information queries, problem-solving, and/or product development.
*LoTi Framework developed by Dr. Chris Moersch, revised by Dr. Marge Maxwell
96
H.E.A.T. Framework
H.E.A.T. stands for Higher-order thinking, Engaged
learning, Authentic learning, and Technology use. The H.E.A.T. Framework measures the
integration of these four factors in classroom instruction.
H.E.A.T. Intensity Level 1
o H - Students taking notes only; no questions asked
o E - Students report what they have learned only
o A - The learning experience is missing or too vague to determine relevance
o T - No technology use is evident
H.E.A.T. Intensity Level 2
o H - Student learning/questioning at knowledge level
o E - Students report what they have learned only; collaborate with others
o A - The learning experience represents a group of connected activities, but
provides no real world application
o T - Technology use is unrelated to the task
H.E.A.T. Intensity Level 3
o H - Student learning/questioning at comprehension level
o E - Students given options to solve a problem
o A - The learning experience provides limited real world relevance, but does not
apply the learning to a real world situation
o T - Technology use appears to be an add-on and is not needed for task completion
H.E.A.T. Intensity Level 4
o H - Student learning/questioning at application level
o E - Students given options to solve a problem; collaborate with others
o A - The learning experience provides extensive real world relevance, but does not
apply the learning to a real world situation
o T - Technology use is somewhat connected to task completion involving one or
more applications
H.E.A.T. Intensity Level 5
o H - Student learning/questioning at analysis level
o E - Students help define the task, the process, and the solution
o A - The learning experience provides real world relevance and opportunity for
students to apply their learning to a real world situation
o T - Technology use is directly connected to task completion involving one or
more applications
H.E.A.T. Intensity Level 6
o H - Student learning/questioning at synthesis/evaluation levels
o E - Students help define the task, the process, and the solution; collaboration
extends beyond the classroom
97
o A - The learning experience is directly relevant to students and involves creating a
product that has a purpose beyond the classroom that directly impacts the students
o T - Technology use is directly connected and needed for task completion and
students determine which application(s) would best address their needs
98

Current Instructional Practices (CIP)
Framework
The Current Instructional Practices (CIP) Framework measures
classroom teachers' current instructional practices relating to a subject-matter versus a learner-
based instructional approach in the classroom. As one moves to a higher CIP Intensity Level,
less emphasis is placed on didactic instruction, sequential and uniform learning activities, and
traditional forms of assessment. In its place, teachers begin to embrace instructional strategies
aligned with student-directed learning, varied assessment strategies, authentic problem-solving
opportunities, differentiated instruction, and complex classroom routines (e.g., students
generating and testing hypotheses, implementing cooperative learning, students identifying
similarities and differences).
Intensity Level 0 (Not True of Me Now)
A CIP Intensity Level 0 indicates that the participant is not involved in a formal
classroom setting (e.g., pull-out program).
Intensity Level 1 (Not True of Me Now)
At a CIP Intensity Level 1, the participant’s current instructional practices align
exclusively with a subject-matter based approach to teaching and learning. Teaching
strategies tend to lean toward lectures and/or teacher-led presentations. The use of
curriculum materials aligned to specific content standards serves as the focus for student
learning. Learning activities tend to be sequential and uniform for all students. Evaluation
techniques focus on traditional measures such as essays, quizzes, short-answers, or true-
false questions, but no effort is made to use the results of the assessments to guide
instruction.
Student projects tend to be teacher-directed in terms of identifying project outcomes as
well as requirements for project completion. No effort is made to differentiate instruction.
The use of research-based best practices focuses on basic classroom routines (e.g.,
providing homework and practice, setting objectives and providing feedback, students
summarizing and note taking, providing adequate wait time).
Intensity Level 2 (Not True of Me Now)
At a CIP Intensity Level 2, the participant supports instructional practices consistent with
a subject-matter based approach to teaching and learning, but not at the same level of
intensity or commitment as a CIP Intensity Level 1. Teaching strategies tend to lean
toward lectures and/or teacher-led presentations. The use of curriculum materials aligned
to specific content standards serves as the focus for student learning. Learning activities
99

tend to be sequential and uniform for all students. Evaluation techniques focus on
traditional measures such as essays, quizzes, short-answers, or true-false questions with
the resulting data used to guide instruction.
Student projects tend to be teacher-directed in terms of identifying project outcomes as
well as requirements for project completion. No effort is made to differentiate instruction.
The use of research-based best practices focuses on basic classroom routines (e.g.,
providing homework and practice, setting objectives and providing feedback, students
summarizing and note taking, providing adequate wait time).
Intensity Level 3 (Somewhat True of Me Now)
At a CIP Intensity Level 3, the participant supports instructional practices aligned
somewhat with a subject-matter based approach to teaching and learning—an approach
characterized by sequential and uniform learning activities for all students, teacher-
directed presentations, and/or the use of traditional evaluation techniques. However, the
participant may also support the use of student-directed projects that provide
opportunities for students to determine the "look and feel" of a final product based on
their modality strengths, learning styles, or interests.
Evaluation techniques continue to focus on traditional measures with the resulting data
serving as the basis for curriculum decision-making. The use of research-based best
practices expands beyond basic classroom routines (e.g., providing opportunities for non-
linguistic representation, offering advanced organizers).
Intensity Level 4 (Somewhat True of Me Now)
At a CIP Intensity Level 4, the participant may feel comfortable supporting or
implementing either a subject-matter or learning-based approach to instruction based on
the content being addressed. In a subject-matter based approach, learning activities tend
to be sequential, student projects tend to be uniform for all students, the use of lectures
and/or teacher-directed presentations are the norm as well as traditional evaluation
strategies. In a learner-based approach, learning activities are diversified and based
mostly on student questions, the teacher serves more as a co-learner or facilitator in the
classroom, student projects are primarily student-directed, and the use of alternative
assessment strategies including performance-based assessments, peer reviews, and
student reflections are the norm.
Although traditional learning activities and evaluation techniques are used, students are
also encouraged to contribute to the assessment process when appropriate to the content
being addressed. The amount of differentiation is moderate based on the readiness level,
interests, and learning styles of the students. The use of research-based best practices
expands beyond basic classroom routines (e.g., providing opportunities for non-linguistic
representation, offering advanced organizers).
Intensity Level 5 (Somewhat True of Me Now)
At a CIP Intensity Level 5, the participant’s instructional practices tend to lean more
toward a learner-based approach. The essential content embedded in the standards
emerges based on students “need to know” as they attempt to research and solve issues of
100

importance to them using critical thinking and problem-solving skills. The types of
learning activities and teaching strategies used in the learning environment are diversified
and driven by student questions. Both students and teachers are involved in devising
appropriate assessment instruments (e.g., performance-based, journals, peer reviews, self-
reflections) by which student performance will be assessed.
Although student-directed learning activities and evaluations are the norm, the use of
teacher-directed activities (e.g., lectures, presentations, teacher-directed projects) may
surface based on the nature of the content being addressed and at the desired level of
student cognition. The amount of differentiation is substantial based on the readiness
level, interests, and learning styles of the students. The use of research-based best
practices delves deeper into complex classroom routines (e.g., students generating and
testing hypotheses, implementing cooperative learning, students identifying similarities
and differences).
Intensity Level 6 (Very True of Me Now)
The participant at a CIP Intensity Level 6 supports instructional practices consistent with
a learner-based approach, but not at the same level of intensity or commitment as a CIP
Intensity Level 7. The essential content embedded in the standards emerges based on
students “need to know” as they attempt to research and solve issues of importance to
them using critical thinking and problem-solving skills. The types of learning activities
and teaching strategies used in the learning environment are diversified and driven by
student questions.
Students, teacher/facilitators, and occasionally parents are all involved in devising
appropriate assessment instruments (e.g., performance-based, journals, peer reviews, self-
reflections) by which student performance will be assessed. The amount of differentiation
is substantial based on the readiness level, interests, and learning styles of the students.
The use of research-based best practices delves deeper into complex classroom routines
(e.g., students generating and testing hypotheses, implementing cooperative learning,
students identifying similarities and differences).
Intensity Level 7 (Very True of Me Now)
At a CIP Intensity Level 7, the participant’s current instructional practices align
exclusively with a learner-based approach to teaching and learning. The essential content
embedded in the standards emerges based on students “need to know” as they attempt to
research and solve issues of importance to them using critical thinking and problem-
solving skills. The types of learning activities and teaching strategies used in the learning
environment are diversified and driven by student questions.
Students, teacher/facilitators, and occasionally parents are all involved in devising
appropriate assessment instruments (e.g., performance-based, journals, peer reviews, self-
reflections) by which student performance will be assessed. The amount of differentiation
is seamless since students completely guide the pace and level of their learning. The use
of research-based best practices delves deeper into complex classroom routines (e.g.,
students generating and testing hypotheses, implementing cooperative learning, students
identifying similarities and differences).
101

Personal Computer Use (PCU) Framework
The Personal Computer Use (PCU) Framework measures classroom
teachers' fluency level with using digital tools and resources for student learning. As one moves
to a higher PCU Intensity Level, the depth and breadth of current and emerging digital tool use
(e.g., multimedia, productivity, desktop publishing, web-based applications) in the classroom
increases proportionally as does the teacher's advocacy and commitment level for their use. At
the highest PCU Intensity Levels, teachers assume leadership roles that transcend the everyday
use of digital tools and resources toward a level of advocacy for effective technology use in their
classroom, school building, and the larger global community.
Intensity Level 0 (Not True of Me Now)
A PCU Intensity Level 0 indicates that the participant does not possess the inclination or
skill level to use digital tools and resources for either personal or professional use.
Participants at Intensity Level 0 exhibit a general disinterest toward emerging
technologies relying more on traditional devices (e.g., use of overhead projectors,
chalkboards, paper/pencil activities) than using digital resources for conveying
information or classroom management tasks.
Intensity Level 1 (Not True of Me Now)
A PCU Intensity Level 1 indicates that the participant demonstrates little fluency with
using digital tools and resources for student learning. Participants at Intensity Level 1
may have a general awareness of various digital tools and media including word
processors, spreadsheets, or the internet, but generally are not using them. Participants at
this level are generally unaware of copyright issues or current research on the impact of
existing and emerging digital tools and resources on student learning.
Intensity Level 2 (Not True of Me Now)
A PCU Intensity Level 2 indicates that the participant demonstrates little to moderate
fluency with using digital tools and resources for student learning. Participants at
Intensity Level 2 may occasionally browse the internet, use email, or use a word
processor program; yet, may not have the confidence or feel comfortable using existing
and emerging digital tools beyond classroom management tasks (e.g., grade book,
attendance program). Participants at this level are somewhat aware of copyright issues
and maintain a cursory understanding of the impact of existing and emerging digital tools
and resources on student learning.
Intensity Level 3 (Somewhat True of Me Now)
A PCU Intensity Level 3 indicates that the participant demonstrates moderate fluency
with using digital tools and resources for student learning. Participants at Intensity Level
102

3 may begin to become “regular” users of selected digital-age media and formats (e.g.,
internet, email, word processor, multimedia) to (1) communicate with students, parents,
and peers and (2) model their use in the classroom in support of research and learning.
Participants at this level are aware of copyright issues and maintain a moderate
understanding of the impact of existing and emerging digital tools and resources on
student learning.
Intensity Level 4 (Somewhat True of Me Now)
A PCU Intensity Level 4 indicates that the participant demonstrates moderate to high
fluency with using digital tools and resources for student learning. Participants at
Intensity Level 4 commonly use a broader range of digital-age media and formats in
support of their curriculum and instructional strategies. Participants at this level model
the safe, legal, and ethical uses of digital information and technologies and participate in
local discussion forums that advocate the positive impact of existing digital tools and
resources on student success in the classroom.
Intensity Level 5 (Somewhat True of Me Now)
A PCU Intensity Level 5 indicates that the participant demonstrates a high fluency level
with using digital tools and resources for student learning. Participants at Intensity Level
5 are commonly able to use an expanded range of existing and emerging digital-age
media and formats in support of their curriculum and instructional strategies. Participants
at this level advocate the safe, legal, and ethical uses of digital information and
technologies and participate in local and global learning that advocate the positive impact
of existing digital tools and resources on student success in the classroom.
Intensity Level 6 (Very True of Me Now)
A PCU Intensity Level 6 indicates that the participant demonstrates high to extremely
high fluency level with using digital tools and resources for student learning. Participants
at Intensity Level 6 are sophisticated in the use of most, if not all, existing and emerging
digital-age media and formats (e.g., multimedia, productivity, desktop publishing, web-
based applications). They begin to take on a leadership role as advocates for technology
infusion as well as the safe, legal, and ethical uses of digital resources in the schools.
Participants at this level continually reflect on the latest research discussing the impact of
digital tools on student success.
Intensity Level 7 (Very True of Me Now)
A PCU Intensity Level 7 indicates that the participant possesses an extremely high
fluency level with using digital tools and resources for student learning. Participants at
Intensity Level 7 are sophisticated in the use of any existing and emerging digital-age
media and formats (e.g., multimedia, productivity, desktop publishing, web-based
applications). Participants at this level set the vision for technology infusion based on the
latest research and continually seek creative uses of digital tools and resources that
impact learning. They actively participate in global learning communities that seek
creative uses of digital tools and resources in the classroom.
103

FW: IRB 11-005 A Structural Validity and Item Functioning Study of the LoTi Digital-Age Survey
InboxX
Reply |Hull, Darrell to me
show details Jan 4
Keep this e-mail. You have the green light to proceed to defense as far as IRB is concerned.
From: Harmon, Jordan
Sent: Tuesday, January 04, 2011 4:21 PM
To: Hull, Darrell
Subject: IRB 11-005 A Structural Validity and Item Functioning Study of the LoTi Digital-Age Survey
Importance: High
Dr. Hull,
The UNT Institutional Review Board has jurisdiction to review proposed “research” with “human
subjects” as those terms are defined in the federal IRB regulations. The phrase “human subjects” is
defined as follows:
“A living individual about whom an investigator (whether professional or student) conducting research
obtains (1) Data through intervention or interaction with the individual, or (2) Identifiable private
information.
Since the data you will be obtaining from LoTi Connection Inc. has been totally de-identified, then your
use of that data falls outside the scope of the “human subjects” definition and UNT IRB review and
approval is not required.
We appreciate your efforts, however, to comply with the federal regulations and sincerely thank you for
your IRB application submission!
104

Thank You,
Jordan Harmon
Research Compliance Analyst
Office of Research Integrity and Compliance
Hurley Administration Building 160P
University of North Texas
P: 940-565-4258 F: 940-565-4277
105

COMPREHENSIVE REFERENCE LIST
Adams, N. B. (2003). Educational computing concerns of postsecondary faculty. Journal of
Research on Technology in Education, 34, 285-304.
Albright, J.J. & Park, H.M. (2009). Confirmatory Factor Analysis Using Amos, LISREL, Mplus,
and SAS/STAT CALIS. Working Paper. Retrieved from Indiana University, Center for
Statistical and Mathematical Computing website:
http://www.indiana.edu/~statmath/stat/all/cfa/cfa.pdf
American Psychological Association (2009). Publication manual of the American Psychological
Association (6th ed.). Washington, DC: Author.
Anderson, L. W. and Krathwohl, D. R. (2001). A taxonomy for learning,
teaching, and assessing: A revision of Bloom's taxonomy of educational objectives.
Boston, MA: Allyn & Bacon.
Andrich, D. (1978a). Application of a psychometric model to ordered categories which are
scored with successive integers. Applied Psychological Measurement, 2, 581-594.
Andrich, D. (1978b). A rating formulation for ordered response categories. Psychometrika, 43,
561-573.
Arbuckle, J. L. (2006). Amos (Version 7.0) [Computer Program]. Chicago: SPSS.
Atkins, N. E., & Vasu, E. S. (2000). Measuring knowledge of technology usage and stages of
concern about computing: A study of middle school teachers. Journal of Technology and
Teacher Education, 8, 279-302.
Barron, A. E., Kember, K., Harmes, C. & Kalaydjian, K. (2003). Large-scale research study on
technology in K-12 Schools: Technology integration as it relates to the national
technology standards. Journal of Research on Technology in Education, 35, 489-507.
106

Bashara, D.M. (2008). The relationship between teacher levels of technology integration (LoTi)
on 3rd
– 5th
grade students on the Texas Assessment of Knowledge and Skills (TAKS)
scores at Alamo Heights Independent School District, San Antonio, Texas. (Doctoral
dissertation). Retrieved from http://repository.tamu.edu/handle/1969.1/86020
Beaujean, A.A., Hull, D.M. & Sheng, Y. (2008, May). Item response theory. Paper presented
at the Item Response Theory Workshop at University of North Texas, Denton, TX.
Bernstein, I. H., & Teng, G. (1989). Factoring items and factoring scales are different: Evidence
for multidimensionality due to item categorization. Psychological Bulletin, 105, 465-477.
Bloom B. S. (1956). Taxonomy of Educational Objectives, Handbook I: The Cognitive Domain.
New York, NY: David McKay.
Bock, R.D. (1972). Estimating item parameters and latent ability when responses are scored in
two or more nominal categories. Psychometrika, 37, 29-51.
Brown, T.A. (2006). Confirmatory factor analysis for applied research. New York, NY:
Guilford Press.
Brown, M.W., & Cudeck, R. (1983). Alternating ways of assessing model fit. In. K. A. Bollen &
J.S. Long (Eds.), Testing structural equation models (pp. 445-455). Newbury Park, CA:
Sage.
Buja, A., & Eyuboglu, N. (1992). Remarks on parallel analysis. Multivariate Behavioral
Research, 27, 509-540.
Cattell, R.B. (1966). The scree test for the number of factors. Multivariate Behavioral Research,
1, 245-276.
Chapman, A. (2009). Bloom’s taxonomy – Learning domains. Retrieved from
http://www.businessballs.com/bloomstaxonomyoflearningdomains.htm
107
Child, D. (1990). The essentials of factor analysis (2nd ed.). London, England: Cassel
Educational Limited.
Clark, D. R. (2009). Bloom’s taxonomy of learning domains. Retrieved from
http://www.nwlink.com/~Donclark/hrd/bloom.html
Chen, W.H., & Thissen, D. (1997). Local dependence indices for items pairs using item response
theory. Journal of Educational and Behavioral Statistics, 22, 265-289.
Cohen, A.S., Kim, S., & Baker, F.B. (1993). Detection of differential item functioning in the
graded response model. Applied Psychological Measurement, 17, 335-350.
Cook, B. (n.d.). Putting the pieces together. Retrieved from
www.grrec.ky.gov/Events_Followup/becky_cook.ppt
Crites, C. (2008). Depth of knowledge (DOK) information. Retrieved from
http://www.ecarter.k12.mo.us/dept/curriculum/dok.html
Crocker, L., & Algina, J. (1986). Introduction to classical and modern test theory. New York,
NY: Harcourt Brace Jovanovich.
Dave, R. H. (1975). Developing and writing behavioral objectives. (R. J. Armstrong, Ed.).
Tucson, AZ: Educational Innovators Press.
DeCoster, J. (1998). Overview of Factor Analysis. Retrieved from http://www.stat-help.com/
factor.pdf
Dragsow, F., Levine, M.V., & Williams, E.A. (1985). Appropriateness measurement with
polychotomous item response models and standardized indices. British Journal of
Mathematical and Statistical Psychology, 38, 67-86.
Dwyer, D. C., Ringstaff, C., & Sandholtz, J. H. (1990). Teacher beliefs and
practices part II: Support for change (Apple Classrooms of Tomorrow Research
108

Report 9). Cupertino, CA: Apple Computer. Retrieved from
www.apple.com/education/k12/leadership/acot/library.html.
Dwyer, D. C., Ringstaff, C., & Sandholtz, J. H. (1991). Changes in teachers’ beliefs and
practices in technology-rich classrooms. Educational Leadership, 48(8), 45–52.
Dwyer, D.C., Ringstaff, C., & Sandholtz, J.H. (1992). The evolution of teachers' instructional
beliefs and practices in high-access-to-technology classrooms first-fourth year findings.
Cupertino, CA: Apple Computer. Retrieved
http://www.apple.com/education/k12/leadership/acot/library.html
Eaton, C. A., Velicer, W. F., & Fava, J. L. (1999). Determining the number of components: An
evaluation of parallel analysis and the minimum average partial correlation procedures.
Unpublished manuscript.
Embretson. S.E. & Reise, S.P. (2000). Item response theory for psychologists. Mahwah, New
Jersey: Lawrence Erlbaum.
Forehand, M. (2005). Bloom's taxonomy: Original and revised. In M. Orey (Ed.), Emerging
perspectives on learning, teaching, and technology. Retrieved from
http://projects.coe.uga.edu/epltt/
Fuller, F. F. (1969). Concerns of teachers: A developmental conceptualization. American
Educational Research Journal, 6, 207-226.
Gall, M.D., Gall, J.P., & Borg, W.R. (2003). Educational research: An introduction (7th ed.).
Boston, MA: Allyn & Bacon.
Garson, G.D. (2010). Factor Analysis. Retrieved from
http://faculty.chass.ncsu.edu/garson/PA765/factor.htm
Geweke, J.F., & Singleton, K.I. (1980). Interpreting the likelihood ratio statistics in factor
109
models when sample size is small. Journal of the American Statistical Association, 75,
133-137.
Gorsuch, L.R. (1983). Factor analysis (2nd ed.). Hillsdale, NJ: Erlbaum.
Grant, C. M. (1996). Professional development in the technological age: New definitions, old
challenges, new resources. Retrieved from
http://ra.terc.edu/publications/TERC_pubs/techinfusion/prof_dev/prof_dev_frame.html
Griffin, D. (2003). Educators’ technology level of use and methods for learning technology
integration. (Doctoral dissertation). Retrieved from
http://www.library.unt.edu/theses/open/20032/griffin_darlene/dissertation.pdf
Guhlin, M. (2009). LOTI and rigor and relevance framework. Retrieved from
http://www.mguhlin.org/2009/06/loti-and-rigor-and-relevance.html
Guttman, L. (1954). Some necessary conditions for common factor analysis. Psychometrika, 30,
179-185.
Hall, G. E. & Hord, S. M. (1987). Change in schools: Facilitating the process. Albany, NY:
State University of New York Press.
Hall, G.E. & Hord, S.M. (2001). Implementing change: Patterns, principles, and potholes.
Boston, MA: Allyn & Bacon.
Hall, G., and S. Loucks. (1977). A developmental model for determining whether the treatment
is actually implemented. American Educational Research Association Journal, 14, 263–
276.
Hall, G. E., Loucks, S. F., Rutherford, W. L., & Newlove, B. W. (1975). Levels of use of the
innovation: a framework for analyzing innovation adoption. Journal of Teacher
Education, 26(1), 52–56.
110

Hambleton, R.K., & Jones, R.W. (1993). An NCME instructional module on classical test theory
and item response theory and their applications to test development. Education
Measurement: Issues and Practice, 12(3), 38-47.
Hambleton, R. K., Swaminathan, H., & Rogers, H. J. (1991). Fundamentals of item
response theory. Newbury Park, CA: Sage.
Harnisch, D. L. (1983). Item response patterns: Applications for educational practice. Journal of
Educational Measurement, 20, 191-206.
Harrington, D. (2008). Confirmatory factor analysis. New York, NY: Oxford University Press.
Harrow, A.J. (1972). A taxonomy of the psychomotor domain. New York, NY: David McKay.
Hayton, J.C., Allen, D. G. & Scarpello, V. (2004). Factor Retention Decisions in Exploratory
Factor Analysis: a Tutorial on Parallel Analysis. Organizational Research Methods, 7,
191-205.
Hope, W. C. (1997). Resolving teachers’ concerns about microcomputer technology. Computers
in the Schools, 13(3/4), 147-160.
Hu, L. & Bentler, P.M. (1998). Fit indices in covariance structure modeling: Sensitivity to
underparameterized model misspecification. Psychological Methods, 3, 424-453.
Hu, L. & Bentler, P.M. (1999). Cutoff criteria for fit indexes in covariance structure modeling:
Conventional criteria versus new alternatives. Structural Equation Modeling, 6, 1-55.
Hull, D. (2010). Notes for a lecture on Item Response Theory. University of North Texas,
Denton, TX.
International Center for Leadership. (2008). Rigor/Relevance Framework. Retrieved
from http://www.leadered.com/rrr.html
International Society for Technology in Education. (2007). National Educational Technology
111

Standards – Student. Retrieved from
http://www.iste.org/standards/nets-for-students/nets-student-standards-2007.aspx
International Society for Technology in Education. (2008). National Educational Technology
Standards – Teacher. Retrieved from
http://www.iste.org/standards/nets-for-teachers.aspx
International Society for Technology in Education. (2009). National Educational Technology
Standards – Administrators. Retrieved from
http://www.iste.org/standards/nets-for-administrators.aspx
International Society for Technology in Education. (2010). Retrieved from
http://www.iste.org
Jöreskog, K.G. (1969). A general approach to confirmatory factor analysis. Psychometrika, 34,
183-202.
Jöreskog, K.G. & Sörbom, D. (2006). LISREL 8.8 for Windows [Computer software].
Lincolnwood, IL: Scientific Software International.
Kim, S.H., & Cohen, A.S. (1991). A comparison of two area measures for detecting differential
item functioning. Applied Psychological Measurement, 15, 269-278.
Kline, P. (1983). An easy guide to factor analysis. New York, NY: Routledge.
Krathwohl, D. R., Bloom, B. S., & Masia, B. B. (1973). Taxonomy of educational objectives,
the classification of educational goals. Handbook II: Affective domain. New York, NY:
David McKay.
Larson, L.L. (2003). A descriptive study of technology integration and faculty professional
development in one higher education institution. Dissertation Abstracts International-A,
64(1), 118.
112

Levine, M.V., & Rubin, D.B. (1979). Measuring appropriateness of multiple-choice test scores.
Journal of Educational Statistics, 4, 269-290.
Liu, O.L. (2009). Evaluation of learning strategies scale for middle school students. Journal of
Psychoeducational Assessment, 27, 312-322.
Loehlin, J.C. (2004). Latent variable models: An introduction to factor, paths, and
structural equation analysis (4th ed.) Mahwah, NJ: Erlbaum.
Lord, F. (1980). Applications of item response theory to practical testing problems. Hillsdale,
NJ: Lawrence Erlbaum.
Lord, F. M., & Novick, M. R. (1968). Statistical theories of mental test scores. Reading, MA:
Addison-Wesley.
LoTi Connection. (2009). LoTi (Levels of Technology Innovation). Retrieved from
http://www.loticonnection.com
LoTi Connection. (n.d.).DETAILS quick scoring device to create DETAILS graph.
LoTi Connection. (n.d.). LoTi Digital-Age quick scoring device to create LoTi Digital-Age
professional development priorities graph.
Lyon, A.R. (2009). Confirmatory factor analysis of the School Refusal Assessment Scale-
Revised in an African American community sample. Journal of Psychoeducational
Assessment, 28, 511-523.
National Research Council. (2002). Scientific research in education. In R. J. Shavelson & L.
Towne (Eds.), Committee on scientific principles for educational research. Washington,
DC: National Academy Press.
McBride, O. (n.d.). Differential item functioning (DIF) on the IPIP neuroticism scale.
Retrieved from harvey.psyc.vt.edu/Documents/McBride.Harvey.handout.pdf
113

McDonald, R.P. (1978). A simple comprehensive model for the analysis of covariance
structures. British Journal of Mathematical and Statistical Psychology, 37, 234-251.
Marcinkiewicz, H. R. & Welliver, P. W. (1993). Procedures for assessing teachers' computer use
based on instructional transformations. (pp. 7). New Orleans, LA: 15th National Convention
of the Association of Educational Communications and Technology.
Martin, J. B. (1989). Measuring the stages of concern in the development of computing
Expertise (Unpublished doctoral dissertation). University of Florida, Gainesville, FL.
Marzano, R.J. (1998). A theory-based meta-analysis of research on instruction. Aurora, CO:
Midcontinent Research for Education and Learning.
Marzano, R.J., Gaddy, B.B., & Dean, C. (2000). What works in classroom instruction? Aurora,
CO: Midcontinent Research for Education and Learning.
Marzano, R.J., Pickering, D.J., & Pollock, J.E. (2001). Classroom instruction that works:
Research-based strategies for increasing student achievement. Alexandria, VA:
Association for Supervision and Curriculum Development.
Marzano, R.J. (2003). What works in schools: Translating research into action. Alexandria, VA:
Association for Supervision and Curriculum Development.
Masters, G.N. (1982). A Rasch model for partial credit scoring, Psychometrika, 47, 149-174.
Meijer, R.R. (1994). The number of Guttman errors as simple and powerful person-fit statistic.
Applied Psychological Measurement, 18, 311-314.
Miller, S. (2008). Putting the pieces together: Integrating technology with Marzano’s
instructional strategies. Retrieved from http://gets.gc.k12.va.us/VSTE/2008/
Mills, S. C. (2002). The technology implementation standards configuration matrix: A tool for
114

analyzing technology integration. National Forum of Applied Educational Research
Journal, 14(2). Retrieved from the University of Kansas website:
http://media.lsi.ku.edu/research/NFAERJTechImp.html
Mills, S. C., & Tincher, R. C. (2003). Be the technology: A developmental model for evaluating
technology integration. Journal of Research on Technology in Education, 35(3).
Retrieved from the University of Kansas website:
http://media.lsi.ku.edu/research/JRTEBetheTechFinal.pdf
Morales, L.S. (2004). Assessing item and scale differential functioning using the DFIT
methodology. Retrieved from outcomes.cancer.gov/conference/irt/morales.pdf
Moersch, C. (1995a). Levels of technology iImplementation (LoTi): A framework for
measuring classroom technology use. Retrieved from
http://loticonnection.com/research.html
Moersch, C. (1995b). Levels of technology implementation (LoTi): A framework for measuring
classroom technology use [Supplement material]. Learning and Leading with
Technology, 23(4), 40-42. Retrieved from
http://www.iste.org/inhouse/publications/ll/26/8/40m/supplement/index.cfm?Section =
LL_23_3
Moersch, C. (1997). Computer efficiency: Measuring the instructional use of
technology. Learning and leading with Technology, 24, 52-56.
Moersch, C. (1998). Enhancing students’ thinking skills. Learning and leading with
technology, 25(6), 50-53.
Moersch, C. (1999). Assessing current technology use in the classroom: A key to
115

efficient staff development and technology planning. Learning and leading with
technology, 26(8), 40-49.
Moersch, C. (2001). Next steps: Using LoTi as a research tool. Learning and leading with
technology, 29(3), 22-27.
Moersch, C. (2002). Measurers of success: Six instruments to assess teachers’ use of
technology. Learning and leading with technology, 30(3), 10-13.
Moersch, C. (2009). Bring the H.E.A.T. to LoTi. Retrieved from
http://lotiguyspeaks.blogspot.com/2009/03/bringing-heat-to-loti.html
Moersch, C. (2009). Building-level leadership: The Key to A Successful LoTi Digital-Age
School. Retrieved from
http://lotiguyspeaks.blogspot.com/2009/09/building-level-leadership-key-to.html
Moersch, C. (n.d.). Turn up the H.E.A.T in your 21st century classroom [Video file]. Retrieved
from http://www.edublogs.tv/play.php?vid=1411
Molenaar, I. W., & Hoijtink, H. (1990). The many null distributions of person fit indices.
Psychometrika, 55, 75-106.
Molenaar, I. W., & Hoijtink, H. (1996). Person-fit and the Rasch model, with an application to
knowledge of logical quantors. Applied Measurement in Education, 9, 27-45.
Moses, R.R. (2006). Factors related to technology implementation of K-12 principals and
teachers (Doctoral dissertation). Retrieved from
http://digital.library.unt.edu/ark:/67531/metadc5355/
Muthén, L.K. and Muthén, B.O. (2010). Mplus [Computer program]. Los Angeles, CA: Muthén & Muthén. Muraki, E. (1990). Fitting a polytomous item response model to Likert-type data. Applied
116
Psychological Measurement, 14, 59-71.
Muraki, E. (1992). A generalized partial credit model: Application of an EM algorithm. Applied
Psychological Measurement, 16, 159-176.
Muthén, B. O., & Kaplan, D. (1992). A comparison of some methodologies for the factor
analysis of non-normal Likert variables. British Journal of Mathematical and Statistical
Psychology, 38, 171-189.
Newhouse, C.P. (2001). Applying the concerns-based adoption model to research on
computers in classrooms. Retrieved from
http://www.iste.org/Content/NavigationMenu/Publications/JRTE/Issues/Volume_331/Nu
mber_5_Summer_2001/Applying_the_Concerns-
Based_Adoption_Model_to_Research_on_Computers_in_Classrooms_Part_I.htm
Newsom. (2010). Missing data and missing data estimation. Retrieved from
http://www.upa.pdx.edu/IOA/newsom/semclass/ho_missing.pdf
No Child Left Behind Act of 2001, 20 U.S.C. §1419 (2002).
Oades-Sese, G., Kaliski, P.K., & Weiss, K. (2010). Factor structure of the Devereux early
childhood assessment clinical form in low-income Hispanic American bilingual
preschool children. Journal of Psychoeducational Assessment, 28(4), 357-372.
Oshima, T.C. & Morris, S.B. (2008). Raju’s differential functioning of items and tests (DFIT).
Educational Measurement: Issues and Practice, 27(3), 43-50.
Oshima. T.C., Raju, N.S., & Nanda, A.O. (2006). A new method for assessing the statistical
significance in differential functioning of items and tests (DFIT) framework. Journal of
Educational Measurement, 14, 197-207.
Office of Technology Assessment. (1995). Teachers and technology: Making the
117
connection (Report No. OTA-HER-616) Washington, DC: US Government printing
office.
Partnership for 21st century skills. (n.d.). The framework for 21st century. Retrieved from
http://www.p21.org/index.php
Parton, B.S. (2006). Technology adoption and integration levels: A comparison study between
technology-minded general educators and technology-minded deaf educators (Doctoral
dissertation, University of North Texas). Retrieved from
http://loticonnection.com/dissertations.html
Peugh, J.L. & Enders, C.K. (2004). Missing data in educational research: A review of
reporting practices and suggestions for improvement. Review of Educational Research,
74, 525-556.
Pohl, M. (2000). Learning to think, thinking to learn: Models and strategies to develop a
classroom culture of thinking. Cheltenham, Victoria: Hawker Brownlow Education.
Raju, N.S. (1988). The area between two characteristic curves. Psychometrika, 53, 495-502.
Raju, N.S. (1990). Determining the significance of estimated signed and unsigned areas between
two item response functions. Applied Psychological Measurement, 14, 197-207,
Raju, N.S., van der Linden, W.J., & Fleer, P.F. (1995). An IRT-based internal measure of test
bias with applications for differential item functioning. Applied Psychological
Measurement, 19, 353-368.
Raju, N.S., Oshima, T.C., & Wolach, A. (2005). Differential functioning of items and tests
(DFIT): Dichotomous and polytomous [Computer program]. Chicago: Illinois Institute of
Technology.
Raju, N.S., Fortmann-Johnson, K.A., Kim, W., Morris, S.B., Nering, M.L., & Oshima, T.C.
118
(2009). The Item Parameter Replication Method for Detecting Differential Functioning in
the Polytomous DFIT Framework. Applied Psychological Measurement, 33(2), 133-147.
Rakes, G. C., Fields, V.S. & Cox, K.E. (2006). The influence of teachers’ technology
use on instructional practices. Journal of Research on Technology in Education,
38, 409–424.
Reise, S.P. (1995). Scoring method and the detection of response aberrancy in a personality
assessment context. Applied Psychological Measurement, 19, 213-229.
Reise. S.P., & Waller, N.G. (1993). Traitedness and the assessment of response patterns
scalability. Journal of Personality and Social Psychology, 65, 143-151.
Reise, S.P., Widaman, K.F., & Pugh, R.H. (1993). Confirmatory factor analysis and item
response theory: Two approaches for exploring measurement invariance. Psychological
Bulletin, 114, 352-566.
Reise, S.P. & Yu, J. (1990). Parameter recovery in the graded response model using
MULTILOG. Journal of Educational Measurement, 27, 133-144.
RMC Corporation. (2005). Levels of Use of Technology. Retrieved from
http://www.rmcdenver.com/useguide/cbam.htm
Samejima, F. (1969). Estimation of latent ability using a response pattern of graded scores.
Psychometrika Monograph, No. 17.
Samejima, F. (1996). The graded response model. In W.J. van der Linden & Hambleton, R.K.
(Eds.), Handbook of modern item response theory. New York, NY: Springer.
Satorra, A., & Bentler, P.M. (1994). Corrections to test statistics and standard errors in
covariance structure analysis. In A. vonEye & C.C. Clogg (Eds.), Latent variable
analysis: Applications for developmental research (pp. 285-305). Thousand Oaks, CA:
119

Sage.
Schechter, E.L. (2000). Factors relating to classroom implementation of computer
technology in elementary schools (Unpublished doctoral dissertation). St. John’s
University, Jamaica, NY.
Simpson, E. (1972). The classification of educational objectives in the psychomotor domain: The
psychomotor domain (Vol. 3). Washington, DC: Gryphon House.
Steinburg, L., & Thissen, D. (1996). Uses of item responses theory and testlet concept in the
measurement of psychopathology. Psychological Methods, 1, 81-97.
Stoltzfus, J. (2006). Determining educational technology and instructional learning skills sets
(DETAILS): A new approach to the LoTi framework for the 21st century. Retrieved
from http://loticonnection.com/validandreliable.html
Stoltzfus, J. (2009). Criterion-related validation of the Core LoTi Levels: An exploratory
analysis. Retrieved from http://www.loticonnection.com/validandreliable.html
Stoltzfus, J. & Moersch, C. (2005, April). Construct validation of the level of technology
implementation (LoTi) survey: A preliminary analysis. Paper presented at the MICCA
Conference, Maryland.
Suhr, D.D. (n.d.). Exploratory or confirmatory factor analysis? Retrieved from
http://www2.sas.com/proceedings/sugi31/200-31.pdf
Tatsuoka, K.K. (1984). Caution indices based on item response theory. Psychometrika, 49, 95-
110.
Tatsuoka, K.K. (1996). Use of generalized person-fit statistics, zetas for statistical pattern
classification. Applied Measurement in Education, 9, 65-75.
Tatsuoka, K.K., & Tatsuoka, M.M. (1983). Spotting erroneous rules of operation by the
120

individual consistency index. Journal of Educational Measurement, 20, 221-230.
Thissen, D., Steinberg, L. & Wainer, H. (1988). Use of item response theory in the study of
group differences in trace lines. In H. Wainer & H.L. Braun (Eds.). Test validity (pp. 147-
169). Hillsdale, NJ: Erlbaum.
Thomas, Lajeane G., & Knezek, Don. (1991). Facilitating restructured learning experiences with
technology. The Computing Teacher, 18(6), 49–53.
Townsend, M. & Konold, T.R. (2010). Measuring early literacy skills: A latent variable
investigation of the Phonological Awareness Literacy Screening for Preschool. Journal of
Psychoeducational Assessment, 28(2), 115-128.
Thompson, B. (2004). Exploratory and confirmatory factor analysis: Understanding concepts
and applications. Washington, DC: American Psychological Association.
Van der Linden, W.J., & Hambleton, R. K. (1997). Handbook of modern item
response theory. New York, NY: Springer.
Vaughan, W. (2002). Professional development and the adoption and implementation of new
innovations: Do teacher concerns matter? International Electronic Journal for
Leadership in Learning, 6(5). Retrieved from
http://www.ucalgary.ca/~iejll/volume6/vaughan.html
Velicer, W.F. (1976). Determining the number of components from the matrix of partial
correlations. Psychometrika, 31, 321-327.
Velicer,W. F., Eaton, C. A. & Fava, J. L. (2000). Construct explication through factor or
component analysis: A review and evaluation of alternative procedures for determining
the number of factors or components. In R. D. Goffin&E. Helmes (Eds.), Problems and
121
solutions in human assessment: Honoring Douglas N. Jackson at seventy. Norwell, MA:
Kluwer Academic.
Webb alignment tool. (2005). Retrieved from http://dese.mo.gov/divimprove/
sia/msip/DOK_Chart.pdf
Wilson, L.O. (2006). Beyond Bloom – A new version of the cognitive taxonomy. Retrieved
from http://www.uwsp.edu/education/lwilson/curric/newtaxonomy.htm
Wright, B.D., & Stone, M.H. (1979). Best test design. Rasch measurement. Chicago, IL: Mesa
Press.
Worrell, P.L. (2005). The use of journaling as a means of reflection for greater technology
implementation among teachers (Doctoral dissertation). Retrieved from
http://digital.library.unt.edu/ark:/67531/metadc4920/
Yen, W.M. (1993). Scaling performance assessments: Strategies for managing local item
dependence. Journal of Educational Measurement, 30, 187-213.
Zwick, W. R. & Velicer, W. F. (1986). Factors influencing five rules for determining the number
of components to retain. Psychological Bulletin, 99, 432-442.
122