Embed Size (px)
Citation preview

National Aeronautics and Space Administration
Structural “Pain” Compensating Flight Control
Chris J. Miller ([email protected])
Flight Controls and Dynamics Branch NASA Armstrong Flight Research Center
Aerospace Control and Guidance Systems Committee Meeting #114
October 15-17, 2014
https://ntrs.nasa.gov/search.jsp?R=20140017331 2018-05-30T16:48:23+00:00Z

Background
Problem Statement Current aircraft designs utilize high design structural margins and fixed* control allocation schemes to prevent structural over load for a priori operating conditions and maneuvers. As a result:
• The control laws provide no explicit guarantee of structural overload prevention
• Operators must rely on pilot awareness and training to avoid maneuvers which would damage the aircraft
• Fixed* allocators lack adaptability to damage, system failures, and flight outside of the design flight envelope (stall/spin)
• Aircraft structure must be overbuilt resulting higher vehicle weight and more fuel burn
American Airlines Flight 587, Nov. 12 2001 NTSB Number AAR-04/04
“The National Transportation Safety Board determines that the probable cause of this accident was the in-flight separation of the vertical stabilizer as a result of the loads beyond ultimate design that were created by the first officer’s unnecessary and excessive rudder pedal inputs. Contributing to these rudder pedal inputs were characteristics of the Airbus A300-600 rudder system design and elements of the American Airlines Advanced Aircraft Maneuvering Program.” *The term fixed in this context does not necessarily mean that the control
allocation is the same across all flight conditions simply the lack of ability to redistribute control mixing based on sensed data or failure detection.
Conceptual Idea
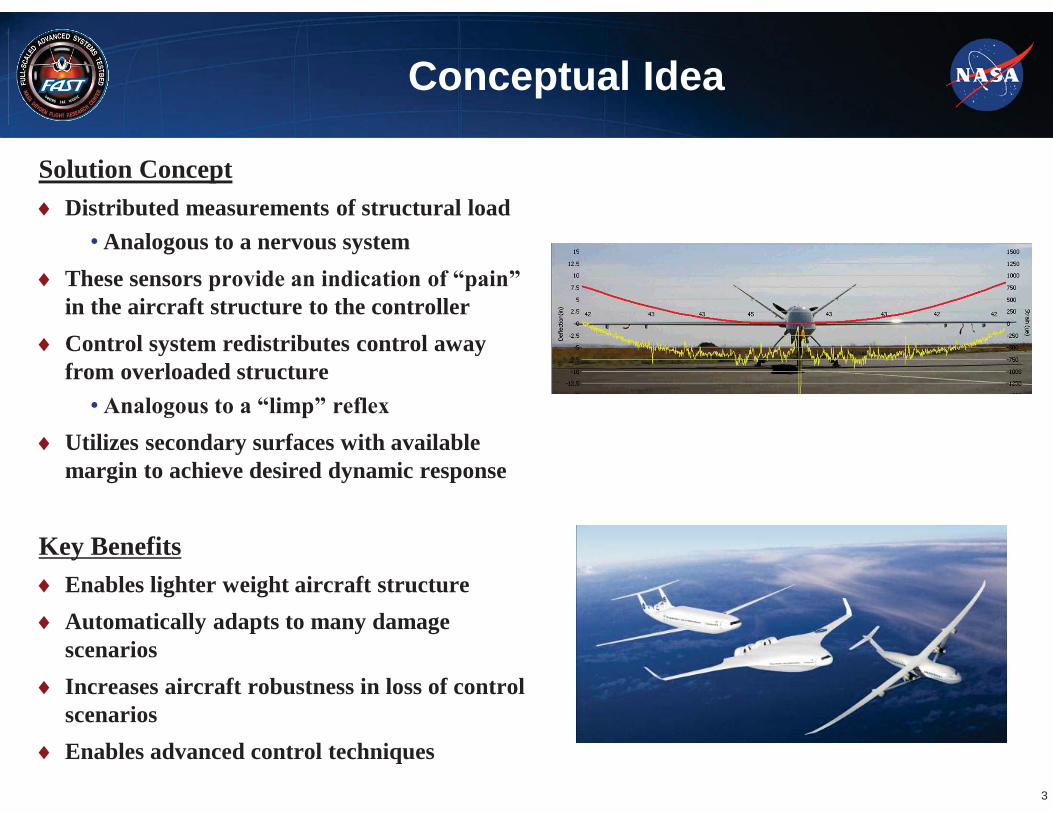
Solution Concept Distributed measurements of structural load
• Analogous to a nervous system These sensors provide an indication of “pain” in the aircraft structure to the controller Control system redistributes control away from overloaded structure
• Analogous to a “limp” reflex Utilizes secondary surfaces with available margin to achieve desired dynamic response
Key Benefits Enables lighter weight aircraft structure Automatically adapts to many damage scenarios Increases aircraft robustness in loss of control scenarios Enables advanced control techniques
3

Explore the merits of Optimal Control Allocation with structural feedback in flight on a full scale piloted vehicle (3 Flights) Feedback strain gauge measured aileron hinge moment
• Limited envelope allows rapid prototyping • Utilizes research instrumentation as a primary feedback parameter
Utilize measured strain within an optimal control allocator to actively limit the load on aileron attachment rivets to specified values maintaining aircraft handling qualities and performance Objectives:
• Objective 1: Limit the aileron motion subject to a defined load constraint.
• Objective 2: Maintain the roll axis frequency response of the controller that does not utilize structural load as a constraint.
• Objective 3: Maintain the handling qualities ratings of the controller that does not utilize structural load as a constraint
Critical load for the experiment
Experiment Objectives and Scope
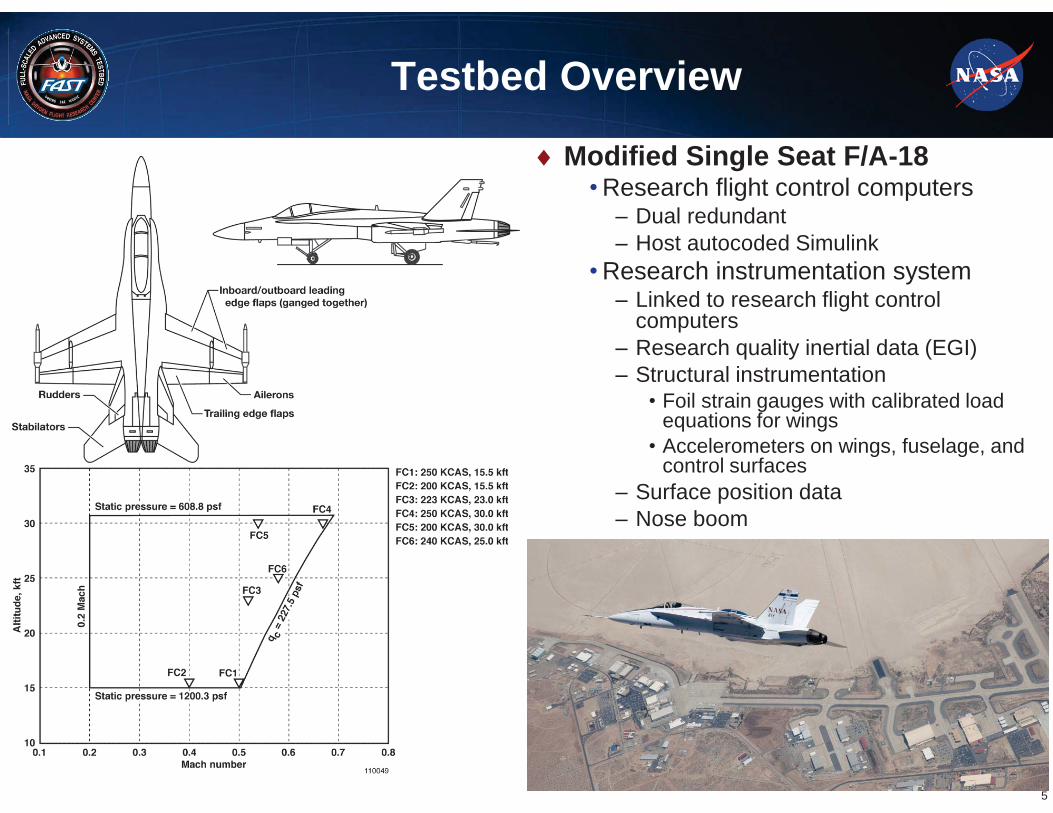
Testbed Overview
5
Modified Single Seat F/A-18 • Research flight control computers
– Dual redundant – Host autocoded Simulink
• Research instrumentation system – Linked to research flight control
computers – Research quality inertial data (EGI) – Structural instrumentation
• Foil strain gauges with calibrated load equations for wings
• Accelerometers on wings, fuselage, and control surfaces
– Surface position data – Nose boom
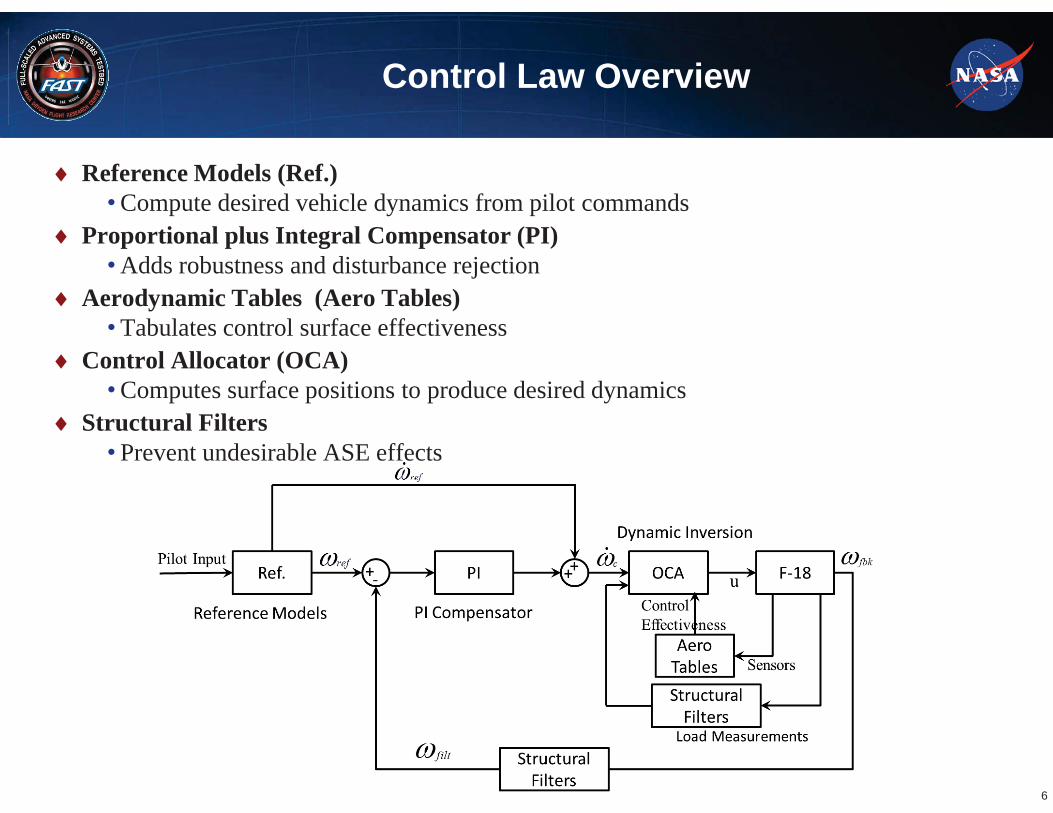
Control Law Overview
6
Reference Models (Ref.) • Compute desired vehicle dynamics from pilot commands
Proportional plus Integral Compensator (PI) • Adds robustness and disturbance rejection
Aerodynamic Tables (Aero Tables)• Tabulates control surface effectiveness
Control Allocator (OCA) • Computes surface positions to produce desired dynamics
Structural Filters • Prevent undesirable ASE effects event undesirable ASE effects

Optimal Control Allocation Formulation
Load feedback
Command tracking from conservation of angular momentum (normal NDI) Desired trim Load Constraint

Cost Function Explanation
Vector of load measurements
Command tracking from conservation of angular momentum (normal NDI) Desired trim
Load Constraint (normalized by load limit)
Surface trim positions Anything in the null(B)
Square matrix used to set relative importance of trim positions for each surface
Relative importance of achieving desired trim positions
Matrix of surface Influence coefficients for each load
Measured surface positions (M is based on current Position)
Load constraint power (used to tailor steepness)
Relative importance of load constraint
Control effectiveness Matrix and homogenous contribution (Aero tables)
Angular Accel. command (ref + PI)
Aircraft state data (α,p,q,r)

Tuning the Cost Function (Trim)
ε – Scalar weight for attraction to trim • Small enough to allow for the surfaces to move to track the desired dynamics but large enough to attract the
surfaces back to their desired trim positions in the absence of large commands – Analogous to an integrator zeroing out steady state error
• Without this type of term the surfaces trim in odd and not intuitively obvious ways • Tuned empirically by trial and error. HQ’s do not appear to be very sensitive to it’s value. Basically just need to
get the order of magnitude right.
H – Square matrix used to set relative importance of achieving trim position for each surface • Not in any of the publications, but found to be very helpful. • Allows the designer fine control of the surface usage priorities without dedicating a surface to one role
– For example: F-18 the TEFs are slow and used mostly for trim while the ailerons are fast and primarily used for tracking roll commands
• Tuning is straight forward and can be done empirically • A diagonal matrix was found to yield the desired flexibility desired..
up – Trim surface commands • Anything in the null space of B is permissible• Used to trim for angle of attack and to keep surfaces in desirable positions for control authority
Command tracking from conservation of angular momentum (normal NDI) Desired trim
Load Constraint (normalized by load limit)

Tuning the Cost Function (Load)
γ – Scalar weight for load constraint • Must be tuned in conjunction with n to tailor at what load level this constraint dominates the cost function • This experiment tuned so that 80% is the cross over point such that below 80% the load constraint plays little
to no role, but over 80% it dominates the cost function
n – Exponent on the load constraint • Tuned to provide a steeper load constraint at higher load and a nice flat near zero value at lower load • Higher powers can exhibit convergence issues, and if the power is too low the constraint behaves less like a
hard constraint and more as a load minimization constraint • Higher values of n makes the control response more sensitive to time delay in the load measurement
This formulation provides a practical hard constraint on the load without requiring a unique mapping from surface positions to loads
• Publications with hard load constrains implement them as surface position limits which requires a uniqueness in the load equations
• The other published approaches minimize load which is also not desirable for this application
Command tracking from conservation of angular momentum (normal NDI) Desired trim
Load Constraint (normalized by load limit)

Tuning n and γ Illustration
Decreasing γ • Increases load at which transition between aileron
and Stab/TEF dominates roll (better aileron usage)
• Leaves some residual aileron command at high load (undesirable)
11
Effect of Varying γ with n=4 Effect of Varying n with γ = 0.1/0.9n
Increasing n • Increases load at which transition between aileron
and Stab/TEF dominates roll (better aileron usage)
• Allows full transition away from aileron usage prior to 100% load (desirable)

Minimizing the Cost Function (subject to rate and position limits)
Solve for:
Which is global minimum because is positive definite as long as B, L, and H are properly formulated
R is a relaxation factor added to improve convergence properties

Other Numerical “Fixes” and Checks
Self adjusting relaxation factor to address poor convergence due to steepness of cost function at high load
•Each iteration should reduce J, if J increases reduce the relaxation factor (R) by a factor of 10 and redo the iteration
•Repeat this until J is reduced by the iteration Rank check of the control effectiveness matrix (B) using minimum singular value check Condition number check on second derivative of the cost matrix Number of iterations limited to avoid over running the allowed computation time Convergence verified by the value of the cost function and the norm of the first derivative of the cost function

Experiment Configurations
Unique combinations for each unique cost function weighting scheme selectable prior to engagement (Not all combinations flown)
• Allocation schemes – Production Controller – Weighted pseudo inverse (NDI) – Cost function optimization via Newton-Rapson (OCA)
• Load constraint exponent (n) values (only available for OCA) – 4, 10, 20
• Trim weight (ε) values (only available for OCA) – 1e-4, 1e-3, 5e-3, 1e-2
Five load level limits selectable by nose wheel steering presses once engaged (only available for OCA)
• 0 – no load limit • 1 – 16,000 in-lbs • 2 – 12,000 in-lbs • 3 – 10,000 in-lbs • 4 – 7,000 in-lbs • 5 – 5,000 in-lbs

Flight Test Approach
3 flights with 3 different test pilots Each configuration (including production F-18) evaluated with a range of load limits
• Integrated test block at 25kft 240kcas, and 25kft 200kcas • 2.0 g air to air tracking with Cooper-Harper Ratings at nominally 25kft 240kcas (Illustration
to follow) Integrated test block consists of:
• Pitch, Roll and Yaw doublets • Pitch and bank captures • Full pedal steady heading side slip • 360 degree to stick rolls (limited by yaw rate required to coordinate rolls) • 2.0g load ½ stick roll • 2.5g wind up turn • Pitch and roll frequency sweeps

Successful Demonstration of Load Limiting
The experiment successfully demonstrated the use of strain feedback as a means to actively limit the aileron loads The allocator redistributed roll control to other surfaces and achieved the desired roll rate
Aileron hinge moment limited to less than the specified value but with some ASE excitation
Desired roll rate achieved with a small decrease in the roll onset rate
360 Degree Roll 65% Stick
7,000 in-lb limit
7,000 in-lb limit

Control Surface Reallocation and Cost Function Behavior
360 Degree Roll 65% Stick
With hinge moment limiting engaged the controller allocates more of the roll command to the stabs and TEF’s as expected Which results in:
• A slight increase in the trim contribution to the cost function • More tracking error due to slower actuator responses

Roll Mode Behavior with Load Limiting
Roll Mode Gain (K)• Decreases slightly with
decreasing hinge moment limit – Less aileron command allowable
translates to reduced roll rate • Steeper load constraints (higher
n) preserve more roll authority
Roll Mode Time Constant • Increases with decreasing roll
rate – Less aileron command allowable
translates to reduced roll bandwidth
• Steeper load constraints (higher n) preserve more roll authority even with restrictive load limits
Damping (ζ) • No significant trends that affect
the response
Low Order Equivalent System Parameters

Symmetric Maneuver Behavior
The Good • Hinge moment is limited to below the 7000
in-lb limit by fairing both ailerons symmetrically up to reduce load
The Not So Good • Significant oscillatory behavior on both
hinge moment measurement and the symmetric ailerons command
– Exacerbated by tighter hinge moment limit • Related to exciting of a wing structural
mode by the high angle of attack flow buffet on the aileron and wing
• Average aileron hinge moment not as close to limit as desired (65% instead of 80%)
– Due to two measurements nearing their limit instead of just the one
– Suggests that further shaping of load measurements beyond just the load constraint exponent may be desirable
2.5g Level Turn at 200KCAS

Gross Acquisition • Target aircraft starts line abreast with
the test aircraft at ~0.5 miles separation • Target initiates a 2g level turn • Test aircraft aggressively places the
target within the reticle – Desired Criteria – No overshoots – Adequate Criteria – One overshoot
Tracking Task Description
~0.5 miles
Target Test Aircraft
Gross Acquisition Setup
Heads Up Display View During Fine Tracking
Reticle Pipper
Fine Tracking • Target aircraft begins gentle roll maneuvers • Test aircraft tracks the target with the pipper
– Desired Criteria – Pipper on target 80% of the time– Adequate Criteria – Pipper on the target 50% of the
time
Target Region

Handling Qualities Degradation
• The ratings generally degraded with more restrictive limits as expected • As AOA increased (heavier weighs and lower airspeeds) the more
restrictive limits exhibited poor HQ’s due to alleviation of HM resulting in poor pitch axis ratings which was a surprise
• Pilot C specifically commented that the task was easier at the beginning but as airspeed decreased and AOA increased the task was more difficult

Strain Feedback ASE Concerns
No models or data sets available prior to flight to determine structural modal interactions on hinge moment measurements Unsure if the assumption that the optimization of a cost function can be reduced to a gain is valid for ASE analysis Concerned that excessive filtering will cause time delay problems for strain feedback Two options designed for flight test, one with no filter and one with a 5hz first order low pass filter on strains s filter on strains

ASE Instability
• Without the filter as HM becomes an important feedback with sufficiently high gain an ASE instability occurs at 20hz (-180 phase crossover above)
• 5hz 1st order low pass filter put on the hinge moment feedback is sufficient
-180
0 dB
Response with no filter on strain feedback
Open loop freq. response of strain feedback loop

OCLA Results Summary
The Good • Limited hinge moments as designed • Redistributed control commands away from the ailerons and maintained performance
• Adequate HQ’s demonstrated for all test scenarios even with very restrictive HM limits
The Needs Improvement (Lessons from Flight)• The ASE concerns and best practices for this technique were largely unknown and difficult to predict prior to this flight series
– With the experience gained a much better design is achievable with a good notch filter design for the hinge moment measurements
• The increase in AOA as a result of fairing the ailerons into the flow was predicted but the HQ implications were not, some AOA compensation with flaps could have addressed this issue
• The actual hinge moments achieved for symmetric maneuvers was lower than expected, but could be easily accounted for with some input shaping on the strain measurements

Backup Charts
25

Redundancy Management
Strain sensors on both ailerons are mission critical and are used as feedbacks to the control system
• Sensors were not originally intended for use as control feedbacks and as such were not installed with that level of robustness in mind
– Foil strain gauges are not well suited as flight critical feedback sensors for production vehicles due to their lack of robustness
– FOSS or some similar load sensors are much better suited to that application • Checks are implemented in the ARTS to verify the validity of the sensed strain for this experiment (Flow Chart on next slide)
– Utilizes red and yellow voting limits to determine if a sensor has failed – Compares the sensors against the model to determine which sensor has failed and then
latches that failure until the ARTS is disengaged and reset (FCS reset) • Selecting a good sensor based on which one is closer to the model allows for fail-op
even with the sensors only being dual redundant (increases mission success probability) – Compares the voted output to a allowed range and commands a disengage if the value is
outside of the allowed range (reduces probability of hardovers)

Redundancy Management Flow Chart
Diff≥red
Diff≥yellow
Per = max(per-1,0)
Per = per+1
Per ≥ per limit Per = per limit Compare sensors to models
Output = Average
Latch Senor Fail
Output = Closest to Model
Output in allowed range?
Stay engaged Output Voted Value
Disengage Output Safe Value
Start yes
no
no
yes
yes
no
yes
no