Embed Size (px)
Citation preview

Structural Organization of ParallelInformation Processing Within the
Tectofugal Visual System of the Pigeon
BURKHARD HELLMANN* AND ONUR GUNTURKUN
Ruhr-Universitat Bochum, Fakultat fur Psychologie, AE Biopsychologie,44780 Bochum, Germany
ABSTRACTVisual information processing within the ascending tectofugal pathway to the forebrain
undergoes essential rearrangements between the mesencephalic tectum opticum and thediencephalic nucleus rotundus of birds. The outer tectal layers constitute a two-dimensionalmap of the visual surrounding, whereas nucleus rotundus is characterized by functionaldomains in which different visual features such as movement, color, or luminance areprocessed in parallel. Morphologic correlates of this reorganization were investigated bymeans of focal injections of the neuronal tracer choleratoxin subunit B into different regionsof the nuclei rotundus and triangularis of the pigeon. Dependent on the thalamic injectionsite, variations in the retrograde labeling pattern of ascending tectal efferents were observed.All rotundal projecting neurons were located within the deep tectal layer 13. Five differentcell populations were distinguished that could be differentiated according to their dendriticramifications within different retinorecipient laminae and their axons projecting to differentsubcomponents of the nucleus rotundus. Because retinorecipient tectal layers differ in theirinput from distinct classes of retinal ganglion cells, each tectorotundal cell type probablyprocesses different aspects of the visual surrounding. Therefore, the differential input/outputconnections of the five tectorotundal cell groups might constitute the structural basis forspatially segregated parallel information processing of different stimulus aspects within thetectofugal visual system. Because two of five rotundal projecting cell groups additionallyexhibited quantitative shifts along the dorsoventral extension of the tectum, data alsoindicate visual field–dependent alterations in information processing for particular visualfeatures. J. Comp. Neurol. 429:94–112, 2001. © 2001 Wiley-Liss, Inc.
Indexing terms: tectum opticum; nucleus rotundus, functional parcellation; extrageniculocortical
pathway; birds
In pigeons, approximately 90% of retinal ganglion cellscontribute to the tectofugal pathway, which is homologous tothe extrageniculocortical system in mammals (Shimizu andKarten, 1993). Within the tectofugal pathway, visual inputascends from the mesencephalic tectum opticum, via thediencephalic nucleus rotundus to the telencephalic ectostria-tum (Benowitz and Karten, 1976). Tectal, rotundal, or ect-ostriatal lesions result in severe deficits in intensity, color,pattern, acuity, or movement discrimination (Hodos andKarten, 1966; Hodos, 1969; Hodos and Bonbright, 1974;Mulvanny, 1979; Hodos et al., 1984; Macko and Hodos, 1984;Bessette and Hodos, 1989; Watanabe, 1991; Gunturkun andHahmann, 1999). The deficits in pattern discriminationtasks and the dramatic postlesional threshold elevations inacuity measurements especially suggest the existence of aneural system with high spatial resolution.
Indeed, the outer retinorecipient layers of the tectumare characterized by a precise retinotopic representationwith narrowly tuned receptive fields of less than 1°(Hamdi and Whitteridge, 1954; Jassik-Gerschenfeld andHardy, 1984). However, receptive field widths graduallyincrease in deeper tectal layers (Jassik-Gerschenfeld andGuichard, 1972) to finally span up to 180° (Frost and
Grant sponsor: Deutsche Forschungsgemeinschaft; Grant numbers: Gu227/4-3 and Sonderforschungsbereich 509 NEUROVISION; Grant sponsor:the Alfried Krupp-Stiftung.
*Correspondence to: Burkhard Hellmann, AE Biopsychologie, Fakultatfur Psychologie, Ruhr-Universitat Bochum, 44780 Bochum, Germany.E-mail: [email protected]
Received 27 June 2000; Revised 8 September 2000; Accepted 8 Septem-ber 2000
THE JOURNAL OF COMPARATIVE NEUROLOGY 429:94–112 (2001)
© 2001 WILEY-LISS, INC.

DiFranco, 1976) in neurons of the efferent tectal layer 13neurons, which are the exclusive source of the ascendingprojection to nucleus rotundus (Karten and Revzin, 1966).Although layer 13 neurons probably receive direct inputfrom retinal terminals in superficial tectal layers, theysample retinal input with their extensive dendritic arborsfrom such a wide tectal area that detailed topographicinformation is probably lost (Ramon y Cajal, 1995; Huntand Kunzle, 1976; Hunt and Brecha, 1984; Karten et al.,1997; Luksch et al., 1998). Indeed, retinotopic place codingseems to be absent within nucleus rotundus, because eachpoint of the tectum is connected to nearly the entire ro-tundus and its dorsal cap, the nucleus triangularis (Be-nowitz and Karten, 1976; Nixdorf and Bischof, 1982; Ngoet al., 1994; Deng and Rogers, 1998; Hellmann and Gun-turkun, 1999). Instead of retinotopy, a new functionallybased segregation seems to take place in the thalamus,because electrophysiologic data could demonstrate func-tional rotundal domains (Granda and Yazulla, 1971;Jassik-Gerschenfeld and Guichard, 1972; Yazulla andGranda, 1973; Frost and DiFranco, 1976; Revzin, 1979;Wang and Frost, 1992) in which mainly color, luminance,motion, or looming are processed (Wang et al., 1993).Behavioral data support this view because restricted ro-tundal lesions were shown to affect performance in onlyspecific aspects of visual analysis (Laverghetta andShimizu, 1999). In contrast to the tectorotundal connec-tion, the rotundoectostriatal projection (Benowitz andKarten, 1976; Nixdorf and Bischof, 1982) as well as sub-sequent secondary and tertiary connections within theforebrain (Husband and Shimizu, 1999) are organized to-pographically, suggesting rotundal functional segregationto be carried on within the forebrain.
Thus, the tectofugal system is transformed at the tectallevel from a retinotopically organized system with smallreceptive fields into a pathway that is composed of func-tionally segregated entities made up of neurons encom-passing wide receptive fields. Understanding the func-tional architecture of the tectofugal visual pathwayrequires an answer to the key question how visual imagesare preserved and transformed at the tectorotundal junc-tion. Therefore, the aim of the present study was to per-form a detailed analysis of the tectorotundal projection tounderstand the structural basis of this transformation.
MATERIALS AND METHODS
Twenty-five adult pigeons (Columba livia) of both sexesfrom local breeding stocks received injections of the neu-ronal tracer choleratoxin subunit B (CtB; Sigma, Deisen-hofen, Germany) into the left diencephalic nucleus rotun-dus (RT) or left nucleus triangularis (T). All experimentswere carried out according to the specifications of theGerman law for the prevention of cruelty to animals.
Before surgery, the pigeons were anesthetized with equi-thesin (0.31–0.33 ml/100 g body weight) and the animalswere placed into a stereotaxic apparatus (Karten and Hodos,1967). The scalps were infiltrated with lidocaine (Xylocaine)and were incised dorsally. Next, the skull was opened with adental drill, and a glass micropipette (outer tip diameter 20mm) mounted to a mechanical pressure device (WPI Nanoli-terinjector, WPI, USA) was inserted into varying sites of theleft RT or T (anterior 5.3–7.0, dorsal 5.0–7.2, lateral 1.8–3.8)according to stereotaxic coordinates of the pigeon brain atlasby Karten and Hodos (1967). Thirty-four nanoliters CtB [1%
(wt/vol) in distilled water] were injected in steps of 2 nlduring a 15–20 min period. Subsequently, the pipette wasremoved, and the skin was infiltrated again with lidocaineand sutured.
After 2 days’ survival time, animals received an injec-tion of 200 U sodium heparin and were then deeply anes-thetized with an overdose of equithesin (0.55 ml/100 gbody weight). The pigeons were perfused through theheart with 100 ml 0.9% (wt/vol) sodium chloride and 800ml ice-cold 4% paraformaldehyde in 0.12 M phosphatebuffer (PB), pH 7.4. The brains were removed and storedfor 2 hours in fixative with supplement of 15% sucrose(wt/vol). Subsequently, the brains were stored overnightin a solution of 30% sucrose in 0.12 M PB. On the followingday, the brains were cut in frontal plane at 35 mm on afreezing microtome and the slices were collected in PBcontaining 0.1% sodium azide (wt/vol).
Brain slices were reacted free-floating according to theimmuno-ABC-technique. The sections were placed for 35minutes in 0.5% hydrogen peroxidase in distilled water toreduce endogenous peroxidase activity. After rinsing, sec-tions were incubated overnight at 4°C in the primaryantibody [rabbit anti-Choleragenoid; Sigma, Germany;1/20,000 in 0.12 M PB with the addition of 2% NaCl(wt/vol), 0.3% Triton-X-100 (vol/vol) and 5% normal goatserum]. After being rinsed, the sections were incubated for60 minutes at room temperature in the biotinylated sec-ondary antibody [goat anti-rabbit; Vectastain, Vector,Camon (Wiesbaden, Germany); 1/250 in 0.12 M PB 1 2%NaCl 1 0.3% Triton-X-100]. After additional rinsing, thesections were incubated for 60 minutes in avidin–biotin–peroxidase solution (Vectastain ABC-Elite kit, Vector,Camon; 1/100 in 0.12 M PB 1 2% NaCl 1 0.3% Triton-X-100). After washing, the peroxidase activity was detectedusing a heavy metal intensified 393-diaminobenzidine(Sigma) reaction (Adams, 1981), modified by the use ofb-d-glucose/glucose-oxidase (Sigma) instead of hydrogenperoxidase (Shu et al., 1988). The sections were mountedon gelatin-coated slides, dehydrated, and coverslippedwith DPX (Fluka, Neu-Ulm, Germany) or Permount(Fischer Scientific, Fair Lawn, NJ). Some sections werecounterstained with cresyl violet.
The rotundal tracer injection sites and the resultingretrograde CtB labeling within the tectum opticum, nu-cleus subpretectalis (SP), nucleus interstitiopretectosub-pretectalis (IPS), and nucleus of the tractus tectothalami-cus (nTT) were analyzed using an Olympus BH2microscope. Qualitative reconstruction of rotundal/triangular CtB diffusion area and the location of labeledsomata as well as their peripheral processes were made inNissl counterstained sections. Drawings were performedusing digitized microscopic images [JVC-TK C1381 andGrabitPCI grabber (SIS, Munster, Germany) in PC-software Designer 3.1 (Micrografx, Dallas, TX)]. Quanti-tative determinations of soma size, number, and distribu-tion were performed in digitized images with the help ofan image analyzing system (analySIS 3.0 Doku, SIS) in 10pigeons. The number of retrogradely labeled layer 13 so-mata was estimated within the ipsilateral as well as con-tralateral tectum along a rostrocaudal extent of 2.8 mm (A1.5–A 4.3; Karten and Hodos, 1967) by counting CtB-labeled cells in every 10th section with 4503 magnifica-tion. The soma size of layer 13 neurons in the dorsal (100cells) and the ventral ipsilateral tectum (100 cells) wasmeasured at A 3.0 (overall magnification 1,8003). Dorso-
95PARALLEL PROCESSING IN THE TECTOFUGAL SYSTEM

ventral alterations in soma distribution were determinedby counting CtB-labeled cells over an extent of 920 mmwithin the dorsal tectum (beginning 3.5 mm dorsal tolayer 5 transition zone; Fig. 1) and the ventral tectum (1.5mm ventral to transition zone) at rostrocaudal coordinatesA 2.0 and A 3.5. We were only interested in an estimationof the relative number of labeled cells between differentrotundal injection sites. Therefore, no correction proce-dures were used. Consequently, the cell numbers reportedbelow should not be misinterpreted as representing anabsolute quantity of neurons of a certain system. Photo-graphic documentation was carried out with a 35-mmcamera-system (Olympus) attached to the microscope us-ing Agfa APX 25 films.
RESULTS
CtB injections into nucleus rotundus (Fig. 2A) and itsdorsal cap, nucleus triangularis, always resulted in a com-plex intrarotundal labeling pattern that never appearedspherical as would be expected from simple tracer diffu-sion halos. The contralateral rotundus exhibited a mirror-
like fiber label compared to the tracer diffusion within theinjected rotundus (Fig. 2B).
Retrograde CtB transport resulted in bilateral labelingof tectal neurons with 64% to 71% of somata locatedwithin the ipsilateral (left) hemisphere (Figs. 1 and 3).High numbers of retrogradely labeled cells were locatedwithin layer 13 (approximately between 12,000 and97,000 within the ipsilateral hemisphere), although, espe-cially after tracer injections located at the outer margin ofthe rotundus, some additional cells could be filled in ipsi-lateral tectal layers 4 to 12 and 14. Surrounding struc-tures into which tracer sometimes spread was observedincluded the nuclei principalis precommissuralis, ventro-lateralis thalami, posteroventralis thalami, dorsolateralisposterior thalami, and dorsolateralis anterior pars latera-lis. Layer 13 neurons were characterized by medium tolarge somata (mean area 75–240 mm2) with multipolar,laterally to superficially oriented, primary dendritic pro-cesses that could be followed up to layer 11. Beside thesecorrespondences, variations in rotundal/triangular injec-tion sites caused variations in retrograde tectal labeling,pertaining to (1) soma size, their location both within (2)
Fig. 1. Frontal sections of the left (A) and right (B) tectum opticumafter a choleratoxin subunit B injection into part of the left central RT.Cell number increased from the dorsal to the ventral tectum both inthe ipsi- as well as the contralateral hemisphere. Shift in soma num-
ber was paralleled by thickness variations of fiber label within layer5b of the outer tectum. Arrows indicate a zone within the ventrolat-eral tectum with enhanced thickness changes of layer 5b (transitionzone). Scale bar 5 1,000 mm.
96 B. HELLMANN AND O. GUNTURKUN

different layer 13 depths, and (3) their distribution overthe dorsoventral extent of the tectal surface. Most obvi-ously, (4) CtB labeling pattern varied within the outertectal layers 3–9. Because the rotundus does not projectonto the tectum (Benowitz and Karten, 1976; Nixdorf andBischof, 1982; Karten et al., 1997; Deng and Rogers, 1998;Luksch et al., 1998), we assumed that the diffuse fiber orgranular staining within the outer tectal layers wascaused by CtB transport into peripheral dendritic ramifi-cations of labeled tectal neurons. Dependent on the abovefour variables, we distinguished five distinct tectal label-ing patterns.
The tectal type I pattern (Karten et al., 1997; Figs. 1 and4, left part) was characterized by extensive, and oftenradially oriented ramifications with numerous local fiberswellings within layer 5b (n 5 4). In three additionalcases, a smaller number of processes also were visible inlayer 5a. Type I somata were concentrated within super-ficial and central layer 13, with a few cell bodies also beinglocated in deep and central layer 12. Overall, somataconcentrated within the ventral tectum with three to sixtimes more cells compared to the dorsal tectum (Figs. 1and 5). No density alterations were observed along therostrocaudal axis. The dorsoventral increase of cell num-ber was paralleled by a corresponding dorsoventral in-crease in thickness of layer 5b label (Fig. 1). The averagenumber of layer 13 cells (approximately 61,000) was thehighest of all tectal labeling patterns. The combination ofreconstructions of rotundal tracer diffusion sites (n 5 4,Fig. 6a) revealed tectal type I labeling to be exclusivelyassociated with CtB injections into the ventrorostral andcentral rotundus.
Tectal type II label (Karten et al., 1997) was character-ized by CtB fiber tracing restricted to nonretinorecipientdeeper tectal layers (layers 8–12; Fig. 4, right side). Ret-rogradely labeled somata (approximately 23,000 cells)were located throughout the entire depth of layer 13 withslightly more cells within the ventral optic tectum (Fig. 5).The type II pattern was exclusively observed after CtBinjections restricted to the dorsalmost regions of nucleustriangularis (n 5 2; Fig. 6).
Tectal type III pattern (Fig. 7, left part) was character-ized by few horizontally oriented dendritic ramificationsand terminal-like swellings within retinorecipient layer 4.CtB label within the retinorecipient outer tectum re-stricted to layer 4 was observed in only one animal with arostral and ventrolaterally situated application (Fig. 6a).Two slightly more caudodorsally situated CtB injectionsresulted in additional granular label within tectal layers5b or 5a. In the latter case, layer 5a label was restricted tothe dorsal tectum, whereas its ventral regions exhibitedextensive layer 4 labeling (Fig. 7, right part). Somata werelocated homogeneously throughout the entire depth oflayer 13. Type III neurons were found with equal numbersalong the dorsoventral and rostrocaudal axis of the tectum(Fig. 5A). Overall numbers of type III cells were the lowest(approximately 17,000; n 5 3).
The tectal type IV pattern was characterized by exten-sive granular CtB label within retinorecipient layer 5a(n 5 3; Fig. 8, left side). Additionally, the nonretinorecipi-ent layer 8 was consistently covered by randomly orienteddendritic processes with small swellings. The type IV pat-tern was associated with CtB diffusion within rostrodorsaland centromedial rotundus (Fig. 6A). Slightly more
Fig. 2. Frontal sections of nucleus rotundus (RT) near cholera-toxin subunit B injection site (A) and its contralateral counterpart (B)within the same pigeon. Because we observed no direct interrotundalprojections, contralateral label was due to contralaterally projecting
axon collaterals of tectorotundal fibers. Thus, a given pool of tectallayer 13 neurons exhibits comparable ramifications within the ro-tundi of both hemispheres. T, nucleus triangularis. Scale bar 5 1,000mm.
97PARALLEL PROCESSING IN THE TECTOFUGAL SYSTEM

lateral/ventral tracer diffusion within the central rotun-dus resulted beneath strong layer 5a also in weak/substantial layer 5b CtB-like immunoreactivity (Fig. 6B).Somata (on average 41,000; n 5 5) were concentratedwithin the inner and central aspects of layer 13 withapproximately 1.7 times more cells within the ventraltectum, representing the inferior/frontal visual field(Fig. 5B).
Tectal type V labeling was characterized by CtB labeleddendritic ramifications within retinorecipient layers 3, 5a,and to a lesser extent in layer 6 (n 5 3; Figs. 3A and 8,right side). Layer 13 somata (average cell number 38,000)clustered mainly within the dorsal tectum (two timesmore cells; Figs. 3A and 9B). Here the cells were locatedthroughout the entire layer 13, whereas type V somatawithin the ventral tectum were situated at the inner mar-gin of this lamina (Fig. 5B). Parallel to this soma distri-bution, type V label within retinorecipient layers alsoconcentrated within the dorsal tectum. Beside this quan-titative difference, a qualitative dorsoventral distinctionalso occurred, as the clearcut segregation of dendritic ar-borizations within dorsal tectal layers 3 and 5a dimin-ished in the ventral tectum (Fig. 3A). This effect was
caused by enhanced CtB label within ventral tectal layer4, such that the dendritic labeling covered layers 3–5amore or less homogeneously. Rotundal tracer spread inthe three cases with pure type V labeling pattern wasrestricted to the caudal most rotundus (Fig. 6A). Two caseswith the tracer extending into central rotundus addition-ally showed CtB immunoreactivity in tectal layer 5b, andwas thus overlapping the type I labeling pattern (Fig. 6B).
Each tectal cell population was reliably labeled if tracerdiffusion was restricted to certain rotundal subregions(Fig. 6A). Each of these subregions differed from eachother in location, and their combination covered largeregions of the rotundus. Therefore, we conclude that eachlayer 13 cell population projects onto separate domains ofthe rotundotriangular system. This does not necessarilymean that each of these layer 13 cell populations consistsof a single cell type, because individual rotundal domainsmay receive input by more than one morphologically orphysiologically specified layer 13 cell class. Indeed, ourdata indicate that at least the type V population consistsof two morphologically different cell types that projectcommonly onto the caudal rotundal domain (see below).
Fig. 3. Left (A) and right (B) tectum opticum after a choleratoxinsubunit B injection into the left caudal rotundus. The number of cellsdecreased from the dorsal to the ventral tectum both in the ipsilateraland the contralateral hemisphere. Although within the dorsal ipsilat-
eral tectum fiber label is clearly distinguishable between layers 3(arrow in A) and 5a (arrowhead in A), there is only faint and diffuselabel in the outer layers 3–5a of the ventral tectum (open arrows in A).Scale bar 5 1,000 mm.
98 B. HELLMANN AND O. GUNTURKUN

Fig. 4. Tectal type I (left) and type II labeling patterns (right).Type I somata were concentrated within the outer and central parts oflayer 13. Presumably dendritic fiber labeling was concentrated withinlayer 5b. Within this layer, numerous radially oriented processes werevisible. Type II somata were apparent throughout the entire layer 13.Fiber label spared the outer retinorecipient layers 2–7. Upper micro-
graphs: layers 1 to 14 of the lateral tectum (bar indicates 200 mm).Lower micrographs: Higher magnification clippings of the outer (typeI) respectively central (type II) tectum (bar indicates 50 mm). Withineach column left side represents combined CtB/cresyl staining, andright side portrays exactly corresponding sole CtB-label. Numbersindicate tectal laminae.
99PARALLEL PROCESSING IN THE TECTOFUGAL SYSTEM
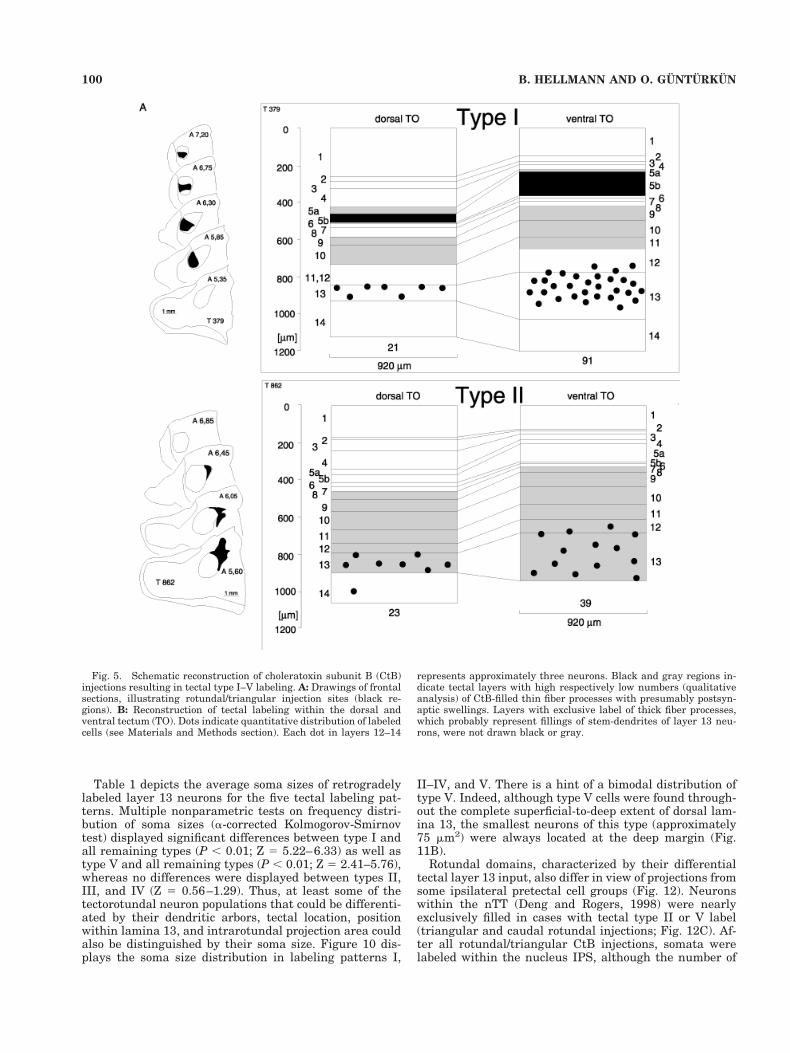
Table 1 depicts the average soma sizes of retrogradelylabeled layer 13 neurons for the five tectal labeling pat-terns. Multiple nonparametric tests on frequency distri-bution of soma sizes (a-corrected Kolmogorov-Smirnovtest) displayed significant differences between type I andall remaining types (P , 0.01; Z 5 5.22–6.33) as well astype V and all remaining types (P , 0.01; Z 5 2.41–5.76),whereas no differences were displayed between types II,III, and IV (Z 5 0.56–1.29). Thus, at least some of thetectorotundal neuron populations that could be differenti-ated by their dendritic arbors, tectal location, positionwithin lamina 13, and intrarotundal projection area couldalso be distinguished by their soma size. Figure 10 dis-plays the soma size distribution in labeling patterns I,
II–IV, and V. There is a hint of a bimodal distribution oftype V. Indeed, although type V cells were found through-out the complete superficial-to-deep extent of dorsal lam-ina 13, the smallest neurons of this type (approximately75 mm2) were always located at the deep margin (Fig.11B).
Rotundal domains, characterized by their differentialtectal layer 13 input, also differ in view of projections fromsome ipsilateral pretectal cell groups (Fig. 12). Neuronswithin the nTT (Deng and Rogers, 1998) were nearlyexclusively filled in cases with tectal type II or V label(triangular and caudal rotundal injections; Fig. 12C). Af-ter all rotundal/triangular CtB injections, somata werelabeled within the nucleus IPS, although the number of
Fig. 5. Schematic reconstruction of choleratoxin subunit B (CtB)injections resulting in tectal type I–V labeling. A: Drawings of frontalsections, illustrating rotundal/triangular injection sites (black re-gions). B: Reconstruction of tectal labeling within the dorsal andventral tectum (TO). Dots indicate quantitative distribution of labeledcells (see Materials and Methods section). Each dot in layers 12–14
represents approximately three neurons. Black and gray regions in-dicate tectal layers with high respectively low numbers (qualitativeanalysis) of CtB-filled thin fiber processes with presumably postsyn-aptic swellings. Layers with exclusive label of thick fiber processes,which probably represent fillings of stem-dendrites of layer 13 neu-rons, were not drawn black or gray.
100 B. HELLMANN AND O. GUNTURKUN

Figure 5 (Continued)
101PARALLEL PROCESSING IN THE TECTOFUGAL SYSTEM

Figure 6

labeled cells was reduced after rostral rotundal injections.Cells within the dorsal components of SP were filled incases with tectal type II, III, and V label, whereas cellswithin the ventral SP were traced after rostroventral CtBinjections, resulting in tectal type I label (Fig. 12B). Cellsthroughout the entire SP were observed after more cen-trally situated rotundal CtB injections, resulting also intectal type I labeling.
DISCUSSION
The present study demonstrates five morphologicallydistinct tectal layer 13 cell populations that together es-tablish the tectorotundal/triangular system. These typesare characterized by their location on the tectal map, thesublaminar position of their somata within layer 13, somasize, projections onto separate subregions of the nucleusrotundus or nucleus triangularis, and the differential pat-tern of fiber labeling within retinorecipient tectal laminae3–7. Layer 13 neurons were already shown to exhibitdendritic ramifications within several retinorecipient lay-ers (Ramon y Cajal, 1995; Luksch et al., 1998), where theyprobably contact directly optic fiber ramifications (S.Ramon cited in Ramon y Cajal, 1995; Hardy et al., 1984;Leresche et al., 1986). Golgi (Ramon y Cajal, 1995) andintracellular tracing studies (Luksch et al., 1998) demon-strated individual layer 13 neurons to exhibit dendriticramifications over wide regions of the tectal surface.Therefore, the banded pattern of CtB labeling within dif-ferent retinorecipient laminae very probably resultedfrom tracer transport within peripheral dendritic ramifi-cations of retrogradely traced layer 13 cells. We will arguethat the morphologic specifications of the five layer 13 cellgroups establish the structural basis for spatially segre-gated information processing of different visual featureswithin the tectofugal system. At the same time, we as-sume that these neurons constitute the transition fromretinotopic to function specific coding principles that takeplace at the tectorotundal junction.
Spatial segregation of function
Electrophysiologic and behavioral data point to region-ally segregated subareas of processing for different visualfeatures such as color, luminance, or movement within therotundus (Wang et al., 1993). As this organization firsttakes place within this structure, it is probably estab-lished by a rearrangement of the ascending visual infor-mation flow between tectum and rotundus. The presentanatomical study shows that the functional segregationsof the rotundotriangular system receive a differential mix-ture of retinal input via five tectal layer 13 cell popula-tions and a divergent delayed inhibition via pretectalstructures (see below).
Retinal ganglion cells (RGCs) can be subdivided accord-ing to morphologic and physiologic criteria into differentclasses, each of which subserves a different function(O’Flaherty, 1971; Mori, 1973; Ramon y Cajal, 1973;Hayes and Holden, 1980; Ehrlich et al., 1987; Karten etal., 1990; Mpodozis et al., 1995). Different classes of avianRGCs terminate in a spatially segregated manner withinthe tectal layers 2–7 (Ramon y Cajal, 1995; Yamagata andSanes, 1995; Karten et al., 1997). Ultrastructural exami-nations have shown that these retinorecipient laminaereceive at least five different types of retinal input, whichare probably linked to different classes of RGCs (Reperantand Angaut, 1977). Therefore, retinorecipient laminae dif-fer in their visual input. Thus, the four different types oflayer 13 cell populations, which probably exhibit dendriticramifications within different retinorecipient laminae,probably process different aspects of vision. Therefore, itis conceivable that the differential rotundal projection pat-terns of these cell groups establish the morphologic basisfor segregated intrarotundal visual processing domains asshown in behavioral (Laverghetta and Shimizu, 1999) andelectrophysiologic examinations (Granda and Yazulla,1971; Jassik-Gerschenfeld and Guichard, 1972; Yazullaand Granda, 1973; Frost and DiFranco, 1976; Revzin,1979; Wang and Frost, 1992; Wang et al., 1993). Thus,tectofugal visual information processing seems to involveparallel stimulus analysis within several functional mod-ules, each characterized by specified sensory input bydistinct classes of RGCs and subsequent processing withindifferent layer 13 cell populations as well as regionaldomains of the diencephalon. Because of the topographi-cally ordered rotundal input to the ectostriatum (Benowitzand Karten, 1976; Nixdorf and Bischof, 1982) and thetopographic ectostriatal projections to subsequent regionsof the forebrain (Husband and Shimizu, 1999), the struc-tural and functional dissociations established at thetectorotundo/triangular junction should also persist athigher brain levels.
Different labeling patterns within thetectorotundo/triangular system
The organization of the tectorotundal projection in birdswas the subject of numerous former studies. Most of themagree in the observation of a heterogeneous constitution ofthe tectorotundal projection. Dependent on rotundaltracer injection sites, retrogradely labeled layer 13 neu-rons were observed to vary with respect to their somalocation within different layer 13 depths (Benowitz andKarten, 1976; Nixdorf and Bischof, 1982; Deng and Rog-ers, 1998), their dendritic ramification pattern (Karten etal., 1997; Luksch et al., 1998), and their distribution over
Fig. 6. Frontal planes of nucleus rotundus/triangularis with re-constructions of tracer injection sites, resulting in different tectallabeling patterns (I–V). The coordinate frame corresponds to thedorsoventral and mediolateral axis of the pigeon brain atlas (Kartenand Hodos, 1967). A: Gray areas merge all regions of rotundal tracerspread in animals that exhibited pure type I (n 5 4), type II (n 5 2),type III (n 5 1), type IV (n 5 3), and type V (n 5 3) labeling. Othercases exhibited a combination of two or more tectal labeling patternsas shown in B,C. B: Reconstruction of rotundal tracer spread in oneanimal with strong choleratoxin subunit B (CtB) labeling withintectal layers 5a and 5b (see micrograph D). The tectal labeling repre-sents a combination of the type I and IV patterns. This is also the casefor the intrarotundal CtB diffusion (gray areas) which cover wideregions of type I and IV termination areas (closed lines). C: Recon-struction of rotundal tracer spread in one animal with CtB labelingwithin tectal layers 3, 5a, and 5b (see micrograph E). The tectallabeling represents a combination of the type I, IV, and V patterns.This correlates with the intrarotundal CtB diffusion (gray areas),which combines wide regions of type I, IV, and V termination zones(closed lines). D: Micrograph of retrograde CtB labeling within outertectal layers 5a and 5b (cresyl violet counterstain). Rotundal tracerdiffusion is shown in B. Numbers indicate the tectal laminae. Barrepresents 50 mm. E: Micrograph of retrograde CtB labeling withinouter tectal layers 3, 5a, and 5b after a rotundal tracer injection (seeC). Numbers indicate the tectal laminae. Scale bar 5 50 mm.
103PARALLEL PROCESSING IN THE TECTOFUGAL SYSTEM

Fig. 7. Type III label within the lateral (left) and ventral tectum(right). Two different rotundal injection sites labeled somata withdendritic ramifications within retinorecipient layer 4. After cholera-toxin subunit B (CtB) injection restricted to the ventrolateral rotun-dus, few labeled fiber processes were filled within layers 4 and 7throughout the entire tectum (left). In one case with a caudocentralrotundal CtB injection, relatively strong fiber label was clearly re-
stricted to layer 4 of the ventral tectum (right), whereas dorsal areasexhibited clear type V label (compare also with Figs. 3 and 8). Uppermicrographs: Bar indicates 200 mm. Lower micrographs: Bar indi-cates 50 mm. Within each column left side represents combined CtB/cresyl staining, and right side portrays exactly corresponding soleCtB-label. Numbers indicate tectal laminae.
104 B. HELLMANN AND O. GUNTURKUN

Fig. 8. Type IV (left) and type V label (right) within the lateraltectum. Dorsomedial rotundal choleratoxin subunit B injections con-sistently resulted in labeling tectal somata within central and deepregions of layer 13. Dendritic fiber label was concentrated withinlayers 5a and 8. Tracer injections into the caudalmost rotundus re-sulted in labeling of somata within central to deep layer 13 (dorsaltectum) or deep layer 13 (ventral tectum). Fibers within the dorsal
tectum ramified within retinorecipient laminae 3, 5a, and 6, whereaswithin the ventral tectum, diffuse label was obvious in layers 3–5a(compare also with Fig. 3). Upper micrographs: Bar indicates 200 mm.Lower micrographs: Bar indicates 50 mm. Within each column leftside represents combined CtB/cresyl staining, and right side portraysexactly corresponding sole CtB-label. Numbers indicate tectal lami-nae.
105PARALLEL PROCESSING IN THE TECTOFUGAL SYSTEM

the tectal map (Karten et al., 1997). Karten and coworkers(1997) were the first who categorized different types ofascending tectal layer 13 projections based on theirunique connections within retinotectorotundal relay. Weapplied and elaborated this classification of layer 13 neu-rons.
Type I. The type I population projects onto the rostraland central rotundus. It is characterized by extensive fiberlabeling within retinorecipient sublayer 5b (Fig. 4). A com-parable labeling pattern was described by Karten andcoworkers (1997). An intracellular tracing study in thechicken demonstrated the characteristic widespread den-dritic ramifications of individual type I neurons, with mul-tiple radially oriented bottlebrush-like dendritic endingsin layer 5b (Luksch et al., 1998). The combination of wide-spread dendritic ramifications and small and interspacedindividual endings could constitute a morphologic basisfor the ability of deep tectal as well as second-order rotun-dal neurons to respond to very small moving objectswithin large receptive fields (Jassik-Gerschenfeld et al.,1970; Frost and DiFranco, 1976; Frost and Nakayama,1983; Wang et al., 1993; for discussion of this point seealso Luksch et al., 1998). The type I population seems tobe the most common and probably constitutes the largestrotundal visual processing domain. Wang and coworkers(1993) showed that nearly the entire ventral and centralrotundus process motion in two-dimensional space (2d).Because extent and location of this 2d-domain matchesthe extent of tracer injections resulting in type I labeling,it is conceivable that this cell class participates in 2dmotion analysis. Also, a second line of evidence points toan involvement of the type I population in motion process-ing. Based on anterograde and retrograde tracing of theretinotectal projection, Karten and coworkers (1997) con-cluded that tectal layer 5b receives input from small RGCswith narrow dendritic fields (w-5b type). Because this is byfar the most frequent RGC type, at least within the supe-rior retina (Karten et al., 1997), it might constitute themost frequent, movement-sensitive subtype of unitswithin the optic tract (Maturana and Frenk, 1963; Miles,1972, Varela et al., 1983; Mpodozis et al., 1995).
Type I neurons are four times more common withinventral tectal regions, representing the lower and frontalfield of view, pointing to visual field–dependent special-izations of information processing (Hamdi and Whit-teridge, 1954; Jassik-Gerschenfeld and Hardy, 1984;Remy and Gunturkun, 1991; Hellmann and Gunturkun,1999). Indeed, a recent behavioral study in pigeons coulddemonstrate the tectofugal pathway to be responsible forvisual acuity performance mainly within the frontal,lower field of view, whereas the thalamofugal pathwayguides lateral acuity (Gunturkun and Hahmann, 1999).Because the tectal type I population exhibits by far thestrongest numerical enhancement within the lower/frontal visual field representation, these behavioral dataindicate a contribution of type I neurons not only in 2dmotion analysis but also in acuity performance and pat-tern recognition.
It is presently unknown how tectal neurons with widedendritic ramifications covering substantial portions ofthe visual field might contribute to fine visual resolution.This problem, however, is not confined to type I. Alltectorotundo/triangular cells have extensive dendritic ar-bors, while they respond to small moving objects (Jassik-Gerschenfeld et al., 1970; Frost and DiFranco, 1976; Frost
et al., 1990). This seems to be a common problem in manyspecies that are capable of highly precise object localiza-tion even though the mesencephalic or telencephalic neu-rons involved in the sensory information processing haveremarkably large, overlapping receptive fields. Hinton etal. (1986) proposed a coarse coding mechanism as a pos-sible solution. In this model, the resolution is determinedby the number of different firing patterns in the neuralpopulation as a stimulus crosses the sensory space. Thisresults in large receptive fields yielding a high resolutionas long as they overlap extensively (but not completely)and therefore show a high number of encodings (Eurichand Schwegler, 1997). If coarse coding principles also ap-ply to the tectorotundo/triangular system, it would beconceivable how lamina 13 neurons with their wide den-dritic arbors could contribute to the high visual resolutionperformance of the tectofugal system.
In addition to motion detection, several behavioral stud-ies have shown the tectofugal pathway of grain-peckingbirds to be also essentially responsible for pattern recog-nition (Hodos and Karten, 1966; Hodos and Bonbright,1974; Macko and Hodos, 1984; Gunturkun and Hahmann,1999), which requires high spatial resolution by, in prin-ciple, narrowly tuned receptive fields of tectal output neu-rons. Recent electrophysiologic work (Schmidt et al., 1999)indicates that layer 13 neurons may respond to both sta-tionary objects within small central “hot spots“ as well asto fast moving stimuli within their much larger residualreceptive fields.
Type II. CtB injections into nucleus triangularis al-ways labeled the type II subset of layer 13 neurons,characterized by dendritic ramifications restricted tononretinorecipient layers 8 –12 (Fig. 4). Because somelayer 13 neurons receive not monosynaptic but disynap-tic and polysynaptic retinal input (Hardy et al., 1984;Leresche et al., 1986), type II cells nevertheless mightrelay visual input to triangularis. An earlier study sug-gested that the type II neurons also project onto caudalrotundus (Karten et al., 1997)—a pattern that we couldnot replicate. However, the present work cannot ruleout those projections, because the tectal type II labelingwas restricted to the deeper tectal layers and couldtherefore overlap with other tectal labeling patternswithout being easily distinguished. Until now, there hasbeen no functional characterization of the triangularis,but its widespread projections onto the entire telence-phalic ectostriatum, which contrasts with the topo-graphically arranged rotundoectostriatal projection(Benowitz and Karten, 1976; Nixdorf and Bischof,1982), might point to a modulatory role of this nucleusin tectofugal processing. Tectal input to nucleus trian-gularis exhibits complex regional variations, with areasreceiving an extremely dense innervation from layer 13cells of the ventral tectum, surrounded by regions withweaker dorsal tectal input (Hellmann and Gunturkun,1999). Therefore, the modulatory role of nucleus trian-gularis might be related to process alterations depen-dent on stimulus position within the visual field.
Type III. The type III population is characterized bydendritic ramifications limited to retinorecipient layers 4and, to a minor extent, to layer 7 (Fig. 7). Based on thischaracterization, a comparable cell type was shown inchicks on the basis of intracellular tracing (Luksch et al.,1998). The latter study could demonstrate that type IIIneurons display widespread dendritic arborizations with
106 B. HELLMANN AND O. GUNTURKUN

Fig. 9. Overall summary of retrograde tracing data. A: Differenttectal labeling patterns. Roman numbers I–V indicate the five-layer13 cell types. Black areas indicate tectal layers with high numbers ofthin fiber processes presumably showing postsynaptic swellings,whereas gray areas (type II) indicate layers with comparatively fewlabeled thin fibers. Arabic numbers indicate different tectal layers.B: Soma distribution over the flattened tectal surface for tectal layer13 cell types shown above. Numbers indicate the anterior–posteriorand dorsoventral position according to the pigeon brain atlas (Kartenand Hodos, 1967). P, posterior; A, anterior. Intensity of gray shadescorrelates with the quantitative shift of soma numbers along thedorsoventral extent of the tectum (see Results section). Type I somatashowed a clear peak within the ventral tectum (four times more cells)
and type V somata within the dorsal tectum (two times more cells).C: Different frontal planes of nucleus rotundus/triangularis with re-gions receiving differential tectal input. The coordinate frame corre-sponds to the dorsoventral and mediolateral axis of the pigeon brainatlas (Karten and Hodos, 1967). Roman numbers indicate tectal typeI–V input. II indication corresponds to the extension of nucleus tri-angularis. D: Different pretectal labeling patterns. Roman numbersrefer to tectal labeling. Ia and Ib: Varying pretectal soma distribu-tions but comparable tectal type I labeling (refers to Fig. 12A,B).Nucleus pretectalis (PT) showed diffuse fiber label in most cases withtectal type I and IV label. IPS, interstitio-pretectosubpretectalis; nTT,nucleus of the tectothalamic tract; SP, nuclei subpretectalis.

small, interspaced endings. Despite these similarities be-tween pigeons and chicks, soma location and intrarotun-dal projection patterns of type III seem to differ betweenthese species.
Type IV. The type IV population is characterized bydense dendritic ramifications within retinorecipient
sublayer 5a and nonretinorecipient layer 8 (Fig. 8).Thus, this newly described cell class might integrateboth direct and indirect retinal input. Axonal projec-tions of type IV neurons ramify within dorsal regions ofthe rostral and central rotundus, which was shown inelectrophysiologic studies to be highly sensitive for color
Fig. 10. Soma size diagram of different tectal layer 13 cell populations. Types I, II–IV, and V differedsignificantly, whereas types II, III, and IV exhibited no significant variations. Arrow points to thesubgroup of small type V neurons, located at the inner margin of layer 13 (see Fig. 11B).
TABLE 1. Summary of the Morphologic Properties of Different Tectal Layer 13 Cell Populations
TypePosition ontectal map1
Position withinlamina 132
Somasize (SD)
Dendriticarbors3 Rotundal domain4
Pretectalconnectivity5
Kartenet al.19976
Lukschet al.19986
I Ventral Superficial to central 228 (10.8) 5b Central to rostroventral SP or IPS and ventral SP Yes YesII Slightly ventral Entire 167 (12.7) 8–12 Triangularis IPS, nTT Yes YesIII Homogenous Entire and deep 173 (2.4) 4,7 Rostroventral IPS, dorsal SP (Yes)IV Slightly ventral Central and deep 167 (1.8) 5a,8 Dorsal IPSV Dorsal Entire and deep 156 (4.1) 3,5a,6 Caudal IPS, dorsal SP, nTT
1Position on tectal map describes the numerical distribution of cell bodies. Variations were observed along the tectal dorsoventral axis with more cells either in the ventral (typesI, II, and IV) or dorsal tectum (type V).2Position within lamina 13 summarizes the depth location of retrogradely labeled neurons (superficial 5 adjacent to layer 12, deep 5 near layer 14).3Dendritic arbors describe the dendritic ramification patterns within the 15 layers of the tectum.4Rotundal domain summarizes the presumed axonal projections onto different rotundal regions, based on the reconstruction of rotundal choleratoxin subunit B injection sitesresulting in differential retrograde tectal labeling.5Pretectal connectivity depicts the retrograde labeling in some pretectal nuclei (SP, nucleus subpretectalis; IPS, nucleus interstitiopretectosubpretectalis; nTT, nucleus of thetractus tectothalamicus).6The last two columns compare the actual data with recent observations of divergent tectal layer 13 cell morphology in the pigeon (Karten et al., 1997) and chicken (Luksch et al.,1998).
108 B. HELLMANN AND O. GUNTURKUN

and/or luminance variations of visual stimuli (Wang etal., 1993). Karten and coworkers (1997), however, sug-gested that the dorsal as well as the ventral rotundusare innervated by tectal type I cells. This discrepancymay be because of the comparatively thin layer 5a la-beling of type IV. Because it directly adjoins layer 5b,combined labeling patterns type I and type IV were onlyscarcely distinguishable from the sole type I pattern.Because type I and IV projection areas are directlyadjacent, the combined pattern always occurred afterdorsal rotundal CtB injections that included some ad-ditional tracer spread into the ventral subdivision. Thismay have caused the discrepancy between our data andthe results of Karten et al. (1997).
Type V. The type V population of tectal layer 13 neu-rons was exclusively labeled after CtB injections into thecaudalmost part of nucleus rotundus and was character-ized by dense dendritic ramifications within retinorecipi-ent layers 3, 5a, and 6. Anterograde tracing had demon-strated the caudal region as the only rotundal domain ofthe pigeon dominated by dorsal tectal input (Hellmannand Gunturkun, 1999). The present work confirms thesedata, because type V somata exhibit a twofold increasewithin the dorsal tectum, mapping the lateral and upperfield of view. Electrophysiologic work revealed the caudalrotundus to be specialized to three-dimensional motionanalysis (3d) (Wang et al., 1993), with some of these neu-rons especially computing time to collision for loomingstimuli (Wang and Frost, 1992). If type V cells wouldindeed contribute to analyzing motion in 3d, their differ-ential distribution over the tectal map might be an adap-tion to looming stimuli primary emerging within the up-per field of view. It is possible that the type V populationcan be subdivided further, because it was composed ofmedium-sized somata within central layer 13 and aunique very small cell group at the inner margin of layer13. The heterogeneous constitution of type V efferents isparalleled by differential physiological properties of rotun-dal looming sensitive neurons, each coding a differentoptical variable related to image expansion (Sun andFrost, 1998).
Comparison with other morphologic studieson the subdifferentiation of
nucleus rotundus
In addition to its hodologic and functional subdifferen-tiation, nucleus rotundus of grain-pecking birds can besubdivided on the basis of acetylcholinesterase (AchE)activity (Martinez-De-La-Torre et al., 1990), overall celldensity (Theiss et al., 1998), and differential expression ofvarious cadherins (Redies et al., 2000).
Within the rostral rotundus, the type I projection areaclearly coincides with the AChE rich, relatively cell poor,and N-cadherin expressing ventrolateral (Martinez-De-La-Torre et al., 1990), respectively, anterolateral (Redieset al., 2000) portion, whereas the type IV projection zonecorresponds to the AChE poor, cell rich, and N-cadherin,cadherin-6B, and cadherin–7 coexpressing anteromedialsubdivision. Nucleus triangularis, receiving only type IIinput, exhibits general cytoarchitectonic differentiationsin addition to specified AChE and cadherin expression(Benowitz and Karten, 1976; Nixdorf and Bischof, 1982).The caudal rotundus, receiving input by the type V cellpopulation, seems to be subdivided into three small re-gions (intermedial, posterolateral, parafascicular) withheterogeneous AChE and calbindin expression.
Pretectorutundal system
Deng and Rogers (1998) proposed a sixfold subdivisionof the tectorotundal system based on the location of tectalneurons in different layer 13 sublaminae and additionallyon rotundal input from some pretectal nuclei (SP, IPS, andnTT). These nuclei receive afferents from collaterals ofrotundally projecting tectal layer 13 neurons (Hunt andKunzle, 1976; Bischof and Niemann, 1990). Their ascend-ing projections constitute the major source of inhibitoryGABAergic input to the nucleus rotundus (Ngo et al.,1992; Mpodozis et al., 1996). In functional terms, Dengand Rogers’ (1998) sixfold subdifferentiation defines ro-tundal domains, characterized by both tectal excitation(Huang et al., 1998; Theiss et al., 1998) and by delayedpretectal inhibition (Gao et al., 1995). Our data supportDeng and Rogers’ observations, because specific retro-
Fig. 11. Type I (A) and type V (B) cell population within layer 13 of the tectum. Note the compara-tively small somata at the inner margin of layer 13 (arrows in B). Scale bar 5 100 mm.
109PARALLEL PROCESSING IN THE TECTOFUGAL SYSTEM

grade labeling of type I–V neurons was accompanied byvariations in labeling neurons of the SP/IPS/nTT complex(Figs. 9 and 12). Moreover, tectal type I labeling wasaccompanied by two different patterns of retrograde pre-tectal tracing (Fig. 9), suggesting a stronger rotundal re-gionalization than that solely based on differential tectalinput.
General considerations
This study shows a complex topographic organization ofthe tectorotundal connection in pigeons. Each point of thetectal space map gives rise to several independent projec-tions onto different rotundal domains, most of themmatching functional specializations. Based on the factthat each point of the tectal surface gives rise to projec-tions onto the entire nucleus rotundus, topographic placecoding seems to be more or less lost at rotundal level(Benowitz and Karten, 1976; Hunt and Kunzle, 1976; Nix-
dorf and Bischof, 1982; Ngo et al., 1994; Karten et al.,1997; Deng and Rogers, 1998). Conversely, behavioralstudies show that the tectofugal system preserves a highdegree of spatial resolution for moving as well as station-ary stimuli (Hodos and Karten, 1966; Hodos and Bon-bright, 1974; Macko and Hodos, 1984; Gunturkun andHahmann, 1999). If, however, rotundal subregions receiveinput from divergent tectal cell types with each of themhaving their own unique distribution on the tectal map, itis possible that each rotundal domain preserves its ownretinotopy.
In all amniotes studied so far, visual input is trans-ferred via two pathways onto the forebrain. In birds, theseare the tectofugal and thalamofugal systems, which areprobably equivalent to the extrageniculocortical andgeniculocortical pathways in mammals, respectively(Gunturkun, 2000). Behavioral, electrophysiologic, andanatomic data increasingly prove the existence of func-
Fig. 12. Different retrograde labeling patterns within the pretec-tal nuclei subpretectalis (SP), interstitio-pretectosubpretectalis (IPS),and nucleus of the tectothalamic tract (nTT). A: Distribution of cellsafter a rostral rotundal choleratoxin subunit B injection. PT, nucleuspretectalis. B: Cells labeled after a central rotundal injection.
C: Pretectal cells after a tracer injection into nucleus triangularis (5tectal type II labeling). A1B: in both cases, tectal layer 13 neuronsexhibited type I labeling, whereas pretectal somata exhibited varyingdistributions in different nuclei. Scale bar 5 1,000 mm.
110 B. HELLMANN AND O. GUNTURKUN

tional segregation and parallel processing within the tec-tofugal visual system of birds. This also applies for thegeniculocortical pathway in mammals (for review see Liv-ingstone and Hubel, 1988). Because both systems seem toprocess visual features in parallel, this might be a princi-pal feature of visual analysis at higher brain levels, prob-ably based on the functional differentiation of RGCs, com-mon to all tetrapodes.
ACKNOWLEDGMENTS
We thank Ariane Schwarz for excellent technical assis-tance, Niko Troje for critically reading the manuscript,and Martina Manns for many helpful discussions.
LITERATURE CITED
Acheson DW, Kemplay SK, Webster KE. 1980. Quantitative analysis ofoptic terminal profile distribution within the pigeon optic tectum. Neu-roscience 5:1067–1084.
Adams JC. 1981. Heavy metal intensification of DAB-based HRP reactionproduct. J Histochem Cytochem 29:775.
Benowitz LI, Karten HJ. 1976. Organization of tectofugal visual pathwayin pigeon: retrograde transport study. J Comp Neurol 167:503–520.
Bessette BB, Hodos W. 1989. Intensity, color, and pattern discriminationdeficits after lesions of the core and the belt regions of the ectostriatum.Vis Neurosci 2:27–34.
Bischof H-J, Niemann J. 1990. Contralateral projection of the optic tectumin the zebra finch (Taenopygia guttata castanotis). Cell Tissue Res262:307–313.
Deng C, Rogers LJ. 1998. Organisation of the tectorotundal and SP/IPS-rotundal projections in the chick. J Comp Neurol 394:171–185.
Duff TA, Scott G, Mai R. 1981. Regional differences in pigeon optic tract,chiasm, and retino-receptive layers of optic tectum. J Comp Neurol198:231–247.
Ehrlich D, Keyser KT, Karten HJ. 1987. Distribution of substance P-likeimmunoreactive retinal ganglion cells and their pattern of terminationin the optic tectum of chick (Gallus gallus). J Comp Neurol 266:220–233.
Eurich CW, Schwegler H. 1997. Coarse coding: calculation of the resolutionachieved by a population of large receptive field neurons. Biol Cybern76:357–363.
Eurich CW, Schwegler H, Woesler R. 1997. Coarse coding: applications tothe visual system of salamanders. Biol Cybern 77:41–47.
Frost BJ, DiFranco DE. 1976. Motion characteristics of single units in thepigeon optic tectum. Vision Res 16:1229–1234.
Frost BJ, Nakayama K. 1983. Single visual neurons code opposing motionindependent of direction. Science 220:744–745.
Frost BJ, Wylie DR, Want Y-C. 1990. The processing of object and self-motion in the tectofugal and accessory optic pathway of birds. VisionRes 30:1677–1688.
Gao HF, Wu GY, Frost BJ, Wang SR. 1995. Excitatory and inhibitoryneurotransmitters in the nucleus rotundus of pigeons. Vis Neurosci12:819–825.
Granda AM, Yazulla S. 1971. The spectral sensitivity of single units in thenucleus rotundus of pigeon, Columba livia. J Gen Physiol 57:363–384.
Gunturkun O, Hahmann U. 1999. Functional subdivisions of the ascendingvisual pathways in the pigeon. Behav Brain Res 98:193–201.
Gunturkun O. 2000. Sensory physiology: vision. In: Whittow GC, editor.Sturkie’s avian physiology, fifth edition. San Diego: Academic Press.p 1–19.
Hamdi FA, Whitteridge D. 1954. The representation of the retina on theoptic tectum of the pigeon. Q J Exp Psychol 39:111–119.
Hardy O, Leresche N, Jassik-Gerschenfeld D. 1984. Postsynaptic poten-tials in neurons of the pigeon’s optic tectum in response to afferentstimulation from the retina and other visual structures: an intracellu-lar study. Brain Res 311:65–74.
Hayes BP, Holden AL. 1980. Size classes of ganglion cells in the centralyellow field of the pigeon retina. Exp Brain Res 39:269–275.
Hayes BP, Webster KE. 1985. Cytoarchitectural fields and retinal termi-
nation: an axonal transport study of laminar organization in the avianoptic tectum. Neuroscience 16:641–657.
Hellmann B, Gunturkun O. 1999. Visual-field-specific heterogeneitywithin the tecto-rotundal projection of the pigeon. Eur J Neurosci11:2635–2650.
Hinton GE, McClelland JL, Rumelhart DE. 1986. Distributed representa-tions. In: Rumelhart DE, McClelland JL, editors. Parallel distributedprocessing, vol 1. Cambridge, MA: MIT Press. p 77–109.
Hodos W. 1969. Color-discrimination deficits after lesions of the nucleusrotundus in pigeons. Brain Behav Evol 2:185–200.
Hodos W, Bonbright JC. 1974. Intensity difference thresholds in pigeonsafter lesions of the tectofugal and thalamofugal visual pathways.J Comp Physiol Psychol 87:1013–1031.
Hodos W, Karten HJ. 1966. Brightness and pattern discrimination deficitsafter lesions of nucleus rotundus in the pigeon. Exp Brain Res 2:151–167.
Hodos W, Macko KA, Bessette BB. 1984. Near-field acuity changes aftervisual system lesions in pigeons. II. Telencephalon. Behav Brain Res13:15–30.
Huang LH, Li JL, Wang SR. 1998. Glutamatergic neurotransmission fromthe optic tectum to the contralateral nucleus rotundus in pigeons.Brain Behav Evol 52:55–60.
Hunt SP, Kunzle H. 1976. Observations on the projections and intrinsicorganization of the pigeon optic tectum: an autoradiographic studybased on anterograde and retrograde, axonal and dendritic flow.J Comp Neurol 170:153–172.
Hunt SP, Brecha N. 1984. The avian optic tectum: a synthesis of morphol-ogy and biochemistry. In: Vanegas H, editor. Comparative neurology ofthe optic tectum. New York: Plenum Press. p 619–648.
Husband SA, Shimizu T. 1999. Efferent projections of the ectostriatum inthe pigeon (Columba livia). J Comp Neurol 406:329–345.
Jassik-Gerschenfeld D, Guichard J. 1972. Visual receptive fields of singlecells in the pigeon’s optic tectum. Brain Res 40:303–317.
Jassik-Gerschenfeld D, Hardy O. 1984. The avian optic tectum: neurophys-iology and behavioural correlations. In: Vanegas H, editor. Compara-tive neurology of the optic tectum. New York: Plenum Press. p 649–686.
Jassik-Gerschenfeld D, Minios F, Cond-Courtine F. 1970. Receptive fieldproperties of directionally selective units in the pigeon’s optic tectum.Brain Res 24:407–421.
Karten HJ, Hodos W. 1967. A stereotaxic atlas of the brain of the pigeon.Baltimore: Johns Hopkins Press.
Karten HJ, Revzin AM. 1966. The afferent connections of the nucleusrotundus in the pigeon. Brain Res 2:368–377.
Karten HJ, Keyser KT, Brecha N. 1990. Biochemical and morphologicalheterogeneity of retinal ganglion cells. In: Cohen B, Bodis-Wollner I,editors. Vision and the brain. New York: Raven Press. p 19–33.
Karten HJ, Cox K, Mpodozis J. 1997. Two distinct populations of tectalneurons have unique connections within the retinotectorotundal path-way of the pigeon (Columba livia). J Comp Neurol 387:449–465.
Laverghetta AV, Shimizu T. 1999. Visual discrimination in the pigeon(Columba livia): effects of selective lesions of the nucleus rotundus.Neuroreport 10:981–985.
Leresche N, Hardy O, Audinat E, Jassik-Gerschenfeld D. 1986. Synaptictransmission of excitation from the retina to cells in the pigeon’s optictectum. Brain Res 365:138–144.
Livingstone M, Hubel D. 1988. Segregation of form, color, movement anddepth: anatomy, physiology and perception. Science 240:740–749.
Luksch H, Cox K, Karten HJ. 1998. Bottlebrush dendritic endings andlarge dendritic fields: motion-detecting neurons in the tectofugal path-way. J Comp Neurol 396:399–414.
Macko KA, Hodos W. 1984. Near-field acuity after visual system lesions inpigeons. I. Thalamus. Behav Brain Res 13:1–14.
Martinez-De-La-Torre M, Martinez S, Puelles L. 1990. Acetylcholinesterase-histochemical differential staining of subdivisions within the nucleus ro-tundus in the chick. Anat Embryol 181:129–135.
Maturana HR, Frenk S. 1963. Directional movement and horizontal edgedetectors in the pigeon. Science 142:977–979.
Miles FA. 1972. Centrifugal control of the avian retina. I. Receptive fieldproperties of retinal ganglion cells. Brain Res 48:65–92.
Mori S. 1973. Analysis of field response in the optic tectum of the pigeon.Brain Res 54:193–206.
Mpodozis J, Letelier J-C, Concha ML, Maturana H. 1995. Conduction
111PARALLEL PROCESSING IN THE TECTOFUGAL SYSTEM

velocity groups in the retino-tectal and retino-thalamic visual path-ways of the pigeon (Columba livia). Intern J Neurosci 81:123–136.
Mpodozis J, Cox K, Shimizu T, Bischof HJ, Woodson W, Karten HJ. 1996.GABAergic inputs to the nucleus rotundus (pulvinar inferior) of thepigeon (Columba livia). J Comp Neurol 374:204–222.
Mulvanny P. 1979. Discrimination of line orientation by visual nuclei. In:Granda AM, Maxwell JM, editors. Neural mechanisms of behavior inthe pigeon. New York: Plenum Press. p 199–222.
Ngo TD, Nemeth A, Tombol T. 1992. Some data on GABA-ergic innervationof nucleus rotundus in chicks. J Hirnforsch 33:335–355.
Ngo TD, Davies DC, Egedi GY, Tombol T. 1994. A phaseolus lectin antero-grade tracing study of the tectorotundal projections in the domesticchick. J Anat 184:129–136.
Nixdorf BE, Bischof HJ. 1982. Afferent connections of the ectostriatum andvisual wulst in the zebrafinch (Taeniopygia guttata castanotisGould)—an HRP study. Brain Res 248:9–17.
O’Flaherty JJ. 1971. A golgi analysis of the optic tectum of the mallardduck. J Hirnforsch 12:389–404.
Ramon Y Cajal S. 1973. The vertebrate retina. In: Rodieck RW, editor. Thevertebrate retina: principles of structure and function. San Francisco:Freeman. p 733–904.
Ramon y Cajal S. 1995. Histology of the nervous system of man andvertebrates, vol 2. Oxford: Oxford University Press.
Redies C, Ast M, Nakagawa S, Takeichi M, Martinez-De-La-Torre M,Puelles L. 2000. Morphological fate of diencephalic prosomeres andtheir subdivisions revealed by mapping cadherin expression. J CompNeurol 421:481–514.
Remy M, Gunturkun O. 1991. Retinal afferents to the tectum opticum and then. opticus principalis thalami in the pigeon. J Comp Neurol 305:57–70.
Reperant J, Angaut P. 1977. The retinotectal projections in the pigeon. An exper-imental optical and electron microscope study. Neuroscience 2:119–140.
Revzin AM. 1979. Functional localization in the nucleus rotundus. In:Granda AM, Maxwell HJ, editors. Neural mechanisms of behavior inthe pigeon. New York: Plenum Press. p 165–175.
Schmidt A, Engelage J, Bischof H-J. 1999. Neurons with complex receptivefields in the deeper layers of the zebra finch optic tectum. In: Elsner N,Eysel U, editors. Proceedings of the 1st Gottingen Conference of theGerman Neuroscience Society 1999, vol 2. Stuttgart, New York:Thieme. p 470.
Shimizu T, Karten HJ. 1993. The avian visual system and the evolution ofthe neocortex. In: Zeigler HP, Bischof H-J, editors. Vision, brain andbehavior in birds. Cambridge, MA: MIT Press. p 104–114.
Shu SY, Ju G, Fan L. 1988. The glucose oxidase-DAB-nickel method inperoxidase histochemistry of the nervous system. Neurosci Lett 85:169–171.
Sun H, Frost BJ. 1998. Computation of different optical variables of loom-ing objects in pigeon nucleus rotundus. Nat Neurosci 1:296–303.
Theiss C, Hellmann B, Gunturkun O. 1998. The differential distribution ofAMPA-receptor subunits in the tectofugal system of the pigeon. BrainRes 785:114–128.
Vallortigara G. 1989. Behavioral asymmetries in visual learning of youngchickens. Physiol Behav 45:797–800.
Varela F, Letelier JC, Marin G, Maturana HR. 1983. The neurophysiologyof avian color vision. Arch Biol Med Exp 16:291–303.
Wang Y, Frost BJ. 1992. Time to collision is signalled by neurons in thenucleus rotundus of pigeons. Nature 356:236–238.
Wang Y, Jiang S, Frost BJ. 1993. Visual processing in pigeon nucleusrotundus: luminance, color, motion, and looming subdivisions. Vis Neu-rosci 10:21–30.
Watanabe S. 1991. Effects of ectostriatal lesions on natural concept,pseudoconcept, and artificial pattern discrimination in pigeons. VisNeurosci 6:497–506.
Yamagata M, Sanes JR. 1995. Target-independent diversification andtarget-specific projection of chemically defined retinal ganglion cellsubsets. Development 121:3763–3776.
Yazulla S, Granda AM. 1973. Opponent-color units in the thalamus of thepigeon (Columba livia). Vision Res 13:1555–1563.
112 B. HELLMANN AND O. GUNTURKUN


![Dimensional Synthesis of Parallel Robots: Unified ... · The structural synthesis of parallel robots by means of screw theory [1] or evolutionary morphology [2] has pro-duced a variety](https://img.dokumen.tips/doc/110x75/5fc62ea974de166e09498062/dimensional-synthesis-of-parallel-robots-unified-the-structural-synthesis-of.jpg)