Embed Size (px)
Citation preview
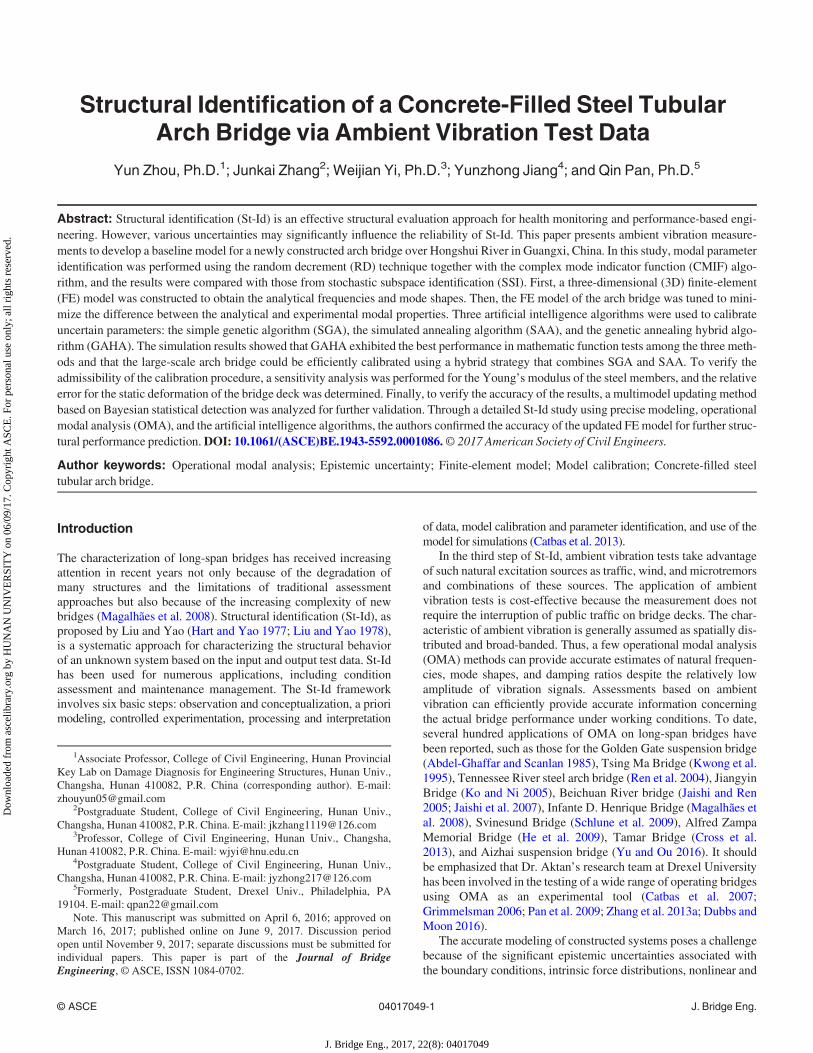
Structural Identification of a Concrete-Filled Steel TubularArch Bridge via Ambient Vibration Test Data
Yun Zhou, Ph.D.1; Junkai Zhang2; Weijian Yi, Ph.D.3; Yunzhong Jiang4; and Qin Pan, Ph.D.5
Abstract: Structural identification (St-Id) is an effective structural evaluation approach for health monitoring and performance-based engi-neering. However, various uncertainties may significantly influence the reliability of St-Id. This paper presents ambient vibration measure-ments to develop a baseline model for a newly constructed arch bridge over Hongshui River in Guangxi, China. In this study, modal parameteridentification was performed using the random decrement (RD) technique together with the complex mode indicator function (CMIF) algo-rithm, and the results were compared with those from stochastic subspace identification (SSI). First, a three-dimensional (3D) finite-element(FE) model was constructed to obtain the analytical frequencies and mode shapes. Then, the FE model of the arch bridge was tuned to mini-mize the difference between the analytical and experimental modal properties. Three artificial intelligence algorithms were used to calibrateuncertain parameters: the simple genetic algorithm (SGA), the simulated annealing algorithm (SAA), and the genetic annealing hybrid algo-rithm (GAHA). The simulation results showed that GAHA exhibited the best performance in mathematic function tests among the three meth-ods and that the large-scale arch bridge could be efficiently calibrated using a hybrid strategy that combines SGA and SAA. To verify theadmissibility of the calibration procedure, a sensitivity analysis was performed for the Young’s modulus of the steel members, and the relativeerror for the static deformation of the bridge deck was determined. Finally, to verify the accuracy of the results, a multimodel updating methodbased on Bayesian statistical detection was analyzed for further validation. Through a detailed St-Id study using precise modeling, operationalmodal analysis (OMA), and the artificial intelligence algorithms, the authors confirmed the accuracy of the updated FEmodel for further struc-tural performance prediction.DOI: 10.1061/(ASCE)BE.1943-5592.0001086.© 2017 American Society of Civil Engineers.
Author keywords: Operational modal analysis; Epistemic uncertainty; Finite-element model; Model calibration; Concrete-filled steeltubular arch bridge.
Introduction
The characterization of long-span bridges has received increasingattention in recent years not only because of the degradation ofmany structures and the limitations of traditional assessmentapproaches but also because of the increasing complexity of newbridges (Magalhães et al. 2008). Structural identification (St-Id), asproposed by Liu and Yao (Hart and Yao 1977; Liu and Yao 1978),is a systematic approach for characterizing the structural behaviorof an unknown system based on the input and output test data. St-Idhas been used for numerous applications, including conditionassessment and maintenance management. The St-Id frameworkinvolves six basic steps: observation and conceptualization, a priorimodeling, controlled experimentation, processing and interpretation
of data, model calibration and parameter identification, and use of themodel for simulations (Catbas et al. 2013).
In the third step of St-Id, ambient vibration tests take advantageof such natural excitation sources as traffic, wind, and microtremorsand combinations of these sources. The application of ambientvibration tests is cost-effective because the measurement does notrequire the interruption of public traffic on bridge decks. The char-acteristic of ambient vibration is generally assumed as spatially dis-tributed and broad-banded. Thus, a few operational modal analysis(OMA) methods can provide accurate estimates of natural frequen-cies, mode shapes, and damping ratios despite the relatively lowamplitude of vibration signals. Assessments based on ambientvibration can efficiently provide accurate information concerningthe actual bridge performance under working conditions. To date,several hundred applications of OMA on long-span bridges havebeen reported, such as those for the Golden Gate suspension bridge(Abdel-Ghaffar and Scanlan 1985), Tsing Ma Bridge (Kwong et al.1995), Tennessee River steel arch bridge (Ren et al. 2004), JiangyinBridge (Ko and Ni 2005), Beichuan River bridge (Jaishi and Ren2005; Jaishi et al. 2007), Infante D. Henrique Bridge (Magalhães etal. 2008), Svinesund Bridge (Schlune et al. 2009), Alfred ZampaMemorial Bridge (He et al. 2009), Tamar Bridge (Cross et al.2013), and Aizhai suspension bridge (Yu and Ou 2016). It shouldbe emphasized that Dr. Aktan’s research team at Drexel Universityhas been involved in the testing of a wide range of operating bridgesusing OMA as an experimental tool (Catbas et al. 2007;Grimmelsman 2006; Pan et al. 2009; Zhang et al. 2013a; Dubbs andMoon 2016).
The accurate modeling of constructed systems poses a challengebecause of the significant epistemic uncertainties associated withthe boundary conditions, intrinsic force distributions, nonlinear and
1Associate Professor, College of Civil Engineering, Hunan ProvincialKey Lab on Damage Diagnosis for Engineering Structures, Hunan Univ.,Changsha, Hunan 410082, P.R. China (corresponding author). E-mail:[email protected]
2Postgraduate Student, College of Civil Engineering, Hunan Univ.,Changsha, Hunan 410082, P.R. China. E-mail: [email protected]
3Professor, College of Civil Engineering, Hunan Univ., Changsha,Hunan 410082, P.R. China. E-mail: [email protected]
4Postgraduate Student, College of Civil Engineering, Hunan Univ.,Changsha, Hunan 410082, P.R. China. E-mail: [email protected]
5Formerly, Postgraduate Student, Drexel Univ., Philadelphia, PA19104. E-mail: [email protected]
Note. This manuscript was submitted on April 6, 2016; approved onMarch 16, 2017; published online on June 9, 2017. Discussion periodopen until November 9, 2017; separate discussions must be submitted forindividual papers. This paper is part of the Journal of BridgeEngineering, © ASCE, ISSN 1084-0702.
© ASCE 04017049-1 J. Bridge Eng.
J. Bridge Eng., 2017, 22(8): 04017049
Dow
nloa
ded
from
asc
elib
rary
.org
by
HU
NA
N U
NIV
ER
SIT
Y o
n 06
/09/
17. C
opyr
ight
ASC
E. F
or p
erso
nal u
se o
nly;
all
righ
ts r
eser
ved.
nonstationary behaviors, and material and cross-sectional proper-ties. Oberkampf (2005) defined two types of uncertainties: episte-mic uncertainty and aleatory uncertainty. Epistemic uncertainty iscaused by a lack of knowledge of the quantities or processes of thesystem or the environment and is also referred to as subjectiveuncertainty, reducible uncertainty, and model uncertainty (Cilogluet al. 2012). Aleatory uncertainty is an inherent variation associatedwith the physical system or the environment and is also referred toas variability, irreducible uncertainty, stochastic uncertainty, andrandom uncertainty. Moon and Aktan (2006) conducted a detailedreview of the impact that uncertainty has on the St-Id of constructedsystems. Pan et al. (2009) discussed various sources of epistemicuncertainty and described mitigation approaches based on the St-Idof a long-span steel arch bridge. Ciloglu et al. (2012) designed aphysical laboratory model to simulate four key sources of epistemicuncertainty representing the primary test variables. The results dem-onstrated that proven and accepted data-preprocessing techniquesand modal parameter-identification algorithms can significantlybias OMA results when used in certain combinations under differ-ent structural and excitation conditions.
In the fifth step of St-Id, updating of the finite-element (FE) modelentails tuning the model so that it can better reflect the measured datafrom the physical structure being modeled (Friswell andMottershead1995). Model-updating methods can basically be classified as directmethods and iterative methods based on whether the methods modifythe elements of the system matrices (mass, stiffness and possiblydamping matrices) directly or tune model parameters (e.g., structuralgeometric and material parameters) iteratively. In general, the opti-mum solution can be obtained by using least-squares minimizationoptimizationmethods, andmethodologies based on heuristic stochas-tic algorithms to solve the optimization problem in St-Id have beenemployed in recent years; among them, simple genetic algorithms(SGAs), particle swarm optimization (PSO), ant colony optimization(ACO), artificial neural networks (ANNs), evolutionary strategy(ES), and differential evolution (DE) algorithms have gained increas-ing attention (Sun et al. 2013). Sun and Betti (2015) proposed ahybrid approach that is a combination of a modified artificial beecolony (MABC) algorithm and the Broyden–Fletcher–Goldfarb–Shannon (BFGS) method. Koh et al. (2003) proposed a hybrid com-putational strategy combining a genetic algorithm (GA) with a com-patible local search operator for large-structure parameter identifica-tion. Wang (2009) developed a hybrid GA integrated with the Gauss–Newton method to identify the structural system. The classic GAand the simulated annealing algorithm (SAA) are acknowledged tooffer certain advantages and have been applied to many practicalproblems, such as bridge maintenance and scour-depth prediction atbridge piers (Azamathulla et al. 2010; Furuta et al. 2014). The appli-cation of hybrid GA has obvious advantages over the classic GAmethod. When updating the high-fidelity FE model of the complexbridge structure, the high-resolution FE model is constructed on theplatform of the FE packages, whereas the advanced optimizationtechniques, such as the GAmethod, can be easily implemented in nu-merical software such asMATLAB (Wan and Ren 2015). Sanayei etal. (2015) and Sipple and Sanayei (2014) developed a frequency-response function-based parameter-estimation method for model cal-ibration of a full-scale bridge; they then developed a robust multiple-response structural parameter-estimation method for the automatedFE model updating. They used PARIS as the automated FE modelcalibration code for full-scale structures, and the application pro-gramming interface (API) technique allowed real-time exchange ofinformation between MATLAB and SAP2000 during the iterativestages and the updating of model parameters in the optimizationprocess.
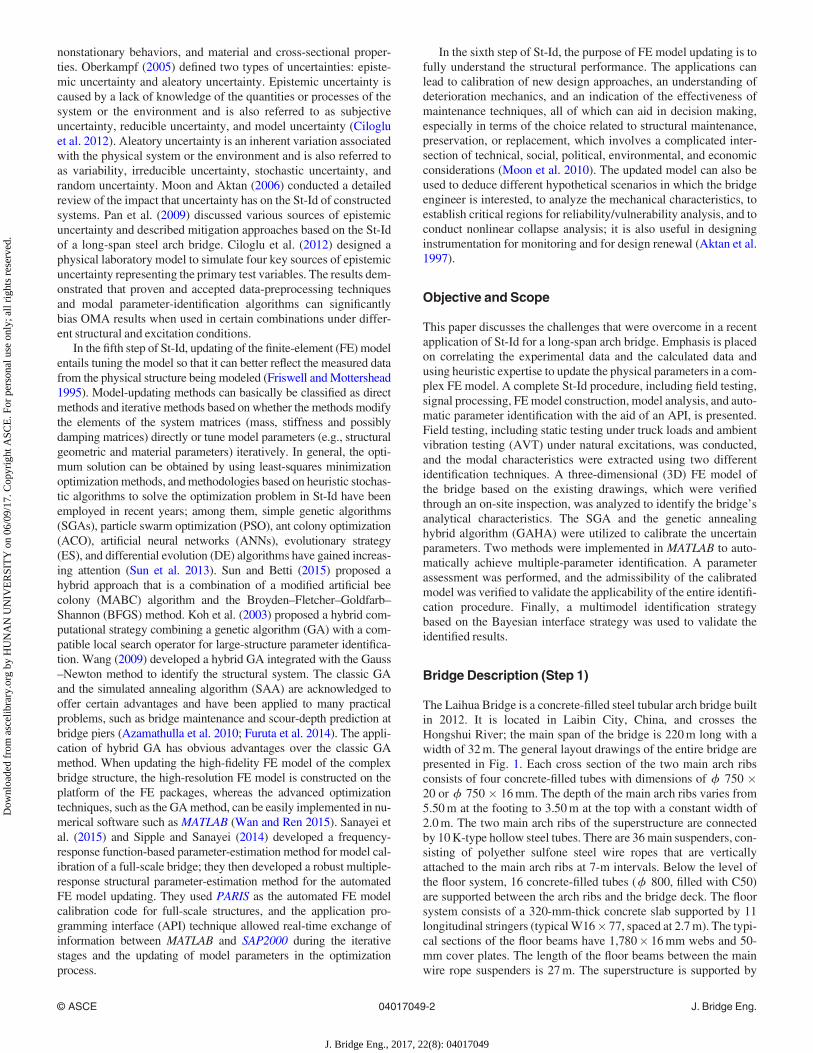
In the sixth step of St-Id, the purpose of FE model updating is tofully understand the structural performance. The applications canlead to calibration of new design approaches, an understanding ofdeterioration mechanics, and an indication of the effectiveness ofmaintenance techniques, all of which can aid in decision making,especially in terms of the choice related to structural maintenance,preservation, or replacement, which involves a complicated inter-section of technical, social, political, environmental, and economicconsiderations (Moon et al. 2010). The updated model can also beused to deduce different hypothetical scenarios in which the bridgeengineer is interested, to analyze the mechanical characteristics, toestablish critical regions for reliability/vulnerability analysis, and toconduct nonlinear collapse analysis; it is also useful in designinginstrumentation for monitoring and for design renewal (Aktan et al.1997).
Objective and Scope
This paper discusses the challenges that were overcome in a recentapplication of St-Id for a long-span arch bridge. Emphasis is placedon correlating the experimental data and the calculated data andusing heuristic expertise to update the physical parameters in a com-plex FE model. A complete St-Id procedure, including field testing,signal processing, FEmodel construction, model analysis, and auto-matic parameter identification with the aid of an API, is presented.Field testing, including static testing under truck loads and ambientvibration testing (AVT) under natural excitations, was conducted,and the modal characteristics were extracted using two differentidentification techniques. A three-dimensional (3D) FE model ofthe bridge based on the existing drawings, which were verifiedthrough an on-site inspection, was analyzed to identify the bridge’sanalytical characteristics. The SGA and the genetic annealinghybrid algorithm (GAHA) were utilized to calibrate the uncertainparameters. Two methods were implemented in MATLAB to auto-matically achieve multiple-parameter identification. A parameterassessment was performed, and the admissibility of the calibratedmodel was verified to validate the applicability of the entire identifi-cation procedure. Finally, a multimodel identification strategybased on the Bayesian interface strategy was used to validate theidentified results.
Bridge Description (Step 1)
The Laihua Bridge is a concrete-filled steel tubular arch bridge builtin 2012. It is located in Laibin City, China, and crosses theHongshui River; the main span of the bridge is 220m long with awidth of 32m. The general layout drawings of the entire bridge arepresented in Fig. 1. Each cross section of the two main arch ribsconsists of four concrete-filled tubes with dimensions of f 750 �20 or f 750 � 16mm. The depth of the main arch ribs varies from5.50m at the footing to 3.50m at the top with a constant width of2.0m. The two main arch ribs of the superstructure are connectedby 10K-type hollow steel tubes. There are 36main suspenders, con-sisting of polyether sulfone steel wire ropes that are verticallyattached to the main arch ribs at 7-m intervals. Below the level ofthe floor system, 16 concrete-filled tubes (f 800, filled with C50)are supported between the arch ribs and the bridge deck. The floorsystem consists of a 320-mm-thick concrete slab supported by 11longitudinal stringers (typicalW16� 77, spaced at 2.7m). The typi-cal sections of the floor beams have 1,780� 16mm webs and 50-mm cover plates. The length of the floor beams between the mainwire rope suspenders is 27m. The superstructure is supported by
© ASCE 04017049-2 J. Bridge Eng.
J. Bridge Eng., 2017, 22(8): 04017049
Dow
nloa
ded
from
asc
elib
rary
.org
by
HU
NA
N U
NIV
ER
SIT
Y o
n 06
/09/
17. C
opyr
ight
ASC
E. F
or p
erso
nal u
se o
nly;
all
righ
ts r
eser
ved.

expansion bearings, and the arches are supported on massive con-crete blocks.
FEModeling (Step 2)
Bridge Modeling
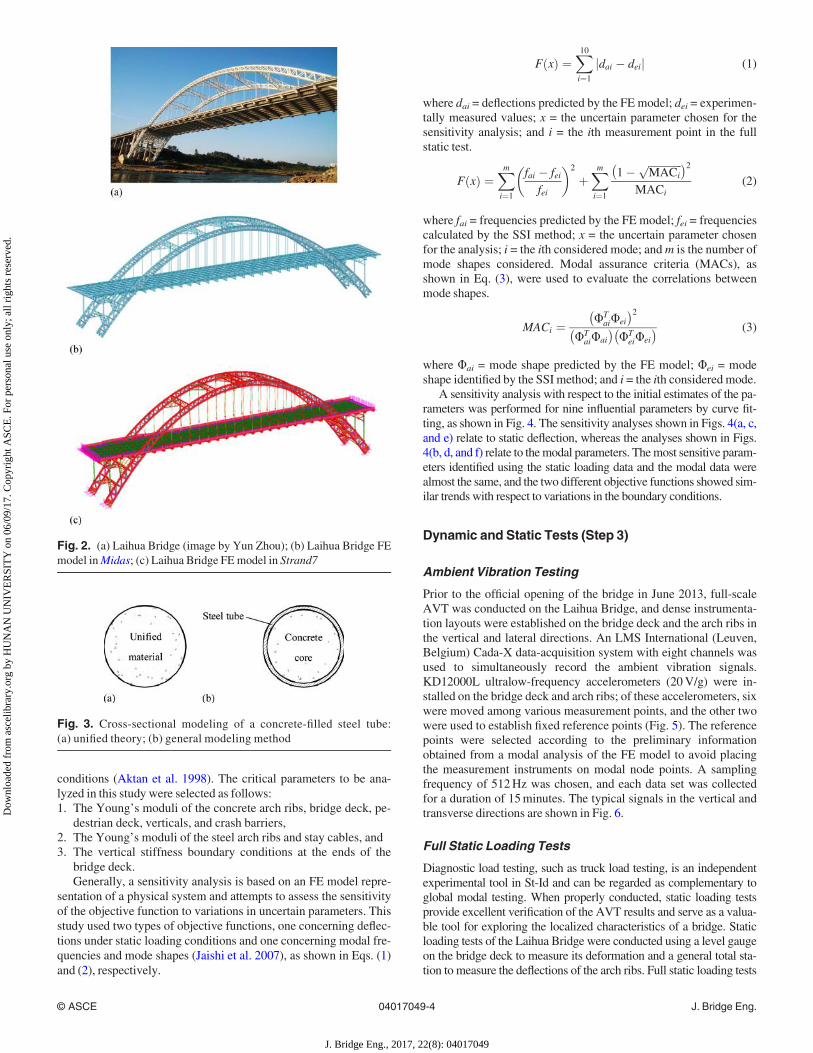
Building accurate FE models is one of the main challenges in struc-tural analysis. Rational FE modeling must strike a balance betweenaccuracy and calculation efficiency. To mitigate modeling uncer-tainty, the geometry and member details of FE models should beconstructed in strict accordance with the design blueprints and fieldinspection. An element-level 3D FE model was constructed inStrand7 analysis software, as shown in Fig. 2. The FE model had atotal of 19,004 nodes, 22,972 beam elements, and 2,256 shell ele-ments. The main structural members were cables, girders, floorbeams, a concrete slab, and arches. The RC deck was discretizedusing shell elements with six degrees of freedom (DOF) at eachnode. Space frame elements were used to represent the deck string-ers, floor beams, verticals, handrails, crash barriers, cushion caps,and arch ribs of the substructures, and the bracings were modeled
using link elements to mimic the actual end connections. Both thecross girders and arch ribs of the bridge consist of variable sections,which were accurately simulated in the model. The 61 PES-7-061Type (GB/T 18365-2001) strand cables were modeled in Strand7using 3D tension-only beam elements. The main arch is anchored inmassive concrete blocks set on rock; fixed bearings are used for thearches, whereas expansion bearings are used for the bridge deck.Generally, there are two kinds of modeling strategies to model theconcrete-filled steel tubes, unified modeling theory (Zhong 2003)and the general modeling theory, as shown in Fig. 3. After compari-son of the predicted results of the modal information and staticdeflection, the general modeling theory, which simulates the crosssection as separate sections for the steel tube and the concrete core,was chosen for the following model-updating analysis.
Sensitivity Analysis
The parameters that the modeling results were most sensitive towere identified to allow the FE model to be iteratively updated; thisprocedure is typically referred to as sensitivity analysis–basedmodel calibration. In general, the parameters to which a structuralmodel are most sensitive are the material properties and boundary
(a)
(b)
(c)
Fig. 1. Structural layout plan of Laihua Bridge: (a) elevation view; (b) plan view; (c) detailed cross-sectional drawings (Note: w 351� 10 means asteel tube with a diameter of 351mm and a thickness of 10mm)
© ASCE 04017049-3 J. Bridge Eng.
J. Bridge Eng., 2017, 22(8): 04017049
Dow
nloa
ded
from
asc
elib
rary
.org
by
HU
NA
N U
NIV
ER
SIT
Y o
n 06
/09/
17. C
opyr
ight
ASC
E. F
or p
erso
nal u
se o
nly;
all
righ
ts r
eser
ved.
conditions (Aktan et al. 1998). The critical parameters to be ana-lyzed in this study were selected as follows:1. The Young’s moduli of the concrete arch ribs, bridge deck, pe-
destrian deck, verticals, and crash barriers,2. The Young’s moduli of the steel arch ribs and stay cables, and3. The vertical stiffness boundary conditions at the ends of the
bridge deck.Generally, a sensitivity analysis is based on an FE model repre-
sentation of a physical system and attempts to assess the sensitivityof the objective function to variations in uncertain parameters. Thisstudy used two types of objective functions, one concerning deflec-tions under static loading conditions and one concerning modal fre-quencies and mode shapes (Jaishi et al. 2007), as shown in Eqs. (1)and (2), respectively.
F xð Þ ¼X10i¼1
jdai � deij (1)
where dai = deflections predicted by the FE model; dei = experimen-tally measured values; x = the uncertain parameter chosen for thesensitivity analysis; and i = the ith measurement point in the fullstatic test.
F xð Þ ¼Xmi¼1
fai � feifei
� �2
þXmi¼1
1� ffiffiffiffiffiffiffiffiffiffiffiffiffiMACi
p� �2MACi
(2)
where fai = frequencies predicted by the FE model; fei = frequenciescalculated by the SSI method; x = the uncertain parameter chosenfor the analysis; i = the ith considered mode; andm is the number ofmode shapes considered. Modal assurance criteria (MACs), asshown in Eq. (3), were used to evaluate the correlations betweenmode shapes.
MACi ¼ UTaiUei
� �2UT
aiUai
� �UT
eiUei
� � (3)
where Uai = mode shape predicted by the FE model; Uei = modeshape identified by the SSI method; and i = the ith consideredmode.
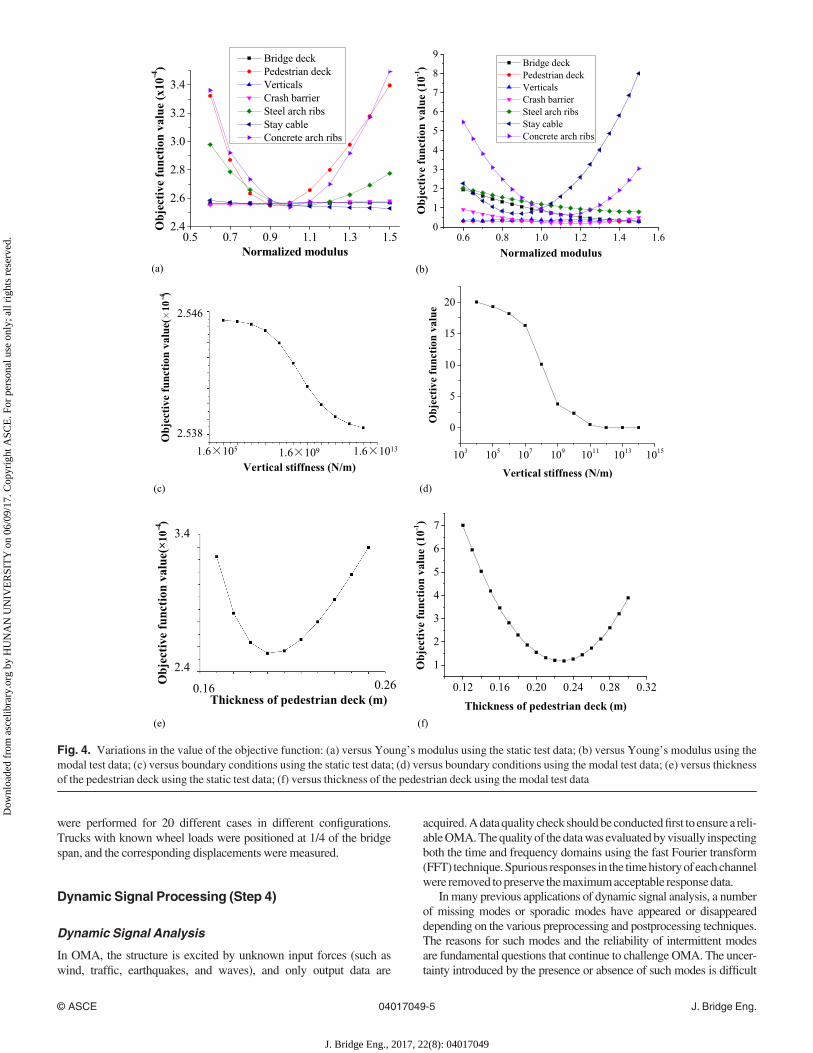
A sensitivity analysis with respect to the initial estimates of the pa-rameters was performed for nine influential parameters by curve fit-ting, as shown in Fig. 4. The sensitivity analyses shown in Figs. 4(a, c,and e) relate to static deflection, whereas the analyses shown in Figs.4(b, d, and f) relate to themodal parameters. Themost sensitive param-eters identified using the static loading data and the modal data werealmost the same, and the two different objective functions showed sim-ilar trends with respect to variations in the boundary conditions.
Dynamic and Static Tests (Step 3)
Ambient Vibration Testing
Prior to the official opening of the bridge in June 2013, full-scaleAVT was conducted on the Laihua Bridge, and dense instrumenta-tion layouts were established on the bridge deck and the arch ribs inthe vertical and lateral directions. An LMS International (Leuven,Belgium) Cada-X data-acquisition system with eight channels wasused to simultaneously record the ambient vibration signals.KD12000L ultralow-frequency accelerometers (20V/g) were in-stalled on the bridge deck and arch ribs; of these accelerometers, sixwere moved among various measurement points, and the other twowere used to establish fixed reference points (Fig. 5). The referencepoints were selected according to the preliminary informationobtained from a modal analysis of the FE model to avoid placingthe measurement instruments on modal node points. A samplingfrequency of 512Hz was chosen, and each data set was collectedfor a duration of 15minutes. The typical signals in the vertical andtransverse directions are shown in Fig. 6.
Full Static Loading Tests
Diagnostic load testing, such as truck load testing, is an independentexperimental tool in St-Id and can be regarded as complementary toglobal modal testing. When properly conducted, static loading testsprovide excellent verification of the AVT results and serve as a valua-ble tool for exploring the localized characteristics of a bridge. Staticloading tests of the Laihua Bridge were conducted using a level gaugeon the bridge deck to measure its deformation and a general total sta-tion to measure the deflections of the arch ribs. Full static loading tests
Fig. 3. Cross-sectional modeling of a concrete-filled steel tube:(a) unified theory; (b) general modeling method
Fig. 2. (a) Laihua Bridge (image by Yun Zhou); (b) Laihua Bridge FEmodel inMidas; (c) Laihua Bridge FEmodel in Strand7
© ASCE 04017049-4 J. Bridge Eng.
J. Bridge Eng., 2017, 22(8): 04017049
Dow
nloa
ded
from
asc
elib
rary
.org
by
HU
NA
N U
NIV
ER
SIT
Y o
n 06
/09/
17. C
opyr
ight
ASC
E. F
or p
erso
nal u
se o
nly;
all
righ
ts r
eser
ved.
were performed for 20 different cases in different configurations.Trucks with known wheel loads were positioned at 1/4 of the bridgespan, and the corresponding displacements weremeasured.
Dynamic Signal Processing (Step 4)
Dynamic Signal Analysis
In OMA, the structure is excited by unknown input forces (such aswind, traffic, earthquakes, and waves), and only output data are
acquired.Adataqualitycheckshouldbeconductedfirst to ensurea reli-ableOMA.Thequalityof thedatawasevaluatedbyvisually inspectingboth the time and frequency domains using the fast Fourier transform(FFT) technique.Spurious responses in the timehistoryofeachchannelwere removed topreserve themaximumacceptable responsedata.
Inmany previous applications of dynamic signal analysis, a numberof missing modes or sporadic modes have appeared or disappeareddepending on the various preprocessing and postprocessing techniques.The reasons for such modes and the reliability of intermittent modesare fundamental questions that continue to challenge OMA. The uncer-tainty introduced by the presence or absence of such modes is difficult
0.5 0.7 0.9 1.1 1.3 1.52.4
2.6
2.8
3.0
3.2
3.4
Obj
ectiv
e fu
nctio
n va
lue
(x10
-4)
Normalized modulus
Bridge deck Pedestrian deck Verticals Crash barrier Steel arch ribs Stay cable Concrete arch ribs
0.6 0.8 1.0 1.2 1.4 1.60
1
2
3
4
5
6
7
8
9 Bridge deck Pedestrian deck Verticals Crash barrier Steel arch ribs Stay cable Concrete arch ribs
Obj
ectiv
e fu
nctio
n va
lue
(10-1
)
Normalized modulus
Vertical stiffness (N/m)
Obj
ectiv
e fu
nctio
n va
lue(
10 )
2.538
2.546
-4
1.6 105 1.6 10131.6 109
-
a
103 105 107 109 1011 1013 1015
0
5
10
15
20
Obj
ectiv
e fu
nctio
n va
lue
Vertical stiffness (N/m)
2.4
3.4
0.16 0.26Thickness of pedestrian deck (m)
Obj
ectiv
e fu
nctio
n va
lue(×1
0 )4-
0.12 0.16 0.20 0.24 0.28 0.32
1
2
3
4
5
6
7
Obj
ectiv
e fu
nctio
n va
lue
(10-1
)
Thickness of pedestrian deck (m)
(a)
(c)
(e) (f)
(d)
(b)
Fig. 4. Variations in the value of the objective function: (a) versus Young’s modulus using the static test data; (b) versus Young’s modulus using themodal test data; (c) versus boundary conditions using the static test data; (d) versus boundary conditions using the modal test data; (e) versus thicknessof the pedestrian deck using the static test data; (f) versus thickness of the pedestrian deck using the modal test data
© ASCE 04017049-5 J. Bridge Eng.
J. Bridge Eng., 2017, 22(8): 04017049
Dow
nloa
ded
from
asc
elib
rary
.org
by
HU
NA
N U
NIV
ER
SIT
Y o
n 06
/09/
17. C
opyr
ight
ASC
E. F
or p
erso
nal u
se o
nly;
all
righ
ts r
eser
ved.

to address using probability theory and represents a key source of epis-temic uncertainty. To eliminate the influence of epistemic uncertainty,the results of the random decrement (RD) technique in combinationwith the complex mode indicator function (CMIF) were comparedwith the results of the SSI technique in the following analysis.
Operational Modal Analysis
The basis of the CMIF method is the singular value decomposition(SVD) of a multiple-reference function matrix, whereas the SSI
method is based on the discrete state-space formulation that repre-sents the dynamic system behavior. Previous research on these twoidentification approaches includes the studies performed by Shih etal. (1988), Phillips et al. (1998), and Peeters and DeRoeck (1998).In this study, the complex mode indicator plot obtained using theCMIF approach and the stabilization diagram obtained using theSSI method clearly indicate consistency in the modal frequencyestimations (Fig. 7). For most long-span bridges, the frequencyrange of interest lies between 0 and 10 Hz, which contains mostof the relevant modal characteristics. The identified natural
S N220m
Measurement points on bridge deck
0/8
W
1 2 3 4 5 6 7 8 9
10 11 12 13 14 15 16 17 18
Reference points
DAQ
DAQ
DAQ Data acquisition system
1/8 2/8 3/8 4/8 5/8 6/8 7/8 8/8
220m
19 20 21 22 23 24 25
26 27 28 29 30 31 32
DAQ
DAQ
4
1/8 2/8 3/8 4/8 5/8 6/8 7/8
Measurement points on arch ribsReference points
Data acquisition system
S N
W
North South220m
E
W
5 Trucks
0/81 2 3 4 5 6 7 8 9
1/8 2/8 3/8 4/8 5/8 6/8 7/8 8/8
East
West
Measurement points on bridge deck
(a)
(b) (c)
(d)
Fig. 5. (a) Instrumentation layout; (b) static truck loading tests at 1/4 of the span; (c) case with 10 trucks at 1/4 of the span (image by Yun Zhou);(d) detailed truck load
© ASCE 04017049-6 J. Bridge Eng.
J. Bridge Eng., 2017, 22(8): 04017049
Dow
nloa
ded
from
asc
elib
rary
.org
by
HU
NA
N U
NIV
ER
SIT
Y o
n 06
/09/
17. C
opyr
ight
ASC
E. F
or p
erso
nal u
se o
nly;
all
righ
ts r
eser
ved.

-6-4-20246
Ver
tical
acce
lera
tion(
×10
m/s
)-4
2Tr
ansv
erse
acce
lera
tion(
×10
m/s
)- 4
2
0.0 0.2 0.4 0.6 0.8 1.0 1.2 1.4 1.6 1.8 2.0-6-4-20246
Times(s)
Fig. 6. Typical vertical and lateral vibration signals on the bridge deck
Fig. 7. Vertical vibration data: (a) stabilization diagram; (b) CMIF plot
© ASCE 04017049-7 J. Bridge Eng.
J. Bridge Eng., 2017, 22(8): 04017049
Dow
nloa
ded
from
asc
elib
rary
.org
by
HU
NA
N U
NIV
ER
SIT
Y o
n 06
/09/
17. C
opyr
ight
ASC
E. F
or p
erso
nal u
se o
nly;
all
righ
ts r
eser
ved.
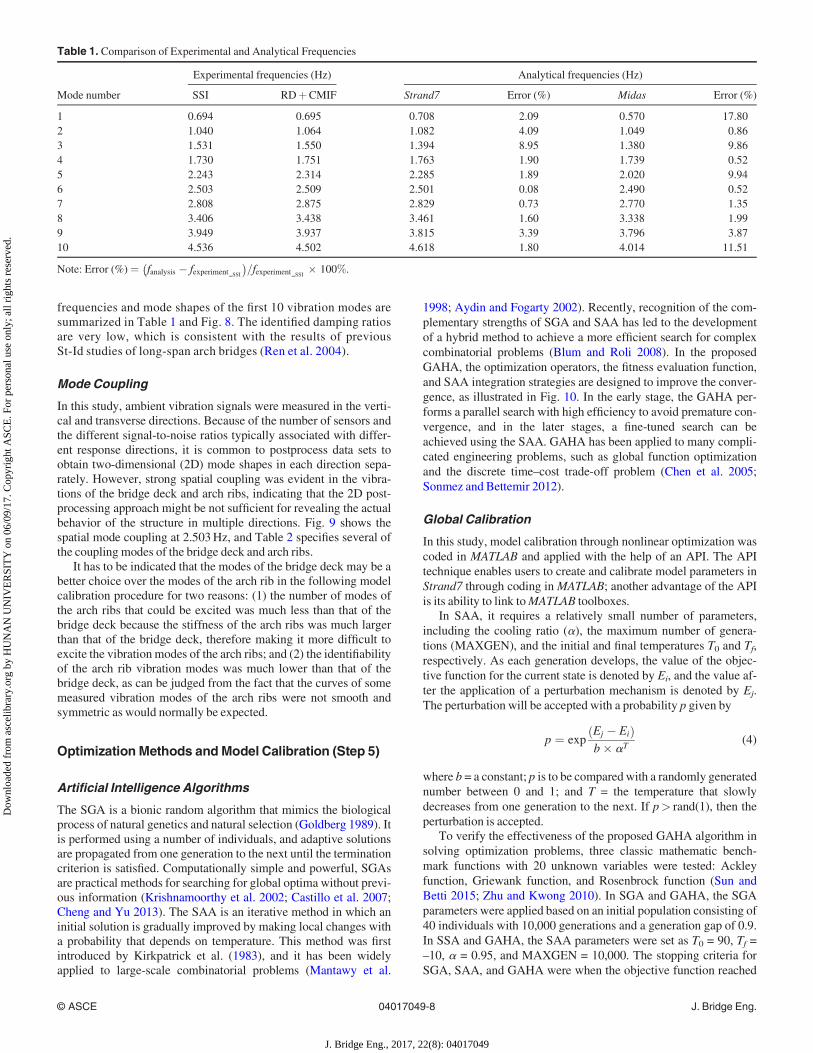
frequencies and mode shapes of the first 10 vibration modes aresummarized in Table 1 and Fig. 8. The identified damping ratiosare very low, which is consistent with the results of previousSt-Id studies of long-span arch bridges (Ren et al. 2004).
Mode Coupling
In this study, ambient vibration signals were measured in the verti-cal and transverse directions. Because of the number of sensors andthe different signal-to-noise ratios typically associated with differ-ent response directions, it is common to postprocess data sets toobtain two-dimensional (2D) mode shapes in each direction sepa-rately. However, strong spatial coupling was evident in the vibra-tions of the bridge deck and arch ribs, indicating that the 2D post-processing approach might be not sufficient for revealing the actualbehavior of the structure in multiple directions. Fig. 9 shows thespatial mode coupling at 2.503Hz, and Table 2 specifies several ofthe coupling modes of the bridge deck and arch ribs.
It has to be indicated that the modes of the bridge deck may be abetter choice over the modes of the arch rib in the following modelcalibration procedure for two reasons: (1) the number of modes ofthe arch ribs that could be excited was much less than that of thebridge deck because the stiffness of the arch ribs was much largerthan that of the bridge deck, therefore making it more difficult toexcite the vibrationmodes of the arch ribs; and (2) the identifiabilityof the arch rib vibration modes was much lower than that of thebridge deck, as can be judged from the fact that the curves of somemeasured vibration modes of the arch ribs were not smooth andsymmetric as would normally be expected.
Optimization Methods andModel Calibration (Step 5)
Artificial Intelligence Algorithms
The SGA is a bionic random algorithm that mimics the biologicalprocess of natural genetics and natural selection (Goldberg 1989). Itis performed using a number of individuals, and adaptive solutionsare propagated from one generation to the next until the terminationcriterion is satisfied. Computationally simple and powerful, SGAsare practical methods for searching for global optima without previ-ous information (Krishnamoorthy et al. 2002; Castillo et al. 2007;Cheng and Yu 2013). The SAA is an iterative method in which aninitial solution is gradually improved by making local changes witha probability that depends on temperature. This method was firstintroduced by Kirkpatrick et al. (1983), and it has been widelyapplied to large-scale combinatorial problems (Mantawy et al.
1998; Aydin and Fogarty 2002). Recently, recognition of the com-plementary strengths of SGA and SAA has led to the developmentof a hybrid method to achieve a more efficient search for complexcombinatorial problems (Blum and Roli 2008). In the proposedGAHA, the optimization operators, the fitness evaluation function,and SAA integration strategies are designed to improve the conver-gence, as illustrated in Fig. 10. In the early stage, the GAHA per-forms a parallel search with high efficiency to avoid premature con-vergence, and in the later stages, a fine-tuned search can beachieved using the SAA. GAHA has been applied to many compli-cated engineering problems, such as global function optimizationand the discrete time–cost trade-off problem (Chen et al. 2005;Sonmez and Bettemir 2012).
Global Calibration
In this study, model calibration through nonlinear optimization wascoded in MATLAB and applied with the help of an API. The APItechnique enables users to create and calibrate model parameters inStrand7 through coding inMATLAB; another advantage of the APIis its ability to link toMATLAB toolboxes.
In SAA, it requires a relatively small number of parameters,including the cooling ratio (a), the maximum number of genera-tions (MAXGEN), and the initial and final temperatures T0 and Tf,respectively. As each generation develops, the value of the objec-tive function for the current state is denoted by Ei, and the value af-ter the application of a perturbation mechanism is denoted by Ej.The perturbation will be accepted with a probability p given by
p ¼ expEj � Eið Þb� aT
(4)
where b = a constant; p is to be comparedwith a randomly generatednumber between 0 and 1; and T = the temperature that slowlydecreases from one generation to the next. If p> rand(1), then theperturbation is accepted.
To verify the effectiveness of the proposed GAHA algorithm insolving optimization problems, three classic mathematic bench-mark functions with 20 unknown variables were tested: Ackleyfunction, Griewank function, and Rosenbrock function (Sun andBetti 2015; Zhu and Kwong 2010). In SGA and GAHA, the SGAparameters were applied based on an initial population consisting of40 individuals with 10,000 generations and a generation gap of 0.9.In SSA and GAHA, the SAA parameters were set as T0 = 90, Tf =–10, a = 0.95, and MAXGEN = 10,000. The stopping criteria forSGA, SAA, and GAHA were when the objective function reached
Table 1. Comparison of Experimental and Analytical Frequencies
Mode number
Experimental frequencies (Hz) Analytical frequencies (Hz)
SSI RDþCMIF Strand7 Error (%) Midas Error (%)
1 0.694 0.695 0.708 2.09 0.570 17.802 1.040 1.064 1.082 4.09 1.049 0.863 1.531 1.550 1.394 8.95 1.380 9.864 1.730 1.751 1.763 1.90 1.739 0.525 2.243 2.314 2.285 1.89 2.020 9.946 2.503 2.509 2.501 0.08 2.490 0.527 2.808 2.875 2.829 0.73 2.770 1.358 3.406 3.438 3.461 1.60 3.338 1.999 3.949 3.937 3.815 3.39 3.796 3.8710 4.536 4.502 4.618 1.80 4.014 11.51
Note: Error (%)¼ fanalysis � fexperiment SSI
� �=fexperiment SSI
� 100%.
© ASCE 04017049-8 J. Bridge Eng.
J. Bridge Eng., 2017, 22(8): 04017049
Dow
nloa
ded
from
asc
elib
rary
.org
by
HU
NA
N U
NIV
ER
SIT
Y o
n 06
/09/
17. C
opyr
ight
ASC
E. F
or p
erso
nal u
se o
nly;
all
righ
ts r
eser
ved.

the maximum number of generations. The convergence lines of thethree benchmark functions are shown in Fig. 11. Although threealgorithms resulted in different convergence rates and solutionaccuracies in different functions, it can still be seen that the pro-posed GAHA algorithm had a better performance than the SGA andSAA. The SAA converged on an infeasible design because it beganfrom a random point and then worked its way toward the minimum,meaning that a local minimum is more likely to be reached.Considering the convergence rate of the different algorithms, onlythe SGA andGAHAwere utilized in the following analysis.
No. Strand7 software SSI method CMIF method
1
MAC1,Strand7-SSI=0.942 MAC1,Strand7-CMIF=0.966
2
MAC2,Strand7-SSI=0.928 MAC2,Strand7-CMIF=0.920
3
MAC3,Strand7-SSI=0.893 MAC3,Strand7-CMIF=0.931
4
MAC4,Strand7-SSI=0.901 MAC4,Strand7-CMIF=0.924
5
MAC5,Strand7-SSI=0.864 MAC5,Strand7-CMIF=0.886
6
MAC6,Strand7-SSI= 0.873 MAC6,Strand7-CMIF=0.861
7
MAC7,Strand7-SSI=0.948 MAC7,Strand7-CMIF=0.953
8
MAC8,Strand7-SSI=0.810 MAC8,Strand7-CMIF=0.581
9
MAC9,Strand7-SSI=0.864 MAC9,Strand7-CMIF=0.804
10
MAC10,Strand7-SSI=0.641 MAC10,Strand7-CMIF=0.619
Fig. 8. Calculated and experimental mode shapes
(a) (b)
Fig. 9. Spatial mode coupling at 2.503Hz: (a) elevation view of thevertical modes; (b) plan view of the transverse modes
© ASCE 04017049-9 J. Bridge Eng.
J. Bridge Eng., 2017, 22(8): 04017049
Dow
nloa
ded
from
asc
elib
rary
.org
by
HU
NA
N U
NIV
ER
SIT
Y o
n 06
/09/
17. C
opyr
ight
ASC
E. F
or p
erso
nal u
se o
nly;
all
righ
ts r
eser
ved.

For the parameter identification of the bridge, it was assumedthat the field test data were reliable, and an absolute percentage errorfor the modal information as illustrated in Eq. (2) was used. As pre-sented earlier, the sensitivity analysis revealed five parameters withsignificant relative importance. Among these parameters, the thick-ness of the pedestrian deck, which is regarded as a certain parameterin the real structure, could be selected to validate the applicability ofthe optimization methods. The SGA and GAHA were used tosearch for the global minimum value of the objective function. Theselected parameters were estimated in each generation, and the opti-mization procedure was terminated when a predefined number ofgenerations was reached. In this study, the SGA and GAHA wereapplied based on an initial population consisting of 50 individualswith 50 generations and a generation gap of 0.9. The GAHA param-eters were defined empirically as follows: T0 = 90, Tf = –10,MAXGEN= 100, and a = 0.98.
Identified Results
The sensitivity analysis revealed that the modal data and static loaddeflections were significantly affected by the vertical stiffness at theends of the bridge deck. In the initial FE model, the boundary condi-tion was represented by separate spring-damping elements con-strained in the vertical direction. Rigid links were used in the trans-verse and longitudinal directions to simulate the interfaces of adjacentbridge deck sections. After calibration, the bearings in the vertical
direction were assumed to be pinned, which agrees well with the fieldtest results. The second step of calibration was to update the uncertainparameters in the initial model to align with the modal frequenciesand mode shapes identified via OMA. The evolution processes ofSGA and GAHA are shown in Fig. 12. The ratios of the optimal valueof each parameter after calibration relative to the initial design valueare presented in Fig. 13. Among the updated models obtained in thisway, themodel calibrated using theGAHAmethod showedmuch bet-ter agreement with the OMA results. The changes in the selected pa-rameters to be updated are listed in Table 3, and the final analyticalfrequencies after calibration are given in Table 4. One important con-cern in model calibration is to check the physical meanings of theuncertain parameters against typical observations in practice. Theupdated values of the Young’s modulus of the concrete arch ribs andthe bridge deck increased, whereas the other values slightly decreased,which is consistent with the possibility that the concrete in the steeltubes may be confined and the fact that the dynamic modulus of con-crete is larger than its static modulus.
Admissibility Check
A model admissibility check, which consisted of two steps, was con-ducted as a validation procedure to evaluate whether the calibratedmodel was suitable for simulating the real structure. The reliability ofthe changes to the initial FE model and the agreement between the
Table 2. Spatial Coupling of the Bridge Deck and Arch Rib Vibrations in Certain Modes
Modesequence
Vertical vibration of the bridgedeck (Hz)
Transverse vibration of the bridgedeck (Hz)
Vertical vibration of the archribs (Hz)
Transverse vibration of the archribs (Hz)
Second 1.040 — 1.064 —
Third 1.531 — 1.503 1.506Fourth 1.730 — 1.751 —
Sixth 2.503 2.503 2.503 2.508Seventh 2.808 — 2.876 —
Initializing candidates
Computing objective function value
Stochastic universal selection
Multipoint crossing operation
Mutation operation
Reading GAHA parameters and setting gen=1
Presenting optimal solution
Termination criterion
gen=gen+1
Candidates and iter=1
Mutation operator
Computing objective function value
Comparing current value and old value
Accept Accept by metropolis algorithm Reject mutation
Output result
iter=iter+1
Cooling schedule termination criterion
Applying cooling system
New generation
Fig. 10. Flowchart of GAHA
© ASCE 04017049-10 J. Bridge Eng.
J. Bridge Eng., 2017, 22(8): 04017049
Dow
nloa
ded
from
asc
elib
rary
.org
by
HU
NA
N U
NIV
ER
SIT
Y o
n 06
/09/
17. C
opyr
ight
ASC
E. F
or p
erso
nal u
se o
nly;
all
righ
ts r
eser
ved.

numerical and experimental data were checked, but this was notsufficient for a physically meaningful updated model. In this pa-per, the Young’s modulus of steel was generally regarded as anear-deterministic parameter. After global correlation, the errorindex was minimized when the Young’s modulus was set to its nomi-nal value. After calibration, the changes to all uncertain parameterswere found to be less than 10%, which is acceptable considering theepistemic uncertainties. Moreover, as a deterministic parameter in thereal structure, the thickness of the pedestrian deck remained close toits nominal value after calibration with two algorithms. Afterward, asensitivity analysis considering themodulus of the steel girders, whichwas known to be nearly deterministic, was performed. Unlike the ini-tial FE model, the objective function values of the calibrated modelswere minimized when the Young’s modulus of the steel girders wasset to its nominal value, as shown in Fig. 14(a). Moreover, the deflec-tions of the bridge deck were also checked, and the relative error at ev-ery measurement point in the static loading tests was determined.Generally, the maximum relative error between the measured andsimulated deflections was reduced from 7.35 to 3.22% [Fig. 14(b)].
Double Validation by the Multimodel Approach
Because of the presence of two different kinds of uncertainties, thereare challenges associated with errors and parameter compensation in-herent to inverse tasks. The multimodel approach is developed
Fig. 11. Convergence lines of three benchmark mathematic functionsof 20 dimensions: (a) Ackley function; (b) Griewank function;(c) Rosenbrock function
0 5 10 15 20 25 30 35 40
0.02
0.04
0.06
0.08
0.10
0.12
0.14
0.16
0.18
Obj
ectiv
e fu
nctio
n va
lue
Generation (n)
Genetic algorithm (SGA) Genetic annealing hybrid algorithm (GAHA)
Fig. 12. Evolution processes of SGA and GAHA
0.7
0.8
0.9
1.0
1.1
1.2
1.3 Genetic algorithm (SGA) Genetic annealing hybrid algorithm (GAHA) Multiple model analysis (MMA)
Uni
fied
valu
e
Uncertain parametersEc Es Ed Ep Th
Fig. 13. Results of uncertain-parameter identification using the threeoptimization algorithms and multimodel method (Note: Ec, Es, Eb, Ep,and Dp denote the moduli of the concrete arch ribs, the steel arch ribs,the bridge deck, and the pedestrian deck and the thickness of the pedes-trian deck, respectively)
Table 3. Parameters of the FE Model before and after Calibration UsingGAHA
Parameter updatedInitialvalue
Updatedvalue
Change(%)
Modulus of concrete arch ribs(MPa)
3.74� 104 4.09� 104 9.36
Modulus of steel arch ribs (MPa) 2.27� 105 2.13� 105 –6.17Modulus of bridge deck (MPa) 6.86� 104 7.02� 104 2.33Modulus of pedestrian deck (MPa) 4.64� 104 4.51� 104 –2.80Thickness of pedestrian deck (m) 0.2 0.19 –5.00
© ASCE 04017049-11 J. Bridge Eng.
J. Bridge Eng., 2017, 22(8): 04017049
Dow
nloa
ded
from
asc
elib
rary
.org
by
HU
NA
N U
NIV
ER
SIT
Y o
n 06
/09/
17. C
opyr
ight
ASC
E. F
or p
erso
nal u
se o
nly;
all
righ
ts r
eser
ved.

(Raphael and Smith 1998) after all sources of uncertainties have beenexplicitly taken into account. The difference of the deterministicmodel-updating approach lies in its search for multiple candidate
models that explain the measurements taken from a structure. Bystudying a number of candidate models consisting of variables repre-senting key uncertainties, all possible structural parameter sets andvarious uncertainties are investigated. Thus, structural predictionusing the multimodel method is more realistic for supporting a risk-based decision-making process. Model fragments partially describecomponents and physical phenomena, and a complete model is cre-ated by combining fragments that are compatible (Smith and Saitta2008). To model the behavior of structures, the fragments representsupport conditions, material properties, geometric properties, nodes,elements, and loads. Themultimodel St-Idmethod usesmultiplemod-els to predict the measured results; the key step is to select the correctmodels from the model clusters. A group of FE models that matchesthe real structural response can be incorporated to identify correlationsand clusters of the candidate model populations that can be employedin the current framework for more efficient St-Id. Over the past15 years, the research team led by Professor Smith has conducted a se-ries of preliminary studies of multimodel system identification(Raphael and Smith 2003; Robert-Nicoud et al. 2005).
Bayesian inference is an especially useful tool to address thisproblem by combining the prior knowledge of the structure with theobserved vibration data into a statistical framework. The success ofthe Bayesian inference for FEmodel updating relies on the effectiveapplication of proper stochastic simulation methods (Ching et al.2006; Cheung and Beck 2009). Bayesian model-updating techni-ques make it possible to identify a set of plausible models withprobabilistic distributions and to characterize the modeling uncer-tainties of a structural system. Recently, Markov chainMonte Carlo(MCMC) sampling has been used to quantify parameter uncertain-ties in model updating for the reliable assessment of a footbridgeand a 21-story concrete building (Sun et al. 2017; Behmanesh andMoaveni 2015).
In this study, Bayesian model updating was utilized via MCMCsampling and weighing based on Bayes’ statistic theorem, and themultimodel method was used to validate the accuracy of the resultsof the single-model updating method. Based on the Bayesian statis-tical detection and error analysis, the multimodel updating buildsrandom model clusters using random sampling. Through the analy-sis of measured data and the FEmodel analysis results, the posteriorprobability can be calculated from the prior probability and likeli-hood function (Zhang et al. 2013b) based on Eq. (5), as follows:
p Mi uð Þ=D� � ¼ p D=Mi uð Þ� �p Mi uð Þ½ �Pn
i¼1p D=Mi uð Þ� �
p Mi uð Þ½ �(5)
Table 4. Analytically Identified Natural Frequencies after Model Updating
Mode number SSI frequency (Hz)
Frequencies after model calibration
MACSGA (Hz) Error (%) GAHA (Hz) Error (%)
1 0.694 0.707 1.91 0.706 1.78 0.9772 1.040 1.080 3.89 1.081 3.90 0.9463 1.531 1.422 7.09 1.424 7.00 0.9084 1.730 1.760 1.71 1.762 1.87 0.8815 2.243 2.278 1.54 2.284 1.83 0.8996 2.503 2.490 0.51 2.485 0.72 0.8707 2.808 2.819 0.38 2.816 0.28 0.8958 3.406 3.455 1.45 3.461 1.61 0.8679 3.949 3.808 3.58 3.816 3.38 0.77410 4.536 4.610 1.64 4.622 1.89 0.793
Note: Error %ð Þ ¼ jfanalysis � fexperimentj=fexperiment � 100%.
0.8 0.9 1.0 1.1 1.2 1.30.0
0.2
0.4
0.6
0.8
1.0
1.2
Obj
ectiv
e fu
nctio
n va
lue
Normalized modulus
Initial model Model calibrated by SGA Model calibrated by GAHA
0 2 4 6 8 10-1
0
1
2
3
4
5
6
7
8
Rel
ativ
e er
ror(
%)
Measurement point
Initial model Model calibrated by GA Model calibrated by GAHA Model calibrated by MMA
(a)
(b)
Fig. 14. (a) Sensitivities of the initial model and the models calibratedusing SGA and GAHAwith respect to the Young’s modulus of the steelgirders; (b) relative errors between the measured and simulated deflec-tions when the truck was loaded at 1/4 point
© ASCE 04017049-12 J. Bridge Eng.
J. Bridge Eng., 2017, 22(8): 04017049
Dow
nloa
ded
from
asc
elib
rary
.org
by
HU
NA
N U
NIV
ER
SIT
Y o
n 06
/09/
17. C
opyr
ight
ASC
E. F
or p
erso
nal u
se o
nly;
all
righ
ts r
eser
ved.
where u = vector of uncertainty parameters of the structure; andp Mi uð Þ½ � = initial (prior) probability of each model when the uncer-tain parameter has a prior distribution based on engineering andmodeling judgment. Because each model fragment is sampledindividually, the prior probability of each model equals the prod-uct of multiplying each model fragment. p D=Mi uð Þ� �
presents the
likelihood function, which can be presented as p xjuð Þ ¼QNms¼1 pðbf sju Þp bf ju
(Zhou 2008), in whichbf s and bf s are meas-
ured frequencies and mode shapes.Pn
i¼1 p D=Mi uð Þ� �p Mi uð Þ½ � is
a normalizing constant called the Bayesian factor, which can beregarded as the marginal probability distribution. Using theMetropolis–Hasting (M-H) algorithm, the method begins by
selecting a starting point u i. A sample is drawn from the proposalfunction q(x,y). The proposal function is assumed to be the formof a normal distribution. The acceptance ratio can be calculatedby Eq. (6), as follows:
a xt; ytþ1ð Þ ¼p ytþ1ð Þq xt; ytþ1ð Þp xtð Þq ytþ1; xtð Þ (6)
The proposed sample is accepted with a probability of min(1.0, a) (Dubbs 2012).
In this study, MATLAB software was used for MCMC-approachcoding. Based on prior experience, the prior distribution is shown inTable 5, where Ec, Es, Ed, Ep, and Th represent previously defineduncertainty parameters. The Markov chain consisting of 1,000
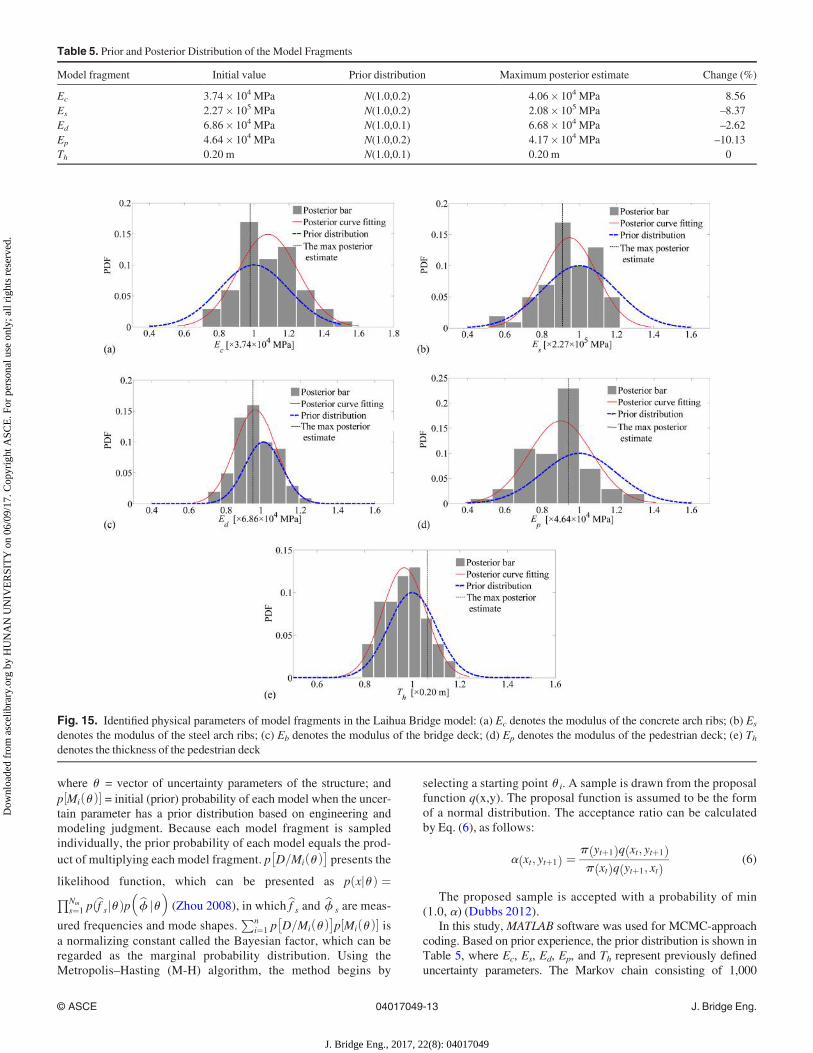
Table 5. Prior and Posterior Distribution of the Model Fragments
Model fragment Initial value Prior distribution Maximum posterior estimate Change (%)
Ec 3.74� 104 MPa N(1.0,0.2) 4.06� 104 MPa 8.56Es 2.27� 105 MPa N(1.0,0.2) 2.08� 105 MPa –8.37Ed 6.86� 104 MPa N(1.0,0.1) 6.68� 104 MPa –2.62Ep 4.64� 104 MPa N(1.0,0.2) 4.17� 104 MPa –10.13Th 0.20 m N(1.0,0.1) 0.20 m 0
Fig. 15. Identified physical parameters of model fragments in the Laihua Bridge model: (a) Ec denotes the modulus of the concrete arch ribs; (b) Es
denotes the modulus of the steel arch ribs; (c) Eb denotes the modulus of the bridge deck; (d) Ep denotes the modulus of the pedestrian deck; (e) Thdenotes the thickness of the pedestrian deck
© ASCE 04017049-13 J. Bridge Eng.
J. Bridge Eng., 2017, 22(8): 04017049
Dow
nloa
ded
from
asc
elib
rary
.org
by
HU
NA
N U
NIV
ER
SIT
Y o
n 06
/09/
17. C
opyr
ight
ASC
E. F
or p
erso
nal u
se o
nly;
all
righ
ts r
eser
ved.
samples was generated to present the likelihood function. The meas-ured 10 modes were used for the MCMC calculation. The posteriordistribution of the model fragment can be estimated using Fig. 15, inwhich the histogram denotes the probability-density functions(PDFs) obtained from MCMC sampling, the solid red line denotesthe PDFs through curve fitting using the normal distribution, thedashed curve-fitting line denotes the maximum a posteriori estimate,and the solid curve-fitting line presents the prior distribution. The pa-rameter-identification results are presented in Table 5, which showsthat they are close to the single-model updating results.
Conclusions
This paper presents the results of a complete St-Id study on a long-span concrete-filled steel tubular bridge, with a focus on mitigatingvarious uncertainty factors in the initial model. By systematicallyperforming full-scale AVT and static loading tests, the physicalproperties in the FE model were updated in detail through calibra-tion using two different optimization methods. Based on theresearch results, themain conclusions are as follows:1. After an initial 3D FE model was established, a careful investi-
gation of the critical bridge members and the interaction of thebridge deck and arch ribs was performed to mitigate modelinguncertainties. A sensitivity analysis considering the results ofboth static and modal tests is a powerful means of identifyinghighly uncertain parameters. Given that epistemic uncertaintygoverns the behavior of long-span bridges in St-Id, the applica-tion of an analytical process consisting of precise 3D FE mod-eling and field tests is helpful for the reliable St-Id of complexreal structures.
2. Because of a number of missing modes or spurious modes thatcan appear or disappear depending on the preprocessing andpostprocessing techniques used, various OMA techniques wereused to reduce the measurement errors induced by signal proc-essing. The results of two independently applied methods(RDþCMIF and SSI) showed excellent agreement, confirmingthe overall applicability of the AVT and OMA procedure.
3. After model calibration using two different artificial intelligencealgorithms (SGA and GAHA), the optimal values of the parame-ters were identified to avoid the parameters tapping into localminima. The high-resolution bridge FE model was constructedin Strand7, which interfaced with three optimization techniquesin MATLAB to update the multiple bridge parameters automati-cally. Among the updated models, GAHA showed the bestagreement with the AVT results and the best performance in amodal admissibility check. After calibration, the average errorbetween the analytical (GAHA) and experimental frequencieswas reduced to 2.42%, and the maximum relative error on thestatic load deflections was reduced from 7.35 to 3.22%.
4. The multimodel St-Id method was used to evaluate the physicalparameters of the bridge to again validate the accuracy of thesingle-model updating method. The Bayesian inference strat-egy was introduced along with the Monte Carlo samplingmethod to generate 1,000 FE models. The posterior distributionwas calculated, and the inference results were close to theupdated physical parameters generated by the single-model St-Id method.
Acknowledgments
The authors are grateful for the support provided for this research by theNational Key Research and Development Program of China (Grants
2016YFC0701400, 2016YFE0127900, and 2016YFC0701308), theNational Natural Science Foundation of China (NSFC) (Grant51208190), and the Research Fund for the Doctoral Program of HigherEducationofChina (Grant20120161120028).
References
Abdel-Ghaffar, A. M., and Scanlan, R. H. (1985). “Ambient vibration stud-ies of Golden Gate Bridge. I: Suspended structure.” J. Eng. Mech., 10.1061/(ASCE)0733-9399(1985)111:4(463), 463–482.
Aktan, A. E., Çatbas�, N., Türer, A., and Zhang, Z. (1998). “Structural identi-fication: Analytical aspects.” J. Struct. Eng., 10.1061/(ASCE)0733-9445(1998)124:7(817), 817–829.
Aktan, A. E., et al. (1997). “Structural identification for condition assess-ment: Experimental arts.” J. Struct. Eng., 10.1061/(ASCE)0733-9445(1997)123:12(1674), 1674–1684.
Aydin, M. E., and Fogarty, T. C. (2002). “A modular simulated annealingalgorithm for multi-agent systems: A job-shop scheduling application.”Proc., 2nd Int. Conf. on Responsive Manufacturing, Gaziantep Univ.,Gaziantep, Turkey, 318–323.
Azamathulla, H. M., Ghani, A. A., Zakaria, N. A., and Guven, A. (2010).“Genetic programming to predict bridge pier scour.” J. Hydraul. Eng.,10.1061/(ASCE)HY.1943-7900.0000133, 165–169.
Behmanesh, I., and Moaveni, B. (2015). “Probabilistic identification ofsimulated damage on the Dowling Hall footbridge through Bayesian fi-nite element model updating.” Struct. Control Health Monit., 22(3),463–483.
Blum, C., and Roli, A. (2008). “Hybrid metaheuristics: An introduction.”Stud. Comput. Intell., 114, 1–30.
Castillo, O., Trujillo, L., and Melin, P. (2007). “Multiple objective geneticalgorithms for path planning optimization in autonomous mobilerobots.” Soft Comput., 11(3), 269–279.
Catbas, F. N., Ciloglu, S. K., Hasancebi, O., Grimmelsman, K., and Aktan,A. E. (2007). “Limitations in structural identification of large constructedstructures.” J. Struct. Eng., 10.1061/(ASCE)0733-9445(2007)133:8(1051),1051–1066.
Catbas, F. N., Kijewski-Correa, T., and Aktan, A. E. (2013).Structural identification of constructed systems: Approaches,methods, and technologies for effective practice of St-Id, ASCE,Reston, VA.
Chen, D., Lee, C. Y., and Park, C. H. (2005). “Hybrid genetic algorithm andsimulated annealing (HGASA) in global function optimization.” Proc.,17th IEEE Int. Conf. on Tools with Artificial Intelligence, IEEE,Washington, DC, 129–133.
Cheng, A., and Yu, D. (2013). “Genetic algorithm for vehicle routing prob-lem.” Proc., 4th Int. Conference on Transportation Engineering (ICTE),ASCE, Reston, VA, 2876–2881.
Cheung, S. H., and Beck, J. L. (2009). “Bayesian model updating usinghybrid Monte Carlo simulation with application to structural dynamicmodels with many uncertain parameters.” J. Eng. Mech., 10.1061/(ASCE)0733-9399(2009)135:4(243), 243–255.
Ching, J., Beck, J. L., Porter, K. A., and Shaikhutdinov, R. (2006).“Bayesian state estimation method for nonlinear systems and itsapplication to recorded seismic response.” J. Eng. Mech., 10.1061/(ASCE)0733-9399(2006)132:4(396), 396–410.
Ciloglu, K., Zhou, Y., Moon, F., and Aktan, A. E. (2012). “Impacts of epis-temic uncertainty in operational modal analysis.” J. Eng. Mech., 10.1061/(ASCE)EM.1943-7889(2012)138:9(1059), 1059–1070.
Cross, E. J., Koo, K. Y., Brownjohn, J. M. W., and Worden, K. (2013).“Long-term monitoring and data analysis of the Tamar Bridge.” Mech.Syst. Sig. Process., 35(1–2), 16–34.
Dubbs, N. C. (2012). “Development, validation, and assessment of a multi-ple model structural identification method.” Ph.D. thesis, Dept. of CivilEngineering, Drexel Univ., Philadelphia.
Dubbs, N. C., and Moon, F. L. (2016). “Assessment of long-span bridgeperformance issues through an iterative approach to ambient vibration–based structural identification.” J. Perform. Constr. Facil., 10.1061/(ASCE)CF.1943-5509.0000877, 04016029.
© ASCE 04017049-14 J. Bridge Eng.
J. Bridge Eng., 2017, 22(8): 04017049
Dow
nloa
ded
from
asc
elib
rary
.org
by
HU
NA
N U
NIV
ER
SIT
Y o
n 06
/09/
17. C
opyr
ight
ASC
E. F
or p
erso
nal u
se o
nly;
all
righ
ts r
eser
ved.

Friswell, M. I., and Mottershead, J. E. (1995). Finite element model updat-ing in structural dynamics, Kluwer Academic, Dordrecht, Netherlands.
Furuta, H., Nakatsu, K., Ishibashi, K., and Miyoshi, N. (2014). “Optimalbridge maintenance of large number of bridges using robust geneticalgorithm.” Proc., Structures Congress 2014, ASCE, Reston, VA,2282–2291.
Goldberg, D. E. (1989). Genetic algorithms in search, optimization andmachine learning, Addition-Wesley, Boston.
Grimmelsman, K. A. (2006). “Experimental characterization of towers incable-supported bridges by ambient vibration testing.” Ph.D. thesis,Dept. of Mechanical Engineering and Mechanics, Drexel Univ.,Philadelphia.
Hart, G. C., and Yao, J. T. P. (1977). “System identification in structural dy-namics.” J. Eng. Mech. Div., 103(6), 1089–1104.
He, X., Moaveni, B., Conte, J. P., Elgamal, A., and Masri, S. F. (2009).“System identification of Alfred Zampa Memorial Bridge usingdynamic field test data.” J. Struct Eng., 10.1061/(ASCE)0733-9445(2009)135:1(54), 54–66.
Jaishi, B., Kim, H.-J., Kim, M. K., Ren, W.-X., and Lee, S.-H. (2007).“Finite element model updating of concrete-filled steel tubular archbridge under operational condition using modal flexibility.”Mech. Syst.Sig. Process., 21(6), 2406–2426.
Jaishi, B., and Ren,W.-X. (2005). “Structural finite element model updatingusing ambient vibration test results.” J. Struct. Eng., 10.1061/(ASCE)0733-9445(2005)131:4(617), 617–628.
Kirkpatrick, S., Gelatt, C. D., Jr., and Vecchi, M. P. (1983). “Optimizationby simulated annealing.” Sci., 220(4598), 671–680.
Ko, J. M., and Ni, Y. Q. (2005). “Technology developments in structuralhealth monitoring of large-scale bridges.” Eng. Struct., 27(12),1715–1725.
Koh, C. G., Chen, Y. F., and Liaw, C.-Y. (2003). “A hybrid computationalstrategy for identification of structural parameters.” Comput. Struct.,81(2), 107–117.
Krishnamoorthy, C. S., Venkatesh, P. P., and Sudarshan, R. (2002).“Object-oriented framework for genetic algorithms with application tospace truss optimization.” J. Comput. Civ. Eng., 10.1061/(ASCE)0887-3801(2002)16:1(66), 66–75.
Kwong, H. S., Lau, C. K., andWong, K. Y. (1995). “Monitoring system forTsing Ma Bridge.” Proc., 13th Structures Congress, Vol. 1, ASCE,Reston, VA, 264–267.
Liu, S. C., and Yao, J. T. P. (1978). “Structural identification concept.” J.Struct. Div., 104(12), 1845–1858.
Magalhães, F., Cunha, A., and Caetano, E. (2008). “Dynamic monitoring ofa long span arch bridge.” Eng. Struct., 30(11), 3034–3044.
Mantawy, A. H., Abdel-Magid, Y. L., and Selim, S. Z. (1998). “A simulatedannealing algorithm for unit commitment.” IEEE Trans. Power Syst.,13(1), 197–204.
MATLAB [Computer software]. MathWorks, Natick,MA.Midas [Computer software]. Midas Information Technology, Gyeonggi-do,
Korea.Moon, F. L., and Aktan, A. E. (2006). “Impacts of epistemic (bias) uncer-
tainty on structural identification of constructed (civil) systems.” ShockVib. Digest, 38(5), 399–420.
Moon, F. L., Frangopol, D. M., Catbas, F. N., and Aktan, A. E. (2010).“Infrastructure decision-making based on structural identification.”Structures Congress 2010, ASCE, Reston, VA, 590–596.
Oberkampf, W. L. (2005). “Uncertainty quantification using evidencetheory.” Proc., Advanced Simulation and Computing Workshop: ErrorEstimation, Uncertainty Quantification, and Reliability in NumericalSimulations, National Nuclear Security Administration (NNSA),Washington, DC.
Pan, Q., Grimmelsman, K. A., Moon, F. L., and Aktan, A. E. (2009).“Mitigating epistemic uncertainty in structural identification.” J. Struct.Eng., 10.1061/(ASCE)ST.1943-541X.0000248, 1–13.
PARIS [Computer software]. Tufts Univ., Medford, MA.Peeters, B., and DeRoeck, G. (1998). “Stochastic subspace system identifi-
cation of a steel transmitter mast.” Proc., 16th Int. Modal AnalysisConf., Society for Experimental Mechanics, Bethel, CT, 130–136.
Phillips, A. W., Allemang, R. J., and Fladung, W. A. (1998). “The complexmode indicator function (CMIF) as a parameter estimation method.”
Proc., 16th Int. Modal Analysis Conf., Society for ExperimentalMechanics, Bethel, CT, 705–710.
Raphael, B., and Smith, I. (1998). “Finding the right model for bridge diag-nosis.” Artificial intelligence in structural engineering: Informationtechnology for design, collaboration, maintenance, and monitoring,Springer, London, 308–319.
Raphael, B., and Smith, I. F. C. (2003). “A direct stochastic algorithm forglobal search.” Appl. Math. Comput., 146(2–3), 729–758.
Ren, W.-X., Zhao, T., and Harik, I. E. (2004). “Experimental and analyticalmodal analysis of steel arch. bridge.” J. Struct. Eng., 10.1061/(ASCE)0733-9445(2004)130:7(1022), 1022–1031.
Robert-Nicoud, Y., Raphael, B., and Smith, I. F. C. (2005). “Configurationof measurement systems using Shannon’s entropy function.” Comput.Struct., 83(8-9), 599– 612.
Sanayei, M., Khaloo, A., Gul, M., and Catbas, F. N. (2015). “Automated fi-nite element model updating of a scale bridge model using measuredstatic and modal test data.” Eng. Struct., 102, 66–79.
SAP2000 [Computer software]. Computers and Structures, Walnut Creek,CA.
Schlune, H., Plos, M., and Gylltoft, K. (2009). “Improved bridge evaluationthrough finite element model updating using static and dynamic meas-urements.” Eng. Struct., 31(7), 1477–1485.
Shih, C. Y., Tsuei, Y. G., Allemang, R. J., and Brown, D. L. (1988).“Complex mode indication function and its applications to spatialdomain parameter estimation.” Mech. Syst. Sig. Process.,2(4) 367–377.
Sipple, J. D., and Sanayei, M. (2014). “Finite element model updating usingfrequency response functions and numerical sensitivities.” Struct.Control Health Monit., 21(5), 784–802.
Smith, I. F., and Saitta, S. (2008). “Improving knowledge of structural sys-tem behavior through multiple models.” J. Struct. Eng., 10.1061/(ASCE)0733-9445(2008)134:4(553), 553–561.
Sonmez, R., and Bettemir, Ö. H. (2012). “A hybrid genetic algorithm forthe discrete time-cost trade-off problem.” Expert. Syst. Appl., 39(13),11428–11434.
Strand7 [Computer software]. Strand7 Pty., Sydney, NSW, Australia.Sun, H., and Betti, R. (2015). “A hybrid optimization algorithm with
Bayesian inference for probabilistic model updating.” Comput.-Aided.Civ. Infrastruct. Eng., 30(8) 602–619.
Sun, H., Lus�, H., and Betti, R. (2013). “Identification of structural modelsusing a modified artificial bee colony algorithm.” Comput. Struct., 116,59–74.
Sun, H., Mordret, A., Prieto, G. A., Toksöz, M. N., and Büyüköztürk, O.(2017). “Bayesian characterization of buildings using seismic inter-ferometry on ambient vibration.” Mech. Syst. Sig. Process., 85,468–486.
Wan, H.-P., and Ren, W.-X. (2015). “A residual-based Gaussian processmodel framework for finite element model updating.” Comput. Struct.,156, 149–159.
Wang, G. S. (2009). “Application of hybrid genetic algorithm to systemidentification.” Struct. Control Health Monit., 16(2), 125–153.
Yu, S., and Ou, J. (2016). “Structural health monitoring and modelupdating of Aizhai suspension bridge.” J. Aerosp. Eng., 10.1061/(ASCE)AS.1943-5525.0000653, B4016009.
Zhang, J., Prader, J., Grimmelsman, K. A., Moon, F. L., Aktan, A. E., andShama, A. (2013a). “Experimental vibration analysis for structural iden-tification of a long-span suspension bridge.” J. Eng. Mech., 10.1061/(ASCE)EM.1943-7889.0000416, 748–759.
Zhang, J., Wan, C., and Sato, T. (2013b). “Advanced Markov chain MonteCarlo approach for finite element calibration under uncertainty.”Comput.-Aided. Civ. Infrastruct. Eng., 28(7), 522–530.
Zhong, S. T. (2003). The concrete-filled steel tubular structures, TsinghuaUniversity Press, Beijing.
Zhou, Y. (2008). “Parameter identification experiment and research on elas-tic foundation slab and reinforced concrete frame structure.” Ph.D. the-sis, College of Civil Engineering, Hunan Univ., Changsha, Hunan,China.
Zhu, G., and Kwong, S. (2010). “Gbest-guided artificial bee colony algo-rithm for numerical function optimization.” Appl. Math. Comput.,217(7), 3166–3173.
© ASCE 04017049-15 J. Bridge Eng.
J. Bridge Eng., 2017, 22(8): 04017049
Dow
nloa
ded
from
asc
elib
rary
.org
by
HU
NA
N U
NIV
ER
SIT
Y o
n 06
/09/
17. C
opyr
ight
ASC
E. F
or p
erso
nal u
se o
nly;
all
righ
ts r
eser
ved.